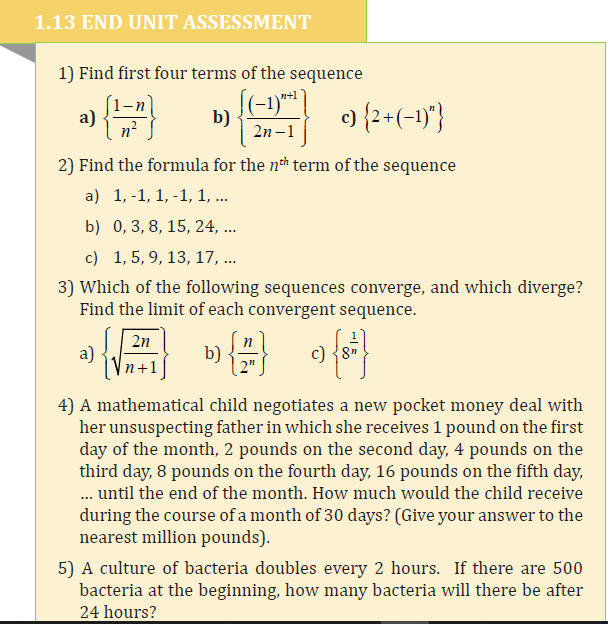
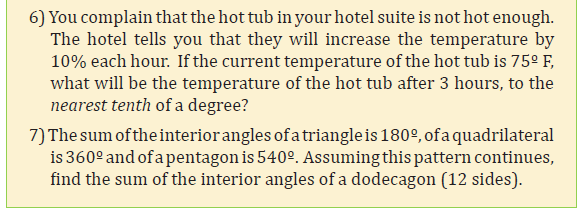
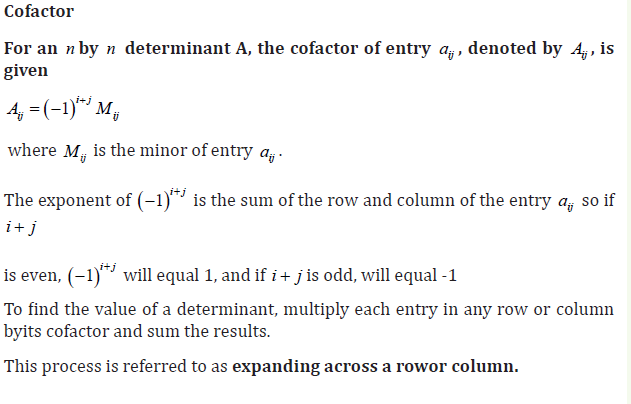
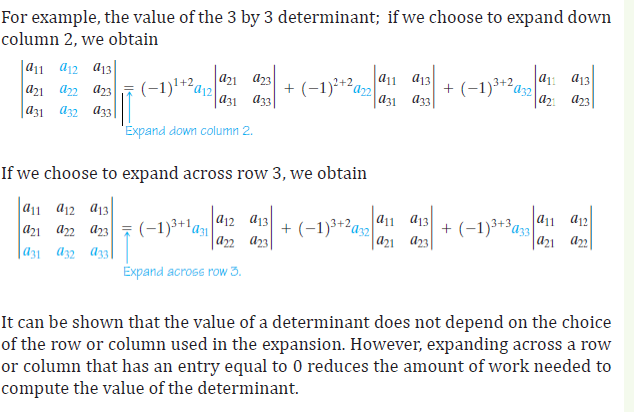
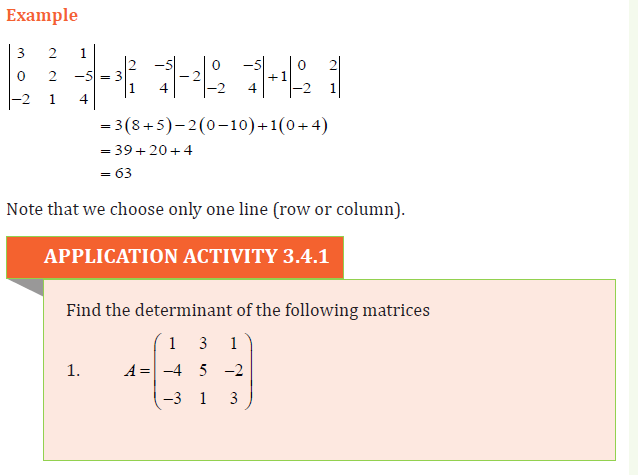
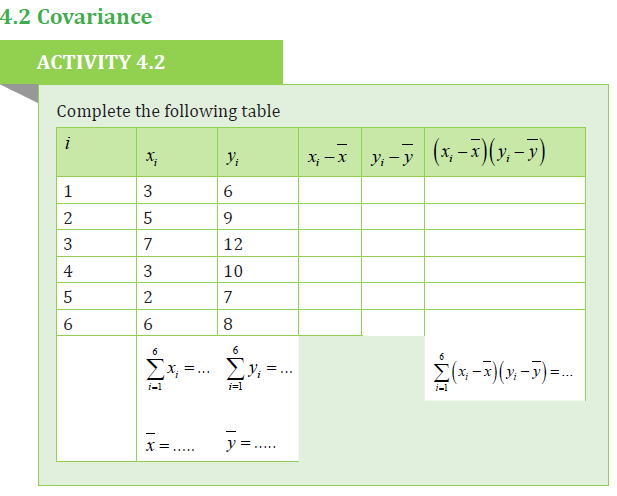
Topic outline
UNIT 1 :SEQUENCES AND SERIES
Key unit competence: Apply arithmetic and geometric sequences to solve
problems in financial mathematics.
1.0 INTRODUCTORY ACTIVITY
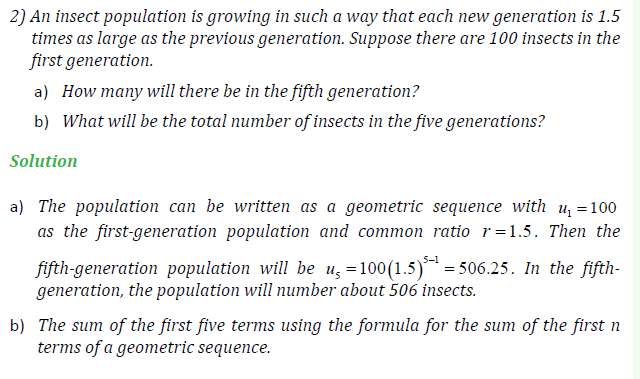
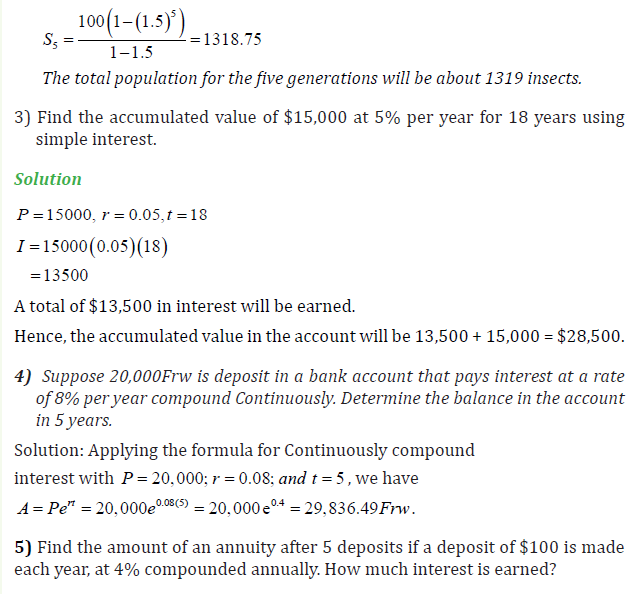
Suppose that an insect population is growing in such a way that each new
generation is 2 times as large as the previous generation. If there are 126
insects in the first generation, on a piece of paper, write down the number
of insects that will be there in second, third, fourth,…nthgeneration.
How can we name the list of the number of insects for different
generations?
1.1 Generalities on sequences
ACTIVITY 1.1
Fold once an A4 paper, what is the fraction that represents the part
you are seeing?
Fold it twice, what is the fraction that represents the part you are
seeing?
What is the fraction that represents the part you are seeing if you
fold it ten times?
What is the fraction that represents the part you are seeing if youfold it n times?
Write a list of the fractions obtained starting from the first until thenth fraction.
The empty sequence { } is included in most notions of sequences, but may
be excluded depending on the context. Usually a numerical sequence is given
by some formulanu = f
, permitting to find any term of the sequence by its
number n; this formula is called a general term formula.
A second way of defining a sequence is to assign a value to the first (or the first
few) term(s) and specify the nth term by a formula or equation that involves
one or more of the terms preceding it. Sequences defined this way are said tobe defined recursively, and the rule or formula is called a recursive formula.
Infinite and finite sequences
Consider the sequence of odd numbers less than 11: This is 1, 3,5,7,9. This is
a finite sequence as the list is limited and countable. However, the sequence
made by all odd numbers is:
1,3,5,7,9,...2n +1,...This suggests the definition that an infinite sequence is a
sequence whose terms are infinite and its domain is the set of positive integers.
Note that it is not always possible to give the numerical sequence by a generalterm formula; sometimes a sequence is given by description of its terms.
In each term, the numerator is the same as the term number, and the denominator
is one greater the term number.
Common difference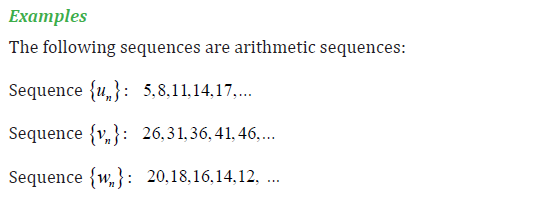
The fixed numbers that bind each sequence together are called the common
differences. Sometimes mathematicians use the letter d when referring tothese types of sequences.
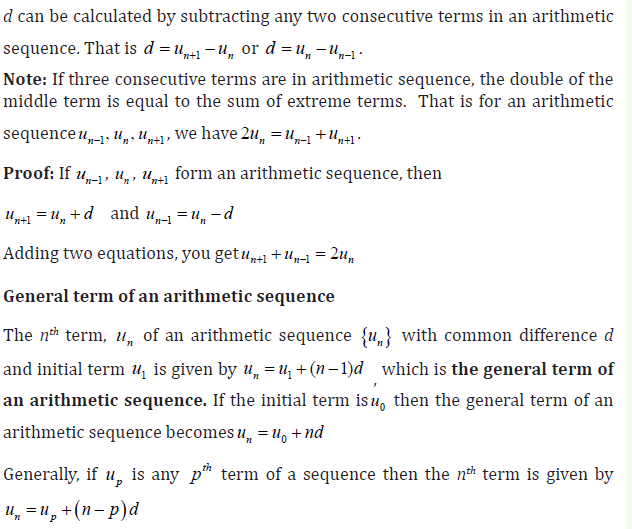
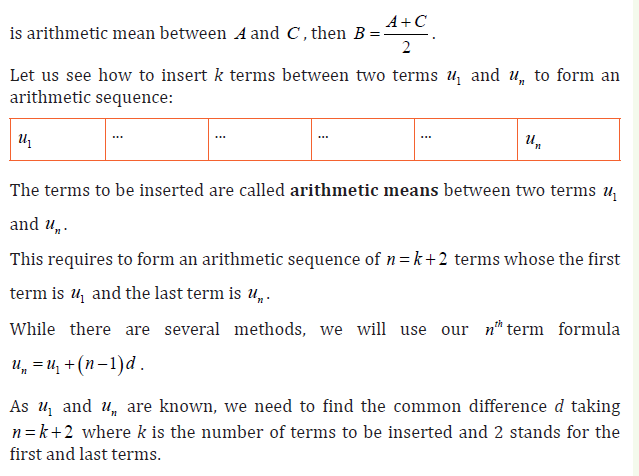
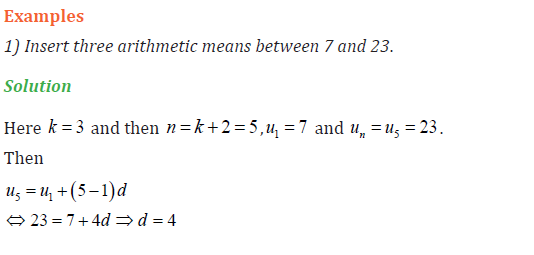
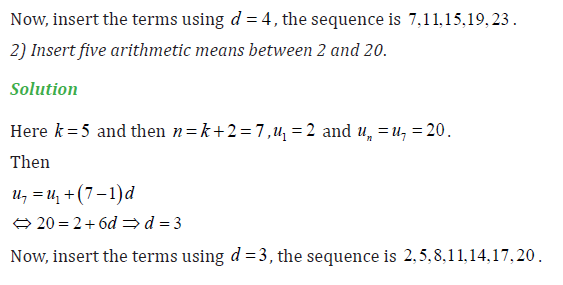
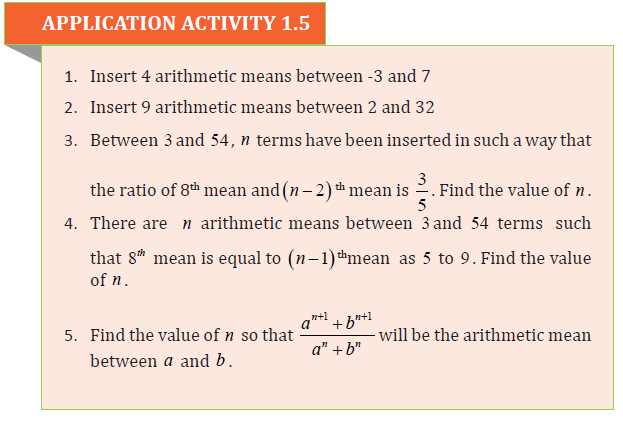
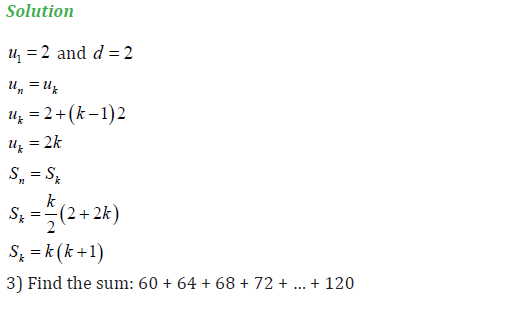
1.5.Arithmetic Means of an arithmetic sequence
ACTIVITY 1.5
Suppose that you need to form an arithmetic sequence of 7 terms
such that the first term is 2 and the seventh term is 20. Write down
that sequence given that those terms are 2, A, B,C,D, E, 20 .
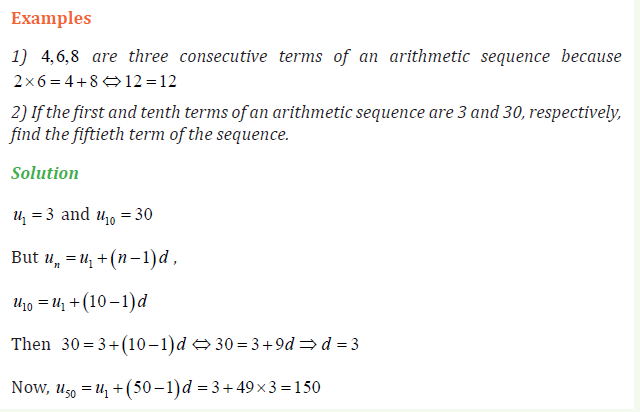
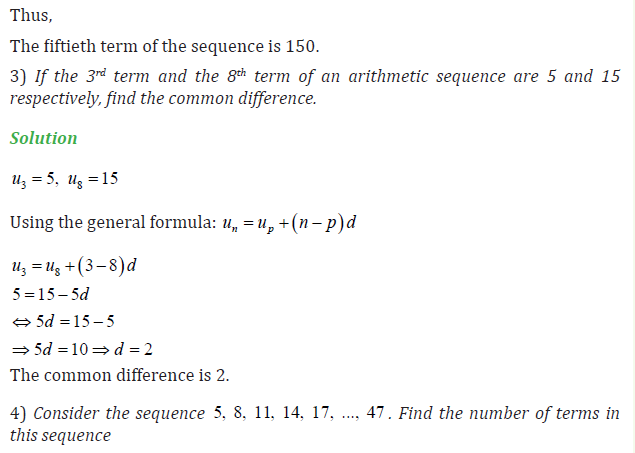
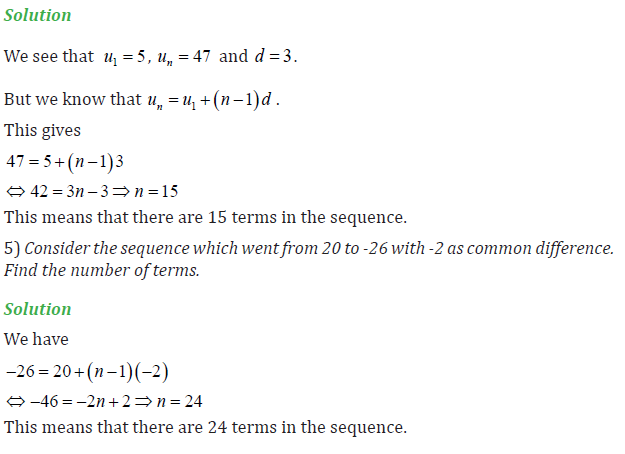
If three or more than three numbers form an arithmetic sequence, then all termslying between the first and the last numbers are called arithmetic means. If B
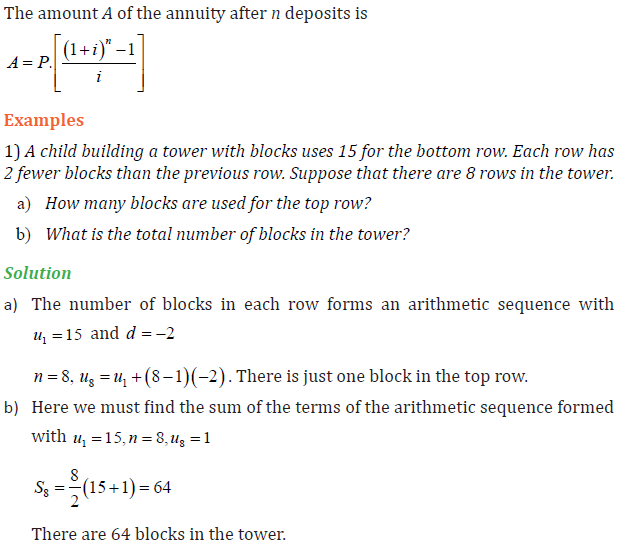
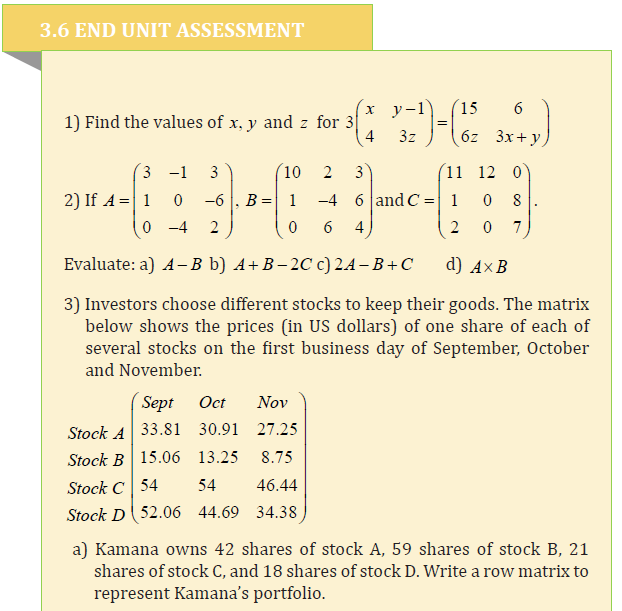
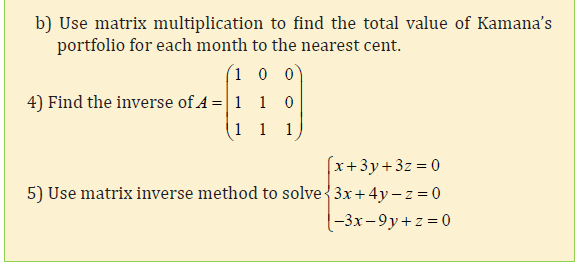
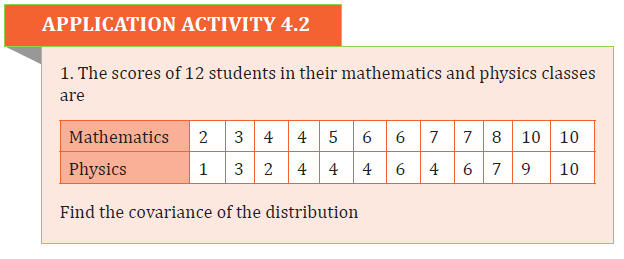
APPLICATION ACTIVITY 1.6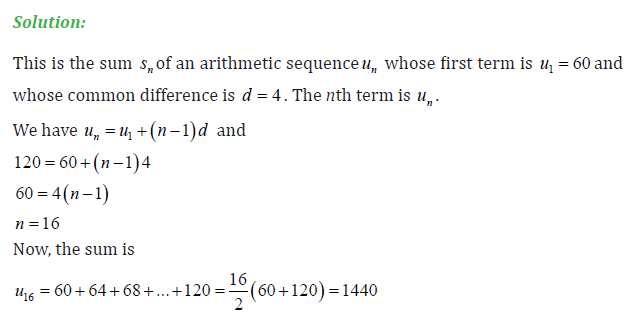
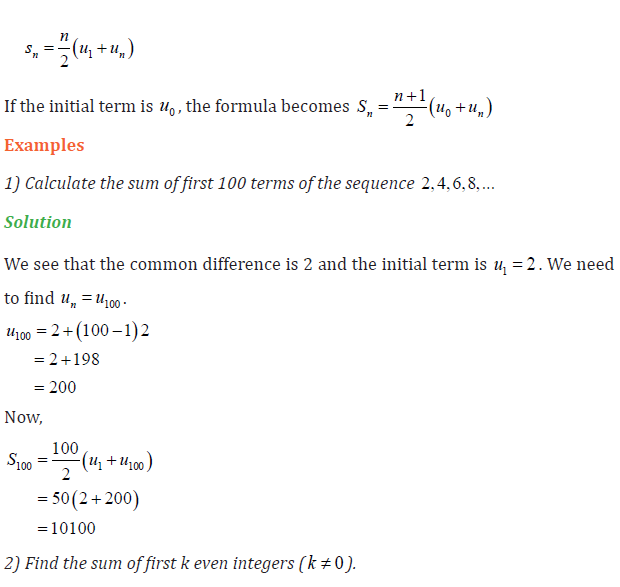
1)Consider the arithmetic sequence 8, 12, 16, 20, … Find the
expression for Sn
2) Sum the first twenty terms of the sequence 5, 9, 13,…
3) The sum of the terms in the sequence 1, 8, 15, … is 396. How many
terms does the sequence contain?
4) Practical activity: A ceramic tile floor is designed in the shape
of a trapezium 10m wide at the base and 5m wide at the top asillustrated on the figure bellow:
The tiles, 10cm by 10cm, are to be placed so that each successive
row contains one less tile than the preceding row. How many tileswill be required?
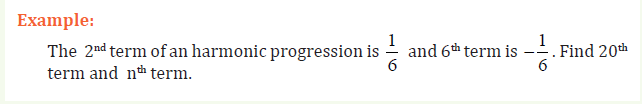
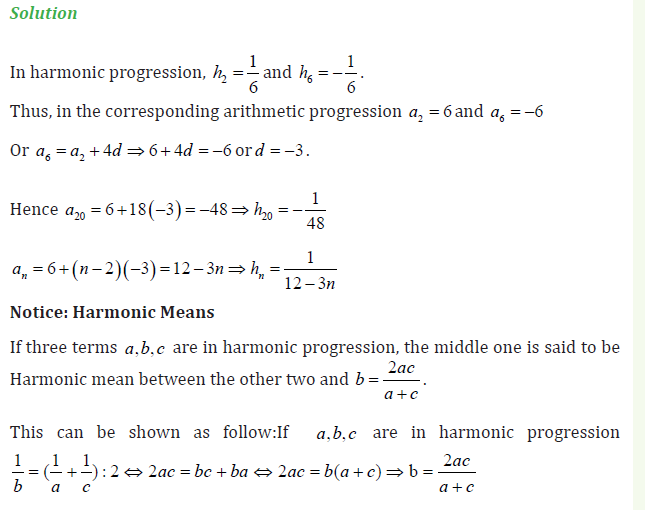
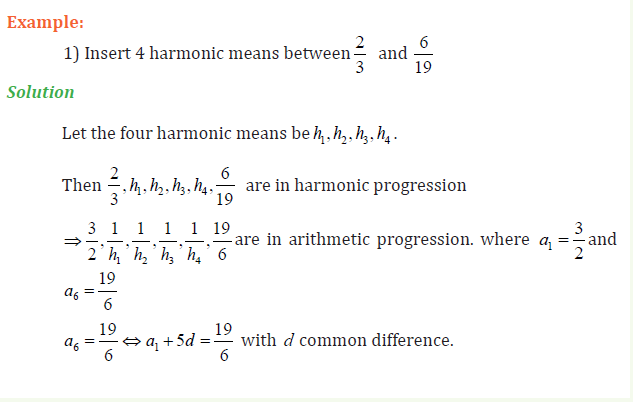
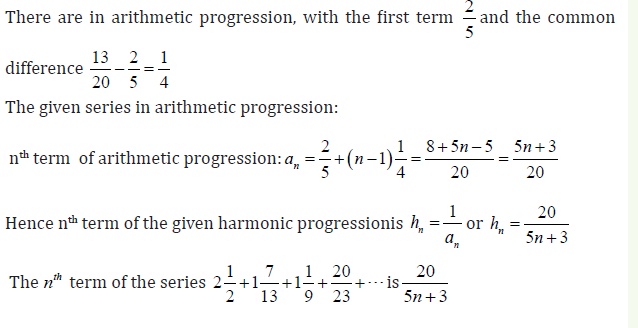
1.7 Harmonic sequences and its general term
ACTIVITY 1.7
Consider the following arithmetic sequence:
2, 4, 6, 8, 10, 12, 14, 16, …2n,...
a) Form another sequence whose terms are the reciprocals of the
terms of the given sequence.
b) What can you say about the new sequence? What is its first term,
the third term and the general term? Is there a relationship between
two consecutive terms?
Harmonic sequence is a sequence of numbers in which the reciprocals of theterms are in arithmetic sequence. It is of the following form:
Remark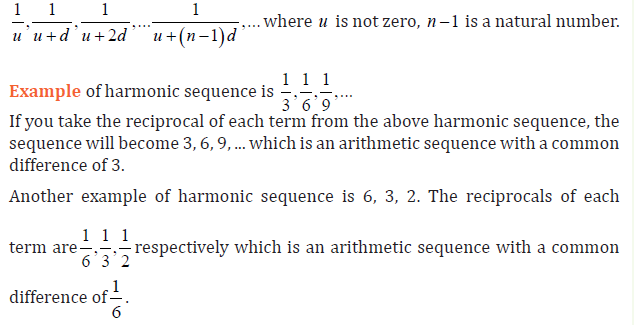
To find the term of harmonic sequence, convert the sequence into arithmetic
sequence then do the calculations using the arithmetic formulae. Then take
the reciprocal of the answer in arithmetic sequence to get the correct term inharmonic sequence.
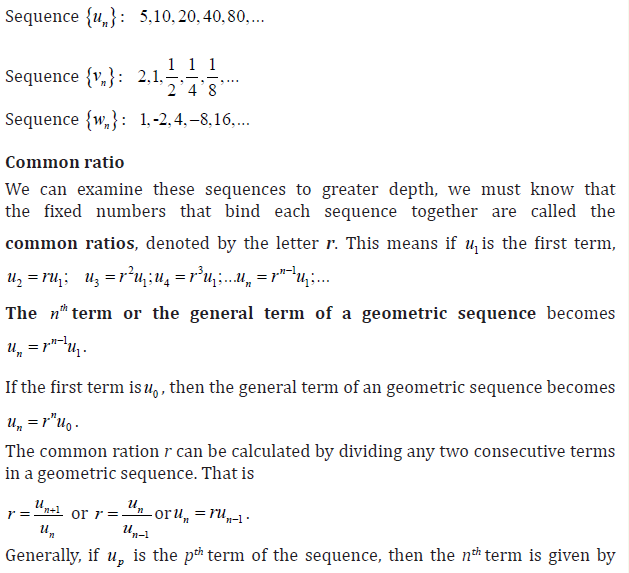
1. 8 Generalities on Geometric sequence and its general term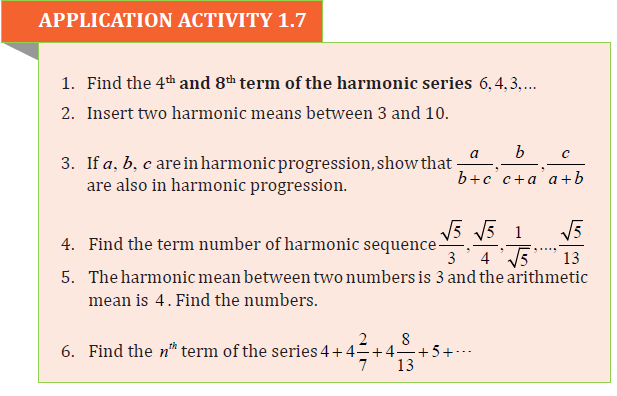
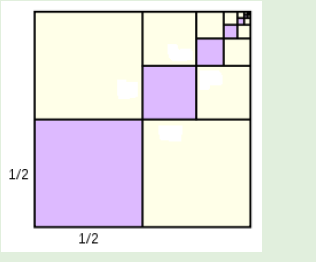
ACTIVITY 1.8
Take a piece of paper with a square shape.
1. Cut it into two equal parts.
2. Write down a fraction corresponding to one part according to
the original piece of paper.
3. Take one part obtained in step 2) and repeat step 1) and then step 2)
4. Continue until you remain with a small piece of paper that you
are not able to cut into two equal parts and write down the
sequence of fractions obtained.
5. Observe the sequence of numbers you obtained and give therelationship between any two consecutive numbers.
Sequences of numbers that follow a pattern of multiplying a fixed number rfrom one term u1 to the next are called geometric sequences.
The following sequences are geometric sequences:
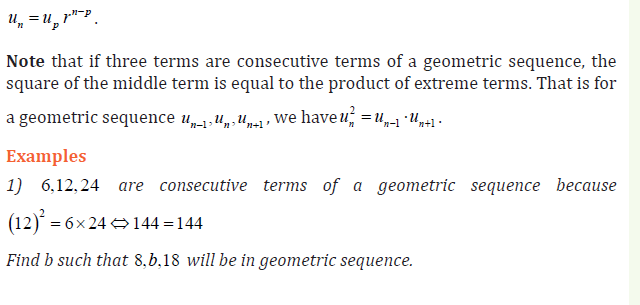
1.9.Geometric Means
ACTIVITY 1.9
Suppose that you need to form a geometric sequence of 6 terms such
that the first term is 1 and the sixth term is 243. Given that theseterms are 1, A,B,C,D, 243 . Write down that sequence.
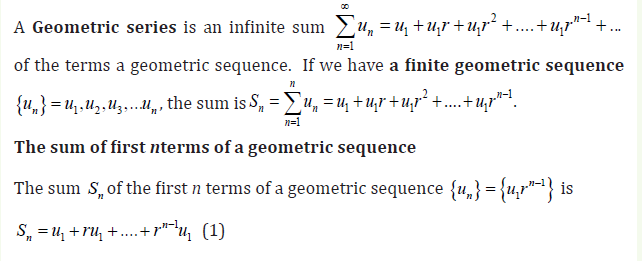
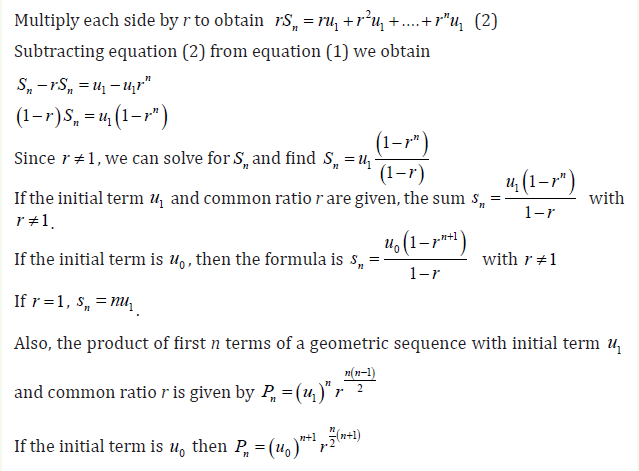
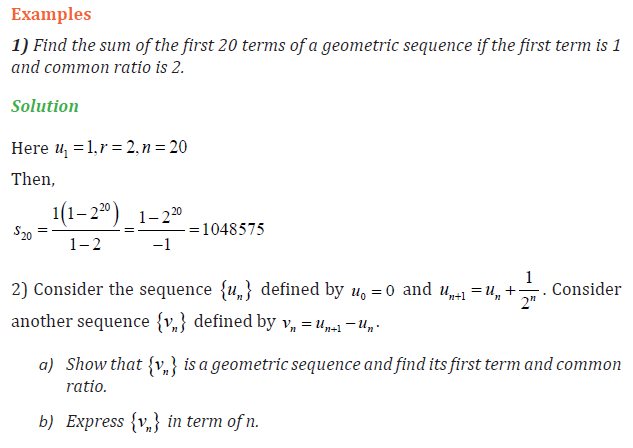
1. 10. Geometric series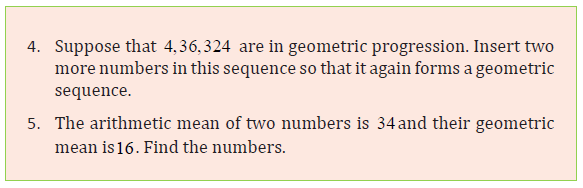
ACTIVITY 1.10
During a competition of student teachers at the district level, 5 first
winners were paid an amount of money in the way that the first got
100,000Frw, the second earned the half of this money, the third got
the half of the second’s money, and so on until the fifth who got the
half of the fourth’s money.
a) Discuss and calculate the money earned by each student from the
second to the fifth.
b) Determine the total amount of money for all the 5 student teachers.
c) Compare the money for the first and the fifth student and discuss
the importance of winning at the best place.
d) Try to generalize the situation and guess the money for the
student who passed at the nth place if more students were paid. Inthis case, evaluate the total amount of money for n students.
1.12 Application of sequences in real life
ACTIVITY 1.12
Carry out a research in the library or on internet and find out at least
3 problems or scenarios of the real life where sequences and series are applied.
There are many applications of sequences. Sequences are useful in our daily lives
as well as in higher mathematics. For example; the monthly payments made to
pay off an automobile or home loan with interest portion, the list of maximum
daily temperatures in one area for a month are sequences. Sequences are used
in calculating interest, population growth, half-life and decay in radioactivity,
etc.
In economics and Finance, sequences and series can be used for example in
solving problems related to:
a) Final sum, the initial sum, the time period and the interest rate for an
investment.
The amount A after t years due to a principal P invested at an annual interestrate r compounded n times per year is
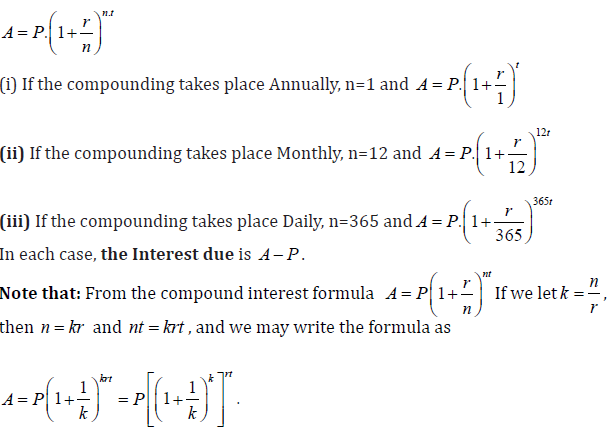
value at t = 0 ; r is the Interest rate expressed as a decimal; r is the number of
years P is invested; A is the amount after t years.
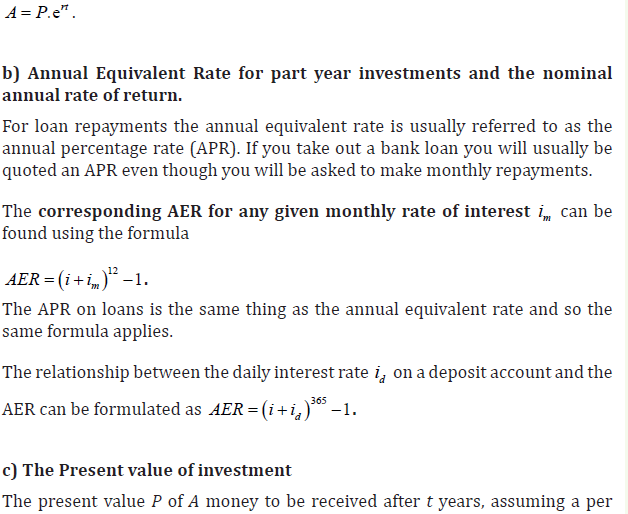
The amount A after t years due to a principal P invested at an annual interestrate r compounded continuously is
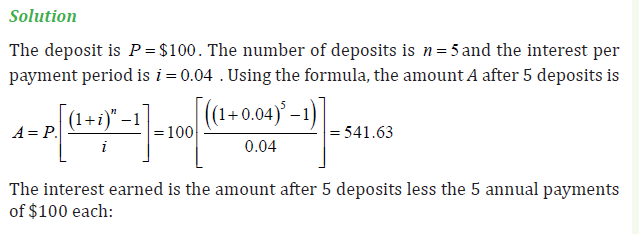
7) To save for her daughter’s college education, Martha decides to put $50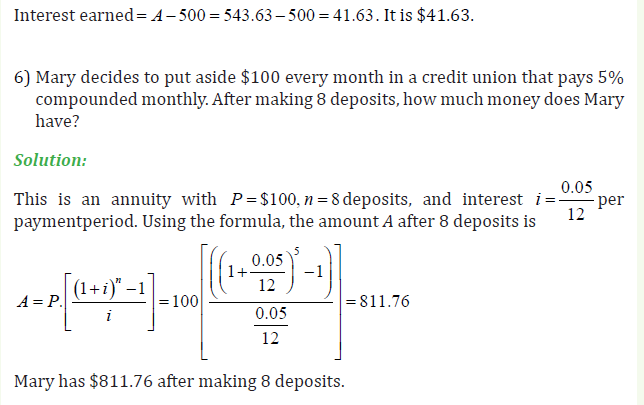
aside every month in a bank guaranteed-interest account paying 4% interest
compounded monthly.
She begins this savings program when her daughter is 3 years old. How much
will she have saved by the time she makes the 180th deposit? How old is herdaughter at this time?
APPLICATION ACTIVITY 1.12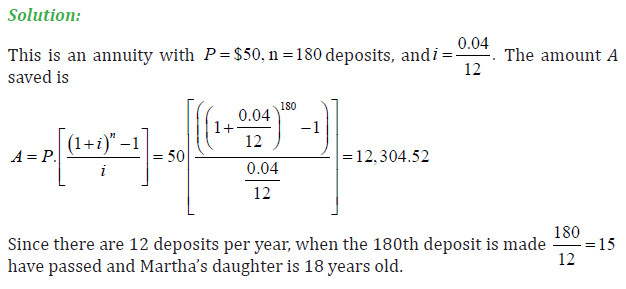
1) If Linda deposits $1300 in a bank at 7% interest compounded
annually, how much will be in the bank 17 years later?
2) The population of a city in 1970 was 153,800. Assuming that
the population increases continuously at a rate of 5% per year,
predict the population of the city in the year 2000.
3) To save for retirement, Manasseh, at age 35, decides to place
2000Frw into an Individual Retirement Account (IRA) each year
for the next 30 years. What will the value of the IRA be when
Manasseh makes his 30th deposit? Assume that the rate of return
of the IRA is 4% per annum compounded annually.
4) A private school leader received permission to issue 4,000,000Frw
in bonds to build a new high school. The leader is required to
make payments every 6 months into a sinking fund paying 4%
compounded semiannually. At the end of 12 years the bondobligation will be retired. What should each payment be?
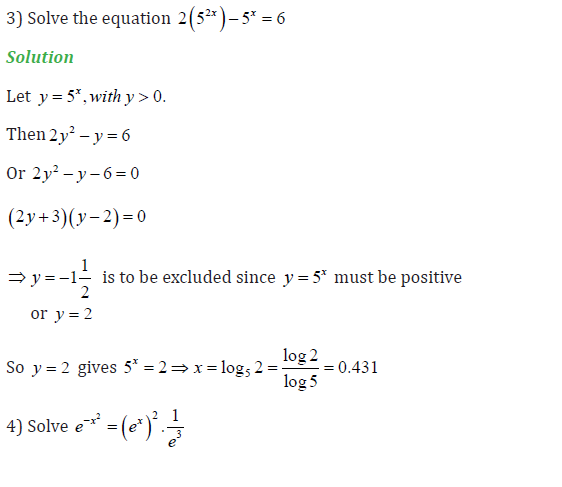
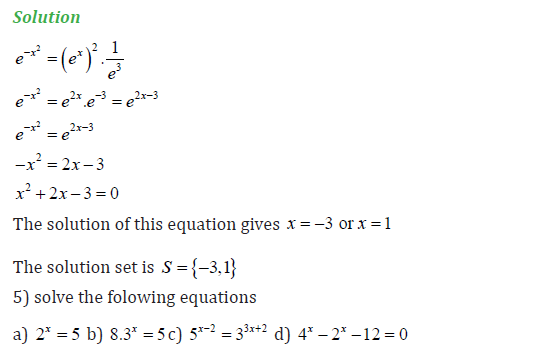
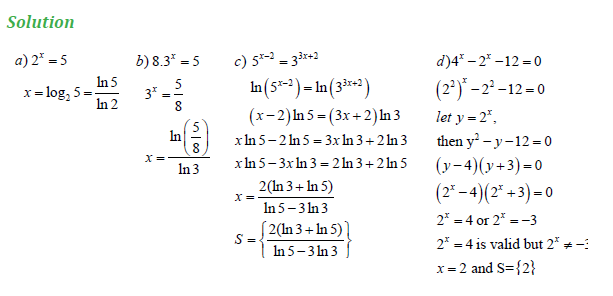
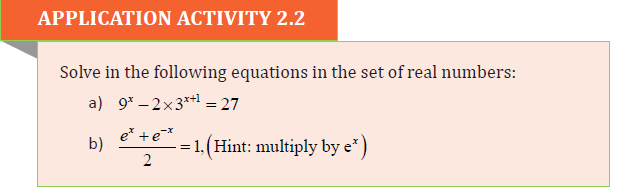
UNIT 2:LOGARITHMIC AND EXPONENTIAL EQUATIONS
Key unit competence: Solve equations involving logarithms or exponentialsand apply them to model and solve related problems.
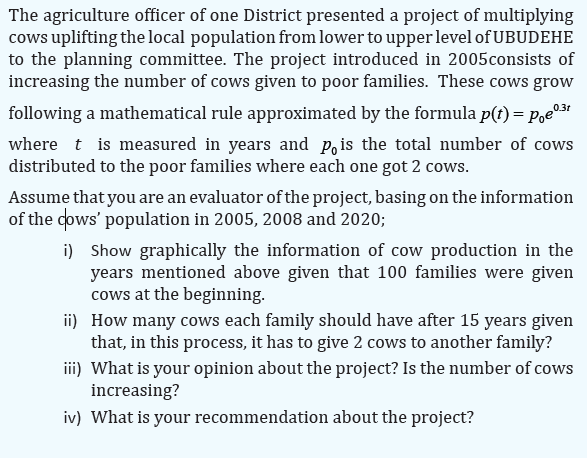
2.0 INTRODUCTORY ACTIVITY
2.3 Application of exponential and logarithmic equations in real life
2.3.1 Application of exponential equations to estimate thePopulation Growth
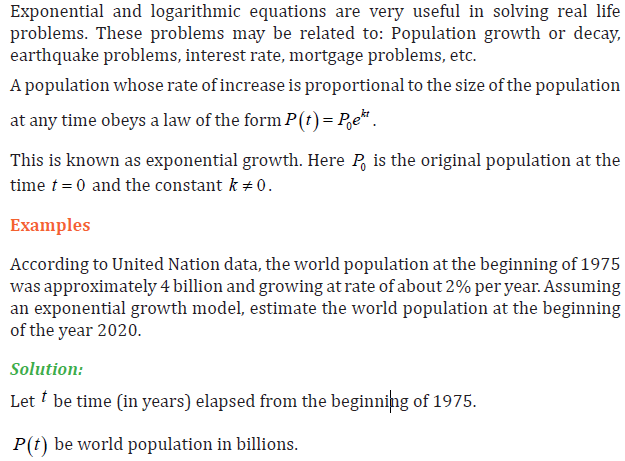
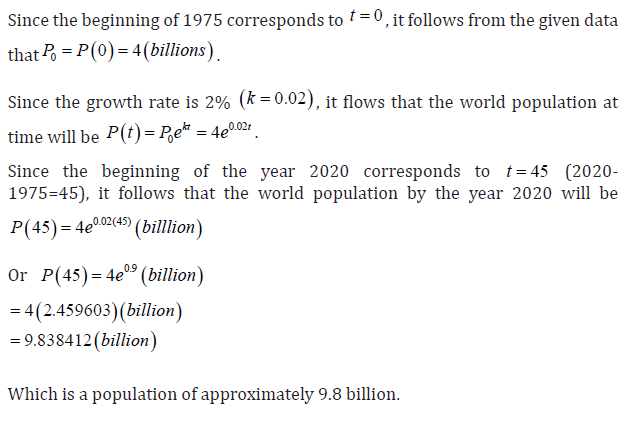
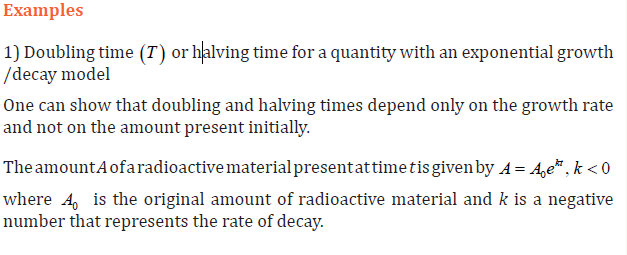
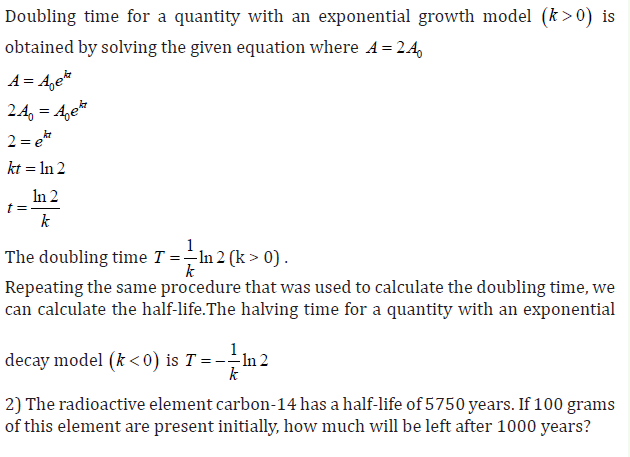
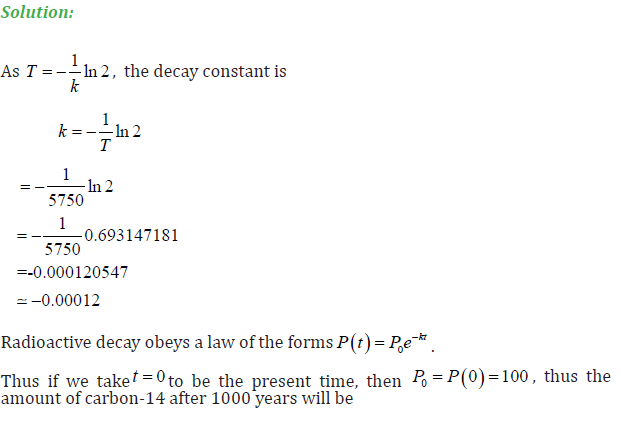
A population whose rate of decrease is proportional to the size of the population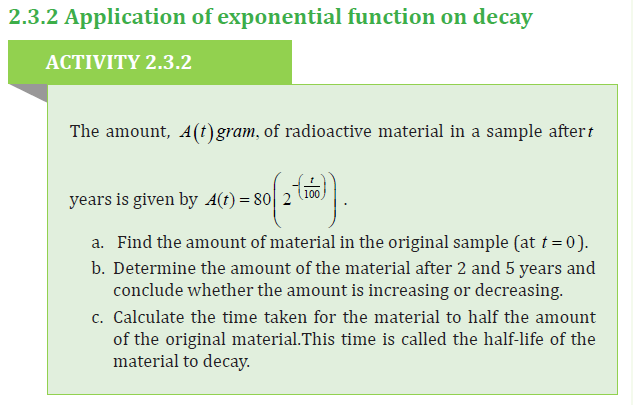
at any time obeys a law of the forms P = Ae−kt . The negative sign on exponent
indicates that the population is decreasing. This is known as exponential
decay.
If a quantity has an exponential growth model, then the time required for it
to double in size is called the doubling time. Similarly, if a quantity has an
exponential decay model, then the time required for it to reduce in value by
half is called the halving time. For radioactive elements, halving time is calledhalf-life.
2.3.3 Application of logarithmic equations to determine the
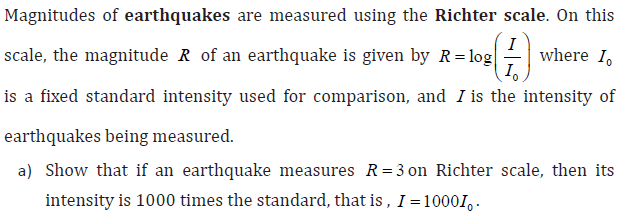
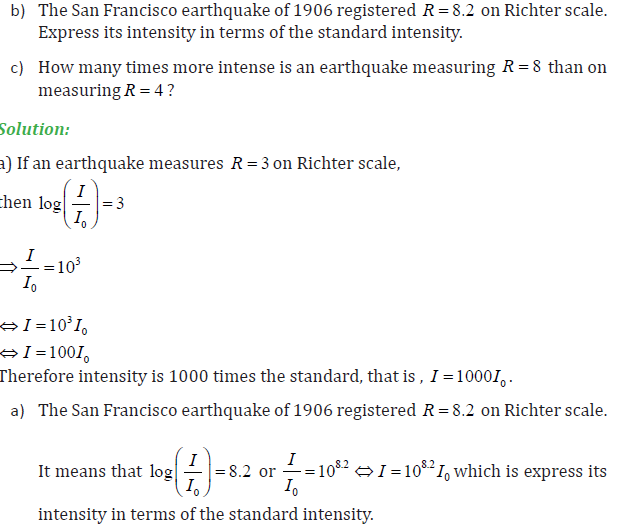
magnitude of an earthquake
ACTIVITY 2.3.3
Using internet and books, carry out a research and find out
how logarithms can intervene to solve problems related to thedetermination of the magnitude of an earthquake.
APPLICATION ACTIVITY 2.3.3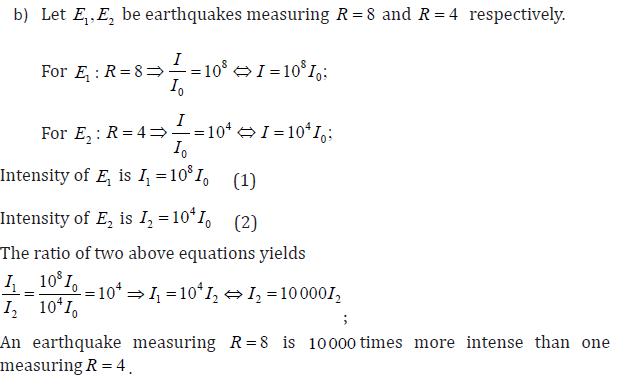
Earth quake can occur in any country. Assuming that there was an
earthquake I*which occurred in Rwanda in a certain past year.
Discuss how we can measure eventual earthquake which may occur
in our country referring to I* instead of referring to earthquake thathappened in western countries.
2.3.4 Application of exponential equations on interest rate problems
ACTIVITY 2.3.4
Mr Cauchy has a rentable house for which he asked 20,000Frw at
the first month. However, the client has pay at the beginning of every
month by adding 1% of the money paid for the previous month. If
the money is to be paid at the new bank account for Cauchy,
a) Calculate the money kept on Cauchy’s account in the middle of
the second, the third and the fourth month.
b) What is the type of sequence made by the money to be paid by
Cauchy’s client? Determine its general term.
c) Discuss the formula to be used to find the money Mr Cauchywill find on his account at the end of 12 months.
Example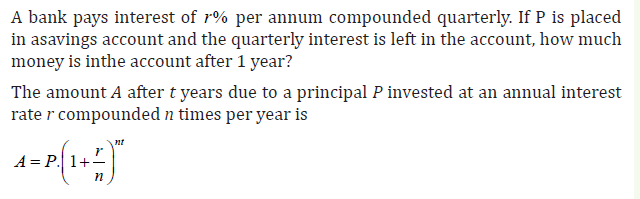
1) Mr. John operates an account with a certain bank which pays a compound
interest rate of 13.5% per annum. He opened the account at the beginning of
the year with 500,000 FRW and deposits the same amount of money at the
beginning of every year. Calculate how much he will receive at the end of 9
years.
After how long will the money have accumulated to 3.32 million of RwandanFracs?
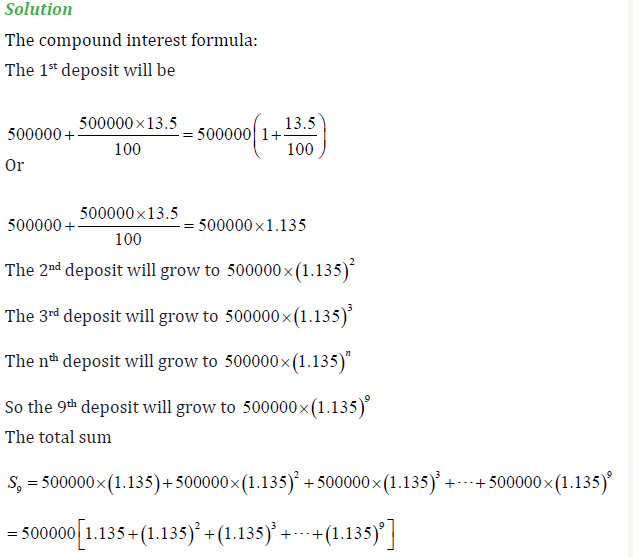
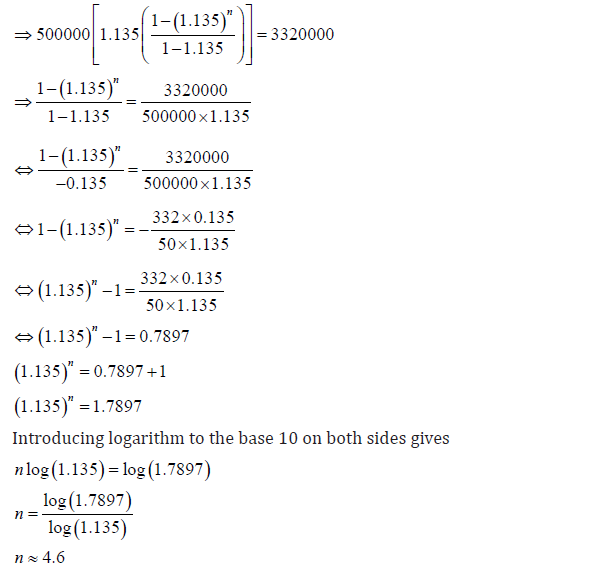
Hence it will take 4.6 years for the amount to accumulate to 3.32 million FRW
2) A man deposits 800,000 FRW into his savings account on which interest is
15% per annum. If he makes no withdrawals, after how many years will hisbalance exceed 8 million FRW?
APPLICATION ACTIVITY 2.3.4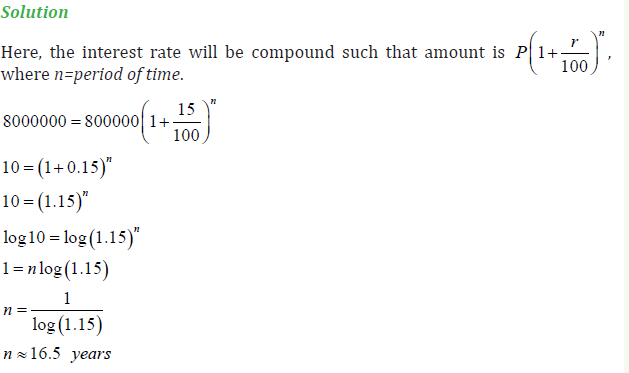
What annual rate of interest compounded annually should you seekif you want to double your investment in 5 years?
2.3.5 Application of exponential equations to determine the
mortgage payments
ACTIVITY 2.3.5
A loan with a fixed rate of interest is said to be amortized if both
principal and interest are paid by a sequence of equal paymentsmade over equal periods of time.
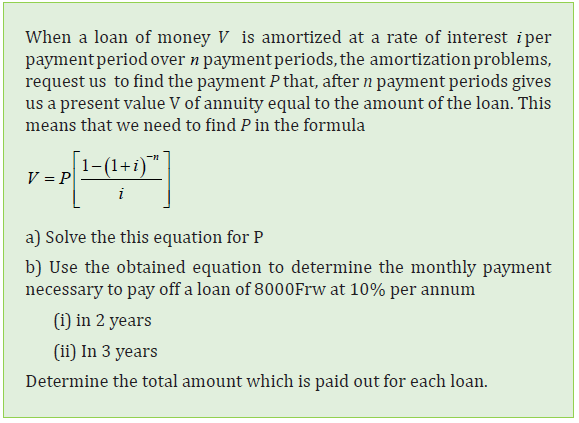
Examples: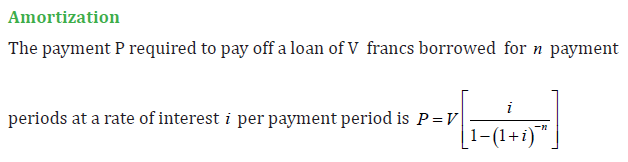
1) Mr. Clement has just purchased a radio of 300,000Frw and has made a down
payment of 60,000Frw. He can amortize the balance (300,000Frw-60,000Frw)
at 6% for 30 years.
(a) What are the monthly payments?
(b) What is his total interest payment?
(c) After 20 years, what equity does he have in his radio (that is, what is thesum of the down payment and the amount paid on the loan)?
2) When Mr. Thomas Rwambikana died, he left an inheritance of 15,000Frw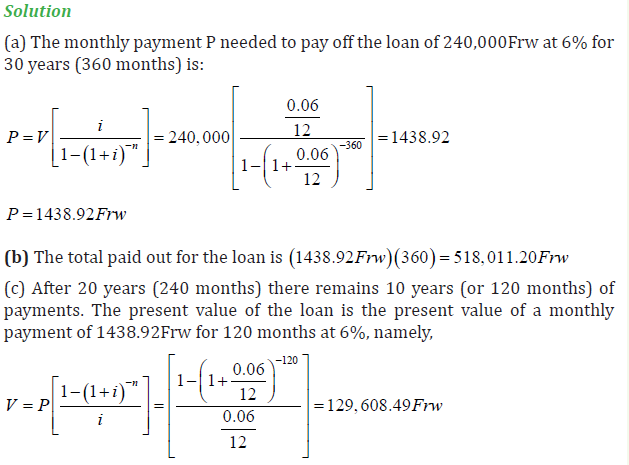
for his family to be paid to them over a 10-year period in equal amounts at the
end of each year. If the 15,000Frw isinvested at 4% per annum, what is the annual payout to the family?
Solution:
This example asks what annual payment is needed at 4% for 10 years to disperse
15,000Frw. That is, we can think of the 15,000Frw as a loan amortized at 4%
for 10 years. Thepayment needed to pay off the loan is the yearly amount Mr.
Rwambikana’s family willreceive.The yearly payout P is
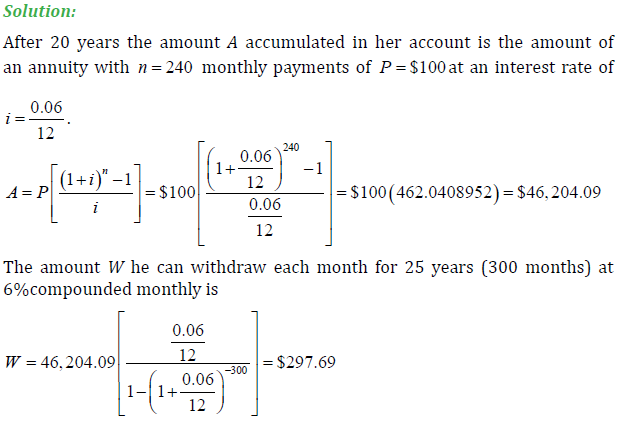
3) Mr Unen is 20 years away from retiring and starts saving $100 a month in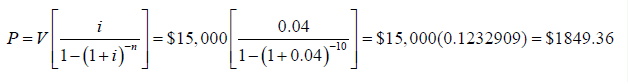
an accountpaying 6% compounded monthly. When he retires, he wishes to
withdraw a fixedamount each month for 25 years. What will this fixed amountbe?
APPLICATION ACTIVITY 2.3.5
A corporation is faced with a choice between two machines, both of
which are designedto improve operations by saving on labor costs.
Machine A costs $8000 and will generatean annual labor savings of
$2000. Machine B costs $6000 and will save $1800 in laborannually.
Machine A has a useful life of 7 years while machine B has a useful
life of only5 years. Assuming that the time value of money (the
investment opportunity rate) of the corporation is 10% per annum,
which machine is preferable? (Assume annual compounding andthat the savings is realized at the end of each year).
UNIT 3:ACQUAINTED WITH TEACHING AND LEARNING
Key unit competence: Solve problem involving the system of linear equationsusing matrices.
3.0 INTRODUCTORY ACTIVITY
A Farmer Kalisa bought in Ruhango Market 5 Cocks and 4 Rabbits and
he paid 35,000Frw, on the following day, he bought in the same Market 3
Cocks and 6 Rabbits and he paid 30,000Frw.
a)Arrange what Kalisa bought according to their types in a simple tableas follows
b)Discuss and explain in your own words how you can determine the cost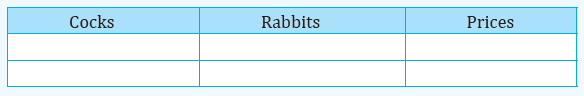
of 1 Cocks and 1 Rabbit.
3.0 INTRODUCTORY ACTIVITY
Matrices provide a means of storing large quantities of information in such a
way that each piece can be easily identified and manipulated. They facilitate the
solution of large systems of linear equations to be carried out in a logical and
formal way so that computer implementation follows naturally. Applications of
matrices extend over many areas of engineering including electrical networkanalysis and robotics.
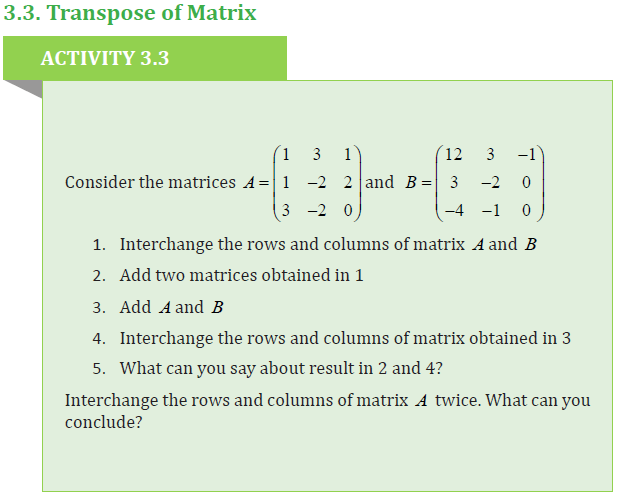
3.1. Definition and order of matrix
ACTIVITY 3.1
1) One shop sold 20 cell phones and 31 computers in a particular
month. Another shop sold 45 cell phones and 23 computers in
the same month. Present this information as an array of rows and columns.
2) a) Observe and complete the number of students in the year twoclasses on one Monday.
b) If every class gets new students on Tuesday such that in SME they
have 2 boys and 1 girls, in SSE they receive 1 girl and 1 boy, Complete
the table for new students.c) Complete the table for all students in an array of rows and columns.
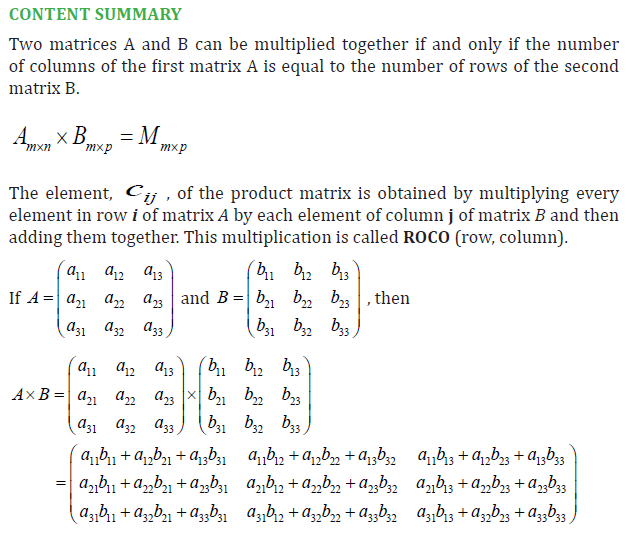
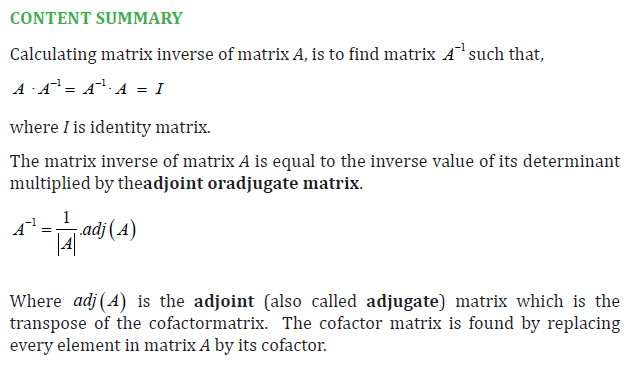
CONTENT SUMMARY
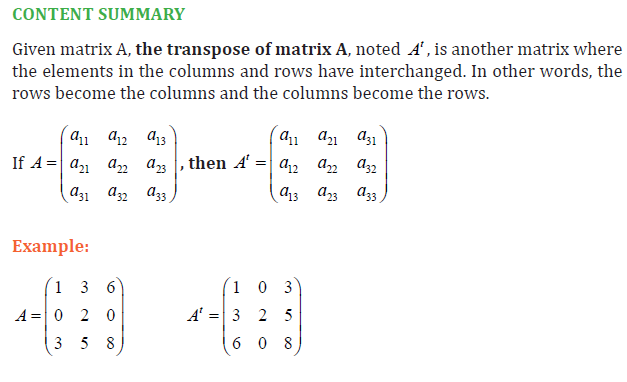
A matrix is a rectangular arrangement of numbers or algebraic expressions which
illustrate the data for a real life model in rows and columns. A matrix is denoted
with a capital letter: A,B,C,…and the elements are enclosed by parenthesis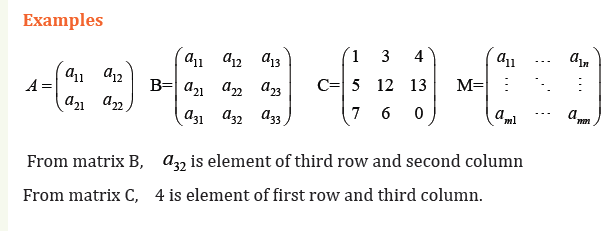
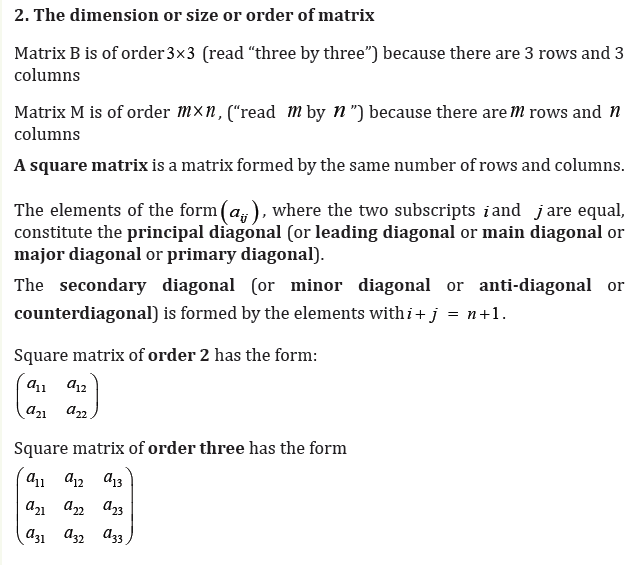
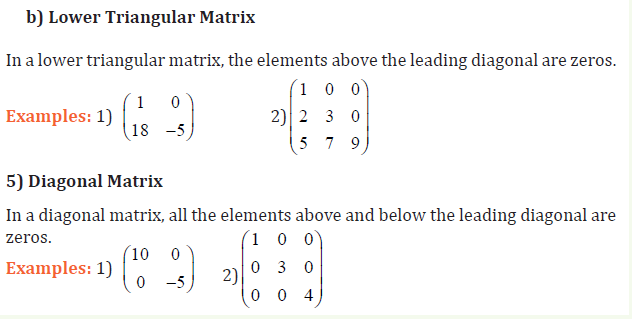
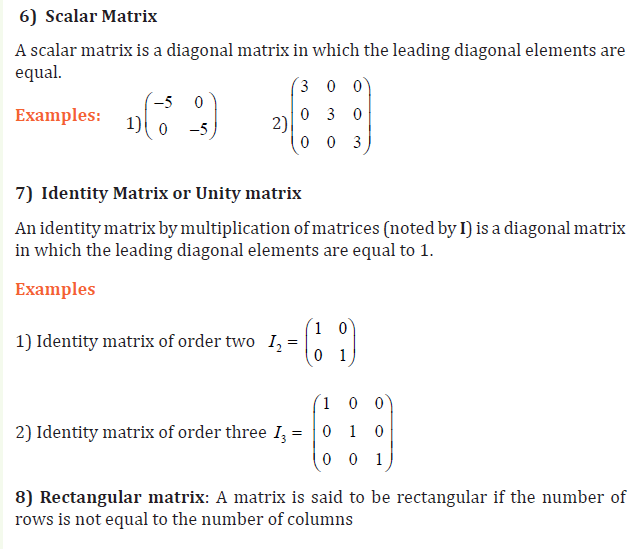
Types of matrices
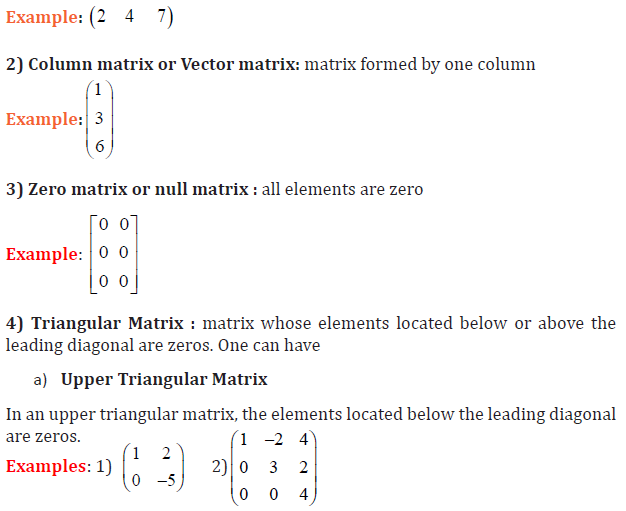
There are several types of matrices, but the most commonly used are1) Row matrix: matrix formed by one row
3.2. Operations on matrices
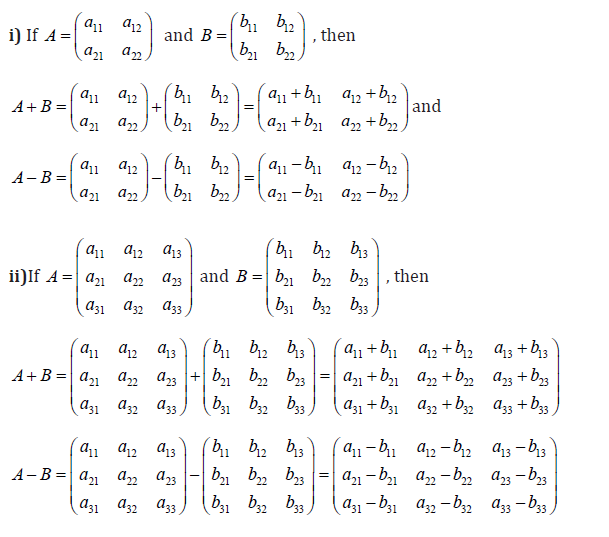
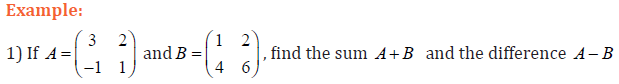
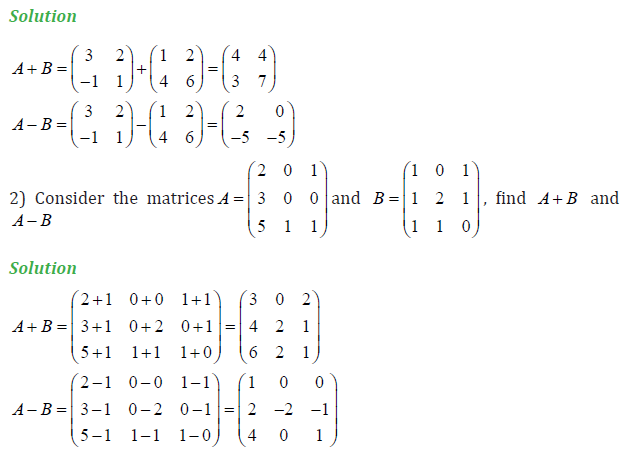
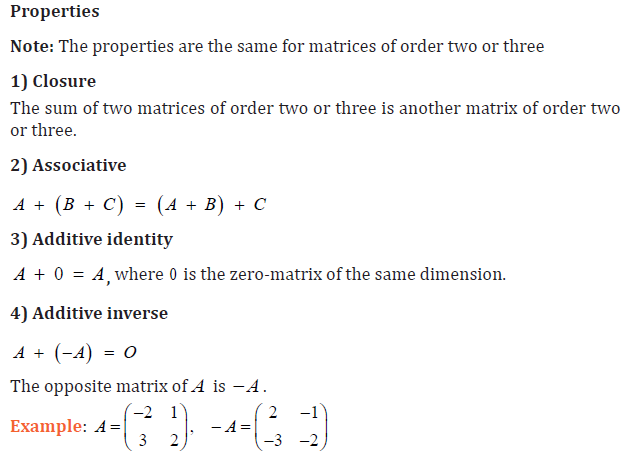
3.2.1 Addition and subtraction of matrices
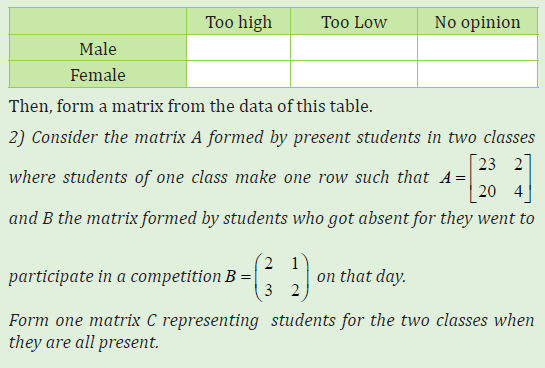
ACTIVITY 3.2.1
1) In a survey of 900 people, the following information was obtained:
200 males thought federal defense spending was too high,150 males
thought federal defense spending was too low, 45 males had no
opinion, 315 females thought federal defense spending was too high
125 females thought federal defense spending was too low, 65
females had no opinion.Discuss and arrange these data in a rectangular array as follows:
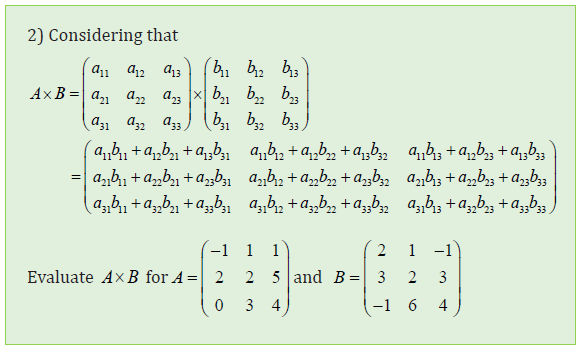
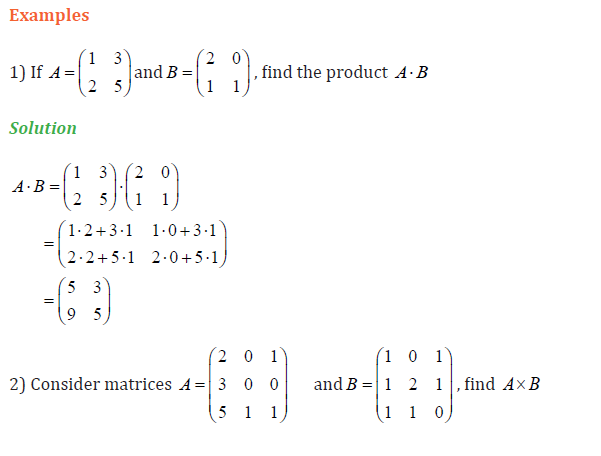
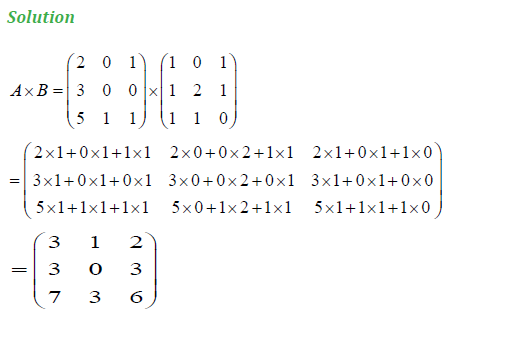
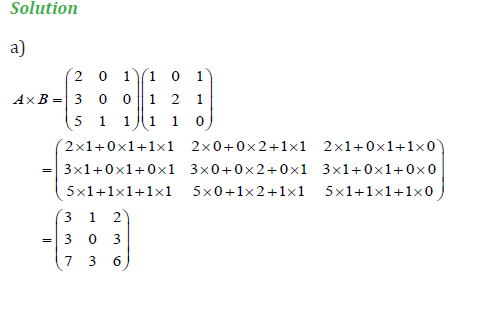
3.3.2 Multiplying matrices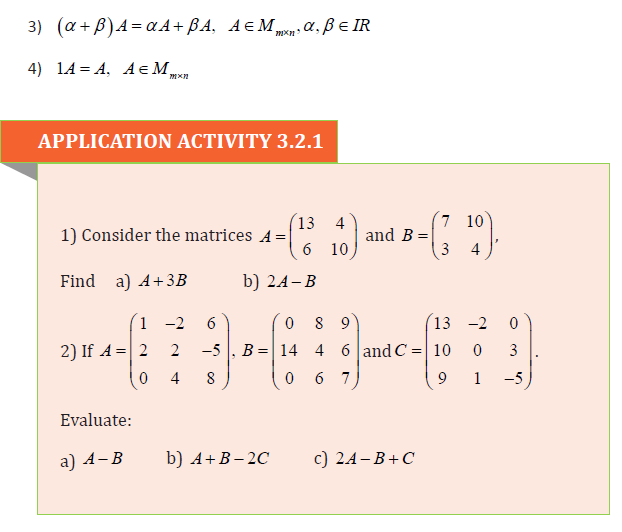
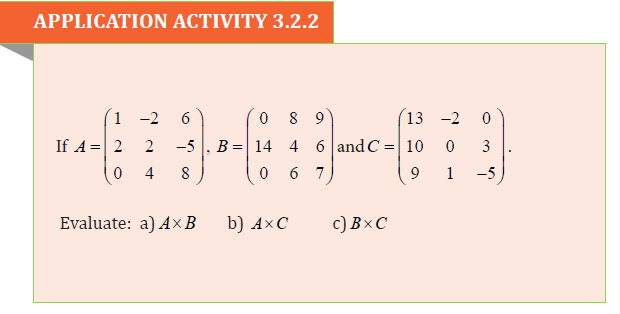
ACTIVITY 3.2.2
1) A clothing store sells men’s shirts for $40, silk ties for $20, and
wool suits for $400.
Last month, the store had sales consisting of 100 shirts, 200 ties, and
50 suits.
Using matrix, discuss and explain in your own words how todetermine the total revenue due to these sales.
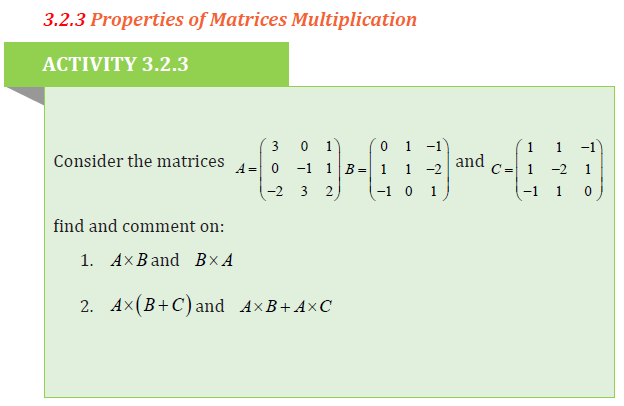
CONTENT SUMMARY
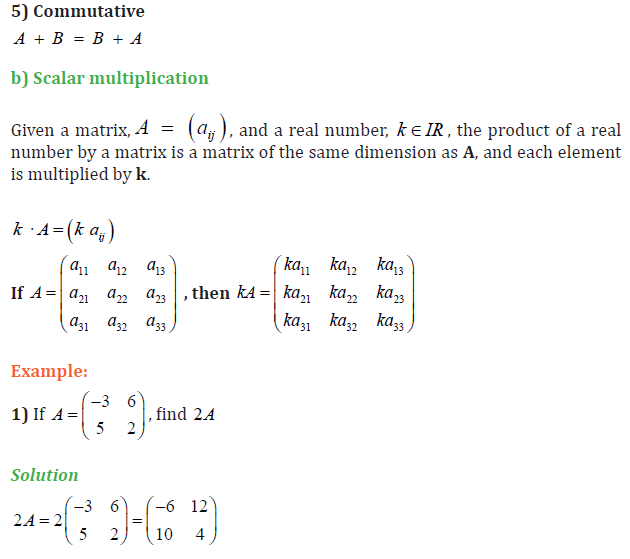
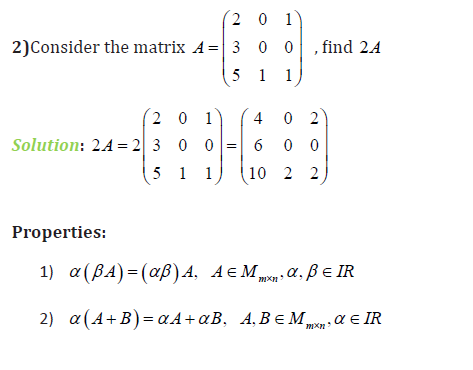
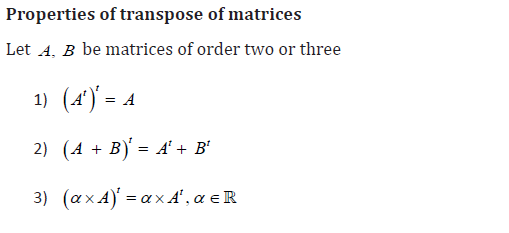
Let A, B,C be matrices of order two or three
1) AssociativeA×(B×C) = ( A× B)×C
2) Multiplicative Identity
A× I = A, where I is the identity matrix with the same order as matrix A.
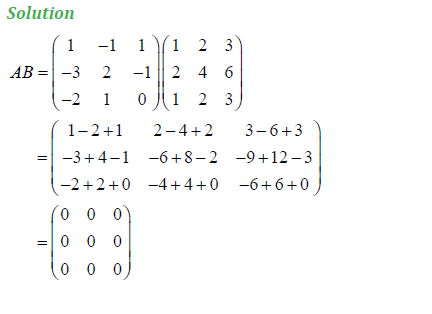
3) Not Commutative
A× B ≠ B× A
4) DistributiveA ×(B +C) = ( A× B) + ( A×C)
Find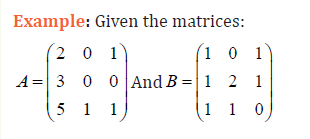
a) The product A× B
b) The product B× Ac) Conclude about the commutativity of multiplication of matrices
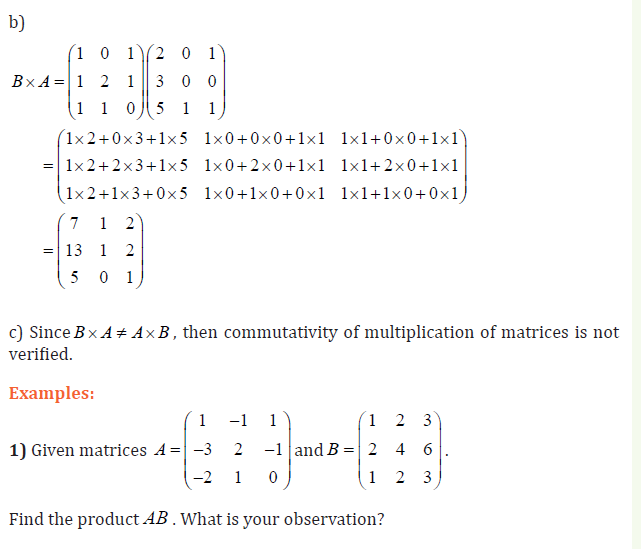
Observation: The given matrices commute in multiplication.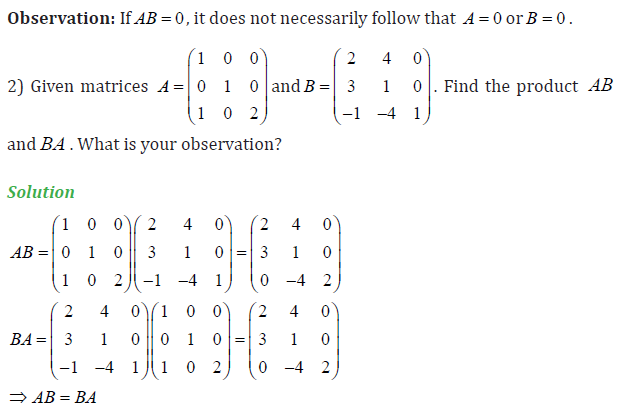
Notice
• If AB = 0, it does not necessarily follow that A = 0 or B = 0 .
• Commuting matrices in multiplication:In general the multiplication of
matrices is not commutative, i.e, AB ≠ BA , but we can have the case where
two matrices A and B satisfy AB = BA. In this case A and B are said to be
commuting.
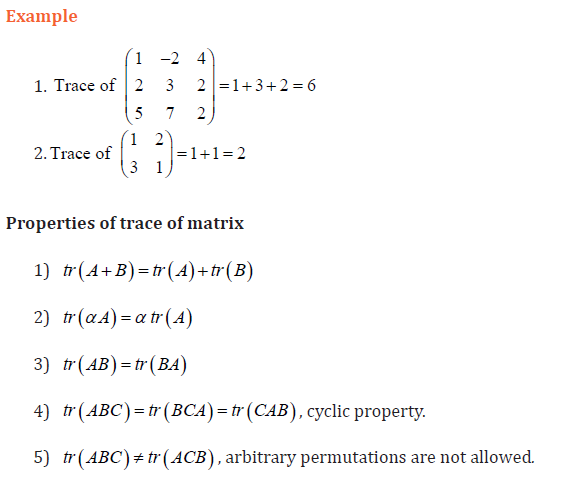
Trace of matrix
The sum of the entries on the leading diagonal of a square matrix, A, is knownas the trace of that matrix, notedtr ( A) .
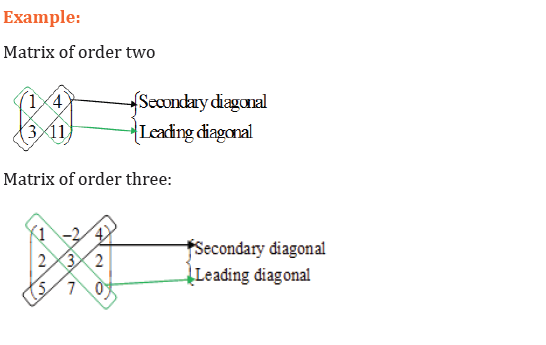
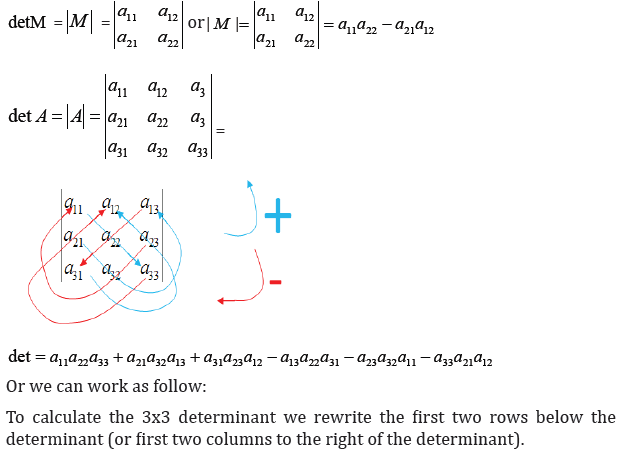
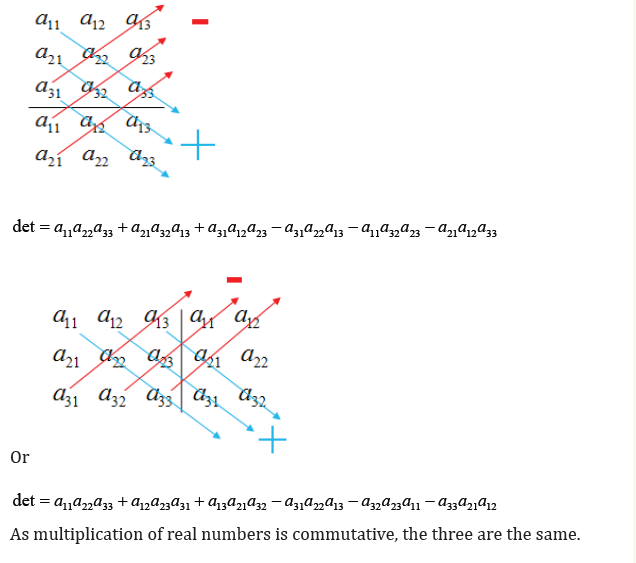
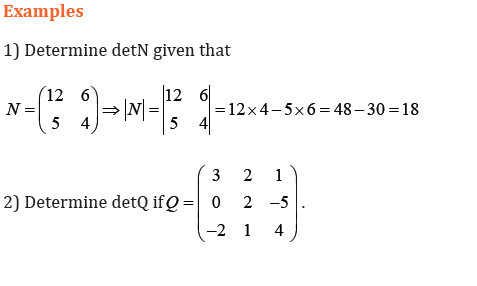
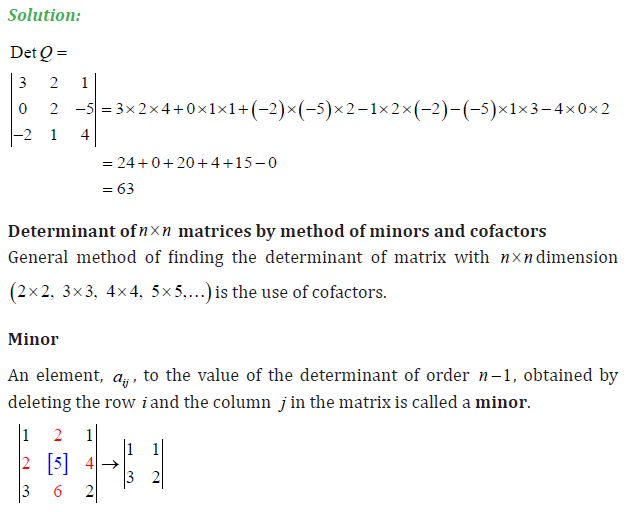
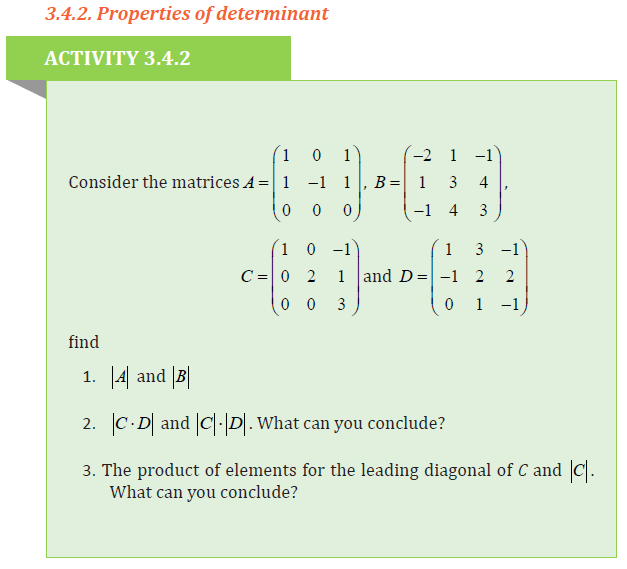
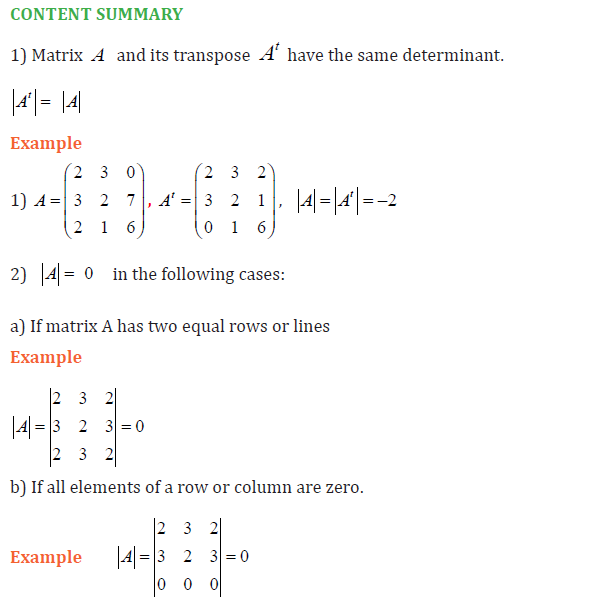
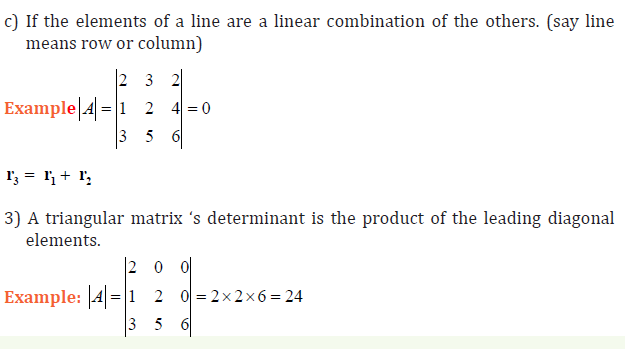
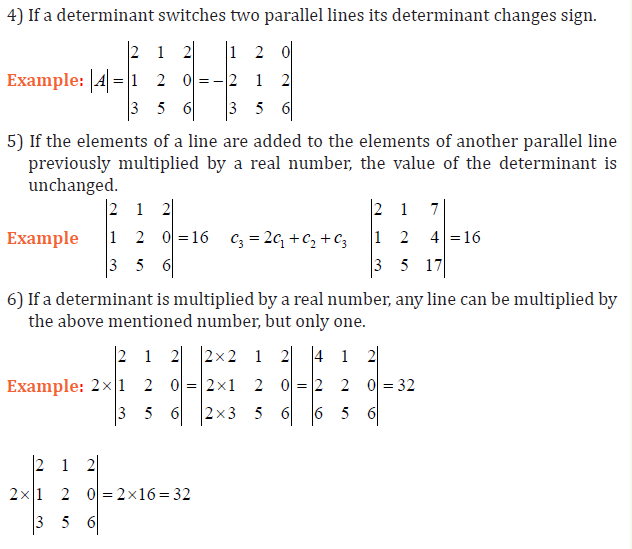
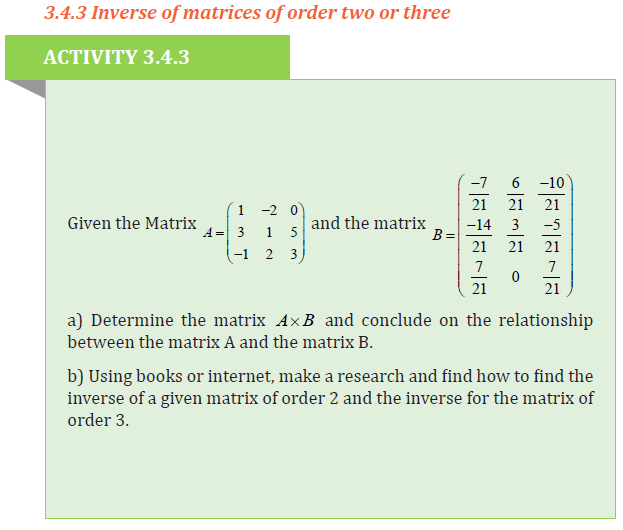
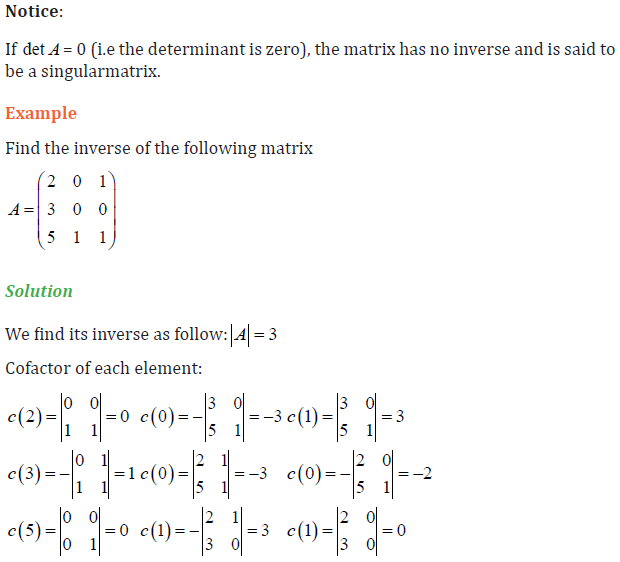
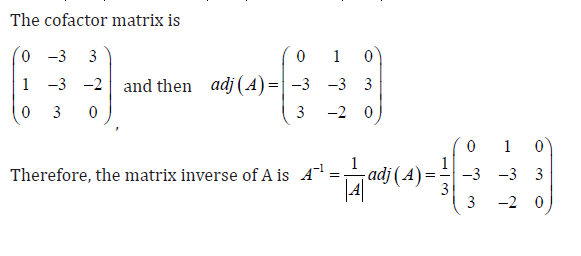
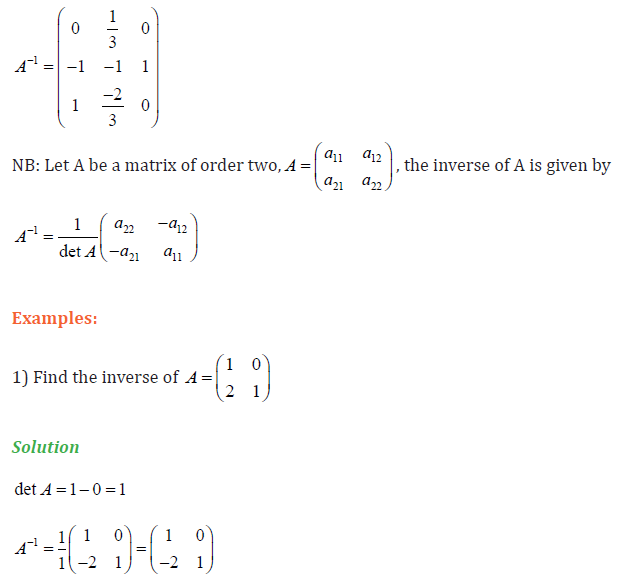
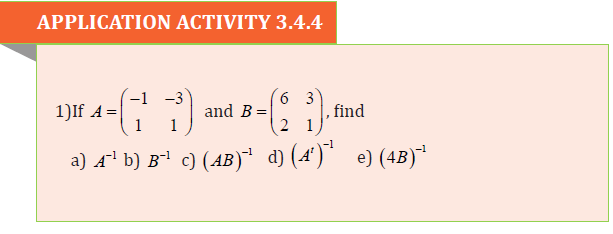
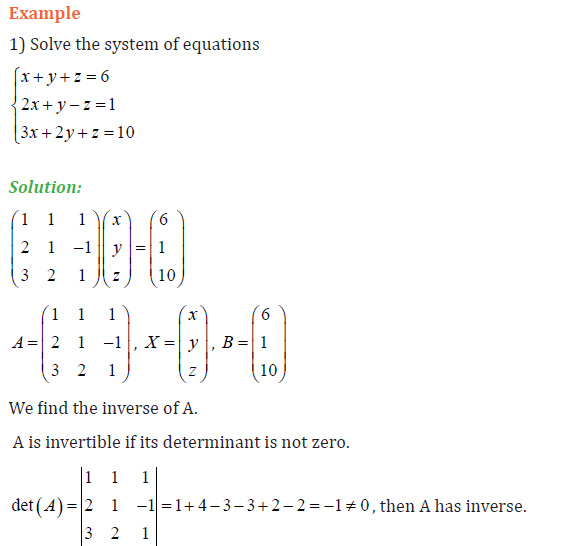
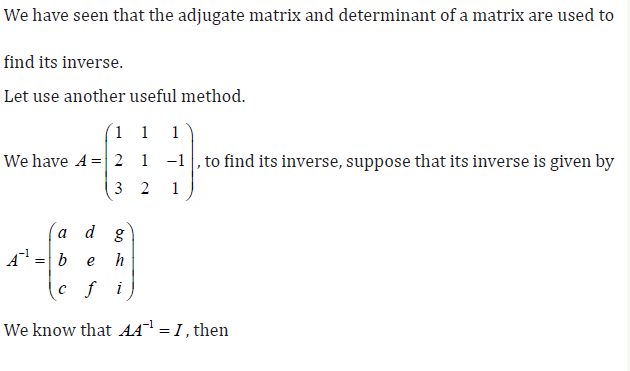
3.4. Determinants and inverse of a matrix of order two and three
3.4.1. Determinant of order two or three
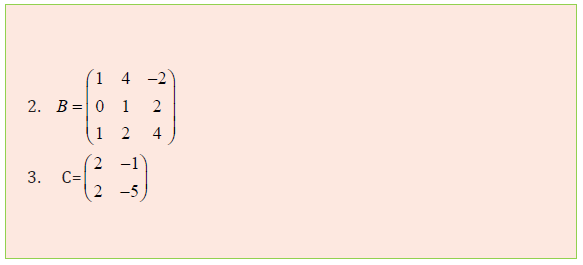
ACTIVITY 3.4.1
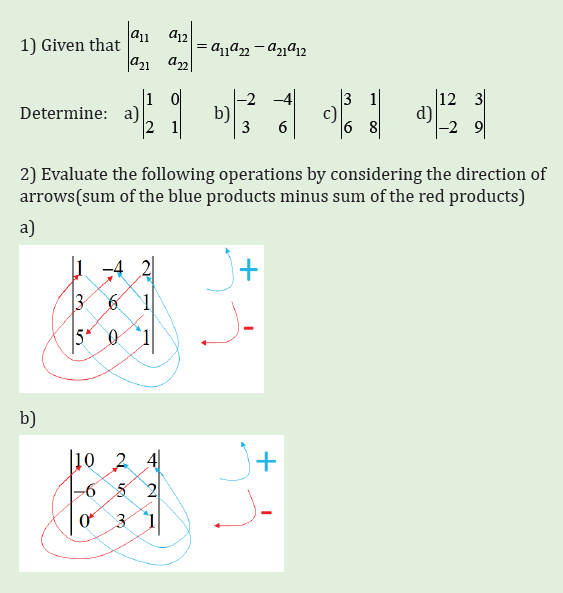
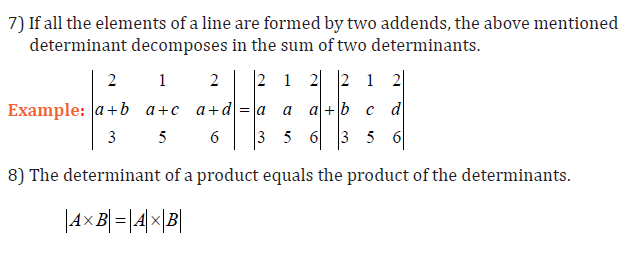
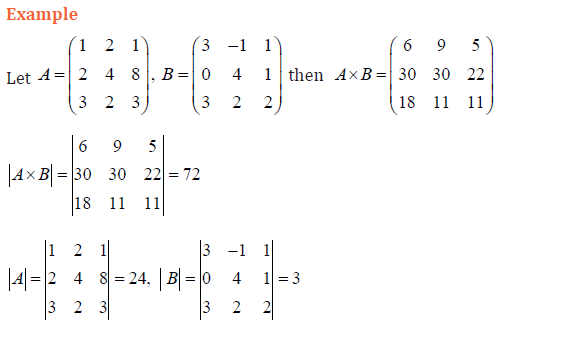
CONTENT SUMMARY
Consider two matrices, one of order two and another one of order three:
The determinant of A is calculated by SARRUS rule: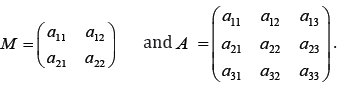
The terms with a positive sign are formed by the elements of the principal
diagonal and those of the parallel diagonals with its corresponding opposite
vertex.
The terms with a negative sign are formed by the elements of the secondary
diagonal and those of the parallel diagonals with its corresponding oppositevertex.
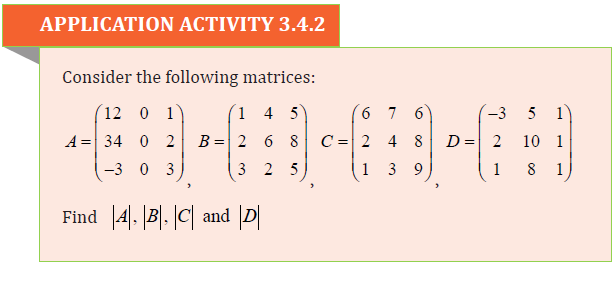
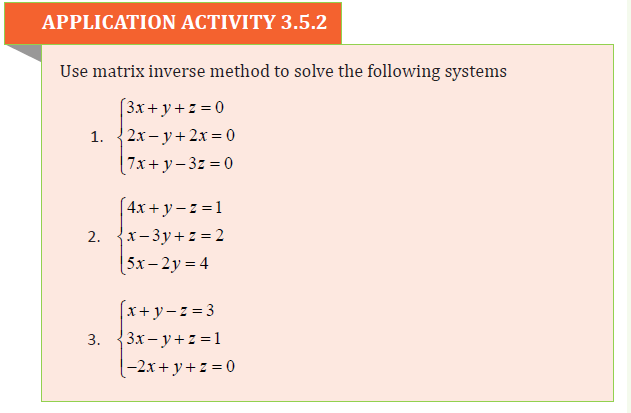
3.5. Applications of matrices and determinants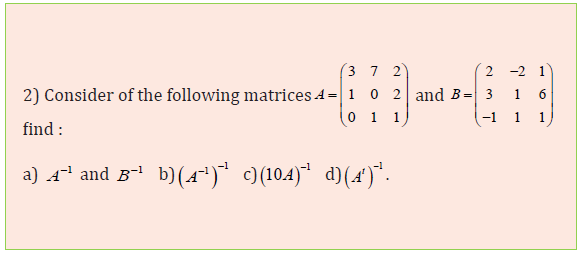
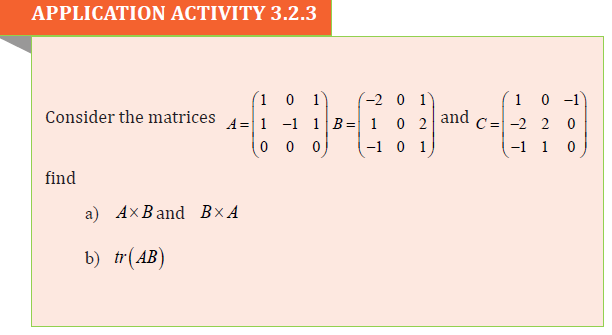
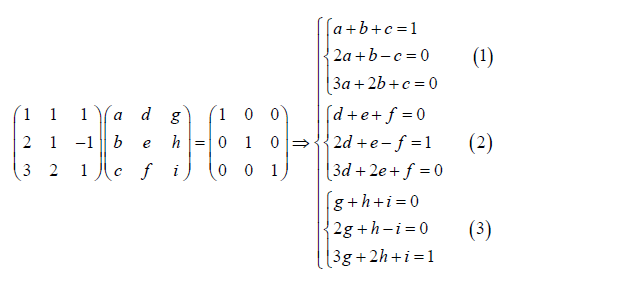
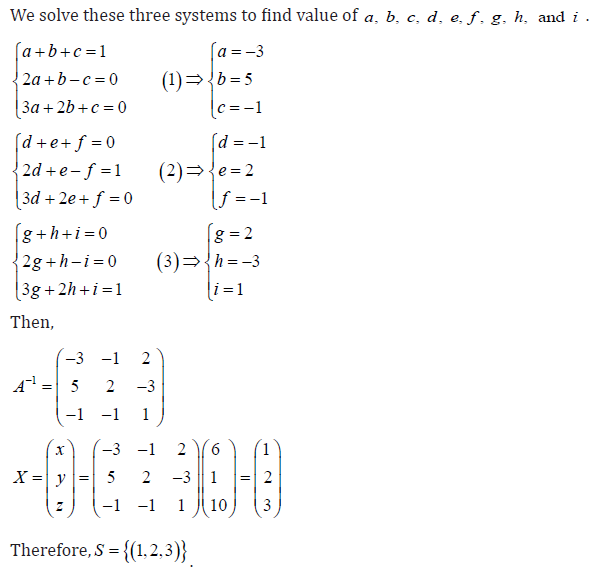
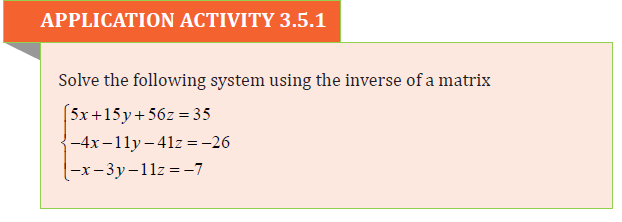
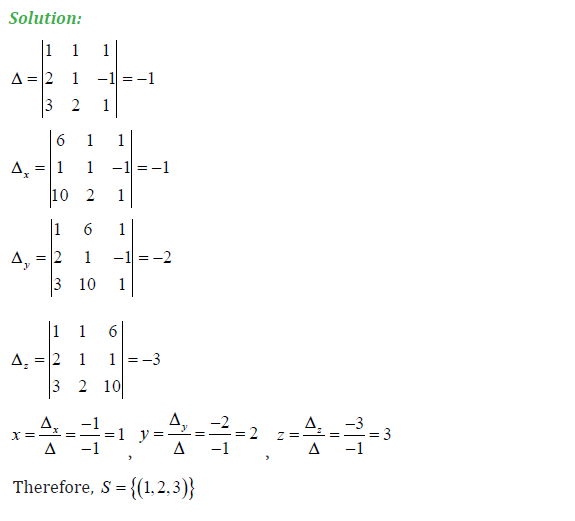
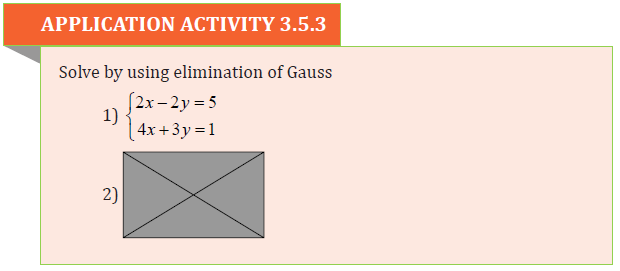
3.5.1 Solving System of linear equations using inverse matrix
ACTIVITY 3.5.1
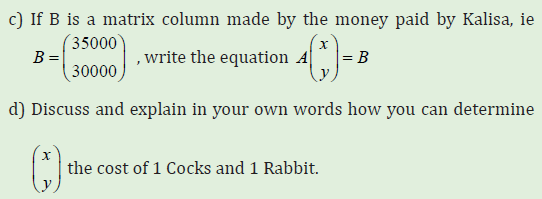
A Farmer Kalisa bought in Ruhango Market 5 Cocks and 4 Rabbits
and he paid 35,000Frw, on the following day, he bought in the same
Market 3 Cocks and 6 Rabbits and he paid 30,000Frw.
a) Considering x as the cost for one cock and y the cost of one
Rabbit, formulate equations that illustrate the activity of Kalisa;b) Make a matrix A indicating the number of cocks and rabbits
Notice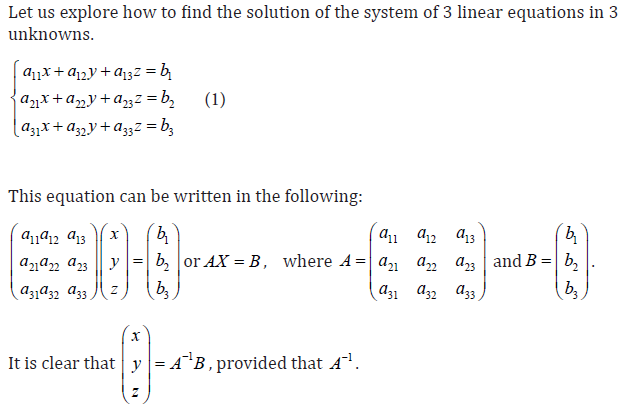
• If at least, one of bi is different of zero the system is said to be non-homogeneous
and if all bi are zero the system is said to be homogeneous.
• The set of values of x, y, z that satisfy all the equations of system (1) is
called solution of the system.
• For the homogeneous system, the solution x = y = z = 0 is called trivial
solution. Other solutions are non-trivial solutions.
Non- homogeneous system cannot have a trivial solution as at least one ofx, y, z is not zero.
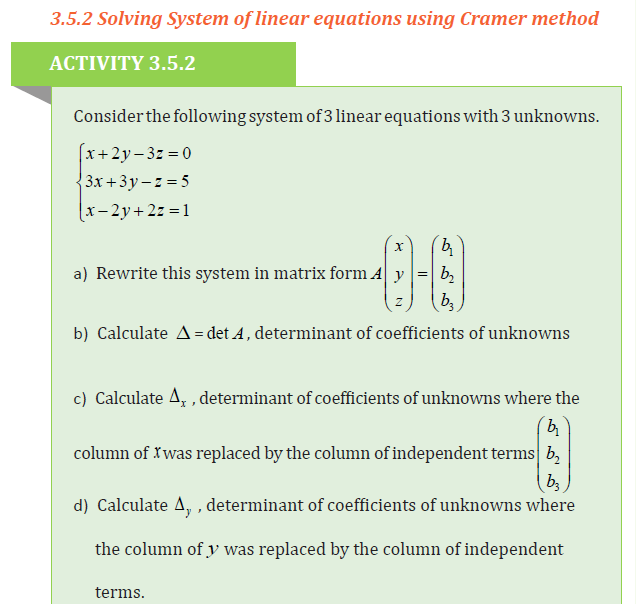
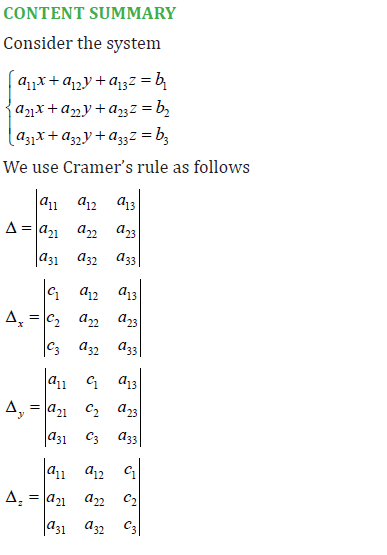
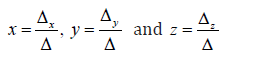
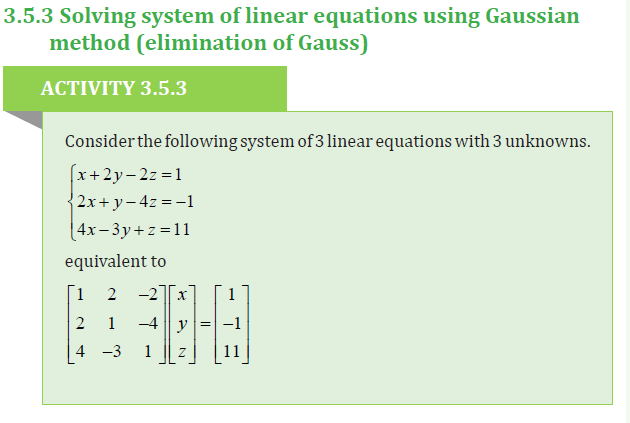
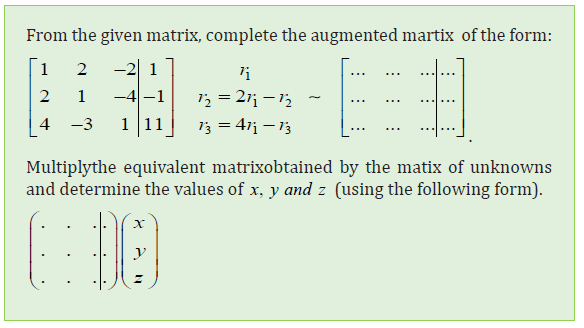
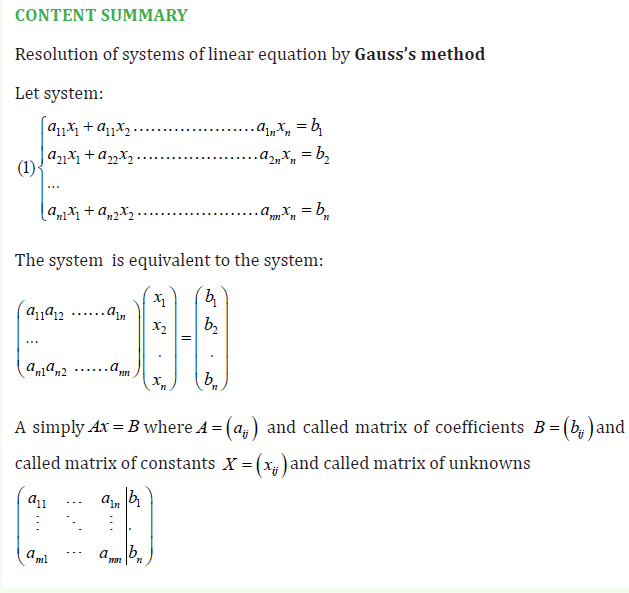
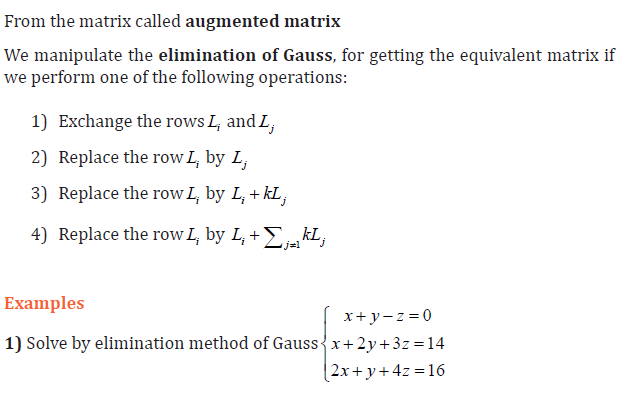
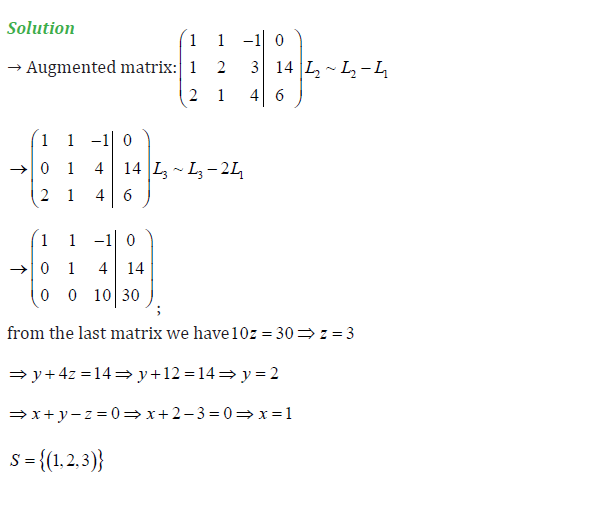
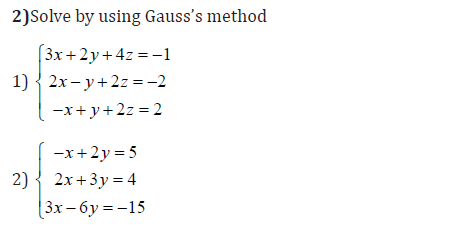
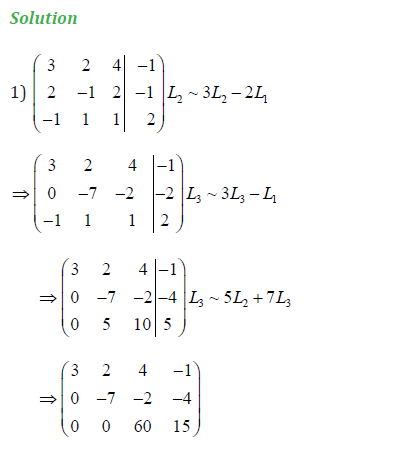
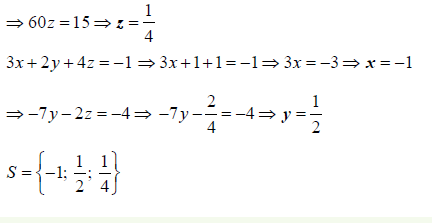
Note: The method of GAUSS helps us to solve the above system where CRAMER’S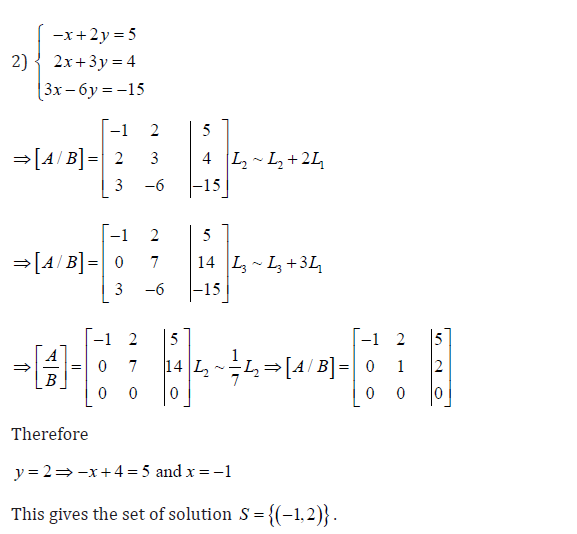
method cannot.
UNIT 4 : BIVARIATE STATISTICS
Key unit Competence: Extend understanding, analysis and interpretation
of bivariate data to correlation coefficients andregression lines
4.0 INTRODUCTORY ACTIVITY
In Kabeza village, after her 9 observations about farming,
UMULISA saw that in every house observed, where there is a cow (X) if
there is also domestic duck (Y), then she got the following results:
(1,4) ,( 2,8) , (3,4) , (4,12) , (5,10),(6,14) , (7,16) , (8,6 ), (9,18)
a. Represent this
information graphically in (x, y) − coordinates .
b. Find the equation of line joining any two points of the graph and guess the
name of this line.
c. According to your observation from (a), explain in your own words if there is any
relationship between the variation of Cows (X) and the variation of domestic duck (Y).
4.1 Bivariate data, scatter diagram and types of correlation
ACTIVITY 4.1
Consider the situation in which the mass, y (g), of a chemical is
related to the time , x minutes, for which the chemical reaction hasbeen taking place ,according to the table.
a) Plot the above information in (x, y) coordinates.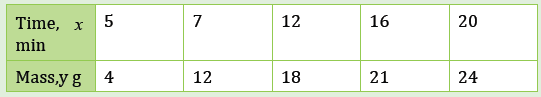
b) Explain in your own words the relationship between x and y
In statistics, bivariate or double series includes technique of analyzing data in
two variables, when focus on the relationship between a dependent variable-y
and an independent variable-x.
For example, between age and weight, weight and height, years of education
and salary, amount of daily exercise and cholesterol level, etc. As with data for a
single variable, we can describe bivariate data both graphically and numerically.
In both cases we will be primarily concerned with determining whether there
is a linear relationship between the two variables under consideration or not.
It should be kept in mind that a statistical relationship between two variables
does not necessarily imply a causal relationship between them. For example,
a strong relationship between weight and height does not imply that either
variable causes the other.
Scatter plots or Scatter diagram and types of correlation
Consider the following data which relate x, the respective number of branches
that 10 different banks have in a given common market, with y, the correspondingmarket share of total deposits held by the banks:
The scatter plot or scatter diagram (in the figure above) indicates that, roughly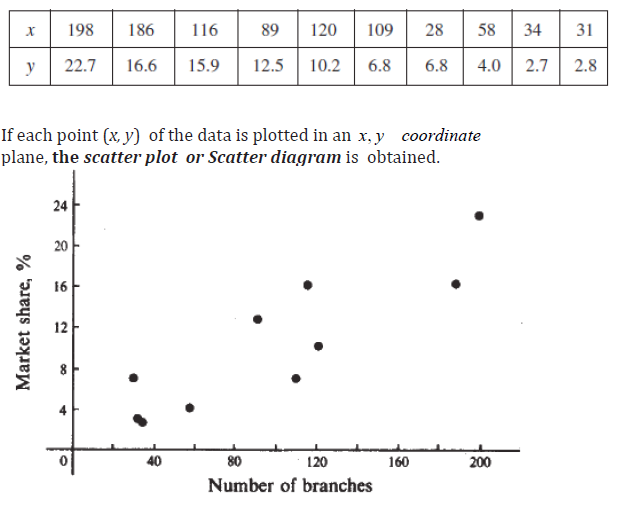
speaking, the market share increases as the number of branches increases. We
say that x and y have a positive correlation.
On the other hand, consider the data below, which relate average daily
temperature x, in degrees Fahrenheit, and daily natural gas consumption y, incubic metre.
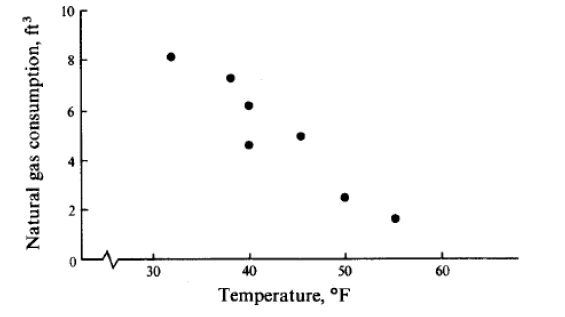
Finally, consider the data items (x, y) below, which relate daily temperature x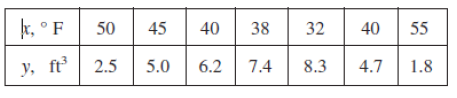
over a 10-day period to the Dow Jones stock average y.
We see that y tends to decrease as x increases. Here, x and y have a negative
correlation.
Finally, consider the data items (x, y) below, which relate daily temperature x
over a 10-day period to the Dow Jones stock average y: (63, 3385); (72, 3330);
(76, 3325); (70, 3320); (71, 3330); (65, 3325); (70, 3280); (74, 3280) ;(68,3300); (61, 3265).
There is no apparent relationship between x and y (no correlation or Weak
correlation.
APPLICATION ACTIVITY 4.1
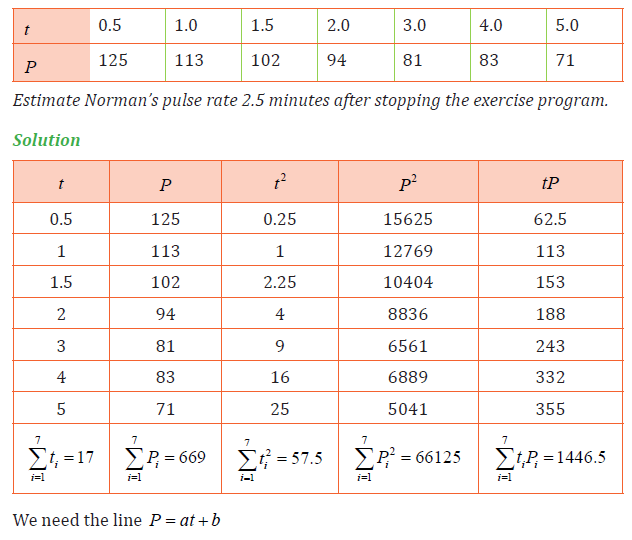
One measure of personal fitness is the time taken for an individual’s
pulse rate to return to normal after strenuous exercise, the greater the
fitness, the shorter the time. Following a short program of strenuous
exercise Norman recorded his pulse rates P at time t minutes after
he had stopped exercising. Norman’s results are given in the tablebelow.
a) Draw a scatter diagram to represent this information in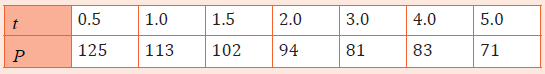
(x, y)coordinatesb) Explain the relationship between Norman’s pulse P and time t.
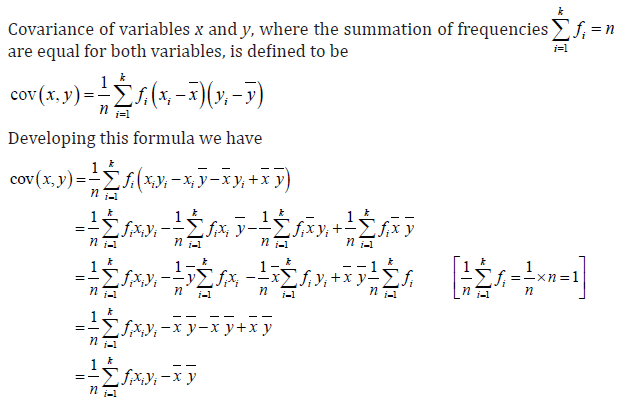
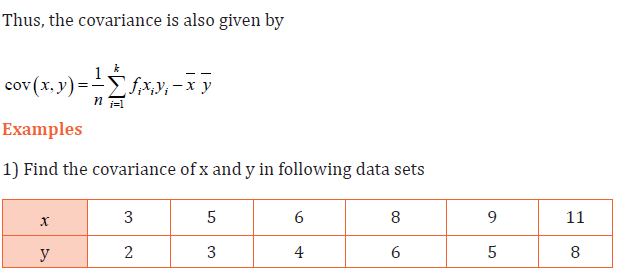
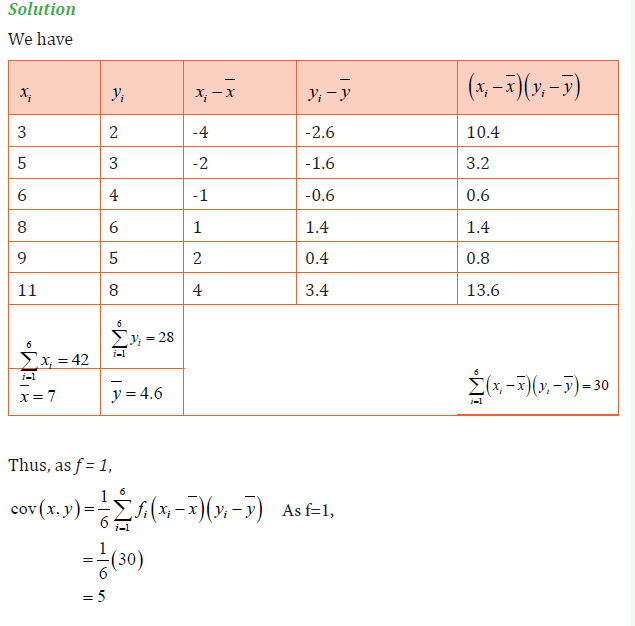
In case of two variables, say x and y, there is another important result called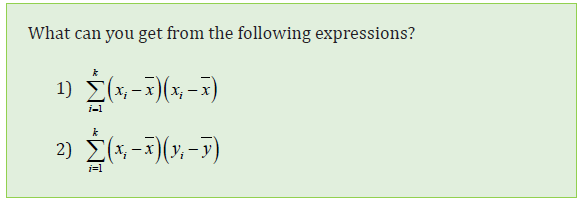
covariance of x and y, denoted cov(x, y) .
The covariance of variables x and y is a measure of how these two variables
change together. If the greater values of one variable mainly correspond with the
greater values of the other variable, and the same holds for the smaller values,
i.e. the variables tend to show similar behavior, the covariance is positive. In
the opposite case, when the greater values of one variable mainly correspond
to the smaller values of the other, i.e. the variables tend to show opposite
behavior, the covariance is negative. If covariance is zero the variables are said
to be uncorrelated, itmeans that there is no linear relationship between them.
Therefore, the sign of covariance shows the tendency in the linear relationshipbetween the variables. The magnitude of covariance is not easy to interpret.
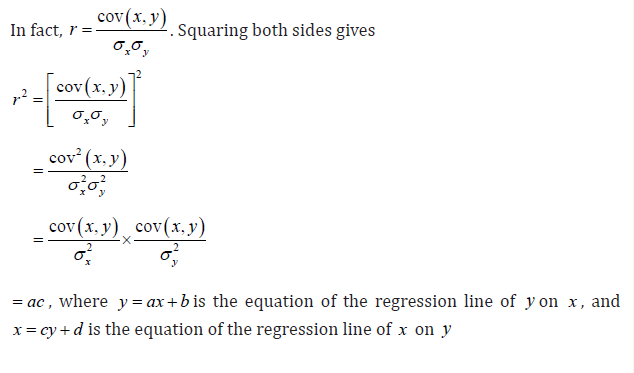
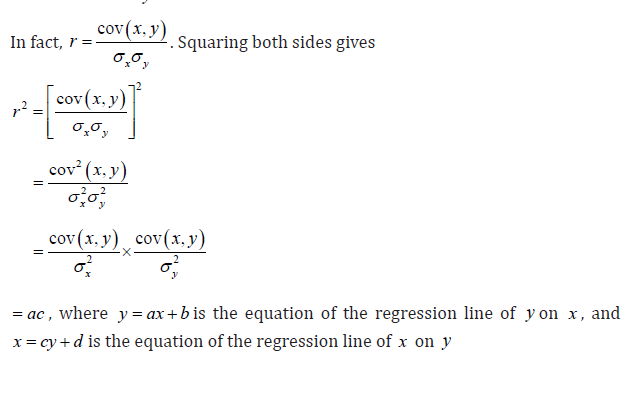
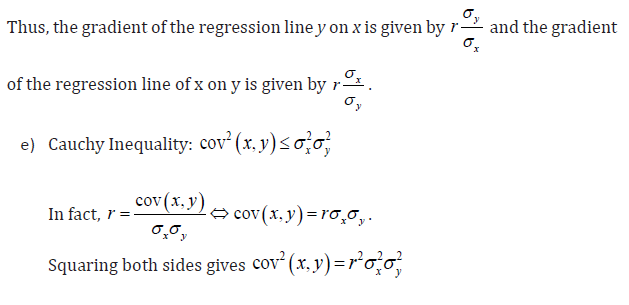
The Pearson’s coefficient of correlation (or Product moment coefficient of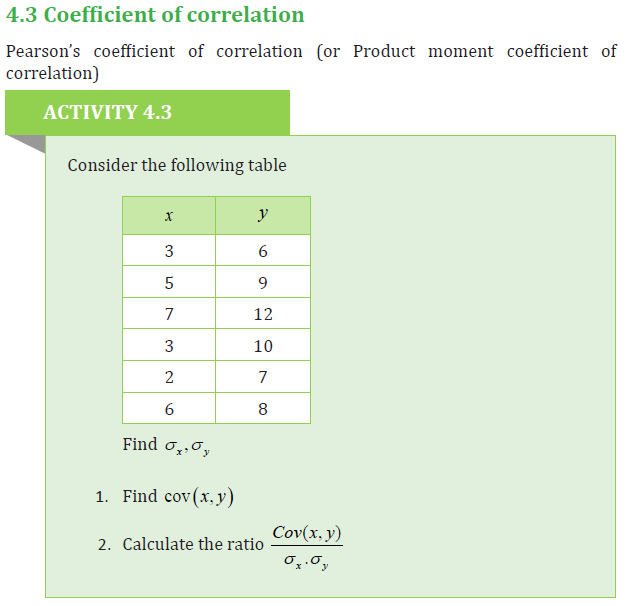
correlation or simply coefficient of correlation), denoted by r, is a measure ofthe strength of linear relationship between two variables.
Properties of the coefficient of correlation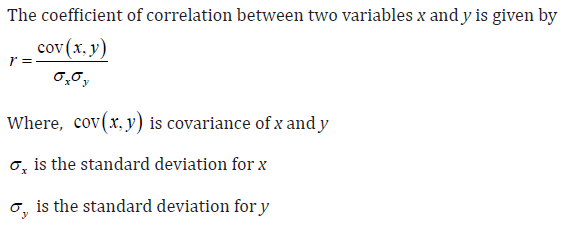
a) The coefficient of correlation does not change the measurement scale.
That is, if the height is expressed in meters or feet, the coefficient of
correlation does not change.
b) The sign of the coefficient of correlation is the same as the covariance.
c) The square of the coefficient of correlation is equal to the product of the
gradient of the regression line of y on x , and the gradient of the regressionline of x on y .
g) If the linear coefficient of correlation takes values closer to −1, the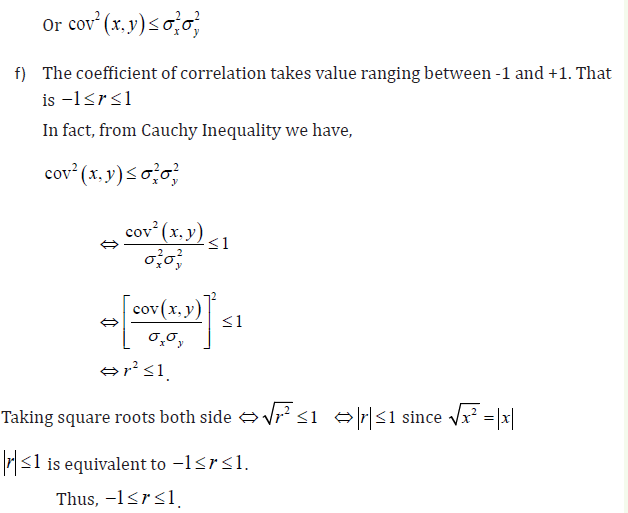
correlation is strong and negative, and will become stronger the closer
rapproaches −1.
h) If the linear coefficient of correlationtakes values close to 1 the correlation
is strong and positive, and will become stronger the closer r approaches 1
i) If the linear coefficient of correlationtakes values close to 0, the correlation is weak.
j) If r = 1or r = −1, there is perfect correlation and the line on the scatter
plot is increasing or decreasing respectively.k) If r = 0, there is no linear correlation.
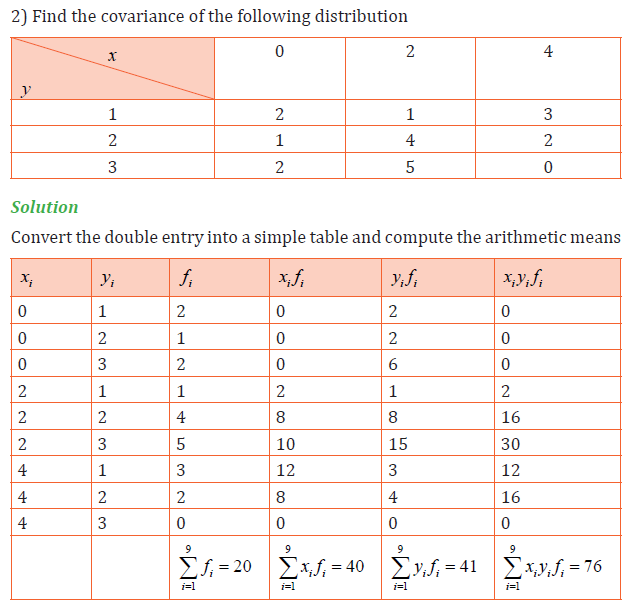
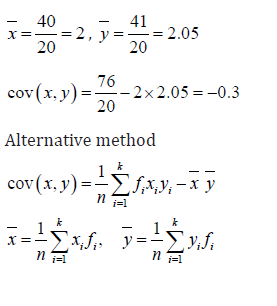
Examples:
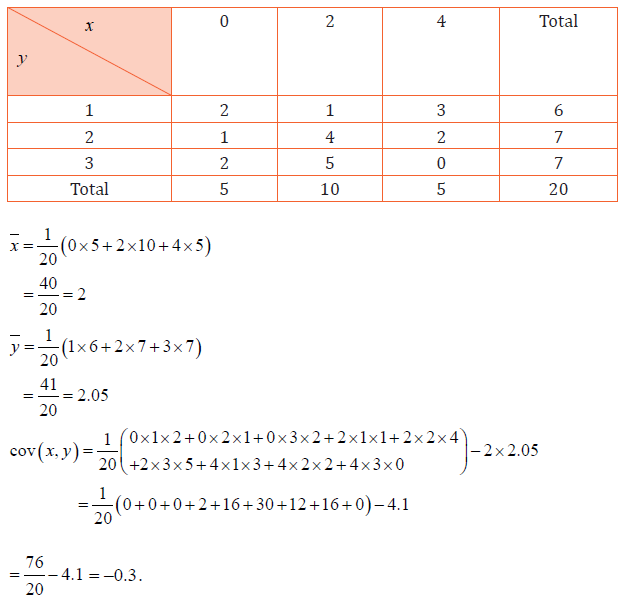
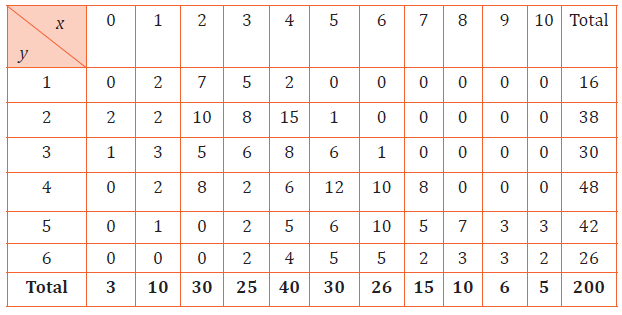
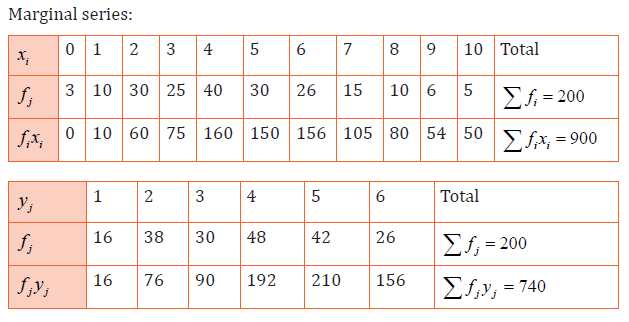
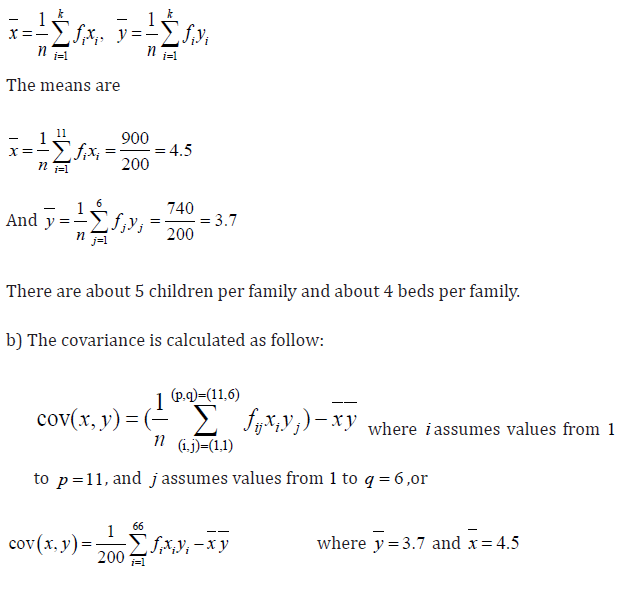
1) A test is made over 200 families on number of children (x) and number of
beds y per family. Results are collected in the table below
a) What is the average number for children and beds per a family?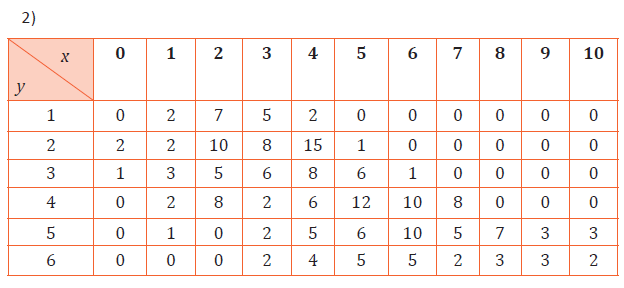
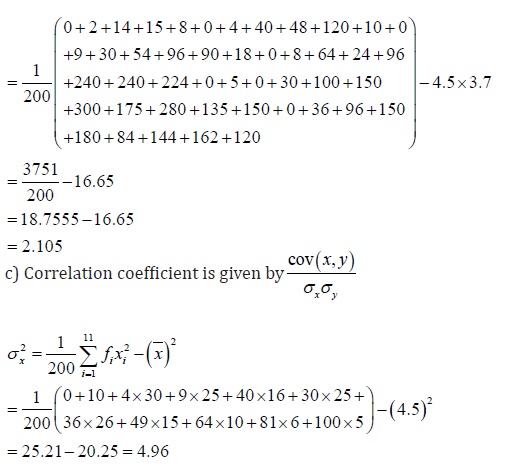
b) Find the covariance.
c) Can we confirm that there is a high linear correlation between the number of
children and number of beds per family?
Solution
a) Average number of children per family:Contingency table:
Spearman’s coefficient of rank correlation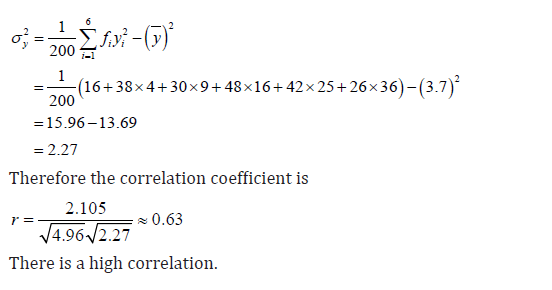
A Spearman coefficient of rank correlation or Spearman’s rho is measure
of statistical dependence between two variables. It assesses how well the
relationship between two variables can be described using a monotonic
function. The Spearman’s coefficient of rank correlation is denoted and defined by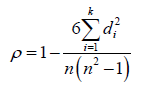
Where, d refers to the difference of ranks between paired items in two series and
n is the number of observations. It is much easier to calculate the Spearman’s
coefficient of rank correlation than to calculate the Pearson’s coefficient
of correlation as there is far less working involved. However, in general, the
Pearson’s coefficient of correlation is a more accurate measure of correlation
when data are numerical.
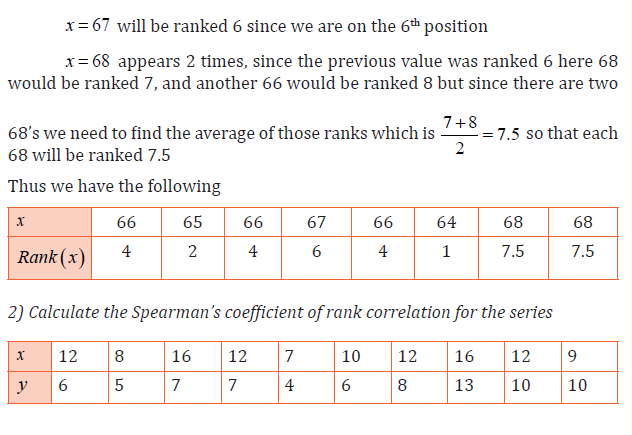
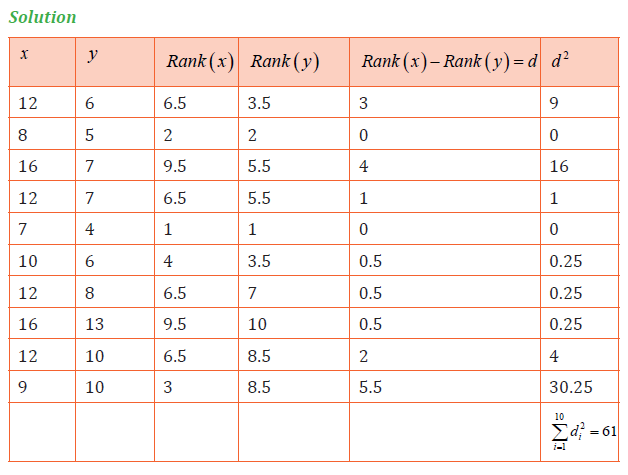
Method of ranking
Ranking can be done in ascending order or descending order.
Examples:
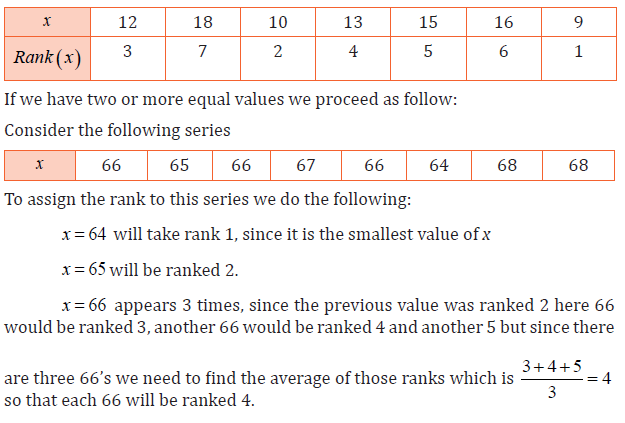
1) Suppose that we have the marks, x, of seven students in this order:
12, 18, 10, 13, 15, 16, 9
We assign the rank 1, 2, 3, 4, 5, 6, 7 such that the smallest value of x will be
ranked 1.That is
CONTENT SUMMARY
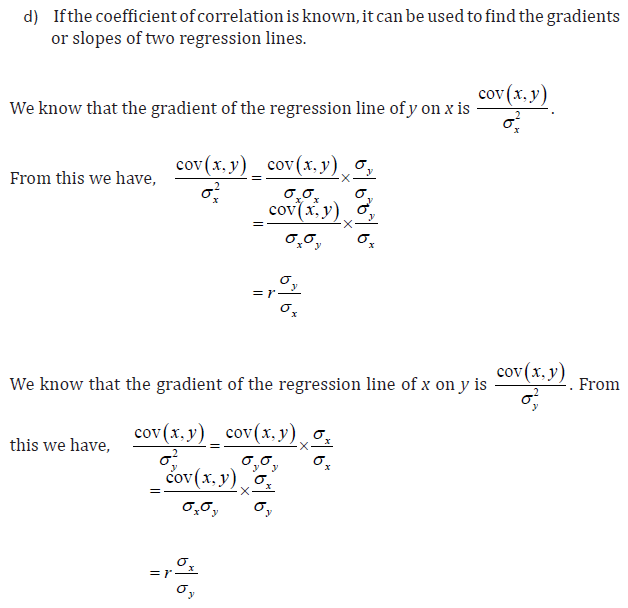
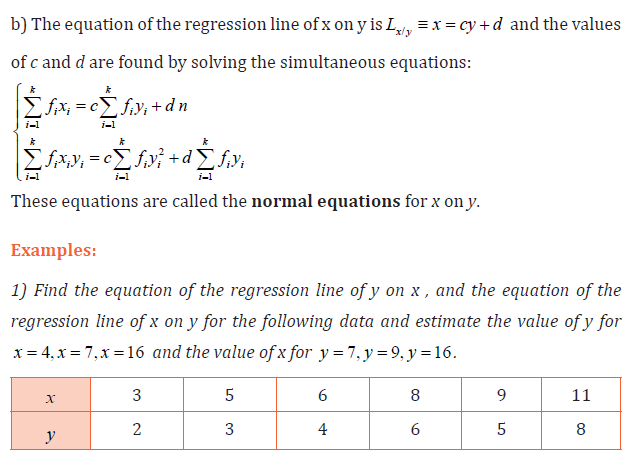
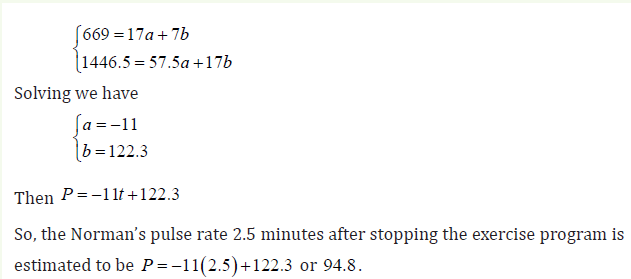
We use the regression line of y on x to predict a value of y for any given value
of x and vice versa, we use the regression line of x on y, to predict a value of
x for a given value of y. The “best” line would make the best predictions: the
observed y-values should stray as little as possible from the line. This straight
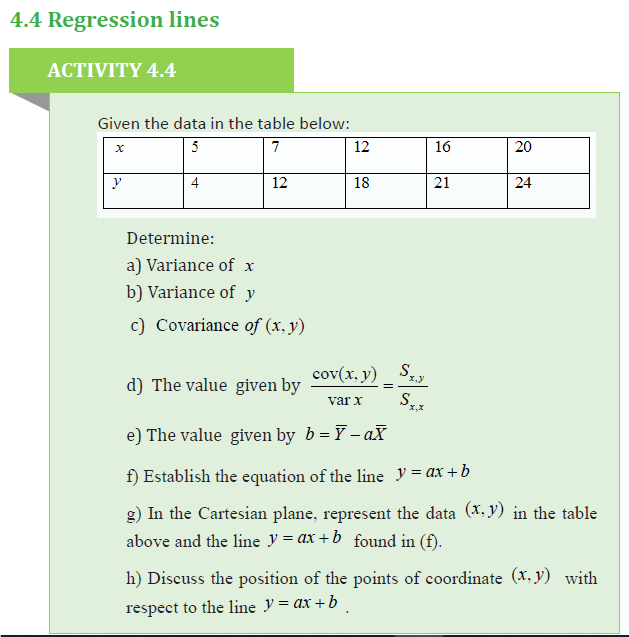
line is the regression line from which we can adjust its algebraic expressionsand it is written as y = ax + b , where a is the gradient and b is the y-intercept.
APPLICATION ACTIVITY 4.4
1. Consider the following table
4.5 Interpretation of statistical data (Application)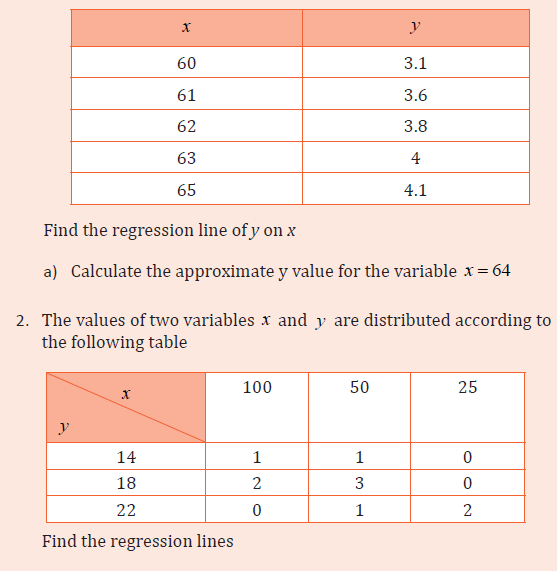
ACTIVITY 4.5Explain in your own words how statistics, especially bivariate
statistics, can be used in our daily life.
Bivariate statistics can help in prediction of a value for one variable if we know
the value of the other.
Examples:
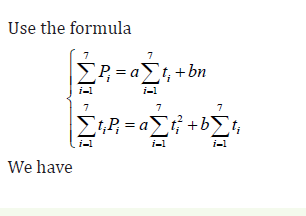
1. One measure of personal fitness is the time taken for an individual’s pulse
rate to return to normal after strenuous exercise, the greater the fitness, the
shorter the time. Following a short program of strenuous exercise Norman
recorded his pulse rates P at time t minutes after he had stopped exercising.Norman’s results are given in the table below.
iv. State with a reason whether it is sensible to conclude from your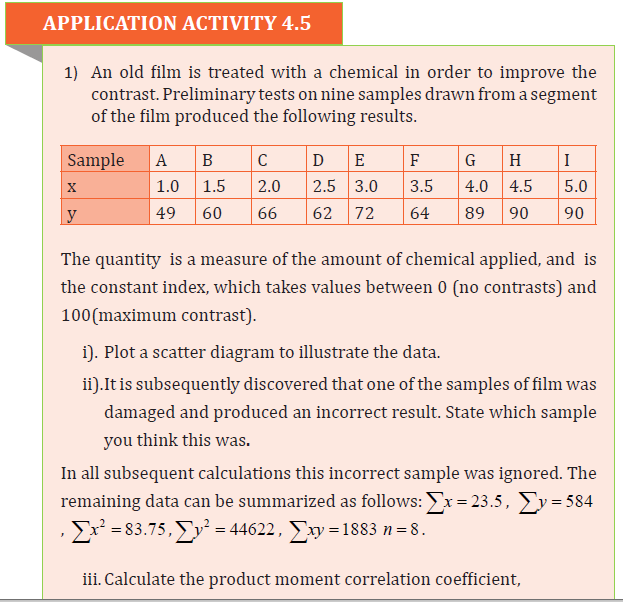
answer to part( iii) that and are linearly related.
v. The line of regression of on x has equation y = ax + b . Calculate the
value of a and b each correct to three significant figures.
vi. Use your regression line to estimate what the contrast index
corresponding to the damaged piece of film would have been if the
piece has been undamaged.
vii.State with a reason, whether it would be sensible to use your
regression equation to estimate the contrast index when the quantityof chemical applied to the film is zero.
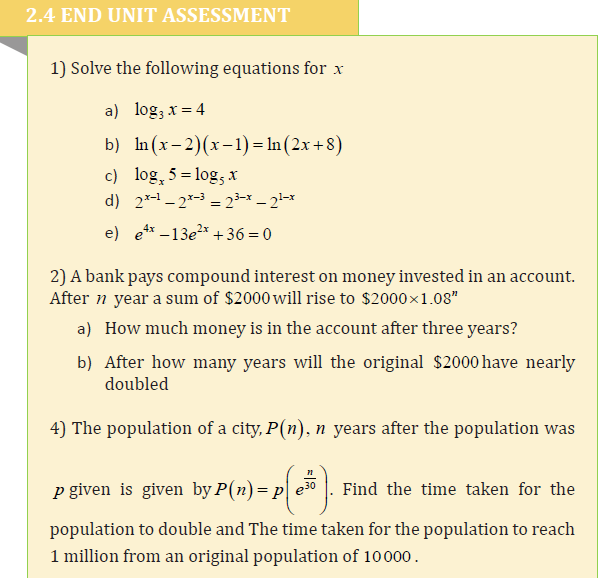
4.6 END UNIT ASSESSMENT
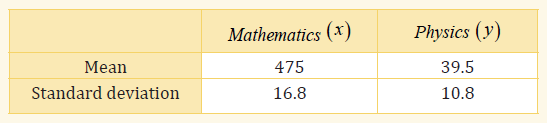
1) The following results were obtained from lineups in Mathematicsand Physics examinations:
4) The table below shows the marks awarded to six students in a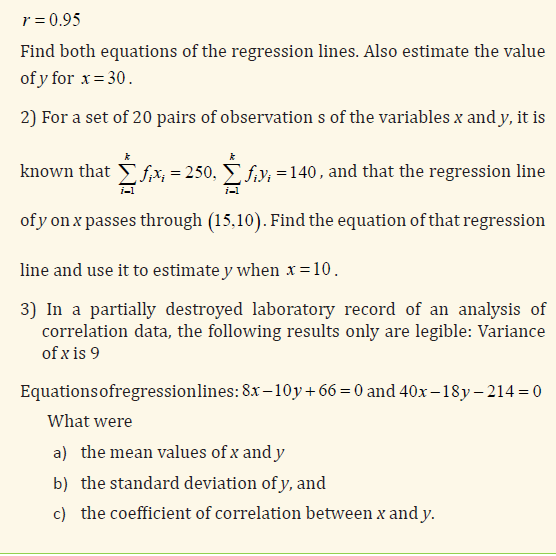
competition:
Calculate a coefficient of rank correlation.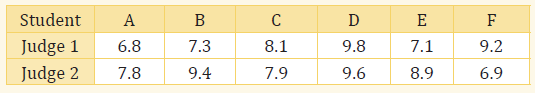
5) A company is to replace its fleet of cars. Eight possible models
are considered and the transport manager is asked to rank them,
from 1 to 8, in order of preference. A saleswoman is asked to use
each type of car for a week and grade them according to theirsuitability for the job (A-very suitable to E-unsuitable).
a. Calculate the Spearman’s coefficient of rank correlation between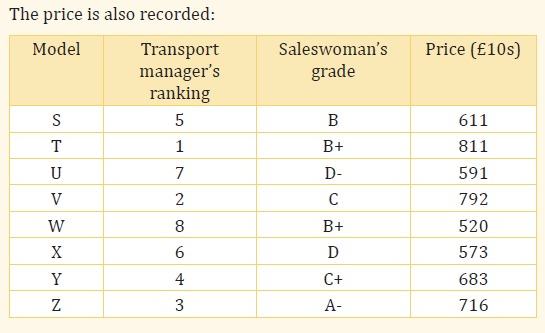
i. price and transport manager’s rankings,
ii. price and saleswoman’s grades.
b. Based on the result of a. state, giving a reason, whether it would
be necessary to use all three different methods of assessing the cars.
c. A new employee is asked to collect further data and to do some
calculations. He produces the following results:
The coefficient of correlationbetween
i. price and boot capacity is 1.2,
ii. maximum speed and fuel consumption in miles per
gallons is -0.7,
iii. price and engine capacity is -0.9
For each of his results say, giving a reason, whether you think
it is reasonable.
d. Suggest two sets of circumstances where Spearman’s coefficient
of rank correlation would be preferred to the Pearson’scoefficient of correlation as a measure of association.
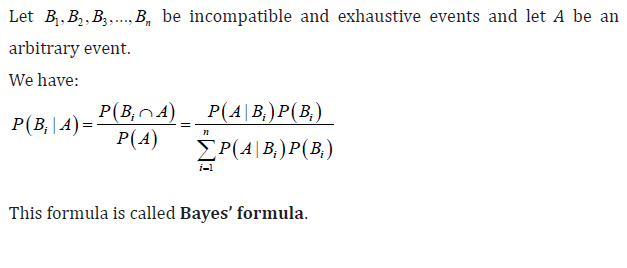
UNIT 5: CONDITIONAL PROBABILITY AND BAYES THEOREM
Key unit Competence: Apply rules of probability to solve problems relatedto dependent and independent events.
5.0 INTRODUCTORY ACTIVITY
1) Consider a machine which manufactures electronic components. These
must meet certain specification. The quality control departmentregularly
samples the components.
Suppose, on average, 92 out of 100 components meet the specification.
Imaginethata
Componentisselected at random and let A be the outcome that a component
meets the specification; let B be the outcome that a component does not
meet the specification.
a) Explain in your own words and determine the probability that a
components meet the specification.
b) Explain in your own words and determine the probability that a
component does not meet the specification.
2) A box contains 4 whitechalks and 3 black chalks. One chalk is drawn at
random; its color is noted but not replaced in the box.
a) What is the probability of selecting2 white chalks?b) Determine the probability of selecting 3 white and 2 black chalks.
Probability is a measure of the likelihood of the occurrence of a particularoutcome.
5.1Tree diagram
ACTIVITY 5.1
A box contains 4 blue pens and 6 black pens. One pen is drawn at
random, its color is noted and the pen is replaced in the box. A pen is
again drawn from the box and its color is noted.
1) For the 1st trial, what is the probability of choosing a blue pen
and probability of choosing a black pen?
2) For the 2nd trial, what is the probability of choosing a blue pen
and probability of choosing a black pen? Remember that after
the 1st trial the pen is replaced in the box.
3) In the following figure complete the missing colors andprobabilities
CONTENT SUMMARY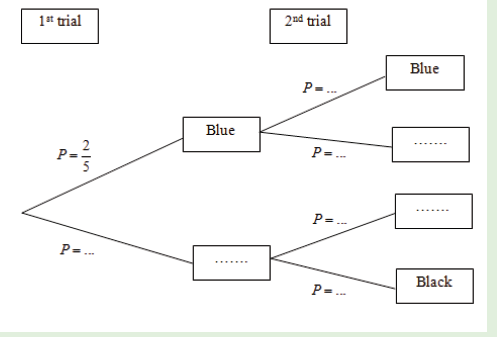
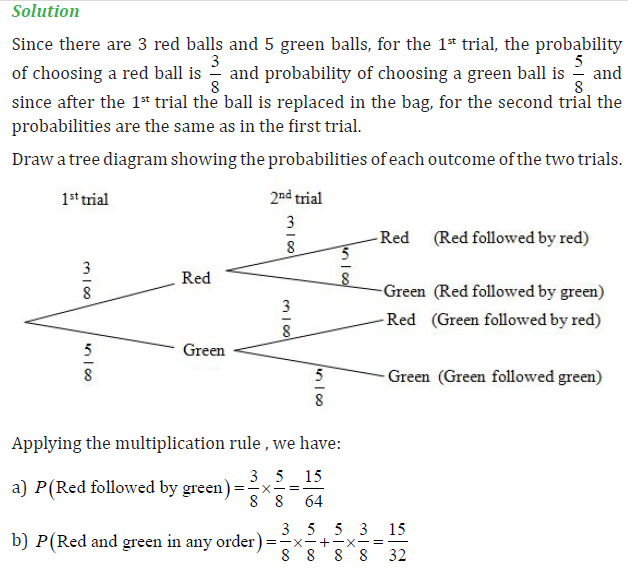
A tree diagram is one way of illustrating the probabilities of certain outcomes
occurring when two or more trials take place in succession by use of arrows in
the form of a tree and branches. A tree diagram has branches and sub-branches
which help us to see the sequence of events and all the possible outcomes ateach stage.
The outcome is written at the end of the branch and the fraction on the branch
gives the probability of the outcome occurring.
For each trial the number of branches is equal to the number of possible
outcomes of that trial.
Examples:
1) A bag contains 8 balls of which 3 are red and 5 are green. One ball is drawn at
random, its colour is noted and the ball replaced in the bag. A ball is again drawn
from the bag and its colour is noted. Find the probability that the 2 balls drawn
will be
a) red followed by green,
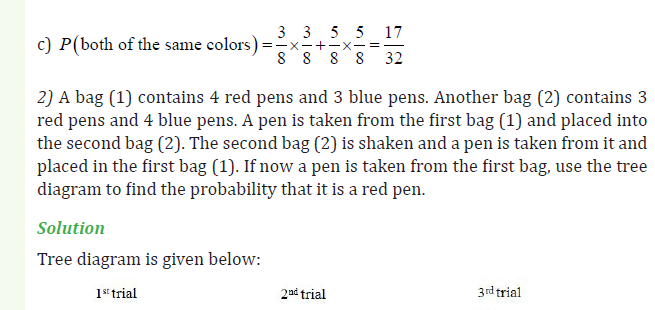
b) red and green in any order,c) of the same colour.
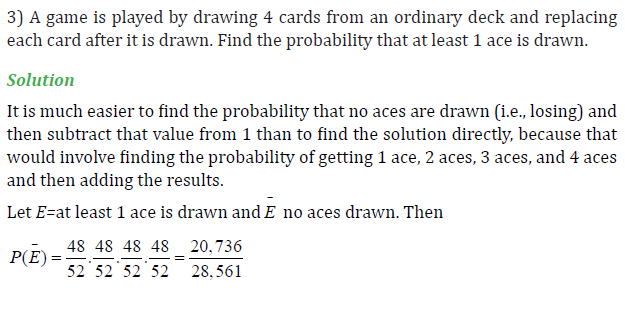
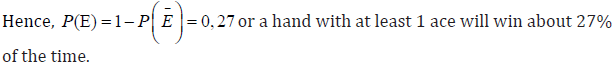
APPLICATION ACTIVITY 5.1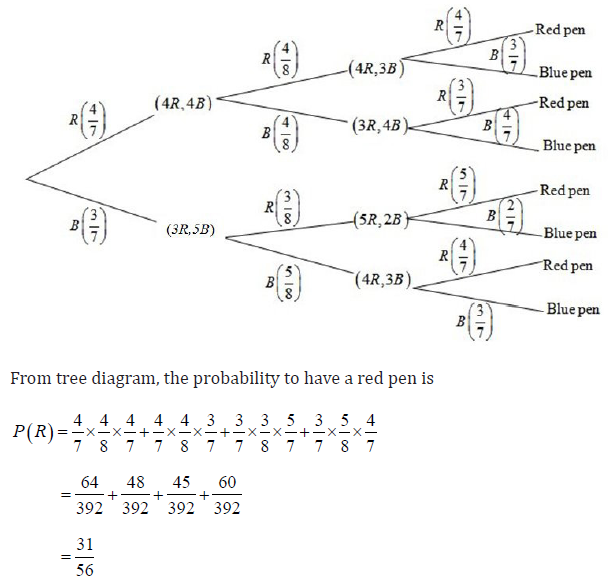
1. Calculate the probability of three coins landing on: Three heads.
2. A class consists of six girls and 10 boys. If a committee of three is
chosen at random, find the probability of:
a) Three boys being chosen.
b) Exactly two boys and a girl being chosen.
c) Exactly two girls and a boy being chosen.
d) Three girls being chosen.
3. A bag contains 7 discs, 2 of which are red and 5 are green. Two discs
are removed at random and their colors noted. The first disk is not
replaced before the second is selected. Find the probability that
the discs will be:
a) both red b) of different colors c) the same colors.
4. Three discs are chosen at random, and without replacement, from a
bag containing 3 red, 8 blue and 7 white discs. Find the probability
that the discs chosen will bea) all red b) all blue c) one of each color.
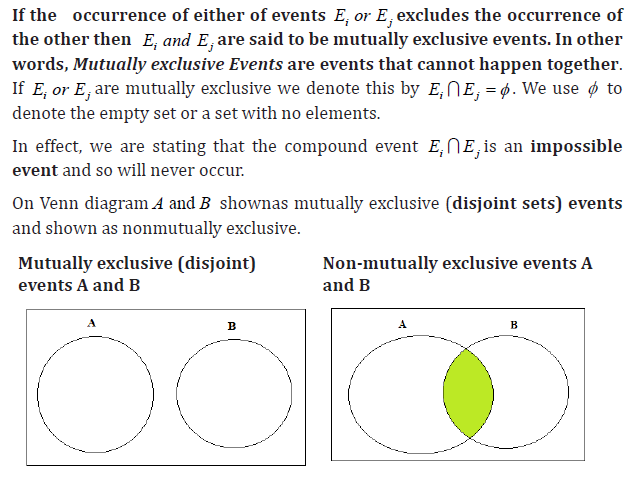
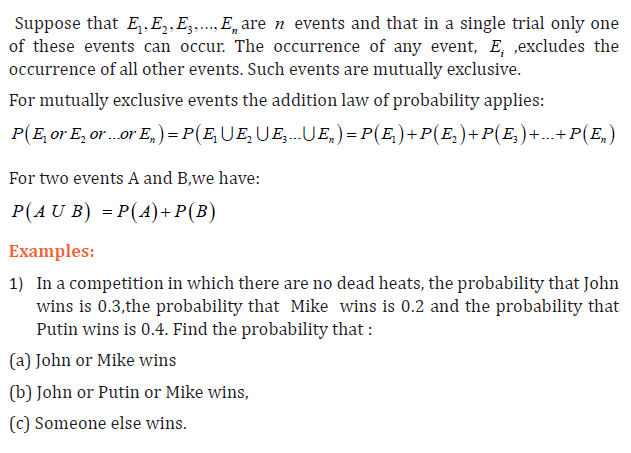
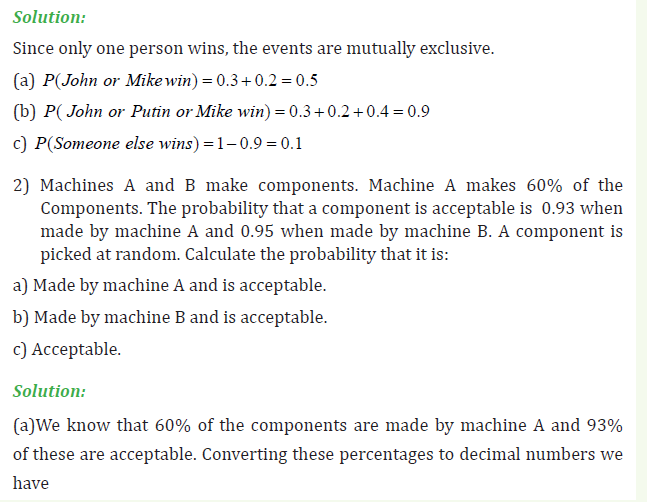
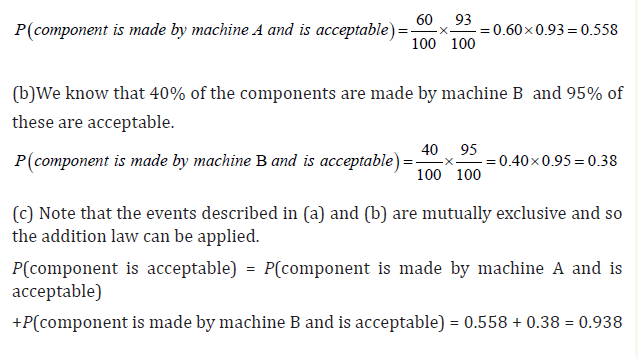
5.2The Addition law of probability
ACTIVITY 5.2
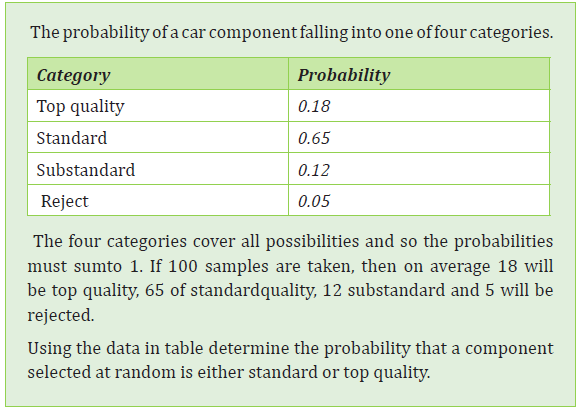
Consider a machine which manufactures car components. Suppose
each component falls into one of four categories:top quality,
standard, substandard, reject
After many samples have been taken and tested, it is found that
under certain specific conditions the probability that a componentfalls into a category is as shown in the following table.
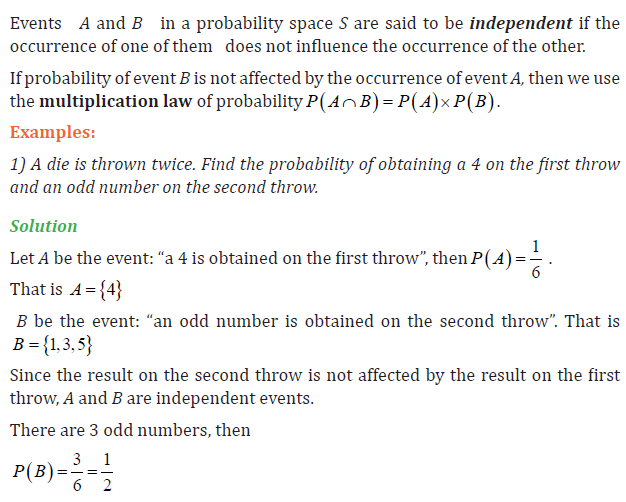
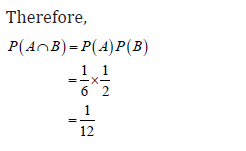
5.3 Independent events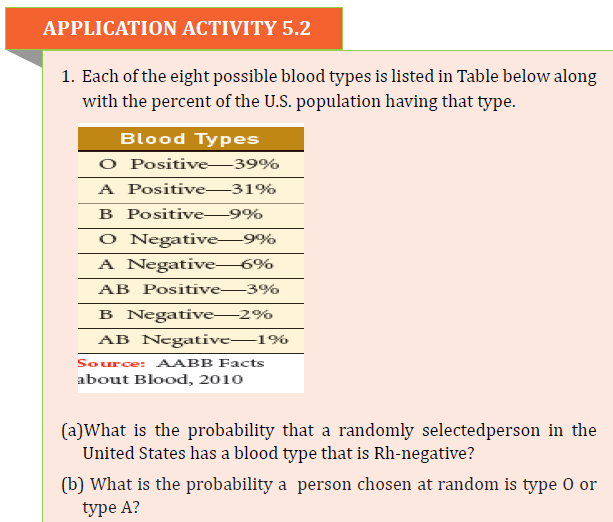
ACTIVITY 5.3
A box contains 3 red pens, 4 green pens and 5 blue pens. One pen is
taken from the box and then replaced. Another pen is taken from the
box. Let A be the event “the first pen is red” and B be the event the
second pen is blue.”
Is the occurrence of event B affected by the occurrence of event A?Explain.

5.4.Dependent events
ACTIVITY 5.4
Suppose that you have a deck of 52 cards. You can draw a card from
that deck , continue without replacing it, and then draw a second card .
a) What is the sample space for each event?
b) Suppose you select successively two cards, what is the probability
of selecting two red cards?
c) Explain if there is any relationship (Independence or dependence)
between those two events considering the sample space. Does the
selection of the first card affect the selection of the second card?
When the outcome or occurrence of the first event affects the outcome or
occurrence of the second event in such a way that the probability is changed,
the events are said to be dependent.
Examples:
1)Suppose a card is drawn from a deck and not replaced, and then the second
card is drawn. What is the probability of selecting an ace on the first card and aking on the second card?
Note that: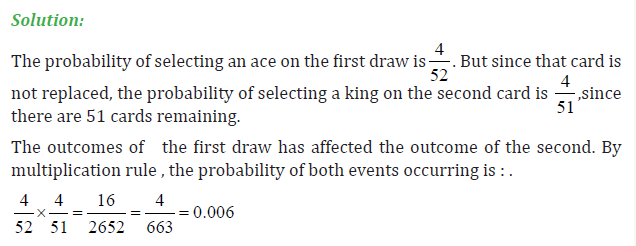
The event of getting a king on the second draw given that an ace was drawn the
first time is called a conditional probability.
APPLICATION ACTIVITY 5.4
The world wide Insurance Company found that 53% of the residents
of a city had home owner’s Insurance with its company of the clients,
27% also had automobile Insurance with the company. If a resident
is selected at random, find the probability that the resident has
both home owner’s and automobile Insurance with the world wideInsurance Company.
5.5 Conditional probability
ACTIVITY 5.5
A box contains 3 red pens, 4 green pens and 5 blue pens. One pen is
taken from the box and is not replaced. Another pen is taken from
the box. Let A be the event “the first pen is red” and B be the event
“the second pen is blue.”
Is the occurrence of event B affected by the occurrence of event A?Explain.
Examples: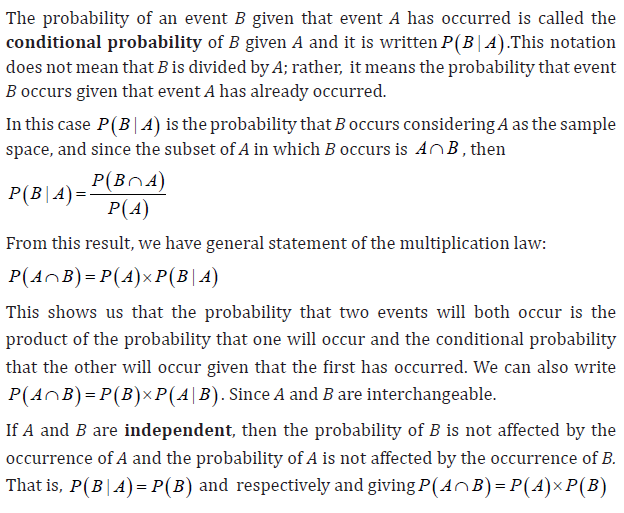
1) A die is tossed. Find the probability that the number obtained is a 4 giventhat the number is greater than 2.
2) At a middle school, 18% of all students play football and basketball, and 32%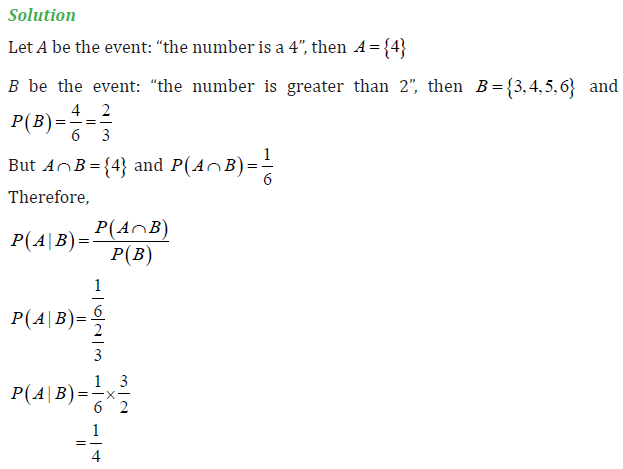
of all students play football. What is the probability that a student who playsfootball also plays basketball?
Notice: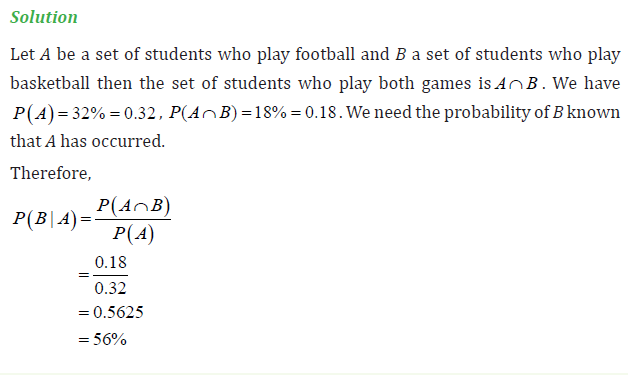
Contingency table
Contingency table (or Two-Way table) provides a different way of calculating
probabilities. The table helps in determining conditional probabilities quite
easily. The table displays sample values in relation to two different variables
that may be dependent or contingent on one another.
Below, the contingency table shows the favorite leisure activities for 50 adults,
20 men and 30 women. Because entries in the table are frequency counts, thetable is a frequency table.
Calculate the following probabilities using the table: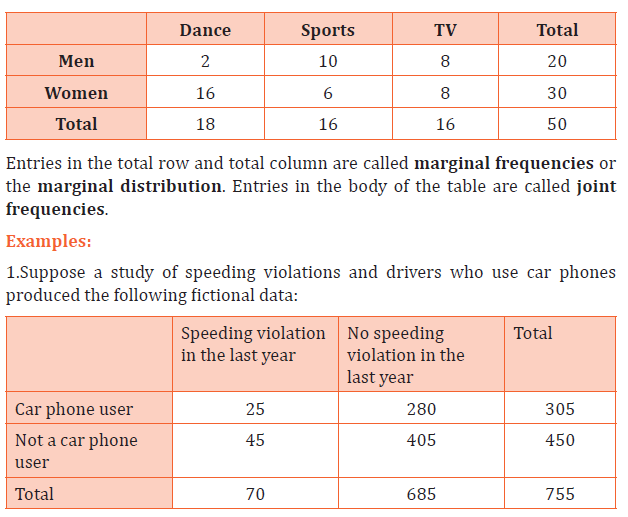
a) P(person is a car phone user)
b) P(person had no violation in the last year)
c) P(person had no violation in the last year AND was a car phone user)
d) P(person is a car phone user OR person had no violation in the last year)
e) P(person is a car phone user GIVEN person had a violation in the last year)
f) P(person had no violation last year GIVEN person was not a car phone user)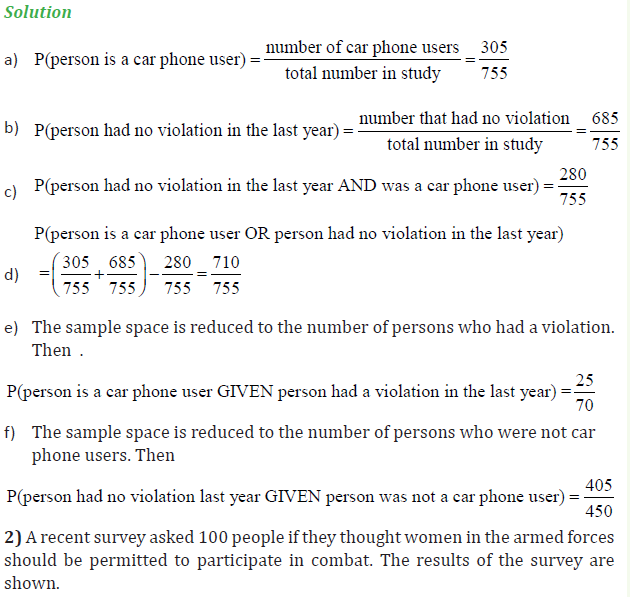
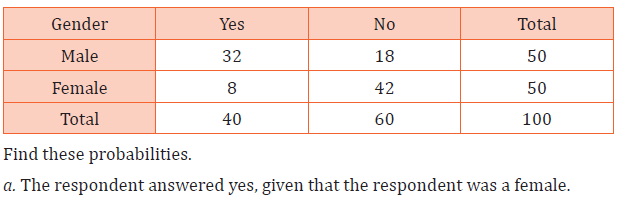
b. The respondent was a male, given that the respondent answered no.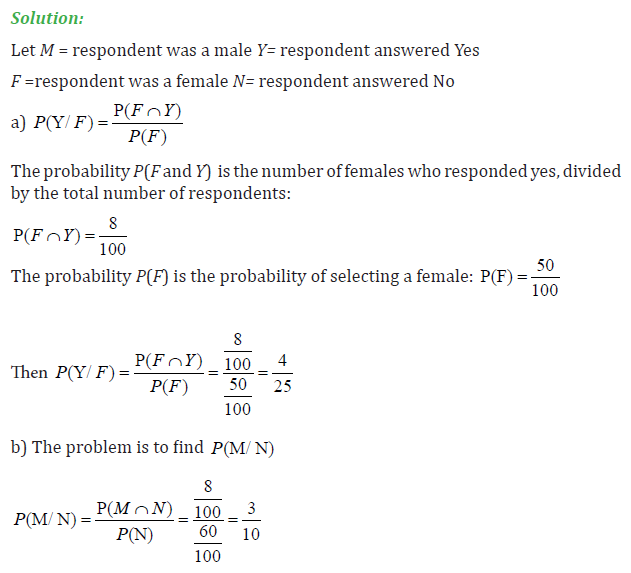
APPLICATION ACTIVITY 5.5
The world wide Insurance Company found that 53% of the residents
of a city had home owner’s Insurance with its company of the clients,
27% also had automobile Insurance with the company. If a resident
is selected at random, find the probability that the resident has
both home owner’s and automobile Insurance with the world wide
Insurance Company.
1. A jar contains black and white marbles. Two marbles are chosen without
replacement. The probability of selecting a black marble and then a white
marble is 0.34, and the probability of selecting a black marble on the first
draw is 0.47. What is the probability of selecting a white marble on the
second draw, given that the first marble drawn was black?
2. A bag contains five discs, three of which are red. A box is contains six discs,
four of which are red. A card is selected at random from a normal pack of
52 cards, if the card is a club a disc is removed from the bag and if the card
is not a club a disc is removed from the box. Find the probability that, if the
removed disc is red it came from the bag.
3. The probability that Gerald parks in a no-parking zone and gets a parking
ticket is 0.06, and the probability that Gerald cannot find a legal parking
space and has to park in the no-parking zone is 0.20. On Tuesday, Gerald
arrives at Headquarter office and has to park in a no-parking zone. Find theprobability that he will get a parking ticket.
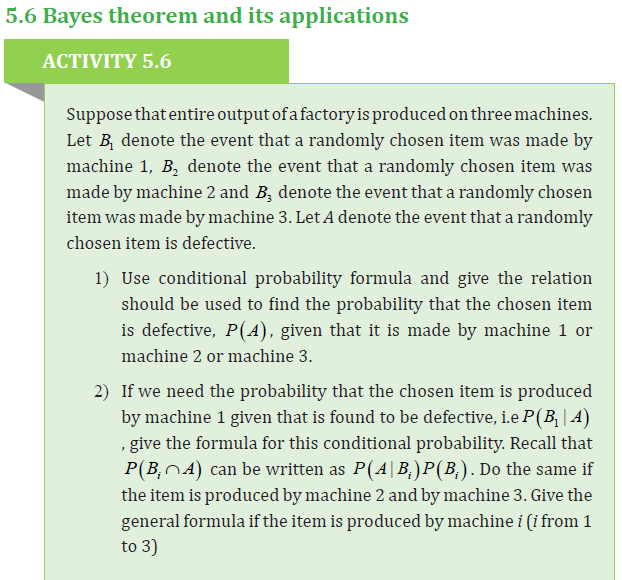
APPLICATION ACTIVITY 5.6 #
#
1. 20% of a company’s employees are engineers and 20% are
economists. 75% of the engineers and 50% of the economists hold
a managerial position, while only 20% of non-engineers and noneconomists
have a similar position. What is the probability that
an employee selected at random will be both an engineer and a
manager?
2. The probability of having an accident in a factory that triggers
an alarm is 0.1. The probability of its sounding after the event
of an incident is 0.97 and the probability of it sounding after no
incident has occurred is 0.02. In an event where the alarm has
been triggered, what is the probability that there has been noaccident?
5.7 END UNIT ASSESSMENT
1) The probability that it is Friday and that a student is absent is
0.03. Since there are 5 school days in a week, the probability that
it is Friday is 0.2. What is the probability that a student is absent
given that today is Friday?
2) Dr. Richard is conducting a survey of families with 3 children.
If a family is selected at random, what is the probability that
the family will have exactly 2 boys if the second child is a boy?
Assume that the probability of giving birth to a boy is equal to the
probability of giving birth to a girl.
3) A 12-sided die (dodecahedron) has the numerals 1 through 12 on
its faces. The die is rolled once, and the number on the top face is
recorded. What is the probability that the number is a multiple of
4 if it is known that it is even?
4) At Kennedy Middle School, the probability that a student takes
Technology and Spanish is 0.087. The probability that a student
takes Technology is 0.68. What is the probability that a student
takes Spanish given that the student is taking Technology?
5) A bag contains 2 red, 3 green and 2 blue balls. Two balls are drawn
at random. What is the probability that none of the balls drawnis blue?
6) In a certain college, 5% of the men and 1% of the women are taller
than 180 cm. Also, 60% of the students are women. If a student is
selected at random and found to be taller than 180 cm, what is theprobability that this student is a woman?
REFERENCES
1. J. Sadler, D. W. S. Thorning: Understanding Pure Mathematics, Oxford
University Press 1987.
2. Arthur Adam Freddy Goossens: Francis Lousberg. Mathématisons 65.
DeBoeck,3e edition 1991.
3. Charles D. Hodgman, M.S., Samuel M. Selby, Robert C.Weast. Standard
Mathematical Table. Chemical Rubber Publishing Company, Cleveland, Ohio
1959.
4. David Rayner, Higher GCSE Mathematics, Oxford University Press 2000
5. Direction des Progammes de l’Enseignement Secondaire. Géometrie de
l’Espace 1er Fascule. Kigali, October1988
6. Direction des Progammes de l’Enseignement Secondaire. Géometrie de
l’Espace 2ème Fascule. Kigali, October1988
7. Frank Ebos, Dennis Hamaguchi, Barbana Morrison & John Klassen,
Mathematics Principles & Process, Nelson Canada A Division of International
Thomson Limited 1990
8. George B. Thomas, Maurice D. Weir & Joel R. Hass, Thomas’ Calculus Twelfth
Edition, Pearson Education, Inc. 2010
9. Geoff Mannall & Michael Kenwood, Pure Mathematics 2, Heinemann
Educational Publishers 1995
10. H.K. DASS...Engineering Mathematics. New Delhi, S. CHAND&COMPANY
LTD, thirteenth revised edition 2007.
11. Hubert Carnec, Genevieve Haye, Monique Nouet, ReneSeroux, Jacqueline
Venard. Mathématiques TS Enseignement obligatoire. Bordas Paris 1994.
12. James T. McClave, P.George Benson. Statistics for Business and Economics.
USA, Dellen Publishing Company, a division of Macmillan, Inc 1988.
13. J CRAWSHAW, J CHAMBERS: A concise course in A-Level statistics with
worked examples, Stanley Thornes (Publishers) LTD, 1984.
14. Jean Paul Beltramonde, VincentBrun, ClaudeFelloneau, LydiaMisset, Claude
Talamoni. Declic 1re S Mathématiques. Hachette-education, Paris 2005.
15. JF Talber & HH Heing, Additional Mathematics 6th Edition Pure & Applied,
Pearson Education South Asia Pte Ltd 1995
16. J.K. Backhouse, SPTHouldsworth B.E.D. Copper and P.J.F. Horril. Pure
Mathematics 2. Longman, third edition 1985, fifteenth impression 1998.
17. Mukasonga Solange. Mathématiques 12, AnalyseNumérique. KIE, Kigali
2006.
18. N. PISKOUNOV, Calcul Différential et Integral tom II 9ème édition. Editions
MIR. Moscou, 1980.
19. Paule Faure- Benjamin Bouchon, Mathématiques Terminales F. Editions
Nathan, Paris 1992.
20. Peter Smythe: Mathematics HL & SL with HL options, Revised Edition,
Mathematics Publishing Pty. Limited, 2005.
21. Robert A. Adms & Christopher Essex, Calculus A complete course Seventh
Edition, Pearson Canada Inc., Toronto, Ontario 2010
22. Seymour Lipschutz. Schaum’s outline of Theory and Problems of Finite
Mathematics. New York, Schaum Publisher, 1966
23. Seymour Lipschutz. Schaum’s outline of Theory and Problems of linear
algebra. McGraw-Hill 1968.
24. Shampiyona Aimable : Mathématiques 6. Kigali, Juin 2005.
25. Yves Noirot, Jean–Paul Parisot, Nathalie Brouillet. Cours de Physique
Mathématiques pour la Physique. Paris, DUNOD, 1997.
26. Swokowski, E.W. (1994). Pre-calculus: Functions and graphs, Seventh
edition. PWS Publishing Company, USA.
27. Allan G. B. (2007). Elementary statistics: a step by step approach, seventh
edition, Von Hoffmann Press, New York.
28. David R. (2000). Higher GCSE Mathematics, revision and Practice. Oxford
University Press, UK.
29. Ngezahayo E.(2016). Subsidiary Mathematics for Rwanda secondary
Schools, Learners’ book 4, Fountain publishers, Kigali.
30. REB. (2015). Subsidiary Mathematics Syllabus, MINEDUC, Kigali, Rwanda.
31. REB. (2019). Mathematics Syllabus for TTC-Option of LE, MINEDUC, Kigali
Rwanda.
32. Peter S. (2005). Mathematics HL&SL with HL options, Revised edition.
Mathematics Publishing PTY. Limited.
33. Elliot M. (1998). Schaum’s outline series of Calculus. MCGraw-Hill
Companies, Inc. USA.
34. Frank E. et All. (1990). Mathematics. Nelson Canada, Scarborough, Ontario
(Canada)
35. Gilbert J.C. et all. (2006). Glencoe Advanced mathematical concepts,
MCGraw-Hill Companies, Inc. USA.
36. Robert A. A. (2006). Calculus, a complete course, sixth edition. Pearson
Education Canada, Toronto, Ontario (Canada).
37. Sadler A. J & Thorning D.W. (1997). Understanding Pure mathematics,
Oxford university press, UK.
38. J. CRAWSHAW and J. CHAMBERS 2001. A concise course in Advanced Level
Statistics with worked examples 4th Edition. Nelson Thornes Ltd, UK.
39. Ron Larson and David C (2009). Falvo. Brief Calculus, An applied approach.
Houghton Mifflin Company.
40. Michael Sullivan, 2012. Algebra and Trigonometry 9th Edition. Pearson Education, Inc
41. Swokowski & Cole. (1992). Preaclaculus, Functions and Graphs. Seventh edition.
42. Glencoe. (2006). Advanced mathematical concepts, Precalculus with Applications.
43. Seymour Lipschutz, PhD. & Marc Lipson, PhD. (2007). Discrete mathematics.3rd edition.
44. K.A. Stroud. (2001). Engineering mathematics. 5th Edition. Industrial Press,Inc, New York
45. John bird. (2005). Basic engineering mathematics. 4th Edition. LinacreHouse, Jordan Hill, Oxford OX2 8DP