General
- Maths S2 SB File Uploaded 24/01/22, 15:45
- S2 Maths TG File Uploaded 3/08/22, 14:43
UNIT11: TREE AND VENN DIAGRAMS AND SAMPLE SPACE
Key unit competence
By the end of the unit, I will be able to determine probabilities and assess likelihood by using tree and Venn diagrams
Unit outline
• Tree diagrams and total number of outcomes
• Determining probability using tree and Venn diagrams
• Mutually exclusive events
• Independent event
11.1 Introduction
In Book one, you were introduced to probability. Let us remind ourselves some of the concepts that were learnt which we will find useful as we progress in this unit
Activity 11.1
1. Remind yourself what probability and how it is determined numerically?
2. Suppose S1 class has 22 boys and 18 girls. Discuss with your classmate and determine the probability that a student picked at random to rub the chalk board is a
(a) boy
(b) girl
We learnt that probability is the likelihood of a particular event happening. We use numerical values to express the probability of an event (A) happening.

The favourable outcomes are the different ways in which an event A can take place, while the number of all possible outcomes is the sample space
is the sample space. The total number of all possible outcomes can never be less than the favourable outcomes. This explains why probability of any event can never be greater than one. For instance let us define n(A) = number of students who like cycling in a class and as the total number of students who are in class (including those who don’t like cycling).

Example 11.1
Consider a class of 40 students where 20 students don’t like pepper. Find the probability that a student selected at random likes pepper.
Solution
Define an event that a student does not like pepper
Favourable outcomes (number of events)
n(x) = 20
The sample space (total number of trials)
n(S) = 40
So probability that a student selected at random doesn’t like pepper is

Exercise 11.1
1. Numbers 1 to 20 are each written on a card. The 20 cards are mixed together. One card is chosen at random from the pack. Find the probability that the number on the card is;
(a) Even number
(b) A factor of 24
(c) Prime number.
2. A black die and a white die are thrown at the same time. Display all the possible outcomes. Find the probability of obtaining:
(a) A total of 5,
(b) A total of 11,
(c) A ‘two’ on the black die and a ‘six’ on the white die.
3. A fair coin is tossed and a fair die is rolled. Find the probability of obtaining a ‘head’ and a ‘six’.
4. A single 6-sided die is rolled. What is the probability of each outcome? What is the probability of:
(a) Rolling an even number?
(b) Rolling an odd number?
5. The probability that it rains on Christmas day in town X is 0.3.What is the probability that it will not rain on Christmas day in that town?
11.2 Tree diagrams and total number outcomes
Activity 11.2
1. Determine all the possible outcomes of the following events without using any diagram
(a) A guest at ceremony is to choose a combination of one food type and a drink. The food types available are chicken, fish and beef. The drinks available are mango juice, orange juice and Soda.
(b) A choice of combination either a green or blue shirt with either a blue, black or khaki trouser.
2. Using any suitable diagram of your choice, determine all the possible outcomes for the events in 1 above.
3. Which of the above two ways is easier to use?
From Activity 11.2, we can see that we have a sequence of events leading to different possible outcomes. Such sequences are not easy to determine without a diagram. One standard diagram used to determine all the possible outcomes is a tree diagram.
A tree diagram is simply a way of representing a sequence of events. Tree diagrams are particularly useful in probability since they record all possible outcomes in a clear and uncomplicated manner. It has branches and sub-branches which help us to see the sequence of events and all the possible outcomes at each stage. Let us demonstrate this using some examples
Example 11.2
Using a tree diagram, determine all the possible outcomes when a coin is tossed once?
Solution
The tree diagram in Fig. 11.1 shows the sequence of events.

We obtain 2 outcomes from tossing a coin once i.e. head (H) and tail (T)
Example 11.3
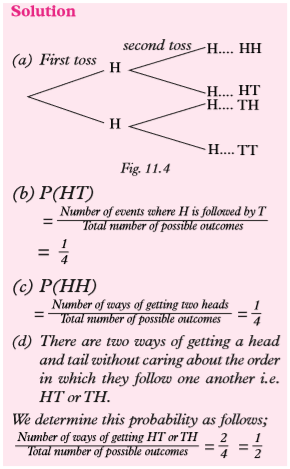
Using a tree diagram, determine all the possible outcomes that can be obtained when a coin is tossed twice.
Solution
In the first toss, we get either a head (H) or a tail (T). On getting a H in the first toss, we can get a H or T in the second toss. Likewise, after getting a T in the first toss, we can get a H or T in the second toss. This is well illustrated using the tree diagram in

Therefore we have 4 possible outcomes i.e. {HH, HT, TH, TT}
Example 11.4
Using a tree diagram, determine all possible combinations of outcomes when a coin is tossed once followed by a die tossed once.

Fig 11.3 The possible outcomes are (H1), (H2), (H3), (H4), (H5), (H6), (T1), (T2), (T3), (T4), (T5), (T6). We obtain 12 possible number of outcomes.
NOTE: Tossing one coin n times is the same as tossing n coins at once. For example the outcomes for tossing 3 coins at once is the same as the number of outcomes for tossing one coin three times
BEWARE: HIV and AIDS can spread from infected persons to others in a chain similar to a tree diagram. This is because one person can infect many people who in turn infect others and so on. ABSTAIN and be safe.
Exercise 11.2
1. A bag contains 3 yellow balls and 4 pink balls. Uwase picked two balls one after the other. With the aid of a tree diagram show all the possible outcomes. How many outcomes are there
2. A bag contains 6 yellow balls and 4 pink balls. Higiro picked three balls one after the other. Draw tree diagram shows all the possible outcomes. How many outcomes are there?
3. A blue, red or green cube is selected and a coin is tossed. Draw a tree diagram which shows the possible outcomes. How many outcomes are there?
4. Two Dice are tossed simultaneously. Draw a tree diagram that shows the sum of scores of the possible outcomes. How many outcomes are there?
5. A coin is tossed and a die is rolled. Use a tree diagram to show all the possible outcomes of the experiment.
6. Three coins are tossed simultaneously. Represent the scores on a tree diagram and write down the total outcomes.
7. A coin is tossed 3 times and outcomes are recorded.
(a) How many possible outcomes are there?
(b) How many outcomes are there if the coin is tossed 4 times, 5 times and n times?
8. Three bulbs are tested. A bulb is labeled “G” if good and “D” if defective. Draw a tree diagram to show possible outcomes. How many possible outcomes are there?
9. Kwizera is not having much luck lately. Her car will only start 80% of the time and her motorbike will only start 60% of the time. Draw a tree diagram to illustrate the situation.
10. A bag contains Blue balls, white balls and Red balls. Two balls are picked at random one after the other. Draw a tree diagram showing the outcomes
11.3 Determining probability by using Tree and Venn diagrams
11.3.1 Use of Tree diagrams to determine probability
Activity 11.3
1. In pairs: In a bag containing 3 oranges, 2 mangoes and 4 apples, two of the fruits are picked at random one after the other with replacement. Determine the probability of getting:
(a) An orange followed by a mango
(b) Two oranges
(c) A mango and an apple irrespective of the order.
We can see that once we have the total number of outcomes, it becomes easier to determine the probabilities from tree diagrams.
Example 11.5
A coin is tossed twice.
(a) Represent the outcomes on a tree diagram.
(b) Determine the following probabilities.
(i) Getting H followed by T
(ii) Getting two heads
(iii) Getting head and tail irrespective of order.
Example 11.6
Mutoni spins 2 spinners; one of which is coloured red, yellow and blue, and the other is coloured green, white and purple (Fig 11.5)

(a) Draw a tree diagram for the experiment.
(b) What is the probability that the spinners stop at “B” and “G”?
(c) Find the probability that the spinners do not stop at “B” and “G”.
(d) What is the probability that the first spinner does not stop at “R”?

Example 11.7
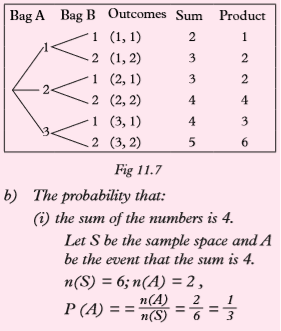
Bag A contains 3 balls numbered 1, 2 and 3. Bag B contains 2 balls numbered 1 and 2. One ball is removed at random from each box.
(a) Draw a tree diagram to list all the possible outcomes.
(b) Find the probability that:
(i) The sum of the numbers is 4
(ii) The sum of the two numbers is even.
(iii) The product of the two numbers is at least 5.
(iv) The sum is equal to the product.
Solution
(a) Fig 11.7 shows the tree diagram for all possible outcomes.

Exercise 11.3
1. A bag contains 4 cards numbered 2, 4, 6, 9. A second bag contains 3 cards numbered 2, 3, and 6. One card is drawn at random from each bag.
(a) Draw a tree diagram for the experiment.
(b) With the help of the tree diagram, calculate the probability that the two numbers obtained: (i) Have different values.
(ii) Are both even.
(iii) Are both prime.
(iv) Have a sum greater than 5. (v) Have a product greater than 16.
2. A hat contains 3 red, 4 blue and 5 green tickets. If one ticket is chosen at random, what is the probability that it is;
(i) Red
(ii) Blue
(iii) Green
3. A bag contains 3 blue and 2 red marbles. Three marbles are drawn at random one after the other. Find the probability that;
i) Atleast two red marbles are obtained
ii) All are blue.
4. A spinner is divided into four equal parts colored red, yellow, green and blue. When the spinner is spun, what is the probability that it lands on:
i) Red
ii) Green
5. A spinner has three equal parts numbered 1, 2 and 3. When this spinner is spun twice;
(i) Draw a tree diagram to show the results
(ii) What is the probability of obtaining a total of 4?
(iii) What is the probability of obtaining atleast one 3.
6. When two children are born, the sample space for the order of birth is S={bb (boy followed by boy), bg (boy followed by a girl), gb (girl followed by a boy), gg (girl followed by a girl)}.
a) Draw a tree diagram for the child births
b) Find the following probabilities
i) Atleast one boy is produced
ii) Atleast one girl is produced
iii) Atmost one boy is produced.
7. Illustrate on tree diagrams the sample spaces for the following.
a) Tossing a 5 francs coin and 10 francs coin simultaneously twice.
b) Tossing a coin once and twirling a triangular spinner whose sides are labelled A, B and C
c) Twirling two equilateral spinners whose sides are labelled 1, 2, 3 and X, Y and Z
d) Drawing two tickets from a hat containing a large number of tickets of Pink, blue, white and Green.
11.3.2 Determining Probability Using Venn diagrams
Activity 11.4
Determine the chances of the following:
1. A survey involving 150 Rwandan people about which game(s) they like showed that 83 like football, 58 like the volleyball. 36 like neither of those two games. What is theprobability that a person selected at random likes both games?
2. A survey involving 50 people was carried out about which food they like among banana, sweet potatoes, and beans. We found that 15 people like banana, 30 people like sweet potatoes, 19 people like beans, 8 people like banana and sweet potatoes, 12 like banana and beans, 7 people like sweet potatoes and beans. 5 people like all the three types of food. What is the chance that a person selected at random do not eat any of the foods mentioned?
3. How easy was it to determine probabilities in 1 and 2? How could it have been done easily? Discuss.
We can clearly see that without a Venn diagram, some probability situations become somehow difficult to analyse.
A Venn diagram refers to representing mathematical or logical sets pictorially as circles or closed curves within an enclosing rectangle (the universal set), common elements of the sets represented by intersections of the circles.
When you have data and you are to use the Venn diagram to solve the problem, always remember the following tips.
(a) Always start with the most specific information you have (basic regions).
(b) If you can’t use a piece of information yet, pass over it and try again later.
(c) As you interpret the information, remember:
(i) And implies intersection
(ii) Or implies Union
(iii) Not implies complement.
Example 11.8
A survey involving 120 people about their preferred breakfast showed that; 55 eat eggs for breakfast. 40 drink juice for breakfast. 25 eat both eggs and drink juice for breakfast.
(a) Represent the information on a Venn diagram.
(b) Calculate the following probabilities.
(i) A person selected at random takes only one type for breakfast.
(ii) A person selected at random takes neither eggs nor juice for breakfas
Solution
Let A= Eggs those who eat eggs only, B = Juice those who take juice only and z represent those who did not take any.

Here, we can now solve for the number of people who didn’t take any for breakfast
x = 55 – 25=30
So 30 people took Eggs only Also,
y = 40 – 25 = 15
So, 15 people took Juice only.
Hence 30 + 25 + 15 + z = 120
Z = 120 – (30+15+25)
Z = 120 – 70
Z = 50
The number of people who did not take anything for breakfast is 50.

Example 11.9
In a survey of 150 Rwandan people about which newspapers they read, 83 read the New Times, 58 read the Imvaho Nshya. 36 read neither of those two papers. Represent the data on the Venn diagram and find the chance that a person selected at random reads both papers.
Solution
Here we can let N= New Times,
M= Imvaho Nshya,
x= New Times only,
z= both New Times and
Imvaho Nshya,
y= Imvaho Nshyaonly

We can therefore calculate the value of z which is required in the question
83 = x + z, so z = 83 – x 58 = y + z, so z = 58 – y
Hence 83 – x = 58 – y , which gives x – y = 25 ………………(1)
Also, x + z + y + 36 = 150

Example 11.10
In a survey of 50 people about which Hotels they patronize among Hilltop, Serena, and Lemigo. We find that 15 people eat at Hilltop, 30 people eat at Serena, 19 people eat at Lemigo 8 people eat at Hilltop and Serena, 12 people eat at Hilltop and Lemigo,7 people eat at Serena and Lemigo. 5 people eat at Hilltop, Serena, and Lemigo.
(a) What is the chance that a person selected at random eats only at Hilltop?
(b) How many eat at Hilltop and Serena, but not at Lemigo?
(c) How many people don’t eat at any of these three hotels?
(d) What is the probability that a person selected at random do not eat at any of the hotels mentioned
Solution
This problem involves a Venn diagram of 3 circles.
Let H represent Hilltop, S represent Serena and L represent Lemigo
Let x represent those who eat at Hilltop only
Let y represent those who eat at Lemigo only, z represent those who eat at Serena only and w represent those who don’t eat at any Hotel.


Exercise 11.4
1.We survey 600 adults about which modes of transportation they have used in the past year. We find that: 100 traveled by plane but not train 150 by train but not by plane 120 by bus but not by train or plane 100 by both bus and plane 40 by all three 440 by bus or train
(a) Represent the data on the Venn diagram
(b) Find the probability that a person selected at random travels by only one mode.
2. A group of 50 people were asked about the three newspapers “IMVAHO NSHYA”, “UMUSESO”, “THE NEW TIMES” they read. The results showed that 25 read IMVAHO NSHYA, 16 read UMUSESO, 14 read NEW TIMES, 5 read both IMVAHO NSHYA and UMUSESO, 4 read both UMUSESO and NEW TIMES, 6 read both IMVAHO NSHYA and NEW TIMES, 2 read all the three papers
(a) Represent the data on the Venn diagram.
(b) Find the probability that a person chosen at random from the group reads;
(i) At least one of the three papers
(ii) Only one of the three papers
(iii) Only IMVAHO NSHYA
3. A survey was carried out in a shop to find out how many customers bought bread, or milk or both or neither. Out of a total of 79 customers for the day, 52 bought milk, 32 bought bread and 15 bought neither. Draw a Venn diagram to show this information and use it to find the probability that a person chosen at random
(a) Bought bread and milk
(b) Bought bread only
(c) Bought milk only
4. In a survey of course preferences of 110 students in a senior six class, the following facts were discovered. 21 students like engineering only, 63 like engineering, 55 like medicine and 34 like none of the two courses.
(a) Draw a Venn diagram to show this information.
(b) What is the probability that a student selected at random likes Engineering or Medicine?
(c) What is the probability that a student selected at random likes Engineering and Medicine?
(d) What is the probability that a student selected at random likes Medicine only?
5. In a cleanup exercise carried out in Karongi town, a group of students were assigned duties as follows; all of them were to collect waste paper. 15 were to sweep the streets but not plant trees along the streets, 12 were to plant trees along the streets 5 of them were to plant trees and sweep the streets.
Draw a Venn diagram to show this information and use it to calculate the number of children in each group. Find the probability that a student selected at random does not do any of the duties assigned.
DID YOU KNOW
It is important to maintain the environment by keeping our surrounding clean. Planting trees around us helps to keep the environment conducive by providing fresh air.
11.4 Mutually exclusive events
Activity 11.5
In Virunga transport company in Rwanda, there are 50 buses. 20 of them are Isuzu model and 15 of them are Coaster model. If a bus is picked at random,
(a) Can the bus be both of Isuzu and Coaster model?
(b) What is the probability that it is of Isuzu model?
c) What is the probability that it is of Coaster model?
d) What is the probability that it is of Isuzu or Coaster model?
e) Discuss with your classmate the easiest way of determining the probability in (d).
From activity 11.5, we can clearly see that the occurrence of one event excludes the occurrence of the other. For example when a bus is of Isuzu model, it cannot be of Coaster model.
Similarly, when a coin is tossed once, the result will either be a head or a tail. If a head occurs, a tail cannot occur. Such events in which occurrence of one excludes the occurrence of the other are called mutually exclusive events. If A and B are two mutually exclusive events, then P (A or B) = P (A) + P (B). This is the addition law of probabilit

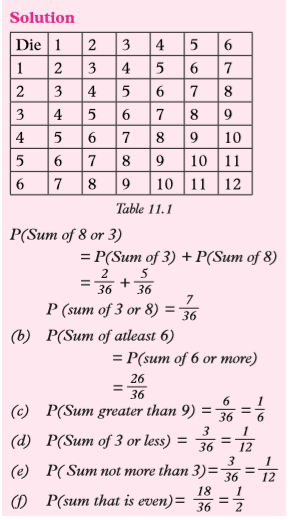
Example 11.13
Two dice are thrown together. Find the probability of getting a sum:
(a) Of 8 or 3.
(c) Of at least 6.
(d) Greater than 9.
(e) Of 3 or less.
(f) Not more than 3.
(g) That is even.
Exercise 11.5
1. A group of tourists arrived at Kigali International Airport. 5 were English, 4 were French, 8 were American and 3 were German. One was chosen at random to be their leader. What is the probability that the one chosen was
(a) English
(b) American
(c) German
(d) French or German
(e) English or French
(f) Not English?
2. In a bag, there are some blue pens, some red pens and some of other colours. The probability of taking a blue pen at random is 1/7. If the probability of taking a blue pen or a red pen at random is 8/21, what is the probability of taking
(a) a red pen?
(b) a pen which is neither red nor blue?
3. In a factory, machines A, B and C produce identical balls. The probability that a ball was produced by machine A or B is 11/15. The probability that a ball was produced by machine B or C is 2/3. If the probability that a ball was produced by machine A is 1/3, what is the probability that a ball was produced by machine C?
4. A card is chosen at random from an ordinary pack of playing cards. What is the probability that it is
(a) either hearts or spades?
(b) either a club or a jack of spades?
5. When playing netball, the probability that only Ann scores is 1/4, the probability that only Betty scores is 1/8 and the probability that only Carol scores is 1/12. What is the probability that none of them scores?
6. Two dice are tossed. Find the probability that
(a) an odd number shows on the second die,
(b) a two or a five shows on the first die,
(c) a two or a five shows on the first die and an odd number on the second die.What connection is there between the answers to parts (a), (b) and (c)?
7. In a certain school of 1 000 pupils, 20 are colour blind and one hundred are overweight. A pupil is chosen at random. What is the probability that the pupil is
(a) colour blind,
(b) overweight
11.5 Independent Events
Activity 11.6
Work in pairs.
A coin and a die are tossed at the same time.
(a) Can we get a head and a six at the same time?
(b) What is the probability of getting a head from the coin?
(c) What is the probability of getting a six from the die?
(d) What is the probability of getting both a head and a six (H6)?
(e) Discuss with your partner the easiest way of determining the probability in (d).
From activity 11.6, we can clearly see that the occurrence of an event in tossing a coin does not affect the occurrence of an event in tossing a die. In otherwords, both events can take place at the same time.
Similarly, when a coin is tossed twice, getting a head or a tail in the first toss does not affect getting a head or a tail in the second toss. Such events in which two or more events can take place at the same time or one after the other are called Independent events.
If A and B are two independent events, the probability of them occurring.’ together is the product of their individual probabilities.
That is; P (A and B) = P (A) x P (B).
If A, B and C are three events,
then P (A and B and C) =P (A) ×P (B) ×P(C) This is known as the multiplication law of probability.

Note
All the events on the same branch in a tree diagram are independent. Hence we cannot add the probabilities of events on the same branch. However, the combined events of one branch is mutually exclusive to the combined event any other branch. Hence we can add the probability of the combined event of one branch to that of the combined event of another branch.
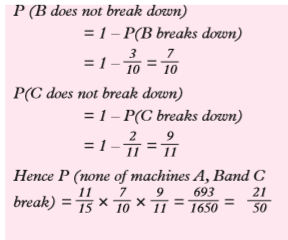
Example 11.15
Three different machines in a factory have different probabilities of breaking down during a shift as shown in table below:

Find:
a) The probability that all machines will break down during one shift.
b) The probability that none of the machines will break down in a particular shift.

Example 11.16
A boy throws a fair coin and a regular tetrahedron with its four faces marked 1, 2, 3 and 4. Find the probability that he gets a 3 on the tetrahedron and a head on the coin.

Example 11.17
A bag A contains 5 red balls and 3 green balls. The second bag B contains 4 red and 6 green balls. A bag is selected at random and two balls are picked from it one after the other without replacement.
a) Represent the information on the Tree diagram.
b) Find the probability of the following events;
i) Both balls are red from bag A.
ii) Both balls are of different colours from different bags.


Exercise 11.6
1. A bag contains 7 black and 3 white balls. If two balls are drawn from the bag, what is the probability that
(a) one is black and one is white?
(b) they are of the same colour?
2. Three pupils were asked to solve a problem. Their chances of solving the problem independently were 1/2,
1/3 and 1/4.(a) What is the chance that all of them solved the problem independently?
(b) What is the probability that only two solved the problem independently?
3. Two dice are tossed giving the events: A: the first die shows a six, B: the second die shows a three, C: the sum of the numbers on the two dice is 7. Check these events for independence.
4. A class has 18 boys and 12 girls. Three pupils are chosen at random from the class. What is the probability that (a) they are all boys? (b) one is a boy and the others are girls?
5. In an office there are 3 men and 7 women. Three people are chosen at random. What is the probability that two are women and one is a man?
6. Events A and B are such that P(A) = 1/5 and P(A and B) = 2/15. What is P(B) if A and B are independent?
7. A bag contains 7 lemons and 3 oranges. If they are drawn one at a time from the bag, what is the probability of drawing a lemon then an orange, and so on, alternately until only lemons remain?
8. A die is tossed. What is the likelihood of scoring;
i) A 3 or a 4?
ii) A prime number or an Even number?
9. A bag contains 8 black balls and 5 white ones. If two balls are drawn from the bag, one at a time, find the probability of drawing a black ball and a white ball without replacement.
10. Two marbles are drawn in turn from a pack containing 3 red marbles, 6 white marbles, 7 black marbles and 9 green marbles. If this is done without replacement, determine the probability of drawing two white marbles.
11. At a mountain Village in Kigali, it rains averagely 6 days a week. Find the probability that;
a) Any one day
b) Two successive days
c) Three successive days
12. A school has two photocopiers A and B. On a certain day, A has 8% chance of malfunctioning while B has 12% chance of malfunctioning. Determine the probability that on any one day of the week, the machines will;
a) Malfunction
b) Work effectively
13. Two marksmen Jean and Benitha fire at a target simultaneously. The Chance that Jean hits the target is 70% while the chance that Benitha hits the target is 80%. Find the probability that;
a) They both hit the target
b) They both miss the target
c) Jean hits the target but Benitha misses
d) Benitha hits the target but Jean misses.
14. A coin is tossed 3 times. Determine the probability of getting the following sequence of results; a) Head then Head then Head b) Tail then Head then Tail
15. A couple would like 4 children, none of whom will be adopted. They will be disappointed if the Children are not in order Boy, Girl, Boy, Girl. Determine the probability that they will be;
a) Happy with the order of arrival
b) Unhappy with the order of arrival.
16. Suppose a box X contains 2 green and 2 blue balls. Then box Y contains 1 white and 3 red balls. Assume a ball is selected at random from each box, what is the probability of getting a blue from X and a red from Y?
Unit Summary
1. Probability: It is the likelihood of a particular event happening.
2. Tree diagram: It is a standard diagram used to determine all the possible outcomes in a sequence.
3. Mutually exclusive events: These are events in which occurrence of one excludes the occurrence of the other.
4. Independent events: These are events in which two or more events can take place at the same time or one after the other.

6. Addition law of probability: It states that if A and B are two mutually exclusive events, then P (A or B) = P (A) + P (B).
7. Multiplication law of probability: If A and B are independent events, then, P(A and B) = P(A) × P(B) If A, B and C are independent events, then P(A and B and C) = P(A) × P(B) × P(C)
8. A Venn diagram: It refers to representing mathematical or logical sets pictorially as circles or closed curves within an enclosed rectangle (the universal set), where common elements of the sets represented by intersections of the circles.
9. Possible outcomes: It is the sample space.
10. Favorable outcomes: These are the different ways in which an event A can take place.
Unit 11 Test
1. In a group of 50 students 40 study mathematics, 32 study physics and each student studies atleast one of the subjects
(a) Use the Venn diagram to determine the number of students who study both subjects.
(b) If a student is chosen at random from the group find the probability that
(i) Students do mathematics but not physics.
(ii) Studies both physics and Mathematics.
2. 50 students went bush-walking, 23 were sunburnt, 22 were bitten by ants, 5 were both sunburnt and bitten by ants. Determine the probability that a student chosen at random;
(a) Escape being bitten
(b) Was either bitten or sunburnt
(c) Was neither bitten nor sunburnt
3. A chocolate is randomly selected at from a box which contains 6 chocolates with soft cores and 12 chocolates with hard cores. Let H represent chocolates with hard cores and S represent chocolates with soft cores. (a) Are events H and S mutually exclusive? (b) Find P(H), P(HnS) and P(H or S)
4. A box contains 4 red and 2 yellow tickets. Two tickets are drawn at random one after the other without replacement. Find the probability that;
(a) Both are red
(b) The first is red and the second is yellow
5. A hat contains 20 tickets numbered 1, 2, 3, ….., 20. If 3 tickets are selected without replacement. Determine the probability that they all contain prime numbers.
6. A coin is flipped and a die is tossed. Determine the probability of getting a 3 on a die and a head on a coin.
7. Kayesu is not having much luck lately. Her car will only start 80% of the time and her motorbike will only start 60% of the time.
(a) Draw a tree diagram to illustrate the situation
(b) Use the tree dagram to find the probability that
(i) Both car and motorbike will start.
(ii) Kayesu can only use her car.
8. A box contains 7 red balls and 3 green balls. Two balls are drawn one after the other without replacement. Determine the probability that;
(a) Both are red
(b) The first is green and the second is red
c) A green and red are obtained
9. A pair of dice is rolled
(a) Illustrate the situation on a two dimensional grid
(b) Us the grid to determine the following probabilities;
(i) Two 3’s
(ii) a 5 or a 6
(iii) Exactly one 6
(iv) A sum of 7
(v) A sum of 7 or 11
(vi) A 5 and a 6 or both
(vii) A tleast a 6
(viii) No sixes
(ix) A sum greater than 8