Topic outline
UNIT1: INDICES AND SURDS
Key unit competence
By the end of this unit, I will be able to:
• Calculate with indices and surds.
• Use place value to represent very small and very large numbers.
Unit outline
• Definition of indices
• Properties of indices
• Simple equation involving indices
• Standard form
• Definition and examples of surds/ radicals
• Properties, simplification and operation of surds
• Rationalization of denominator
• Square root calculation methods
Introduction
Most of our daily activities involve writing very large numbers or very small numbers. For example 1 500 000 and 0.00 001 251. Writing these numbers repeatedly is tedious and in most cases can lead to errors of omission of zeros or other digits. To avoid this, the numbers are therefore written in index form or in standard form. In this unit, we will be writing numbers in index notation and in standard form.
1.1Indices
1.1.1 Index notation
Activity 1.1
1. Write the following numbers as products of their prime numbers. (a) 16 (b) 81
2. Discuss with your classmate then express the factors of the numbers in simple form.
3. Compare your results with another classmates.
Consider the number 32. Writing it as a product of its prime numbers we get 32 = 2 × 2 × 2 × 2 × 2
We notice that in this format, the factor 2 is repeated 5 times. We can write the same in short form as:

The raised numeral is called an index (plural indices), power or exponent. Representing a number in this short form is known as index notation.

For example, 16 can be factorised using a factor tree as shown below.

Example 1.1
Write each of the following in its simplest index form.
(a) 81 (b) 96 (c) 5 × c × c × 5 × c × 5


Exercise 1.1
1. Write each of the following in index form using the specified base. (a) 25 (base 5)
(b) 64 (base 4)
(c) 49 (base 7)
(d) 1 000 (base 10)
2. Write each of the following in its simplest index form.
(a) 2 × a × a × a
(b) 3 × y × y
(c) h × h × h × 7 × h × 21
(d) 3 × b × b × a × b × b × b
(e) 3 × a × 3 × a × a × a
3.Write each of the following in its simplest index form.
(a) 2 (b) 8
(c) 32 (d) 16
(e) 64 (f) 128

7. Express 2 × 2 × 2 × 3 × 3 × 5 × 5 × 5 × 5 in index form.
8. Express 72 and 108 as products of powers of 2 and 3.
1.1.2 Properties of indices
1.1.2.1 Multiplication law of indices
Activity 1.2
1. Write the following numbers as products of two numbers where the two numbers are not equal or where one of the numbers is not one. E.g 16 = 2 × 8
(a) 32 (b) 81
2. Write the short form of the prime products of the numbers you wrote.
3. Discuss with your partner the relationship between the index of the products and the indices of the numbers. 4. Compare your answer with other classmates.


Generally,
When numbers, written in index form with a common base, are multiplied, the indices are added while the base remains the same,

If in a multiplication there is more than one letter to be multiplied, they must be multiplied separately because each represents a different value.

Squaring an expression simply means multiplying the expression by itself. For example,

Thus, in order to square an algebraic expression, square the base and double the indices of the letters.

1.1.2.2 Division laws of indices
Activity 1.3
1. Write the following numbers as quotients of two numbers where the two numbers are not equal, the dividend is greater than the divisor and none of them is equal to 1.
(a) 4 (b) 3
2. Write the short form of the quotient, divisor and the dividend in index notation.
3. Discuss with your partner the relationship between the index of the quotient and that of the indices of the dividend and divisor.
4. Compare the answers with your partner.


In the above working, the power of 2 in the answer is the difference between indices of the numerator and that of the denominator.
Example 1.5


If there is more than one variable to be divided, they must be divided separately as they represent different values.


1.1.2.3 Power of powers
Activity 1.4
1. Write the following numbers in index notation.
(a) 4 (b) 27
2. Square each of the numbers.
3. Find the relationship between the indices of the squares and the solution.

When a number, written in index form, is raised to another power, the indices are multiplied.


All the numerals which are multiplied together in a bracket are raised to the power of that bracket


Note that in this example, all the numerals which are in the bracket are raised to the power of the bracket


1.1.2.4 Zero index
Activity 1.5
1. Using the division law of indices, find the solution of the following:

2. Discuss the results with your partner and compare them with other classmates.


1.1.2.5 Negative indices
Activity 1.6
1. Using the division law of indices, solve the following:

2. In the second case, express your answer in index notation and in fraction form.
3. Discuss with your classmates the relationship between the answer in index notation and fraction form.

Any number raised to a negative power is the same as the reciprocal of the equivalent positive power of the same number,


1.1.2.6 Fractional indices
Ac1.1.2.6 Fractional indices
Activity 1.7

2. Discuss the changes in the index and how in turn it affects the results.
3. Derive a relationship between the change in index and the result. Thus predict the result of 31 2.
4. Compare your results with other classmates.

The indices are reducing by
1 /2 while the results are the square roots of the preceding results: ie

We can also understand the meaning of fractional indices by applying the laws of indices. For example, we know that fractional powers obey the same laws of indices as integral powers. What then is the meaning of:


Note that method (b) is quicker.
From Example 1.10, we see that to find the square root of an algebraic expression, we find the square root of the coefficient and divide the indices of the letters by 2.

Similarly, for any root, order n, we simply find the nth root of the coefficient and divide the indices of the letters by the order n of the root.


1.1.3 Simple equations involving indices
Activity 1.8
1. Consider the equation
 = 4
= 4 2. Discuss in groups how you can determine the value of x.
3. Compare your findings with another groups
Sometimes we may be required to solve equations involving indices.
Consider
 = 81. What value of x makes the equation true? = 81 is the same as = 34 (expressing Right Hand Side (RHS) is index form).
The base on the Left Hand Side (LHS) is equal to the base on the RHS. Since LHS = RHS, the indices must also be equal.
∴ if
= 34, then x = 4 (equating indices since bases
are also equal).In general,
If
 then x = y Similarly, if
 , then a = b, provided both the bases are positive numbers. To solve equations involving indices, follow the procedure below:
 1. Express both sides of the equation with a common base and simplify as far as possible to reduce to one term on LHS and one term on RHS.
2. If the variable is in the exponent, equate the indices and solve the resulting equation.
3. If the variable is in the base, ensure that the powers are the same. Equate the bases and solve the resulting equation.


1.2 Standard form
Activity 1.9
1. Write the following numbers as products of two numbers. Where one of the numbers is either between 1 and 10 (10 not included) while the other number should be a power of 10)
(a) 1 000 (b) 100 000
(c) 10 (d) 1
(e) 0.001 (f) 7 000
2. Compare your results with other classmates.
Consider the number 60 000. We can write this number using the instructions in step 1 of activity 1.9 as follows:
60 000 = 6 × 10 000
Where 10 000 in index notation is
10 × 10 × 10 × 10 =

Therefore,
60 000 = 6 ×
This format of writing is known as standard form or scientific notation.
It involves writing large numbers in terms of powers of 10.

Example 1.17
Write each the following numbers in scientific notation.
(a) 75 200 (b) 0.000321
(c) 85 (d) 7 834
(e) 7.321 (f) 0.0429
Solution
(a) 75 200: In this case, our decimal point is at the end of the number to the right. To write this number in scientific notation, we move the decimal place to the left up to the position of the number in the 1st significant place value. We then count the number of steps we have moved the decimal point and write it as a power of 10.

(b) 0.000321: In case of a decimal number, we use the same procedure as in (a) above but this time, our decimal point moves to the right. 10 will now be raised to a negative power (ie number of steps moved to the right).

Exercise 1.9 1.
Write the following numbers in standard notation.
(a) 601 (b) 42 300
(c) 6 001 (d) 4 329 200
(e) 100 000 000 (f) 75 000
(g) 0.000 561
0.000 000 32
2. Multiply each of the following and leave your answer in standard form.
(a) 326 × 43 (b) 41 × 691
(c) 8.5 × 25 (d) 69 × 7
(e) 6 300 × 90 (f) 55 × 20
(g) 439 × 12
1.3 Surds
1.3.1 Definition of a surd
Activity 1.10
1. On a stiff paper such as manilla paper, construct two squares of sides 1 unit each. (You may use a scale of "4 cm represents 1 unit"). 2. Cut each square diagonally and rearrange the triangles to form one large square as shown in Fig. 1.1.

3. The sides of the larger square are equal in length to the diagonals of the smaller squares. What is the length?
4. What is the exact area of the large square? Now calculate the area using the length of the side that you measured in step 3 above. Did you get 1.96?
From Activity 1.10, we see that: Area of large square = sum of areas of 2 small squares

Many numbers are not exact powers. Their roots (e.g. square root, cube root, etc.) are, therefore, irrational. Expressions containing roots of such numbers are called surds.


1.3.3 Simplification of surds
Activity 1.11
By putting x = 25 and y = 4, determine which of the following pairs of expression are equal.

Note that in Activity 1.11, the pairs of expressions in 1, 2 and 6, are equal.

These facts can be used when simplifying surds.

A surd is said to be in its simplest form when the number under the radical
 is a prime number.
The process of simplifying surds can also be reversed to obtain surds of single numbers.


1.3.4 Operation on surds
1.3.4.1 Addition and subtraction of surds
Activity 1.12
1. Using the basic addition and subtraction mathematics operations, calculate the following:
(a) x -x (b)3x-2x

We notice that:
To be able to add or subtract surds, they must contain roots of the same number. In general,

1.3.4.2 Multiplication of surds
Activity 1.13


When two monomial surds have to be multiplied together;
1. first simplify each surd where possible, and then
2. multiply whole numbers together and surds together.

Note that the second method is sometimes simpler and quicker.


1.3.4.3 Division of surds and rationalising the denominator
Activity 1.14

If a fraction has a surd in the denominator, it is usually better to rationalise the denominator.
Rationalising the denominator means making the denominator a rational number, so that we divide by a rational number rather than divide by a surd. When rationalising, we multiply both the numerator and the denominator of the fraction by a surd which makes the denominator rational. It is easier to divide by a rational number than a surd.
Rationalisation of monomial denominators
Activity 1.15
1. Using the knowledge of multplication of surds, discuss with your patner how to rationalise the denominator of:

2. Compare your findings with other classmates.


Rationalisation of binomial denominators
Activity 1.16


Note that 1 is a rational number. Any two surds whose product give a rational number are called conjugate surds.

Therefore, to rationalise a denominator, we multiply both the numerator and the denominator by the conjugate of the denominator.

NB
When adding or subtracting fractions containing surds, it is advisable to first rationalise the denominator of each fraction. This is done by multiplying the numerator and the denominator of the fractions by the same number so that the answer has a rational denominator.
If the product of two surds is a rational number, then the surds are said to be conjugates of each other or simply conjugate surds


The first method gives an “exact” answer while the second one gives an approximation. Thus, the first method is more accurate
Note: You may use a calculator when evaluating surds, but you still must show all the steps involved in the process.


1.4 Square roots 1.4.1
Square root by estimation method
Activity 1.17

Consider the value of
 . Since is not a perfect square, 10 is also not an exact value. 10 lies between 9 and 16 both of which are perfect squares i.e
This tells us that
is a value between 3 and 4. We can obtain the value by estimation method. The following example will help us understand how to do this.
NB
To find the whole number part of a square root of a non–square number,
1. Find two consecutive exact squares between which the non-square number lies, (e.g. 39 lies between 36 and 49).
2. The square root of that number lies between the square roots of the exact squares.

3. The whole number part of the required square root is given by the lower value,

Exercise 1.13
1. The following numbers are exact squares.
Find their positive square roots.
(a) 64 (b) 144
(c) 400 (d) 169
(e) 1.96 (f) 0.0036
2. Find the two consecutive exact squares closest integers between which the square root of each of the following numbers lies.
(a) 134 (b) 430
(c) 1 440 (d) 3 000

1.4.2. Square root by factorisation
Activity 1.18


To find the square root by factorisation
(a) Express the given number as a product of prime factors in power notation.
(b) Divide the power of each factor by 2.
(c) Multiply out the result to get the square root.
1.4.3 Square root by general method
First, the numbers under the root are grouped in pairs from right to left. Make sure you leave at least one or two digits on the left. For each pair of numbers you will get one digit in the square root. To start, find a number whose square is less than or equal to the first pair or first number, and write it above the square root line.


2. Surds: These are expressions containing roots of irrational numbers.
3. Scientific notation: It involves writing large numbers in terms of powers of 10 in the form A x
 where the index n is a positive or negative integer and A must lie in the range
1 ≤ A ≤10.
4. Monomial surd: It is a surd which contains only one term.
5. Binomial surd: It is a surd which has two terms.
6. Rationalising the denominator: It means making the denominator a rational number by multiplying both the numerator and denominator by the conjugate of the denominator.
7. Conjugate surds: Occurs when the product of two surds is a rational number.
Unit 1 Test


 Files: 2Quizzes: 5URL: 1
UNIT2: POLYNOMIALS
Key unit competence
By the end of this unit, I will be able to perform operations, factorise polynomials, and solve related problems
Unit outline
• Definition and classifications of polynomials including homogenous polynomials.
• Operations on polynomials.
• Numerical values of polynomials.
• Algebraic identities.
• Factorisation of polynomials
2.1 Introduction to polynomials
With reference to algebra, a polynomial is an expression that consist of variables and coefficients combined by the operations of addition, subtraction, multiplication, and non-negative integer exponents. Polynomials describe an expression of more than two algebraic terms, especially the sum of several terms that contain different powers of the same variable(s). It is the second unit of the book and the learner will be able to learn about the definition, classification, and operations of polynomials. Similarly, the learner will be able to look into numerical values of polynomials, algebraic identity, and factorisation of quadratic expressions relating them to the real life situation.
Consider the following algebraic expression
(a) 2x

Answer the following questions based on the expressions above.
1. How many terms does each of the expression have?
2. State the highest power of x in each expression.
3. Using a dictionary or internet, find out the classification of polynomials based on the number of terms.
(a) A monomial: is an algebraic expression which consists of only one term.

(b) A binomial: is an algebraic expression which contain (or is made up of) two terms only.
Examples: 2a – 3b and 2x2 + 5 are binomials.
(c) A trinomial: is an algebraic expression which is made up of three terms. Examples: 2a + 3b + c, 2x2 – 3x + 5
(d) A polynomial: is any algebraic expression containing more than two terms of different positive powers of the same variable or variables.
The highest power of the variables in a polynomial defines the degree or order of the polynomial.
For example x4 + 2x3 + 3x2 – x + 5 and 3x5 – 4x4 + 2x3 – x2 + x + 3 are examples of polynomials of order 4 and 5 respectively. A zero degree polynomial is known as a consonant e.g 2x° = 2 is a constant.
The general form of a polynomial order n

The power of the variable in any term of a polynomial must be positive.
For example, an expression of the type
 is not a polynomial Because some of the powers of are not positive.
 Generally, a quadratic polynomial will take the form ax2+bx+c, a cubic polynomial takes the form ax3+bx2+cx+d and so on.
Homogenous Polynomial
A polynomial containing two or more variables are said to be homogenous if every term is of the same degree.
For example, xy2 + x2y + 3x3 and 3x + 2y – 4z are homogenous polynomials of degree 3 and 1 respectively.
xy2 + x2y + 3x3, its equivalent form isx1y2 + x2y1 + 3x3
In every term, the sum of the powers of the variables is equal to 3. Therefore, this is called a homogenous polynomial of order 3.
Similarly, the expression 3x + 2y – 4z, is a homogenous polynomial of first degree
Exercise 2.1
1. For each of the following write the (i) numerical coefficient (ii)variable part

2. Identify each of the following expression as a monomial, binomial, trinomial or polynomial
(a) 5x3 + x2 – 3x – 4
(b) 3ab2c – 6b
(c) 4x2y2
(d) 4 – 6ab2
(e) x2 + y3
(f) a2b3 – 25
(g) –yx2z3
(i) –5x2 + 6x + 3
3. Which of the following are homogenous? State the degree of those that are homogenous.
(a) zx + xy
(b) a2b2 + 2a + 2b
(c) x3 + y3 – z3
(d) x2 – 3xy – 40y2
(e) 6x – 5y + 6z
(f) ab + ac + bc
(g) x3 + y3 + z3 + 3a2c + 3ac2
(i) 5x3 + 6x2y – 7xy2 + 6y3
4. Which of the following are homogenous polynomials? State their degree where possible.
(a) x2 + y2 + z2
(b) 3xy + zx – 2yz
(c) x3 + y3 – 2x – 2y
(d) x3 + y2x + z3x
(e) x3 + y2z – x2yz
(f) a2b + ab2 – x2y + xy2
2.2 Operations on polynomials
The rule that governs the basic operations on numbers also apply in polynomials. In this unit, we are going to concentrate on addition and subtraction, multiplication and division of polynomials.
2.2.1 Addition and subtraction
Activity 2.2
Consider the expressions;
(i) 3x3 – 13x2 + 4x – 2
(ii) x2 + 3x + 4
(iii) 5x2– 3x + 3
(a) Identify the terms that are alike in (i),(ii) and (iii) and group them together.
(b) Combine the sets of terms in (a) above.
(c) Simplifying each group to a single term.
(d) Now add all the expressions together (3x3 – 13x2 + 4x – 2) + (x2 + 3x + 4) + (5x2 – 3x + 3)
To be able to add or to subtract polynomials you need to identify:
(i) Like terms: These are terms which have the same variables to the same power.

4x and 6x are like terms: and 7a and 4a are like terms.
(ii) Unlike terms - these are terms which either have different variables or same variable to different powers.

2x and – 3y, 5a and 3b cannot combine because the variable parts are different i.e are unlike terms.
3x2 and 4x are unlike terms because they have different powers of x.
The following are more example of like and unlike terms
2a and 3a are like terms,
2ab and 4ab are like terms,
2a and 5b are unlike terms,
2a and 2ab are unlike terms, a
and a2 are unlike terms.
When simplifying algebraic expressions, first collect the like terms together. Simplification is usually easier if the positive like terms are separated from the negative ones.
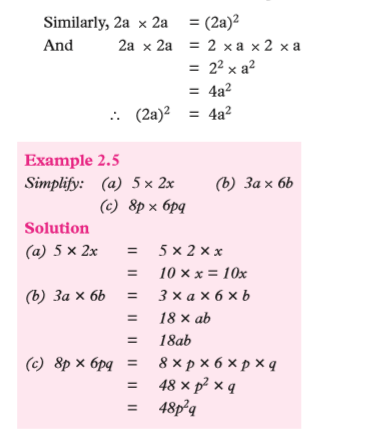
Example 2.1
Simplify the expression
2x – 4y + 5x – 3y
Solution
To simplify the expression, you first collect like terms together for example,
2x – 4y + 5x – 3y
= 2x + 5x – 4y – 3y (like term together)
= 7x – 7y (combine like terms)
= 7x – 7y (this expression cannot be simplified further because 7x and –7y are unlike terms)

2.2.2 Substitution and evaluation
Activity 2.3
1. Consider the polynomial expressions
(a) x2 + y + 1
(b) 3x2 + 2y - 3
2. Given x = 2 and y = 3, solve the expressions.
3. Compare your findings with other classmates.
Polynomials can be evaluated numerically if some numerical values are attached to the variable or variables. We use the method of substitution in the given expression and then simplify.Substitution involves replacing variables, in an algebraic expression, with specific values. The expression may then be evaluated.


Exercise 2.2
1. In each of the following, pick out the term which is unlike the others.
(a) 2x, 4x, 6x, 3x2, 8x
(b) m3, 5m2, 6m3, 3m3, 10m3
(c) x2y, xy, yx2, 3x2y, 4yx2
(d) 3mn, nm, –mn, m2n, 2 /3 mn
2. Simplify the following expressions.
(a) y + y + y
(b) n + n – n + n + n – n – n
(c) f – f + f – f + f
(d) d + d + d – d – d + d
3. Simplify:
(a) 3a + 3a
(b) 4b – b
(c) 6z – 2z
(d) k – k
(e) q + 2q
(f) 5p + 7p
(g) 9r – 8r
4. Simplify:
(a) 5a + a + 3a
(b) c + 2c + 4c
(c) 3b + 3b + 3b
(d) 5y – 4y + y
(e) 12w – 6w + 6w
(f) 9n – 3n + 2n
(g) 2m + 8m – 4m + m – 2m
5. Simplify the following by first collecting like terms together and grouping those with the same signs.
(a) x + y + y + x
(b) 3w + 8w + 9z – 4z
(c) 11n + 11 + n – 10
(d) 4s – 2t + 5t – 3s
(e) 2p – 7 – 4 + 5p
(f) 14b – 9c – 6b
(g) 4m – m + 5n – 4n
6. Simplify
(a) x2 – 3x – 2 + 4x2 – 2x + 5
(b) 3y2 – 4y – 6 – 3 – 2y – 3y2
(c) (2x2 – 3x)+ (5x – 8)
(d) (3y2 – 2y) – (3y + 4)
7. Given that x = 4, y = 3 and z = 2,
evaluate; (a) 2x – y + 7
(b) 4x – 2y + 2z
(c) 5x – y – z
(d) 3x – 3y + 4z
8. If m = 4 and n = 3,
evaluate: (a) 3m + 3
(b) 4m – 5n
(c) 1/2 m + n
(d) 1/4 m – 1/3n
(e) 5m – 5
(f) 6m +2n
(g) 3m – 4n
(i) 3n2
(j) 2mn2
(k) mn – n
(l) m(n– m)
(m) 2m3
1/2 mn
(o) m2 – n2
9. If a = 5, b = 9 and c = 1, evaluate:(a) a ÷ (b + c) + 6 (b)(b – 2c) ÷ (4a – 2b)(c) a2 – c2/ b + 3(d) (3a + c /3a + c)2
10. If E = 1/2 mv2,
find E when m = 27 and v = 1 3.
11. If xy = 5 and y = 2,
find: (a) x (b) 2(x + y)

2.2.3 Multiplication of polynomials
2.2.3.1 Multiplication of monomials
Activity 2.4
Each car has four wheels. Let w stand for one wheel.
1. Write a mathematical expression for the number of wheels for one car.
2. Write a mathematical expression with w and involving multiplication for finding the total number of wheels for 5 cars.
3. Simplify the expression in step 2 above.
4. Discuss with your partner how to simplify the following expressions:

5. Compare your results in step 4 above with those of other classmates.
Study the following facts regarding multiplication. Consider:

Exercise 2.3
Simplify the following:
1. (a) 3 × 4a (b) 4m × 5
(c) 6x × 9 (d) 11 × 3q
2. (a) 3x × 2y (b) 2a × 7b
(c) 8q × 5p (d) y × 8x
3. (a) a × 3ab (b) 2a × 7ab
(c) 7y × 4yx (d) 13st × 11t
4. (a) 5 × 2m2 (b) 15pq × p2
(c) (3q)2 × pq (d) 3p2 × 2q2
2.2.3.2 Multiplication of a polynomials by a monomial
Removing brackets in multiplication of polynomials
Usually, multiplication of polynomials involves removing brackets. The following activity prepares us for multiplicatio
Activity 2.5
1. Open the brackets correctly and simplify the following expressions.
(a) 4a + (5 + 3a) (b) 4a – (5 - 3a)
(c) 4a – 2(5 + 3a) (d) 4a – 2(- 3a – 5)
2. Using your observation remove the brackets in
(a) a – (b + c) (b) a – (–b – c).
3. Comment on your answers and compare your results to those of other members of the class.
The terms inside brackets are intended to be taken as one term.
For example, 9 + (7 + 3) means that 7 and 3 are to be added together, and their sum added to 9, so that,
9 + (7 + 3) = 9 + 10 = 19
Also, 9 + 7 + 3 = 19
Hence, the bracket may be removed without changing the result,
i.e. 9 + (7 + 3) = 9 + 7 + 3
In general,
x + (y + z) = x + y + z
Consider the expression 9 + (7 – 3)
9 + (7 – 3) = 9 + 4 (First subtracting 3 from 7) 9 + 4 = 13
Also, 9 + 7 – 3 = 16 – 3 = 13
Hence, the bracket may again be removed without changing the result.
In general,
x + (y – z) = x + y – z
Consider the expression 9 – (7 + 3) 9 – (7 + 3) = 9 – 10 (First adding 3 to = –1 7) = 10
Also, 9 – 7 – 3 = 2 – 3 = –1
Hence, in this case, when the bracket is removed, the sign of each term inside the bracket is changed.
i.e. 9 – (7 + 3) = 9 – 7 – 3
In general,
x – (y + z) = x – y – z
Caution !
9 – 7 + 3 = 2 + 3 = 5
Note that this is not the same as 9 – (7 + 3). This is a common mistake, which must be avoided.
In general,
x – (y + z) ≠ x – y + z
Consider the expression 9 – (7 – 3) 9 – (7 – 3) = 9 – 4
(First subtracting 3 from 7)= 5
Also, 9 – 7 + 3 = 2 + 3 = 5.
Similarly, when the bracket is removed, the sign of each term inside the bracket is changed to the opposite sign,
i.e. 9 – (7 – 3) = 9 – 7 + 3.
In general,
x – (y – z) = x – y + z
Caution !
9 – (7 – 3) ≠ 9 – 7 – 3 !
∴ in general,
x – (y – z) ≠ x – y – z
The rules, therefore, are:
1. If there is a positive (plus) sign just before a bracket, the sign of each term inside the bracket is unchanged when the bracket is removed (i.e. when the expression is expanded).
2. If there is a negative (minus) sign just before a bracket, the sign of each term inside the bracket must be changed to the opposite sign when the bracket is removed. Removing the bracket is like multiplying each term by –1
Example 2.6
Remove the brackets and simplify:
(a) 7g + (3g – 4h) – (2g – 9h)
(b) (6x – y + 3z) – (2x + 5y – 4z)
Solution
(a) 7g + (3g – 4h) – (2g – 9h)
= 7g + 3g – 4h – 2g + 9h
= 7g + 3g – 2g + 9h – 4h
= 8g + 5h
(b) (6x – y + 3z) – (2x + 5y – 4z)
= 6x – y + 3z – 2x – 5y + 4z
= 6x – 2x – y – 5y + 3z + 4z
= 4x – 6y + 7z
Note: In (b) above, there is no sign before the first bracket so a positive sign is assumed.
In the expression 9 × (7 + 3), the bracket means that 7 and 3 are to be added together, and the result multiplied by 9. Thus, 9 × (7 + 3) = 9 × 10 = 90.
But
9 × 7 + 9 × 3 = 63 + 27 = 90. ∴ 9 × (7 + 3) = 9 × 7 + 9 × 3, which means that 7 and 3 may each be multiplied by 9 and the products added together. The multiplication sign is usually omitted, so that 9(7 + 3) means exactly the same as 9 × (7 + 3), just as a × b = ab.
In general, when expression in a bracket is multiplied by a number in order to remove the brackets, every term inside the bracket must be multiplied by that number.
Thus,
a(x + y) = a × x + a × y = ax + ay and a(x – y) = a × x – a × y = ax – ay
Example 2.7
Remove the brackets and simplify:
2(3x – y) + 4(x + 2y) – 3(2x – 3y)
Solution2(3x – y) + 4(x + 2y) – 3(2x – 3y)
= 2 × 3x – 2 × y + 4 × x + 4 × 2y – 3 × 2x + 3 × 3y
= 6x – 2y + 4x + 8y – 6x + 9y
= 6x + 4x – 6x + 8y + 9y – 2y
= 4x + 15
Notice how the signs obey the rules obtained earlier
When simplifying expressions containing brackets enclosed in other brackets, remove the innermost bracket first and collect the like terms (if any) before removing the next outer bracket.
Example 2.8
Simplify {3y – (x – 2y)} – {5x – (y + 3x)}
Solution
{3y –(x – 2y)} – {5x – (y + 3x)}
= {3y – x + 2y} – {5x – y – 3x}
= {5y – x} – {2x – y} = 5y – x – 2x + y
= 6y – 3x
Note: Different shapes of brackets are usually used to make the meaning of the hyphen expression more easily understood.
Exercise 2.4 1.
Remove the brackets and simplify the following:
(a) 5(2x + 3) (b) 4(3m – 2n)
(c) 7(2b – 3c + 1) (d) 3w(4x – 1)
(e) 6(3x – 5y – 1) (f) 2(4r – 3) + 3(s – 1)
(g) 3a(2b + c) – 2a(2x + y)
(i) –(x + y) + x (j) (7a + 5b) – (3a – 10b)
(k) (x – 3y)9y + 2(y2 – 3xy) (l) xy(x – xy) – x(xy – x2)
2. Write algebraic expressions for the following. Do not remove brackets.
(a) Add a to 2y and multiply the result by 4.
(b) Divide 12e + 30d – 18 by 6.
(c) The product of 3 consecutive even numbers, the largest of which is p.
(d) The number by which a + b exceeds a – b. 3
3. Copy and complete the following:
(a) m + n – l = m + ( _____ )
(b) a – b – c = a – ( _____ )
(c) x – y + z = x – ( _____ )
(d) p – q – r + s = p – ( _____ )
(e) u – v + w + x = u – ( _____ )
(f) x – y + v – w = x – ( _____ )
(g) a + 2b – 2c = a + 2( _____ )
(i) 2a – 8c – 3x – 9z
= 2( _____ ) – 3( _____ )
(j) k2 + 2kl – 3m2 + 4mn
= k( _____ ) – m( _____ )
2.2.3.3 Multiplication of a polynomial by a polynomia
We have just learned how to multiply expressions of the form a(x+y) using integers, and the result generalised. Remember:
• An expression such as a (2x + c) means a × (2x) + a × c = 2ax + ac
• This skill will help us to multiply two or more polynomials, whatever the number of terms.
Now, consider the expression p (x + y) we have just seen that: p (x + y) means p × x + p × y Multiplying (a + b)(x + y),suppose we let p represent (a + b)
So that (a + b)(x + y)
= p(x + y)……(1)
= p × x + p × y
= px + py
= xp + yp..(2)
Substituting (a + b) for p in equation (2) xp + yp = x(a + b) + y(a + b) = ax + bx + ay + by (a + b)(x + y) = ax + bx + ay + by This is called a binomial expansion The result show that each term in one bracket, then the result added.

Example 2.9 Multiply and simplify
(a) (x + 2)(x + 3)
(b) (3x – 2)(2x – 3)

The method used in examples 2.8 to 2.10 can be used to multiply polynomials of any degree. However when polynomials have more than two terms, it is easier to use an alternative arrangement; similar to the one used in Example 2.12 below

Exercise 2.5 1.
Multiply
(a) (x – 3)(x – 2)
(b) (a – 5)(a + 5
(c) (y + 4)(y – 4)
(d) (x + 5)(x + 5)
2. Simplify
(a) 3(x – 1)(x – 4)
(b) (2y2 – 1)(6y2 + 7)
(c) 3(3x + 1)2
(d) 2(3y – t)(2y – t)
3. (a) (x2 – 8)(x2 – 3)
(b) (2y2 – 1)(6y2 + 7)
(c) (ab – 6)(ab + 6)
(d) (2x – 1/2 )2
4. (a) (a – 3)(2a – 2) + 2(2a + 3)(2a – 1)
(b) (3x – 5)2 – 2(x – 5)(x + 5)
(c) 3(x – y)2 – 3(x + y)(x – 2y)
(d) (3x – 2)(2x2 – 2x + 1)
5. Expand and simplify the following
(a) (x + y)(x – y – 2)
(b) (3x – 2)(2x2 – 2x + 1)
(c) (2x + 3 – y)2
(d) (a – 2b)(3a2 – 2ab + b2)
(e) –x(2x – 3x – 1)
(f) (x – y – 2)(2x + 3 – y)
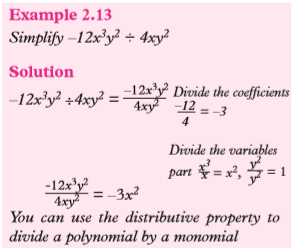
2.2.4 Division of polynomials
2.2.4.1 Division of a monomial by a monomial
Activity 2.6
1. With your partner, discuss the division rule of indices.
2. Consider the polynomial expression
8x3y5 ÷ 4x2y3.
3. State the denominator and the numerator of the expression in (2) above.
4. Simplify the expression by cancelling all the common factors.
5. Compare your results with those of other classmates
Consider a polynomial expression 36x3y5 ÷ 9xy2.
To solve the expression, we first identify the numerator and denominator then cancelling the common terms. The division law of indices is applied i.e.
Activity 2.7 Divide 16x2y3 + 8xy2 – 2x3y3 by 2xy (a) Identify the number of terms in the numerator. (b) Divide each term by the divisor. (c) State your answer and compare with other classmate

Activity 2.7
Divide 16x2y3 + 8xy2 – 2x3y3 by 2xy
(a) Identify the number of terms in the numerator.
(b) Divide each term by the divisor.
(c) State your answer and compare with other classmates
Consider the division: 12x3y2 – 6xy2 + 18x2y divided by 3xy


2.2.4.2 Division of a polynomial by a polynomial
Activity 2.8
1. Through a discussion with your partner divide the polynomial
x2 + 9x + 18 by x + 3 Hint: Try the long division method.
2. Compare your result with those of other classmates.
For the division of one polynomial by another to work, the degree of the dividend must be higher than that of the divisor.Remember:
Like in division of numbers, not all polynomials divide exactly, some will have remainders.
Suppose the polynomial to be divided is denoted by f(x), and the divisor by the polynomial g(x), we can denote the result of division as,

Where Q is the quotient and R is the remainder, the division process terminates as soon as the degree of R is less than the degree of division g(x)
In division, order of the terms is important;
(i) Both the dividend and the divisor must be written in descending powers of the variable.
(ii) If a term is missing, a zero term must be inserted in its place.

Example 2.15
Divide –20 + 6x3 – 4x2 by 2x – 4 and state the quotient and the remainder.
Solution
(i) Rearrange the terms in the dividend and write them in descending order.
(ii) Insert 0x for the missing.

Example 2.16
Divide 2x4 + x3 – 3x2 by x2 + 2 and state the quotient and the remainder.
Solution
In the dividend, the constant and the x term are missing, so we replace them with 0x, and 0 respectively. In the divisor, the term in x is missing, so we replace it with 0x.

Exercise 2.7
1. Arrange each of the polynomials in descending powers of the variable.
(a) –12x3 + 3x2 – x4 + 7x + 10
(b) 4x3 – 3x5 + 6x2
(c) 4a + a2 – 12 + 12a3
(d) 4a5 – 5a + 3a3 + a4 – 7a2
2. Arrange the following polynomials in descending order, inserting zero for any missing term.
(a) 8 + 4x3 – 2x
(b) –3x3 + 4x5 – 2x2 + 7x
(c) 8x5 – 3x2 + 4x3 – 7
(d) 7a + 3a4 – 8a2
3. Simplify the following:
(a) (m2 + 5m) – (m2 + m)
(b) (4x2 + 6x) – (4x2 – 10x)
(c) (–6x2 – 3x) – (–6x – 8x)
(d) (11x2 + 0x) – (11x2 – 10x)
4. Verify whether the statements given below are true or false.
(a) a2 – 7a – 18 = (a – 9) (a + 2)
(b) b3 – 8 = (b2 + 2b + 4) (b – 2)
(c) 3x3 – 2x2 + 16x – 8 = (3x2 + 4x + 11) (x – 2) + 18
(d) 3p2 – 3p + p3 – 8 = (p2 + 5p + 7) (p – 2) + 6
5. Divide the given polynomials and in each case state the quotient and the remainder.
(a) (13x + 14 + 3x2) ÷ (x + 2)
(b) (t + 20t2 – 4) ÷ (4 + 5t)
(c) (17a + 14a2 + 7) ÷ (2 – 7a)
(d) (9 – 16r2) ÷ (4r – 3)
(e) (x + 2 – 3x2 – 2x3) ÷ (1 + 2x)
(f) (a + 2a4 – 14a2 + 5) ÷ (a2 + 5)
(g) (3y2 + 4 – 10y) ÷ (3y – 2)
2.2.5 Numerical value of polynomialActivity 2.91. Consider the polynomial2x2 + 3xy2 + xy2. Evaluate the polynomial given that x = 2 and y = 3.3. What do you find as your final answer? Compare with other class members.Evaluating a polynomial means finding a single numerical value for the expression. In this case, we must be given the numerical values of the variables in the polynomial.Consider a polynomiala2b + ab2 for a = -2, b = 3To find the numerical value of the expression, we substitute the values of a and b in the polynomial given.This gives (-2)2(3) + (-2)(3)2= (4 × 3) + (-2 × 9)= 12 + (-18)= 12 – 18= -6Example 2.17Evaluate x4 + 3x3 – x2 + 6 for x = –3SolutionSubstitute all the 'x' for 3= (-3)4 + 3(-3)3 – (-3)2 + 6= 81 + 3(-27) − (9) + 6= 81 – 81 – 9 + 6= -3Example 2.18Evaluate 3x2 − 12x + 4 for x = –2SolutionSubstitute 2 for all the x= 3(-2)2 – 12(-2) + 4= 3(4) + 24 + 4= 12 + 24 + 4 = 402.3 Algebraic expressionsIdentities are equations that include variables that are always true.2.3.1 Definition of algebraic identities and equationsActivity 2.101. Find two values of x for which the equation x2 = -7x – 12 is true2. Find any two values of x for which the equation(x + 3) (x – 3) = x2 – 9 is not true.Consider the algebraic equations(a) x2 = 3x – 2 (b) (x + 5)(x – 5) = x2 – 25 To find the two values of x that satisfies the equation:1. There are only two values of x for which x2 = 3x – 2 is truei.e. when x = 1 LHS = x2 RHS = 3x – 2= 12 = 1 = 3 × 1 –2= 3 2 = 1When x = 2 LHS = x2 RHS = 3x – 2= 22 = 3 × 2 – 2= 4= 6 -2= 4Suppose x = 3 LHS = x2 = 32 and RHS = 3x – 2 = 9 = 3 × 3 – 2 = 9 – 2 = 71 and 2 are the only values of x that make the equation x2 = 3x – 2 true2. In the equation(x + 5)(x – 5) = x2 – 25, any value of x makes the statement true. For examplewhen x = 1, LHS = (x + 5)(x – 5) = (1 + 5)(1 – 5) = 6 × – 4 = –24 RHS = x2 – 25 = 12 – 25 = 1 – 25 = –24\ LHS equals RHSAny algebraic statement which is only true for a particular value(s) of x is called an equation.Therefore x2 = 3x – 2 is an equation. (x + 5)(x – 5) = x2 – 25 is an identity because it is true for all values of x. The symbol ≡ is usually used to denote an identity in place of =NoteIf two identities are polynomials of same degree and are equal, then their corresponding terms must be equal.For example Suppose 2x2 – ax + c = bx2 + 4x + k This means 2x2 = bx2 ⇒ b = 2 – ax = 4x ⇒ –a = 4 a = –4 c = kNote that c and k are constants since x is the variable.Suppose f(x) and g(x) are polynomials. f(x) ≡ g(x) only if:(i) they are of the same degree,(ii) they have the same number of terms,(iii) the coefficients of the corresponding terms are equal.If f(x) = g(x), then f(a) = g(a) for all a, and the coefficient of xn in f(x) is equal to coefficient of xn in g(x) for all n.Example 2.19Given that
a(x + 3)2 + b(x – 2) + 1 ≡ 3x2 + 20x + 24, find the values of a and b.SolutionSince the identity is true for all values of x, we substitute sample values like (i) x = –3 and (ii) x = 2, one at a time. When x= –3, a(x + 3)2 + b(x – 2) + 1≡ 3x2 + 20x + 24 Becomes a(–3 + 3)2 + b(–3 – 2) + 1≡ 3(–3)2 + 20(–3) + 24 – 5b + 1≡ + 27 – 60 + 24≡ 51 – 60–5b≡ –9 – -5b= –10∴ b = 2when x = 2, a(2 + 3)2 + 2(2 – 2) + 1≡ 3(2)2 + 20(2) + 24
25a + 1≡ 12 + 40 + 24a = 75 /25 = 3Alternatively we can find the values of a and b by first expanding the left hand side of the identity, and then comparing coefficients of appropriate terms.a(x + 3)2 + b (x – 2 ) + 1 ≡ 3x2 + 20x + 24LHS: a(x2 + 6x + 9) +b(x – 2) + 1 ax2 + 6ax + 9a + bx – 2b + 1 If ax2 + (6a + b) x + 9a – 2b + 1 ≡ 3x2 + 20x + 24,We can now equate the coefficient of like termsThus: a = 3 …… the coefficients of x2 in the two expressions6a + b = 20and 9a – 2b + 1 = 24The first two equations of the coefficient givea = 3 and b = 20 – 18 = 2.To confirm that our values of a and b are correct, we substitute in the third equationLHS 9a – 2b + 1 = 9 × 3 – 2 × 2 + 1= 27 – 4 + 1= 24∴a = 3 and b = 2Exercise 2.81. Given that f(x) = ax3 + ax2 + bx + 12 and that f(–2) = f(3) = 0, find the values of a and b.2. If f(2) = f(–3) = 0, use the identity
f(x) ≡ x3 + 2x2 + ax + b to find the values of a and b. Hence, the remainder when x3 + 2x2 + ax + b is divided by x – 4.3. Use the identity 2x2 + 3bx +4 ≡ (5x + 2) (x + 2) to find the value of a and b.4. Use the identity x2 + 7x + 12 ≡ (x + a)(x + b) to find the value of a and b.5. Find the value of a, b and c in the identity2x2 – x + 1 ≡ a(x – 1)2 + b(x – 1) + c6. If x3 + ax2 + bx + c ≡ (x + d)3 where a, b and d are constants, express ab in terms of c.7. Find the values of a and b given that a(x + 3)2 + b(x – 2) + 1= 3x2 + 20x + 24 8. Find the value of a and b (x – 2)(x + 3)(x – 4)= x3 – ax2 – 2bx + 249. (x2 + 4x + 4)(2x2 – 5x + 3)= 2x4 + ax3 + bx2 + cx + 1210. (x + a)(x2 – bx – 12)= x3 – 3x2 – 10x + 2411. Given that 2x2 – 9x – 15 = ax(x + 3) + b(x + 3)2 + c(x2 + 1),Find the values of a, b, and c2.3.2 Factorisation of polynomials by common factorActivity 2.111. Consider the following expression(a) 2a + 2b (b) 3r + 6r2(c) xy + axy (d) 9x2y + 15xy22. For each expression above, identify the common factors for both terms and factorise the expression fully.3. Compare your results with those of other classmates.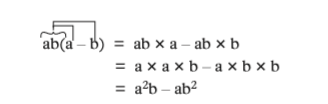 To factorise means to write a sum or difference of terms as a product of polynomial. For example, 2x2 + 4x = 2x(x + 2)2x is the greatest common factor of the two terms.The number inside the brackets is the result of dividing the two terms by the common factor 2xa2b2 – ab2 = ab2(a – 1)ab2 is the greatest /factor of the two terms dividing by the common factor ab2 gives rise to two factors (ab2 and (a - 1)Expanding and factorising are reverse operations. For exampleExpand 2x(x + 2) = 2x2 + 4xFactorising 2x2 + 4x = 2x(x + 2)Example 2.20Factorise each of the following expressions:(a) 2ab + 4c (b) –3b2 – 9b(c) 3x3 + 6x2 – 9x
Solution(a) 2ab + 4c There are only two terms 2ab and 4c. 2 is the only common factor between the two terms so 2ab = 2(ab) and 4c = 2(2c)∴2ab + 4c = 2(ab + 2c)(b) –3b2 – 9b is a binomial i.e only two terms –3 is a common factor and b is another,, the greatest common factor is –3b So –3b2 ÷ 3b = b And –9b ÷ –3b = 3 –3b2 – 9b = –3b(b + 3)(c) 3x3 + 6x2 – 9x is a trinomial All the 3 terms have 3 as a common factor All the 3 terms have x as a common factor The greatest common factor is 3x So 3x3 ÷ 3x = x2 6x2 ÷ 3x = 2x –9x ÷ 3x = 3x3 + 6x2 – 9x = 3x(x2 + 2x – 3)Exercise 2.9Factorise:1. ax + ay 2. 3x + 3z3. 21xy – 6x2 4. 6x2 + 15xy5. 9x2 – 45y2x3 6. 4x + 14x27. 25x2 – 15xy2 8. 8ap + 2aqExpand the following expression:9. (x + 4) 10. –2(8a – 5)11.(–b)(4b – 1) 12. –2x(–3x – 5)Expand and simplify:13. 2(x + 1) + 3(x + 2) 14. 3(3y – 5)(2y + 3)15. –x(x + 5) + 5(x – 5) 16. t(t – 5) – 5(t – 5)2.3.3 Factorisation of algebraic expressions by groupingActivity 2.12Consider the algebraic expression with four terms below:ab – 2a + 3cb – 6c1. Factor out the common factor(s) in the expression above.2. Group these terms in pairs such that there is a common factor in each pair.3. Now factorise each of the pairs of terms.Example 2.21Factorise:(i) 3a + 6b + 2a + 4b(ii) ac + ad + bc + bd(iii) 2ab – xc + bc – 2ax(iv) 3ad + 12bd – 12bc – 3acSolution(i) 3a + 6b + 2a + 4b= 3a + 6b + 2a + 4b(Already paired) = 3(a + 2b) + 2(a + 2b)[(a + 2b) is the common factor] = (a + 2b)(3 + 2) = (a + 2b)5 = 5(a + 2b)(ii) ac + ad + bc + bd = ac + ad + bc + bd(Already paired) = a(c + d) + b(c + d)[(c + d) is the common factor] = (c + d)(a + b)(iii) 2ab – xc + bc – 2ax = 2ab + bc – xc – 2ax(Pairing) = b(2a + c) – x(c + 2a) = b(2a + c) – x(2a + c)[(2a + c) is the common factor] = (2a + c)(b – x)(iv)3ad + 12bd – 12bc – 3ac = 3(ad + 4bd – 4bc – ac) [3 is acommon factor] = 3{d(a + 4b) – c(4b + a)} [(a + 4b)is a common factor] = 3{(a + 4b)(d – c)} = 3(a + 4b)(d – c)Note that in each of the cases (i) to (iv), it is possible to group the terms differently. Try it out!Exercise 2.10Factorise the following expressions completely:1. 6p + 18q + 27r – 12s2. 8x + 16y – 32n – 64m3. a2b2 + a3b – ab34. 6k + 18k2l – 27km + 12k3n5. 4abx – 2x2c + 2bcx – 4ax26. 28m3n + 70m2n2 – 42mn37. 6a2 – 4ab + a8. ab – 2a + 3cb – 6c9. e2 + ef + 2e + 2f10. 2n – 2w + mw – mn11. 5ab – 5bc – 4c + 4a12. x2 – xy + 6x – 6y13. 7ab + abk – 7m – mk14. nx – 6m – 2n + 3mx15. ay + 3 + y + 3a16. 3ab – 2c – 3bc + 2a17. mw + 3n – mn – 3w18. bx – by + 3bx – 3by19. 6na – 3bm – 10an + 5mb2.4 Quadratic ExpressionEarlier in this unit we defined the term algebraic identities in this section we deal with special identities called quadratic identities.2.4.1 Definition of quadratic expressionsActivity 2.11. Expand the expressions(a) (x + 2)(x + 3)(b) (2a + 1)(3a – 4)2. What is the degree of each of the expression that you obtain after expansion. 3. Use a dictionary or internet to identify the name of this type of polynomial and its general form.An algebraic expression of the type ax2 + bx + c where a, b and c are constants, a ≠ 0 and x is the variable, is called a quadratic expression. Thus, x2 + 5x + 6, 3x2 – 5x + 3, 3x2 + 5x, 2x2 – 16 are examples of quadratic expressions.In x2 + 5x + 6, the term in x2 is called the quadratic term or simply the first term. The term in x, i.e. 5x, is called the linear term or second term or middle term, and 6, the numerical term or the independent term of x, is called the constant term or third term. In 3x2 + 5x, the ‘missing constant term is understood to be zero. In 2x2 – 16, the ‘missing’ linear term has zero coefficient.Three special binomial products appear so often in algebra that their expansions can be stated with minimum computation.2.4.2 Quadratic identities2.4.2.1 Binomial squaresIn arithmetic, we know that 22 means 2 × 2 = 4, 32 means 3 × 3 = 9, and so on. In algebra, (a + b)2 means (a + b) × (a + b).Thus, (a + b)2 = (a + b)(a + b)= a(a + b) + b(a + b)= a2 + ab + ba + b2 =a2 + 2ab + b2 (since ab = ba)Also (a – b)2 means (a – b) × (a – b)Thus, (a – b)2 = (a – b)(a – b)= a(a – b) – b(a – b)
= a2 – ab – ba + b2= a2 – 2ab + b2(a + b)2 and (a – b)2 are called squares of binomials or simply perfect squares. The three terms of the product can be obtained through the following procedure.1. The first term of the product is the square of the first term of the binomial, i.e. (a)2 = a2 .2. The second term of the product is two times the product of the two terms of the binomial, i.e. 2 × (a × b) = 2ab3. The third term of the product is equal to the square of the second term of the binomial, i.e. (b)2 = b2Thus, (a + b)2 = a2 + 2ab + b2 and not a2 + b2 . This is a common error which must be avoided. Similarly, (a – b)2 = a2 – 2ab + b2 and not a2 – b2The square of a binomial always gives a trinomial, (i.e. an expression having three terms), also known as a quadratic expression.2.4.2.2 A difference of two squaresA third special product comes from multiplying the sum and difference of two similar termsConsider the product(a + b)(a – b). (a + b)(a – b)= a(a – b) + b(a – b)= a2 – ab + ab – b2= a2 – b2 (Since ab = ba, then –ab + ba = –ab + ab = 0)This product may be obtained by:1. Squaring the first term of the factors.2. Subtracting the square of the second term of the factors.The result (a + b)(a – b) = a2 – b2 is called a difference of two squares. The expansions (a + b)2 = a2 + 2ab + b2 (a – b)2 = a2 – 2ab + b2 , and (a + b)(a – b) = a2 – b2 are known as quadratic identities.These identities can be used to factorise quadratic expressions which are perfect squares as we are going to see later in this unit.Use of area to derive the quadratic identitiesIn this section, we use the idea of area of a rectangle to derive the three identities. This section will help you appreciate that when expanding the algebraic expressions, we are looking for areas of some rectangles and squares.Activity 2.141. Consider fig. 2.1(a), a square ABCD with sides of length (a + b).2. Find the area of ABCD = (a + b)23. Similarly, fig. 2.1(b) is the same square ABCD [Fig. 2.1 (a)]. In it is a small square AEFG of lengths a.4. The square ABCD [Fig. 2.1(b)] can be divided as shown in Fig. 2.1(c). DiscussionThe area of ABCD = Area of AEFG + Area of EBHF + Area of GHCD Area of AEFG = a2 Area of EBHF = ab Area of GHCD = b(a + b) = ab + b2 Thus, area of ABCD = (a + b)(a + b) = a2 + ab + ab + b2 = a2 + 2ab + b2
Since area of ABCD = (a + b)2 (from Fig. 2.1(a))Then (a + b)2 = a2 + 2ab + b2Activity 2.15Consider the following:1. Fig. 2.2(a), a square ABCD with sides of length a. 2. Similarly, Fig. 2.2(b) shows the same square ABCD of length a From the activity, we can deduce that, PQRC is a square of length (a – b). Area of PQRC = (a – b)2 ………(1) But area of PQRC = Area of ABCD – (Area of DPQS + Area of SQTA + Area of QTBR)Area of ABCD = a2Area of DPQS = b(a – b) = ab – b2Area of SQTA = b2Area of QTBR = b(a – b) = ab – b2∴ Area of PQRC = a2 – [ab – b2 + b2 +
ab – b2 ] = a2 – (2ab – b2 ) = a2 – 2ab + b2 …(2)Hence from equation (1) and (2)we get (a – b)2 = a2 – 2ab + b2Activity 2.161. Given that Fig. 2.3(a) below is a rectangle ABCD with sides of length (a + b) and (a – b).2. Find the area of ABCD3. Similarly Fig. 2.3(b) is the same rectangle ABCD in Fig. 2.3(a), with PB = b hence AP = a.4. Find the area of Fig. 2.3(b) DiscussionArea of APQD = a(a – b) = a2 – abArea of PBCQ = b(a – b) = ab – b2Area of ABCD = Area of + Area of APQD PBCQ= a2 – ab + ab – b2= a2 – b2 ………(2)Comparing equation (1) and (2)we get: (a + b)(a – b) = a2 – b2
We have seen that given squares of sides (a + b) and (a – b) and rectangle of sides (a + b) and (a – b), their areas are given by(a + b)2 = a2 + 2ab + b2(a – b)2 = a2 – 2ab + b2(a + b)(a – b) = a2 – b2The following examples illustrate how to expand binomial products using quadratic identities.Example 2.22Perform the indicated multiplication and simplify(a) (3x + 2)2(b) (4a – 5b)2
Solution(a) (3x + 2)2= (3x)2 + 2(3x)(2) + (2)2= 9x2 + 12x + 4(b) (4a – 5b)2= (4a)2 + 2(4a)(–5b) + (–5b)2= 16a2 + (–40ab) + 25b2= 16a2 – 40ab + 25b2Example 2.23Perform the indicated multiplication and simplify.(a) (x + 2y)(x – 2y) (b) (3a – b)(3a + b)Solution(a) In (x + 2y)(x – 2y), the two factors are (x + 2y) and (x – 2y). Square of first term is (x)2 = x2 Square of second term is (2y)2 or (–2y)2 = 4y2 The difference is x2 – 4y2 (x + 2y)(x – 2y) = x2 – 4y2(b) (3a – b)(3a + b) = (3a)2 – (b)2 = 9a2 – b2Exercise 2.11
1.Expand the following expression using the method used in Example 2.21.
(a)
(i) (a + 1) 2
(ii) (a + 6b) 2
(iii) (x + y) 2
(iv) (x + 9) 2
(v) (m + n) 2
(vi) (2a + 3b) 2
(vii) (3x + 4) 2
(viii) (3m + 2)2
(ix) (4x + 3y) 2
(b)
(i) (b – 1) 2
(ii) (r – 3) 2
(iii) (x – y) 2
(iv) (4x – 3) 2
(v) (5x – 2) 2
(vi) (3x – 12) 2
(vii) (5x – 3)2
(viii) (4z – 3b)2
(ix) (7x – 2y) 2
2. Expand the following using the method used in Example 2.22.
(a) (a + 3)(a – 3)
(b) (a + 5)(a – 5) (
c) (x – 9)(x + 9)
(d) (f + g)(f – g)
(e) (2p – 1)(2p + 1)
(f) (4x – y)(4x + y)
(g) (7 + 2x)(7 – 2x)
(i) (5y + 3)(5y – 3)
(j) (4x – 1)(4x + 1)
(k) (3x + 4)(3x – 4)
(l) (2x – 3y)(2x + 3y)
(m) (8 – 3x)(8 + 3x)
2.4.3 Factorising quadratic expressions
2.4.3.1 General methodology of factors in quadratic expressionsIt is easy to see that 2x2 – 16 = 2(x2 – 8) and 3x2 – 5x = x(3x – 5).
However, it is not easy to see what the factors of x2 + 5x + 6 are. Our experience in multiplying binomials is of great help here.
Now, consider the product (x + 3)(x + 2). (x + 3) and (x + 2) are prime binomial expressions, since the two terms in each bracket have no common factor.
Activity 2.17
1. Expand and simplify the expression (x + 4) (x – 2)
2. Work back to factorise the expression you have obtained.
Given the expression; (x + 3)(x + 2) Expansion of the expression takes the steps below
(x + 3)(x + 2) = x(x + 2) + 3(x + 2) = x2 + 2x + 3x + 6 = x2 + 5x + 6 (since 2x and 3x are like terms). This means that (x + 3) and (x + 2) are factors of x2 + 5x + 6. ⇒ x2 + 5x + 6 = (x + 3)(x + 2)(in factor form).
Note: In x2 + 5x + 6,
1. the coefficient of the quadratic term is 1,
2. the coefficient of the linear term is 5, the sum of the constant terms in the binomial factors, and
3. the constant term is 6, the product of the constant terms in the binomial factors.
Generally,
In a simple expression like ax2 + bx + c, where a = 1, the factors are always of the form (x + m)(x + n), where m and n are constants. Such an expression is factorisable only if there exists two integers m and n such that m × n = c and m + n = b.
To factorise a quadratic expression of the form ax2 + bx + c, where a = 1, follow the steps below.1. List all the possible pairs of integers whose product equals the constant term.
2. Identify the only pair whose sum equals the coefficient of the linear term.
3. Rewrite the given expression with the linear term split as per the factors in 2 above.
4. Factorise your new expression by grouping, i.e. taking two terms at a time.
5. Check that the factors are correct by expanding and simplifying.
Example 2.24
Factorise x2 + 8x + 12.
Solution In this example, a = 1, b = 8 and c = 12.1. List all the pairs of integers whose product is 12. These are: 1 × 12 3 × 4 2 × 6 1 × –12 –3 × –4 –2 × –6
2. Identify the pair of numbers whose sum is 8. The numbers are 6 and 2.
3. Rewrite the expression with the middle term split. x2 + 8x + 12 = x 2 + 2x + 6x + 12
4. Factorise x2 + 2x + 6x + 12 by grouping. x2 + 2x + 6x + 12 has 4 terms which we can group in twos so
that first and second terms make one group and third and fourth terms make another group
i.e x2+ 2x + 6x + 12 In each group, factor out the common factor.
Thus,
x2+ 2x + 6x + 12 = x(x + 2) + 6(x + 2) We now have two terms, i.e. x(x + 2) and 6(x + 2), whose common factor is (x + 2) .
∴ x2 + 8x + 12 = (x + 2)(x + 6) (Factor out the common factor (x + 2)) Check that (x + 2)(x + 6) = x2 + 8x + 12
Note: Since all the terms in the example are positive, the negative pairs of factors of 12 in 1 above could have been omitted altogether.Example 2.25Factorisey2 + 2y – 35.
Solution The pairs of numbers whose product is –35 are –5, 7; 5, –7; 1, –35; and –1, 35. The only pair of numbers whose sum is 2 is –5, 7. ∴ y2+ 2y – 35= y2 – 5y + 7y – 35= y(y – 5) + 7(y – 5)= (y – 5)(y + 7)Note:1. If the third term in the split form of the expression is negative, we factor out the negative common factor. e.g. y2 + 2y – 35 = y2 + 7y – 5y – 35 (the third term is negative)= y(y + 7) – 5(y + 7)(we factor out –5) = (y + 7 )(y – 5).2. The order in which we write mx and nx in the split form of the expression does not change the answer.Exercise 2.121. Factorise the following by grouping:(a) ax + ay + bx + by(b) x2 + 3x + 2x + 6(c) 6x2 – 9x – 4x + 6(d) x2– 3x – 2x + 6(e) cx + dx + cy + dy(f) ax + bx – ay – byFactorise the following quadratic expressions: Further factorisation of quadratic expressionsActivity 2.18Expand and simplify the expression (3x + 3)(4x + 1) Describe the resulting expression fully. Relate the binomials 3x + 3 and 4x + 1 with the result you obtained.ObservationsConsider the expression below:(2x + 3)(2x + 7) We can exapand the expression as follows:(2x + 3)(2x + 7)= 2x (2x + 7) + 3(2x + 7)= 4x2 + 14x + 6x + 21= 4x2 + (14 + 6)x + 21= 4x2 + 20x + 21In this example, (2x + 3) and (2x + 7) are the factors of 4x2 + 20x + 21. In 4x2 + 20x + 21, a = 4, b = 20, and c = 21. 4x2 + 20x + 21 is a quadratic expression of the form ax2 + bx + c, where a, b, c are constants a ≠ 1.Note: If: ac = 4 × 21 = 84 b = 20 There is a pair of integers m and n such that m × n = ac and m + n = b. The pair is 14 and 6.An expression of the form ax2 + bx + c can be factorised if there exists a pair of numbers m and n whose product is ac and whose sum is b.
 Note: When you factorise the groups in Step 3, the factors inside the brackets must be identical. If not, then there is a mistake.Example 2.27Factorise 12x2 – 4x – 5.
Solution Note:1. If we cannot determine m and n by inspection, then we use the procedure of Example 2.26.2. If m and n do not exist, then the expression has no factors.
 2.4.3.2 Factorising perfect squaresActivity 2.1Expand and simplify(i) (x + 4)2 (ii)(x – 1)21. How many terms does each expansion have?2. How does the first term of the result compare with the first term of the given binomial?3. Describe the third term of the expansion in relation to the second term of the given binomial.4. Relate the middle term to the two terms of the binomialConsider the expressions (x + 2)2 and (x – 3)2, expand and simplify them Each binomial expansion has three terms The first term = the square of the first term of the binomial The third term = the square of the second term of the given binomial The middle term = twice the product of the two terms of the binomiali.e. (x + 2)2 = x2 + 2(2 × x) + (2)2=x2+ 4x + 4(x – 3)2= x2 + 2(x × –3) + (–3)2= x2 – 6x + 9 Just like we have square numbers in arithmetic, we also have square trinomials in algebra.Remember (a + b)2 = (a + b)(a + b)= a2 + 2ab + b2In this case, a2 + 2ab + b2 is a perfect square. It has two identical factors.If a trinomial is a perfect square,1. The first term must be a perfect square.2. The last term must be a perfect square.3. The middle term must be twice the product of numbers that were squared to give the first and last termsExample 2.28Show that the following expressions are perfect squares and give the factor of each.(a) 9x2 + 12x + 4 (b) 9x2 – 30x + 25Solution(a) 9x2 + 12x + 4Condition (1): first term 9x2 = (3x)2Condition (2): last term 4 = (2)2Condition (3): middle term 12x = 2(3x)(2)∴ 9x2 + 12x + 4 = (3x)2 + 2(2)(3x) + 22= (3x + 2)2(b) 9x2 – 30x + 25First term 9x2 = (3x)2Last term 25 = (–5)2 Middle term –30x = 2(–5)(3x)∴ 9x2 – 30x + 25 is a perfect square which factorises to (3x – 5)2.Note: In 9x2 – 30x + 25, middle term of the expression is negative, hence the constant term in the binomial factor must be negative.Exercise 2.14Show that the following are perfect squares. Hence state their factors.
 2.4.3.3 Factorising a difference of two squaresRemember:We have already seen that (a – b)(a + b) = a2 – b2. (a – b)(a + b) is the product of the sum and difference of the same two terms. The product always gives a difference of the squares of the two terms. To factorise a difference of two squares, we reverse the process, i.e. find the factors, given the expression.In order to use this technique, we must be able to recognise a difference of two perfect squares. To factorise a difference of two squares, follow the following steps:Step 1: Confirm that we have a perfect square minus another perfect square.Step 2: Rerite the expression in the form a2 – b2. Step 3: Factorise the expression. We proceed as in Example 2.11.Example 2.29Factorise(a) x2 – 9(b) 4x2 – 25y2(c) 3x2 – 27Solution(a) In x2 – 9, x2 and 9 are perfect squares.∴ x2 – 9 = (x)2 – (3)2 = (x + 3)(x – 3)(b) In 4x2 – 25y2, 4x2 and 25y2 are perfect squares.∴ 4x2 – 25y2 = (2x)2 – (5y)2 = (2x + 5y)(2x – 5y) (c) In 3x2 – 27, 3x2 and 27 are not perfect squares but they have a common factor. ∴ 3x2 – 27 = 3(x2 – 9) (x2 and 9 are perfect squares) = 3[(x)2 – (3)2] = 3[(x – 3)(x + 3)] = 3(x – 3)(x + 3)Note that in 3x2 – 27, it was necessary for us to factor out the common factor 3 in order to discover the difference of two squares therein. We must not forget to include 3 in our answer.Also note that, an expression of the form a2 + b2 is called the sum of two squares, and it has no factors.Exercise 2.15Factorise the following completely.1.(a) x2 – 16(b) x2 – 4(c) x2 – 252.(a) x2 – 1(b) 36 – a2(c) 81 – a23.(a) 25 – y2(b) x2 – y2(c) x2 – 4y24.(a) b2 – 49(b) 4a2 – 25b2(c) 9x2 – 49y5.(a) 9y2 – 25x2(b) 16p2 – 9q2(c) 4x2 – 9b26.(a) 81x2 – y2(b) p2 – 25q2(c) a2 – 16b27.(a) 144x2 – 121y2(b) 1 – c2(c) 2x2 – 8y28.(a) 3x2 – 48y2(b) 18x2 – 2(c) 20 – 5b29.(a) 8x2 – 32y2(b) 50 – 2x2(c) r4 – 910.(a) 49x2 – 64y4(b) x4 – 1(c) a4b4 – 16c42.4.4 Applying the quadratic identitiesActivity 2.201. Express each of the following as a sum or difference of two numbers which are easy to multiply i.e 1999 = 2000 - 1 = 19992 = (2000 –1)2 (a) 1022(b) 1992 (c) 300222. Write each of the following as a product of two binomials(i)102 x 99 (ii)106 x 399Observation
1. You should have observed the following(a) 102 can be written as 100 + 21022 = (100 + 2)2(b) 199 = 200 – 11992 = (200 – 1)2(c) 3002 =3000 + 23002 = (3000 + 2)2You can see it would be a lot easier to use the binomial expression instead of the given number.2. 102 × 99 = (102 + 2) (100 – 1)102 × 99 = (102 + 6) (400 – 1)We have derived the three quadratic identities:(a + b)2 = a2 + 2ab + b2(a – b)2 = a2 – 2ab + b2(a + b) (a – b) = a2 – b2The following example will show us how the identities can help in making calculations easier.Example 2.30Find: (a) 122 (b) 182 (c) 102 × 98Solution(a) 12 = 10 + 2∴ 122 = (10 + 2)2= 102 + 2 × 10 × 2 + 22= 100 + 40 + 4= 144(b) 18 = 20 – 2∴ 182 = (20 – 2)2= 202 – 2 × 20 × 2 + 22= 400 – 80 + 4 = 324(c) 102 × 98 = (100 + 2)(100 – 2)= 1002 – 22= 10 000 – 4= 9 996Exercise 2.161. Use the quadratic identities to calculate the following.(a) 112 (b) 292(c) 672 (d) 972(e) 21 × 19 (f) 2022(g) 5012(i) 1 0032 (j) 2 998 × 30022. Use quadratic identities to find the area of the rectangles whose dimensions are:(a) 33 m by 27 m(b) 104 m by 96 m(c) 99 m by 101 m(d) 998 m by 1 002 mUnit summary1. Unlike terms: These are terms which have different variable parts. For example, 2x and 3y are unlike terms.2. Like terms: These are terms which have exactly the same variable(s) to the same power. For example 4n and 2n are like terms.3. Monomial: A monomial is an algebraic expression which consists of only one term. For example 2x.4. Binomial: A binomial is an algebraic expression which contain (or is made up of) two terms only. For example 3x2 – 4.5. Trinomial: A trinomial is an algebraic expression which is made up of three terms. For example 4xy – 3x + 8.6. Polynomial: A polynomial is an algebraic expression containing more than two terms of different powers of the same variable or variables. The general form of a polynomial is 7. Degree or order of the variable: It is defined by the highest power of the variables in a polynomial.8. Homogenous polynomial: It is an expression containing two or more variables where every term is of the same degree.9. Factorising: It means to write a sum or difference of terms as a product of polynomial. For example,
 10. Quadratic expression: It is an algebraic expression of the type ax2 + bx + c where a, b and c are constants, a ≠ 0 and x is the variable.11. A difference of two squares: It is the result of (a + b)(a – b) = a2 – b2.12. Quadratic identities: These are the expansions;
 13. Substitution: It involves replacing variables, in an algebraic expression, with specific values.14. Evaluation: It involves replacing letters in an algebraic expression with given numbers (substitutes) and perform the operation(s).15. In expanding algebraic expressions
 16. When expressions in a bracket is multiplied by a member to remove bracket(a) a(x + y) = a × x + a × y = ax + ay(b) a(x – y) = a × x – a × y = ax – ay17. In the expansion of polynomials: (a + b) (x + y)= ax + ay + bx + by= ax + bx + ay + by18. If f(x) = g(x), then f(a) = g(a) for all a, and the coefficient of xn in f(x) = coefficient of xn in g(x) for all n.19. The difference between two squares is the result of (a + b) (a – b) = a2 – b2 20. An expression of the form a2 + b2 is called the sum of two squares and has no factors.Unit 2 Test1. Simplify the expression5a – 4b – 2 [a – (2b + c)]2. Factorise 3x2 – 2xy – y2.3. Factorise and simplify:2x-6/3x+94. Given that x = 3, y = 4 and w = 5,evaluate3y-5w/w+x5. Given that (x + 3a)+(x – 2b) ≡ 3x2 + 20x + 24Find the values of a and b6. Factorise completely3x2 – 2437. Simplify 8a2bc2 ÷ 4ac8. Find the value of (a + 2b)3 if a=-2 and b = 3
 10. Given that(2x + ay)2 = bx2 + cxy + 16y2Find the values of a, b and c
UNIT3: SIMULTANEOUS LINEAR EQUATIONS AND INEQUALITIE
Key unit competence
By the end of this unit, I will be able to solve problems related to simultenous linear equations, inequalities and represent the solution graphically. Let us now learn about equations containing two variables
3.1 An equation in two variables
Activity 3.1
1. On a market day, Jean bought some white chicken and some black ones. In total he bought 12 chicken. Choose letters of your choice to represent the total number of chicken in an equation.
2. Lucy bought some oranges and mangoes. Mary bought twice the number of oranges as Lucy and thrice the number of mangoes. If Mary bought, 18 fruits in total, represent her total number of fruits in an equation.
Suppose Erick and Robert together have eight children. How can we express this situation in a mathematical statement? Since there are two numbers that we do not know, it is natural to use two variables (unknowns).
Thus, if Erick has x children and Robert has y children, together they have (x + y) children. This mean that x + y = 8
Table 3.1 below shows possible pairs of numbers which make the above equation true.

In table 3.1 above, for each value of x, there is a corresponding value of y. We say that such a pair of numbers satisfies the equation or it is a solution of the equation.
Activity 3.2
At a certain point, two small businessmen noted that their bank accounts had 110 and 600 dollars respectively. The first man decided to increase his account by 30 dollars every year for n years. th second decreased his bank account balance by 40 dollars every year for n years.
After n years, the bank balance in each year was p dollars. Assuming that no other transactions were done in these accounts,
(i) Express p in terms of n in each case
(ii) Use each equation to make a table of values for n and p for each person, for values of n not more than 10 years.
(iii) Do you think there will be a time when their bank balances will be equal? If yes, when and how much will it be?
(iv) How do you describe the relations in (ii) above.
Observations
From this activity you should have observed that:
(i) The two situations can be represented by the equations
p = 30n +110 and p = 600 – 40n.
(i) Tables 3.2 and 3.3 below show the required tables for p =110 + 30n, see Table 3.2.

After 7 years, both account balances will be 320 dollars. The equations p = 30n + 110 and p = 600 – 40n are called simultaneous equations because there are two distinct variables n and p.
The solution set of the equations are n = 7 and p = 320 as seen from the table
Simultaneous equations are a set of equations with same set of two or more variables that collectively satisfy all the equations.
Example 3.1
Show that the following pairs of numbers satisfy the equation x + 3y = 18.
(a) (0, 6) (b) (3, 5) (c) (–3, 7) (d) (21, –1)
Solution
In these pairs of numbers, the first number represents the value of x, while the second one represents the value of y.
(a) x + 3y = 18 : (0, 6)
LHS = 0 + 3 × 6
= 0 + 18
= 18
∴ LHS = RHS
(b) x + 3y = 18 : (3, 5)
LHS = 3 + 3 × 5
= 3 + 15
= 18
∴LHS = RHS (c) x + 3y = 18 : (–3, 7)
LHS = –3 + 3 × 7
= –3 + 21
= 18
∴LHS = RHS (d) x + 3y = 18 : (21,–1)
LHS = 21 + (3 × –1)
= 21 + –3
= 18
∴LHS = RHS
In each case, the left hand side of the equation is equal to the right hand side; all the given pairs of numbers satisfy the equation.
Exercise 3.1
In Questions 1 and 2, the given pairs of numbers are such that the first number represents the value of x, while the second represents the value of y.
1. Show that the given pairs of numbers satisfy the equation y + 2x = 12.
(a) (1, 10) (b) (5, 2)
(c) (0, 12) (d) (8, –4)
2. Which of the following pairs of numbers satisfy the equation 3x + 4y = 7?
(a) (1, 0) (b) (1, 1)
(c) (5, –2) (d) (2, 2)
(e) (7, 3) (f) (9, –5)
3. If x and y represent whole positive numbers, give the first four pairs of numbers which satisfy the equation 3x + y = 15. 4. Copy and complete table 3.4 below for pairs of numbers that satisfy the equation x + 3y = 17.

5. If x and y are restricted to positive whole numbers, give six pairs of numbers that satisfy each of the following equations:
(a) 3x – y = 8
(b) x – 2y = 1
Is there any pair of numbers that satisfies both equations? If yes, state the pair.
3.2 Solving simultaneous equations
3.2.1 Graphical solutions of simultaneous equations
Activity 3.3
1. Draw on the same axes the groups of the equations.
x + y = 4 ...... (i)
2x + y = 5 ........ (ii)
2. Read the x and y coordinates of the point of intersection of the two lines.
3. Substitute these x and y values in each of the equation and test whether they satisfy the equations or not. What do you notice.
4. What can you say about the coordinates of intersection of two graphs in relation to the solutions of the two equalities.
From Activity 3.3, we have seen that linear graphs can be used to determine the values of the variables that satisfy a system of equations. Simultaneous linear equations in two unknowns may be solved by plotting the two straight lines then note the coordinates of the point of intersection. If for example, the coordinates of the point of intersection are (2, 3), then we say the solution of the linear simultaneous equations is x = 2, y = 3.
Consider the pair of simultaneous equations
y + 2x = 6
x – y = 3
Table 3.5 (a) below gives some of the ordered pairs of values that satisfy the equation
y + 2x = 6.Table 3.5 (b) gives pairs of values for the equation x – y = 3.

The ordered pair x = 3, y = 0, i.e. (3, 0) appears in both tables; and it is the only pair that does so. It is the only pair of values that satisfies both equations simultaneously (i.e. at the same time). Hence, the solution of the simultaneous equations is x = 3, y = 0.
The result can be obtained by drawing the graphs of the two lines as in Fig. 3.1. The two lines intersect at the point (3, 0). This is the only point that is on both lines.

The coordinates of the point at which the lines intersect give the solution of the simultaneous equations they represent.
Example 3.2
Solve graphically the simultaneous equations
x – 2y = –1 2x – y = 4
Solution
Step 1:
Make a table of values for each equation. Three pairs of values are sufficient for each (Table 3.6 (a) and (b)).

Step 2:
Choose a suitable scale and plot the points. Draw the lines. Extend if necessary, so that they intersect. Fig. 3.2 shows the graphs of the two lines.

Step 3:
Read the coordinates of the point of intersection. From the graph, the lines intersect at (3, 2). The solution of the simultaneous equations is x = 3, y = 2
Exercise 3.2 Solve graphically the following pairs of simultaneous equations.
1. x + y = 3 2. 2x = 3 + y
y = 3x – 1 7x + 2y = 16
3. 2x – y = 3 4. 3x + 2y = 0
2y = –x + 14 5x + y = 7
5. y + 1 = 2x 6. 3y – x = 4
2y + x + 7 = 0 2x – 5y = –7
7. 3x + 4y = 3.5 8. 2y + 3x = –5
7x – 6y = 0.5 3y + 2 = x
9. 4x – y = 2 10. 4x – 2y = 4
6x + 4y = 25 2x – 3y = 0
11. 2x – y = –1 12. 12x + 6y = 12
x – 2y = 4 2x – 3y = –2
13. 10x – l0y = 3 14. x – y = –1
2x + 3y = 3.1 4x – 8y = 4
15. 2y + 2 = 3x – 6 16. 5x – 2y = 1
(y – 1) /2 +( x – 3)/ 2 = (x + 3)/ 3 4x + 3y = –10.7
Classification of simultaneous equations
Activity 3.4
Using a graph paper, draw on separate graphs the pairs of lines whose equations are
(a) 2x – y = –1
x – 2y = 4
(b) x – 2y = –1
2x – 4y = –2
(c) 2x – y = –4
4x – 2y = 6
In each case describe completely the resulting graphs
Observation
Fig 3.3 shows the graphs of lines whose equations are x – 2y = 0 and 2x + y = 5 The two lines intersect at point (2, 1). thus x = 2 and y = 1 satisfy the two equations simultaneously. Therefore, we say there is one unique solution to the two equations.

Such a pair of equations is classified as consistent and independent. Fig 3.4 shows the graph of the lines whose equations are x – 3y = –1 and 2x – 6y = –2.

The lines representing the two equations are coincident i.e. all the points on one line lie on the second line. We say that there is an infinite number of solutions to the two equations you should have observed that one equation is a multiple of the other. Such equations are classified as consistent and dependent.
Fig 3.5 above shows the graphs of x – y = 4 and x – y = 2. The lines do not touch and therefore no value of x or y can satisfy both the equations. They have no solutions and therefore are classified as inconsistent/ incompatible.
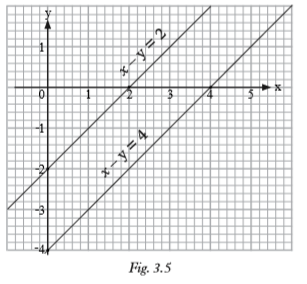
Fig 3.5 above shows the graphs of x – y = 4 and x – y = 2. The lines do not touch and therefore no value of x or y can satisfy both the equations. They have no solutions and therefore are classified as inconsistent/ incompatible.
Note that the lines are parallel and therefore will never meet. Therefore, no pair of values of x and y can satisfy both equations.
Summary
(i) Two or more simultaneous equations have a unique solution if the lines representing them intersect.
(ii) Two equations have an infinite solution if their lines are coincident.
(iii) Equations have no solutions if the lines representing them are paralle
Exercise 3.3
For each question in this exercise, draw on the same axis and classify the sets of equations. In each case state the values of x and y that satisfy the equations simultaneously, where possible.
1. 3x + 2y = 6 and x – y = 2
2. 2x – 3y = 6 and 2x – 3y = –15
3. 2x – y = 2 and x + y = 4
4. x + 2y = 6 and x + 2y = 8
5. 3x – 2y = 5 and 2x - y = –1
6. 2x – 3y = 5 and 2x - y = –1
7. x – 3y = 4 and x – 3y = 8
8. 2x – y = –3 and x = y = 0
9. x – y = + 8 and –3x + 3y + 24 = 0
10. y – 2x = –3 and –2y + 4x = 6
3.2.2 Solving simultaneous equations analytically
From the foregoing work, we have seen that simultaneous equations can be solved graphically. However, for some equations it is not possible to obtain a totally accurate graph so that the reading at the point of intersection is not accurate either. Therefore, we use alternative algebraic methods of solving simultaneous equations.
These methods include:
i. Substitution method
ii. Elimination method
iii. Comparison method and
iv. The Cramer’s rule
3.2.2.1 Solving simultaneous equations by substitution method
Activity 3.5
Consider the equations:
2x + y = 7 ....... (i)
3x – 2y = 0 ....... (ii)
Using equation (i), express y interms of x. In equation form and label this equation (iii) i.e
y = ____ ... (iii)
1. Substitute the value of y (in terms of x) from equation (iii) into equation (ii) to have equation (iii) in terms of x only.
2. Solve equation (iii) to get the exact value of x.
3. Substitute the exact value of x in equation (i) or (iii) to get the value of y.
4. Confirm whether the values of x and y satisfy both equations (i) and (ii)
5. What value is given to this method of solving simultaneous equations?
Consider the following equations
3x – 5y = 23.............(1)
x – 4y = 3..............(2)
Using equation (2), add 4y to both sides:
x + 4y = 3 x – 4y + 4y = 3 + 4y
x = 3 + 4y..............(3)
In equation (3), x is said to be expressed or solved in terms of y. To express the equation 3x – 5y = 23 as an equation in one variable, substitute
(3 + 4y) in place of x in equation (1):3x – 5y = 23 becomes
3(3 + 4y) – 5y = 23
9 + 12y – 5y = 23
9 + 7y = 23
7y = 14
y = 2
Substituting y = 2 in equation
(3) we get;
x = 3 + 4(2)
= 3 + 8
∴ x = 11
Use equation (1) to check that the solutions are correct. This method of solving simultaneous equations is called substitution method.

Solution
Multiply (1) by 12 to remove the denominators.
4x + 4y – 3x + 3y = 8x + 7y = 8..............
(3) Multiply (2) by 12 to remove the denominators.
8x – 12 – 6y – 9 = –198x – 6y = 2..............
(4) Using (3), express x in terms of y: x = 8 – 7y..............
(5) Substitute (5) in (4) to eliminate x:
8(8 – 7y) – 6y = 2 64 – 56y – 6y = 2 64 – 62y = 2
62y = 62
y = 1
Substitute y = 1 in (5):x = 8 – 7(1)
= 8 – 7
x = 1
Substitute y = 1 and x = 1 in equation (1) or (2) to check that the solutions are correct.
Solution is s = {(1,1)}To solve simultaneous equations by substitution method:
1. First decide which variable is easier to substitute.
2. Using the simpler of the two equations, express the variable to be eliminated in terms of the other i.e. make it the subject of the formulae.
3. Using the other equation, substitute the equivalent for the variable to be removed.
4. Solve for the remaining variable.
5. By substitution, solve for the other unknown.
6. By substitution, check whether your solutions satisfy the equations.
Exercise 3.4
In questions 1 to 4, find y in terms of x.
1. 4x – y = 12 2. 2x + 5y = 10
3. 1 3 x– 4y = 16 4. 3x – 1 4 y = 10
In questions 5 to 8, express x in terms of y.
5. x – 5y = 3 6. 9x + 4y = 0
7. 1/3 x = 1/6 (y – 1) 8. 1/3 (x – 2) – y = 2
Use substitution method to solve the following pairs of simultaneous equations. 9. a + b = 3 10. w – 2z = 5
4a – 3b = 5 2w + z = 5
11. x + y = 0 12. x = 5 – 2y
2y – 3x = 10 5x + 2y = 1
13. 4x – 3y = 1 4. 6a – b = –1
x – 4 = 2y 4a + 2b = –6
15. 4m – n = –3 16. 5q + 2p = 10
8m + 3n = 4 3p + 7q = 29
17. 1/v + 1 u = 1/5 18. 2s – 4t = 8 1
v – 1 u = 2 5 3s – 2t = 8
19. 2x – 4y + 10 = 0 20. 1/2 a – 2b = 5
3x + y – 6 = 0 1/2 a + b = 1
21. 2y/5 + z/3 = 2 (2/3) 22. (a – 1) /2 + (b + 1)/5 = 1/5
y = 2(z + 1) a + b 3 = b – 1
3.2.2.2 Solution of simultaneous equations by elimination method
Sometimes the substitution method gives rise to awkward fractions when attempting to express one variable in terms of the other. In such a situation it is advisable to use the method of addition or subtraction of the given equations. This method is also called the elimination method.
Activity 3.6
Consider the equations
3x - 2y = 11………………..(1)
5x + 2y = 29………………..(2) (
i) Add the left hand sides of equations (1) and (2).
(ii) Add the right hand sides of equations (1) and (2).
(iii) Equate the results of (i) and (ii) above to obtain equation (3). What do you notice?
(vi) Solve equation (3).
(v) By substitution use the solution of equation (3) to obtain equation (4).
(vi) Solve equation (4).
Summaries your findings
From activity 3.6 above you should have observed the following: Since left hand side of each equation equals its right hand side, adding left hand sides of (1) and (2) equals the result of adding the corresponding right hand side
i.e. 3x – 2y = 11
5x + 2y = 29
8x + 0 = 40
In doing this addition, the term in y disappears leaving a simple equation in x Thus 8x = 40 x
= 40/8
= 5
Substituting 5 for x in equation 1,
3x – 2y = 11 becomes 3(5) – 2y = 11
15 – 2y = 11
–2y = –4
y = –4/ –2
= 2
The solution is x = 5, y=2 This process of getting rid of one of the variables is called elimination method. Now consider the equations
2x - 5y = 27……………(1)
2x + 3y = 3……………..(2)
Follow steps similar to the ones used in the above activity to eliminate one of the variables and summarise your findings.
Observations
In the equations, we can eliminate the terms in x by subtraction.
2x – 5y = 27……………….(1)
2x + 3y = 3………………….(2)
-8y = 24
By substraction, the term in x disappear so
–8y = 24
y = 24/–8y = –3
Substituting -3 for y in equation
(2) 2x + 3y =
3 becomes 2x + 3(–3) = 3
2x – 9 = 3
x = 12/2 = 6
The solution is x = 6, y = –3
To use elimination method,
1. Decide which unknown is easier to eliminate.
2. Solve for the remaining unknown.
3. When one unknown has been found, obtain the other by substituting in the easier of the original equations.
Example 3.4
Solve the simultaneous equations
3x + 2y = 12.............(i)
4x – 2y = 2...............(ii)
Solution
If we add equation (i) and (ii), we get a simpler equation in one unknown. We do this by adding LHS of equation (i) to the LHS of equation (ii) and the RHS of equation (i) to RHS of equation (ii).
Thus,

In any of the original equations, we can use 2 instead of x, i.e. we can substitute 2 for x to get the value of y.
Using equation (1), 3x + 2y = 12 becomes
3 × 2 + 2y = 12
6 + 2y = 12
2y = 6
y = 3
The solutions of the simultaneous equations are therefore x = 2 and y = 3 or Solution is s = {(2,3)}
Example 3.5 Solve the simultaneous equations
2x + 4y = –12 ......... (i)
5x + 4y = –33 ......... (ii)
Solution
We do this by subtracting LHS of equation (ii) from LHS of equation (i) and the RHS of equation 2 from RHS of equation (i). If we subtract equation (ii) from equation (i) we get a simple equation in one unknown.

x = –7 To make the given equations true, x must be equal to –7. Now, in equation (i) or (ii) we use –7 instead of x to solve for y.
Thus,
2x + 4y = –12 becomes
(2 × –7) + 4y = –12
i.e. –14 + 4y = –12
4y = 2
y = 1/2
Use –7 for x in equation (2) and confirm
that y = 1/2 .
Solution is s = {(–7,1 2 )}
In Examples 3.4 and 3.5 we were able to get rid of one of the variables by addition or subtraction, because the coefficients of one of the unknowns in both equations had either the same sign or opposite sign. You should note that if the coefficients of the variable to be eliminated have the same sign, we subtract the equations, otherwise add the equations. This method of getting rid of one of the variables by addition or subtraction is known as the elimination method.
Exercise 3.5
In this exercise, examine each of the pairs of equations carefully, and decide when to add and when to subtract. Then solve the simultaneous equations.
1. 3x – y = 8 2. 5x – y = 18
x + y = 4 3x + y = 14
3. 3x – 2y = 0 4. 4x – 3y = 16
x – 2y = –4 2x + 3y = 26
5. x + 2y = 11 6. 3x + 2y = 12
x – 2y = 3 4x + 2y = 2
7. 3a – 2b = 11 8. r – s = 1
2a – 2b = 10 –r – s = 13
9. 2m – n = 11 10. 5x + 3y = 9
3m + n = 49 –5x + 2y = 1
11. 7x – 2y = 29 12. 10x – 3y = 36
7x + y = 38 x + 3y = 18
13. 5x – 6y = 16 14. x + 6y = –5
7x + 6y = 44 x – 9y = 0
15. 6x + 4y = 24 16. 5x + 3y = 77
7x – 4y = 2 15x – 3y = 3
Solving complex simultaneous equations by elimination method
Sometimes it may not be obvious which unknown to eliminate or how to eliminate. Consider the equations:
3x – 2y = 8
x + 5y = –3
In this pair of equations, we cannot eliminate any variable by simple addition or subtraction. We must first make the coefficient of x or y the same in both cases. Then we may be able to add or subtract as before. The examples that follow illustrate this process
Example 3.6
Use elimination method to solve the simultaneous equations
3x – 2y = 8
x + 5y = –3
Solution
In this case we choose to eliminate x.
3x – 2y = 8.............(i)
x + 5y = –3.............(ii)Leave (i) as it is: 3x – 2y = 8 ....(i)
Multiply (ii) by 3: 3x + 15y = –9 ...(iii)
Subtract (iii) from (i) –17y = 17
y = –1 Use –1 instead of y in (i)
3x – 2 ( –1) = 8
3x + 2 = 8
3x = 6
x = 2 Check in equation (i):
LHS = 2 + 5 (–1) = 2 – 5 = –3,
RHS = –3
Example 3.7
Solve the simultaneous equations
3x + 4y = 10.............(i)
2x – 3y = 1...............(ii)Solution
Let us eliminate y in this case.
Multiply (i) by 3: 9x + 12y = 30 ...(iii)
Multiply (ii) by 4: + 8x – 12y = 4 ...(iv)
Add (iii) to (iv): 17x
= 34
x = 2
Substitute x = 2 in (i): 3 × 2 + 4y = 10
6 + 4y = 10
4y = 4
y = 1
Check in equation
(ii): LHS = (2 × 2) – (3 × 1) = 4 – 3 = 1,
RHS = 1
Solution is s = {(2,1)}
Example 3.8
Solve the simultaneous equations
2x + 7y = 15 5x – 3y = 19
Solution
2x + 7y = 15...........(i) 5x – 3y = 19...........(ii)
Eliminate x: (i) × 5: 10x + 35y = 75...........(iii)
(ii) × 2: 10x – 6y = 38 ...........(iv)
(iii) – (iv): 41y = 37
y = 37/41
Note that since y is a fraction, substituting y = 37 41 in equation (i) or (ii) would make work more difficult. We obtain x by eliminating y (as was done for x)
i.e.
(i) × 3: 6x + 21y = 45.............(v)(ii) × 7: 35x – 21y = 133............(vi)
(iii) + (vi): 41x = 178
∴x = 173/41 = 4 (14/41)
Hence, the solution is x = 4 (14/41) , y = 37/41
Solution is s = {(4(14/41), 37/41)}
To solve simultaneous equations by elimination method:
1. Decide which variable to eliminate.
2. Make the coefficients of the variable the same in both equations.
3. Eliminate the variable by addition or subtraction as is appropriate.
4. Solve for the remaining variable.
5. Substitute your value from 4 above in any of the original equations to solve for the other variable.
Exercise 3.6
Solve the simultaneous equations.
1. 3x + 2y = 16 2. 2x – y = 7
2x – y = 6 5x – 3y = 16
3. 2x + 3y = 27 4. 3x + 2y = 13
3x + 2y = 13 2x + 3y = 12
5. x = 5 – 2y 6. x + y = 0
5x + 2y = 1 2y – 3x = 10
7. 3x + y = 12 8. 4y – x = 7
2x – 3y = 8 3y + 4x = –9
9. 5n + 2m = 10 10. 2x – 4y = 8
3m + 7n = 29 3x – 2y = 8
11. 2x + 3y = 600 12. 6a – b = –1
x + 2y = 350 4a + 2b = –6
13. w – 2z = 5 14. 2x – 4y = –10
2w + z = 5 3x + y – 6 = 0
15. 9x + 3y = 4 16. 2x – y = 6
3x – 6y = –1 3x + 2y = 18
17. 3x – 4y = –5 18. 2x – 7y = –10
2x + y = 6 9y + 5x = 6
3.2.2.3 Comparison method
We have just learned to solve simultaneous equations graphically, by substitution and by elimination methods. Another method of solving simultaneous equation is the comparison method.
Activity 3.7
Consider the equations (i) x + y = 5 (i)
(ii) 2x – y = 4 (ii)
1. Using equation (i) x + y = 5, solve for x in terms of y to obtain equation (iii)
2. Solve for x in terms of y using the equation (ii) 2x – y = 4 to obtain equation (iv)
3. Equate equation (iii) to equation (iv) to obtain equation (v)
4. Now solve equation (v) to obtain the value of y.
5. Using the value of x in equation (i) find the value of x
Consider the equation x + y = 6 (i)
x – y = 2 (ii)
We can solve these equations using the substitution method twice as was demonstrated in activity 3.7 above. Using equation (i) find y in terms of x
x + y = 6 …… (i)
y = 6 – x ………(iii) …………
solve for y in terms of x
x – y = 2 ........(ii) –y = 2 – x
y = x – 2 ………………… (iv)
solve for y in terms of x
6 – x = x – 2 ………….
Comparing the values of y in terms of x –2x = -8
x = –8 ÷ - 2 = 4
Using equation (i) substitute 4 for x to find y 4 + y = 6 y = 2
∴Solution set is (x, y) = {(4, 2)}
Note:
The equation x + y = 6 and x – y = 2 can also be solved simultaneously using the approach of intersecting lines.
This method makes the following assumptions
(i) The lines represented by x + y = 6 and x – y = 2 are distinct and intersect at only one point
(ii) The variables x and y are real numbers.
Let any ordered pair(x, y) lie on the line L1 x + y = 6 be defined as l1: x + y = 6, (x, y) ∈ (Real numbers) In L1, y = 6 – x hence,
the ordered pair (x, y) = (x, 6 – x)
Similarly let any ordered pair(x, y) that lies on l2 x – y = 2, be defined as l2: x – y = 2, (x, y) ∈ (Real numbers) In this case x – y = 2
hence the ordered pair (x, y)=(x, x – 2)
At the point of intersection, (x, x – 2) = (x, 6 – x) ⇒ x – 2 = 6 – x But, x + y = 6 2x = 8 4 + y = 6 x = 4
y = 2
The solution is s = {(4,2)}
Example 3.9
Use the method of comparison to solve the equation
x – 2y = 9 3y – x = – 11
Solution
Let x – 2y = 9 .............................(i)
– x + 3y = – 11 ........................(ii)
And the variables to compare be From equation (i)
x = 9 + 2y .........(iii)
Equation (ii) x = 11 + 3y ..............(iv)
Comparing (iii) and (iv)
9 + 2y = 11 + 3y
2y – 3y = 11 – 9
–y = 2
y = –2
Using equation (iii),
x = 9 + 2y
When y = – 2,
x = 9 + 2(–2) = 9 – 4
x = 5
(x, y) = (5, – 2) ⇒ x = 5, y = –2
Solution is s = {(5, –2)}
Exercise 3.7
Use the comparison method to solve the simultaneous equations. All variables represent real numbers.
1. Solve for x in terms of y in
(a) x + 2y = 6 (b) x – 3y = 4
(c) 3x – 6y = 2 (d) 2x – y = 6
2. Solve for y in terms of x in:
(a) x + y = 4 (b) 3x – y = 2
(c) 2y – x – 8 – 0 (d) 2x = y + 4
3. Use the method of comparison to solve the simultaneous equations.
(a) 2y = 2x – 2
2y = 4x – 6
(b) x = –2y + 3
x = 3y – 7
(c) y = –3 – 2x
y = 2x – 1
4. Solve by comparison method
(a) 3x = y + 11
y = x – 5
(b) 5x – y = – 13
y – 3x = 9
(c) 3y + 2 = x
x + 2y = 8 – y
(d) x + 3y = 3
2y – x – 3 = 0
5. Solve the simultaneous equations:
(a) 2x = 3y + 2
2x = 6 + y
(b) 3 – y = 3x
3x = 2y + 3
(c) 2x + 16 = 4y
4y – 3x = 18
(d) 2x – 5 = 3y
5x – 2y = 18
6. Two lines are given by 2x + y = 5 and 4x – y = 1. Find the coordinates of the point of intersection. Hence state the solutions of the simultaneous equations 2x + y = 5 and 4x – y = 1
7. Solve the simultaneous equations:
(a) 2y + 3x = – 5
3y + 2 = x
(b) 12x + 6y = 12
2x – 3y = – 2
3.2.2.4 Cramer’s rule
Activity 3.8
1. Research the following from reference books and the internet. • Matrix and the order of matrix. • The notation of representing a matrix • How to work out the determinant of 2 × 2 matrix.
2. Discuss with your partner how to calculate the determinant of the matrix
 Consider the equation;x – 3y = 4…...........(i)5x + 7y = 8…........(ii)This set of equations can also be referred to as a system of equation of order 2 × 2. 2 × 2 means two equations with two unknown.Using a given system, we can use the coefficients of the unknowns to obtain a pattern of numbers enclosed within a pair of brackets. For example, using the equations.x – 3y = 45x + 7y = 8The coefficients of x and y are 1 and 5, and – 3 and 7 in the two equations respectively
 The coefficients of equations in matrix form A matrix is made up of rows and columns
 The numbers in a matrix of coefficients can be combined using operations such as multiplication and subtraction to obtain a special value that we can use to solve a system of equation.The value is called a determinant.Consider the system of equationsa1x + b1y = c1a2x + b2y = c2 Given that a1, a2, b1, b2, c1 and c2 are constants,
 Activity 3.9Given the simultaneous equation4x – 3y = 23x + y = -1(i) State the matrix of the coefficients. Write the matrix in the determinant notation(ii) Calculate the determinant of the matrixNote: The number on the right side of the equations can also represent as a matrixin a column form as a1a2The method of using determinant to solve simultaneous equations is called theCramer’s rule.Using the system of equationsa1x + b1y = c1a2x + b2y = c2We can write the equation in matrix
 This formula is valid whenever the system of equations has a unique solution.Example 3.10Use the Cramer’s rule to solve the simultaneous equation
3x – y = 7–5x + 4y = –5
 Note:If the determinant of the coefficient matrix is 0, either:(i) The equations have an infinite solution or(ii) The equations have no solutions. To determine which is which we solve the equations by any other method.Exercise 3.8Use cramers rule to solve the equations below:1. 2x + y = 26x – 3y = 02. 9x – 4y = 18x + 2y = 23. 3x – 2y = 115x + 2y = 294. 7y – 2x = 43y – x = 15. 2x – 5y = –33x + 4y = 16. y + 2x = 2y – 21x = 127. 2x + 5y = 83x + 4y = 5
8. 3y – x = 112y – 3x = 59. 4x – 3y = 23x + y = –110. 5x – y = 33y – 8x = 53.2.3 Forming and solving simultaneous equations from real life situationsActivity 3.10Use the knowledge you have acquired on solving simultaneous equations.1. Determine the two numbers in the following scenario Esther picked two numbers when she doubted the first one and added to the second one, she got 18. When she doubled the first one and subtracted the second one, she got 14. Which two numbers did Esther pick?2. Identify situation in real life that involved simultaneous equations.3. Form pairs of simultaneous equations from real life situations and solve them.Consider the following situation: Two years ago, a man was seven times as old as his son. In three years time, he will be four times as old as his son. Find their present ages.If the present age of the man is m and the present age of the son is s years, then two years ago, the man’s age was (m – 2) years, and the son’s age was (s – 2) years.∴ m – 2 = 7(s – 2)..............(1)In three years time, the man’s age will be (m + 3) years.In three years time, the son’s age will be (s + 3) years.∴ m + 3 = 4(s + 3)..............(2)Equations (1) and (2) can be written simply asm = 7s – 12............(3)m = 4s + 9..............(4)Since the LHS are equal, the RHS are also equal.∴ 7s – 12 = 4s + 9 3s = 21s = 7 Substituting 7 for s in (3):m = 7 × 7 – 12= 49 – 12= 37The present age of the man is 37 years. The present age of the son is 7 years. Thus, we have formed and solved simultaneous equations from the given situation.Example 3.11A two digit number is such that its value equals four times the sum of its digits. If 27 is added to the number, the result is equal to the value of the number obtained when the digits are interchanged. What is the number?SolutionLet the tens digit be x.Let the ones digit be y.∴ the value of the number is 10x + y and the sum of the digits is x + y.
10x + y = 4(x + y)
10x + y = 4x + 4y6x = 3y2x = y2x – y = 0................(1)The value of the number formed by interchanging the digits is 10y + x.∴ 10x + y + 27 = 10y + x.
9x – 9y + 27 = 09x – 9y = –27x – y = –3................(2) The original number is 36. Check by using the information in the question.Exercise 3.91. The sum of two numbers is 10, and their difference is 6. Make a pair of equations and solve them simultaneously to find the numbers.2. Mary is one year older than June, and their ages add up to 15. Form a pair of equations and solve them to find the ages of the girls.3. Two books have a total of 500 pages. One book has 350 pages more than the other. Find the number of pages in each book.4. A bag contains 50 FRW coins and 100 FRW coins. There are 14 coins in all, and their value is 1050 FRW. Find the number of each type of coin.5. Two numbers are such that twice the larger number differs from thrice the smaller number by four. The sum of the two numbers is 17. Find the numbers.6. If 5 is added to both the numerator and
denominator of a fraction, the result is 4 7 . If 1 is subtracted from both the numerator and denominator, the result is 2 5 . Find the fraction.7. The cost of 3 shirts and 2 jackets is 14 400 FRW. If 4 shirts and a jacket cost 15 200 FRW, find the cost of two jackets and a shirt.8. A wire 200 cm long is bent to form a rectangle. The length of the rectangle is 3 cm longer than the width. Find the dimensions of the rectangle.9. A man is 22 years older than his son, and their total age is 48 years. Form a pair of equations and solve them to find the ages of the man and his son.10. The length of a rectangle is 2 m more than its width, and the perimeter is 8 m. Find the length and breadth of the rectangle.3.3 Inequalities3.3.1 Review of basic operations on inequalitiesIn unit 3, S1, we defined inequalities and symbols, and solved simple inequalities. We learnt that an inequality is a mathematical statement describing a number in relation to another, regarding their sizes.Activity 3.111. Using the skills you acquired in S1, do the following activity2. Solve the inequalities (a) x + 1≤ - 2x (b) x – 6 > 12 + 3x3. Illustrate your solutions on separate number linesRemember: We can do any of the following without altering an inequality: Note:If ab is negative, then one of the two numbers is negative i.e. ab < 0, either a < 0 and b > 0 or a > 0 and b < oExample 3.12Solve the following inequalities (a) 2x – 6 < 14 (b) 3x + 2 > 11Solution(a) 2x – 6 < 14 ⇒ 2x – 6 + 6 < 14 + 6 (Adding 3 to both sides) ⇒ 2x < 20 Thus, x < 10 is the solution of the inequality 2x – 6 < 14.(b) 3x + 2 > 11 ⇒ 3x + 2 – 2 > 11 – 2 (subtracting 2 from both sides) ⇒ 3x < 9 ⇒ x >Example 3.13Solve the following inequality. 3x – 3 ≥ 6
Solution3x – 3 ≥ 6 ⇒ 3x – 3 + 3 ≥ 3 + 6 ⇒ 3x ≥ 9 ⇒ 3x/3 –– ≥ 9/3 – (Dividing both sides by 3) ⇒ x ≥ 3Example 3.14Solve the inequality 3 – 2x ≥ 15.Solution3 – 2x ≥ 15⇒ 3 – 2x – 3 ≥ 15 – 3⇒ –2x ≥ 12⇒ –2x/–2 ≤ 12/–2⇒ x ≤ –6Exercise 3.10Solve the following inequalities and represent the solutions on number lines.1. (a) –x + 4 > 11(b) 3x – 6 ≤ 5 + 2x2. (a) –2x – 8 ≤ 4 – 4x(b) 2x + 4 > 19 – 5x3. (a) –3 > 4x – 2x(b) –7 ≤ 5x + 124. (a) 3 – 2x < 5x(b) –4 – 5x ≥ –115. (a) 1 3 – x – 3 > –4(b) 1 5 – x + 2 < 1x6. (a) –4 > – 1 7 – x + 2(b) – 2 3 – x + 4 ≤ –6x7. (a) 4m – 3 < –7m(b) –2m + 1 ≥ 5m – 108. -3(2 + x)+ 2(x – 3) ≤ 259. 4 – 4p ≥ –2 – 5p – 1210. 1/8 t < 4 + 3/8 t3.3.2 Compound statementsActivity 3.12Suppose a,b and c are real numbers such that a < b and b < c1. Name three such numbers2. Write the inequalities a < b and b < c as a single inequality3. Write a numerical example of the inequality in(2) above.4. Draw a number line, and on it mark the relative positions of a, b and cSome examples of such numbers are 3, 4, 5, - 5, -2, 3 etc. if a < b, and b < c, we can say that a is the smallest c is the largest and b is the middle number we can write a < b < c similarly in 3, 4, 5 for example,3 < 4 < 5 a, b and c are such that a is to the left of b and b is to the left of cAny number to the left of another on a number line is less than it. a < b < c. Sometimes, two simple inequalities may be combined into one compound statement such as a < x < b. This statement means that a < x and x < b or x > a and x < b i.e. x lies between a and b.Example 3.15Write the following pairs of simple inequality statements as compound statements and illustrate them on number lines. (a) x ≥ –3, x < 3 (b) x < 1, x ≥ –2
 Exercise 3.11Write each of the following pairs of simple statements as a compound statement and illustrate the answer on a number line.1. (a) x < –2, x > –4(b) x > –3, x ≤ 0(c) x ≤ 5, x > –2(d) x ≤ 1, x ≥ –1(e) x > –1.5, x ≤ 0.5(f) x ≥ –2.5, x ≤ –1.82. (a) x > – 1/4 , x ≤ 0(b) x ≤ – 3/4 , x > –2( 1/4)(c) x >–3(1/2) , x < –2 (1/2 )(d) x <– 1/5 , x >– 2/3(e) x ≤ 0.75, x ≥ –0.75(f) x >–4(1/2) , x < 1/23.3.3 Solving compound inequalitiesActivity 3.13Consider the inequality3x + 4 < 2x + 8 < x + 31. Using the given inequality, make three simple inequalities.2. Solve the inequalities in (i)3. Represent your solutions on a number line4. State your solution as a single statement.• It is important to remember that if three numbers are such that a < b < c, then a < b, b < c and a < c.Let us use the inequality (3x – 2)< 10 + x < 2 + 5x to make three simple inequalities.• The required inequalities are:(i) 3x - 2 < 10 + x(ii) 10 + x < 2 + 5x(iii) 3x – 2 < 2 + 5x• Solutions are:(i) x < 6(ii) x > 2(iii) x > –2 respectively
 • From the number line, the solution set is between 2 and 6 exclusive. Any value of x chosen between 2 and 6 satisfies the inequalityNote this interval is common to all the three inequalities.Example 3.16Find the range of values of x which satisfy the inequality1/4(2x – 1) < 1/4(x + 3) < 3(x + 4)SolutionWe begin by first splitting the compound inequalities to create three simple inequalities. 1/4 (2x – 1) < 1/4 (x + 3) < 3 (x + 4)Separating and solving 1/4 (2x – 1) < 1/4 (x + 3)(Multiplying through by4) 2x – 1 < x + 3 x < 4and1/4 (x + 3) < 3 (x + 4)(Multiplying through by 4)x + 3 < 12x + 48–11x < 45 x > – 4 (1/11) (on dividing by –11)Also
 Example 3.17Find all the integral values of x which satisfy the inequality2(2 – x) < 4x – 9 < x + 11Solution2(2 – x) < 4x – 9 < x + 11Separating into three inequalities2(2 – x) < 4x – 9…(i)4x – 9 < x + 11…(ii)and 2(2 – x) < x + 11…(iii)Solving each equation2(2 – x) < 4x –9 ...(i)4 – 2x < 4x – 9–6x < –13x > 21 – 6(Dividing by –6)4x – 9 < x + 11...(ii)4x – x < 203x < 20x < 6(2/3)2(2 – x)< x + 11...(iii)4 – 2x < x + 11– 3x < 7x >– 7/3(Dividing by –3)x > –2(1/3)
 Exercise 3.121. Write down the integral values of x which satisfy the inequality–3 < 2x + 4 ≤ –3x + 9.2. Solve the following pair of simultaneous inequalities and illustrate the solution on a single number line: 4 – x < 5, 3 – 2x ≥ –53. Find the range of values of x which satisfy the following inequalities:(a) 2 ≤ 3 – x < 5(b) 20 – x < 5 + 2x ≥ x + 5(c) 2(2 – x) < 4x – 9 < x + 114. Solve the following inequalities and represent the solutions on a single number line.3 – 2x < 54 – 3x ≥ –85. Solve the following inequalities and represent the solutions on a single numberline.1 – 3x > –5, 3 – 2x < 96. Solve the simultaneous linear inequalities.(a) x – 4 < 3x + 2 < 2(x + 5)(b) – 5 ≤ 2x + 1 < 57. Solve the compound inequality 2(3x + 1) ≥ 4(x – 1) < 12 and represent your answer on a number line.8. Find the range of integral values of x for each of the inequalities:(a) 19 < 3(x + 2) < 35(b) 7x – 6 ≥ 4 ≤ 17 (x – 5)9. Solve the inequalities below and illustrate the solutions on the number line.(a) 2 < (x + 1) < –x – 3(b) 2(x + 3) ≥ 5(x – 4)10. Solve the following inequality sets and illustrate the solutions on the number line. Hence state all the integral values satisfying them.(a) –3x > 3 , –1/2 x – 2 ≤ 1(b) 12 – x ≥ 5 ≤ 2x – 23.3.4 Solving simultaneous inequalitiesActivity 3.1Consider the inequalities(i) 1– 3x > 10(ii) 3 – 2x < 15On the same number line,represent the two solutions. Write down the range of the values of x which satisfy both the inequalities.Solve the inequalities(i) 1 – 3x >7 – 5(ii) 3 – 2x < 9Now consider From activity 3.14 you should have observed an argument similar to the following:(i) x – 2 ≤ 3x + 43x – x ≥ –2 – 42x ≥ –6x ≥ –3(ii) 3x + 4 < 163x < 12x < 4The two solutions can represented on a number as:
 Any value of x between -3 inclusive and +4 satisfy the two inequalities i.e. -3 < x < 4. Thus the inequalities x – 2 < 3x + 4 and 3x + 4 < 16 are simultaneously satisfied by x:-3 < x < 4 they are simultaneous inequalities in one unknown. Inequalities that must be satisfied at the same time are called simultaneous inequalities.Example 3.18Solve the following pair of simultaneous inequalities.2(3 – x) < 10, 3(2x – 5) < 21
Solution
6 – 2x < 10⇒ –2x < 4
⇒ x > –2 …………(i) Also 6x – 15 < 21
⇒ 6x < 36
⇒ x < 6 …………(ii)Combining (i) and (ii), we have –2 < x < 6.Thus, x lies between –2 and 6. -2 < x < 6This is represented on a number line as in Fig. 3.9 Example 3.19Solve the inequality:x – 22 < –10 – x < –12 + xSolutionx – 22 < –10 – x < –12 + xSplit the inequality into two simultaneous inequalities as:x – 22 < –10 – x …………(i)
and –10 – x < –12 + x …………(ii)Solving each inequality separately.
(i) x – 22 < –10 – x⇒ 2x < 12⇒ x < 6 (Dividing by 2)
(ii) –10 – x < –12 – x⇒ 2 < 2x
⇒ 1 < x (dividing by 4) Exercise 3.13Solve the following simultaneous inequalities and represent each solution on a number line.1.(a) 2x < 10, 5x ≥ 15(b) 3x ≤ 9, 2x > 02.(a) x + 7 < 0, x – 2 > –10(b) x ≥ 3, 2x – 1 ≤ 133.(a) 4x – 33 < –1, –2 < 3x + 1(b) 2x – 5 < 22 ≤ 5x – 64. (a) –3x + 4 > –8 – x > –2 – 7x(b) 4x + 2 < 1x + 8 < 25x – 13.3.5 Solving inequalities involving multiplication and division of algebraic expressionsIn this section we will learn how to solve inequalities of the form A.B > 0, A.B ≥ 0, A.B < 0, A.B ≤ 0, > 0, / B ≥ 0, A/B < 0 and A/B ≤ 0Activity 3.15• Work individually• Solve the equation to find the possible values of x that make the statement true (x + 30 (x – 2) = 0• Given that x and y are real numbers, find some possible pairs of numbers that make the following expressions true(i) xy = 0(ii) xy/ y = 0Consider the inequality(x – 2)(x – 1) < 0 This statement can only be true if:1. (x – 2) > 0 and (x – 1) < 0 or2. (x – 2) < 0 and (x – 1) > 0 Remember less than zero means negative.
 From the table, we see that any value between 1 and 2 satisfies both the inequalities.∴ Solution is x: 1 < x < 2Example 3.20Solve the inequality (x + 1)(2x – 5) < 0
 The sign table below will help us to identify the appropriate solution of the inequality
 Therefore not suitable.3) But when x between -1 and 2.5, (x + 1) (2x – 5 <0 ∴ the value of x between -1 and 2.5 satisfies the inequality. Any value of x between – 1 and 2.5 satisfies the inequality. The answer is stated – 1 < x < 2.5 i.e s = ] –1, 2.5 [Example 3.21Solve the inequality (x + 3)(2x – 1) > 0
 When x is greater than 0.5, (x + 3) (2x – 1) > 0When x is less than -3, (x + 3) (2x – 1) > 0When x lies between –3 and 0.5,(x + 3)(2x – 1) > 0hence not suitable∴There are two sets of x which satisfy(x + 3) (2x – 1) > 0 i.e. when x < –3 andwhen x > 1/2 The solution is x:x < – 3 and x > 1/2
 In this case, any value of x such that x > 2 satisfies the inequality

 Exercise 3.14Solve the inequalities in this exercise and state the solution as a single inequality where possible.
 3.3.6 Forming and solving inequalities from real life situationsIn this section we shall concentrate on choosing appropriate symbols to transform given situations into mathematical statements hence solve the resulting inequalitiesActivity 3.16(a) Work individually.(b) Think of a number x.(c) Multiplying the number by five and then add six to your result.(d) Write down an expression in terms of x to represent your result in part (c).(e) Consider the same number x and multiply it by six and then add five.(f) Write down a second expression in x to represent your result in part (e).(g) Given that the result in (e) is greater than the result in (d) write down an inequality to represent this situation.From your activity, discuss and compare your results with those of other members of your class. Now look at the example below and use it to refine your skills on manipulation inequalities from a given situation.Example 3.24A certain number multiplied by 3 is less than the same number added to 3. Form the inequality and find the range of integral values that the number can take.Let y be the number. Then y × 3 < y + 3 is the required inequality.Solving this we have:y × 3 < y + 3 ⇒ 3y < y + 33y – y < y – y + 32y < 3y < 3/2The range of values the number can have is less than 3 2 i.e. the integral values are {1,0,-1,-2,-3---}Example 3.25The result of multiplying a number by 3 and then subtracting 5 is less than multiplying the number by 2 and adding 9. Form an inequality in one unknown and solve it.SolutionLet x be the number.Then, 3x – 5 < 2x + 9⇒ 3x – 2x < 9 + 5⇒ x < 14Any number less than 14 satisfies the given conditions. In other words, any number in the interval ] –∞, 14 [Example 3.26The area of a square is greater than 36 cm2. Write an inequality for(a) the length(b) the perimeter of the square.SolutionWe must first define our variables, just as we do when forming equations. Let the length of the square be x cm. Area of the square = x2.
 Exercise 3.151. The area of a rectangle is estimated to be 48 cm2. If the length of the rectangle is b cm, write an expression for the: (a) breadth of the rectangle. (b) perimeter of the rectangle in terms of b.2. Five times an unknown number plus 7 is greater than 42. What is the range of values that the unknown number can have?3. The sum of two consecutive even integers is less than or equal to 22. Find the range of values in which these integers lie.
4. A total of 35000 FRW is to be divided among a group of students. If each student must receive not more than 750 FRW, find the range of the number of students which will be given the money.5. A tank of water has a capacity of y litres. If water is to be shared between 25 families, each family receiving not more than 100 litres, find the capacity of the tank.6. Three consecutive odd numbers are such that the sum of five times the least and seven times the middle one is greater than eleven times the third number. Form an inequality in one unknown and solve it to find the least of those numbers.3.3.7 Applications of inequalities in real lifeExample 3.27A piece of wire more than 35 cm long is to be cut into two pieces. One piece must be 13 cm long. What is the range of values for the length of the other piece?SolutionLet b be the length of the other piece. Then b + 13 cm < 35 cmSolving this we haveb + 13 – 13 > 35 – 13b > 22The range of values for the other piece must be less than 22 cm.Example 3.28Lucy was given some mangoes. She gave away three of them. When she divided the number of the remaining mangoes into 2, the number was less than 17. What is the maximum number of mangoes that she could have been given? Exercise 3.161. A class teacher received a number of storybooks for his class. He put aside three books for his use and divided the rest between two groups. He discovered that each group got less than 17 books. Form an inequality to find the number of books he received.2. A business lady took a loan from her SACCO to expand her business. Given that the cost of goods from China was USD 2398, shipping cost was USD 1499 and that she had could only get a maximum of an equivalent of USD 15 000 from the SACCO, use an inequality to find the value of the items she could buy.3. Sarah’s age is 20 years less than her mother’s age. If her father is 45 years old, what is the maximum age (to the nearest whole number) that she could have been 5 years ago.4. Abraham has 5 000 FRW in his savings. He wants to have at least 2 000 FRW at the end of the season.He withdraws 255 FRW each week for use.(a) Write an inequality to represent this situation.(b) In how many weeks can he withdraw the money.5. A taxi charges 700 FRW basic charge plus 12 FRW per km travelled. Judy has only 8300 FRW and cannot spend more than that for the taxi.(a) Write an inequality for the situation.(b) How many km can she travel without exceeding the limit (to the nearest km).6. Robert keeps dogs and cats in her place. The number of cats is three times the number of dogs. What is the greatest number of cats if the total number does not exceed 58?7. James plans to buy a car 21 months from now. At present he has saved
450 000 FRW. The cheapest car he can buy costs 250 000 FRW. What is the minimum amount (whole number) that must he save per month for this period of time to be able to buy such a car?Unit Summary1. Simultaneous equations are systems of equations with two or more variables. The set of variables are however same in all the equations. Methods of solving simultaneous equations include:(i) Graphical method(ii) elimination method(iii) substitution method(iv) Comparison method(v) Cramer’s rule2. Elimination method: It is the method of getting rid of one of the variables by addition or subtraction.3. Substitution method: It is a method of solving simultaneously equations by first replacing one expression with another.4. Cramer’s rule: It is the method of using a determinant to solve simultaneous equations. 6. An inequality: Itis a statement that states that one number is greater than or less than another.7. Compound inequalities comprise of a minimum of three simple linear inequalities combined together. For example, a<b<c, means that a<b, a<c and b<c.Unit 3 Test1. Find all the integral values of x which satisfy the inequality
2(2 – x) < 4x – 9 < x + 11
2. Solve the inequalities(a) 3 – 7x ≤ 2x + 21(b) 2(3x + 1) ≥ 4(x – 1) > 12
 5. The sum of two numbers is 23 and their difference is 3. Find the sum of the squares of the two numbers.6. Solve the following equations by elimination.
 9. The sum of the number of edges and faces of a solid is 20. The difference between the number of edges and faces is 4. Find the number of edges and faces.10. The velocity in km/h of a car after t hours is given by the formula v = u + at, where u and a are constants. Given that v = 50 when t = 2 and v = 140 when t = 5, find (a) the constants u and a. (b) the velocity when t = 7 hours. (c) the time at which v = 260 km/h.11. The sum of the digits in a three digit number is nine. The tens digit is half the sum of the other two and the hundreds digit is half the units digit. Find the number.12. Asale and Mbiya collected a number of stones each to use in an arithmetic lesson. If Asale gave Mbiya 5 stones, Mbiya would have twice as many as Asale. If Asale had five stones less than Mbiya, how many stones did each have?13. A student invested 50 000 FRW in two different savings accounts. The first account pays an annual interest rate 3%. The second account pays an annual interest rate of 4%. At the end of the year, she had earned
1 850 FRW in interest. How much money did she invest in each account?UNIT4: MULTIPLIER FOR PROPORTIONAL CHANGE
Key unit competence
By the end of this unit, I will be able to use a multiplier for proportional change.
Unit outline
• Proportions and sharing.
• Expressing ratios in their simplest form.
• Sharing quantities in a given proportion.
• Increasing and decreasing quantities by a given percentage.
• Calculations on proportional change using multiplier.
Introduction
In S1,we already learned about proportion, its definition, properties and its application in the real life situation. This unit, therefore, reviews the properties of proportions; expressing ratios in the simplest form; and decreasing quantities by a given percentage proportion. Finally, calculations of proportional change using multiplier.
4.1 Properties of proportions
In S1, we already studied proportions, its properties and application in real life situation. Here, we review some of the properties of proportions.
Activity 4.1
1. Working in groups, discuss what proportion is.
2. By use of a simple example, discuss within your group members the properties of proportions that you learnt in S1.
3. Compare your findings with the other groups in class. Did you get the same findings?
4. Discuss two applications of proportions in real life.
5. Present your findings to the whole class through your group leader.
The following are properties of proportions: 1. Mean-extremes or cross-multiplication property. If
a /b = c /d,
then ad = bc


4.2 Expressing ratios in their simplest form
Remember that expressing ratios in their simplest form had been studied in S1. You are therefore expected to be well versed with how the operations will be carried out.
Activity 4.2
• Remind you classmate on how ratios are expressed in their simplest form.
• Consider the ratio 4:12. What do you notice when the ratio is divided by 4 on both sides?
• Explain your findings to your partner.
As studied in S1, simplification of ratios is a means of reducing a ratio to its lowest form by either dividing or multiplying the ratio by the same value without necessarily changing the value of the ratio.


Exercise 4.1 1.
Express the following ratios in their lowest forms.
(a) 28 : 42
(b) 30 : 50
(c) 24 kg : 30 kg
(d) 150 cm to 3 m
(e) 1 litre to 250 ml
(f) 45 min : 1 1 2 hours
(g) 2.6 kg to 130 g
2. Simplify the following ratios in their simplest form.
(a) 2 : 0.4 (b) 0.9 : 0.18
(c) 0.3 : 0.12 (d) 3/4 : 10
(e) 3/4 : 3/5 (f) 3(1/2) : 2(1/2)4.3 Multipliers for proportional change
4.3.1 Definition of multiplier
Activity 4.3
• Discuss with your classmate what you understand by the word multiplier.
• Consider a shirt that is sold at a 20% discount.
• What is the percentage of the selling price?
• Convert this percentage you have gotten into fraction. What do you notice?
• Consider the price of a book being reduced by 15%, the percentage of the selling price is 100% – 15% = 85%. • 85% converted to decimal gives
= 85/100 = 0.85 • We say that 0.85 is the multiplier of the price of the book.
Example 4.8
What is the multiplier for 15% increase?
Solution
A 15% increase means the final percentage for the quantity will be 100% + 15% = 115% 115% as a decimal = 115/100 = 1.15 1.15 is the multiplier.
Example 4.9
What is the multiplier of 45% decrease?
Solution
45% decrease means the overall percentage for the quantity will be 100% – 45% = 55% 55% as a fraction = 55/100 = 0.55 0.55 is the multiplier.
4.3.2 Multiplier for increasing and decreasing by a percentage
Activity 4.4
• Consider a phone costing 10 000 FRW. Two customers bought the phone at two different places. One at 20% less while the other at 20% more than the cost price.
• Determine the prices at which the customers bought the phones
. • Compare your results with those of other groups

4.3.2.1 Increasing multiplier


Exercise 4.2
Increase:
(a) 50 by 10%
(b) 60 by 30%
(c) 70 by 5%
(d) 200 by 80%
(e) 450 by 100%
(f) 525 by 25%
4.3.2.2 Decreasing multiplier

Exercise 4.3
Decrease
(a) 200 by 20%
(b) 150 by 5%
(c) 450 by 35%
(d) 670 by 45%
(e) 1 000 by 3%
(f) 1 425 by 25%
4.4 Calculations of proportional change using multiplier
Activity 4.5
Consider a shirt with a marked price of 500 FRW. After bargaining with the customer, the shirt is sold at a 10% lower. Discuss with your classmate the change in price and the new price (selling price) of the shirt in FRW.
From Activity 4.5, it is evident that the shirt has been sold at a reduced price compared to the initial buying price. The marked price is reduced proportional by 10% which translates to 50FRW. Therefore the customer bought the shirt at 50 FRW less.


Exercise 4.4 1.
Increase:
(a) 70 by 20%
(b) 250 by 50%
(c) 750 by 100%
(d) 1 250 by 5%
(e) 2 by 95%
(f) 100 by 0.75%
2. Decrease:
(a) 600 by 20%
(b) 30 by 30% (
c) 1 760 by 10%
(d) 230 by 11%
(e) 980 by 99%
(f) 2 250 by 2%
3. Mbaya bought 10 m of cloth material for making suits. After washing the length shrunk by 5%. What was the length after washing?
4. The bus fare from Town A to Town B used to be 600 FRW. Due to increase in petrol, the fare has increased by 25%. What was the new fare?
5. Habimana’s salary used to be 45 000 FRW. The company started making losses and his salary was reduced by 15%. What is his new salary?
Unit summary
1. A ratio is a relation that compares two or more quantities of the same kind, such as lengths, using division giving one quantity as a fraction of another.
2. A proportion is a mathematical statement of the equality of two ratios.
3. The four properties of proportion are: (a) Mean-extremes or cross - product (b) Mean or extremes switching (c) Inverse or reciprocal (d) Denominator addition/ substraction
4. If two ratio have the same value then they are equivalent, even though they may look different.
5. A decreasing multiplier is a factor that reduces the proportion of a given quantity. To calculate the new price, we proceed as New price = initial price × multiplier, where, multiplier = (100 - x) /100 and x is the percentage decrease on the cost price.
6. An increasing multiplier is a factor that increases the proportion of a given quantity. To calculate the new price, we proceed as New price = initial price × multiplier, where multiplier = (100 + x)/100 and x is the percentage increase on the cost price.
Unit 4 test
1. Express the following ratios to their simplest form.
(a) 8:24
(b) 0.2:0.8
(c) 1 8 : 1 2
(d) 3 4 : 20
2. Uwimana has a flock of 3 000 sheep. He intends to reduce the flock by 40%. What number will be his new flock?
3. A cow produced 800 litres of milk in one week. In the following week its milk production increased by 30%. What amount of milk did it produce in the week.
4. The attendance in an agricultural shows that last year was 60 000 people. This year the attendance increased by 12%. What was the attendance this year?
5. A farmer produces 9 500 tonnes of coffee in the first six months of the year. Because of drought in the following six months, the production reduced by 36 %. How many tonnes of coffee were produced in the year?
6. In 2005, a certain region increased milk production by 22% over the previous year. If in 2004 the region had produced 25 450 000 litres of milk, how many litres were produced in the two years?
7. The population of a town increases by 8% every year. The population this year is 52 800. What will be the population after 2 years?
8. In 2003, the number of HIV and AIDS patients visiting a certain dispensary fell by 25%. If a total of 1200 patients had visited dispensary in 2002, how many patients visited the dispensary in 2003?
9. A milk processing company has a capacity to process 6 million litres of milk in 2 months. In the last two months, processing fell by 45% due to repair undertaken in the factory. How many litres of milk were processed in the two months?
10. A region produces 5 million tonnes of maize every year. The production fell by 15% in the following years. How many tonnes were produced by the region over the two years?
11. Three business partners Patric, Rebecca and Joseph contributed 50 000 FRW, 40 000 FRW and 25 000 FRW respectively, to start a business. After sometime, they realised a profit which they decided to share in the ratio of their contributions. If Joseph’s share was 10 000 FRW, by how much was Patric’s share more than Rebecca’s?
UNIT5: THALES’ THEOREM5
Key unit competence
By the end of this unit, I will be able to use Thales’ theorem to solve the problem related to similar shapes and determine their lengths and area.
Unit outline
• Midpoint theorem
• Thales’ theorem and its converse
• Application of Thales’ theorem in calculating lengths of proportions segments (In triangles and Trapeziums)
5.1 Midpoint theorem
Activity 5.1
1. Using a ruler, draw a line segment AB of length 10 cm.
2. Mark Point C 5 cm from A towards B at the midpoint of the line AB. Measure and compare the lengths AC and CB. What can you say about these two line segments AC and CB?
3. What Fraction does segment AC represent in terms of length AB?
Midpoint is defined as the point halfway between the endpoints of a line segment. A midpoint divides a line segment into two equal segments. Consider Fig. 5.1.

In figure 5.1 above, two people are 10 metres apart. They want to meet at the midpoint. The midpoint is half way from each person. The concept of midpoint of lines can be extended to triangles and trapezia to establish the proportions between parallel line segments.
This is summed up in what is known as midpoint theorem.

1. With the aid of a ruler, construct the above triangle accurately.
2. Measure and mark points D and E, the midpoints of AC and BC respectively. 3. Join D to E with a straight line as shown in Figure 5.3. Measure the length of the line DE 4. Compare the lengths of DE and AB and state the relationship. 5. Draw dotted perpendicular lines from points D and E to intersect line AB as shown in Figure 5.3. Measure and compare their lengths. What do you notice?

6. From your results in step 5, are the line segments DE and AB parallel or not

In Fig 5.4, Point S is the mid-point of the line segment PQ and T is the mid-point of the line segment PR. Hence the line segment PS is equal to SQ, and the line segment PT is equal to TR.
When the two mid-points S and T are joined together, they form the line segment ST. From the results of Activity 5.2, ST is parallel to QR. By measuring, we see that the length of ST is half the length of QR
These facts are summarised in midpoint theorem that states:
1. The straight line through the midpoints of two sides of the triangle is parallel to the third side of the triangle.
2. The length of the segment joining the midpoints of the sides of the triangle is half the length of the third side which are parallel to it.
The midpoint theorem is also extended to trapezia.
Activity 5.3
In trapezium ABCD below,
AB = 4 cm,
BC = 6 cm and
CD = 5 cm and
AD = 8 cm.

1. With the aid of a ruler, construct the above trapezium accurately
2. Measure and mark points E and F, the midpoints of AB and DC respectively. Join E to F with a straight line as shown in Fig. 5.5.
3. Draw dotted perpendicular lines from points E and F to intersect line AD. Measure and compare their lengths. What do you notice?

4. From your results in step 3, are the line segments DE and AB parallel or not?

In the trapezium WXYZ, WX is parallel to ZY. ZY is the base of the trapezium. Point A and B are the midpoints of ZW and YX respectively.
Therefore, AB is parallel to ZY.
These facts are summarised in the midpoint theorem for trapezia that states that: The line through the midpoint of two non-parallel sides of a trapezium is parallel to the base of the trapezium. Note: Applying the midpoint theorem in triangle ZWY, you should note that
AC=1/2 ZY, C is the midpoint of WY hence WC=CY.

Solution By midpoint theorem, DE = 1/2 BC
We get 4x =
1/2(6x + 4)
8x = 6x + 48x – 6x = 4
2x = 4
so x = 2
Example 5.2
In the Trapezium below, E is the midpoint of AD, find the value of x, given that
AB = 6x2 – 36 and EF = 2x2 – 3x.


Exercise 5.1
1. In the figure below, find the value of x given that PQ is parallel to AC.

2. In the figure below, find the value(s) of x given that PQ is parallel to AB.

3. In the trapezium below, FG = 2x2 – 5x and AB = 14 cm. FG is parallel to AB.

Find the values of x that can balance the conditions of the parallel sides.
4. In the Fig. 5.13, PQ is parallel to BA, AC is 6 cm. Triangle BCA is rightangled at C.

Find the value of x.
5. Find the values of x in the diagrams below.

6. Find the value of y in the triangle PQR if point M is the midpoint of the side PQ and N is the midpoint of the side PR given that QR=30 cm.

5.2 Thales’ theorem
5.2.1 Thale's theorem in triangles
Activity 5.4
1.
a) Write the following as proportions.
b) Find the values of letters given in the ratios,
i) 4:6 = c:3
ii) 5:4 =15:x
2. a) Draw triangle ABC with dimensions of your choice.
b) Draw a line DE parallel to side AB.

c) Measure and record the lengths of the line segments AD, DC, BE and EC.
d) Find and compare the ratios AD/DC and BE/CE. What do you notice?
Remember, a ratio is a way of comparing two or more quantities of the same kind. Given that a:b = c:d, we can write this as a proportion of two equal ratios as ab=cd. In step 2 of activity 5.4, you should have noticed that AD/DC = BE/CE.
This fact is summarised in Thales’ theorem which states that: If a line is drawn parallel to one side of a triangle intersecting the other two sides, it divides the two sides in the same ratio. For example, in triangle PQR below ST is parallel to PQ.


5.2.2 Thales’ theorem in Trapezia
Activity 5.5
1. Draw three parallel lines AB, CD and EF.
2. Draw two lines that pass through the parallel lines (Transverse lines) as shown in Fig. 5.19

What is the name of figure EABF?
3. Measure and record the lengths of the line segments AC, CE, BD and DF. 4. Find and compare the ratios AC/CE and BD/DF . What do you notice?
In activity 5.5, we drew three parallel lines and two transversals through them (figure 5.19). Figure EABF is a trapezium.
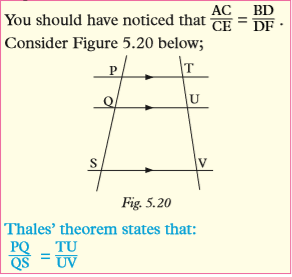

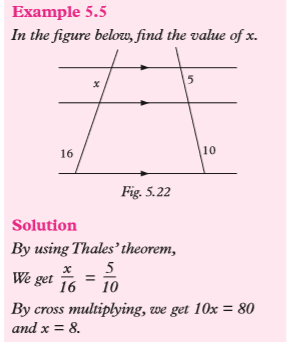

5.3 The converse of Thales’ theorem
Activity 5.6
1. Draw triangle ABC with dimensions of your choice.
2. Draw a line XY through side AC and BC; ensure the line is not parallel to AB.

3. Measure and record the lengths of the line segments AX, XC, BY and YC.
4. Find and compare the ratios AX/XC and BY/YC . What do you notice
In activity 5.6, you should have noticed that the ratio AX/XC ≠ BY/YC
This observation is the converse of Thales’ theorem, which can be summed up as follows: “If a line intersects two sides of a triangle and is not parallel to the third side, then it does not divide the sides in the same ratio.


5. Copy and complete the proportions in figure 5.29.

(b) Calculate the values of x and y.
6. Find the values of x in the Fig. 5.30.

7. In the Fig. 5.31 below, find the value of x in:

8. Find the values of x in the figures below.

Unit Summary
1. Midpoint: It is the point halfway between the endpoints of a line segment. For example, if AX = XB then X is the midpoint of line AB.

2. Thales' theorem states that if a line is drawn parallel to one side of a triangle intersecting the other two sides, it divides the two sides in the same ratio. For instance, in triangle ABC in Fig. 5.34.

Thales' theorem states that; BX/XA = CY/YA .
3. The converse of Thales theorem states that if a line intersects two sides of a triangle and is not parallel to the third side, then it does not divide the sides in the same ratio.
4. The midpoint theorem for trapezia it states that the line through the midpoint of two non-parallel sides of a trapezium is parallel to the base of the trapezium.
5. The midpoint theorem states that:
a) The straight line through the midpoints of two sides of the triangle is parallel to the third side of the triangle.
b) The length of the segment joining the midpoints of the sides of the triangle is half the length of the third side which are parallel to it.
6. A ratio is a way of comparing two or more quantities of the same kind. For example 1:2, 3:4 are ratios.
Unit 5 test 1.
In the figure 5.35, ACB is a rightangled triangle. The bisector of AC and BC is parallel to BA.

Find the value of x.

3. Given that P and Q are the midpoints of lines AB and BC respectively in the Fig. 5.37.

4. Fig. 5.38 is a trapezium. AM is half of AB and CN is half of CD. Given that AB = 8 cm and CD=10 cm.

a) Determine the values of n, x and y.
b) Express the following as ratios to their simplest forms.
i) MB:CD ii) AM:DN
5. The right-angled triangle ABC in Fig. 5.38 has E as the midpoint of line segment AB and F as the midpoint of line segment of BC. Given that AB=9 cm and EF=6 cm.

Find:
a) The value of y
b) Length CF
c) Area of triangle EBF and ABC
6. In the Figure 5.40, AB = 2.4 cm, AC = 3.6 cm, BC = 3 cm and BB′ = 3.6 cm


UNIT6: PYTHAGORAS' THEOREM6
Key unit competenceBy the end of this unit, I will be able to solve problems of lengths in right angled triangle by using Pythagoras' theorem.Unit outline• State Pythagoras' theorem• Identify hypotenuse in three sided of a right angled triangle• Demonstration of Pythagoras' theorem• Application of Pythagoras' theorem in calculations6.1 Pythagoras' theoremAny triangle that contains a right angle is called a right triangle or right-angled triangle. Right triangles occur frequently in everyday life situations. For example, right triangles are formed when you lean a ladder against a wall or you brace a book shelf.Fig 6.1 shows a right triangle. The longest side in any right triangle is called the hypotenuse. For a very long time, it has been known, as a matter of fact, that a triangle with sides 3, 4 and 5 units is right-angled. However, this is only one isolated case and does not provide an answer to the question above. The lengths of the sides of a right triangle are related in a special way as you will discover from the following activitiesActivity 6.1Consider a floor that is tiled with tiles of the same size, each is a right-angled isosceles triangle, as in Fig. 6.2.
 1. Make a copy of this figure on a larger scale.2. Pick any of the small triangular tiles (e.g. A) and shade the three squares standing on its sides. The squares on the shorter sides are equal (each comprising of two triangular tiles).3. How many tiles make the square on the longest side (called the hypotenuse)?4. Shade a triangle composed of two triangular tiles (e.g. B). This triangle is similar to the previous one.5. Count the number of tiles that make the squares on its sides.6. Continue shading triangles of the same shape but of increasing size and record your results as in Table 6.1.
 What is the relationship between the values of a, b and c? Suppose the area of a triangle represents 1sq. unit, find the areas of the squares on the three sides of the triangle. What is the relationship between the three areas? Suppose also that the area of triangle B in the same figure represents 1sq.unit state the areas of the three squares on the side of B.What is the relationship between the three areas?In both cases, the sum of the areas of the square on the two shorter sides is equal to the area of the square on the hypotenuse. Is this fact true if the right-angled triangle is not isosceles? Verify this by carrying out Activities 6.2 and 6.3.Activity 6.21. Draw ∆ABC, right-angled at B on a stiff paper, such that BC is longer than AB. Construct the three squares on its sides, as in Fig. 6.3.
 2. Locate the centre P of the square on side BC. Through P, construct a line perpendicular to AC and another line parallel to AC, to subdivide the square into four pieces as in Fig. 6.4.
 3. Cut out the squares on AB and BC. Cut out the square on BC into the four pieces indicated. Arrange the pieces to cover completely the square on AC (See Fig. 6.5). Note that the pieces can be moved into their new positions without rotating any of them or turning them over. (This is like a jigsaw puzzle and is referred to as Perigal’s dissection).
 What can you say about the areas of the squares on the two shorter sides of the triangleActivity 6.31. (a) Construct a right triangle with sides of 3 cm,4 cm and 5 cm respectively on a piece of grid paper Fig 6.6
 (b) Draw a square on each side of the triangle. Calculate the area of each square.(c) How does the area of the square on the hypotenuse seem to relate to the areas of the squares drawn on the other two sides?2. Repeat question 1 by constructing right triangles(a) 6 cm, 8 cm, 10 cm(b) 5 cm, 12 cm, 13 cm3. The side of various right triangles are shown in the table 6.2.(a) Draw each right triangle using the sides given measure the hypotenuse.(b) Draw a square on each side of the right triangle. Find the area of each square.(c) How does the area of the square drawn on the hypotenuse seem to relate to the areas of the other two sides?
 From activities 6.1 to 6.3, the area of the square on the hypotenuse is equal to the sum of the areas on the other two sides of any right triangle.
 ABC is a right-angled triangle. The following relationship is obtained
 This relationship is called the Pythagorean relation or Pythagoras theorem. It states that “in aright triangle the square of the hypotenuse is equal to the sum of the squares of the other two sides”.The Pythagoras relation can be used to help you find the missing side in a right triangle.Example 6.1A right triangle has a hypotenuse 12 cm long. Find the length of the third side if one of the two shorter sides is 8 cm long. Give your answer to the nearest centimetres.
 Exercise 6.11. Lengths of the sides of four triangles are shown. Identify which of the triangles are right angled, showing your method.(a) AB = 24 cm, BC = 10 cm, AC = 26 cm(b) DE = 7 cm, EF = 8 cm, FD = 13 cm(c) GH = 10.6 cm, HF = 5.6 cm, IG = 9.0 cm(d) JK = 16 mm, KL = 34 mm, LJ = 30 mm2. Use Fig 6.9 to copy and complete the following, given that A,B,Crepresent areas of the three squares.
 6.2 Proof of Pythagoras’ theorem (using algebra)Activity 6.4For pythagoras’ theorem to be completely general, think of a triangle T whose sides are of lengths a, b and c units, as in Fig. 6.10.
 Note that line CBC′ is straight and C′B′ is at right angles to it.2. Rotate triangle T′ in a clockwise direction about O twice through 90° in each case, to positions T′′ and T′′′ as in Fig. 6.12.
Note that the figure CC′C′′C′′′ obtained after the three rotations, is a square of side (a + b) units.
 6.2.1 Using Pythagoras’ theoremAs we have seen, Pythagoras’ theorem concerns areas of the square on the sides of a right angled triangle. Its main use, however, is in calculating lengths. It also provides us with a test for a right-angled triangle.A triangle is right-angled, whenever the square of the length of the longest side equals the sum of the squares of the lengths of the other two sides.


 Exercise 6.21. Fig. 6.16 is a right-angled triangle with squares A, B and C on its sides.


 7. The sides of a rectangle are 7.8 cm and 6.4 cm long. Find the length of the diagonal of the rectangle.8. The length of the diagonal of a rectangle is 23.7 cm and the length of one side is 18.8 cm. Find its perimeter.
 CD = 20 cm. Calculate the length of a diagonal of the rectangle giving your answer to the nearest a whole number.6.3 Pythagorean triplesRevisit your answers to question 5 of Exercise 6.1 (b). You notice that the values give right-angled triangles. Such sets of values which give right-angled triangles are known as Pythagorean triples or Pythagorean numbersA Pythagorean triple (a, b, c,) is a group of three numbers which give the respective lengths of the sides and the hypotenuse of a right-angled triangle and are related thus: a2 + b2 = c2The group (3, 4, 5) is the most famous and most commonly used Pythagorean triple. The triple was known even before the time of Pythagoras. It was, and is still, used for setting out the base lines on tennis courts and other sports pitches.Activity 6.5There are many other Pythagorean triples. Now complete the following patterns to discover some more
 In general if we donate a Pythagorean triple as a, b, c, such that:(i) a < b < c and a, b and c are positive integers.(ii) b and c are consecutive numbers i.e. b + 1 = c, then b + c = a2Example 6.5Suppose 11, b, c are Pythagorean triple, find b and c.Solutionb + c = 112 ⇒ b + c = 121We need two consecutive numbers whose sum = 121(121 – 1) /2 = 60The two numbers are therefore 60 and 61Check for the Pythagorean propertyin 11, 60, and 61 112 + 602= 612 LHS 112 = 121602 = 3 600 112 + 602 = 121 + 3600= 3 721 RHS = 612 = 3 721Therefore, 11, 60 and 61 is a pythagorean tripleActivity 6.6Discuss with your classmate the following working from numbers 1-4 then work out numbers 5-10 in your exercise books.
 In general,if a, b, c is a Pythagorean triple then(i) a < b < c (ii) b + 2 = c(iii) b + c = 1/2 a2 Note that a is always an even numberso that 1/2a2 can make sense.Example 6.6Suppose that 14, b, c is a Pythagorean triple.Find the value of b and c.
 Examples 6.5 and 6.6 show two ways of finding Pythagorean triples. But they do not seem to give all the possible sets of such triples. Is there a general way of finding Pythagorean triples?
 Are these all Pythagorean triples? In general:Given any two positive integers m and n, where m > n, we always obtain the Pythagorean triple: (m2 – n2, 2mn, m2 + n2)We can use Pythagorean theorem to determine if a given triangle is rightangled or not. If a triangle is right-angled, then the sum of the squares of the shorter sides equals the square of the longer side. Example 6.7 illustrates the process.Example 6.7Find out whether a triangle with sides 11, 15 and 18 cm is right-angled.SolutionThe two shorter sides are 11 cm and 15 cm in length. The sum of the squares of their lengths is112 + 152 = 121 +225 = 346The square of the length of the longest side is182 = 324 Now112 + 152 ≠ 182∴ the triangle is not right-angled.Exercise 6.31. (5, 12, 13) is a Pythagorean triple.(a) Write down four multiples of it.(b) Are all the four multiples in (a) Pythagorean triples?(c) Using a multiplier n and any Pythagorean triple (a, b, c,) state the general result for such multiples as in (a).2. Find out if the following are Pythagorean triples.(a) (7 , 24 , 25)(b) (8 , 15 , 17)(c) (15 , 22 , 27)(d) (28 , 43 , 53)(e) (11 , 60 , 61)(f) (20 , 21 , 29)3. The following are the dimensions of two triangles. Which one of them is a right-angled triangle?(a) 15 cm, 30 cm, 35 cm(b) 33 cm, 56 cm, 65 cm4. Use the following numbers to generate Pythagorean triples.(a) 1 and 4(b) 1 and 5(c) 6 and 2(d) 3 and 85. Complete the following Pythagorean triples.(a) (25 , … , …)(b) (31 , … , …)(c) (43 , … , …)(d) (49 , … , …)(e) (30 , … , …)(f) (38 , … , …)(g) (44 , … , …)6. Which of the following measurements would give a right-angled triangle?(a) 6 cm by 8 cm by 10 cm(b) 5 cm by 12 cm by 13 cm(c) 4 cm by 16 cm by 17 cm(d) 7(1/2) cm by 10 cm by 12(1/2) cm(e) 9 cm by 30 cm by 35 cm(f) 12 cm by 35 cm by 37 cm(g) 12 m by 60 m by 61 m(i) 20 m by 21 m by 28 m(j) 28 m by 45 m by 53 m(k) 27 m by 35 m by 50 m(l) 33 m by 44 m by 55 m(m) 4 m by 7(1/2) m by 8(1/2) m(o) 2.7 m by 36.4 m by 36.5 m(p) 2.9 m by 42 m by 42.1 m6.4 Using Pythagoras’ theorem in real life situationAs we have seen, Pythagoras’ theorem connects the areas of actual squares. Its main use, however, is in calculating lengths without having to draw any squares. The theorem also acts as a test for right-angled trianglesThere are many real life situations which require the use of Pythagoras’ theorem. A pedestrian may take shortcut along the diagonal rather than walk along street M and street A. How much shorter is the shortcut?Activity 6.7Working in groups, identify five real life situations in which you find application of Pythagoras' theorem. Describe the situations either in words or by use of clearly labeled diagrams.The following are some of the situations that represent the application of pythagoras' theorem in real life. Did you capture all of them in Activity 6.7? List those that are not captured below in your exercise book:
 In this case we can find the distance between the wall and the foot of the ladder, the vertical height of the top of the ladder from the ground or the length of the ladder depending on the information given or known.2. Imagine a guy wire or chain used to steady an electric post. The post is upright i.e. perpendicular to the ground and the guy chain fixed to the ground on one end and to the post on the other. (see Fig. 6.24
 In this case you can find the distance of the wire from the post, the height of the point at which the wire is secured on the post or even the length of the wire depending on what information is given or known. The wire, the post and the ground form a right angled triangle.3. Imagine a hawk on a branch of a tree, and observed a chick on the ground. Some distance from the foot of the tree. (see Fig. 6.25)
 The view line of the hawk to the chick represents the hypotenuse of a right angled triangle connecting the hawk, the chick and the foot of the tree.4. Imagine a man standing at the edge of a cliff and using binoculars observes a ship on the sea at a distance. The point on the cliff where the man stands, the position of the ship and the height of the cliff above the water connected would form a right angled triangle whose dimensions can be calculated given appropriate information make a sketch of this situation. (see Fig. 6.26)
 These are just a few examples where Pythagoras' theorem can be applied to calculate distances. I believe of many more which you are ready to share with your class.Example 6.8A ladder, 3.9 m long, leans against a wall. If its foot is 1.2 m from the wall, how high up the wall does it reach?SolutionFig. 6.27 is an illustration of the situation. Note that the ground must be assumed to be horizontal and level and hence at right angles to the wall.
 Exercise 6.41. Fig. 6.28 shows a television antenna. Find the length of the wire AB holding the antenna.
 2. A ladder reaches the top of a wall of height 6 m when the end on the ground is 2.5 m from the wall. What is the length of the ladder?3. The length of a diagonal of a rectangular flower bed is 24.6 m and the length of one side is 18.9 m. Find the perimeter and the area of the flower bed.4. A piece of rope with 12 knots that are equally spaced has been laid out and pinned down on the ground as in Fig. 6.29.
 (a) What can you say about the triangle whose corners the stakes mark?(b) Does it matter how great the distance between the knots is?5. A rectangular chalkboard in a classroom measures 2.2 m by 1.2 m. What is the length of the longest straight line that can be drawn on it?6. Fig. 6.30 shows a road that turns through a right angle to go round a rectangular recreational garden in a town. To save time, people on foot cut off the corner, thus making a path that meets the road at 45°. If the path is 48 m long, find the distance that the people save?
 7. A hall is 16 m long, 14 m wide and 9 m high. Find the length of the diagonal of the floor.8. Fig. 6.31 represents a roof truss which is symmetrical about QS. Beam PQ is 5 m long, strut TS 2.4 m long and the distance TQ is 1.8 m.(a) Find the height QS.(b) Hence, find the span PR of the roof.
 9. Three ships A, B and C leave and sailed in different directions. A sails due west, B sails due East and C sails due south. In 1 hour, A had sailed 23 km, B 18 km and C 12 km. Draw a sketch to show the relative positions at this instance. Hence calculate how far apart are(a) B and C(b) A and C(c) A and B10. Fig. 6.32 gives an example of the network of streets in a modern city, a pedestrain may make a shortcut along the diagonal rather than walk along street M and street A. How much shorter is the shortcut.
 Unit Summary1. Any triangle that contain a right angle is called a right triangle or right- angled triangle.2. The longest side of any right angled triangle is called the hypotenuse.3. Pythagoras' theorem states that in a right triangle, the square of the hypotenuse is equal to the sum of the squares of the other two sides.4. A group of three numbers (a, b, c) which give the respective lengths of the sides and the hypotenuse of a right-angled triangle and are related is called a pythagorean triple.5. A set of values which give right-angled triangles is called Pythagorean numbers.Unit 6 test1. Find AB if AC = 18 cm and BC = 24 cm in Fig. 6.33.
 2. A rectangle measures 3 cm by 4 cm. Calculate the length of its diagonal.3. A string is firmly tied onto the top of a flag post 10 m tall and supported on the ground by pegs. If the string is pegged 7.5 m away from the base of the flag post, find the length of the string.4. A ladder 22 m long leans against a vertical wall. If it is 16 m away from the vertical wall, calculate the height of the wall.5. In Fig. 6.34, PQ is parallel to SR and PQRS is a trapezium. Angle QPS = Angle RSP = 90°, PS = 6 cm, SR = 19 cm and PQ = 11 cm.Calculate: (a) the length of QR.(b) the length of diagonal PR.
 6. The diagonal of a rectangle measures 7.5 cm. If one of the sides measures 4 cm, calculate the perimeter of the rectangle7. In Fig. 6.35, QR = 32 cm, PTS = TRS = TQP = PUS = 90º. Given that T divides QR in the ratio 1:1 and S divides RU in the ratio 3:1, find the length of PS.
UNIT7: VECTORS
Key unit competency
By the end of this unit, I will be able to solve the problems using operations on vectors.
Unit outline
• Concept of a vector, definition and properties
• Vectors in a cartesian plane
• Operations on vectors
• Magnitude of vectors as its length
7.1 Concept of a vector, definition and properties
Activity 7.1
1. A tourist arrived in Kigali and is to visit the national museum.
a) What two aspects of the journey must he know?
b) What is the name of the quantity that has these two aspects?
2. In pairs, roughly estimate the following :
a) The distance between your school and the nearest shopping centre.
b) The direction of your school from the nearest shopping centre.
c) How did you estimate the direction in (b) above?
3. The distance from Kigali to Butare is about 133.1 km. Uwase drove from Kigali to Butare and back.
a) What is the total distance covered by Uwase?
b) What is the total displacement?
c) What causes the correct values of part (a) and (b)?
A vector is any quantity that has both magnitude and direction. Two examples of vectors are force and velocity. Both force and velocity are in a particular direction. The magnitude of the force indicates the strength of the force. For velocity, the speed is the magnitude. Other examples include displacement, acceleration.
Note that magnitude and direction are the two properties of a vector. Quantities with magnitude only are called scalars. Examples of scalar quantities are; distance, mass, time.
Geometrically, we represent a vector as a directed line segment, whose length is proportional to the magnitude of the vector and with an arrow indicating the direction. The direction of the vector is from its tail to its head. This is shown in fig 7.1


In this book, we shall adopt bold small letter notation e.g. (a) for position vectors and bold capital letter notation e.g. (AB) for others.
For example, consider a triangle ABC in figure 7.2

Note
The opposite vector of vector a in Fig. 7.2 is -a and that of vector b is -b. A vector and its opposite vector eg a and -a have the equal magnitudes but point in opposite directions.
7.2 Vectors on Cartesian plane
7.2.1 Definition of a column vector
Activity 7.2
Given the points A (-3, 2), B (3, 5), C (0,-2), D (2, 2) and E (-3,-3). Plot them on a graph paper. Join the points appropriately to show the following vectors.
a) AB b) BC
c) CA d) ED
e) DA f) EB
Consider the vectors from point A to B in the figure 7.3

The vector AB and is a displacement of 6 units to the right and 4 units upwards.
Consider the vector from point A to C in the figure 7.4 below.


The number (x) at the top represents the horizontal displacement. The number y at the bottom represents the vertical displacement. When a displacement vector is written in this way it is called a column vector.

It is important to note that whenever the displacement is towards the right or upwards, it is a positive displacement while displacement to the left or downwards is negative

Example 7.1
a) Plot the points P (2, 3) and Q (7,4) and show vector PQ .
b) Write down the column vector PQ

Exercise 7.1
1. Draw cartesian planes and locate the vectors provided. Draw a line joining the two points and indicate the arrow showing the direction from the first to the last point.
a) A(2,2) and B(3,1)
b) P(5,3) and Q(2,2)
c) P(3,1) and Q(2,-3)
d) A(3,4) and B(4,10)
e) A(2,-3) and B(6,7)
f) A(5,1) and B(2,-3)
2. Without drawing, find the resultant vectors for the following points. a) A(2,0) and B(3,-11)
b) P(5,1) and Q(2,4)
c) P(-6,1) and Q(6,-3)
d) A(3,2) and B(4,-5)


7.2.3 Equivalent of vectors
Activity 7.3
Observe the figure 7.7 that is in a shape of a parallelogram and discuss the questions that follow

a) Compare the magnitudes and directions of vectors AB and DC. What do you notice? What is the name given to such vectors?
b) Compare the magnitudes and directions of vectors DA and BC. What do you notice
Two vectors that have equal magnitudes and same directions are called equal vectors.
Consider the pairs of vectors shown in the figure 7.8.

In figure 7.8 (a), vectors VU and WX have the same direction and magnitude hence VU=WX.
In figure 7.8(b) vectors VU and WX have same magnitudes but different directions. Because they are different in directions, the two vectors are not equal i.e. VU≠WX.
Vectors that are parallel and equal in magnitude but opposite in direction are called opposite vectors. Vectors VU and WX in Fig. 7.8 (b) are examples of opposite vectors.


(a) List all the vectors that are equivalent to:
(i) AC
(ii) GH
(b) Is vector AB equivalent to vector IJ? Give a reason.

7.2.4 Midpoints of a vector
Activity 7.4
1. Count the number of desks in your column and locate the middle desk. Identify the fellow students who sit there.
2. a) Using a scale of your choice on a graph paper, draw a cartesian plane and plot the points A(2,2) and B(6,6) and join them with a straight line.
b) On your cartesian plane, locate the point M which is mid-way between A and B by counting the number of squares.
c) How else could you have determined the coordinates of point M in (b)?
A point that bisects a vector equally is called midpoint. This point lies halfway on the vector.


Exercise 7.3
1. Calculate the coordinates of the midpoints of the line segment joining the following pairs of points.
(a) A (2, 1), B (5, 3)
(b) A (0, 3), B (2, 7)
(c) A (4, –1), B (4, 3)
(d) A (–2, 3), B ( 2, 1)
2. In each of the following cases,
(i) Find the column vector of PQ.
(ii) Hence or otherwise, find the coordinates of the midpoint.
(a) P (3, 0), Q (4, 3)
(b) P (–3, 1), Q (5, 1)
(c) P (–2, –1), Q (–12, –8)
(d) P (–9, 1) Q (12, 0)
(e) P (–8, 7), Q (–7, 8)
(f) P (–3, 2), Q (3, –2)
3. P is (1, 0), Q is (4, 2) and R is (5, 4).
(a) Use vector method to find the coordinates of S if PQRS is a parallelogram.
(b) Find the coordinates of the midpoints of the sides of the parallelogram.
7.3 Operations on vectors
7.3.1 Addition and subtraction of vectors by construction
Activity 7.5

a) i) In figure 7.11 (a), redraw the vector AB and BC. Let the head of vector AB meet the tail of vector BC at B.
ii) Draw a line joining A directly to C and indicate the direction of vector AC with double arrows.
iii) What is the representative vector for AC?
b) i) In Figure 7.11(b), redraw the vector AB and CB. Let the head of vector AB meet the head of vector CB at B.
ii) Draw a line joining A directly to C indicate the direction of vector AC with double arrows.
iii) What is the representative vector for AC? c) What do you notice in (a) (iii) and (b) (iii)?

In the figure 7.12 above, the end result of moving from A to B and then from B to C is the same as going from A to C directly. The end effect is to reach point C from point A.
Since the end result is same,
we write AC = AB + BC
c = a + b
The vector AC is called the resultant vector and is indicated by the double arrow. Similarly, if you go from A to B and then from B to C′, the effect is the same as going from A to C′ directly. The required effect is to reach point C′ from point A.
Since the end result is the same, we writeAC′=AB+BC′
c = a + –b
c = a – b
The vector AC′ is called the resultant vector and is indicated by the double arrow. It is also important to note that: AC′=AB – BC′
Let us consider another triangle ABC in figure 7.13. The triangle represents routes joining three towns A, B and C.

If you go from A to B, then from B to C, the effect is the same as going from A to C directly. The required effect is to reach town C from A.
Since the effect is the same,
then AB + BC = AC.
Vector AC is called the resultant vector of AB and BC. Such a vector is usually represented by a line segment with a double arrowhead.
Example 7.5
Using Fig. 7.14, write down the single vector equivalent to:
(a) AB + BC
(b) AE + ED
(c) BC + CD + DE
(d) ED + DC + CB
(e) AB + BA
(f) CD + DC


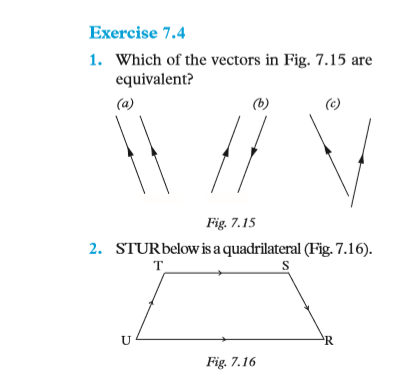
Use it to write down the single vector equivalent to
(a) ST + TU (b) TS – RS
(c) RS + ST (d) UR – SR
(e) UT – RT (f) UR + RT
(g) TS + ST
(i) RS + ST + TU (j) UT – ST + SR
(k) ST + TU + UR + RS (l) UT + TS + SR – RU
3. Draw a triangle STR and put arrows on its sides to show TS + SR = TR.
4. Draw a quadrilateral ABCD and on it show BC, CD and DA. State a single vector equivalent to BC + CD + DA.
5. A man walks 10 km in the NE direction, and then 4 km due north. Using an appropriate scale, draw a vector diagram showing the man’s displacement from his starting point. When he stops walking, how far from the starting point will he have walked?
6. Vectors a, b and c are such that a = b and b = c. What can you say about a and c?
7. Mr. Habimana’s family planned a sight seeing trip which was to take them from Kigali to Huye, then to Rubavu and back to Kigali. Draw a vector triangle to show their trip, using K to stands for Kigali, H for Huye and R for Rubavu. What vector does KH + HR + RK represent?

(a) Copy the figure. Mark with arrows and name two pairs of equal vectors.
(b) Write single vector to represent:
(i) PQ + QR
(ii) PS – RS
(iii) SP + PQ
(iv) SR + RQ
9. Use Fig. 7.18 to find the vector represented by the box to make the following vector equations true.

 7.3.2 Addition and subtraction of column vectorsActivity 7.6Study the cartesian plane in Fig. 7.20 and answer the questions that follow.
 a) State the column vectors for r, p and q.b) Find r + pc) State the mathematical relationship connecting r and p to qd) Find the column vectors for r – p.e) What does – r – p represent on the above Cartesian plane.
 In general, when adding or subtracting vectors, the horizontal displacements and the vertical displacements are added or subtracted separately.


 Use the graph in Fig. 7.22 shown next page to answer Questions 3 and 4 below.3. (a) Name all the vectors that are equal to AB and state their column vectors.(b) Name the vector which is equal to EF.(c) Is PQ equal to KL? Give a reason for your answer.(d) Is KL equal to QP? Why?(e) Simplify EF + FG + GH and give your answer as a column vector. (f) Name a resultant vector which is equal to NM.(g) Name three vectors which are equal to 2GL.4. Write all the vectors in Fig. 7.22 as column vectors.5. P is (5, 3), Q is (-4, 2) and R is (2, -3). Find the column vectors PQ, RQ and RP.
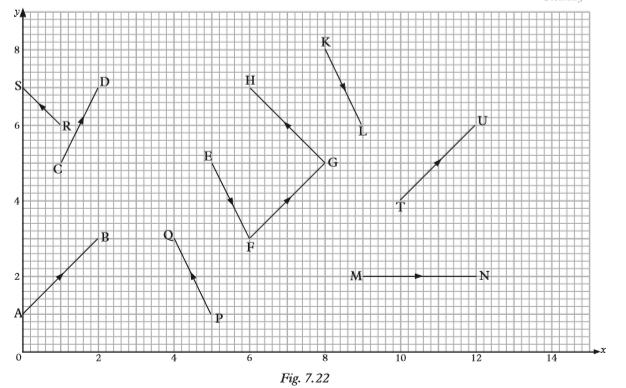 9. Simplify FG + GH giving your answer in column vector form. What is the name of the simplified vector?10. Draw diagrams on squared paper to show
 7.4 Position vectorsOn a cartesian plane, the position of a point is given with reference to the origin, O, the intersection of the x- and y- axes. Thus, we can use vectors to describe the position of a point (Fig. 7.23).
 From the origin, A is +2 units in the x direction and +4 units in the y direction. Thus, A has coordinates (2 , 4) and OA
 Similarly, B is –3 units in the x direction and +1 units in the y direction. Thus, B has coordinates (–3 , 1) and O
 C is –2 units in the x direction and –3 units in the y direction.
 D is +3 units in the x direction and –6 units in the y direction.
 OA, OB, OC and OD are known as position vectors of A, B, C, and D respectively. All position vectors have O as their initial point.Example 7.8Consider points A (2, 3) and B (9, 5) in the figure 7.24 below
 Find the position vectors for A and B hence find AB
 Example 7.10P has coordinates (2 , 3) and Q (7 , 5).(a) Find the position vector of (i) P (ii) Q(b) State the column vector for PO.(c) Find the column vector for PQ


 Exercise 7.61. State the position vectors of the following points.(a) P(5, 3)(b) Q(2, 3)(c) R(-6, 8)(d) S(-3, -4)(e) T(0, 2)(f) U(-3, 0)2. State the coordinates of the points with the following position vectors.
 3. Given A (6, 3) and B (-4, 9), find the coordinates of C when:(a) OC = OA + OB(b) OC + OB = OA4. Given that OR = OP + OQ, state the coordinates of R when the coordinates of P and Q are:(a) P (0, 1) and Q (3, 6)(b) P (-3, 2) and Q (5, 1) (c) P (-4, -3) and Q (2, 0)5. Use Fig. 7.26 to write down the position vectors of the marked points.
 6. On squared paper, mark the points whose position vectors are given below.
 (a) Write down the position vector of B and of C. (b) The position vector of point D
 7.5 Multiplying vectors by a scalarActivity 7.7Kigali, Rwamagana and kayonza are along the same road. Assume the road is straight which runs east of Kigali. From Kigali to Rwamagana is 55 km and from Rwamagana to Kayonza is 35 km.a) Draw a sketch diagram showing the location of towns along the straight line.b) If the distance from Kigali to kayonza is a, express in terms of a, i) distance from Rwamagana to Kayonza. ii) distance from Kayonza to Rwamagana.
 If vectors PQ = QR = RT, then PT = PQ + QR + RT = a + a + a = 3a. In the above case, the value 3 is considered as a scalar multiplied to a vector a. If we have a vector say a, it can be multiplied by a constant k to give the final result as the vector.
 The scalar k can be any positive or negative number. Each component of the vector is multiplied by the scalar.
 Note:When a vector is multiplied by a positive scalar, its direction does not change. However, when a vector is multiplied by a negative scalar, its direction is reversed.Exercise 7.7
 7.6 The magnitude of a vectorActivity 7.8In groups, discuss the following:1. The distance from Kigali to Musanze is –100 km. Is this statement valid? Explain your answer.2. A man moved from a point K, 40 km due East to point M. At point M, he turned north and moved 30 km to point N. However, there is a direct route from K to N.a) Sketch the diagram showing the man’s movement.b) Find the shortest distance from K to N.c) If the distance from K to M is x units and the distance from M to N is y units. Express the distance K to N in terms of x and y.The distance between two points is a scalar quantity hence it has no direction. Its value can therefore never be negative. It is always positive.Activity 7.91. Discuss with your classmate how to find the magnitude between two points A(x1, y1) and B(x2, y2).2. Using a graph paper, draw points P(2,6) and Q(5,3). Find |PQ
 We can also determine the magnitude of the vector between two points using the coordinates of the two points
 In the figure 7.30 below, the magnitude of OA is the length of line OA and is denoted as |OA| or |a|
 Since the magnitude of a vector is its length, the quantity is always a positive scalar.

 From this example, multiplying a vector by a scalar, k, also multiplies its magnitude by k. In general, |kr| = k|r|.
 Exercise 7.81. Let u = (1, 2) v = (3, 2) and w = (2,–1) be vectors in x–y plane. Find the following.(a) 3u + 2w(b) 2u + 3v(c) 2u – (w + v)(d) 3(u + 7w)(e) |3u – 2v|(f) |u-7v|(g) |4u – w|22. Let P (2, 4) and Q (3, 7) be two points on a straight line PQ. Find the midpoint of the line PQ. Find also the distance from P to Q.3. Compute the magnitudes of the following vectors in x-y plane.
 7. Find the distance between points P and Q given that:a) P(1, -2) and Q(2, 1)b) P(2, -2) and Q(0, 4)c) P(0, -2) and Q(0, 4)d) P(3, -3) and Q(-4, 1)
 9. Calculate the distances between the following pairs of points.(a) A (5, 0), B (10, 4)(b) C (7, 4), D (1, 12)(c) E (–1, –1), F(–5, –6)(d) P (4, –1), Q(–3, –4)(e) H (b, 4b), K(–2b, 8b)(f) M (–2m, 5m), N (–4m, –2m)10. State which of the following expressions represent the distance between the points A (a , b)
 Unit summary1. A vector is any quantity that has both magnitude and direction. Examples of vector quantities are: displacement, velocity, acceleration and force.2. Properties of a vector quantity are magnitude and direction.3. When a displacement vector is written as AB = ( x, y ) x y is called a column vector.4. Vector can be denoted using different ways:i) Bold capital letter e.g. ABii) Capital letters with arrow e.g. ABiii) Position vector with bold and small letters e.g. a, b or a , b5. Null vector has no magnitude and direction. It is denoted as 0 or 0 . 6. Two vectors are equivalent if they have the same direction and equal magnitude.7. A point that bisects a vector equally is called a midpoint. It lies halfway on the vector.8. The vector sum of two or more vectors is called resultant vector. 9. All position vector have 0 as their initial position.10. When a vector a = (x,y) x y is multiplied by a scalar k, we obtain ka = k (x,y ) x y = kx ky11. When a vector is multiplied by a position scalar, its direction does not change. However, when a vector is multiplied by a negative scalar, its direction is reversed.

 8. PQR is a straight line such that PQ = 2QR(a) Given P (6, 0) and R (4, 3), write down the column vectors for OP and OR.(b) If OP = p and OR = r, express RP, RQ and OQ in terms of p and r. Hence find the coordinates of point Q.9. Fig 7.32 shows triangle ABC. Use it to answer the questions that follow.
 (a) What is the opposite vectors of:(i) AB(ii) BC(iii) AC(b) Given that A(1,3) and C(5,3). Find |AC|
UNIT8: PARALLEL AND ORTHOGONAL PROJECTION
Key unit competence
By the end of this unit, I will be able to transform shapes under orthogonal or parallel projection.
Unit outline
• Definition of parallel projection
• Properties of parallel projection
• Definition of orthogonal projection
• Properties of orthogonal projection
• Images of geometrical shapes under parallel projection and orthogonal projection.
8.1 Parallel projection
8.1.1 Introduction to parallel projection
Activity 8.1
In this activity, you will draw two parallel line using a ruler and a set square.
Step 1: Using a ruler, draw a straight horizontal parallel line AB as shown in figure 8.1 below.

Step 2: Align the base of the set square to the line AB as shown in the figure 8.2.

Step 3: Place the ruler along the set square as shown in figure 8.3.

Step 4: Slide the set square along the ruler (you can slide it for about 2 cm) as figure 8.4 shows. As you slide up the set square, ensure that you hold the ruler down firmly.

Step 5: Draw a line at the new base of the set square. Is the line parallel to line AB?
Step 6: Measure the distance between the two lines at different positions. What can you comment about the distance between the two lines?
The distance between the two lines are discovered to be equal. This new line is parallel to the line AB
From activity 8.1, we discovered that parallel lines are those lines which can never intersect. This is because they have a constant distance between them.
8.1.2 Parallel projection of a point on a line
Activity 8.2
1. In your note book draw a line and label it L.
2. On same side of line L, mark two points A and B not more than 3 cm from L, and about 2 cm apart.

3. From point A, draw any-line segment to meet L at point A′. From B, draw another line segment to parallel to AA′ to meet L and B′.

This figure shows a one to one mapping where A′ is the image of A and B′ the image of B on line L
In such a mapping A′ is called the projection of A and B′ the projection of B on line L. This is called a parallel projection. Why is this a parallel projection?
Note
If we join A to B in fig 8.6 would be the parallel projection of line segment AB on the line L.
Shadows are formed as the result of an opaque object placed in front of the source of light ray where parallel light rays project the object to the wall. A shadow is the projection of the object on the wall parallel to the direction of the light rays as shown on the figure 8.7 below.

Consider triangle ABC which is placed in the direction of parallel lines as fig 8.8 shows. The triangle is projected by the parallel lines to form the image along the straight line XY.

A′, B′, and C' show where the vertices are moved by “parallel” projection. Parallel projection of a point can also be described in the following steps.
Let L1 and L2 be two intersecting lines and Q a point in the plane defined by L1 and L2. The image of Q under parallel projection on line L2 in the direction of L1 is obtained in the following ways
(a) Draw a line parallel to L1 through point Q as shown in the diagram below
(b) Let the line drawn meat L2 at point Q′.
(c) Q′ is the image of Q under projection on L2 in the direction of L1.

In a similar way, find the images of U,S,V,T and R under the same parallel projection.
Fig 8.9 shows the points U,S,Q,V,T,R and their corresponding images U′,S′,Q′,V′,T′,R′ under the parallel projection on L2 in the direction of L1.
Remember!
Fig 8.9 can only represent a parallel projection on L2 in the direction of L1 if and only if the line segment UU′, SS′, QQ′, VV′, TT′, and RR′ are all parallel to L1. How can you verify that this is so?
The images for the points U, S, Q, V, T, R under parallel projection are U′, V′, Q′, T′ and R′ as figure 8.9 shows
8.1.3 Parallel projection of a Line Segment on a line
On the diagram below, consider the line segment AB and the line L1 and L2 as figure 8.10 shows.

The line segment AB is projected by first projecting A on L2 in the direction of L1 to give the image A´ and then projecting B on L2 to give B´. This is shown in figure 8.1

The parallel projection of line AB segment on L2 is line segment A´B´.
8.1.4 Properties of parallel projection
Activity 8.3
Refer back to Fig 8.11, find the lengths of:
1. (a) AB
(b) A´B´ what do you notice?
2. (a) AA´
(b) BB′ what do you notice?
3. Evaluate (a) A´B´/AB
(b) BB´/AA´
4. Measure angles:(a) <AA´B´
(b) <BB´O What do you notice?
(c) What can you say abut the interior angles of the figureAA´B´B?
Note that:
i) The parallel projection on one line, all images are formed on that line.
ii) A point on the line is mapped onto itself under parallel projection on the same line. Such a point is said to be invariant.
iii) Invariant points are those points which lie exactly on the line of projection under parallel projection. For example in Fig. 8.12, A, B, C and D are invariant points. In figure 8.12, the line segment AB is equal to CD i.e. AB =CD

The parallel projection of line segment AB is A´B´and the parallel projection of the segment CD is C´D´. If two line segments have the same length, then their parallel projection have the same length as well. If the segments are in the same direction.

iv) If a line segment, say AB to be projected is parallel to the direction of the projection, then the two points have the same image. In fig 8.13, points C and D define a line segment CD which is parallel to L1, the line giving the direction of the parallel projection.

v) The image of midpoint of line segment is the midpoint of the image of the segment. (see Fig. 8.14)

8.1.5 Parallel projection of a geometric figure on a line
Activity 8.4
Given that L1 and L2 represent a line of parallel projection, and the direction of the projection respectively;
1. Draw the lines L1 and L2 to intersect at point O at 40°.
2. Draw a simple geometric figure i.e. a triangle, a rectangle, trapezium etc away from the line L1 and L2.

3. Construct the parallel projections of A, B and C on L1 in the direction of L2. Label the image of A,B and C.
4. Fig 8.12 shows the mapping of ∆ABC onto the projection line L1 parallel to line L2.
5. Describe the image of ABC.
6. In a similar way identify a line of projection and another one to show the direction of the projection.
7. Find the image of another plane shape under a parallel projection. 8. Comment on your findings.
Note
In Fig. 8.12, ∠ABC is the object.
• The three vertices have been projected on the line L1.
• A′B′ and C′ are the images of A,B,C respectively.
∴ ∠ABC is mapped onto a line segment
A´C´1. Fig. 8.16 represents a line segment AB and a half line L intersecting at point B, at an angle of 30°

a) Given that AB = 12 cm and that BC= CD= DE = EF . Copy this figure accurately. To mark off C, D, E and F, use a pair of compasses, start from B using a radius of 3 cm
b) Join F to A.
c) Find the parallel projections of C, D and E on AB in the direction FA. Let C, D, E to be projections of C’, D’ and E’.
d) As accurately as possible, measure the lengths of the line segments BC′, C′D′, D′E′ and E′A, stating your measurements to the nearest mm. What do you notice?

ii) What do you notice?
f) What is the image of F under this projection?
2. Using plain paper, ruler and compasses, a) Draw two lines L1 and L2 to intersect at a point O at an angle of 60°

b) Mark two points A and B as shown so that line segment is not parallel to L1 or L2
c) Draw the projection of point A on L2 in the direction of L1 , then draw the projection of points B in the same way.
d) If A′and B′are the images of A and B respectively, describe the shape of the figure marked as AA′B′B.
e) Use your protractor to measure the interior angles of the figure. Name the two angles you could have stated without measuring why?
3. a) Draw a pair of parallel lines L1 and L2
b) Draw another line L3 to meet both L1 and L2 at a non-right angle at points A and B respectively.

c) Pick another point P on L1 and draw its parallel projection on L2 in the direction L3.
d) If the projection of P on L2 is denoted as Q, what can you say about figure PABQ? e) List the properties of the figure PABQ.
4. a) On a graph paper, draw lines whose equalities are (i) y + x = 5 (ii) y = 1/2 x
b) Let the lines meet at point P.
c) Find the parallel projection of a point A(-1, 3) on line y = 1/2 x in the direction y + x = 5. Let the image of A in this projection be denoted by A′.
d) Find the parallel projection of the point A on the line y + x = 5 in the direction y = 1/2 x, and let the image of A in this projection be denoted as A”.
e) State the coordinates of the points P, and A”. Name the geometric figure AA′PA′′and list its properties
5. Fig 8.19 shows object ∆ABC on the cartesian plane. Using line y = -x as the direction of parallel projection, find the coordinates of the image of ∆ABC on: (i) x-axis (ii) y-axis.

8.2 Orthogonal projection
8.2.1 Introduction to orthogonal projection
Activity 8.5
• Draw a line segment AB on a piece of paper. Above the line, mark point P as shown in Fig. 8.20.

• Place a pair of compasses at point P and mark two arcs on line AB as in Fig. 8.21.

• Without changing the radius of the compass, place the compass on each of the arcs already made on line AB. Make another pair of intersecting arcs below the line as shown in Fig. 8.18.

• Using a ruler, draw a line from P to meet AB at point P´as shown in Fig. 8.23.

From fig 8.19, PP´ is a perpendicular to AB and P´ is the image of P.
If a line segment PP´ meets another line say L2 at right angles at point P´, P´ is called orthogonal projection of point P in the line L2.
Orthogonal projection is the type of projection where the line of projection and the line giving the direction meet at 90°. For example, in the figure 8.23, L1 is the line of projection, L2 is the line giving the direction, and P is the object point.

Orthogonal projection can be regarded as a subject of parallel projections. In such a case it is not necessary to draw the first line if the line to show the direction of the projection is already known (see Fig. 8.25).

8.2.2 Orthogonal projection of a line segment on a line
Activity 8.6
Consider the horizontal line AB and a line PQ above line AB in Fig. 8.26.

1. Construct a perpendicular from point P to meet the line AB at 90°.
2. Put the compass at point P. Make two arcs on line AB.
3. Without changing the radius of the compass transfer it to the two arcs made on line AB and make other arcs that intersect below AB.
4. Using a ruler, draw the line from P to meet the point of intersection of the arcs below the line AB.
5. Repeat procedures 2-4 for point Q.
6. Discuss your drawing with other classmates.
P´Q´ is the orthogonal projection of PQ on line AB
8.3.3 Orthogonal projection of a geometric figure on a line
Activity 8.7

1. Let L1 represent the line of projection and figure ABCD the object to be projected.
2. Construct the image points of ABCD using orthogonal projections on line L1 i.e. construct line segments from points A,B,C,D to the line of projection. On line L1, mark clearly the image points A´B´C´ and D´
3. Describe the shape of the image figure A´B´C´D´.
4. What properties of the trapezium ABCD have been preserved?
5. Repeat the activity using another geometric shape.
6. Comment on your findings.
Note: For the construction in activity 8.7 there was no need to indicate the direction of the projection. Explain the reason
Properties of orthogonal projection:
• The projection meets the line of projection at 90°.
• Preserves ratios of corresponding line segments and ratio of corresponding projections.
• Preserves the distance between line segments and pairs of corresponding points.
Exercise 8.2
1. Given the points A, B, C and D which are on the line L2. If the line L2 meets L1 at the angle of 60º. Point M is
4 cm from A. (See figure 8.28)
(a) Using a ruler and a protractor, draw accurately the diagram above. (b) Find the orthogonal projection of the points A, B, C and D on L1 (c) Find the ratios:

(d) What do you notice about the results from c(iv) and c(vii) above?
2. Study the graph below and answer the questions that follow.

The triangle ABC is given orthogonal projection on x axis.
(a) Find the coordinates of A', B' and C' under the projection on x-axis (b) Measure lengths:
(i) A'B'
(ii) B'C'
(iii) A'C'
3. Given that line AB=8 cm and it makes an angle of 35° to line L2 as shown in fig. 8.30.

By construction, find the length of orthogonal projection of line AB on line L2. 4. Given that BC´ =3.5 cm is orthogonal projection of BC=6 cm on line K as shown in Fig. 8.31

(i) By construction, determine angle CBC´.
(ii) Find the length BD if its orthogonal projection on line K is BD´ = 7 cm.
5. Use Fig 8.32 to find the projection of PQRS on the line y = x in the direction y = -x.
(a) State the coordinates of P´Q´R´S´
(b) Find the projection of PQRS on the line y = -x in the direction y = x (let the image points of PQRS be P´´Q´´R´´S´´

Unit summary
1. Parallel projection is projection in which the projection rays (lines) through the object are parallel to one another.
2. Properties of parallel projection
(i) The image of the midpoint of an object is the midpoint of the image (ii) The ratios of image to corresponding object lengths is constant For example

(ii) A point on the line or plane of projection is mapped onto itself by a parallel projection
(iv) All the points on the object that is line segment parallel to the projection rays are mapped onto one image point.
3. Orthogonal projection is a special parallel projection in which the projection rays (lines) through the object are parallel to one another and perpendicular to the line or plane of projection.
4. Orthogonal projection has all the properties of parallel projection.
Unit 8 test
1. Given that line AB = 8 cm and it makes an angle of 45° to line L as shown in Fig. 8.34.

By construction, find the length of orthogonal projection of line AB on line L.
2. a) Draw horizontal line AB = 8 cm
and AC = 5 cm with AC intersecting AB at 30º.(b) Draw a diagram showing orthogonal projection of point C onto line AB.
(c) Measure the length C to C´.
3. Draw the image showing the orthogonal projection of line segment PQ onto the line AB as shown in the figure 8.35

4. A student moved from point A, 6 m due east to B and changed the direction 8 m due north to point C as shown in Fig. 8.36.

(a) Using a ruler construct accurately the diagram showing the course.
(b) Draw line AC.
(c) Find the length of the line AC.
(d) Locate the midpoint D of AC.
(e) Project point D orthogonally to AB.
(f) If the image of point D is formed on point E along AB, find the ratio of length DE:CB.
UNIT9: ISOMETRIES
Key unit competence
By the end of this unit, I will be able to transform shapes using congruence (central symmetry, reflection, translation and rotation).
Unit outline
• Definition of isometries i.e. central symmetry, reflection, translation and rotation.
• Construction of an image of an object/ geometric shapes under isometries.
• Properties and effects of isometries
• Composite transformations up to three isometries.
9.1 Introduction to isometries
Activity 9.1
1. Use a dictionary or internet to find the meaning of the following terms:
(i) Transformation
(ii) Isometry
2. Compare and discuss your findings with those of other members of your class.
Using most geometrical shapes, we can transform a shape into a different shape or size or change position or direction etc. A figure or shape which has been altered in one way or the other is said to be transformed. The procedure or process of alteration is called a transformation.
An isometry is that transformation that does not affect the size, the shape or area of the object being transformed.
The shape that is being transformed is called the object and the transformed figure, the image.
Referring to the object, the image and the transformation, we can say that an isometry maps the object onto the image. Some examples of common isometry are translation, reflection, rotation, and central symmetry.
In this chapter, we will deal with reflection, central symmetry, translation and rotation.
9.2 Central symmetry
9.2.1 Definition of central symmetry
Activity 9.2
1. Copy figure 9.1, ABCDE in your note book and label the figure clearly as shown below.

2. Join point A to O. Extend line AO to A´ such that AO = OA´
3. Similarly join BO and extend it to B’ such that BO = OB´
4. Repeat procedure 1 for points C, D and E in order to locate points C´, D´ and E´, the images of C, D and E respectively.
5. Join the points A´B´C´D´E´ in that order to obtain a closed shape.
6. Describe figure A´B´C´D´E´ formed in relation to figure ABCDE.
7. How do the sizes, areas and shapes of ABCDE and A´B´C´D´E´ compare
From the activity 9.2,
• Figure ABCDE is identical to figure A´B´C´D´E´.
• Figure A´B´C´D´E´ is an inverted version of ABCDE.
• The two figures have same shape, same size and therefore same area.
• Activity 9.2 gives an example of central symmetry.
• Point O is the centre of the central symmetry.
Central symmetry is a transformation under which the image is inverted upside down about a point called the centre. The object and the image are equidistant from the centre, and the corresponding points lie on opposite sides of the centre.
9.2.2. Properties of central symmetry
1. An object and its image have same shape and size.
2. A point on the object and a corresponding point on the image are equidistant from the centre.
3. The image of the object is inverted.
4. Central symmetry is fully defined if the object and the centre are known.
Example 9.1
Triangle ABC has vertices at A(2, 1), B(2, -4) and C(5, -4).
Find the image of ∆ABC under the central symmetry with centre O(0, 0). State the coordinates of the image
Solution
Let the image be A´B´C´ Fig 9.2 shows the object and its image. On graph paper plot the points A(2, 1) B(2, -4), C(5, -4) and mark the origin O(0, 0). Join the points A,B,C to form triangle ABC.

Join A to O and extend line to A´ so that OA´= OA and
mark point A´. Join B to O and extend line to B´
so that OB´= OB and point B´.
Similarly locate point C′so that OC´= OC.
The coordinates of the image ∆ are: A´(-2, -1), B´(-2, 4), C´(-5, 4)
Exercise 9.1
1. Given that points A(4, 0), B(0, 3) and C(4, 3) are vertices of a triangle. Draw the triangle on a graph paper. Label this triangle clearly.Construct the image of ∆ABC under central symmetry, centre (0, 0).
2. Fig 9.3 below shows a triangle ABC and its image A´B´C´ under a certain transformation.

Identify the transformation and describe it fully.
3. Fig 9.4 below shows the image of figure ABCD under a central symmetry centre P.

(a) Copy the figure in your graph book and label it clearly.
(b) Accurately locate the object figure ABCD.
(c) State the coordinates of A,B,C and D.
4. Trace figure 9.5 below. Given that it represents an object and its image under a central symmetry, locate the centre of the transformations and label it O.

Use your construction to estimate the following:
(a) Lengths OA, OA´, OB, OB´, OC, OC´, OD, and OD´
(b) Angles between
(i) OA and OA´
(ii) OB and OB´
(iii) OC and OC´
5. ∆ABC has vertices at A(1, 2) B(-2, 3) and C(-1, 5) the image of ∆ABC under central symmetry has vertices at A′(3, 2) B′(6, 1) and C′(6, -1). Using graph paper and a suitable scale, plot the points A, B, C, A′, B′ and C′
Join the appropriate points to show the distinct ∆s ABC and A′B′C. Use geometric construction to locate the centre, D, of the central symmetry. State the coordinates of D.
6. (a) Given that P′Q′R′S′ is the image of PQRS under a central symmetry, and that P′(1, 1) Q′(6, 1) R′(5, 4) S′(2, 3) draw figure P′Q′R′S′ on a graph paper. If the centre of central symmetry is C(4, -1), find the coordinates of P,Q,R,S.
(b) If P′′Q′′R′′S′′ is the image of P′Q′R′S′ under a central symmetry, find the coordinates of the centre given that P′′(-3, -5), Q′′(-8, -5) R′′(-7, -8) S′′(-4, -7)
9.3 Reflection
9.3.1 Definition to reflection
We have already seen that the two parts of a shape on opposite sides of a line of symmetry, are mirror images of each other.
Activity 9.3
Look at yourself in a mirror. Do you see yourself as others see you? In what ways does your image differ from yourself? Answer the following questions.
1. If you raise your right arm, which arm appears to be is raised in your image?
2. Which is taller, you or your image?
3. If you stand 3 m infront of the mirror, where does your image appear to be in relation to the mirror?
4. If you walk towards the mirror, what happens to your image?
• Now consider figure 9.9 which shows Peter standing infront of a vertical mirror denoted by xy and his image on the other side of the mirror line.

• Draw a line joining the tip (N) of Peter’s nose to the tip (N’) of Peter’s image.
• Let the line NN´ meet the mirror line at a point O. Measure the distance NO, ON´ giving your answer to the nearest mm. What do you notice?
• Using a protractor, measure all the angles formed at point O. What do you notice?
From activity 9.3 you should have noticed the following
1. You and your image
• Are identical
• Face opposite directions.
• Stand same distance away from the mirror.
• If you walk towards the mirror your image walks towards you.
2. For Peter and his image
• NO´= NO´
• All the angles of point O are equal
i.e. each of the angles at O is 90°
Activity 9.3
above helps us to drive the properties of reflection as a transformation. Under reflection, the mirror is represented by a line called the mirror line.
9.3.2 Properties of reflection
The following are some of the properties of reflection as a transformation:
1. An object and its image have the same shape and size.
2. A point on the object and a corresponding point on the image are equidistant from the mirror line.
3. The image is laterally inverted, i.e. the object’s left-hand side becomes the image’s right-hand side and vice versa. Object and image face opposite directions. They are oppositely congruent.
4. The line joining a point and its image is perpendicular to the mirror line.
5. A point on the mirror line is an image of itself. Such a point is said to be invariant since its position does not change.
6. A reflection is fully defined if an object point and its image are known or one point and the mirror line one given.
Note: We think of a mirror as two-sided so that if object point B is on the same side as the image A′, then its image B′ is on the same side as the object A (Fig. 9.7)

Example 9.2
Draw the image of triangle PQR (Fig. 9.8) under reflection in the mirror line m.
Solution
(i) To obtain the image of point P, use a pair of compasses and a ruler to draw a perpendicular from P to the mirror line and produce it (Fig. 9.9).
(ii) Mark off P′, the image of P, equidistant from the mirror line as P.
(iii)Similarly, obtain Q′ and R′, the images of Q and R respectively in the same way.
(iv)Join P′, Q′ and R′ to obtain the image of ∆PQR.

Exercise 9.2
1. Trace each of the drawings in Fig. 9.10 below and construct their images under reflection in the indicated mirror line m.

2. Fig 9.11 shows objects and their images under reflection. Trace each of the drawings and construct the mirror line in each case.

9.3.3 Reflection on the Cartesian plane
Reflection in the mirror lines x-axis
(y = 0) and y-axis (x = 0)Activity 9.4
• Consider a triangle of sides with the coordinates A(1, 4), B(3, 5) and C(4, 12).• In the cartesian plane provided, plot the points A, B C and join the points.
• Identify the x and y axes and reflect the triangle along these axes.
• What do you notice about the shape and the distance of the image to the object from the line of reflection?
• Discuss with the whole class
Discussion
x and y - axes are lines y=0 and x=0 respectively. Reflection along these axes takes the object's image to the opposite side of the axis with both the object and image distances from the axis equal. The image remains the same as the object.
Example 9.3
A(2 ,4 ), B(6, 4) and C(7 , 2) are the vertices of a triangle. Find the image of the triangle under reflection in the line (i) x-axis, (ii) y-axis, labelling them as A′B′C′ and A′′B′′C ′′ respectively.
Solution
Fig. 9.12 shows ∆ABC and its images.
• x-axis is the line y = 0 while y –axis is the line x = 0.
• To construct the images, a perpendicular line is dropped to these lines y = 0 and x = 0 respectively.
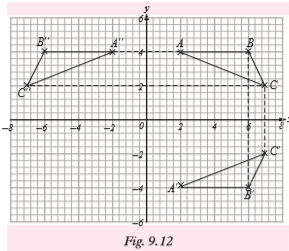
From example 9.3 above, how are the x-coordinates and y-coordinates of an object point and its image related? How are the y-coordinates related? From the example, you should be able to notice that

9.3.2.1 Reflection in the mirror lines x = k and y = k
Example 9.4
Find the images of ∆ABC with vertices A(–1 , –2), B(1 , 5) and C(2 , 3) under reflection in the mirror lines (i) x = –1, and (ii) y = 1, labelling them as ∆A′B′C′ and ∆A′′B′′C′′ respectively.
Solution
First, you need to identify the lines x = –1 and y = 1 on the Cartesian plane. Then we obtain the image by first reflecting it on the line x = –1 followed by a reflection on y = 1. ∆ABC and its images are shown in
Fig. 9.13.
What do you notice about the relationship between the x-coordinates and y – coordinates of an object point and its image from example 9.3 above?
You should notice that:

9.3.2.2 Reflection in the mirror lines y = x and y = –x
Example 9.5
A(–1,2), B(1,5) and C(3,4) are the vertices of a triangle. Find the images of the triangle when it is reflected in the mirror lines (i) y = x, and (ii) y = –x, labelling them as A′B′C′ and A′′B′′C′′ respectively.
Solution
Fig. 9.14 shows ∆ABC and its images. The same method of constructing the image is applied here where the two lines y = –x and y = x are first identified on the plane then a perpendicular is constructed.
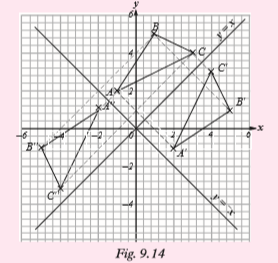
For example 9.5 above, how are the x-coordinates and y-co-ordinates of an object point and its image related?
You should notice that:

Example 9.6
The vertices of a quadrilateral are A(2, 0.5), B(2, 2), C(4, 3.5) and D(3.5, –1). Find the image of the quadrilateral under reflection in line y = 0 then reflect the image in the line y = –x.
Solution
We first obtain the image under reflection in line y = 0. Then we reflect this image in line y = –x. This is shown in Fig. 9.15 In the figure, A'B'C'D' is the reflection of ABCD in line y = 0. A"B"C"D" is the reflection of A'B'C'D' in line y = –x
Thus the required image vertices are:
A"(0.5 , –2), B"(2 , –2), C"(3.5 , –4) and D"(1 , 3.5)

Exercise 9.3
1. A quadrilateral has vertices P(4 , 2),Q(7 , 3),R(6 , 2) and S(4 , 0). Draw, on the same axes, the quadrilateral and its images under reflection in
(a) the x-axis,
(b) the line y = x,
(c) the y-axis,
(d) the line y = –x, labels the images as P′Q′R′S′, P′′Q′′R′′S′′, P′′′Q′′′R′′′S′′′ and P′′′′Q′′′′R′′′′S′′′′ respectively .
State the coordinates of each image point.
2. The vertices of a triangle are A(–4 , 6), B(–3 , 2) and C(–7, 1). Find the final image of the triangle under
(a)(i) Reflection in line y = 0
(ii) Reflection of the image in (i) In line y = x.
(b) (i) Reflection in line y = –x
(ii) Reflection of the image in (i) In line x = 0.
(c) (i) Reflection in line y = x
(ii) Reflection of the image in (i) In line y = 1.
(d) (i) Reflection in line x = 1.5
(ii) Reflection of the image in (i) In the same line.
3. Under reflection, which properties of an object are invariant?
4. ∆ PQR has vertices P (2, 1), Q (4, 3) and R (3, 5) and those of ∆ P′Q′R′ are P′ (2, –1), Q′ (4, –3) and R’ (3, –5). On the same axes, draw the two triangles. Describe the transformation that maps ∆ PQR onto ∆P′Q′R′.
9.4 Rotation
9.4.1 Introdcution to rotation
Rotation is another example of an isometric transformation.
Activity 9.5
Draw a triangle OAB, as shown in Fig. 9.16. Trace the triangle using tracing paper. Name the vertices of the tracing O′, A′ and B′ to correspond with O, A and B.

Place the tracing exactly on top of the original figure. Put a pin through O and O′. Keeping the lower sheet still, rotate the tracing anti-clockwise about O through an angle of approximately 90°. Answer the following questions.
(a) Through what angle has each of lines OA and OB turned?
(b) Which is longer, AB or A′B′; or they are of the same length?
(c) Have any points remained in the same position? If so, which ones?
(d) Are the angles of the image the same as the corresponding angles of the object triangle?
Put the tracing back exactly on top of the original triangle. Rotate the tracing clockwise about O through 90°. Answer the above questions now. Do you get the same result as before?
The point about which a figure is rotated is called the centre of rotation and the angle through which the figure is rotated is called the angle of rotation.
9.4.2 Direction of rotation
Activity 9.6
• Using the same figure and tracing as in Activity 9.5, arrange the tracing to coincide with the original triangle again.
• Rotate the tracing about O through 60°. How do you know when to stop rotating the tracing?
• You may do this by first marking the final position of OA on the lower sheet before putting the tracing on top. Fig 9.17 shows the lower sheet with the image position of OA drawn as broken line OA′. OA′ is called a guide line.
• Arrange the tracing to coincide with the original triangle.
• Rotate the tracing about O until OA′, on the tracing, comes on top of the guide line.

• Is OB turned the same angle as OA? Measure to check your answer.
• Is any point remained fixed in this rotation?
• What is the angle between AB and A′B′? (Extend the line segments if necessary).
The direction of rotation is important! An anticlockwise turn is referred to as positive turn while a clockwise turn is referred to as negative turn. Therefore, an anticlockwise turn of 90° is called a rotation of +90° while a clockwise turn of 90° is called a rotation of –90°
Note: This convention is used throughout in mathematics, science and engineering. It is only in the measurement of bearings that the positive direction is clockwise.
Activity 9.7
• Draw another triangle as in Activity 9.6 and label its vertices A, B and C.
• Mark on the lower sheet a point O, which is not on the triangle.
• Rotate the tracing about O through an angle of –90°. How do you do this?
• You may do this by using guide lines.
• In Fig. 9.18, OD has been drawn. This will be rotated to the position OD′

• On your lower sheet, mark the guide lines OD and OD′.
• Place the tracing back on the figure and trace OD.
• Now rotate the tracing through –90° about O.
• How do you know when to stop rotating the tracing?
• What size is the angle between a line and its image in this rotation? (Extend the line segments, if necessary, to answer this).
• What conclusion can you draw?
• Which is longer, OA or its image OA′? What about OB and OB′, OC and OC′?
• Instead of rotating through –90°, through what angle would you have to rotate the tracing in positive direction to get into the same position?
• We say that a rotation of 270° has the same effect as one of –90°.
• What positive rotation has the same effect as one of –150°?
• What negative rotation is equivalent to a rotation of 320°?
9.4.3 Properties of rotation
From Activities 9.5 to 9.7, you should have noticed that rotation has the following properties:
1. All points on the object turn through the same angle in the same direction.
2. The angle between a line and its image equals the angle of rotation.
3. Each point and its image are the same distance from the centre of rotation.
4. The centre of rotation is invariant i.e. it does not change its position.
5. The object figure and its image are identical i.e. directly congruent.
6. A rotation is fully defined when the centre and direction angle of rotation are specified.
7. A positive rotation through an angle θ is the same as a negative rotation through an angle of (360°–θ) about the same centre.
8. Rotation preserves shape and size.
9. By convention, a clockwise rotation is negative and anticlockwise rotation is positive.
9.4.4 Rotation and congruence
Activity 9.8
Refer back to Activities 9.5 to 9.7 you did before.
Looking at the object and the image. What can you say about;
(a) the sizes of corresponding angles?
(b) the lengths of corresponding sides?
(c) the orientation (i.e. the direction in which they face)?
Under rotation, an object and its image are directly congruent.
9.4.5 Locating an image given the object, centre and angle of rotation
Activity 9.9

• Identify point M, the midpoint of line segment AB and join it to point C.
• Identify point N, the midpoint of line segment AC and join it to point B.
• Let CM and BN meet at a point O.
• Using point O as the centre and 180° as the angle of rotation, draw the image of ∆ ABC under the rotation. Label the image as ∆ A´B´C´.
• Describe the congruency of the two triangles.
This activity helps you to find the image of a given figure provided the centre and angle of rotation are known. In this case, O is the centre of rotation and 180° is the angle of rotation
Example 9.7
Fig. 9.20 shows a triangle PQR in which PQ = 3 cm, QR = 4 cm and PR = 5 cm. Copy the figure and locate ∆P′Q′R′, the image of ∆PQR, under a rotation of 65° about point O.

Solution
To locate ∆P′Q′R′, proceed as follows:
(a) Join P to O. W ith OP as the initial line, measure an angle of 65° anticlockwise at O and draw a construction line OA. (Fig. 9.21).
(b) To obtain P ′ on OA, measure OP ′ = OP. Mark the point P′.
(c) Repeat step (a) for Q and R to obtain construction lines OB and OC respectively. Measure OQ′ = OQ and OR′ = OR on OB and OC to obtain points Q′ and R′.
(d) Join P′, Q′, R′ to obtain ∆P′Q′R′

9.4.6 Finding the centre and angle of rotation
Activity 9.10
• Trace or copy Fig. 9.22 below in your exercise book

• To join P to B′, C to C′ correct the OA and OA′ include O′
• Construct perpendicular bisectors of BB´ and CC´ to meet at point O.
• Join (i) OA and OA′, (ii) OB and OB′ and (iii) OC and OC´. What do you say about the lengths of the pairs of line segments?
• Measure angles (i) <AOA´ (ii) <BOB´ (iii) <COC´ and comment about your answer.
• Describe the significance of the point O with reference to the triangles ABC and A´B´C´.
• Describe the meaning of the size of the angels; AOA´, BOB´ and COC´
Note
A rotation is fully defined if both the object and the image are known. Under rotation, every point of an object moves along an arc of a circle whose centre is the centre of rotation. Thus, if a point A is mapped onto a point A′ by a rotation about a point O, then AA′ is a chord of the circle centre O, through A and A′ (Fig. 9.23).

The perpendicular bisector (mediator) of a chord of a circle passes through the centre of the circle.
Thus, the perpendicular bisector (mediator) of AA′ passes through the centre of rotation O. We use this fact in locating the centre of rotation.
Example 9.8
In Fig. 9.24, ∆A′B′C′ is the image of ∆ABC after a rotation. Copy the figure and locate the centre of rotation. Determine the centre and angle of rotation

Solution
To locate the centre of rotation, proceed as follows:
(a) Join A to A′ and construct the mediator of AA′ (Fig 9.25).
(b) Join B to B′ and construct the mediator of BB′.
(c) Produce the mediators in steps (a) and (b) so that they intersect at point O.
(d) Construct the mediator of CC′. This mediator also pass through O. Using the method of Activities 9.9 to 9.11, check that O is actually the centre of rotation.

To find the angle of rotation, join any one of the points A, B or C to the centre of rotation O. Also join the corresponding image point to O. Measure the angle thus formed. The angle of rotation is –120°.
To find the centre of rotation, we draw the mediators of the line segments formed by joining object points to their corresponding image points. As all the mediators pass through the centre of rotation, it is sufficient to find the intersection of any two mediators. To find the angle of rotation, we join a pair of corresponding points to the centre of rotation, then measure the angle formed at the centre and specify the direction of the rotation.
Exercise 9.4
1.The drawing in Fig. 9.26 has a rotational symmetry of order 2

(a) What point is the centre of rotational symmetry?
(b) Which lines are parallel?
(c) What is the image of point S?
(d) If the points P, Q, T, and S are joined, what kind of quadrilateral is formed?
(e) If PT = 9 cm, what is the length of RT? (f) If ∠RST = 48°, what other angle is 48°?
2. PQ is a chord of a circle centre O (Fig. 9.27). The circle is rotated about O so that P′Q′ is the image of PQ.

(a) What can you say about the length of PQ and P′Q′?
(b) What is the perpendicular distance of P′Q′ from O, given that PQ is a perpendicular distance x from O?
(c) Copy and complete the following statement: Equal chords of a circle are the same ______ from the centre of the circle.
3. Each part of Fig. 9.28 shows an object and its image after rotation
(a) Trace the diagrams and find the centres of rotation.
(b) Find the angle of rotation in each case giving your answer both as a positive and a negative angle.


9.4.7 Rotation in the cartesian plane
Activity 9.1
Consider Fig. 9.29 on the cartesian plane, showing a triangle ABC and its images after rotations with different angles of rotation.

1. With ∆ABC as the object and ∆A′B′C′ as the image:
(i) What is the centre of rotation?
(ii) What is the angle of rotation?
(iii) Copy and complete Table 9.1.

2. With ∆ABC as the object and ∆A′′B′′C′′ as the image:
(a) What is the centre of rotation?
(b) What is the angle of rotation?
(c) Copy and complete Table 9.2

3. With ∆ABC as the object and ∆A′′′B′′′C′′′ as the image;
(a) What is the centre of rotation?
(b) What is the angle of rotation?
(c) Copy and complete Table 9.3.

From activity 9.11 you should have noticed that
A rotation about the origin (0, 0);
1. through 90° maps a point (a, b) onto the point (–b, a).
2. through –90° maps a point (a, b) onto the point (b, –a).
3. through 180° maps a point (a, b) onto the point (–a, –b).
Where do rotations of 0° and 360° about the origin map point (a, b)?
Activity 9.12
Consider a quadrilateral with the vertices A(2, 5), B(4, 5), C(6, 3) and D(3, 2). With (1, 2) as the centre of rotation, rotate quadrilateral ABCD through 180°.

From Activity 9.12, you should notice that a rotation of 180° about a point (1, 2) maps a point (a, b) onto the point (2 × 1 – a, 2 × 2 – b).
A rotation of 180° about (h, k) maps a point (a, b) onto the point (2h – a, 2k – b).
Example 9.9
ABCD is a rectangle whose vertices are A (1, 0), B (4, 0), C (4, 2) and D (1, 2). Find the co–ordinates of the image of the rectangle A´∴B´∴C´∴D´∴, of ABCD after a rotation of –90° about (0, 0)
Solution
On a graph paper or a squared paper, draw rectangle ABCD. Since the rotation is negative, it is in a clockwise direction, measure AOA′= 90º to locate A′ the image of A, such that OA = OA′. Similarly, measure ∠BOB′ ∠COC′ = ∠BOB′ = 90º and BO = OB′, OC = OC’, OD = OD′to locate B′,C′and D′, the images of B,C, and D respectively. Fig. 9.30 below shows both the object and its image rectangle.

The co-ordinates of the image are: A′(0,−1), B′(0,−4), C′(2,−4) and D′(2,−1)
Example 9.10
A triangle with vertices A (1, 3), B (2, 1) and C (3, 1) is mapped onto another triangle with vertices A′ (-3, 1), B′ (-1, 2) and C′ (-1, 3). Describe this transformation fully.
Solution
The object and its image are shown in Fig. 9.31.

Both the object and its image are directly congruent. Since ∆ ABC cannot map onto ∆ A′B′C′ by a reflection or a translation, the transformation must be a rotation. To find the centre of rotation;
(i) Join AA′ and construct its perpendicular bisector. (ii) Join BB′ and CC′ and construct the perpendicular bisectors. The perpendicular bisectors meet at the centre of rotation referred to as point O. Hence, the centre of rotation is (0, 0) i.e. about the origin.
To find the angle of rotation;
(i) Join AO and A′O
(ii) Measure ∠ AOA′.
∠ AOA′ = 90º
So, a rotation about point O maps OA onto OA′. Similarly, OB → OB′ and OC → OC′.
Since ∠AOA′ = 90º,
∴ the transformation is a rotation centre (0,0) angle 90º. This is a positive rotation.
Note: The angle of rotation can also be given as –270º also written as 270º; clockwise.
Exercise 9.5
1. L(4, 2), M(–1, –2) and N(3, 0) are the vertices of a triangle. Plot these points on a squared paper and with C(2, 1) as the centre, rotate LMN through an angle of 90°.
(a) Write down the coordinates of L′, M′ and N′.
(b) If S is the point (2, –1), what are the coordinates of S′?
(c) If T is the point (3, 4), what are the coordinates of T′?
(d) Without measuring, state the angle between LM and L′M′.
(e) What is the path traced out by L in moving to L′?
2. A(–3, 1), B(1, 1), C(1, –3), D(–3, –3) and P(–1, 3), Q(3, 3), R(3, –1), S(–1, –1) are the vertices of two squares ABCD and PQRS. Describe fully the rotation that maps:
(a) ABCD onto QRSP (this means that A is mapped onto Q, B onto R, and so on).
(b) ABCD onto SPQR, and
(c) ABCD onto RSPQ.
3. Write down the images of the following points under rotation through the given angles and about the stated centres.
(a) Centre (0, 0), angle 90º
(i) (4, 4)
(ii) (3, –4)
(iii) (4, –7)
(iv) (–6, –8)
(b) Centre (0, 0) angle –90º
(i) (7, 1)
(ii) (–3, 6)
(iii) (4, –7)
(iv) (–2, –3)
(c) Centre (0, 0), angle 180º:
(i) (4, 4)
(ii) (–3, 2)
(iii) (0, –5)
(iv) (–3, –4)
(d) Centre (3, 2) angle 180º:
(i) (2, 3)
(ii) (–5, 3)
(iii) (4, –5)
(iv) (3, –1)
(e) Centre (–2, –5) angle 180º:
(i) (7, 1)
(ii) (–3, 6)
(iii) (4, –7)
(iv) (–2, –3)
4. A negative quarter turn about the point (0, –1) maps ABC onto A′B′C′ with the vertices A′(3, 1), B′(0, 5), and C′(0, 1). Find the vertices of ABC.
5. A quadrilateral has vertices A(1, 3) B(2, 5) C(4, 4) and D (3, 3).
(a) Find the coordinates of the image quadrilateral A′B′C′D′ under reflection in the line y = 2.
(b) A certain transformation maps points A′, B′, C′ and D′ onto points A′′(–5, –3), B′′(–7, –3), C′′(–8, –2), and D′′(–6, –1) respectively. Describe this transformation fully.
6. ∆ LMN has vertices L (2,3), M (2,5), N (6,5). Find the coordinates of L′M′ and N′ under the following transformations:
(a) Rotation of 90o about (0, 0)
(b) Rotation of –90o about (0, 0)
(c) Rotation of 180o about (0, 0)
7. A triangle has vertices at X (3, 5), Y (3, 2) and Z (5, 2). Describe fully the transformation that maps:
(a) ∆ XYZ onto ∆ X′Y′Z′ whose vertices are X′ (–3, –5), Y′ (–3, –2) and Z′ (–5, –2).
(b) ∆ X′Y′Z′ onto ∆ XYZ given that vertices of X′Y′Z′ are X′ (–3, 5), Y′ (–3, 2) and Z′ (–5, 2).
9.5 Translation
9.5.1 Definition of translation
Activity 9.13

2. Draw the line segment joining B to B′ as shown in Fig. 9.37 (b).
3. Slide the tracing using line BB′ as a guide line, to ensure that B moves onto B′ in a straight line.
4. When B coincides with B′, stop the slide. What do you notice about the positions of A and C?
5. What do you notice about the new position of ∆ABC? What can you say about the two triangles?
From Activity 9.13, we notice that each point on triangle ABC has moved the same distance in the same direction. The process that moves triangle ABC onto triangle A′B′C′ is called a translation.
Note:
In our previous work, under properties of reflection and properties of rotation we noticed that under reflection and rotation, sides, angles and area were invariant. This is similar to the findings we have observed under translation. Thus, a translation is described using distance and direction.
Properties of a translation
Translation encompasses the following properties:
1. All the points on the object move the same distance.
2. All the points move in the same direction.
3. The object and the image are identical and they face the same direction. Hence, they are directly congruent. This means that shape, size, angles and area are invariant.
4. A translation is fully defined by stating the distance and direction that each point moves.
Activity 9.14

From Activity, 9.16, you will notice that the translation that maps A onto A′ is defined by the distance |AA1| and the direction AA1. Similarly, the translation that maps A onto A2 can be defined by the distance|AA2| and the direction AA2. The displacement vector in any of the translations can be given by any BB1, CC1, DD1 or BB2, CC2, DD2 but the distance moved remains the same.
All the displacement vectors that describe a translation must be equal and therefore parallel, i.e. AA1, BB1, CC1, DD2 are equal. Similarly, AA2, BB2, CC2 DD1 are equal and therefore parallel.
Exercise 9.6
1. A packaging case is pushed (without turning) a distance of 8 m, in a straight line (Fig. 9.34). The corner of the box which was originally at A ends up at B.

How far will each of the following have moved?
(a) The upper front edge.
(b) Each vertex.
(c) The centre of each face.
(d) The centre of the box.
Fig. 9.35 shows a tiling composed of congruent parallelograms of sides 10 cm by 5 cm. Suppose the lines in the diagram are used as guide lines along which tiles may be slid.

2. (a) If tile 6 moves onto tile 7, in what direction has each vertex of the tile moved? How far has the point Xmoved? Make a statement that is true for every point on tile 6.
(b) Tile 6 moves along the guideline parallel to line BC in th direction BC. Observe and state the direction of motion of:
(i) each vertex of tile 6.
(ii) the point X on tile 6.
(iii) every point on tile 6.
(c) Answer Question (b) for the case where tile 6 is slid to position 14.
3. Name the tiles onto which tiles 1, 11, 15 and 18 will be translated by a translation equivalent to that of Question 2 (a).
4. (a) Name the tiles onto which tiles, 2, 8, 11 and 5 will be translated by a translation equivalent to
that of Question 2 (c).(b) What will be the images of letters E, F, G and H under the same translation in 2 (c) above?
5. Write down all the possible translations that are equal to the translation:
(a) FH
(b) AC
9.5.2 Translation in the Cartesian plane
Activity 9.1
Consider Fig 9.36 below. ∆ PQR is the image ∆ ABC under a translation. Described by the vector AP, BQ, CR or any other vector equal to the column vector. What do you notice about the translation shown

In this case, vector (4 2) defines the translation that maps ABC onto PQR. When using the Cartesian plane, a translation is fully defined by stating the distances moved in the x and y directions. The column vector that defines the translation is also called the displacement vector of the translation.
On the Cartesian plane, if a point P (x, y) is mapped onto anther point P′ (x + a, y + b), we say that P is mapped onto P′ by the translation (a b). The column vector ( a b) defines both the distance and the direction, where a represents the horizontal distance moved and b the vertical distance moved
In general,
A displacement vector AA′ is a quantity which describes a change in position from a point A to A′. It can be defined by giving the length AA′ and the direction of A′ from A or by giving a displacement vector called a column vector. This means that a translation can be performed if:
(i) the object and the displacement vector are known or
(ii) the object and the image of one (1) point are given or
(iii) the displacement vector and the image are given, to find the object.
Example 9.11
Triangle ABC has vertices A (0, 0), B (5, 1) and C ( 1, 3). Find the coordinates of the points A′, B' and C', the images of A, B and C respectively, under a translation with displacement vector (2 5 ) .

Example 9.12
Under a translation that maps a point P (2, 3) onto P ′(4, 7), rectangle ABCD is mapped onto another rectangle A′B′C′D′. Given that the vertices of A, B, C and D are (1, 4), (5, 4), (5, 2) and (1, 2) respectively, perform the following: (a) calculate the co–ordinates of A′B′C′ and D′. (b) describe the translation that would map A′B′C′D′ onto ABCD. (c) On the same axes, represent both the object and the image rectangles, and use them to verify your answers to (a) and (b) above.


Example 9.13
Triangle A′B′C′ is the image of ∆ABC under a translation. Given A′(0, –3) B′ (1, –5), C′(1, –2); A, B and C are points (–2, –2), (–1, –4), (–1, –1) respectively, find the translation vector.


Note that the result of the combined translation is the same as that obtained by doing the individual translations one after the other.
Exercise 9.7
1. Quadrilateral A′ B′ C′ D′ is the image of ABCD under a translation. Given that the vertices A, B, C and D have co-ordinates (2, 2), (5, 2), (5, 5) and (2, 5) respectively and that A′ is the point (9, 2) find:
(a) the translation vector
(b) the co-ordinates of:
(i) B'
(ii) C´
(iii) D´
2. Given the rectangle ABCD in question 1 and a displacement vector 6 3 , find the co-ordinates of the image of ABCD under this translation.
3. A triangle has vertices at L (1, 1); M (6, 1) and N (5, 4). Another triangle has vertices at L′ (3, 4), M′ (8,4) and N′ (7, 7).
A student in your class claims that ∆ L′M′N′ is the image of ∆LMN under a translation. Do you agree? Explain your answer.
4. The position of a point P in a Cartesian plane is described as P (x, y). Describe the transformation, that maps point P (x, y) onto the point
P′ (x + 5, y + 2).
5. (a) The points A and B have co–ordinates (3, –1) and (3, 1) respectively. Given that O is the origin, state the column vectors for the translations:
(i) OA
(ii) AB
(iii) OB.
(b) Find the co-ordinates of O′, A′ and B′ under each of the translations in (a).
6. A square has vertices at A (0, 1) B(2, 1), C(2, 3) and D(0, 3). Its image under a translation has vertices at A′(5, 5), B′(7, 5), C′ (7, 7) and D′(5, 7). Describe the following transformations:
(a) the one that maps ABCD onto A′B′C′D′.
(b) the one that maps A′B′C′D′ onto ABCD.
7. A certain translation maps P (3, 5) onto P′ (7, 8). Find the co–ordinates of the point which is mapped onto Q′ (2, 7) under the same translation.
8. A quadrilateral P′Q′R′S′ is the image of PQRS under a translation. Given vertices P (2, 0), Q′ (0, 3), P′ (5, 4), R′ (6, 9) and S′ (9, 4), find:
(a) the translation vector.
(b) the co-ordinates of R, S and Q.
(c) the translation that maps P′Q′R′S′ onto PQRS.
9.6 Composite Transformations
It is possible to combine more than one transformation using the same object. In such a case we say we are working with composite transformation.
Using the same diagram
• Using graph paper, draw OABC such that O(0, 0) A (1, 0) B(1, 1) and C(0,1)
• Find the image O′A′B′C′ of OABC after a reflection in the x-axis.
• Find the image O′′A′′B′′C′′ of O′A′B′C′ after a rotation of 90° about the origin.
• Now, translate O′′A′′B′′C′′ to O′′′A′′′B′′′C′′′ using displacement or translation vector 1 2 .
• State the coordinates of each image and ensure that the plotting is accurate.
• Discuss your findings with other members of your class.
From activity 9.16 above, the final image is identical to the original object to mean properties of isommetries are not altered by the combination of the transformations.
In this example, we did a reflection in the x-axis, followed by a rotation centre (0, 0) angle 90° followed by a translation with vector (1 2) In this case order does not matter.
Properties of composite transformations
1. If X and Q represent two transformations, then XQ meansperform transformation first followed by transformations X. i.e. if A represents an object, XQ(A), Q(A) = A′ (the image of A under Q and XQ (A) = X(A′) = A′′
2. Similarly if XQ and R are three transformations, and B is an object, XQR(B) = XQ(B′) (B′ image of B under R) = X(B′′) (B′′ is the image of B' under Q) = B′′′ (the image of B′′ under X)
3. If X represents a reflection under a certain mirror line, XX means a reflection in a line followed by a reflection in the same line i.e. XX(A) = X(A′)
= A′′ This means A′ = A′′
Note: XX can be written as X2
4. A translation followed by a translation equals another translation.
5. A rotation followed by another rotation about the same centre results in another rotation.
6. In general for two transformations X and Q, QX ≠ XQ.
7. Composite transformations are performed successively in the given order as in point 2 above.
Example 9.16
ABC is a triangle with vertices A(1, 2), B(3, 1) and C(2, 3) Find the coordinates of:
a) (i) the image of ∆ABC after a reflection in the x-axis. Let the image ∆ have vertices A´, B´ and C´.
(ii) the image of A´B´C´after a rotation of 180° about (4,0). Let the new image have vertices A′′, B′′ and C′′
(iii)the image of ∆A′′B′′C′′ after a central symmetry centre (7, 3).
b) Describe the transformation that would map
(i) ∆ABC onto ∆A′′B′′C′′
(ii) ∆A′B′C′ onto ∆A′′B′′C′′
Solution
On graph paper, plot and draw ∆ABC and label it clearly. On the same diagram draw the three images and label them appropriately. a) Fig 9.39 shows the three images of ∆ABC

(i) Image of ABC under reflection is divided as ∆A′B′C′ with vertices A′(1, -2) B′(3, -1) C′(2, -3)
(ii) Image of ∆A′B′C′is directed as ∆A′′B′′C′′with vertices A′′(7, 2) B′′(5, 2) C′′(6, 3)
(iii) Image of ∆A′′B′′C′′ is denoted as ∆A′′B′′C′′with vertices A′′(7, 4) B′′(9, 5) C′′(8, 3).
b)(i) By observation, ∆A′′B′′C′′ is the image of ∆ABC under a reflection. By construction the mirror line passes through the perpendicular bisect of AA′′or BB′′or CC′′. The line has the equation x = 4
(ii) ∆ABC maps onto ∆A′′B′′C′′ by a reflection in the line x = 4
(iii) ∆A′B′C′and A′′B′′C′′ are identical and face the same direction ∆A′B′C′maps onto ∆A′′B′′C′′by a translation, vector (6 6 )
Exercise 9.8
1. Figure ABCD has vertices at A(1, 2), B(7, 2), C(5, 4) and D(3, 4).
(a) On the same grid,
(i) Draw ABCD and its image A′B′C′D′ under a rotation of -90° about the origin.
(ii) Draw the image of A′′B′′C′′D′′ of A′B′C′D′ under a reflection in the line y = x. State the coordinates of A′′, B′′, C′′ and D′′
(b) A′′′B′′′C′′′D′′′ is the image of A′′B′′C′′D′′ under reflection in the line y = 0. Draw figure A′′B′′C′′D′′ and state its co-ordinates.
(c) Describe fully the transformation that maps
(i) ABCD onto A′′′B′′′C′′′D′′′
(ii) ABCD onto A′′B′′C′′D′′
2. ∆ABC has vertices A(1, 1), B(1, 3) C(4, 3) ∆A′B′C′ is the image of ∆ABC under a certain transformation P, so that A′(-1, 1), B ′(-3, 1) and C′(-3, 4) ∆A′′B′′C′′ is the image of ∆A′B′C′under another transformation, M. The vertices of ∆A′′B′′C′′ are A′′(-1, -1) B′′(-3, -1) C′′(-3, -4)
(a) On the same diagram draw ∆ABC and its two images.
(b) Describe the transformation denoted as P.
(c) Describe the transformation denoted as M. (d) Describe a single transformation that maps ∆ABC onto ∆A′′B′′C′′
3. M is a reflection in the line y = x. T is a translation that maps the origin (0, 0) onto the point (10, 2). Given that ∆ABC has vertices at A(-2, 6), B(2, 3) C(-2, 3)
(a) Find the coordinates of (i) M(A) (ii) T(B) (iii) TM(A) (iv) MT(B)
(b) Find the image of ∆ABC under a combined transformation (i) TM (ii) MT State the coordinates b(i) and (ii)
4. M is a reflection in the line y = -x. H is a central symmetry centre (0, 0). The vertices of triangle P are A(0, 1), B(0, 6) C(4, 6).
Find the coordinates of P′ under the following transformations
(a) M(P)
(b) H(P)
(c) HM(P)
(d) MH(P)
(e) MM(P)
(f) HH(P)
(g) Comment on the results of the transformations in parts (c) to (f).
Unit summary
1. Isometry: this is a transformation which preserves shapes, appearance, size and area of the object. Examples of isometries are
• Central symmetry
• Reflection
• Rotation
• Translation
2. Central symmetry: is fully defined if the object and the centre are known
• Object and image are identical, but are inverted
• ∆A’B’C’ is the image of ∆ABC by a rotation, 180° about the centre O.
• Object point, corresponding image point and centre are collinear.
3. Rotation: is defined [if given one point on the object and the centre and angle of rotation or
• Two point and their corresponding images.
• An angle of rotation can be stated as positive (anticlockwise) or negative (clockwise).
• Both object and image are described as being directly congruent
4. Reflection
• We define a reflection by giving a point on the object and the mirror line.
• Object and image are identical but face opposite directions. They are said to be oppositely congruent.
• Corresponding points under reflection are equidistant from the mirror line and the line segment joining them meets the mirror line at 90°
• Points on the mirror line are invarian.
5. Translation
A translation is fully defined if
• If the object and the translation vector is given or An object and corresponding image point are known
• Under translation, points move equal distance in the same direction i.e. parallel.
• Both object and its image are identical and they are said to be directly congruent. They face the same direction.
6. Composite transformations
These are transformations that are performed successively on the same object. They are also known as combined transformations.
Unit 9 test
1. Copy paste each shape and on the copy, draw a line of symmetry.

2. Draw a line segment PQ on a piece of paper. Does PQ have a line of symmetry? Fold the paper so that the fold is a line of symmetry of PQ. What is the size of the angles between the fold and PQ? What can you say about the distances of P and Q from any point on the line of symmetry?
3. A(–4 , 1), B(–2 , –1), C(1, 0) are the vertices of a triangle. Find the image of the triangle when it is reflected in the mirror line:
(a) y = 1
(b) y = –2
(c) x = –3
(d) x = 1.5
4. ∆A′B′C′ has vertices A′(–2, –1), B′(–2, –4) and C′(–4, –4). Find the co–ordinates of the vertices of ∆ABC such that ∆A′B′C′ is the image of ∆ ABC under half turn about the origin.
5. ∆ ABC is mapped onto ∆ A′B′C′ under a given transformation. Given that the co–ordinates of ∆ ABC are A (–3, 4), B(–3, 1), C (–1, 1) and those of ∆A′B′C′ are A (–3, –4), B′ (–3, –1) and C′ (–1, –1), describe fully the given transformation. 6. A triangle has vertices A (1, 2), B (7, 2) and C (5, 4)
(a) Draw triangle ABC on the Cartesian plane.
(b) Construct ∆ PQR, the image of ∆ ABC under a rotation of 90o clockwise about the origin.
(c) On the same axes, draw ∆ XYZ; the image of ∆ PQR under a reflecion in the line y = x. State the co–ordinates of x, y and z.
(d) ∆ MNS is the image of ∆ XYZ under a reflection in the line y = 0.State the co–ordinates of M, N and S.
(e) Describe one transformation that maps ∆ MNS onto ∆ ABC.
7. A square PQRS has vertices at P (2, 2), Q (2, 6), R (6, 6) and S (6, 2). Find the co–ordinates of the image of the square under a reflection in the line y = x.
8. On the same axes, draw ∆ ABC and ∆A′B′C′. Given that the co–ordinates of A, B, C, A′, B′ and C′ are (3, 4), (7, 4), (7, 6), (4, –3), (4, –7) and (6, –7) respectively, find by construction the centre and angle of rotation that maps ∆ ABC onto ∆ A′B′C′.
9. Under a rotation, the images of points P(–1,1) and Q (2,4) are P′(3, – 4) and Q′ (0, –1). Plot these points on a squared paper and find:
(a) The co–ordinates of the centre of rotation.
(b) The co–ordinates of R given that R′ is (–2, 4).
10. A (–1, –1), B(3, –1), C(3, 3), D(–1, 3), E(–3, –3), F(1, –3), G (1, 1) and H(–3, 1) are the vertices of two squares ABCD and EFGH. Draw the squares on squared paper.
(a) Find the centre and the angle of rotation that maps:
(i) ABCD onto FGHE,
(ii) EFGH onto DABC.
(b) What is the equation of the mirror line of the reflection that maps one square onto the other?
11. State which of the following statements are true and which are false. When a figure or object has a translation applied to it,
(a) all points move in the same direction.
(b) not all points of the figure move in the same direction.
(c) all lengths in the object remain unchanged.
(d) usually, at least one point on the figure remains unchanged.
(e) a translation can be described by many directed line segments, provided each has the same length and same direction.
12. (a) Triangles ABC, PQR and STU are congruent. Co–ordinates of the vertices of the triangles are given as A(1, 1), B(4, 3), C(1, 2); P(–1, 1), Q(–4, 3), R(–1, 2); S(– 4, 4), T(1, 6) and U(–4, 5). On the same axis plot the points and draw the triangles. Describe the congruence between the following triangles:
(i) ABC and PQR.
(ii) ABC and STU.
(b) Describe the transformation that maps:
(i) ABC onto PQR
(ii) ABC onto STU.
13. Find the image of ∆ABC, where A is (–3, –2), B is (–1, 1) and C is (2, –1), with operation vector 4 2 .
14. The image of A (6, 4) under a translation is A′ (3, 4). Find the translation vector.
15. ∆ABC with A (0, 1), B (2, 0) and C (3, 4) is given a translation equivalent to 2 4 followed by –3 2 . Find the coordinates of the image of ∆ABC.
16. Quadrilateral P′Q′R′S′ is the image of PQRS under a certain translation. P is (2, 0), Q is (0, 3), P′ is (5, 4), R′ is (6, 9) and S′ is (9, 4). Find:
(a) the translation vector.
(b) the coordinates of R, S and Q′.
UNIT10: STATISTICS
Key unit competence
By the end of this unit, I will be able to collect, present and interpret grouped data.
Unit outline
• Definition and examples of grouped data.
• Grouping data into classes.
• Frequency distribution tables for grouped data.
• Commulative frequency distribution tables.
• Measure of central tendency for grouped data.
• Graphical presentation of grouped data (polygon, histogram).
10.1 Grouped data
In unit 8 of S1, you were introduced to basic statistics that involved collection, organization and analysis of ungrouped data. In this unit, we are going to continue with the same using grouped data
10.1.1 Definition of grouped data
Activity 10.1
Given masses (in kg) of 30 pupils as follows:

1. Draw the following frequency distribution table in your exercise books. Count and fill the number of pupils whose mass fall in the given groups of masses:

2. Find the total number of pupils (∑ f) and fill it in the bottom cell of the frequency column.
3. Answer the following questions from the table:
(a) Which group has the highest number of pupils? (b) Which group has the lowest number of pupils?
4. Suppose you had pupils with masses of 50.4 kg and 50.9 kg. Discuss with your classmates in groups where you would place them, giving reasons for you choice of group.

The data in this table represents marks scored by a group of 40 students in a mathematics test. We can analyse this performance by putting these students in groups according to their performance. For example, in this test, 2 students scored between 30 and 39, 9 scored between 40 and 49, 14 scored between 50 and 59, 7 scored between 60 and 69 and 8 scored between 70 and 79.
This information can be presented as in Table 10.3 below

When data is presented as in table 10.3 above, it is said to be a grouped data.
Grouped data is data that has been sorted into classes or categories.
Table 10.3 is an example of a frequency table. From table 10.3 it means that all scores from 30 to 39 inclusive, are in one group; all scores from 40 to 49 inclusive, are in the next group and so on.
Each of these groups is called a class or class interval. The values 30 and 39, 40 and 49, 50 and 59, etc. are called class limits for the respective class.
Note that, when the number of items in a data distribution is small, it is easy to deal with them; but when the number of items is large, it becomes necessary to group the data.
10.1.2 Frequency distribution table for grouped data
Activity 10.2
Table 10.4 below shows fifty scores for 25 basketball games.

Using the data in table 10.4;
1. Identify
(i) the lowest score
(ii) the highest score
2. Find the range of the scores.
3. Set these scores into 10 groups or class intervals beginning with 1 – 10, 11 – 20…. 91 – 100 in a frequency table.
4. For each group, state the class limits.
5. For each class frequency, denote the frequencies f1 = …, f2 = … and so on upto the 10th group.
6. How do you think the range can be useful in determining a suitable number of classes or the size of the class interval?
1. Consider the following data on the diameters of 40 ball bearings that were recorded in mm.

(i) the lowest diameter is 27 and
(ii) the highest diameter is 67.
• The range of the scores is the difference between the highest score and the lowest score.
Range = highest value – lowest
value = 67 – 27 = 40
2. Using classes 26 – 30, then 31 – 35, 36 – 40, 41 – 45 and so on, we get the following frequency table.

• Thus, for the class 26-30, 26 is called the Lower Class Limit and 30 is called the Upper Class Limit.
• Table 10.5 is called a frequency distribution table for Grouped Data. Similarly we can state the class limits for the rest of the groups.
• The number of observations in each class is the class frequency, denoted by f for example, the frequency for the class 41- 45 is f = 9.
• For this data the group size was already determined for us. Generally, the range and the number of classes can be used to estimate the class width or size.

Usually class sizes are better in multiples of 5 or 10. For example, to work with about 10 classes

we can then use a convenient class of 5.
Similarly we can estimate the number of classes as follows:

From this type of data presentation, we can draw better conclusions about the data than before.
Some of these conclusions are:
(a) The number of balls whose diameters fall between 31 and 35 is 3.
(b) No ball measures less than 26 mm.
(c) Nine balls have a diameter between 41 and 45 and so on.
Example 10.1
Table 10.6 shows the masses (in grams) of 50 carrots taken from a plot of land on which the effect of a new fertiliser was being investigated.

Make a frequency distribution table for this data
Solution
The smallest mass is 63 g and the largest is 118 g. The difference between the largest value and smallest value is called the range.
Thus, range = 118 g – 63 g = 55 g.
We need to group the data into a convenient number of classes. Usually, the reasonable number of classes varies from 4 to 12. By dividing the range by class size, we get the number of classes. Thus a class size of 5 will give us
55/5 i.e. 11 classes. A class size of 8 will give us 55/8 i.e. 7 classesA class size of 10 will give us 55/10 i.e. 6
classes.Let us use a class size of 10. Table 10.7 is the required frequency table.

Note: If the range is small, it is more convenient to use class sizes which are even. If it is large, multiples of 5 or 10 are more convenient. This is helpful especially if there is need to represent the data graphically.
Exercise 10.1
1. A handspan is the distance (length) from the end of the thumb to the end of the small finger when the hand is fully open. Table 10.8 shows the handspans of some 21 children measured in centimetres.

Make a frequency distribution table, grouping the data into four classes starting with 14.0 – 15.9.
2. The lengths of 36 pea pods were measured to the nearest millimetre and recorded in Table 10.9.

Put the data into a grouped frequency table by choosing a convenient number of classes.
3. The percentage burns for 70 fire accident victims treated in a hospital in two years were recorded in the hospital records as shown in Table 10.10.

Make a grouped frequency table using classes 10 – 19, 20 – 29, 30 – 39, etc.
4. A pupil measured the amount of ink in biro pens used in his class by measuring the length (in cm) of the ink column that could be seen. He obtained the results shown in table 10.11 below. Make a grouped frequency table with 6 classes
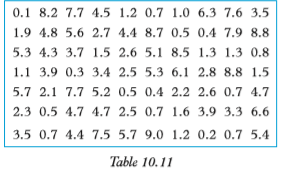
10.2 Data presentation
10.2.1 Class boundaries
Consider the grouped distribution in Table 10.12. Suppose the data represents the masses to the nearest kg of a group of 40 boys.
Generally, for any data obtained from measurements, the practice is to record them to the nearest value of the accuracy chosen. For example, a recorded value of say 30 kg represents a number in the interval 29.5 to 30.5. Thus 29.5 ≤ 30 < 30.5
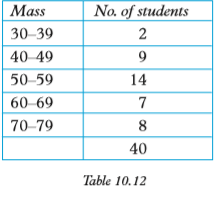
The class 30 – 39 includes all values equal to or greater than 29.5 but less than 39.5. Thus the class interval stretches from 29.5 to 39.5. The point half way between the upper limit of the first class and the lower limit of the next class is called the class boundary. i.e. class boundary between first and second class

Similarly, the class 40 – 49 includes all values equal to or greater than 39.5 but less than 49.5
The values 29.5, 39.5, 49.5, etc. are called class boundaries for Table 10.11. Thus, the class 30–39 can be represented as 29.5 – 39.5. The value 29.5 is the lower class boundary and 39.5 is the upper class boundary for this class
Similarly, the class 40 – 49 can be extended to 39.5 – 49.5, etc.
The difference between the upper class boundary and the lower class boundary is called the class interval, class width, or class size, i.e. class interval = upper class boundary – lower class boundary. This knowledge is essential for the construction of a histogram.
10.2.2 Histogram
Activity 10.3
Table 10.13 below shows the frequency distribution table for the heights of a group of men, to the nearest centimetres.

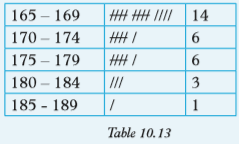
Use the given information to do the following:
1. Identify the boundaries of the classes.
2. Rewrite the table using boundaries rather than class limits.
3. In your own words, distinguish between class limits and class boundaries.
From Activity 10.4, the class boundary between the first and the second class is given by the mean of upper limit of the first class and lower limit of the second class

Between one class and the next, the class limits have a gap between them. There is a disconnect between any two consecutive classes. In table 10.13, class boundaries are such that the end of one class to the beginning of the next. In other words, there is a sense of continuity when the frequency table is written using class boundaries table 10.14. This is the format used when constructing a histogram of grouped data.
A histogram is a bar diagram that represents the frequency distribution of a continuous data. When class intervals are of equal width, a histogram resembles a bar graph the difference is that there are no spaces between bars. In a histogram, each rectangle is drawn above each respective class interval such that the area of each rectangle is proportional to the frequency of the observations falling in the corresponding interval.
If the class intervals are equal, then the heights of the rectangles are proportional to the corresponding frequencies. If the classes intervals are not equal the heights of rectangles are represented by a unit called relative frequency or frequency density.
Activity 10.4
1. Using a dictionary or the internet, find the meaning of the terms:
(i) frequency density
(ii) relative frequency
2. Copy table 10.14 and create another column for the frequency density (fd).
3. Using an appropriate scale, draw a pair of axes. On the vertical axis, mark the frequency density.
4. On the horizontal axis, draw appropriate rectangles whose width equals the class width, and whose height equals the corresponding frequency density.
From Activity 10.4, you notice that:
• Frequency density, also known as relative frequency is a statistical data that compares class frequency to the class width, for the purposes of constructing a histogram of a given set of data.

The required table that includes the frequency density column is as shown below i.e. Table 10.15
Note: class interval = 5 for all classes.
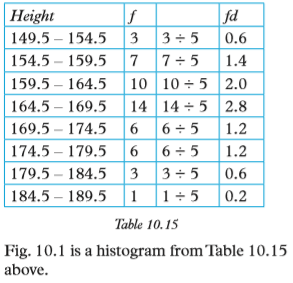
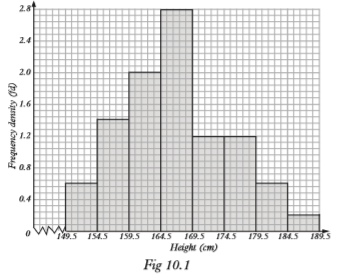
A histogram (or a frequency histogram) is a graph that consists of a series of rectangles:
(a) drawn on a continuous scale (i.e. no gaps between the rectangles) and
(b) with areas being proportional to class frequencies. The height of the rectangles are obtained as, , f being the frequency and w the class width. The value is called frequency density.
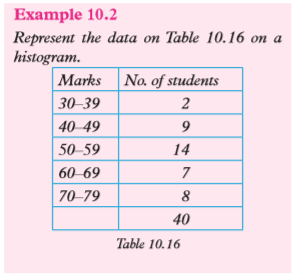
Solution
Table 10.17 represents the same data as in Table 10.16, but with the class limits having been changed to class boundaries and the column for the frequency density included

Choose a suitable scale and use it to represent marks on the horizontal axis, indicating all the class boundaries along this axis.
Since the class interval is constant, the rectangles must have the same width. Fig. 10.2 below shows the required histogram.

Note that:
(i) The class boundaries mark the boundaries of the rectangular bars in the histogram.
(ii) In Fig. 10.2, the horizontal axis is compressed. We put to show that there is no information being displayed on the lower part of the axis.
(iii) Where the widths of the rectangles of a histogram are equal (as in Fig. 10.2), the histogram is similar to a bar chart. Therefore the height of the bars is also proportional to the respective frequencies.
Example 10.3
In a certain function, the ages of the people present were recorded as shown in Table 10.18.

Draw a histogram for this data
Solution
Remember that in a histogram, the area of each rectangle represents the frequency and the width of a rectangle the class interval. Thus, we get the height of the bar by dividing the frequency by the class interval. This result is known as the frequency density (Table 10.19).

The height of each column (Table 10.19) represents the average number of people in each age group. It is assumed that there is a uniform distribution within the class intervals. Fig. 10.3 shows the required histogram.

Exercise 10.2
1. Table 10.20 represents the number of patients who attended a mobile clinic grouped by age.
Exercise 10.2
1. Table 10.20 represents the number of patients who attended a mobile clinic grouped by age.

Using a scale of 2 cm to represent 1 unit on y-axis, draw a histogram to represent the distribution.
2. In a high altitude weather station, wind speeds were observed for a period of 100 days

Using a scale of 4 cm to represent 1 unit on the y-axis, draw a histogram to represent the distribution.
3. Table 10.22 shows the heights to the nearest centimetre of a sample of seedlings in a tree nursery.

Construct a histogram to represent the distribution. Who do you think would be interested in a tree nursery project? To whose benefit would it be?
4. Use the data in Table 10.23 and a suitable number of class to make a frequency distribution table.

10.2.3 Frequency polygon
Fig. 10.4 shows a frequency polygon obtained using information in Table 10.24 shows the same information that was in Table 10.3 on page 178 but this time, the mid-points or class mid marks of the classes are included. Each class mark is obtained as half the sum of the class limits (or boundaries). These classmarks are useful in the construction of the frequency polygons, calculation of the mean and the standard deviation of grouped data.
In order to construct a frequency polygon of a given set of data, we plot the class mid-points against the corresponding frequency densities. Therefore, the class mid-points represent the corresponding class intervals. These mid-points are calculated using class limits as follows


When the frequency densities are plotted against the corresponding midpoints and the points joined with straight line segments, we obtain a frequency polygon (Fig. 10.4).

Thus, a frequency polygon is a graph in which frequency densities are plotted against class mid-points and the points are joined with straight line segments.
Note that in Table 10.24, the first point given is the mid-point of the first class whose frequency is 2. Normally, it is taken that the previous class
(i.e 20 – 29) has frequency 0 (zero). So the graph is extended to the mid-point of this class. Similarly, it is taken that the next class, after the last, has frequency 0 (zero). The graph is also extended to this class. Sometimes, more than one frequency polygon may be drawn on the same axes for purposes of comparing frequency distributions.
Activity 10.5
Table 10.25 shows the performance of two quizes. The maximum possible mark that could be scored was 50.

1. Copy table 10.25 and on it introduce a 4th column with the heading “class mid-values".
2. On the same axes and using an appropriate scale on each axis, draw a frequency polygon for each class.
3. Explain how you would use these frequency polygons.
From this activity, you should have observed the following:
(i) A frequency polygon is obtained by plotting class-mid values against the corresponding frequency densities.
(ii) You needed to add another two columns for the frequency density for each set.
Fig 10.5 is the required frequency polygons.
 Horizontal scale 1 m represents 5 marksVertical Scale 1 cm represents 0.2 (frequency density) Key___ represents S2A___ represents S2The trend of the graph shows that S2A is a better performer.Note: The frequency of the class below the first class is 0 and the frequency of the class after the last one is also 0.10.2.4 Pie-chartActivity 10.6
 We plot the two points in order to give the starting and the end points of the graph. Otherwise, the polygon would not be closed.using an appropriate number of classes.1. Make a frequency distribution table and ensure that all the entries are considered.2. If each class was to be represented by a sector of an angle, calculate the degree of the sectors representing each class.3. Construct an accurate pie chart and label it appropriately.4. In order to construct a pie chart, what other fact did you require?Since this is a small distribution, five classes are appropriate.
 1. Introduce the cumulative frequency of column just to confirm that you have the correct distribution total.2. On the frequency table, I have introduced the class boundaries column as a reminder that there should be no gaps in the pie chart.According to the frequencies the angles of the sectors should be as follows:
 To draw the pie chart, the circle should be not too small and not too big. Fig. 10.6 is the required chart.
 To draw an accurate pie chart, you need to be aware that we consider the class boundaries rather than the class limits even though you need not mark them.A pie-chart is a graph or a diagram in which different proportions of a given data distribution is represented by sectors of a circle.Since the diagram is a circle, it is looked at as a circular ‘pie’, hence the name pie chartExample 10.4Table 10.30 shows grades scored by 15 candidates who sat for a certain test
 Draw a pie chart for this data
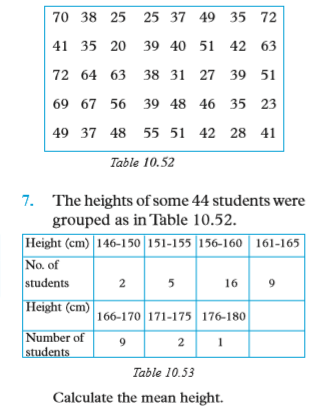 Note:1. Usually, there are no numbers on a pie chart.2. The sizes of the sectors give a comparison between the quantities represented.3. The order in which the sectors are presented does not matter.4. Sectors may be shaded with different patterns (or colours) to give a better visual impressionExample 10.5
In a school, 320 students are in Senior 1, 200 students in Senior 2, 160 students are in Senior 3 and 120 students in Senior 4. Draw a pie chart to display the information.SolutionStep IFind the angles that represent each item (class). Angles = Fraction of that item × 360° The total number of students in the school is; 320 + 200 + 160 + 120 = 800 students Angle = Fraction of class in the school × 360° Exercise 10.31. Table 10.32 shows masses of 100 students at St. Augustin’s College.
 (a) Represent this distribution in a pie chart.(b) Draw a histogram for this data.2. Table 10.33 shows marks in a mathematics test for some 80 pupils at St. Peter’s Primary School.
 (a) Represent this distribution in a pie chart.(b) Draw a histogram for this data.3. In a village, 25% of the people are male adults, 30% are female adults while the rest are children.(a) Draw a pie chart to represent the above information.(b) If the same village consists of a population of 950 000, find how many children are there?(c) If three quarters of the male adults are married, each having only one wife from the same village, find how many female adults are not married?4. Table 10.34 shows masses, to the nearest kg of 100 students, who were picked at random, in St. Emmanuel Secondary School
 Draw a pie chart to represent this information.5. The pie chart in Fig. 10.9 shows students taking different courses at the university.
 (a) If 240 students take law, find the total number of students in the university.(b) If 65% of education students take education in arts, find how many take education in science.6. Draw a frequency polygon using the data in(a) Question 1 Table 17.18(b) Question 2 Table 17.19(c) Question 3 Table 17.2010.2.5. Cumulative frequency table and graphA cumulative frequency table of a continuous variate gives the frequency of observations that fall below the upper end point of each class interval. The cumulative frequency table is formed from the individual frequencies by adding them up, getting a sum of frequencies at the end of each class. Consider the following:Table 10.35 represents times measured to the nearest second, taken by some 30 students to complete a timed quiz.
 Numbers in the last column of this table are called cumulative frequencies, denoted as cf.The clarification in the third column is normally not included in the cumulative frequency tableActivity 10.71. Copy and complete Table 10.36 below.
 2. Cumulative frequency diagram (graph). To draw a cumulative frequency diagram, we use the information in the last two columns i.e. we plot the cumulative frequencies against the corresponding upper class boundaries.3. By choosing an appropriate scale(a) Mark the cumulative frequency (cf) on the vertical axis.b) Mark the class boundaries on the horizontal axis.(c) Plot cf against the boundaries.(d) Join the points with a smooth curve.(e) The cumulative frequency at the beginning of the first class to be zero, the first point on your graph must be on the horizontal axis.4. From your graph, find the height when cf = 24.From the activity, your completed table should look like Table 10.37 below.
 Fig 10.10 shows the cumulative frequency diagram for the data in Table 10.37
 Note that 25 on the cf scale represents the median position, while 166 cm is the corresponding value on the height axis or scale. Therefore, 166 cm must represent the median height of the distribution. Thus, we can use cumulative frequency graph to estimate the median of a grouped distribution.
 (a) Construct a cumulative frequency (cf) table(b) Draw a cumulative frequency (cf) graph and use it to estimate the median age.
 (b) To draw the cumulative frequency curve, we need class boundaries so we introduce a 4th column in the cf table for the boundaries
 Since the sample size is 630, the median position is between 315 and 316 i.e. 315.5 Thus,when cf = 315.5Age = 50.8 yrsthe median age = 50.8 years
 Use this information to draw a cumulative frequency graph and use it to determine the mean age.2. The lengths of some pea pods were measured to the nearest mm and recorded as in Table 10.42. Choose a suitable number of class to put the data into a grouped frequency table. Hence, represent the data in a cumulative frequency graph.
 3. A survey was conducted to assess how much money a particular group spent per week. The data in Table 10.43 was obtained. Make a grouped frequency table using classes 110–119, 120 – 129 and so on. Use your table to construct a cumulative graph and use it to estimate the median amount to the nearest unit.
 10.3 Measures of central tendencyIn unit 8 of S1, we defined measures of central tendency, and found them using ungrouped data.Measures of central tendency include the mean, median, mode and range. We will look at each one of them separately. The measures of central tendencies are used to show the trends and patterns ofany given data. For example, in a class of 40 students, given the individual mass (kg) of each student, we can calculate the average mass (mean mass), the median mass, the most common mass and the difference between the highest and the lowest mass. This will help us to analyse the mass of the students and possibly make some important decisions based on the analysis.10.3.1 Arithmetic meanThis is one of the measures of the centre of a set of observations. You have already learnt that for ungrouped data, the sum of the observations divided by the number of observations gives the mean. Inclusion of any extreme value in a set of observations alters the mean significantly since the mean uses the actual values of the observationsTo find the mean of grouped data we must look for suitable values to represent the class intervals since mean involves multiplication of numbersThe best representative of a class interval is the class mid-value or class centre. We act as if all the observations in a class are equal in value to the class centre. We act as if all the observations in a class are equal in value to the class centre.Activity 10.81. Obtain the masses to the nearest kg of all the members of your group.2. Calculate the mean mass of your group.3. Through the secretary of the group, obtain the masses of all the other groups of the class.4. Now, calculate the mean mass of the whole class.5. Determine a suitable number of classes, and use it to determine the class size.6. Make a frequency distribution table for the masses.7. On your frequency distribution table, add another two columns i.e. one for the class mid values (x) and another one for the on product of the frequencies (f) and the corresponding class mid values (x) i.e. fx.8. Find the sum of the products above.9. Divide the sum in (8) above by the number of students in the class whose masses you have worked with.10. How does your answer in (9) above compare with the answer obtained in (2) above.In Activity 10.8, you should have observed the following:1. Unless any group made an error, in their calculations, the mean mass of the class should be the same.2. Your frequency distribution tables will depend on the number of groups chosen. Similarly the results of number 6 to 8 will depend on the number of groups.3. The result of Σfx ÷ Σf should be approximately equal to the mean mass found earlier. Can you explain why the two answers should differ?4. The answers to part (8) and part (9) in the activity represent the same measure i.e. the mean mass of the students in your class. Any discrepancy would be as a result of the approach used
 Use the table to calculate the mean height of the buildings.SolutionWe need to introduce a new row for class centres (x) and another row for the products of the frequencies and class – centres (fx) as shown in Table 10.45
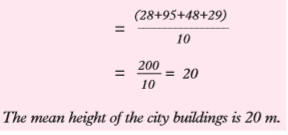 Example 10.8Table 10.46 shows the distribution of the average mathematics marks scored by 40 students in the end of year examination
 Exercise 10.51. The masses (kg) of a group of children between the ages of 6 months to 11 months are tabulated below. (Table 10.48).
 Calculate the mean mass.2. The frequency distribution table (Table 10.49) relates to the lengths of sentences in a book
 Calculate the mean number of words.3. Using the results of mathematics examination for the end of year 2013 in your class:(a) Calculate the mean mark for the class.(b) Using class intervals of 1 – 10, 10 – 20, form a frequency distribution table and use it to calculate the mean mark.(c) Compare the two answers that you have obtained in (a) and (b) above. Comment on them.4. A company’s monthly wage bill in FRW is distributed as in the Table 10.50 below
 5. In each of the following distributions, find the arithmetic mean.
 6. Table 10.52 shows marks out of 100 for 40 students in a mathematics test. Make a frequency distribution table with class intervals 20 – 24, 25 – 29…. Calculate the mean mark in the test
 Finding the mean using the assumed meanWhen finding the mean of a set of large numbers, it is possible to reduce the amount of computation involved. This is done by reducing each entry of the set by subtracting a constant number so that we work with smaller figures. Below is an explanation of the method including an example.Consider the following distributions (Table 10.54)
 Confirm that the means of these distributions are as follows:Mean of distribution A is 48·2Mean of distribution B is 78·2Mean of distribution C is 8·2Notice that distribution B is obtained by adding 30 to each of the values in distribution A. Similarly, distribution C is obtained by subtracting 40 from each of the values in distribution A.Now look at their means.Adding 30 to the mean of distribution A gives the mean of distribution B. Subtracting 40 from the mean of distribution A gives the mean of distribution C.In general:If a constant A is added to or subtracted from each value in a distribution, the mean of the new distribution equals the mean of the old distribution plus or minus the same constant A. This constant is referred to as a working mean or an assumed mean.The assumed mean may be used to make work easier and quicker when finding the mean of a distribution, especially if the values are large.Example 10.9Find the mean of 105, 107, 108, 109, 113.SolutionStep 1: Choose a reasonable assumed mean. You do this by looking at the values and seeing that they range from 105 to 113. The true mean will lie roughly halfway between these values. Thus, a reasonable working mean may be 109.Step 2: Subtract the assumed mean, 109, from each of the values to obtain the new distribution
–4, –2, –1, 0, 4 . This is a distribution of differences from the assumed mean known as deviations.Step 3: Calculate the mean of the new distribution (i.e. mean of deviations from the assumed mean). Step 4: To obtain the true mean, add the assumed mean to the mean of deviations. Thus:True mean = 109 + –0.6 = 108.4
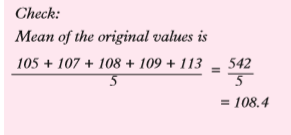 Example 10.10A farmer weighed the pigs in his sty and found their masses to be as in Table 10.55.
 Using an appropriate assumed mean, find the mean mass of the pigs.SolutionWe use a working mean A = 56. The working is tabulated as in table 10.56
 Recall:If the given data is in a grouped frequency distribution, we use mid-interval values, i.e. class mid-points as the values of xExercise 10.61. Using an appropriate assumed mean, find the mean of each of the following groups of values.(a) 178, 179, 183, 185, 186, 199(b) 66.4, 67.8, 69.2, 70.0, 71.3(c) 15.40, 16.20, 17.00, 17.80, 19.60, 20.40, 21.20, 22.00(d) 221 cm, 229 cm, 227 cm, 226 cm, 220 cm, 221 cm, 228 cm, 225 cm, 220 cm, 223 cm.2. Table 10.57 shows the marks (out of 50) obtained by 28 students of a certain school in an aptitude test.
 Use the method of working mean to find the mean mark.3. Table 10.58 shows the masses, to the nearest kilogram, of 40 form 4 students picked at random
 Calculate the mean mass, using an appropriate assumed mean4. Table 10.59 shows the grouping by age of students in a certain polytechnic.
 Calculate the mean age of the students, to the nearest year.5. An agricultural researcher measured the heights of a sample of plants and recorded them as in Table 10.60. Using an appropriate working mean, find the mean height of the plants.
 10.3.2 ModeThe mode is another measure of the centre of a set of observations. The mode of a discrete variate is that value of the variate, which occurs most frequently. For example, in a distribution such as 3, 4, 4, ,4, 4, 5, 5, 5, 33, 38, 40, which represents ages of group of people at a birthday party, the mode is 4 years. This is the mode of this ungrouped dataIn a grouped data it is not possible to find by observation a single most frequent value. So, we define a modal class. Thus, a modal class of a grouped data with equal intervals is the class that contains the highest frequency. For example look at the distribution in table 10.61.
 The group with the highest number of people is 21 – 22 with a frequency of 16. Therefore, 21 – 22 is the modal class. Below is an alternative way of stating the formula.As observed earlier, the mode of a grouped data can only be estimated. There are two formulae that can be used, although the procedure has slight discrepancy in the answer. We use the following variables in the formulae:

 where:L – is the lower limit of the modal class.t1 – is the difference between the modal frequency and the frequency of the lower class.t2 – is the difference between the modal frequency and the frequency of the upper class.i – is the class size or the class interval.Example 10.11The following frequency distribution table (Table 10.62) shows the mass in kilograms of 100 athletes who participated in a Marathon competition in Rwanda.
 10.3.3 The rangeAs we have already learnt in earlier sections of this unit, the range of a set of observations is the difference between the largest and the smallest observations in a set.The range is a measure of variability, which uses only two of the observations in a set. It ignores the pattern of distribution in between the largest and the smallest value.Exercise 10.71. Find the mode and the range of the following data:(a) 15, 25, 18, 16, 25, 19, 18, 25, 16, 19, 25.(b) 1, 9, 22, 16, 15, 28, 9, 14, 16, 9, 28(c) 28, 7, 28, 17, 7, 19, 15, 7, 28, 7, 15, 18, 7.2.(a) Find the value of x so that the mode of the following data is 37: 12, 33, 37, 18, 19, 37, x, 33, 12, 33, 18, 37. What is the range?(b) What will be the new mode if one of the 37 after x is replaced by 33?3. Find the mode and the range of the following data: 28, 22, 21, 29, 12, 13, 18, 22, 14, 16, 28, 29, 13, 28, 22, 14, 22, 16, 19, 16, 15, 18, 22, 29.4. Find the mode of the scores in a Mathematics exam which were recorded as shown in table 10.63:
 5. Table 10.64 shows the findings on the amount of pocket money spent by 50 students in a school per month. The amounts are in Rwandan Francs
 Make a frequency table with the classes of 10 – 20, 20 – 30, 30 – 40 ... and use it to determine the mode.10.3.4 The medianRemember, when numbers are arranged in ascending or descending order, the middle number or the average of the two middle numbers is called the median. Consider the following example.the following example. The height in cm of a sample of 11 seedlings in a demonstration farm are 168 163, 165, 171, 169, 161, 159, 166, 163, 170, 159.If we rank the heights from the shortest to the highest, we obtain 159, 159, 161, 164, 163, 165, 166, 168, 169, 170, 171.We can use one height in this set to represent the set. The representative figure or the observation we choose should say something about the values in the set. In our example, we will choose an observation that has as many observations below it as above it. The value taken by this observation is called the medianThe median, M, of a set of observations is the middle one of the ranked quantities. In the rank order of the heights, the value 165 has 5 observations below it and five above it.Therefore, the median of the heights 159, 159, 161, 163, 164, 165, 166, 168, 169, 170, 171 is 165.When the number of observations, N, is odd, there is a unique middle observation, in the position.1/2 (N + 1) of the rank order. Suppose we had a 12th height i.e. 174 cm. The rank order would be 159, 159, 161, 163, 165, 166, 168, 169, 170, 171, 174. In the new order, if we take median = 165, there will be 5 entries below it and six above it.If we take median = 166, there will be 6 entries below it and 5 above it. So neither 165 nor 166 can be the median. The accepted rule when N is even is to place the median midway between the two middle observations, in this case between the sixth and the seventh.
 Note that median is a measure that ignores the actual sizes of the observations except those in the middle of the rank.Median of grouped dataActivity 10.91. Research from reference books and the internet the formula for calculating the median of grouped data.2. Collect the heights of your group members to the nearest cm.3. Through your group leader obtain the heights of the other groups so that every group has the heights of the whole class.4. Find range of the heights of the class.5. Use the data to make a frequency distribution table, using an appropriate group size.6. On your table, add a column for the cumulative frequency, cf7. Use the cumulative frequency table to find and state the median class.8. Does your answer agree with other groups? If your answer is no, explain why.To estimate the median of grouped data, we use the same principle as we used for ungrouped data. The assumption is that the data values in the median class are equally spread out in the classThe following is a formula that is used to estimate the median value. In the formula, the variables used in the formula are defined as was the case in the estimation of the mode
 Example 10.12The time taken by 38 students to work out a puzzle were recorded as in Table 10.65 below.


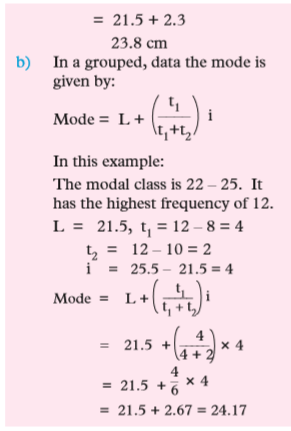 Note:With reference to the cumulative frequency table 10.68 in example 10.13, the 24th position is the class 22 – 25. The class 22 – 25 stretches from the lower boundary 21.5 to the upper boundary 25.5, an interval of 4 cm. There are 12 seedlings in this interval, and 17 seedlings have lengths less than 21.5 cm. This means we require 7 more seedlings to make up to the 24th position i.e. the median position. If we assume that the lengths for the 12 seedlings in the median class are evenly or equally distributed in the class we can estimate the median as follows:
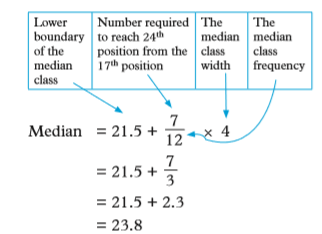 We can generalize a simple rule to estimate the median of grouped data distribution as follows. Let l be the lower median class boundary a be number of observations required to reach median position. fm be the median of the class frequency i be the median class size
 Exercise 10.81. Calculate the median of each of the following sets of observations. (a) 22, 16, 34, 25, 13(b) 20, 7, 63, 48, 10(c) 18, 9, 13, 15, 10, 4, 32, 26, 13, 17(d) 35, -13, 17, 1, 12, -1, 21, 2, 18,132. Find the median of the following sets of data:(a) The masses (kg) of 10 male students aged 18 years: 80, 75, 77, 83, 82, 73, 71, 77, 75, 89.(b) The width of a hand span of a group of people measured in mm. 52, 37, 103, 40, 20, 31, 86, 38, 70, 104, 50, 125.3. Calculate the median of the set of data given in Table 10.69.
 4. Table 10.70 shows the ages of a group of people in a gathering.
 (a) Find the number of people in the group.(b) Calculate the median age.5. The data below shows the marks scored by a group of students in a maths test.
 (a) Find:(i) the highest scores(ii) the lowest score(b) How many students did the test?(c) Calculate the median mark.6. Calculate the median of the data distribution and mode in table 10.7
 7. The following data show the number of children born to 25 families3, 5, 4, 2, 2, 4, 6, 8, 10, 4, 3, 5, 4, 8, 4, 7, 6, 6, 4, 6, 2, 3, 6, 5, 8.Make a frequency distribution table and find the mode and the median number of children.8. The mass of 30 new-born babies were recorded in kg as follows: 1.8, 1.7, 1.6, 2.1, 1.8, 1.9, 2.5, 1.7, 1.8, 1.6, 1.5, 1.4, 2.0, 2.1, 1.8, 1.6, 1.7, 2.1, 1.9, 1.8, 1.2, 1.9, 1.8, 1.8, 1.9, 1.7, 1.8, 2.0, 1.8, 1.6.(a) State the mode.(b) (i) What is the median?(ii) The mean mass?(c) Make a frequency distribution table and work out the mean, the mode and the median using the table.(d) How do your answer in (a) and (b) compare with the corresponding ones in (c)?9. Make a frequency distribution table for the data in table 10.73 below and use it to answer the following questions:(i) What is the median?(ii) Calculate the mode and the mean of the data.
 10. Make a frequency distribution table for the following data.15, 18, 11, 15, 11, 18, 17, 11, 20, 10, 11, 25, 24, 18, 10, 24, 14, 15, 20, 15, 15, 18, 20, 19, 13, 11, 17, 17, 12, 19, 17, 13, 11, 20.Use the table to find the mean and the median of the data.10.4 Reading statistical graphs/diagramsSo far, we have used diagrams/graphs to represent data distributions. It is also possible to extract vital information from such diagrams.Activity 10.10Table 10.74 represents some information about a set of observations.
 Use the table to find the value of x.1. Make a frequency distribution table for the data.2. What else might you do with the information such as the one given in this tableFrom the given table, we can see that the distribution has 55 entries. We also know that, we obtain successive cumulative frequencies by adding class frequencies.
 Note: Column 3 is what we needed to draw the frequency distribution table. Now, we can use this table to do a couple of processes i.e. estimating the mean of the data.We could use the given information to draw a cumulative frequency graph, histogram, etc. Remember this cumulative frequency graph can be used to estimate the median of the data.Example 10.14Fig. 10.12 shows some data distribution and a frequency polygon.
 Working in pairs, use the histogram for this activity.(a) Identify the class intervals of the data.(b) What is the class size?(c) Make a frequency distribution table i.e. use the class size and the frequency densities to find frequencies(d) Use the table to construct a cumulative frequency graph.(e) Use the frequency polygon to calculate the mean of the data
 (d) Table 10.76 shows the required frequency distribution table
 (e) Table 10.77 shows the frequency distribution table
 The graph of cf against upper class boundaries is as shown in. Fig. 10.13 Vertical Scale : 2 cm : 10 Horizontal Scale: 2 cm: 10
 Using the frequency polygon we see what class mid values can be read from the graph and the corresponding frequencies in the frequency table
 Use the graph to:(a) Make a frequency distribution table(b) Calculate the mean of the data(c) Calculate the median quantity(d) Estimate the median from the graph and compare it with the one you found in (c) above.(e) Calculate the mode of the distribution2. In a certain year, a school presented a total of 200 candidates in a national examination. Their performance is tabulated in Table 10.79
 (a) Use the table to make a frequency distribution table. (b) Construct a histogram for the data.(c) Calculate(i) the mean mark of the group(i) the median mark(ii) the mode of the distribution3. Patients who attended a medical clinic in one week were grouped by age as in table 10. 80.
 (a) Estimate the mean age.(b) Using a scale of 1cm to 1 unit on the vertical axis, draw a histogram to represent the distribution.4. A total of 120 AIDS patients were sampled out and their mass (kg) recorded in classes of 10 beginning with 30 – 39, 40 – 49…. 80 – 89. The data was represented in a pie chart as in figure 10.15
 The sectors in this pie chart represent the suggested classes.(a) By measuring each of the angles at the centre, find the frequencies of the distribution.(b) Make a frequency distribution table for the data.(c) Calculate:(i) the mean(ii) the median(iii) the mode of distributionCautionAIDS is REAL and has No Cure. Choose to live, reject death.5. The times taken, measured to the nearest minute, by 30 students to complete a class project are given in table 10.81.
 (a) Use the value in the table to make a frequency distribution table having eight equal classes starting with 35-39 minutes.(b) Draw a histogram of the grouped distribution and state the modal class.6. The ages of a group of people were recorded using class intervals of 5. The data was then represented in a bar chart as in Fig.. 10.16. Use the given information to
 (a) construct a frequency distribution table.(b) draw a cummulative frequency curve and use it to state the number of people whose mass lies between 12 kg and 23 kg.(c) construct a histogram for the data.7. A mysterious disease has affected children, in a certain region, who are between the ages of 0 and 12 years. Table 10.82 shows the number of deaths of children at various ages.
 (a) Draw a histogram to represent the data.(b) Represent the information in a pie chart.(c) Calculate the mean of the distribution.(d) Calculate the median.(e) Identify the modal class then:i) Estimate the mode of the dataii) Join the lower modal class boundary to the upper class boundary of the next classiii) Join the upper modal class boundary to the lower boundary of the preceding classiv) Let the diagonals in (ii) and (ii) meet at a point, A.v) Read the value in kg, at point A. How does this value compare with your answer in part (d)Unit Summary1. In a pie chart, the total data is represented by the area of a circle. The circle is divided into sectors, each of which represents a category. Angles of the sectors are proportional to the quantities they represent.2. A bar chart represents data using a series of bars of equal width, the length of each being proportional to the frequency (or quantity) for the category it represents.3. A histogram consists of a series of rectangles drawn on a horizontal base (i.e. the independent variabl axis), with the areas of rectangles representing the corresponding class frequencies.(a) The rectangles do not always have the same width, but the widths of their bases must be proportional to the width of the class intervals they represent.(b) Consecutive rectangles must share a common boundary. So, for each rectangle, the extremes of the base must be the lower class boundary (l.c.b) and the upper class boundary (u.c.b) of the class it represents.(c) The height of each rectangle is calculated as:
 4. If the consecutive midpoints of the tops of the rectangles in a histrogram are joined using line segments, the resulting graph is called a frequency polygon.5. A cummulative frequency curve is obtained as follows:(a) From a frequency distribution, form a cumulative frequency distribution. The cumulative frequency of any class is the sum of all frequencies of that class and all lower classes.(b) Plot each cumulative frequency value against the upper limit of the corresponding class.(c) Join the points thus plotted using a smooth curve to obtain a cumulative frequency curve also known as an ogive.6. The arithmetic mean of ungrouped data is obtained by dividing the sum of all values of a variable by the number of the values. Thus, for the
 7. The arithimetic mean of grouped data is obtained using the class centres and frequencies of the group. Consider the table below. The centres are denoted as xi, where
i = 1,2,…, k.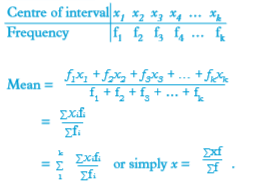 8. The median of N observations which have been arranged in order of size is equal to the value taken by the middle observation. When N is odd, the middle observation is in position 1 – 2(N + 1). When N is even, the median is the mean of the two middle observations, 1 – 2Nth and 1 – 2 (N + 1)th9. To estimate the median of a grouped distribution,(a) find the cumulative frequency of the data, then:(b) identify the median class.(c) The median M of a set of N observations, which have been ranked in order of size is equal to the value taken by the middle 1 – 2 (N + 1)th position when N is odd. When N is even, M is half the sum of the values of the values of the two middle observations i.e. the 1/2 Nth and
 (d) For continuous data, as above, it is sufficient to estimate the median by using the formula only once as, median
 10. The mode in a set of discrete elements is the value of the element that occurs most frequently. The modal class in grouped data with equal class intervals is the class that contains the highest frequency.We use the following variables in the formulae for mode of grouped data:L: the lower limit of the modal class fm: the modal frequencyf1: the frequency of the immediate class below the modal class f2: the frequency of the immediate class above the modal class w: modal class width
 Unit 10 test1. The data below shows the number of words correctly spelt by a group of 30 students in an English lesson
 Use a frequency distribution table starting with class 15 – 19 tocalculate:(a) the mean number of words.(b) the median number of words.(c) state the modal class.2. A die was thrown 25 times and the face that appeared at the top was recorded. The scores were as shown in Table 10.83
 Draw a bar chart to represent the information above3. Four milk dealers Jean, Charlotte, Paul and Lucie shared 1200 litres of milk from a supplier as shown in the piechart (Fig. 10.7). Find the amount of milk in litres, that each dealer got.
 4. The number of patients who attended a clinic by age was grouped as shown in Table 10.84.
 (a) Calculate the mean and median age of attendance.(b) State the modal class.(c) Calculate the mode of the distribution.(d) On the same axes draw a histogram to represent the information.5. Table 10.85 below shows the number of people by age who attended a counselling seminar.
 (a) Calculate the mean and median of the distribution.(b) Draw a histogram and frequency polygon on the same axes to represent the above information.6. Use the histogram in Fig. 10.17 below to calculate the mean and median of the data it represents.
 7. The masses of letters in a post office were recorded in Table 10.86 below:
 Calculate:(a) the mean mass in grams(b) the median mass8. The mean of the numbers 3, 4, a, 5, 7, 9, 5, 8, 5 and 9 is equal to the mode. Find the value of a and hence the median of the data.
UNIT11: TREE AND VENN DIAGRAMS AND SAMPLE SPACE
Key unit competence
By the end of the unit, I will be able to determine probabilities and assess likelihood by using tree and Venn diagrams
Unit outline
• Tree diagrams and total number of outcomes
• Determining probability using tree and Venn diagrams
• Mutually exclusive events
• Independent event
11.1 Introduction
In Book one, you were introduced to probability. Let us remind ourselves some of the concepts that were learnt which we will find useful as we progress in this unit
Activity 11.1
1. Remind yourself what probability and how it is determined numerically?
2. Suppose S1 class has 22 boys and 18 girls. Discuss with your classmate and determine the probability that a student picked at random to rub the chalk board is a
(a) boy
(b) girl
We learnt that probability is the likelihood of a particular event happening. We use numerical values to express the probability of an event (A) happening.

The favourable outcomes are the different ways in which an event A can take place, while the number of all possible outcomes is the sample space
is the sample space. The total number of all possible outcomes can never be less than the favourable outcomes. This explains why probability of any event can never be greater than one. For instance let us define n(A) = number of students who like cycling in a class and as the total number of students who are in class (including those who don’t like cycling).

Example 11.1
Consider a class of 40 students where 20 students don’t like pepper. Find the probability that a student selected at random likes pepper.
Solution
Define an event that a student does not like pepper
Favourable outcomes (number of events)
n(x) = 20
The sample space (total number of trials)
n(S) = 40
So probability that a student selected at random doesn’t like pepper is

Exercise 11.1
1. Numbers 1 to 20 are each written on a card. The 20 cards are mixed together. One card is chosen at random from the pack. Find the probability that the number on the card is;
(a) Even number
(b) A factor of 24
(c) Prime number.
2. A black die and a white die are thrown at the same time. Display all the possible outcomes. Find the probability of obtaining:
(a) A total of 5,
(b) A total of 11,
(c) A ‘two’ on the black die and a ‘six’ on the white die.
3. A fair coin is tossed and a fair die is rolled. Find the probability of obtaining a ‘head’ and a ‘six’.
4. A single 6-sided die is rolled. What is the probability of each outcome? What is the probability of:
(a) Rolling an even number?
(b) Rolling an odd number?
5. The probability that it rains on Christmas day in town X is 0.3.What is the probability that it will not rain on Christmas day in that town?
11.2 Tree diagrams and total number outcomes
Activity 11.2
1. Determine all the possible outcomes of the following events without using any diagram
(a) A guest at ceremony is to choose a combination of one food type and a drink. The food types available are chicken, fish and beef. The drinks available are mango juice, orange juice and Soda.
(b) A choice of combination either a green or blue shirt with either a blue, black or khaki trouser.
2. Using any suitable diagram of your choice, determine all the possible outcomes for the events in 1 above.
3. Which of the above two ways is easier to use?
From Activity 11.2, we can see that we have a sequence of events leading to different possible outcomes. Such sequences are not easy to determine without a diagram. One standard diagram used to determine all the possible outcomes is a tree diagram.
A tree diagram is simply a way of representing a sequence of events. Tree diagrams are particularly useful in probability since they record all possible outcomes in a clear and uncomplicated manner. It has branches and sub-branches which help us to see the sequence of events and all the possible outcomes at each stage. Let us demonstrate this using some examples
Example 11.2
Using a tree diagram, determine all the possible outcomes when a coin is tossed once?
Solution
The tree diagram in Fig. 11.1 shows the sequence of events.

We obtain 2 outcomes from tossing a coin once i.e. head (H) and tail (T)
Example 11.3
Using a tree diagram, determine all the possible outcomes that can be obtained when a coin is tossed twice.
Solution
In the first toss, we get either a head (H) or a tail (T). On getting a H in the first toss, we can get a H or T in the second toss. Likewise, after getting a T in the first toss, we can get a H or T in the second toss. This is well illustrated using the tree diagram in

Therefore we have 4 possible outcomes i.e. {HH, HT, TH, TT}
Example 11.4
Using a tree diagram, determine all possible combinations of outcomes when a coin is tossed once followed by a die tossed once.

Fig 11.3 The possible outcomes are (H1), (H2), (H3), (H4), (H5), (H6), (T1), (T2), (T3), (T4), (T5), (T6). We obtain 12 possible number of outcomes.
NOTE: Tossing one coin n times is the same as tossing n coins at once. For example the outcomes for tossing 3 coins at once is the same as the number of outcomes for tossing one coin three times
BEWARE: HIV and AIDS can spread from infected persons to others in a chain similar to a tree diagram. This is because one person can infect many people who in turn infect others and so on. ABSTAIN and be safe.
Exercise 11.2
1. A bag contains 3 yellow balls and 4 pink balls. Uwase picked two balls one after the other. With the aid of a tree diagram show all the possible outcomes. How many outcomes are there
2. A bag contains 6 yellow balls and 4 pink balls. Higiro picked three balls one after the other. Draw tree diagram shows all the possible outcomes. How many outcomes are there?
3. A blue, red or green cube is selected and a coin is tossed. Draw a tree diagram which shows the possible outcomes. How many outcomes are there?
4. Two Dice are tossed simultaneously. Draw a tree diagram that shows the sum of scores of the possible outcomes. How many outcomes are there?
5. A coin is tossed and a die is rolled. Use a tree diagram to show all the possible outcomes of the experiment.
6. Three coins are tossed simultaneously. Represent the scores on a tree diagram and write down the total outcomes.
7. A coin is tossed 3 times and outcomes are recorded.
(a) How many possible outcomes are there?
(b) How many outcomes are there if the coin is tossed 4 times, 5 times and n times?
8. Three bulbs are tested. A bulb is labeled “G” if good and “D” if defective. Draw a tree diagram to show possible outcomes. How many possible outcomes are there?
9. Kwizera is not having much luck lately. Her car will only start 80% of the time and her motorbike will only start 60% of the time. Draw a tree diagram to illustrate the situation.
10. A bag contains Blue balls, white balls and Red balls. Two balls are picked at random one after the other. Draw a tree diagram showing the outcomes
11.3 Determining probability by using Tree and Venn diagrams
11.3.1 Use of Tree diagrams to determine probability
Activity 11.3
1. In pairs: In a bag containing 3 oranges, 2 mangoes and 4 apples, two of the fruits are picked at random one after the other with replacement. Determine the probability of getting:
(a) An orange followed by a mango
(b) Two oranges
(c) A mango and an apple irrespective of the order.
We can see that once we have the total number of outcomes, it becomes easier to determine the probabilities from tree diagrams.
Example 11.5
A coin is tossed twice.
(a) Represent the outcomes on a tree diagram.
(b) Determine the following probabilities.
(i) Getting H followed by T
(ii) Getting two heads
(iii) Getting head and tail irrespective of order.
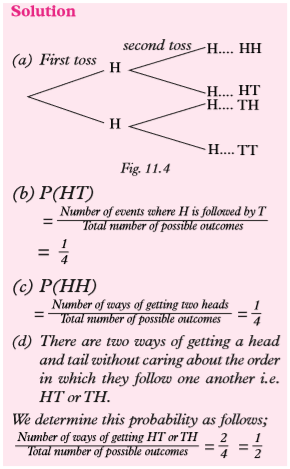
Example 11.6
Mutoni spins 2 spinners; one of which is coloured red, yellow and blue, and the other is coloured green, white and purple (Fig 11.5)

(a) Draw a tree diagram for the experiment.
(b) What is the probability that the spinners stop at “B” and “G”?
(c) Find the probability that the spinners do not stop at “B” and “G”.
(d) What is the probability that the first spinner does not stop at “R”?

Example 11.7
Bag A contains 3 balls numbered 1, 2 and 3. Bag B contains 2 balls numbered 1 and 2. One ball is removed at random from each box.
(a) Draw a tree diagram to list all the possible outcomes.
(b) Find the probability that:
(i) The sum of the numbers is 4
(ii) The sum of the two numbers is even.
(iii) The product of the two numbers is at least 5.
(iv) The sum is equal to the product.
Solution
(a) Fig 11.7 shows the tree diagram for all possible outcomes.
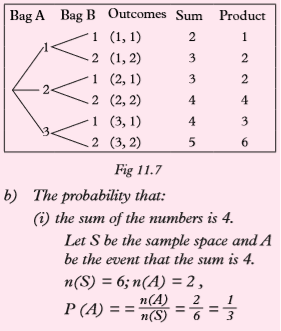

Exercise 11.3
1. A bag contains 4 cards numbered 2, 4, 6, 9. A second bag contains 3 cards numbered 2, 3, and 6. One card is drawn at random from each bag.
(a) Draw a tree diagram for the experiment.
(b) With the help of the tree diagram, calculate the probability that the two numbers obtained: (i) Have different values.
(ii) Are both even.
(iii) Are both prime.
(iv) Have a sum greater than 5. (v) Have a product greater than 16.
2. A hat contains 3 red, 4 blue and 5 green tickets. If one ticket is chosen at random, what is the probability that it is;
(i) Red
(ii) Blue
(iii) Green
3. A bag contains 3 blue and 2 red marbles. Three marbles are drawn at random one after the other. Find the probability that;
i) Atleast two red marbles are obtained
ii) All are blue.
4. A spinner is divided into four equal parts colored red, yellow, green and blue. When the spinner is spun, what is the probability that it lands on:
i) Red
ii) Green
5. A spinner has three equal parts numbered 1, 2 and 3. When this spinner is spun twice;
(i) Draw a tree diagram to show the results
(ii) What is the probability of obtaining a total of 4?
(iii) What is the probability of obtaining atleast one 3.
6. When two children are born, the sample space for the order of birth is S={bb (boy followed by boy), bg (boy followed by a girl), gb (girl followed by a boy), gg (girl followed by a girl)}.
a) Draw a tree diagram for the child births
b) Find the following probabilities
i) Atleast one boy is produced
ii) Atleast one girl is produced
iii) Atmost one boy is produced.
7. Illustrate on tree diagrams the sample spaces for the following.
a) Tossing a 5 francs coin and 10 francs coin simultaneously twice.
b) Tossing a coin once and twirling a triangular spinner whose sides are labelled A, B and C
c) Twirling two equilateral spinners whose sides are labelled 1, 2, 3 and X, Y and Z
d) Drawing two tickets from a hat containing a large number of tickets of Pink, blue, white and Green.
11.3.2 Determining Probability Using Venn diagrams
Activity 11.4
Determine the chances of the following:
1. A survey involving 150 Rwandan people about which game(s) they like showed that 83 like football, 58 like the volleyball. 36 like neither of those two games. What is theprobability that a person selected at random likes both games?
2. A survey involving 50 people was carried out about which food they like among banana, sweet potatoes, and beans. We found that 15 people like banana, 30 people like sweet potatoes, 19 people like beans, 8 people like banana and sweet potatoes, 12 like banana and beans, 7 people like sweet potatoes and beans. 5 people like all the three types of food. What is the chance that a person selected at random do not eat any of the foods mentioned?
3. How easy was it to determine probabilities in 1 and 2? How could it have been done easily? Discuss.
We can clearly see that without a Venn diagram, some probability situations become somehow difficult to analyse.
A Venn diagram refers to representing mathematical or logical sets pictorially as circles or closed curves within an enclosing rectangle (the universal set), common elements of the sets represented by intersections of the circles.
When you have data and you are to use the Venn diagram to solve the problem, always remember the following tips.
(a) Always start with the most specific information you have (basic regions).
(b) If you can’t use a piece of information yet, pass over it and try again later.
(c) As you interpret the information, remember:
(i) And implies intersection
(ii) Or implies Union
(iii) Not implies complement.
Example 11.8
A survey involving 120 people about their preferred breakfast showed that; 55 eat eggs for breakfast. 40 drink juice for breakfast. 25 eat both eggs and drink juice for breakfast.
(a) Represent the information on a Venn diagram.
(b) Calculate the following probabilities.
(i) A person selected at random takes only one type for breakfast.
(ii) A person selected at random takes neither eggs nor juice for breakfas
Solution
Let A= Eggs those who eat eggs only, B = Juice those who take juice only and z represent those who did not take any.

Here, we can now solve for the number of people who didn’t take any for breakfast
x = 55 – 25=30
So 30 people took Eggs only Also,
y = 40 – 25 = 15
So, 15 people took Juice only.
Hence 30 + 25 + 15 + z = 120
Z = 120 – (30+15+25)
Z = 120 – 70
Z = 50
The number of people who did not take anything for breakfast is 50.

Example 11.9
In a survey of 150 Rwandan people about which newspapers they read, 83 read the New Times, 58 read the Imvaho Nshya. 36 read neither of those two papers. Represent the data on the Venn diagram and find the chance that a person selected at random reads both papers.
Solution
Here we can let N= New Times,
M= Imvaho Nshya,
x= New Times only,
z= both New Times and
Imvaho Nshya,
y= Imvaho Nshyaonly

We can therefore calculate the value of z which is required in the question
83 = x + z, so z = 83 – x 58 = y + z, so z = 58 – y
Hence 83 – x = 58 – y , which gives x – y = 25 ………………(1)
Also, x + z + y + 36 = 150

Example 11.10
In a survey of 50 people about which Hotels they patronize among Hilltop, Serena, and Lemigo. We find that 15 people eat at Hilltop, 30 people eat at Serena, 19 people eat at Lemigo 8 people eat at Hilltop and Serena, 12 people eat at Hilltop and Lemigo,7 people eat at Serena and Lemigo. 5 people eat at Hilltop, Serena, and Lemigo.
(a) What is the chance that a person selected at random eats only at Hilltop?
(b) How many eat at Hilltop and Serena, but not at Lemigo?
(c) How many people don’t eat at any of these three hotels?
(d) What is the probability that a person selected at random do not eat at any of the hotels mentioned
Solution
This problem involves a Venn diagram of 3 circles.
Let H represent Hilltop, S represent Serena and L represent Lemigo
Let x represent those who eat at Hilltop only
Let y represent those who eat at Lemigo only, z represent those who eat at Serena only and w represent those who don’t eat at any Hotel.


Exercise 11.4
1.We survey 600 adults about which modes of transportation they have used in the past year. We find that: 100 traveled by plane but not train 150 by train but not by plane 120 by bus but not by train or plane 100 by both bus and plane 40 by all three 440 by bus or train
(a) Represent the data on the Venn diagram
(b) Find the probability that a person selected at random travels by only one mode.
2. A group of 50 people were asked about the three newspapers “IMVAHO NSHYA”, “UMUSESO”, “THE NEW TIMES” they read. The results showed that 25 read IMVAHO NSHYA, 16 read UMUSESO, 14 read NEW TIMES, 5 read both IMVAHO NSHYA and UMUSESO, 4 read both UMUSESO and NEW TIMES, 6 read both IMVAHO NSHYA and NEW TIMES, 2 read all the three papers
(a) Represent the data on the Venn diagram.
(b) Find the probability that a person chosen at random from the group reads;
(i) At least one of the three papers
(ii) Only one of the three papers
(iii) Only IMVAHO NSHYA
3. A survey was carried out in a shop to find out how many customers bought bread, or milk or both or neither. Out of a total of 79 customers for the day, 52 bought milk, 32 bought bread and 15 bought neither. Draw a Venn diagram to show this information and use it to find the probability that a person chosen at random
(a) Bought bread and milk
(b) Bought bread only
(c) Bought milk only
4. In a survey of course preferences of 110 students in a senior six class, the following facts were discovered. 21 students like engineering only, 63 like engineering, 55 like medicine and 34 like none of the two courses.
(a) Draw a Venn diagram to show this information.
(b) What is the probability that a student selected at random likes Engineering or Medicine?
(c) What is the probability that a student selected at random likes Engineering and Medicine?
(d) What is the probability that a student selected at random likes Medicine only?
5. In a cleanup exercise carried out in Karongi town, a group of students were assigned duties as follows; all of them were to collect waste paper. 15 were to sweep the streets but not plant trees along the streets, 12 were to plant trees along the streets 5 of them were to plant trees and sweep the streets.
Draw a Venn diagram to show this information and use it to calculate the number of children in each group. Find the probability that a student selected at random does not do any of the duties assigned.
DID YOU KNOW
It is important to maintain the environment by keeping our surrounding clean. Planting trees around us helps to keep the environment conducive by providing fresh air.
11.4 Mutually exclusive events
Activity 11.5
In Virunga transport company in Rwanda, there are 50 buses. 20 of them are Isuzu model and 15 of them are Coaster model. If a bus is picked at random,
(a) Can the bus be both of Isuzu and Coaster model?
(b) What is the probability that it is of Isuzu model?
c) What is the probability that it is of Coaster model?
d) What is the probability that it is of Isuzu or Coaster model?
e) Discuss with your classmate the easiest way of determining the probability in (d).
From activity 11.5, we can clearly see that the occurrence of one event excludes the occurrence of the other. For example when a bus is of Isuzu model, it cannot be of Coaster model.
Similarly, when a coin is tossed once, the result will either be a head or a tail. If a head occurs, a tail cannot occur. Such events in which occurrence of one excludes the occurrence of the other are called mutually exclusive events. If A and B are two mutually exclusive events, then P (A or B) = P (A) + P (B). This is the addition law of probabilit

Example 11.13
Two dice are thrown together. Find the probability of getting a sum:
(a) Of 8 or 3.
(c) Of at least 6.
(d) Greater than 9.
(e) Of 3 or less.
(f) Not more than 3.
(g) That is even.
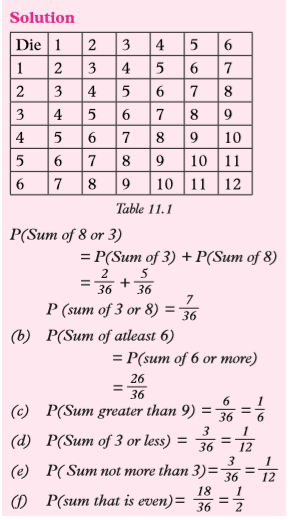
Exercise 11.5
1. A group of tourists arrived at Kigali International Airport. 5 were English, 4 were French, 8 were American and 3 were German. One was chosen at random to be their leader. What is the probability that the one chosen was
(a) English
(b) American
(c) German
(d) French or German
(e) English or French
(f) Not English?
2. In a bag, there are some blue pens, some red pens and some of other colours. The probability of taking a blue pen at random is 1/7. If the probability of taking a blue pen or a red pen at random is 8/21, what is the probability of taking
(a) a red pen?
(b) a pen which is neither red nor blue?
3. In a factory, machines A, B and C produce identical balls. The probability that a ball was produced by machine A or B is 11/15. The probability that a ball was produced by machine B or C is 2/3. If the probability that a ball was produced by machine A is 1/3, what is the probability that a ball was produced by machine C?
4. A card is chosen at random from an ordinary pack of playing cards. What is the probability that it is
(a) either hearts or spades?
(b) either a club or a jack of spades?
5. When playing netball, the probability that only Ann scores is 1/4, the probability that only Betty scores is 1/8 and the probability that only Carol scores is 1/12. What is the probability that none of them scores?
6. Two dice are tossed. Find the probability that
(a) an odd number shows on the second die,
(b) a two or a five shows on the first die,
(c) a two or a five shows on the first die and an odd number on the second die.What connection is there between the answers to parts (a), (b) and (c)?
7. In a certain school of 1 000 pupils, 20 are colour blind and one hundred are overweight. A pupil is chosen at random. What is the probability that the pupil is
(a) colour blind,
(b) overweight
11.5 Independent Events
Activity 11.6
Work in pairs.
A coin and a die are tossed at the same time.
(a) Can we get a head and a six at the same time?
(b) What is the probability of getting a head from the coin?
(c) What is the probability of getting a six from the die?
(d) What is the probability of getting both a head and a six (H6)?
(e) Discuss with your partner the easiest way of determining the probability in (d).
From activity 11.6, we can clearly see that the occurrence of an event in tossing a coin does not affect the occurrence of an event in tossing a die. In otherwords, both events can take place at the same time.
Similarly, when a coin is tossed twice, getting a head or a tail in the first toss does not affect getting a head or a tail in the second toss. Such events in which two or more events can take place at the same time or one after the other are called Independent events.
If A and B are two independent events, the probability of them occurring.’ together is the product of their individual probabilities.
That is; P (A and B) = P (A) x P (B).
If A, B and C are three events,
then P (A and B and C) =P (A) ×P (B) ×P(C) This is known as the multiplication law of probability.

Note
All the events on the same branch in a tree diagram are independent. Hence we cannot add the probabilities of events on the same branch. However, the combined events of one branch is mutually exclusive to the combined event any other branch. Hence we can add the probability of the combined event of one branch to that of the combined event of another branch.
Example 11.15
Three different machines in a factory have different probabilities of breaking down during a shift as shown in table below:

Find:
a) The probability that all machines will break down during one shift.
b) The probability that none of the machines will break down in a particular shift.

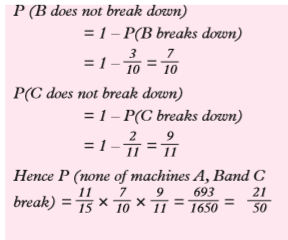
Example 11.16
A boy throws a fair coin and a regular tetrahedron with its four faces marked 1, 2, 3 and 4. Find the probability that he gets a 3 on the tetrahedron and a head on the coin.

Example 11.17
A bag A contains 5 red balls and 3 green balls. The second bag B contains 4 red and 6 green balls. A bag is selected at random and two balls are picked from it one after the other without replacement.
a) Represent the information on the Tree diagram.
b) Find the probability of the following events;
i) Both balls are red from bag A.
ii) Both balls are of different colours from different bags.


Exercise 11.6
1. A bag contains 7 black and 3 white balls. If two balls are drawn from the bag, what is the probability that
(a) one is black and one is white?
(b) they are of the same colour?
2. Three pupils were asked to solve a problem. Their chances of solving the problem independently were 1/2,
1/3 and 1/4.(a) What is the chance that all of them solved the problem independently?
(b) What is the probability that only two solved the problem independently?
3. Two dice are tossed giving the events: A: the first die shows a six, B: the second die shows a three, C: the sum of the numbers on the two dice is 7. Check these events for independence.
4. A class has 18 boys and 12 girls. Three pupils are chosen at random from the class. What is the probability that (a) they are all boys? (b) one is a boy and the others are girls?
5. In an office there are 3 men and 7 women. Three people are chosen at random. What is the probability that two are women and one is a man?
6. Events A and B are such that P(A) = 1/5 and P(A and B) = 2/15. What is P(B) if A and B are independent?
7. A bag contains 7 lemons and 3 oranges. If they are drawn one at a time from the bag, what is the probability of drawing a lemon then an orange, and so on, alternately until only lemons remain?
8. A die is tossed. What is the likelihood of scoring;
i) A 3 or a 4?
ii) A prime number or an Even number?
9. A bag contains 8 black balls and 5 white ones. If two balls are drawn from the bag, one at a time, find the probability of drawing a black ball and a white ball without replacement.
10. Two marbles are drawn in turn from a pack containing 3 red marbles, 6 white marbles, 7 black marbles and 9 green marbles. If this is done without replacement, determine the probability of drawing two white marbles.
11. At a mountain Village in Kigali, it rains averagely 6 days a week. Find the probability that;
a) Any one day
b) Two successive days
c) Three successive days
12. A school has two photocopiers A and B. On a certain day, A has 8% chance of malfunctioning while B has 12% chance of malfunctioning. Determine the probability that on any one day of the week, the machines will;
a) Malfunction
b) Work effectively
13. Two marksmen Jean and Benitha fire at a target simultaneously. The Chance that Jean hits the target is 70% while the chance that Benitha hits the target is 80%. Find the probability that;
a) They both hit the target
b) They both miss the target
c) Jean hits the target but Benitha misses
d) Benitha hits the target but Jean misses.
14. A coin is tossed 3 times. Determine the probability of getting the following sequence of results; a) Head then Head then Head b) Tail then Head then Tail
15. A couple would like 4 children, none of whom will be adopted. They will be disappointed if the Children are not in order Boy, Girl, Boy, Girl. Determine the probability that they will be;
a) Happy with the order of arrival
b) Unhappy with the order of arrival.
16. Suppose a box X contains 2 green and 2 blue balls. Then box Y contains 1 white and 3 red balls. Assume a ball is selected at random from each box, what is the probability of getting a blue from X and a red from Y?
Unit Summary
1. Probability: It is the likelihood of a particular event happening.
2. Tree diagram: It is a standard diagram used to determine all the possible outcomes in a sequence.
3. Mutually exclusive events: These are events in which occurrence of one excludes the occurrence of the other.
4. Independent events: These are events in which two or more events can take place at the same time or one after the other.

6. Addition law of probability: It states that if A and B are two mutually exclusive events, then P (A or B) = P (A) + P (B).
7. Multiplication law of probability: If A and B are independent events, then, P(A and B) = P(A) × P(B) If A, B and C are independent events, then P(A and B and C) = P(A) × P(B) × P(C)
8. A Venn diagram: It refers to representing mathematical or logical sets pictorially as circles or closed curves within an enclosed rectangle (the universal set), where common elements of the sets represented by intersections of the circles.
9. Possible outcomes: It is the sample space.
10. Favorable outcomes: These are the different ways in which an event A can take place.
Unit 11 Test
1. In a group of 50 students 40 study mathematics, 32 study physics and each student studies atleast one of the subjects
(a) Use the Venn diagram to determine the number of students who study both subjects.
(b) If a student is chosen at random from the group find the probability that
(i) Students do mathematics but not physics.
(ii) Studies both physics and Mathematics.
2. 50 students went bush-walking, 23 were sunburnt, 22 were bitten by ants, 5 were both sunburnt and bitten by ants. Determine the probability that a student chosen at random;
(a) Escape being bitten
(b) Was either bitten or sunburnt
(c) Was neither bitten nor sunburnt
3. A chocolate is randomly selected at from a box which contains 6 chocolates with soft cores and 12 chocolates with hard cores. Let H represent chocolates with hard cores and S represent chocolates with soft cores. (a) Are events H and S mutually exclusive? (b) Find P(H), P(HnS) and P(H or S)
4. A box contains 4 red and 2 yellow tickets. Two tickets are drawn at random one after the other without replacement. Find the probability that;
(a) Both are red
(b) The first is red and the second is yellow
5. A hat contains 20 tickets numbered 1, 2, 3, ….., 20. If 3 tickets are selected without replacement. Determine the probability that they all contain prime numbers.
6. A coin is flipped and a die is tossed. Determine the probability of getting a 3 on a die and a head on a coin.
7. Kayesu is not having much luck lately. Her car will only start 80% of the time and her motorbike will only start 60% of the time.
(a) Draw a tree diagram to illustrate the situation
(b) Use the tree dagram to find the probability that
(i) Both car and motorbike will start.
(ii) Kayesu can only use her car.
8. A box contains 7 red balls and 3 green balls. Two balls are drawn one after the other without replacement. Determine the probability that;
(a) Both are red
(b) The first is green and the second is red
c) A green and red are obtained
9. A pair of dice is rolled
(a) Illustrate the situation on a two dimensional grid
(b) Us the grid to determine the following probabilities;
(i) Two 3’s
(ii) a 5 or a 6
(iii) Exactly one 6
(iv) A sum of 7
(v) A sum of 7 or 11
(vi) A 5 and a 6 or both
(vii) A tleast a 6
(viii) No sixes
(ix) A sum greater than 8