Key unit competence: Learners will be able to analyse the effects of
price changes in an economy over time.
My goals
By the end of this unit, I will be able to:
- Identify the types of indices and the steps of compiling price indices for various periods.
- Explain the uses of price index numbers.
- Explain the problems with compiling price indices in an economy.
- Compute and interpret price indices for various periods.
- Assess the importance of computing price indices and the problems involved.
- Appreciate the importance of compiling price indices and advocate for the improvement of the standard of living for people.
3.1 The price index
Activity 1
Back in 2012, in Rwanda, prices of most of the consumed commodities such as sugar, salt, rice, fish etc.
were seen to be cheap. Prices of such same commodities have changed over time and are not the same today.
Visit around the school community and research about the prices of such sighted commodities in 2012 and the
current prices. Thereafter find out the following:
1. What do we call such a change in prices from one year to another?
2. Relate the prices in 2012 and the current price.
3. Calculate the price changes from 2012 to date.
4. How would you interpret such price changes?
Facts
Price index can be defined as the measure of the variation in the prices of a given class of goods and services
over a period in a given region. It shows average changes in price over a period,
i.e. from a base year to a current year.
3.1.1 Types of price indices
The following are some of the price indices:
1. Consumer price index (CPI): This measures the changes in the price level of a market basket of consumer
goods and services bought by households. The National Institute of Statistics of Rwanda (NISR) collects the
CPI price information and calculates the CPI statistics for Rwanda on a monthly basis.
2. Producer price index (PPI): This measures the average changes in the prices received by domestic producers
for their output.
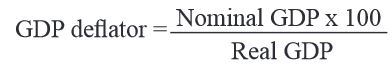
3. Gross Domestic Product deflator (GDP deflator): It is sometimes referred to as implicit price deflator.
It is a measure of the level of prices of all new, domestically produced final goods and services in an economy
it can be measured by:
4. Retail price index (RPI): This is the measure of the variation of consumer prices or consumer retail goods and
services over a period. RPI is computed on a monthly basis but an annual rate is also published which serves as
a yardstick for adjusting salaries and wages, tax allowances and pensions, among others.
3.1.2 The procedure for computing cost of living index
• Selecting the base year: This is the year when prices were relatively stable and it is equated to 100% so as to
show the change in the prices
• Selecting the basket of commodities. This is a basket which represents commodities that were wholly consumed
by the people in a country during a period of time.
• Collecting information about the basket of commodities.
•
Calculating the simple price index/price relative. This is calculated by:

Where P1 is current year price, P0 is base year price.
• Attaching weights: Weights are attached to show the relative value of the goods. The commodity with the biggest
weight has more value than the one with a small weight. This is done by:
Weighted index = SPI x Weights.
• Calculate Average Simple Index
• Calculating the cost of living index/average weighted index
This is done by:
• Interpreting the findings to find out whether there was an increase or a decrease in the prices of the consumer
basket during a given period of time.
Computation
Example
1. Calculate the SPI for 2015
2. Calculate the average weighted index (COL index) for 2015.
3. Interpret your findings.
Calculating the cost of living index can be done in the following few steps:
Step one
Calculate the SPI for each commodity for each year:
Sugar SPI = P1/ P0 x 100 Rice SPI = P1/ P0 x 100
200/ 100 x100 = 200 150/100 x 100 = 150
Salt SPI = P1/ P0 x 100 Fish SPI = P1/ P0 x 100
30/20 x 100 = 150 30/50 x 100 = 60
Step two
Attach weights for the different commodities by:
Weighted index (WI) = SPI x weights
Sugar Rice
WI = 200x 3 = 600 WI = 150x 5 = 450
Salt Fish
WI = 150x 1 = 150 WI = 60x 2 = 120
Step Four
Calculating the cost of living index/ average weighted index through the following method:
Interpreting
There was an increase in the prices of goods and services from 100 to 120 by a 20% increase.
The cost of living increased while the standard of living reduced other factors remaining constant.
3.1.3 Uses of the price indices
Activity 2
Basing on the case study above, analyse the following:
1. Why do you think price index statistics is useful in your country?
2. What problems do you think are met in compiling price indices in Rwanda?
Facts
• Measuring changes in the value of money: When the general price level increases, the value of money,
commodities which a unit of money can buy reduces. When the general price level reduces, the value
of money increases.
• It is the measure of the rate of inflation which is the difference between relative price changes of 2 years.
When the price increases, it means there is inflation. When the price reduces, it means there is a deflation.
• Wage determinating and change, i.e. wage changes should match with changes in the general price level
to avoid a decline in the standard of living of workers when there is inflation and this can be done basing
on the price index figures.
• The price index can be compiled for different regions and towns so as to determine allowances, wages,
taxes, etc. which should match with inflation.
• Comparison purposes: The price Index can be used to compare the standard of living between countries at a
point of time, and in one country over time.
• The producers’ price index for inputs is used to measure the variations of input prices. This helps policy makers
when designing policies to influence input prices.
• The price index helps the government in pricing contracts and awarding tenders, for example, for construction,
input price variation is important when determining total costs to fix and to revise contract values.
• The central bank uses price indices to design policies which can stabilise prices.
• The price index for different regions in the country helps manufactures to locate sources of cheaper inputs and
areas with higher output prices where to sell commodities.
• Price indices help the government to trace the cause of scarcity of inputs which are reflected in their prices,
for example the drought can be the cause of increase of agricultural raw materials
3.1.4 Problems of compiling index numbers
• There are different ways and formulae of compiling index numbers. The values calculated may differ by the method
used and this makes comparison difficult.
• Choosing the base year: Because of inflation, it is difficult to get the year when prices were stable.
• It is hard to include all commodities in the index. Representative commodities may not show the cost of living of same
groups of people although attempts are usually made to include in as many commodities as possible.
• Because of changes in tastes and preferences, weights (relative importance that people attach to commodities) change
over time and, therefore, there is a need to compile new index numbers over time.
• Weights always change because of new discoveries, innovations and changes in consumption patterns meaning that
the importance or the value of the commodity may vary in the same year.
• The change in the general price level may be due to change in the quality of products. This may be misinterpreted to
be inflation.
• Differences in income, for example the rich and the poor consumer different commodities. Therefore, one index cannot
reflect the change in cost of living of all income groups.
• The introduction of new commodities and the changes in the tastes and preferences also lead to shift to other
commodities, hence a problem when comparing the prices in the different years.
Unit assessment
1. (i) Discuss the reasons for periodical revision of cost of living index.
(ii) What problems are encountered when constructing an index number?
2. Given the information in the table below, answer the questions that follow.
Calculate the;
i. simple index for 2016
ii. weighted index for 2016
iii. simple cost of living index for 2016
iv. weighted cost of living index 2016
3.2 Glossary
- Base year:A year or a chosen point in time for comparison purposes in order to express or compute index numbers.It is also calledbase period.
- Cost of living:How much (money) a consumer can utilise so as to enable him or her afford basic necessities at the prevailing price level for example during the inflation, the cost of living tends to be high and vice versa.
- GDP deflator:This measures the average level of prices of all goods and services included in the GDP.
- Given period: Any particular period that is being compared with the base year. It is otherwise commonly called current year
- Gross domestic product (GDP):The value of output produced with in the economy, whether produced by nationals or non-nationals of that economy.
- Price index: The measure of the variation in the prices of goods and services over a period.
- Producer price index:The price index of wholesale goods such as steel, wheat and oil.
- Real national income (GDP):Nominal national product divided by price index x 100, i.e.

- Retail price index: The measure of the variation of consumer prices of basic needs of a group of people over a period.
Unit summary
• Meaning of price index
• Types of price indices
• Steps of computing price indices
• Computation of price indices
• Uses of price indices
• Problems of computing price indices
 4. Retail price index (RPI): This is the measure of the variation of consumer prices or consumer retail goods andservices over a period. RPI is computed on a monthly basis but an annual rate is also published which serves asa yardstick for adjusting salaries and wages, tax allowances and pensions, among others.
 • Calculating the cost of living index/average weighted indexThis is done by:
 • Interpreting the findings to find out whether there was an increase or a decrease in the prices of the consumerbasket during a given period of time.
 Calculating the cost of living index can be done in the following few steps:

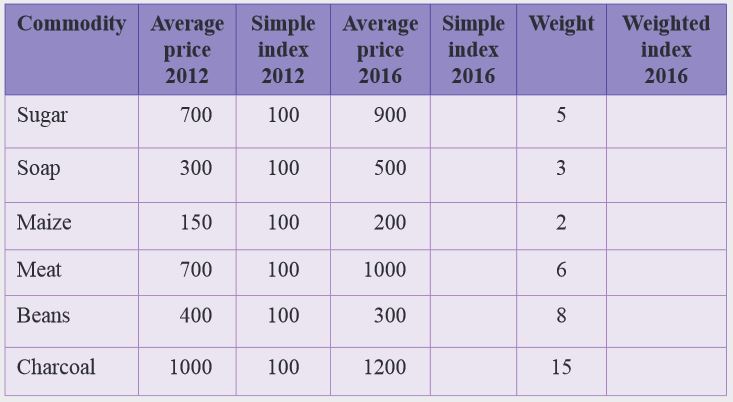 Calculate the;i. simple index for 2016ii. weighted index for 2016iii. simple cost of living index for 2016iv. weighted cost of living index 2016