Topic outline
General
- Economics S5 SB File Uploaded 28/01/22, 14:53
- S5: Economics TG File Uploaded 11/08/22, 23:04
Unit 1: MARKET STRUCTURES
5. Identify other businesses in Rwanda that may fall under the same market structure.Key unit competence: Learners will be able to analyse the operation of
firms under different market structures.
My goals
By the end of this unit, I will be able to:- Identify the different categories of market structures and their characteristics.
- Explain the process of profit maximisation of firms under different markets in both the short run and long run.
- Explain the advantages and disadvantages of firms under different market structures.
- Explain why firms continue to produce even when they are making losses.
- Explain the conditions for successful price discrimination under monopoly conditions and the different forms.
- Identify the different forms of product differentiation under monopolistic competition.
- Explain how prices are determined under oligopoly firms.
- Describe the conditions under which different market structures operate.
- Analyse the operation of firms under different markets in both the short run and long run.
- Illustrate the process of profit maximisation of firms under different markets in both the short run and long run.
- Illustrate the break even and shut down point under perfect competition.
- Analyse how firms under oligopoly win markets without price wars.
- Illustrate the kinked demand curve under an oligopoly.
- Make a comparison between different market structures and appreciate the conditions under which they operate.
1.1 Introduction to market structures
1.1.1 Meaning
A market is any arrangement that brings buyers and sellers into close contact to transact business with an aim of making profits. It may be a physical place, communication through telephone, fax and mail. Different markets have different characteristics, participants and conditions. Thus, markets differ in number of sellers and buyers, nature of the product, entry conditions, degree of knowledge, cost conditions, etc. The conditions that prevail in the market which determine how the market players operate are what we call the market structures. Therefore, a market structure is a range of unique features or characteristics that describe a given market.Market structure is categorised into two:1. Perfect markets: These include perfect competition.2. Imperfect markets: These include monopoly, oligopoly, monopolistic competition, etc.Activity 1
Basing on figure 1 on page 5:1. Distinguish between a market and a market structure.2. Identify the features found in the two markets a and b.3. Describe the differences between the two markets.
1.2 Perfect markets
Activity 2
Basing on figure 2 below:1. Identify the nature of commodities.2. How many sellers can you recognise in the picture?3. What type of market structure is seen in the figure below and why
Facts
Under perfect markets, there is basically one market situation that is known as perfect competition.1.2.1 Perfect competition
Perfect competition is a market structure where there are several buyers and sellers dealing in a homogeneouscommodity and possessing perfect knowledge of market conditions at that particular time.Conditions/features for perfect competition
Perfect competition is said to exist where there are the following conditions or features:• There are many buyers and sellers in the market. No seller/buyer controls the market conditions independently.Each participant in the market cannot independently influence the price of the commodity.Therefore, firms underperfect competition are price takers, i.e. they take the price that is determined by automatic forces of demand and supply.• All the commodities sold are similar or homogeneous. All firms in the industry produce the same product such that there isno way a consumer can prefer one producer’s product to the other.• There is no government intervention in form of fixing prices. All participants in the market abide by the price that is set byforces of demand and supply. Such a price rules all over the industry.• The demand curve of a perfect competitor is perfectly elastic. This indicates a constant price for the whole industry.At this point, marginal revenue is equal to average revenue which is equal to the price. • The firms under perfect competition do not incur transport costs. Under perfect competition, it is assumed that the rawmaterials, the firm, the consumers, are all found in the same place or locality• There is perfect mobility of factors of production from one production unit to another. Factors of production can easilymove from places of low payment to better paying places. It is further assumed that labour is easily acquired.• Buyers and sellers have perfect knowledge about the market conditions. It is assumed that the price, quality, quantity andthe location of the product in question are known by all the participants in the market.• There is no persuasive advertising. This is because the commodities are the same and the consumers have perfectknowledge about the market conditions. There may be some informative advertisements to make the consumers awareof the products.• There is free entry and exit in the industry. Firms can freely join the industry if they anticipate making profits and can alsofreely leave the industry if they make losses.• The major aim of firms is profit maximisation. This is attained at a point where the marginal cost is equal to the marginalrevenue (MC = MR).
Examples of perfect competition
In the real world, its hard to find examples of industries which fit all the criteria of ‘perfect knowledge’ and‘perfect information’. However some industries are close and these may include:1. Foreign exchange markets: Here currency is all homogeneous and traders will have access to many buyers and sellersand there will be good information about relative prices.2. Agricultural markets: In some cases, there are several farmers selling identical products to the market e.g. tomatoes,pineapples, Irish potatoes, bananas, etc. and many buyers. At the market, it is to compare prices.3. Internet related industries: It is easy to compare prices quickly and efficiently and entry barriers are lower.Note : At times, a distinction is made between pure competition and perfect competition.Pure competition is characterised by: Many firms and buyers, product homogeneity, free entry and exit, profit-maximisation,no government interference, no transport costs, no persuasive advertising.Perfect competition, on the other hand, requires the fulfillment of two additional conditions: Perfect mobility of factors of production and perfect knowledge of market conditions.Therefore, perfect competition is a wider term than pure competition. In other words, pure competition is a subset of perfect competition.The demand curve for a firm under perfect competition
Activity 3
Make research in the nearby market and find out the following.1. What is the price of tomatoes? (ask at least three sellers).2. Why do they sell at that price?Facts
Each firm in a perfectly competitive market faces a perfectly elastic demandcurve because variations in the firm’s outputhave no noticeable effect on price. The perfectly elastic demand curve does not indicate that the firm could actually sell an infinite amount at the prevailing price. It only indicatesthat the variations in production will leave the price unchanged because their effect on total industry output will be negligible. The firm’s output variation has only a tiny percentage effect on industry output. The price is determined by the industry.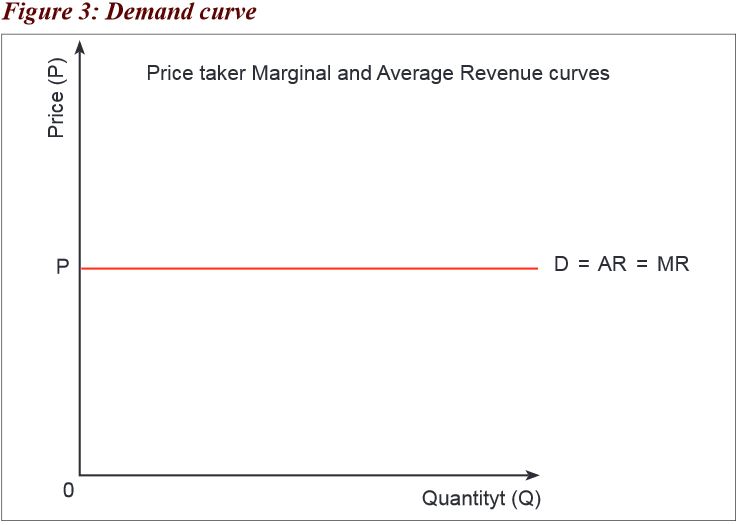 As shown in Figure 3 above, the demand curve is equal to the average revenue curve and equal to marginal revenuecurve. (D=AR=MR)
Cost curves under perfect competition
Activity 4
Basing on the knowledge of the theory of costs:1. Distinguish between marginal cost and average cost.2. Describe the nature and relationship between the two above.Both the Marginal Cost (MC) and Average Cost (AC) are U-shaped under market structures because of the law ofdiminishing returns and economies and diseconomies, respectively.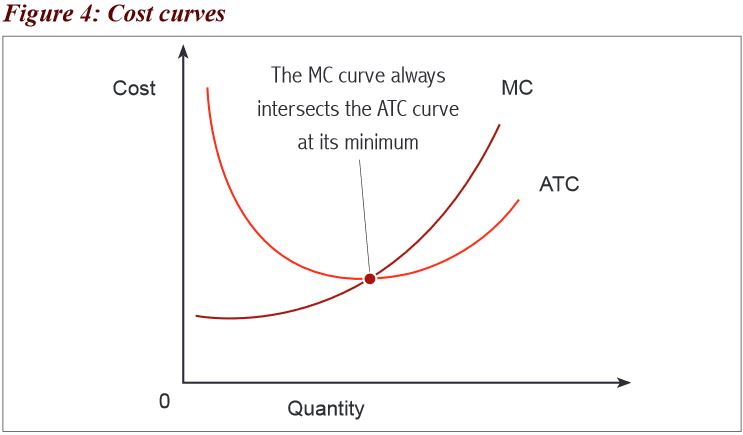 The MC and AC are both U-shaped but the MC curve cuts the AC curve from its lowest point (i.e. optimum point of a firm).
Relationship between average revenue (AR) and marginal revenue (MR), price and demand of a firm under perfect competition
The AR curve is the same as MR curve under perfect competition. This is because selling an extra unit of output adds the same amount to the total revenue since the price is constant, i.e. AR=P=D=MR as illustrated below. As shown in Figure 5 on page 10, the price is equal to demand, marginal revenue and average revenue (P=D=AR=MR).
Short-run equilibrium position of a firm under perfect competition
Activity 5
Using the photos in figure 6 below:1. Describe the situations in the two photos.2. Define the term equilibrium.3. When do you think the firm is in equilibrium?
Facts
Equilibrium can be defined as a state of balance when variables under consideration have no tendencies to change.The firm is in equilibrium at a point where marginal cost (MC) is equal to the marginal revenue (MR), and it is when profits are maximised. The firm aims at producing the level of output which maximises a difference between TR and TC. This is when it pays the firm to keep output unchanged. The slope of MC must be greater than the slope of MR at the equilibrium output.This is when the MC curve cuts the MR curve from below. For the competitive firm which is maximising profit,we have P = AR = MR = MC. This can be illustrated in the figure below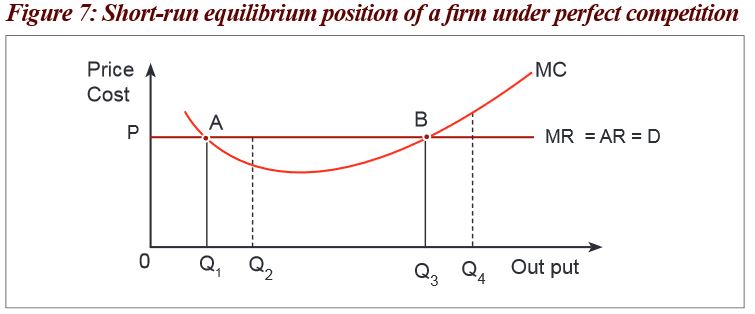 As shown in Figure 7, at point A (output 0Q1), the firm is in equilibrium, i.e. MC = MR. However, this is not sufficient. It,therefore, requires the firm to increase output to a higher output e.g. 0Q3 in order to fetch more revenue compared to thecost incurred in its production.At point B, the firm fulfils the sufficient condition of equilibrium by producing a high output 0Q3 where MC= MR and MCis rising. At equilibrium, the firm may either make abnormal profits or incur losses (sub-normal profits) depending on thelevel of averagetotal cost (ATC).
Price and output determining of a firm under perfect competition in the short-run
(Equilibrium of the firm in short-run)
Activity 6
Umutesi and Murenzi started separate businesses of selling tomatoes on 1st of January 2016. They each started with 5000 FRW. After two months of activity, Umutesi received 7000 FRW while Murenzi received 4000 FRW.From the case study above:1. Identify the costs and revenues of each seller.2. Calculate the difference between Umutesi and Murenzi’s earnings.3. Describe the nature of their earnings.4. Illustrate the above information on graphs.Facts
In the short-run, the firm can either make abnormal profits or losses.Losses are made because the firm may be new and incurring higher costs of production.Abnormal profits in the short-run
The firm will be in equilibrium at a point where marginal cost (MC) = marginal revenue (MR) and it will come under the following conditions:• The average revenue (AR) must be greater than the average cost (AC).• The average revenue curve determines the price while the average cost curve determines the cost of the firm.• Average cost curve must be below the average revenue curve.• Marginal cost curve cuts the average cost curve at the lowest point. As shown in Figure 8 on page 13, the firm produces output 0Q at total cost
 and sells it at price 0P getting total revenue
 , hence making abnormal profits CPAB.
Loss making firm under perfect competition
It comes under the following conditions:• The average revenue (AR) must be less than average cost (AC).• The average revenue curve determines the price while the average cost curve determines the cost of the firm.• Average cost curve must be above the average revenue curve.• Marginal cost curve cuts the average cost curve at the lowest point.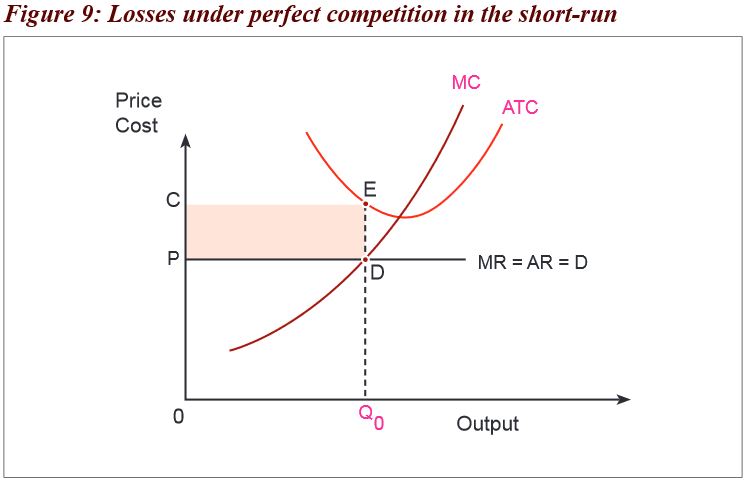 As shown in Figure 9 above, the firm produces output 0Q at total cost
 and sells it at price 0P, getting total revenue
  ,hence making losses PCED because the AC is greater than the AR.
Price and output determining under perfect competition in the long-run
Activity 7
With reference to the case study in activity 6, due to the abnormal profits earned by Umutesi after two months, Umubyeyi and Sibomana joined the businesses of selling tomatoes in the same market starting with 5000 FRW each. After three months of the activity, they realised that what they used for starting the business is what they all earned.From the case study above:1. Identify the costs and revenues of each seller.2. Calculate the difference in earnings of Umutesi, Umubyeyi and Sibomana.3. Describe the nature of their earnings.4. Illustrate the above information on graphs.Facts
In the long-run, because of the abnormal profits in the short-run, other firms join the business hence the abnormal profits will be shared among all firms. Therefore, each firm will get zero or normal profits as seen below. It comes under the following conditions:• The average revenue (AR) must be equal to the average cost (AC).• The average revenue curve determines the price while the average cost curve determines the cost of the firm.• Average cost curve must be tangent to the average revenue line.• Marginal cost curve cuts the average cost curve at the lowest point.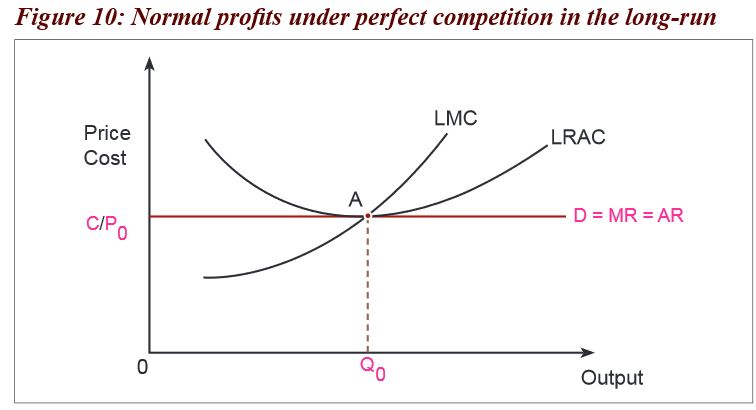 As shown in Figure 10 above, the firm produces output 0Q0 at Total cost
 and sells it at price 0P0 getting total revenue
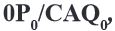 , hence making zero profits (normal profits).
Break even and shut down points of a firm
Activity 8
With reference to the case study in Activity 7, Umutesi, Umubyeyi and Sibomana all earned normal profits.Munezero joined the businesses too and they all shared the same customers, leading to a reduction of the profits furtherup to the point when they could not cover all the costs of production.From the case study above:1. Explain why you think Munezero joined the business.2. Illustrate the points where:(a) All the sellers are earning normal profits.(b) All the sellers cannot cover all the costs of production.Facts
Break-even point is a point where the firm is earning normal profits and where the average revenue is equal toaverage cost. The firm can only cover the costs of production without earning any profit.Shut-down point is a point below which a firm cannot continue to operate because it covers only average variable cost.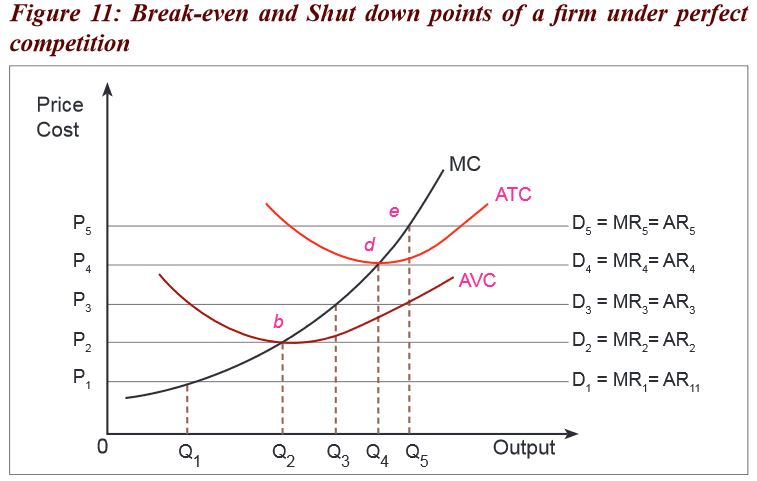 As shown in Figure 11 above, in the long-run, many firms join the business because of the abnormal profits in the short-runat point e and in the end, all firms get normal or zero profit at point d and they are only able to cover costs of production asshown by the ATC curve. Point d is the break-even point where the firm earns normal profits.Other firms will still join the business up to when the firm is not able to cover all the costs of production but only coversvariable costs as shown by the AVC curve.Point b is the shut-down point where the firm only covers variable costs. Below this point (point b),the firm cannot continueoperation.
Why firms continue to operate even when making losses (not covering all the costs)
Activity 9
With reference to the case study in Activity 8; explain why Umutesi, Umubyeyi, Sibomana and Munezero may all continueto operate even when they cannot cover all the costs of production.Facts
Sometimes, a firm may continue to operate even though it cannot cover all its costs of production. As long as it is in positionto cover its variable cost of production, it may continue operating. This may be explained by the following reasons:• Some firms fear to lose their skilled manpower which it would have trained at a high cost, which labour may be necessaryin the near future thus they continue to operate.• Some firms do not want to lose their established markets/customers as a solution to the problems sought.• Firms continue to operate because they fear to lose their suppliers of raw materials for their industry.• Firms may expect to get loans in future to cover the costs.• Some firms fear to be taken over by the state through nationalisation.• The firm may be a beginner firm, thus is still in its infancy and it expects to make profits in the long-run.• Some firms keep operating when they hope to change or restructure management, if it believes current losses are due topoor management.• A loss-making firm may be a branch of a bigger firm which is making profits and the losses can be shared by the otherbranches so as to cover the costs.• Some firms are not meant to be making profits but to give services such as welfare improvement in case of governmentorganisations.• Some firms may be set up for research/experimental purposes so they operate even if they are making losses.• Difficulties might be short-run and, therefore, hope to make improvements in the long-run.• Some firms keep operating when they fear to lose their reputation or good name in society.Supply curve of a firm under perfect competition
The supply curve under perfect competition is derived from the MC curve. Every time a firm determines its output, it will be where MC=MR. From that point, a perpendicular line is dropped to get the level of output. Therefore, each level of output will have a correspondence on the MC curve as illustrated in the figure below. As shown in Figure 12 above, the firm can only produce a high output if the price is high. If the price is less than minimumAVC, the firm does not produce. However, it does not mean that the firm leaves the industry. It only means a temporaryhalt in production.If the price is equal to or greater than
 , the firm may continue to produce from output
  because of an increasein price, hence determining the supply curve.
Advantages of perfect competition
Activity 10
Present the arguments for and against perfect competitive markets.Facts
• Perfect competition encourages optimum use of resources because factors of production can freely move from oneplace to another.• There is production of better quality goods because of competition within the industry.• There is no wastage of resources because no advertisement costs are incurred.• There is no consumer exploitation because prices are determined by the forces of demand and supply.• There is a lot of output because of many suppliers and buyers.• Producers are able to expand their firms and use modern technology because of the abnormal profits in the short-run.• Perfect competition eliminates income inequality because in the long-run all firms earn normal profits.• The plant is used to full capacity in the long-run. This is mainly because firms operate at the least average cost and sothere is no resource wastage.Disadvantages or shortcomings
• Unemployment is likely to occur because of the inefficient firms leaving the production.• Buyers have little or no choice because the goods produced are the same.• There are no abnormal profits in the long-run, so, expansion of the firm is hard.• Research is difficult because of little of no profits in the long-run.• Firms aim at profit, maximisation and this discourages the production of public utilities such as water supply which arevital for society but are non-profit making.• Profits are reduced because the seller is supposed to sell at the same price as others.• Perfect competition cannot exist in reality and so cannot be relied upon for development.1.2.2 Imperfect markets
Activity 11
Basing on figure 13 below:1. Identify the activities dealt in.2. Suggest other institutions in Rwanda that deal in the same activities.3. What type of market structure is this?4. What are the characteristics of such markets?
Facts
Under imperfect markets, there are many market situations such as monopoly, monopolistic competition and oligopoly,among others.1.3 Monopoly
Monopoly is a market situation where there is one producer or supplier of a product, which has no close substitutes andentry into the market is highly blocked.Extreme forms of monopoly may include:1. Pure monopoly: This is a market situation where there is production of a commodity that has no substitutes at all.In practice, there is no pure monopoly because people can always forge substitutes for that commodity.2. Monopsony: This is market situation where there is only one buyer of a commodity or a factor of production,e.g. one employer.3. Bilateral monopoly: This is a market situation consisting of a single seller and a single buyer of a commodity.Features/characteristics of monopoly
The noticeable example is:(a) Water and Sanitation Company Limited (WASAC)(b) Energy and Utility Company Limited (EUCL)(c) National Bank of Rwanda (NBR)The bases/sources/origin of monopoly (Factors which give rise to monopoly)
Activity 12
Manzi Publishers Rwanda, is the sole supplier of economics books in Rwanda. Describe the factors that may have favouredit to carry out that activity alone and make presentations.Facts
• Patent rights e.g. writers of books, where the law forbids other firms to deal in the same commodity.• Ownership and control of strategic raw materials usually under government control e.g. minerals.This leads to natural monopoly.• Exclusive methods of production. This gives the producers monopoly of the skills that are needed for production.E.g. doctors.• Long distance among producers where each producer monopolises the market in his/her locality. This leads to spatialmonopoly• Advantages of large-scale production which do not allow small firms to compete successfully with large firms.• Protectionism: This is where trade barriers are imposed on the product to exclude foreign competitors. In such cases,the home producer may become a monopolist.• Take over and mergers: ‘Take-over’ is when one firm takes over the assets and Organisation of another whereas mergersare formed when firms combine their assets and organisations into one to achieve strong market position. Both situationsmay result into a monopolist firm.• Collective monopoly or collusive monopoly: This is where firms come together in a formal or informal agreement (cartel)to achieve monopoly power. Such firms can fix quotas (maximum output each may put on the market). They may also setthe price very low with the objective of preventing new entry of other firms. This is called limit pricingEquilibrium position of a firm under monopoly
Activity 13
Using the photographs in figure 14 on page 24:(i) Describe situations in the two photographs.(ii) Define the term equilibrium.(iii) When do you think the firm is in equilibrium?
Facts
The monopolist is in equilibrium at a point where MC = MR and the slope of MR must be less than the slope of MC at the equilibrium output. The price is fixed on the demand curve in such a way that P = AR > MR = MC.The AR curve is above the MR curve. The price is fixed at the point where the demand curve is elastic. It can be illustrated below: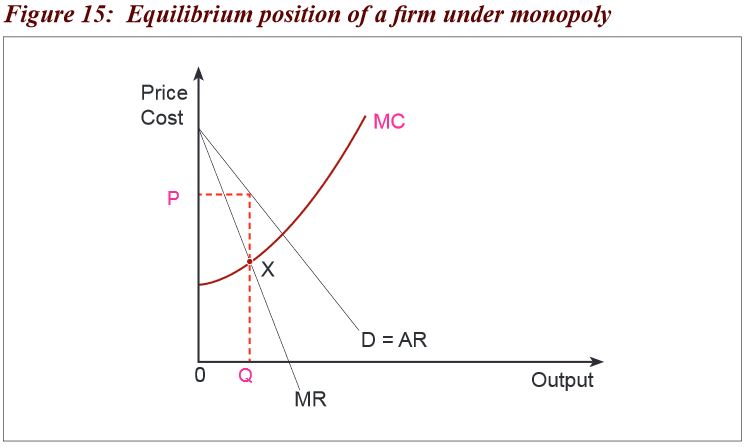 As shown in Figure 15, the firm is in equilibrium at point x where MC=MR.
Profit maximisation of a firm under monopoly in the short-run
Activity 14
Mr and Mrs Gatete started a sugar producing firm in Kibungo with 1,000,000 FRW. After two months, they realised revenuesof 2,000,000 FRW. As they continued to produce, they made 800,000 FRW which is less than what they put in at the start.From the case study above;1. Identify the costs and revenues of Mr and Mrs Gatete’s firm.2. Describe the nature of their earnings in both situations.3. Illustrate the above information on graphs.Facts
A firm under monopoly is in equilibrium where MC=MR and in the short-run, the firm can either make abnormal profitsor losses. Profits are made as seen below:Conditions
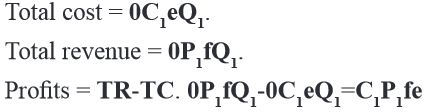
• The average revenue (AR) must be greater than average cost (AC).• The average revenue curve determines the price while the average cost curve determines the cost of the firm.• Average cost curve must be below the average revenue curve.• Marginal cost curve cuts the average cost curve at the lowest point.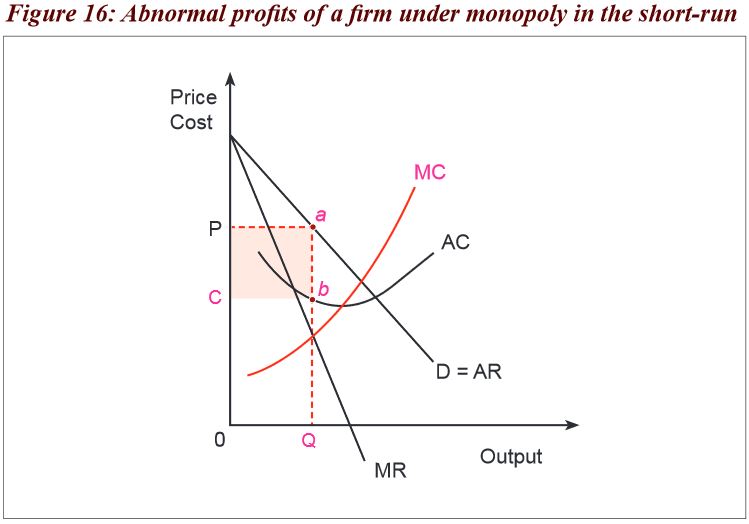 As shown in Figure 16 above, the firm produces output 0Q at total cost 0CbQand sells it at price 0P getting total revenue0PaQ,hence getting abnormal profits CPab.
Profits = TR-TC. 0PaQ -0CbQ= CPab
Losses under monopoly in the short-run
Conditions
• The average revenue (AR) must be less than the average cost (AC).• The average revenue curve determines the price while the average cost curve determines the cost of the firm.• Average cost curve must be above the average revenue curve.• Marginal cost curve cuts the average cost curve at the lowest point.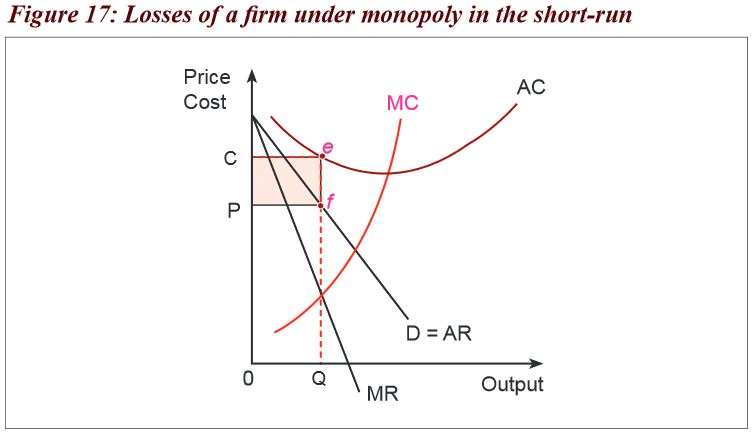 As shown in Figure 17, the firm produces output 0Q at total cost 0CeQ and sells it at lower price 0P, getting total revenue0PfQ and thus makes losses PCef because the costs are greater than the revenue.
Equilibrium position of a firm under monopoly in thelong-run
Activity 15
With reference to the case study in Activity 14, after one year, Mr and Mrs Gatete continued to earn more than whatthey put in at the start.From the case study above;1. Present the reasons why they continued to do so.2. Illustrate the above information on graphs.Facts
In the long-run, the firm under monopoly will still earn abnormal profits because it is the only firm in the production process.The firm will be in equilibrium where the long-run marginal cost curve is equal to long-run marginal revenue curve. This is shown as follows:Conditions
• The average revenue (AR) must be greater than average cost (AC).• The average revenue curve determines the price while the average cost curve determines the cost of the firm.• Average cost curve must be below the average revenue curve.• Marginal cost curve cuts the average cost curve at the lowest point.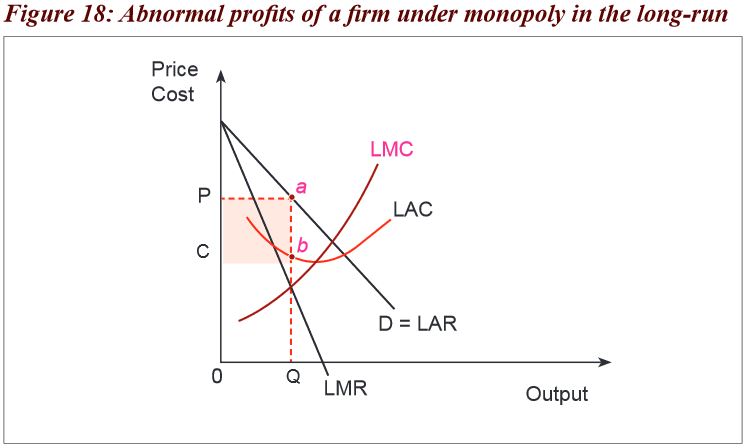 In Figure 18, the firm produces output 0Q at total cost 0CbQ and sells it at price 0P, getting total revenue 0PaQ hencegetting abnormal profits CPab.
Profits = TR-TC. 0PaQ-0CbQ= CPab
Advantages of monopoly
Activity 16
Present a skit about the advantages and disadvantages of monopoly firms.Facts
• There is no duplication of services and this saves resources e.g. if there is one hydroelectric power plant, there may notbe the need to set up another one in the same area.• Economies of scale can be enjoyed by the firm because it is capable of expanding using the abnormal profits earned.• There is a possibility of price discrimination. (Parallel pricing). This refers to the selling of the same commodity at differentprices to different customers which benefits the low-income earners.• Research can easily be carried out using the abnormal profits.• There is no wastage of resources in persuasive advertising which may increase prices.• Public utilities such as roads, telephones, etc. are easily controlled by the government as a monopolist.• Infant industries can grow up when they are monopolies and are protected from foreign competition.• It encourages innovations by protecting copyright and patent owners.Disadvantages of monopoly
• Because there is no competition, the firm can become inefficient and produce low quality products.• Monopoly firms produce at excess capacity, i.e. they under-utilise their plants so as to produce less output and sell ata high price.• Monopoly firms may charge higher price than firms in perfect competition.• In case a monopolist stops operating, there would be shortage of the commodity.• Monopoly firms tend to exert pressure on the government and sometimes they can influence decision making becausethey are the controllers of production.• Discrimination of consumers: This may be based on political or religious affiliation other than the factors respectedby economics.• Monopoly leads to income inequality. The monopolies who overcharge earn more compared to others.• Restriction of choices: A monopolist normally produces one type of commodity, thus consumers are denied a chanceto choose among the alternatives.Measures of controlling monopoly
Activity 17
Suggest the ways that the government of Rwanda can use to reduce monopoly powers.Facts
Because of the above disadvantages of monopolies, the following methods can be used to control their activities.• The government can fix prices of commodities through price legislation.• Anti-monopoly (anti-trust) legislation, i.e. laws imposed to control monopolies: Such laws can prohibit monopolisation,and collusion among firms to raise prices or inhibit competition.• There may be nationalisation of monopoly firms by the government so as to lower the prices.• Subsidisation of new firms: This can help the new times to competewith the already established firms favourably.• There may be resale price maintenance whereby the producers set prices at which sellers should sell the goods toavoid charging high prices.• Imports may be encouraged to compete with the commodities of monopoly firms in the country.• There may be demonstration by consumer groups especially boycotting the goods of monopolists so that the prices canbe lowered.• Government-owned firms may be set up to compete with the monopoly firms.•Removal of deliberate monopoly bases such as protectionism and taxation to encourage competition among the firms maybe an option.• Taxation: The government can impose taxes to reduce the profits of the monopolists. Such taxes may include:(a) Sur tax: This is an incentive tax that provokes monopolists to increase their scale of production.(b) Advalerem tax: This is a tax levied on the value of the commodity.(c) Specific tax: Tax charged per unit of out put.(d) Lamp-sum tax: Tax levied on the total amount produced and it does not change even if output changes.Price discrimination under monopoly (parallel pricing)
Activity 18
Basing on the photographs in Figure 19 below, examine;1. How customers are charged for the services rendered?2. The considerations followed while charging the customers in the photographs below?3. What conditions must be in place to charge customers in such a way?4. Merits and demerits of charging customers in such a way.
Facts
Price discrimination exists when a commodity is sold at different prices to different customers irrespective of the cost of production. It can also be referred to as parallel pricing.Forms of price discrimination
• Discrimination according to personal income: For example, income differentiation among buyers, e.g. doctors charginglow prices on the poor and high prices on the rich for the same services.• Discrimination according to age: For example, charging low prices on the young people than old people on tickets towatch football or for a film show.• Discrimination according to sex: Where different prices are charged to females and males for example, for discothequeswhere for ladies’ nights, ladies enter for free and males are made to pay.• Geographical discrimination for example, dumping where commodities are sold cheaply in other countries to disposeoff surplus.• Discrimination according to the time of service for example, tickets for video shows charged at high prices in afternoonswhen there are many people than in morning hours when there are few people.• Discrimination according to nature of the product, for example, a soft cover book may be cheaper than a hard cover book.• Discrimination according to the number of uses of the product, for example, a soft cover book may be cheaper thana hard cover book.• Discrimination according to the number of uses of the product, for example, electricity used for industrial purposesis cheaper than electricity for domestic use.• Discrimination by differentiation of commodities, for example, high prices on travellers in first class in the train andlow charges of other classes such as the economy class.Conditions for price discrimination to be successful• The commodity must be sold by a monopolist so that even when the price is increased, the buyer has nowhere else to go.• Elasticity of demand should be different in different markets. A higher price should be charged in the market where elasticityof demand is lower than where elasticity of demand is high.• The cost of dividing the markets should be very low, for example, in case of dumping costs of transport should be low.• Buyers should not know how much is charged on others. This is possible especially where goods are sold on orders withno advertising.• It should be impossible for buyers to transfer the commodity from where the price is low to where the price is high.This is possible especially with services of doctors, teachers, etc.Advantages of price discrimination
• It enables the poor to get essential services at low prices, for example, cheap houses to civil servants and doctorscharging low prices on poor patients.• To the sellers, it increases total revenue because output sold increases.• It is one way in which the rich subsidise the poor thus a method of income distribution. The rich are charged highlyon commodities while the poor are subsidised on the same commodities.• It increases sales and consumption, for example, for air time, the first units, may be charged higher price than otherextra units. Therefore, the more units of air time you use, the less charges you would pay for extra units.• It helps producers to dispose of surplus and poorly manufactured commodities, for example, dumping.• Increased efficiency: The increased profits from the higher charges make the firms efficient and such profits arere-invested.Disadvantages of price discrimination
• It may encourage consumption of some commodities in undesirable excessive amounts. For example,when childrenare charged less for entrance in cinema halls, they may spend more time watching films thanon studies or leisure.• It increases monopoly powers of firms by limiting entrance of other firms in the market. One firm serves all categoriesof customers irrespective of their incomes, ages or sex.• It can lead to low quantity of products/services, for example, in some airlines, travellers in the economy class(where fares are lower) are sometimes not well treated by airline staff like those in the first class (where fares are higher).• Discrimination in form of dumping discourages local industries.• Poor quality output normally arises. Such output is sold to the less privileged who yearn for the less prices.• Misallocation of resources: Price discrimination may bring about divergence of resources from their socially optimal usesto those who can reward highly.1.3.1 Monopolistic competition
Activity 19
Using the photographs in figure 20 below:1. Identify the nature of services offered.2. How many sellers do you think deal in such a business in Rwanda?3. Identify some in your area.4. What type of market structure is seen in the figure below and why?5. Identify other businesses in Rwanda that may fall under the same market structure.

Facts
Monopolistic competition market structure has characteristics similar to that of perfect competition except that the commodity dealt with in monopolistic competition is not homogeneous. It is a market structure in which a large number of firms sell differentiated products with close substitutes. Product differentiation may be in form of packing, design, quality, branding, advertising, blending, giving credit, etc. There is a need for persuasive advertising in monopolistic competition. Monopolistic competition lies between perfect competion and monopoly.Because of product differentiation, the seller has some control over the market price. Examples of monopolistic firms are soap industry, bread industry, hotel industry, washing powder, hair salons, shoe repairers, etc.Characteristics of firms under monopolistic competition
• There are many buyers and several sellers.• Firms deal in differentiated products although they remain close substitutes.• There is a lot of persuasive and informative advertising.• The demand curve is fairly elastic in nature because of the presence of many substitutes.• There is production at excess capacity, i.e. production less than the required output so as to charge at a high price.• The firms in the industry are large but none of them dominates the market.• The major aim is to maximise profits and this is done at a point where marginal revenue is equal to marginal cost (MR=MC).• Firms are price makers to some extent and price takers to a certain extent.• There exists brand loyalty, i.e. consumers exercise a lot of loyalty by sticking on a particular commodity believing thata particular brand is superior.Equilibrium position of a firm under monopolistic competition
The firm under monopolistic competition is in equilibrium when the MC=MR and in the short-run the firm will either make abnormal profits or losses. The supernormal profits will exist in the short-run because new firms cannot enter the industry. In the short-run, the firms may attempt to maximise their profits by changing the quality and the nature of the product and by increasing advertisement expenditure. But since there are many close substitutes, neither of the strategies would be of much avail in the short-run.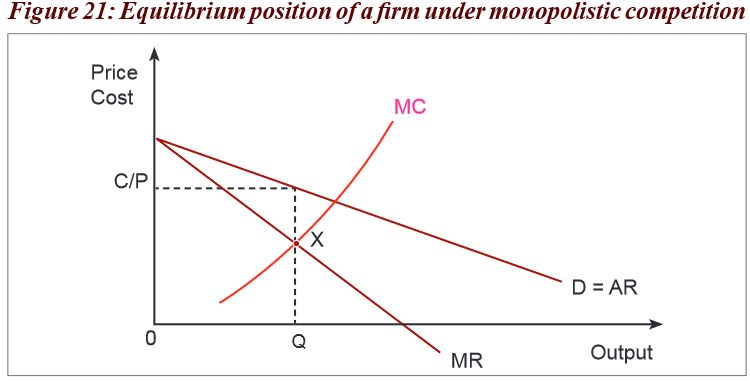 Point x in Figure 21 above shows the equilibrium point where MC=MR.
Price and output determining of a firm under monopolistic competition in the short-run
Activity 20
Colgate and Whitedent are two competing toothpaste firms. They all started the business using the same capital of 2,000,000 FRW each. After three months of operating, Colgate firm received revenues more than the amount it put in; while Whitedent firm, received less revenue than what it put in.From the case study above;1. Describe the nature of their earnings.2. Suggest reasons to support the above situation.3. Illustrate the above information on graphs.Facts
A firm under monopolistic competition is in equilibrium where MC=MR and in the short-run the firm can either makeabnormal profits or losses. Abnormal profits are made as seen below:Conditions
• The average revenue (AR) must be greater than the average cost (AC).• The average revenue curve determines the price while the average cost curve determines the cost of the firm.• Average cost curve must be below the average revenue curve.• Marginal cost curve cuts the average cost curve at the lowest point. From Figure 22 above, the firm produces output
 at cost
  and sells it at price
  ,getting total revenue
 .
.
Losses under monopolistic competition in the short-run
The firm can also make losses when it is in the production processes. This is shown below:Conditions• The average revenue (AR) must be less than average cost (AC).• The average revenue curve determines the price while the average cost curve determines the cost of the firm.• Average cost curve must be above the average revenue curve.• Marginal cost curve cuts the average cost curve at the lowest point.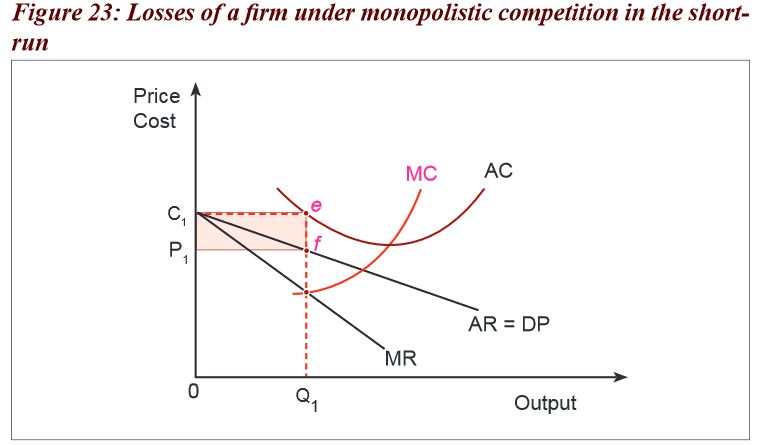 From Figure 23, the firm produces output
 at cost
  and sells it at a lower price
  .
.
Equilibrium of the firm under monopolistic competition in the long-run
Activity 21
With reference to the case study in Activity 20, due to the abnormal profits earned by Colgate, other firms such as Delident, Close up and ABC joined the business. After three months of the activity, they realised that what they used for starting the business is what they all earned.From the case study above;1. Describe the nature of their earnings.2. Explain reasons for such a nature of their earnings.3. Illustrate the above information on graphs.Facts
Due to the supernormal profits in the short-run, new firms join the industry with new brands. Output increases,Product differentiation increases. Consumer choice widens but the firms reduce the level of their output sincethe market has remained the same.The firms that were previously incurring losses leave the industry. Therefore,the demand curve would keep onshifting to the left until a point is reached where the demand curve is tangent to the ATC (LAC) curve.Equilibrium is attained at point where Long-run Marginal Cost Curve (LMC) = Long-Run Marginal Revenue (LMR).Conditions
• The average revenue (AR) must be equal to the average cost (AC).• The average revenue curve determines the price while the average cost curve determines the cost of the firm.• Average cost curve must be tangent to the average revenue line.• Marginal cost curve cuts the average cost curve at the lowest point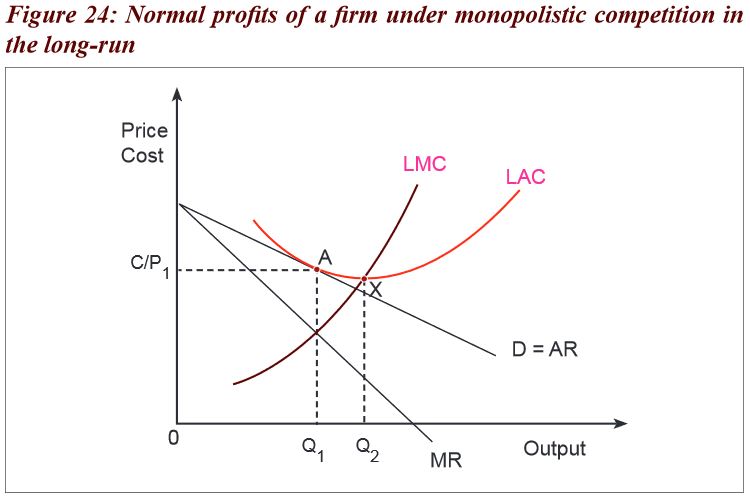 From Figure 24, output
 is produced at a high total cost
  and sold at the same price OP1/C. The total cost is 0C/
 and the total revenue
  .The firm produces a lower output
 as shown by point A. However, it should produce output
 as shownby point x where
 is excess capacity, i.e. the difference between actual output and expected output.
Product differentiation under monopolistic competition
Activity 22
Through research, in businesses near your school, find out about:1. The methods the sellers use to make their products different from others that serve the same purpose.2. Advantages and disadvantages of such businesses to the societyFacts
This is a situation where a producer is in position to make his or her product appear different from other products of other firms. It may take the following forms. Packaging, Design / shape, Branding, Colour, Scent, Labelling, Salesmanship, Size, etc.Advantages of monopolistic competition
• Product differentiation enables consumers to get a variety of products.• Firms compete to make improvement in the quality of products to choose from.• In case one firm collapses, substitutes are available for the consumers.• The price charged is lower than that of a monopolist because of competition from substitutes.• The freedom of entry gives a chance to any willing entrepreneur to enter the industry which createsemployment opportunities in the country.• Individual firms gain a lot of popularity due to specialisation in their own brands.• In the short-run, abnormal profits earned are used to improve on the quality of products; undertake research;and expand the size of the firmDisadvantages of monopolistic competition
• There is under-utilisation of resources in the short-run and in the long-run and this leads to excess capacity.• In the long-run, there is no profit to make improvements. So, the firm may not expand to enjoy economies of scale.• The price charged on buyers is higher than in perfect competition.• In the long-run, there are no profits to invest in research since the firm earns normal (zero) profits.• To maintain the market share, the seller has to persuasively advertise and this may increase costs and the price.• There are limited employment opportunities as firms operate at excess capacity.• The output produced is less than that in perfect competition.1.3.2 Oligopoly
Activity 23
Using the photographs in figure 25 on page 43;1. Identify the nature of services offered.2. How many sellers do you think deal in such a business in Rwanda?3. What type of market structure is seen in the photographs and why?4. Identify other businesses in Rwanda that may fall under the same market structure.5. Identify characteristics of such a market structure.
Facts
Oligopoly is a market structure which is characterised by a few sellers and many buyers of closely related commodities. Such commodities can either be homogeneous or differentiated.If the commodities dealt in are homogeneous then the market is known as perfect oligopoly.If the products dealt in are differentiated then the market is known as imperfect oligopoly.Examples of firms under oligopoly
Mobile telephone companies such as MTN, Tigo, Airtel; petroleum companies such as Kobil, SP, Mount Meru;soft drink companies such as Coca Cola and Pepsi Cola; beer companies such as Bralirwa and Skol;newspaper firms such as The New Times, Umuseso, Imvahonshya, etc.Features/characteristics of oligopoly
• There are few, unequal, competing firms. Each firm, although faced with competition from other firms,has enough market power and, therefore, cannot be a price taker.• There is non-price competition such as advertising, quality of services, etc. If one firm reduces the price,others would do the same and all firms would end up losing.• Each firm is concerned with the activities of other firms so as to act accordingly, for example it can reducethe price when others reduce the price.• In most cases, there is product differentiation.• Presence of monopoly power: There are very few oligopoly firms and this makes it easy for collusion as a formof price determination leading to monopoly.• Uncertainty: There is a lot of uncertainty in oligopoly industry, as one firm takes a decision say to increase the price,it cannot be certain of the reaction of other firms.• There is limited entry into the production process.• There is price rigidity. Prices tend to be stable for a long period of time.• Firms are faced with a kinked demand curve, i.e. a curve that has a bend (kink) and it is elastic above the kink andinelastic below the kink.• There are price wars, i.e. when one firm reduces the price, other firms reduce theirs even lower.Forms of oligopoly
1. Perfect oligopoly/pure oligopoly: This is a form of oligopoly where there are few firms which sell ahomogeneous product such as petroleum companies.2. Imperfect oligopoly: This is a form of oligopoly where there are few firms dealing in differentiated commoditiesfor example dealers in soft drinks, tea industry, tobacco industry etc.3. Duopoly: This is an extreme form of oligopoly where there are only two firms in the market.4. Duoposony: This is a form of oligopoly where there are two buyers in the market.5. Oligopsony: This is a form of oligopoly where there are a few buyers in the market.Price determination under oligopoly
Activity 24
When Kobil fuel station increased its price, other companies such as SP, and Mount Meru, among others,never followed. Hence, the customers of Kobil fell drastically and so did its revenue. Kobil decided to reducethe price even further lower than its rivals and also the rivals reacted by reducing their prices to the same level.They, therefore, found themselves selling at the same price. Each firm designed unique measures to win the marketother than price wars.From the case study above;1. Identify the methods of price determination in oligopoly.2. Illustrate the nature of the demand curve under oligopoly.3. Which measures do you think can be used by rival firms to win market.Facts
Under oligopoly, there is no single method of price determining but prices are determined by any of the following methods:1.Independent pricing:This is where each firm or seller sets its own price for profit maximisation.2.Perfect collusion: This refers to cartel agreement where independent firms within the same industry cometogether to determine the price and output with the purpose of reducing unnecessary competition.An example is OPEC.3.Imperfect collusion: Here there is price leadership where the dominant firm decides on the price for others to eitherfollow if it is favourable or exit the industry if it is unfavourable.The demand curve of an oligopoly firmThe demand curve is kinked because the demand for their products largely depends on the behaviours of other rival firms.This brings uncertainties in the industry because no single firm can predict the reaction of another firm in case they take their own decision. The kinked demand curve is elastic above the kink and inelastic below it. This is shown below.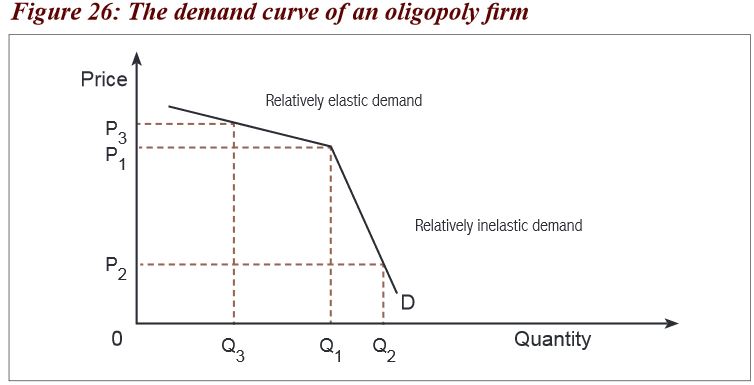 From Figure 26 above, P1 is the market price or administered price. Should any firm increase its price above that priceto price P3, it would lose its customers (Q1- Q3) to other firms. If a firm decides to set price below P1 to price P2,other firms will react by reducing their price even further or lower to win more customers, hence increase in quantitysold will be lower (Q1-Q2) than the reduction in price. Hence, the demand curve has a kink meaning that the priceswill remain rigid/stable for a long period of time.
Non price competition under oligopoly
This is a situation where firms compete on the basis of other things other than price in an attempt to widentheir markets in the same industry. It is a common feature in oligopoly.The forms of non-price competition used by oligopolistic firms in Rwanda
• Persuasive advertisement using various media such as radios, television, newspapers, etc. to make people awareof the commodity.• Branding and blending, i.e. use of appealing brand names such as Rwanda tea.• Offering credit facilities to customers to encourage them to keep buying.• Offering gifts and free samples to encourage them to buy more such as petrol stations giving soap to customers.• Opening many branches in different locations in the country.• Offering after sales services such as free delivery of purchases to customers’ premises; guaranteeing spare partsall which attract customers to the firm involved.• Sponsoring social events such as sports and music, for example Guma Guma with Primus thus winning the market.• Organising promotions through raffle draws which are intended to increase the number of customers who are attractedto buy the commodity in order to join the draw, for example MTN Sharama, join the millionaires club by Tigo.• Organising trade fairs and exhibitions to make their products known to customers.• Offering mobile shops: This is where the firm puts its products in a vehicle/ bicycle and moves from place to place sellingits products, for example bread firms.• Renovation of premises of customers by rival firms for example telecommunication networks (Tigo, MTN, Airtel),beer firms (Primus, Skol).• Use of stop-shopping centres such as supermarkets at fueling stations.• Use of differentiated attractive packaging and convenient designs of products by firms to outcompete each other,for example Blue Omo.• Quality improvement and introduction of new variables in order to increase their market share.• Use of appealing slogans which attract customers to their products, for example MTN-everywhere you go,Tigo-live it love it, Airtel-express yourself.Equilibrium position and profit maximisation of a firm under oligopoly
Activity 25
Choose the best alternative:1. The firm under oligopoly is in equilibrium when(a) MC = MR (c) MC = AC(b) AC = AR (d) AR = MR2. The firm under oligopoly earns: (a) Normal profits (c) Abnormal profits(b) Losses (d) None of the above3. Oligopoly firms operate at (a) Optimum capacity (c) Over capacity(b) Excess capacity (d) Equilibrium point4. The demand curve under oligopoly is:(a) Elastic (c) Inelastic(b) Perfectly elastic (d) kinkedFacts
Under oligopoly, the firm is in equilibrium where the MC=MR and oligopolists make abnormal profits both inthe short and long-run as shown in figure 27 on page 49: From Figure 27 above, the firm produces output 0q at total cost 0Cxq and sells it at price 0P getting total revenue 0PKq.
 The marginal revenue curve is not continuous between sections T and S because of uncertainties.The firm is, therefore, in equilibrium at point T where MC = MR and earns abnormal profits shown by the area CPKx.
Advantages of oligopoly
Activity 26
Present a case for and against oligopoly market structure.Facts
• There are low prices to the consumers due to existence of intensive competition and fear of other firms reaction.• It eases consumer budgeting due to price stability.• It widens consumer choice production of a variety especially with imperfect oligopoly due to branding and productdifferentiation.• There is production of good quality goods due to competition.• There is increased innovation due to competition.• There is increased output due to production on large scale.• Stable prices are charged due to the presence of price rigidity.• Consumer awareness of the commodity is high due to extensive advertising.• Most oligopoly firms operate on large scale, which enables a firm to enjoy economies of scale.• Provision of gifts to customers such as books, soap, pens, etc. improves on customer welfare.• A lot of abnormal profits earned are spent on research and development which leads to technological advancementand a high standard of living in the country.Demerits of oligopoly firms
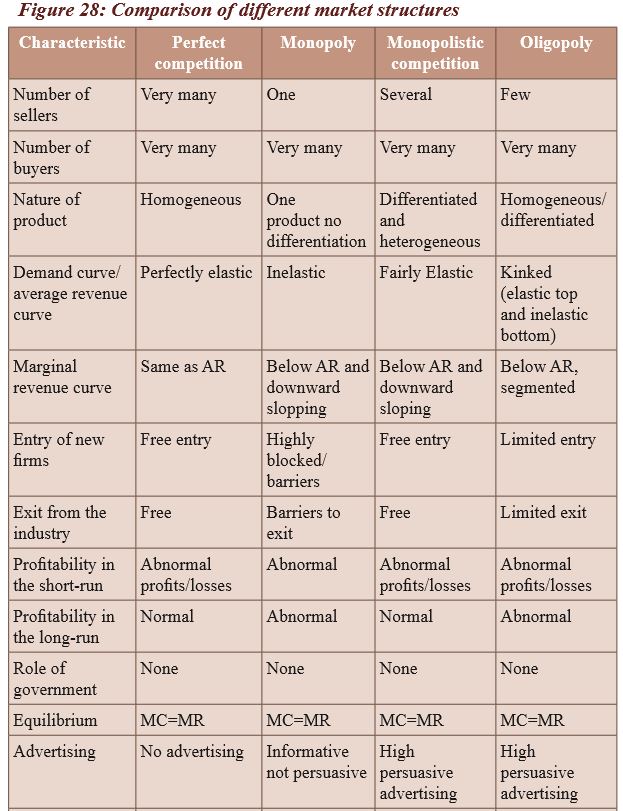
• There is consumer exploitation through overcharging due to collusion.• There is duplication, hence wastage of resources.• Small firms collapse when they are outcompeted.• There is under-exploitation of resources due to production at excess capacity.• Industries with large firms exert pressure on government.• Oligopoly distorts consumer choices due to excessive advertisements.• It worsens income inequality due to limited entry of other firms.• Some firms at times engage in price wars where each firm keeps on reducing on prices of its products tooutcompete rival firms, which results into losses.• Profits are limited due to price rigidity and this may affect further expansion.• Firms incur high costs on advertising, which increases on the price of the commodity.• The market structure is characterised by uncertainties about the reactions and activities of other firms, which limitthe ability of an individual firm to make independent decisions.1.3.3 Comparison of the different market structures
Activity 27
Match the following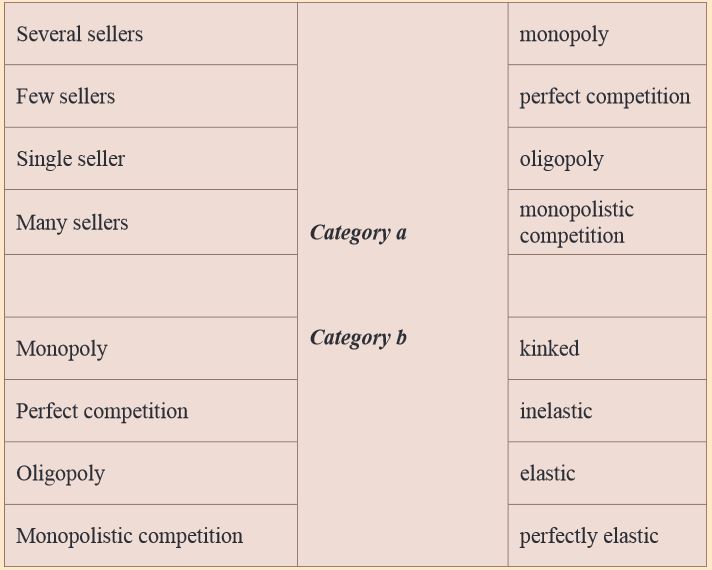
Facts

Unit assessment
1. (a) How are market structures categorised?(b) What distinguishes the different firms in market structure in Rwanda?2. (a) Describe the basis of monopoly in Rwanda. Give examples.(b) Why do you think it is necessary to interfere with monopoly firms in Rwanda?(c)Why do you think there is need of state monopolies in Rwanda? Give examples of state monopolies.3. Having tackled all market structures in which firms in Rwanda operate, which would you recommend formost effective utilisation of resources and solving macro-economic problems in Rwanda and why?4. (i) Define the term price discrimination.(ii) Explain the different forms of price discrimination.(iii) Analyse the conditions necessary for price discrimination to be successful.1.4 Glossary
- Advalerem tax: A tax levied on the value of the commodity.
- Bilateral monopoly: A market structure consisting of a single seller and a single buyer of a commodity.
- Break-even point: The short-run rate of output and sales at which a supplier generates just enough revenue to cover fixed and variable costs, earning neither a profit nor a loss.
- Break-even price: The level of price at which it “breaks even,” covering costs but earning no profit.
- Buyer’s monopoly: The condition which exists when there are numerous sellers but only one buyer
- Cartel: A contractual association of independent business organisations, located in one or more countries, formed for the purpose of regulating the prices, purchasing, production or marketing of goods by the members. It acts basically as a monopoly in price and output decision.
- Collusion: An agreement among sellers of a commodity or commodities to set a common price and/or share market.
- Dumping: The selling of a commodity abroad at a lower price than in the home market. This practice may be pursued by a producer when a large volume of production lessens the unit cost of the product, and when, because of the large production, the price of the product would be reduced if sold entirely in the domestic market. By restricting the supply offered in the home market, the producer may sell the balance of the supply abroad at a lesser price and still gain more profits than they would gain if the supply were sold at home.
- Duopoly: The condition that exists when only two producers offer identical or nearly identical products.
- Economic profit: The return on capital above that necessary to keep it in a particular use; also known as pure profit or supernormal profit.
- Equilibrium: A state of balance, when variables under consideration have no tendency to change.
- Equilibrium price: The price at which quantity supplied equals quantity demanded. It is determined by intersection of supply and demand curves.
- Equilibrium quantity: The quantity at which a market is in equilibrium. It is determined by intersection of supply and demand curves.
- Excess capacity: A situation where the firm produces less than the installed capacity, i.e. state of under-utilisation of the available resources.
- Imperfect collusion: Here, there is price leadership where the dominant firm decides on the price for others to follow.
- Imperfect oligopoly: An oligopolistic market situation where the commodities dealt in are heterogeneous (differentiated).
- Independent pricing: This is where each firm or seller sets its own price for profit maximisation.
- Infant industry: In foreign-trade theory, this is an industry that has not had sufficient time to develop the experience or expertise, or that has not grown enough to exploit the economies of scale needed to compete successfully with more mature industries producing the same commodity in other countries. Infant industries are often thought to need tariffs or quotas to protect them while they develop.
- Lamp-sum tax: Tax levied on the total amount produced and it does not change even if output changes.
- Limit pricing: A situation where oligopoly firms set very low prices so as to block entry of other firms into the production.
- Long-run: The period of time in which a firm can increase or decrease all of its inputs. All inputs are variable.
- Long-run average cost curve: The curve enveloping, target to, all possible short-run average total cost curves for a firm. It shows the lowest possible average cost when all inputs are variable.
- Long-run costs: Costs when all factors of production are variable.
- Long-run equilibrium: The equilibrium when all costs are variable. In pure competition, when P = AR =SMC = SAC = LMC = LAC.
- Marginal cost: The additional cost incurred by producing one additional unit of output.
- Marginal revenue:The change in total revenue due to a unit change in the quantity sold, the additional revenue a firm would obtain if it sold one unit of output. In perfect competition, this is the same thing as price. Under imperfect competition, MR is less than price because in order to sell the extra unit the price must be reduced on all prior units sold.
- Market: The area within which buyers and sellers are in communication with one another and within which exchanges take place.
- Merger:The combination of two or more firms into a single firm.
- Monopolistic competition: The market structures in which many firms produce similar products but with some degree of product differentiation, resulting in each firm’s having a partial monopoly. An example is a bread industry.
- Monopoly: One firm has 100% of the market. This rarely occurs in the actual structure.
- Monophony: The market structure with only one buyer of a good
- Monopsony: A market structure where there is only one buyer of a commodity or a factor of production.
- Mutual interdependence: The interdependence of firms in an oligopoly because each firm is affected by what its rivals do.
- Natural monopoly: A monopoly due to natural conditions.
- Non-price competition: The methods of competition, such as product differentiation advertising, that are not based on changes in prices.
- Oligopoly: A market structure in which the number of firms is small enough that changes in price and output of one firm will affect the price and output decision of the others.
- Over production: Production in excess of what is demanded.
- Patent: The legal monopoly over a product or process granted by government for a period of 17 years.
- Perfect collusion: This refers to cartel agreement where independent firms within the same industry come together to determine the price and output with the purpose of reducing unnecessary competition.
- Perfect competition: A market structure with all characteristics of pure competition, perfect knowledge, no transport costs and perfect mobility of factors of production.
- Perfect oligopoly: An oligopolistic market situation where the commodities dealt in are homogeneous.
- Predatory pricing:A situation where oligopoly firms set very low prices to get little profits so as to drive out already existing firms from production.
- Price discrimination: A situation where a commodity is sold at different prices to different people.
- Price leader:A firm in an oligopolistic industry that signals a new price by announcing a price increase or decrease. All other firms follow with similar price changes. The price leader firm is normally the largest producer or a low-cost firm.
- Price taker: A purely competitive firm. A firm unable to influence the market price.
- Product differentiation: The attempt to make a product seem different from its rivals. This is frequently accomplished through advertising, design changes and quality.
- Profit: The difference between total revenue and total cost.
- Pure competition: A market structure with a large number of buyers and sellers of a commodity. No buyer or seller can affect price.
- Revenue: The price of each unit of output times the quantity of output sold.
- Short-run:The period of time in which some of the firm’s inputs are fixed.
- Short-run average total cost curve: A curve showing average total costs over possible outputs for a given firm size — the plant is fixed.
- Short-run costs: Costs when some inputs are fixed.
- Short-run equilibrium: Equilibrium when some costs are fixed; in pure competition, when P = MC = MR.
- Shut-down price: The point where market price is so low that the firm’s losses per period just equal its fixed costs. Thus,it might just as well shut-down. The shut-down point comes at the point where the market price is just sufficient to cover average variable cost, and no more.
- Specific tax: A tax charged per unit of output.
Unit summary
• Meaning and categories of market structure• Perfect markets• Perfect competition• Imperfect markets• Monopoly• Monopolistic competition• Oligopoly• Comparison of different market structuresURLs: 3Files: 3Unit 2: MEASURING NATIONAL INCOME
Key unit competence:
Learners will be able to analyse the importance of measuring national income in an economy.
My goals
By the end of this unit, I will be able to:
Explain the different key terms used in national income.
Explain the approaches of measuring national income.
Identify the determining factors of national income levels in an economy.
Explain the importance of measuring national income and the difficulties met in an economy.
Explain the national income equilibrium level.
Identify characteristics of different phases of the business cycle.
Identify the causes and effects of income inequality.
Examine the approaches for measuring national income.
Discuss the determining factors of national income in Rwanda.
Assess the importance of measuring national income and the difficulties met in Rwanda
Illustrate the circular flow of income and the equilibrium level of national income.
Illustrate and explain the business cycle.
Use per capita income figures of different periods and countries to compares tandards of living in a country and between countries.
Examine the causes and impact of income inequality on standards of living in Rwanda.
Show income distribution amongst the population using the Lorenz curve and Gini coefficient.
Appreciate the importance of measuring national income and participate willingly in promoting the level of national income.
Show concern for low income earners and act to improve their standard of living.
Be aware of the fluctuations in national income and adapt to those changes.
2.1 National income
Activity 1
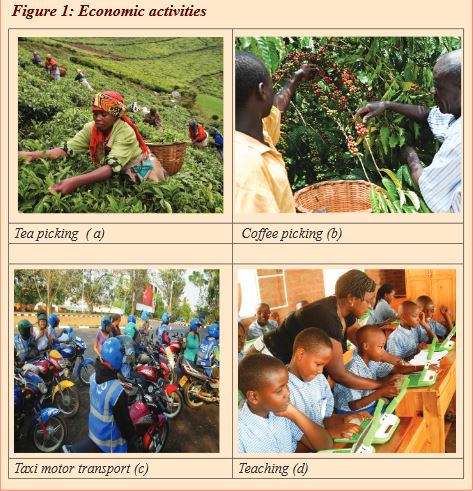
Using the photographs in figure 1.
1. Describe the activities in photographs a, b, c and d in figure 1 below.
2. What is the purpose of the activities below to the economy?
3. Relate the activities to national income.
4. Who should participate in such activities?
Facts
National income is the monetary value of goods and services arising from productive activities of a country in a given period of time, usually a year. For an individual, the income during any given period of time largely consists of earnings received from participation in the productive activity carried out in the economy.
National income of a country is the aggregate of all incomes of those individuals who are residents of the country. Incomes that are received in form of gifts or transfer receipts from other individuals, business firms and governments, do not form part of national income because they are not from corresponding productive activities.
2.1.1 Concepts used in national income
Gross Domestic Product (GDP)
This is the monetary value of goods and services produced in the country by both nationals (residents) and foreigners. Foreigners include foreign investors and expatriates.
GDP=GNP-Net income from abroad (x-m)
Gross National Product (GNP)
This is the monetary value of goods and services produced by the nationals within the country and those nationals that live outside the country (abroad). It excludes the incomes earned by foreigners living in the country.
GNP = GDP + Net Factor Income from Abroad (x-m)
Net National Product (NNP)
This is the monetary value of goods and services produced by nationals of a country in a given period of time less depreciation costs.
NNP= GNP-Depreciation.
Net Domestic Product (NDP)
This is the monetary value of goods and services produced in the boundaries of a country by both nationals and non nationals less depreciation.
NDP = GDP-Depreciation.
Income per- capita
This is income earned per person in a given period of time.
Per capita income = National Income
Total Population
Personal income
This is the total income received by an individual from both productive and unproductive activities.
Disposable income
This is a fraction of income that remains for spending after deducting the taxes.
Nominal income
This refers to incomes expressed in monetary units such as dollars, shillings, francs, etc.
Real income
This refers to the amount of goods and services that nominal income can buy.Net factor (Property) This is the difference between income earned by nationals abroad and income earned by foreigners in the country. Such earnings may be in form of salaries, rent from properties, dividends, profit, royolities, etc.
National income at market price (NNP mp)
This is the monetary value of goods and services valued at market prices. When the goods are in the market, we add indirect taxes but we subtract subsidies. NNPmp=NNPfc + indirect taxes – subsidies
National income at factor cost (NNPfc)
This is the monetary value of goods and services produced in a country at a given period of time valued at factor cost.
NNPfc = NNPmp + subsidies – indirect taxes
2.1.2 Approaches/methods of measuring national income
Activity 2
Using photographs in figure 2 below;
1. Describe the activities in the photographs a, b, c, and d below.
2. How do the activities above contribute to the measurement of national income?
3. Explain the approaches used in measuring national income as shown in the photographs below.
4. Identify the problems of using the different approaches in measuring national income.
5. Explain how the three approaches give the same results.

Facts
There are tree methods of measuring national income namely: • The income approach;• The expenditure approach; and• The product (output) approach.The income approach
Using the income approach, we add the incomes received by individuals, firms and government from the exchange of goods and services in form of wages, rent, profits and interests. All these incomes should be from productive activities, therefore, illegal activities such as black marketing, smuggling, prostitution and transfer payments should be excluded.
Transfer payments are incomes received without any corresponding level of activities done. They include gifts, pocket money, grants, sick benefits, famine relief, etc.
NY=W+R+P+I where, NY- National income = W-Wages, R-Rent, P-Profits, I- Interest
Therefore, national income arrived at using the income approach is called National income at factor cost because it considers payments for the factors of production.
The expenditure approach
The expenditure approach considers GDP from the expenditure side (National Expenditure). In this approach, we add up expenditure on final commodities.
Expenditure must be on final commodities to avoid double counting, for example, expenditure on bread and expenditure on wheat which was used to make bread would involve double counting of wheat and, therefore, we should consider only expenditure on bread (final good).
To get total expenditure, we add up expenditure by all sectors of the economy, i.e.
NY=C+I+G+(x-m) where C- expenditure on consumer goods and services, I- expenditure on capital goods / investment expenditure, G-government expenditure on goods and services, x-m net expenditure from abroad.
X stands for exports and M stands for imports.
Therefore, national income using the expenditure approach is National income at market price because it considers prices paid for final goods and services at the market.
The product approach/output approach
This is the most direct approach of estimating the value of output produced by the country. In this approach, we add up ‘value added’ on output by all sectors during the course of the year. All final goods and services produced must be included, whether they are sold to consumers, government, firms as capital goods or sold abroad as exports.
Intermediate goods or goods still in the process of production should not be included so as to avoid double counting. Value added includes only what was added on output during the process of production. Value added is the difference between the value of the final product and that of the intermediate inputs at each stage of production.
Example
Stage 1: Masera a farmer in Byumba grows cotton and sells it to a ginnery at10,000 FRW. This represents an income of 10,000 FRW to Masera. The value added is 10,000 FRW.
Stage 2: The ginnery sorts out the good cotton from the poor cotton and sells it to a spinner at 15,000 FRW meaning that the value added on the cotton is equal to 5,000 FRW.
Stage 3: The spinner uses the good quality cotton to make threads that it sells to Utexrwa, a cloth-making industry, at 25,000 FRW, meaning the value added to the cotton to make threads is 10,000 FRW.
Stage 4: Utexrwa turns the threads into a dress and sells it to Umutoni at 40,000 FRW meaning the value added onto the threads is now 15,000 FRW.
The total value added on to the cotton up to the time of its sale is: 10,000+ 5,000+ 10,000+ 15,000= 40,000which is equal to the value of the final dress. This can further be illustrated in the table below;
National income = 10,000+ 5,000+ 10,000+ 15,000= 40,000 FRW.
Therefore, using the output approach, NY= C+I+G+ (x-m) by value added.
Reasons why LDCs use the output approach to measure national income
LDCs have inadequate information on the incomes of the people especially the self-employed in informal sector and this makes the income approach less useful.
Developing countries do not have information regarding private consumer expenditure and this makes the expenditure approach less useful.
Using the income approach and the expenditure approach will involve double counting. So to avoid this, they use the output approach.
The expenditure approach cannot be depended upon because expenditure on intermediate goods may be valued yet expenditure should be on final goods and services.
Under the output approach, output of individual sectors can be determined easily to determine the exact output (value added).
Government expenditure abroad is hard to estimate and this makes the expenditure approach less useful.
Identical results of the approaches to national income
The three approaches of measuring national income are expected to give the same (identical) result unless there are some errors in calculations. This is shown below.

From Figure 4 above:
- The expenditure on goods and services in the market is paid out to the factors of production as rewards for their contribution to the production of goods and services in form of wages, interests, rent, profits, and, therefore, the income approach is equivalent to the expenditure approach, i.e. Y≡E.
- The money value of goods and services produced by the firms is reflected in the prices paid for them in the market and, therefore, the output approach is equivalent to the expenditure approach, i.e. O≡E.
- The value of goods and services produced by firms is also reflected in the incomes received by the different factors of production, therefore, the output approach is equivalent to the income approach, i.e. O≡Y.
Since Y≡ E, O≡ E, O≡ Y, therefore, O≡ Y≡ E2.2 The circular flow of income
This is a system that illustrates the flow of resources and commodities and the flow of expenditure and incomes between households and firms. The flow of resources and commodities is known as real flow while the flow of receipts and incomes is called money flow. Therefore, the circular flow of income involves both real and money flows.
2.2.1 Circular flow of income in a closed economy
In a closed economy, (where there is no foreign trade); assuming there is no government intervention, the circular flow of income would appear as follows:
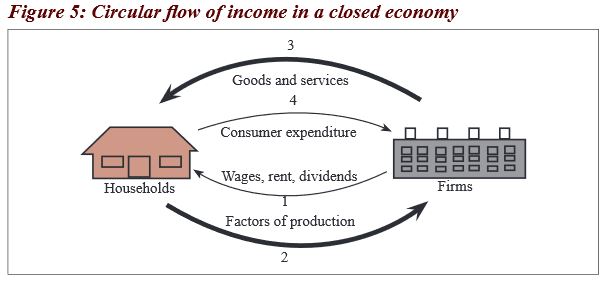
From Figure 5 above, we note the following:
- Firms buy factors of production from households (2) and pay for these factors of production (1). Firms use the factors of production to produce goods and services which they sell to households (3). In turn, households pay for these goods and services (4).
- Arrow (2) and arrow (3) show real flows,i.e. the flow of factors of production and commodities, respectively.
- Arrow (1) and arrow (4) show monetary/financial flows, i.e. flow of income and expenditure, respectively.
- The value of goods and services (output approach) is equal to households’ expenditure on them (expenditure approach), O=E.
Receipts received by firms from sale of goods and services(expenditure approach) are spent on buying factors of production (income approach), E=Y. The value of the goods and services is also reflected in the incomes received by the factors of production,O=Y. Therefore, the three approaches should give equivalent results if there are no errors, i.e. O ≡ Y ≡ E.2.2.2 Circular flow of income in an open economy
An open economy is that economy that has economic relationship with outside countries, i.e. there is international trade, so as to protect infant industries, check on profit repatriation by foreign investors and save the volume of foreign savings injected into the domestic economy. It tends to utilise other sources apart from the household to provide capital, which is injected into the circular flow of income.The sources could be foreign investment and the government. In an open economy, both domestic and foreign firms interact, thus it involves domestic house holds, domestic producers, government interference and the foreign sector as well. Thus, showing how the economic agents interact, i.e. C+ I+ G + (X-M).
From Figure 6 above, it is noted that:
- The household owns all factors of production and hires them to the domestic producers. In turn, they receive income in form of rent, salaries, interest and profits from the business sector (domestic producers) which is used to pay for goods and services from the producers. The remaining income after consumption is used to make savings through financial system which lend to the business firms.
- Firms buy factors of production from domestic households and use them to provide goods and services which are consumed locally and at times exported to the foreign sector. When they run short of funds for paying for factor services and investment, they have to borrow from the financial institutions in order to raise capital to produce.
- Taxes are paid to the government by firms’ profits.
- The state spends the tax revenue received to provide social services to the people.
- The foreign sector provides market, i.e. for domestic exports and providing imports to the domestic households.
- The financial sectors stand between savers (households) and borrowers (investors) by receiving savings from households on which it pays interest. It provides business loans for firms for investment on which it charges interest which is higher than that paid to depositors. The difference is the surplus for this sector.
2.3 Determinants of a country’s national income
Activity 3
Visit the library or internet and carry out a research on the;
1. Determinants of a country’s national income.
2. Importance of national income statistics.
3. Difficulties of measuring national income in LDCs.
4. Shortcomings of using national income figures.
Facts
Stock of natural resources: These include resources such as land, minerals, soils, etc. When such resources are available and exploited, national income will be high but if they are scarce and not exploited, national income will be low.
Availability of capital: When capital in form of machines and money is available, national income will be high compared to when capital is scarce.
Technological progress: Once technology is advanced, output will increase and national income will be his/her than when technology is outdated.
Human resource: If the country’s labour force is highly productive with good entrepreneur skills, national income will be high compared to when the quality of labour is low.
Political situation: Political stability will lead to increase in productivity and high national income while instability will cause low production and national income.
Level of market: A big market for goods and services will lead to high productivity and national income; while a small market will discourage production, hence low income.
Level of infrastructure development: Once infrastructure such as roads and communication, among others, are well developed, it will encourage investment, hence increasing national income. But when they are under developed, national income will be low.
Government policy of taxation and subsidisation: Once the government overtaxes the people, it will discourage investment and national income will be low but once the government subsidises the people, investment and national income will increase.
Organisation of factors of production: Once factor inputs such as land, labour and capital are well coordinated and organised, national income will be higher than when these factors are poorly coordinated.
Institutional factors such as culture, religion and people’s attitude towards work. If people’s attitudes towards work are high, national income will be high but low attitude will lead to low national income.
2.3.1 Importance of national income statistics
National income data/statistics are of great importance for the economy of a country. It tells us aggregates of a nations income, output and product result from the incomes of different individual products or industries and transactions of international trade. It is thus important to compile national income data because of the following reasons:
National policy analysis: For example, policies on employment can be based on the level of output, investment, etc.
Research: Both economy and social research can be carried out in respect of incomes, savings, investments, consumption patterns, etc. Data on these indicators can be got from the statistics of national income.
Per capita income (national income divided by total population) is a good indicator of improvement or decline in the standard of living.
National income statistics show the distribution of income among the various factors of production and sectors of the economy, namely: the household, business and the government sectors. This is important in planning for taxes and governments expenditure.
They are important in estimating the level of international transactions and the degree to which an economy depends on other economies. This can be estimated from the figures of imports and exports.
They show the patterns of expenditure:This is shown by figures of private and public expenditure. This is important in the making of the national budget where there is the need to estimate private and public expenditure.
They show regional performance and improvements: Incomes of different regions in the country can be compared so as to make plans on how to improve backward regions.
They are used for international comparisons which are necessary if improvement in economic performance is to be achieved.
They are used for comparisons of economic performance in one country over time so as to make improvements.
They show the rate of resource utilisation: The increase in national income may be the result of increased utilisation of national resources.
- They measure the size of various economic sectors, i.e. agriculture, industry and infrastructure or monetary and subsistence sector. This is helpful in tracing the source of economic growth and allocation of resources among these sectors.
2.3.2 Difficulties of measuring national income in LDCs
There are a number of statistical and conceptual problems which are encountered when measuring national income. Conceptual problems are those problems that arise from the interpretation of the subject matter of national income for example, defining the boundary of production.While statistical problems are those that arise from the exercise of collecting and processing national income data, such as inadequate information, lack of enough qualified personnel, etc.A combination of both statistical and conceptual problems includes the following:Defining the term nation: There is difficulty in defining the term nation in national income. Every country has its own political boundaries but in national income estimation, the term nationincludes the income earned by nationals of a country in a foreign country beyond the territorial boundaries of the country in question.
Double counting: There is a possibility of counting some commodities more than once. For example, wheat as an intermediate good may be counted and at the same time bread as the final good.
Non-monetary output: National income is measured in monetary terms, but there are some goods and services which are difficult to measure in monetary terms, for example, Subsistence output, services of housewives, etc.All these activities add to economic welfare and all use economic resources yet none of them is included in official measures of national income and product. This leads to underestimation of national income.
Inadequate information especially on private expenditure and other private incomes, information on fisheries, crops and animal husbandry, among others, on which very little data is available leads to national income figures underestimated.
Shortage of facilities such as computers to collect and process national income data may also bring about statistical errors when computing national income.
Price changes: When the price level in the country rises, national income also shows an increase although the production level may have fallen. Also, there might be a decrease in the price and national income also shows a reduction although production levels may have increased. Thus, due to price changes, national income cannot be adequately measured.
Timing of production: It is very difficult to determine output produced in the country during the year. For example, crops may stay in the field for more than one year and there is a likelihood that they may be counted year after year.
Inflation: Changes in prices affect the value of GNP and the effect of inflation is difficult to adjust accurately.
It is difficult to determine transfer payments such as unemployment benefits, gifts, etc. It is hard to tell whether such payments were received as a result of providing services or not yet they are part of the incomes of the giver.
Omissions from GDP: There are activities that may be omitted from national income such as prostitution and smuggling, among others. Although those bring welfare and incomes to the people, they are not included when calculating national income. Therefore, it leaves national income figures underestimated.
It is difficult to determine net exports and income earned from abroad since import and export trade is carried out by many people or groups of people also there are lots of goods that come in and go out undetected due to smuggling.
2.3.3 Shortcomings of using national income figures
National income data are highly useful in several ways, but it is necessary to use them with caution. They have the following shortcomings:Comparison between countries: The per capita income of a country whose principal diet is rice and fish as in Korea is not comparable with Rwanda’s, where the diet is so much varied. Money units do not measure these differences in the kinds of products consumed.
Changes in the country’s stock of capital: National income statistics do not consider the changes in the country’s stock of capital equipment. The calculation of depreciation on capital goods is not accurate.
Changes in quality: The qualitative aspect is totally ignored. The GNP figures do not take into account the quality of goods and services.
Marketed activities: National income data are confined to goods and services sold in the market. But, in the majority of underdeveloped countries, most production takes place in the homes of people. Measures of national income confined to production for home consumption underestimate per capita income in such countries, since the national income is underestimated.
Use of national income figures over a long period: For shorter periods of two or three years, comparisons of income totals are valid for most purposes. But over a longer span of time, they can be misleading. Over a longer period, a number of new products may appear in the economy and a number of old products may disappear. It, therefore, becomes difficult to compare two periods with unlike items.
2.3.4 Equilibrium level of national income
Meaning of Equilibrium
Equilibrium can be defined as a state of stability in economic conditions irrespective of the forces influencing different economic agents. That is, there is no tendency for consumers and firms to change their economic behaviour. This means that the variables in an economy are equal and have no tendency to change. As already pointed out, during equilibrium, national product and national income must be equal and also national income is equal to national expenditure since it is derived from this income.
Activity 4
Visit the library or internet and carry out a research on:
1. What is equilibrium?
2. Explain situations when national income is in equilibrium.
3. Illustrate the situations for national income equilibrium.
4. The additions to the circular flow of income are called..........., while the withdraws are called...................
5. The situation when aggregate demand is greater than aggregate supply at full employment is known as......... and when aggregate supply is greater that aggregate demand at full employment is known as.........
6. With illustrations, explain how the gaps in (5) above can be closed.
Approaches to national income equilibrium
a) National income equilibrium: leakages – injections approach
National income is in equilibrium when total leakages are equal to total injections.
Leakages refer to elements which withdraw money from the circular flow of income. They include savings -S, consumption-C, taxation -T, imports-M and capital outflow-Ko. These elements remove money from the circular flow of income, i.e. C+ S+ T+ M+ Ko.
Injections refer to elements that add to the circular flow of income. They include investment-I, consumption-C, government expenditure-G, exports-X and capital inflow-Ki. These elements add money to the economic activities in an economy, i.e. C+ I+ G+ X+ Ki. Thus, national income is in equilibrium when S+ T+ M+ Ko = I+ G+ X+ Ki. This can be seen in the following ways:
i) National income equilibrium in a closed economy
A closed economy is one where transactions take place within the country without any foreign trade. The major factors, which determine the level of income (Y), are consumption (C), saving (S) and investment (I).
The country’s income can be used for the consumption and saving. These are known as leakages or withdrawals. The identity is Y = C + S. If the level of income is to be maintained, saving must be put back into the economy in form of investment so as to create more income.
Consumption must also take place. These are known as injections. The identity is C +I =Y. Therefore, we have Y = C + S and Y = C +I; equating the two expressions yields C + S = C + I = Y. In a closed economy without government, equilibrium income is a situation where savings are equal to investments. This can be illustrated as below:
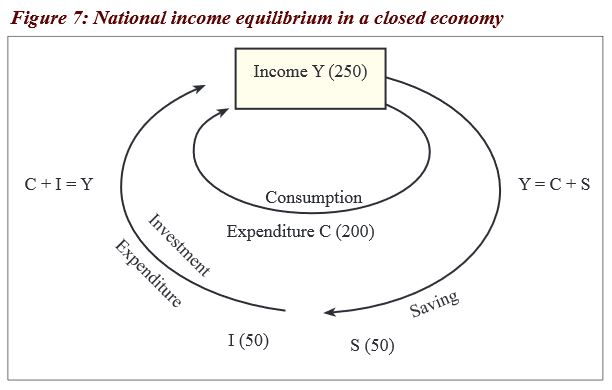
The left hand side of Figure 7 shows how income is being created through consumption and investment. The right hand side shows how income is being used through consumption and saving. Our objective is to determine precisely the equilibrium level of GDP and to see what factors it depends upon. Thus, C+I=C+S=Y which then means I (an injection) =S (a leakage) in a closed economy.
Equilibrium income determining: Saving-investment approaches

From Figure 8 above, it is seen that equilibrium income can also be determined through the saving- investment approach. Planned saving is equal to planned investment. The intersection of the saving and investment schedules determines equilibrium income and output at
 . The savings are positively related to the income while investment is autonomous.
 The economy will reach equilibrium at full employment only if the amount that consumers wish to save out of their income is precisely equal to the amount that investors want to invest. At any income below
, planned investment exceeds planned saving. Aggregate demand exceeds aggregate supply. This forces investors to increase the rate of production until . At any level of income beyond , savings exceed investment. Aggregate supply exceeds aggregate demand. Consequently, there are unsold inventories and investors will be forced to reduce the rate of production until S =I.
ii) National income equilibrium in an open economy
An Open economy is one where there is foreign trade. So far, we have dealt with a very simple economy consisting of only households and businesses. All the income created in the process of production was passed on to households as disposable income. Thus, GNP and disposable income were identical.
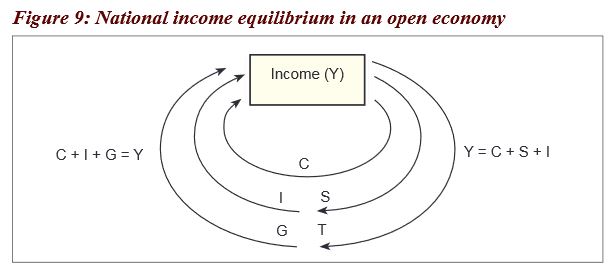
From Figure 9 above, in our simple economy, when the government sector is added, it levies taxes and makes expenditures on the purchase of goods and services. The government also makes transfer payments. Aggregate demand now consists of consumption (C) investment (I) and government demand for goods and services (G). Therefore, C + I + G = Y. Not all the income from the production of output is disposable income to the households. A portion is now absorbed by the government as net tax receipts.
Net tax receipts are total tax receipts less that portion which is returned to the private sector in the form of government transfer payments. While government tax receipts reduce disposable income, government transfer payments such as unemployment allowances increase disposable income.
The income is used for consumption, saving and tax. Y = C + S + T. Therefore, equilibrium income is where S + T = I + G, i.e. leakages = injections. When government expenditure is added on, the equilibrium income increases from
 to where I + G = S + T.
Equilibrium income determining: The leakages-injections approach

When the foreign sector is introduced, income is created through consumption, investment, government expenditure and exports. Thus, C + I + G + X = Y. The income is used for consumption, saving, tax and imports. This is indicated by the following equation Y = C + S + T + M.
Equilibrium income is, therefore, equal to S + T + M = I+ G + X. Leakages = injections. The equilibrium income is indicated in Figure 11 below;
Equilibrium income with the foreign sector

From Figure 11 on page 82, it is seen that when the foreign sector is added on, injections become C + I +G + X and leakages become C + S + T + M. Therefore, the equilibrium income increases to Ye where, I+ G + X = S + T + M.
Equilibrium income determining: Leakages-injections approach

From Figure 12 above, investment, government spending and exports are known as the injections into the flow of income. They increase the circular flow of income. Savings, taxes and imports are referred to as withdrawals or leakages from the flow. They reduce the country’s income — the circular flow of income.
The condition for the equilibrium income is that injections = leakages. When injections exceed leakage, the level of income increases whereas if leakages exceed injections, the income level reduces.
b) National income equilibrium: Inflationary gap and deflationary gap approach
According to the classical economists, equilibrium income is determined where aggregate demand is equal to aggregate supply. At such a point, savings are equal to investment, and all the resources are fully employed.
Keynes, on the other hand, disagrees with this analysis. According to him, full employment level of income (
 ) may not equal to the equilibrium income (
 ). It is possible to have ( ) being greater than (Ye ) and hence the deflationary gap. It is also possible to have ( ) being greater than () and hence the inflationary gap.
A deflationary gap is a situation where aggregate supply exceeds aggregate demand at full employment. All that is produced is not demanded. Realised investment is greater than the actual demand. A deflationary gap is caused by deficiency in demand.

From the figure 13 above, gap a-b is a deflationary gap
How to close a deflationary gap
It can be closed by increasing aggregate demand from aggregate demand (1) to aggregate demand (2) and this can be done through using the policies that increase demand for goods and services.
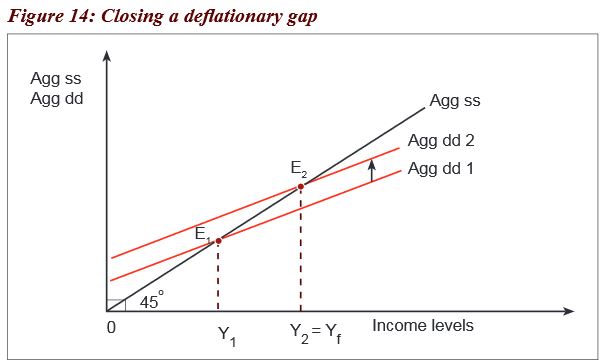
From Figure 14 above, Agg ss- aggregate supply, Agg dd- aggregate demand, E1- equilibrium 1, E2 equilibrium 2, Y1 – income 1, Y2= Yf – shows full employment levels of resources.
Policies that can be used to increase aggregate demand
Increasing the volume of exports so as to get rid of the surplus;
Discouraging imports so as to avoid increasing the volume of goods in the country;
Adopting an expansionary monetary policy – This will help to increase money in the hands of the people, hence increase their demand.
Increasing government expenditure – This will also increase money in the hands of the people, hence increasing their demand.
Increasing wages such that the people can have access to income and increase demand;
Reducing taxes – This will increase the disposable income in the hands of the people, hence increasing their demand.
Adopting price control especially maximum price which is low and will encourage demand.
An inflationary gap is a situation where aggregate demand exceeds aggregate supply at full employment level. Realised investment is less than actual demand. Supply is not enough.
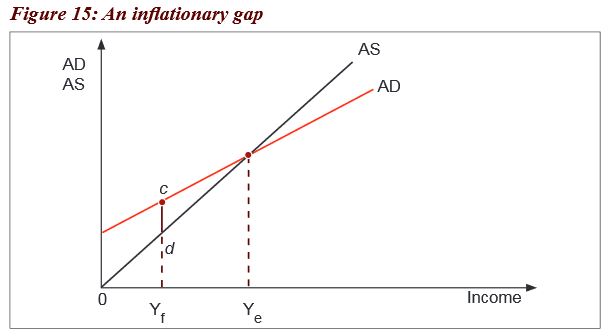
From Figure 15 above, gap c-d is an inflationary gap.
At point (
), national income is in equilibrium when aggregate demand is equal to aggregate supply. Before ( ), aggregate demand exceeds aggregate supply and this is called an inflationary gap. How to close an inflationary gap
An inflationary gap can be closed by reducing aggregate demand from aggregate demand (1) to aggregate demand (2) as shown below and this can be done through the policies which reduce the money in the hands of the people so that because of little income, demand is also reduced.

From Figure 16 on page 86, Agg ss- aggregate supply, Agg dd- aggregate demand,
 - equilibrium 1,
  equilibrium 2,
  =
=  shows full employment levels of resources,
  - income.
Policies that can be used to reduce aggregate demand
Adopting a restrictive monetary policy – This will reduce the amount of money supply and hence lower aggregate demand.
Increased imports – This can help to increase the volume of goods available when demand is greater than supply.
Reduced exports – This is to reduce the amount of goods going out of the country so as to make them enough for the people.
Increased taxes – This is to help reduce the disposable income of the people so that they do not have a lot to spend.
Reduced government spending – This is aimed at reducing and controlling the amount of money in circulation which leads to limited liquidity and low demand.
Adopt price control especially minimum price legislation which is a high price that can reduce the demand for goods and services.• Reducing wages by adopting a tight income and wage policy.
2.3.5 Fluctuations in national income /Business cycle
Activity 5
Abahuzamugambi association of coffee growers in Maraba in Huye District- Southern Province is well known for having excelled in coffee production. They mostly harvest their coffee during the rainy season between March and May. During coffee harvest, employment opportunities, output, saving levels, demand, prices, income levels are all high, hence high standards of living to the community.
However, this does not remain static. Coffee harvesting comes to an end due to changes in seasons which leads to a fall in the employment opportunities, output, saving levels, demand, prices, income levels, hence reduced standards of living.
As the next season comes in, output, saving levels, demand, prices, income levels output, saving levels, demand, prices, income levels and standards of living start to rise slowly up to the point where the season is at its highest peak. This trend is a cycle of fluctuations in coffee production/harvest.
From the case study above;
1. Identify the phases of coffee harvesting.
2. Explain the characteristics of each stage.
3. Illustrate the stages above on a graph.
4. Describe the effects of each stage on the community.
Facts
In any given economy, economic conditions and circumstances do not remain constant over a long period. There are always upward and downward swings in business activities or trade.
According to Professor Mitchell, it is a type of fluctuations found in aggregate economic activities of nations that organise their work mainly in business enterprises.
The course of trend of business activities passes through phases of prosperity and adversity which are referred to as trade/business cycles. They occur in every economy periodically and they follow a particular pattern. Each cycle takes a different period from the other and a time taken in each cycle is different in different economies.
A typical business cycle is generally divided into 4 phases although some scholars argue that they are five as seen below.
• Boom phase (upswing)
• Recession phase (upper turning point)
• Depression or slump or trough phase ( downswing)
• Recovery phase (lower turning point)
• Prosperity
There are basically four stages of business growth although some scholars argue that they are five as seen below.
Expansion (Boom)
This is a stage where business activities are at high levels and they tend to acquire profits. The business is normally in the upswing mode as shown by the high levels of economic activities. It is characterised by the following:
There is increase in the demand for both capital and consumer goods.
Companies invest in more production facilities with a view of making profits from the increase in sales.
Banks lend capital for expansion at low rates because they have confidence in the investors paying back.
There are high rates of employment brought about by high aggregate demand and investments.
Business is at its peak and makes supernormal profits.
Recession
This stage is the upper turning point and shows that the economy is in a decline as shown by the characteristics below:Level of sales and production orders start declining.
Production facilities become underutilised.
Companies reduce the work rate.
Workers hired on casual basis are laid off.
There is reduction in the level of output.
Banks raise the interest rates to counter the rise in risk of default on loans.
Most of the companies reduce the price of their goods so that they can increase demand.
Depression
This is the bottom of a cycle where economic activity remains at a low level. It has the following characteristics:Demand for products and services reduce, forcing some companies to shut down some production facilities.
There are rampant cases of unemployment brought by closing of industries.
There are high rates of poverty.
The purchasing power in an economy becomes very low.
The gross domestic product declines and so does the standard of living of the people.
The fall in price of capital goods is more than that of consumer goods.
Demand for loans declines because the investors become irritated by the economic situation.
Recovery
This is the stage where business begins regaining its strength. Business may sell output at very low prices to retain the operating costs; carry out some repairs; or gets some credit, among others. This helps it to begin moving from the trough. The stage is characterised by the following:Business become confident in the market and they begin buying goods so the business begins making profits.
The bank rates become low so the companies can afford to borrow and finance projects.
There is an increase in production because of increase in aggregate demand.
Companies begin employing people and so there is a reduction in unemployment levels.
Standards of living of the people improve since they can afford to buy goods and services.
Profit margins of business start rising and the gross domestic productalso begins to rise.
Prosperity
This is where business regains its strength and activities are at their peak. The following are its characteristics:There are high employment levels in an economy.
There are high incomes due to the employment levels.
High levels of production is common at this stage
There is high aggregate demand and cost which leads to a rise in investment and prices for goods and services.
The existing capacity of plants is underutilised.
This can be illustrated in the figure below.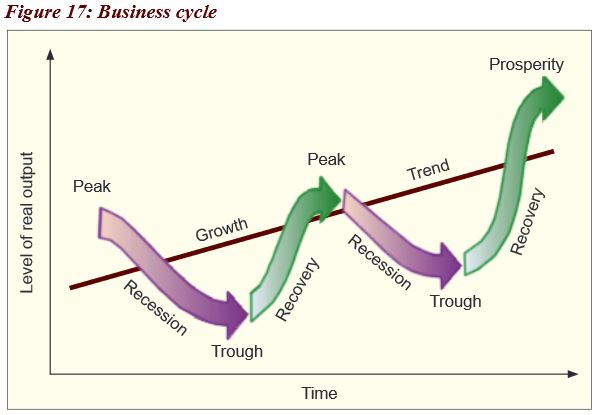 Figure 17 above shows business growth through ups and downs.
2.3.6 National income and standard of living
Activity 6
Mr Nkurunziza and Mrs Umutoni are two nationals of Rwanda who earn 30,000 and 100,000 FRW, respectively. However, after compiling statistics by the national statistics of Rwanda, it is shown that they all earn the same amount 50,000 FRW.
When you compare their average earnings and that of an American, it is very low and hence their standard of living and way of life is still low.
From the case study above, respond to the following questions.
1. What economic term is given to the average amount that they both earn?
2. Explain reasons to explain why you think the average income they earn is low.
3. Give reasons to explain why the average income they get is not a good measure of standard of living in:
(a) A country over a period of time.
(b) Between two countries.
Facts
National income of a given country reflects the way of life of its people during a specified period. The way of life people live or hope to live is what we call standard of living. The higher the level of national income, the higher the standard of living and vise-versa, holding other factors constant. The standard of living will depend on the average income of the people in the country at a particular time.
Per capita income
Per capita income is income received per person in a period.

Example 1
If the total national income is 200 billion francs and the population is 50 million people, then;

Example 2
Study the table below showing population and GNP of countries A and B and answer the questions that follow.

i. Calculate the per-capita income of countries A and B
Country A

Country B

Per capital income is used as an indicator of the standard of living in a country; and to compare the standard of living between countries because it is available for all countries and it is the most relevant among other available measures. Using national income figures to compare standard of living comes with many shortcomings as seen below:
Limitations of using per capita income figures as a measure of good standard of living in a country for period of time
Per capita income does not take into account the distribution of income. It may be high but when in the hands of a few people and many are poor, it may not reflect a good standard of living in the country.
Per capita income does not take into account the pattern of goods produced, either capital or consumer goods. It may be high but when capital goods are produced as compared to consumer goods that yield satisfaction to the consumers.
Per capita income does not consider the working conditions of the people. It may be high but when the working conditions of the people are poor, it may not reflect a good standard of living.
Per capita income does not take into account the amount of leisure. It may be high but when the people do not have leisure yet we know that leisure is one of the attributes of good welfare, meaning the standard of living will become low.
Per capita income does not consider the level of subsistence sector. It looks at the monetary terms of the output but the subsistence sector where food is grown for home consumption is not considered yet it is a basis for good welfare in the rural areas.
Per capita income does not consider the level of prices. It may be high because the prices of goods and services are very high implying that the people cannot afford them, hence leading to poor standards of living.
Per capita income does not put into consideration the political climate. It may be high but when there is political instability in the country, meaning that the people are always on the run. This may not show good standards of living.
Per capita income does not consider the quality of goods produced. It may be high but when the quality of goods produced is low. This means that the quality of life of the people will also be poor.
Inaccurate statistical data for example, population figures. It may be high but when the population figures given are inaccurate. This means that the per capita income figures will not reflect what is actually on the ground.
Per capita income can also be used to compare the standard of living between two different countries. The figures got from the different countries are compared and the country with a high per capita income figure is assumed to be having a high standard of living. However, this is not true in reality as seen further.Limitations of using the figures of per capita income to compare the standard of living between countries
It does not consider the types of goods produced. Per capital income may be high in the country, which produces many capital goods, which do not improve the welfare directly in the short-run.
It does not take into account leisure which contributes to welfare. Per capita income may be high in a country where people work hard and forego leisure, which may be on top of their scale of preferences.
Transport differences: Two countries may produce the same quantity and quality of product but may have different figures of per capita income because of the difference in transport costs.•
Per capita income figures do not reflect some factors, which influence the welfare of the people. For example, it may be high in a country where there are wars, accidents, diseases, pollution, etc.
In LDCs, it is likely that population figures are inaccurate because of inadequate facilities and, therefore, the figures for per capita income are unreliable.
Per capita income may be underestimated in a country where there are omissions in measuring GNP for example due to a large fraction of subsistence sector, high non-monetary output, etc.• There are people who live on illegal activities such as gambling and smuggling, which are not included in national income figures.
Countries use different concepts and definitions of national income. For example, some countries value subsistence output while others do not. Others use GNP at factor cost while others use GNP at market prices, etc.
Income distribution: A country may have high-income per capita figures when income is in the hands of few people while the majority of the population are suffering.
Price structures: figures of national income may be high because of inflation and this does not means that people are better off. Also a commodity may be cheap in one country and expensive in another but generate the same welfare.
Per capita income may be high in a country where there is unemployment which affects welfare of affected people/households.
Causes of low per capita income in Rwanda
Low levels of education: This makes the people get casual low-paying jobs leading to low levels of income and in the end the per capita income will be low.
Under developed infrastructure especially in the rural areas: This complicates movement of people and their goods from one place to another. This further limits the level of earnings of the people and some of the output may remain unsold.
High levels of unemployment: Lack of jobs means that the output in the country will be low leading to a low national income and per capita income figures.
Low levels of income: Some institutions give people low incomes despite their high contributions to the economy. Some may end up getting subsistence wage that will reflect a low income per person.
Dependence of agriculture which depends on climate: Agriculture in Rwanda depends on climate and in situations where there is a mismatch between the seasons, the farmers suffer with no output and income leading to low income per person.
Large subsistence sector: This yields little income since only the incidental surplus is sold. Most of the foods grown here are for home consumption implying that the there are no incomes expected during the production process.
Unbalanced development: Some areas are highly developed with many economic activities while others are lagging behind in terms of development. The least developed areas yield low productivity and the general national income will be affected, leading to a low per capita income.
Lack of capital to invest in businesses: There is still lack of enough capital to invest in production activities. This is evidenced by the low level of manufacturing industries. This leads to low productivity, low national income and finally low per capita income.
Low prices of agriculture products: This accompanied by high rates of price fluctuation and little earnings from the agricultural sector, leading to low national income and hence low income per person.
2.3.7 Income distribution
Activity 7
In figure 18, using photographs a, b, c and d:
1. Describe the two categories of people and regions.
2. What term is given to the differences in the appearances in the photographs below?
3. Explain the advantages and disadvantages of some people or areas being richer than others.
4. Suggest what can be done by the government of Rwanda to ensure that all the people and regions are equally the same in terms of resources.

Facts
Income distribution refers to the way income is spread among various social groups in an economy. It may be between different people in the same region or in another region or it may be how resources are distributed in different regions.
Inequality means an instance of being unequal which may imply difference in size, degree or circumstances, among others. In economics though, inequality is always talked of in terms of two major forms or types:
Types of inequality
1. Personal inequality: refers to the economic difference between the very poor and the rich people in society.
2. Regional inequality: refers to a situation where there is a difference in terms of resource endowments, developments through infrastructure such as roads and industries, among others. These make one region appear different and more developed than others.
3. National inequality: This is where some countries are richer than others in terms of resources and development.
4. Sector inequality: This where some sectors are richer and developed compared to other sectors e.g Industry being more developed than agricuture.
5. Occupational inequality: This where some occupations are more advanced in terms of technology used and payments etc. than other occupations.
Causes of income inequality
Income inequalities may be among different social groups or even among people in the same social group. Income inequality is caused by historical, geographical, social, economic and political factors.
Some of these factors are:
Differences in distribution of resources, for instance, people who have access to fertile land are likely to get more income than those who live on marginal land, for example pastoralists.
Differences in social and economic infrastructure such as roads to ease the transportation of goods and services from one area to another;
Government policies such as a regressive tax which taxes the poor more than the rich causes income differences.
Historical factors for example one can get much income because of inheriting property from rich parents. In rural areas, most people become rich because of inheriting land.
Differences in natural abilities, for example, when one is physically handicapped, he/she is likely to have less income than one who is physically well.
Differences in employment, i.e. some jobs bring in more money than others, hence income inequality.
Differences in education levels: Educated people have higher chances of being employed and earning higher salaries than the illiterate.
Uneven distribution of investment opportunities: Most of the investments are done in the urban centres and others are neglected, hence leading to regional inequalities.
Difference in sex: Females are generally poorer than males because of limited access to income-generating properties such as land and credit.
Lorenz curve
The Lorenz curve is a graphical representation of the distribution of income or wealth in an economy. It was developed by Otto Max Lorenz in 1905 to represent the inequality of wealth distribution. It looks at the line of perfect equality where there it is assumed to be income equality and as we move away from the line, the gap between the rich and the poor also increases.

From Figure 19 above, the further away the Lorenz curve from the line of perfect equality, the more the income inequality. And the nearer the Lorenz curve from the line of perfect equality, the less the income inequality.
Gini coefficient
This is also known as the Gini index or the Gini ratio and it is the measure of statistical dispersion intended to represent the income distribution of a nation’s residents. The Gini coefficient is a number between 0 and 1 where 0 corresponds to perfect equality (where everyone has the same income) and 1 corresponds to perfect inequality (where one person has all the income and everyone else has zero income).
Advantages of income inequalities
Income is in hands of few people who can invest it and produce commodities for other people and the society at large.
It encourages the poor to work hard so as to survive in the ever-changing economy.
It encourages savings among the rich which can be used for further investments, employment creation and production of goods and services.
The rich can invest in research and innovations and improve technologies and this can help to speed up production and economic growth.
The few rich employ the poor through investments in industries and factories, hence improving their standard of living.
More tax revenue is realised by taxing the rich and this can lead to increase in national income through progressive taxation.
The poor take up low category jobs such as cleaners, mortuary attendants etc. which would have nobody to take them up if all people were in the same average class
. The rich invest in assets, which increase the wealth of the country.
Foreign exchange is earned by rich export firms. This, through export promotion industries, can lead to increase in the foreign exchange earnings and reduce the balance of payment problems of a country.
Disadvantages of income inequality
There is minimum economic welfare of some group of people because of absolute poverty, i.e. inability to purchase basic needs.
Reduction in aggregate demand: The rich have a lower marginal propensity to consume than the poor. The poor people are left with little money to purchase commodities. The reduction in aggregate demand discourages investment.
Misallocation of resources: The very rich people spend on luxuries, leaving the poor to go without basic needs.
Capital outflow especially when the very rich are non-citizenswho always repatriate their earnings to their home countries – In countries which are politically unstable, rich people prefer to invest/bank their money in other countries where there is political stability.
It leads to a reduction in government revenue since the majority of the people would be having little or no incomes to tax.
It leads to social disharmony whereby the poor feel neglected and not catered for which results into political instability.
It leads to failure of government programmes when the majority have no adequate means to participate in development activities.
Regional imbalances come up because the regions with resources develop at the expense of others without resources.
Measures to control income inequality in Rwanda
Education reforms have been undertaken. This has helped many people to access education so that they can be prepared to get jobs
Land tenure reforms: This is through land redistribution policies and making it accessible to all people in society so that they can be able to carry out agriculture.
Kick-start funds such as the “one cow per family” have helped people to access cows that can be used as a source of income through selling the milk.
Progressive taxation: This has reduced the gap between the rich and the poor people since the revenues collected are used to subsidise the poor.
Improving infrastructure such as roads which helps in the movement of people and goods from areas of production to markets helps people to increase their earnings.
Liberalisation of the economy: This has helped people to participate in economic activities and trade, hence increasing their incomes and standards of living.
Controlling population growth: This has helped to reduce the ratio of resources to the population and also dependence burden among the families.
Modernising agriculture: This has helped reduce the level of poverty in rural areas where the activity is fully based. The people are able to increase the quality and quantity of their products, hence receiving more incomes.
Improvement of the investment climate: This has been through giving tax holidays and free land such as the free investment zone in Masoro. This has attracted more investors, hence creating employment opportunities.
Improvement of the political climate: This has created good environment for production whereby the people are not scared of carrying out any activity.
Encouraging development of small-scale enterprises: These have also created more employment for the people in Rwanda, hence improving their standard of living.
- Formation of co-operatives: This has been the basis for reducing income inequalities among the people. These cooperatives such as Saccos, for example, umurenge sacco, umwarimu sacco, producer co-operatives, among others, have encouraged micro savings and given small loans to the local people.
Unit assessment
1.(i) Examine why the government of Rwanda undertakes compilations of annual gross domestic product.
(ii) Analyse the measures that the government of Rwanda can undertake to improve the level of gross domestic product.
2. (i) Given that the per-capita income of an average Kenyan is three times greater than that of an average Rwandan, does it necessarily mean that an average Kenyan is better off than an average Rwandan?
(ii) If you are analysing per-capita income in Rwanda for this year, Why are the figures not a good measure for standard of living in the country?
3. Explain how the construction of good roads may help to increase national income of Rwanda.
2.4 Glossary
Black economy: A non-marketed economic activity which is not recorded in the national income accounts, either because such activity does not pass through the market place or because it is illegal.
Black market: A situation in which there is illegal selling of goods at prices above a legal maximum set by the government.
Business cycle or trade: Fluctuations in the level of economic activity alternating between periods of depression and boom conditions.
Circular flow of income expenditure: A process consisting of both the real flow of resources and commodities and the money flow of expenditures and income between businesses and households.
Closed economy: An economy in which there are no foreign trade transactions or any other form of economic contracts with the rest of the world.
Circular flow of income: The flow of resources, commodities (real flow) and flow of expenditure and incomes (money flow) between households and firms in an economy.
Disposable income: A fraction of income that remains for spending after removing the taxes and other compulsory payments. Disposable income equals personal income minus personal taxes.
Equilibrium GNP: A price at which quantity supplied equals quantity demanded.
Factor cost: A term used to indicate the market price of a commodity less all items in its cost other than those of the factors of production employed in its manufacture. For example, indirect taxes, specific factor of production, are excluded from the concept of factor cost.
Gross domestic product (GDP):The monetary value of goods and services produced in the country by both nationals and foreigners. GDP=GNP-Net income from abroad (x-m).
Gross national product (GNP): The monetary value of goods and services produced by only nationals with in the country and those nationals that live outside the country. GNP = GDP + Net Factor Income from Abroad (x-m).
Income inequality: A situation where there is a disproportionate distribution of total income among the households.
Income approach to GNP: The calculation of GNP by summing income received by all factors of production: the sum of wages, profits, rent, interest and capital consumption allowances.
Income per capita: The total GNP divided by the total population of a country. It is the major indicator of the levels of standard of living and development. Income per capita: is income earned per person in a given period of time.
Injection: An autonomous increase in total spending. It is an increase in government spending, investment, exports, or consumption not induced by an increase in income.
Leakage: An autonomous decrease in total spending. This includes an increase in saving, taxes and imports.
Net national product (NNP): The monetary value of goods and services produced by nationals of a country in a given period of time minus depreciation costs: NNP= GNP-Depreciation.
National income: The monetary value of goods and services arising from productive activities of a country in a given period usually a year.
Nominal income: Incomes expressed in monetary units such as dollars, shillings, francs, etc.
Net domestic product (NDP): The monetary value of goods and services produced in the boundaries of a country by both nationals and non-nationals minus depreciation. NDP= GDP-Depreciation.
Net factor (Property) income from abroad: The difference between income earned by nationals from abroad and income earned by foreigners in the country.
National income at market price (NNPmp): The monetary value of goods and services produced in a country valued at market prices: NNPmp=NNPfc + indirect taxes – subsidies.
National income at factor price (NNPfc): the monetary value of goods and services produced in a country valued at factor cost: NNPfc = NNPmp + subsidies – indirect taxes.
Open economy: An economy which engages in foreign trade and has financial and non-financial dealings with the outside world.
Personal income: The portion of national income, which is received by households. It is the sum of the wages and property income received by households plus transfer payments to households.
Potential GNP: The level of GNP that would occur at full employment.
Price index: An index number that shows how the average price of a bundle of goods has changed over a period of time.
Producer price index: The price index of wholesale goods such as steel, wheat and oil.ཀྵReal flow: The exchange of goods for services of factors of production.
Real income: The amount of goods and services that nominal income can buy.
Real GNP: The GNP adjusted for price change. Real GNP equals nominal GNP divided by the GNP deflator.
Recession: A period of economic downturn in which output and employment drop with declines appearing in consumption and in investment.
Standard of living: The minimum of the necessities of luxuries of life to which a person or a group may be accustomed or to which they aspire.
Transfer payment: Any payment, usually by the government, but not in exchange for goods or services. Student grants, welfare and social insurance payments are examples.
Underground economy (Unreported economic activity): The underground economy includes otherwise legal activities not reported to the taxing authorities such as garage sales or services ‘bartered’ among friends, and illegal activities such as the drug trade, gambling and prostitution.
Value added: An addition to the value of product at each stage of production.
Unit summary
• Key concepts in national income
• Methods / approaches in measuring national income
• Income approach
• Expenditure approach
• Output approach
• Circular flow of income
• Open economy
• Closed economy
• Determining factors of national income
• Importance of measuring national income
• Difficulties in measuring national income
• National income equilibrium
• Injections and leakages approach
• Inflationary and deflationary gaps approach
• Fluctuations in national income (Business cycle)
• National income and standard of living
• Income distribution
Unit 3: PRICE INDICES
Key unit competence: Learners will be able to analyse the effects of
price changes in an economy over time.
My goals
By the end of this unit, I will be able to:- Identify the types of indices and the steps of compiling price indices for various periods.
- Explain the uses of price index numbers.
- Explain the problems with compiling price indices in an economy.
- Compute and interpret price indices for various periods.
- Assess the importance of computing price indices and the problems involved.
- Appreciate the importance of compiling price indices and advocate for the improvement of the standard of living for people.
3.1 The price index
Activity 1
Back in 2012, in Rwanda, prices of most of the consumed commodities such as sugar, salt, rice, fish etc.were seen to be cheap. Prices of such same commodities have changed over time and are not the same today.Visit around the school community and research about the prices of such sighted commodities in 2012 and thecurrent prices. Thereafter find out the following:1. What do we call such a change in prices from one year to another?2. Relate the prices in 2012 and the current price.3. Calculate the price changes from 2012 to date.4. How would you interpret such price changes?Facts
Price index can be defined as the measure of the variation in the prices of a given class of goods and servicesover a period in a given region. It shows average changes in price over a period,i.e. from a base year to a current year.3.1.1 Types of price indices
The following are some of the price indices:1. Consumer price index (CPI): This measures the changes in the price level of a market basket of consumergoods and services bought by households. The National Institute of Statistics of Rwanda (NISR) collects theCPI price information and calculates the CPI statistics for Rwanda on a monthly basis.2. Producer price index (PPI): This measures the average changes in the prices received by domestic producersfor their output.3. Gross Domestic Product deflator (GDP deflator): It is sometimes referred to as implicit price deflator.It is a measure of the level of prices of all new, domestically produced final goods and services in an economyit can be measured by: 4. Retail price index (RPI): This is the measure of the variation of consumer prices or consumer retail goods andservices over a period. RPI is computed on a monthly basis but an annual rate is also published which serves asa yardstick for adjusting salaries and wages, tax allowances and pensions, among others.
3.1.2 The procedure for computing cost of living index
• Selecting the base year: This is the year when prices were relatively stable and it is equated to 100% so as toshow the change in the prices• Selecting the basket of commodities. This is a basket which represents commodities that were wholly consumedby the people in a country during a period of time.• Collecting information about the basket of commodities.• Calculating the simple price index/price relative. This is calculated by:
 Where P1 is current year price, P0 is base year price.• Attaching weights: Weights are attached to show the relative value of the goods. The commodity with the biggestweight has more value than the one with a small weight. This is done by:Weighted index = SPI x Weights.• Calculate Average Simple Index
 • Calculating the cost of living index/average weighted indexThis is done by:
 • Interpreting the findings to find out whether there was an increase or a decrease in the prices of the consumerbasket during a given period of time.
Computation
Example
1. Calculate the SPI for 20152. Calculate the average weighted index (COL index) for 2015.3. Interpret your findings. Calculating the cost of living index can be done in the following few steps:
Step one
Calculate the SPI for each commodity for each year:Sugar SPI = P1/ P0 x 100 Rice SPI = P1/ P0 x 100200/ 100 x100 = 200 150/100 x 100 = 150Salt SPI = P1/ P0 x 100 Fish SPI = P1/ P0 x 10030/20 x 100 = 150 30/50 x 100 = 60Step two
Attach weights for the different commodities by:Weighted index (WI) = SPI x weightsSugar RiceWI = 200x 3 = 600 WI = 150x 5 = 450Salt FishWI = 150x 1 = 150 WI = 60x 2 = 120Step three

Step Four
Calculating the cost of living index/ average weighted index through the following method:
Interpreting
There was an increase in the prices of goods and services from 100 to 120 by a 20% increase.The cost of living increased while the standard of living reduced other factors remaining constant.3.1.3 Uses of the price indices
Activity 2
Basing on the case study above, analyse the following:1. Why do you think price index statistics is useful in your country?2. What problems do you think are met in compiling price indices in Rwanda?Facts
• Measuring changes in the value of money: When the general price level increases, the value of money,commodities which a unit of money can buy reduces. When the general price level reduces, the valueof money increases.• It is the measure of the rate of inflation which is the difference between relative price changes of 2 years.When the price increases, it means there is inflation. When the price reduces, it means there is a deflation.• Wage determinating and change, i.e. wage changes should match with changes in the general price levelto avoid a decline in the standard of living of workers when there is inflation and this can be done basingon the price index figures.• The price index can be compiled for different regions and towns so as to determine allowances, wages,taxes, etc. which should match with inflation.• Comparison purposes: The price Index can be used to compare the standard of living between countries at apoint of time, and in one country over time.• The producers’ price index for inputs is used to measure the variations of input prices. This helps policy makerswhen designing policies to influence input prices.• The price index helps the government in pricing contracts and awarding tenders, for example, for construction,input price variation is important when determining total costs to fix and to revise contract values.• The central bank uses price indices to design policies which can stabilise prices.• The price index for different regions in the country helps manufactures to locate sources of cheaper inputs andareas with higher output prices where to sell commodities.• Price indices help the government to trace the cause of scarcity of inputs which are reflected in their prices,for example the drought can be the cause of increase of agricultural raw materials3.1.4 Problems of compiling index numbers
• There are different ways and formulae of compiling index numbers. The values calculated may differ by the methodused and this makes comparison difficult.• Choosing the base year: Because of inflation, it is difficult to get the year when prices were stable.• It is hard to include all commodities in the index. Representative commodities may not show the cost of living of samegroups of people although attempts are usually made to include in as many commodities as possible.• Because of changes in tastes and preferences, weights (relative importance that people attach to commodities) changeover time and, therefore, there is a need to compile new index numbers over time.• Weights always change because of new discoveries, innovations and changes in consumption patterns meaning thatthe importance or the value of the commodity may vary in the same year.• The change in the general price level may be due to change in the quality of products. This may be misinterpreted tobe inflation.• Differences in income, for example the rich and the poor consumer different commodities. Therefore, one index cannotreflect the change in cost of living of all income groups.• The introduction of new commodities and the changes in the tastes and preferences also lead to shift to othercommodities, hence a problem when comparing the prices in the different years.Unit assessment
1. (i) Discuss the reasons for periodical revision of cost of living index.(ii) What problems are encountered when constructing an index number?2. Given the information in the table below, answer the questions that follow.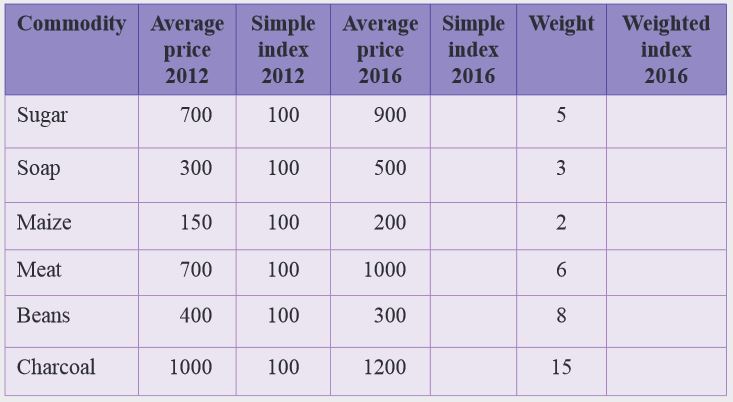 Calculate the;i. simple index for 2016ii. weighted index for 2016iii. simple cost of living index for 2016iv. weighted cost of living index 2016
3.2 Glossary
- Base year:A year or a chosen point in time for comparison purposes in order to express or compute index numbers.It is also calledbase period.
- Cost of living:How much (money) a consumer can utilise so as to enable him or her afford basic necessities at the prevailing price level for example during the inflation, the cost of living tends to be high and vice versa.
- GDP deflator:This measures the average level of prices of all goods and services included in the GDP.
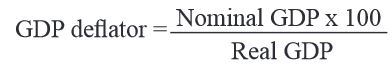
- Given period: Any particular period that is being compared with the base year. It is otherwise commonly called current year
- Gross domestic product (GDP):The value of output produced with in the economy, whether produced by nationals or non-nationals of that economy.
- Price index: The measure of the variation in the prices of goods and services over a period.
- Producer price index:The price index of wholesale goods such as steel, wheat and oil.
- Real national income (GDP):Nominal national product divided by price index x 100, i.e.

- Retail price index: The measure of the variation of consumer prices of basic needs of a group of people over a period.
Unit summary
• Meaning of price index• Types of price indices• Steps of computing price indices• Computation of price indices• Uses of price indices• Problems of computing price indicesUnit 4: CONSUMPTION, SAVING, INVESTMENT AND MULTIPLIERS
Key unit competence:
Learners will be able to evaluate the impact of consumption, saving, and investment on national income.
My goals
By the end of this unit, I will be able to:
Distinguish between consumption, savings and investment and identify the factors that determine them.
Distinguish between average propensity to consume (APC) and average propensity to save APS, and marginal propensity to consume MPC and marginal propensity to save MPS.
Explain the limitations and the ways of improving investment levels in Rwanda.
Explain various types of multipliers and their effect on the national income.
Distinguish between the multiplier and accelerator principles.
Discuss the factors determining consumption,savings and investment levels.
Calculate and illustrate the consumption function.
Calculate APC, APS, MPC and MPS and explain how they influence national income levels.
Analyse the effect of multipliers on the national income.
Examine the limiting factors to the investment multiplier in Rwanda.
Compute and interpret different multipliers and adjust their consumption,savings and investment behaviours to increase the national income levels.
Show concern for promoting the investment multiplier in Rwanda.
4.1 Consumption theory
4.1.1 Meaning
Consumption in economic terms means using up of economic resources so that they are not available in the future. From the individual point of view, consumption refers to the expenditure on the purchase of goods for final use by the consumer.
Activity 1
Mr Rwanyamugabo of Ntunga Village in Rwamagana District uses 4kgs of sugar, 8kgs of meat, 25kgs of rice, 40 units of power, and 5 sacks of charcoal per month. While Ms Mukakabanda of the same village uses 6kgs of sugar, 4kgs of meat, 30kgs of rice and 50 units of power in a month.Using the case study above, respond to the following questions:
1. What economic term can you give the act of using those commodities by Mr Rwanyamugabo and Ms Mukakabanda?
2. What do you think are the factors that affect their consumption levels?
3. What effect does Mr Rwanyamugabo’s act of using 5 sacks of charcoal have on our environment?
4. What advice would you give to Mr Rwanyamugabo on the issue of using the 5 sacks of charcoal?
4.1.2 Consumption function
Consumption function is the relationship between current consumption and all the factors that influence consumer spending. Using the functional notation, we can express the consumption function as C= F (yd., w, cr, r, dg, ex, ygf) where;
C- Consumer spending,
yd. - personal disposable income,
w- Wealth, Cr- availability of credit,
r- Interest rates,
dg- stock of durable consumer goods,
ex- expectations
ygf- income distribution.
Consumption depends on many factors, thus, a change in any of these factors changes total consumption expenditure. However, it should be noted that consumption largely depends on income. Thus, consumption function can as well be defined as the relationship between the level of consumption and national income, i.e. C = C0+ bYd, where.
C is consumption and the dependent variable C0 is the consumption at zero income or autonomous consumption.
b is the marginal propensity to consume (MPC).
Yd. is the disposable income which is an independent variable.
When a household’s income is zero, it will still consume some minimal amount (via begging, borrowing, or drawing down savings). This level of consumption expenditure is autonomous because it persists even when there is no income. The higher a household’s income, the more it will want to consume. This part of consumption which depends upon income is induced. It varies with disposable income.
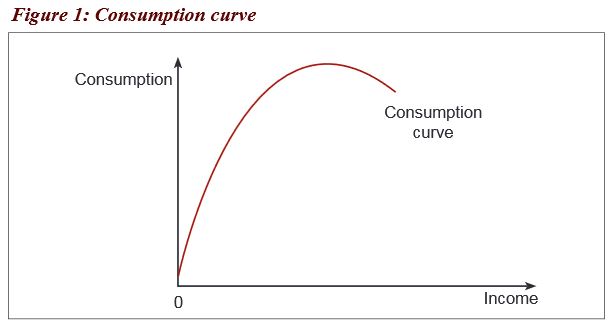
From Figure 1 above, as income rises, Marginal Propensity to Consume (MPC) declines (MPC is the proportion of additional income consumed). Rich individuals have a low MPC. This means that as their income increases, they consume a small proportion of the additional income. A straight-line consumption curve implies that as income rises, MPC is constant. It means that as income increases, one consumes a constant amount of the additional income. Nevertheless, this is not realistic.
4.1.3 Factors influencing the level of consumption
Consumption in any economy is generally determined by the many factors which include, among others, the following:
General Price level: The higher the price, the lower the demand and consumption; and the lower the price the higher the demand and consumption.
Liquidity preference: The higher the liquidity preference than investing money, the higher the consumption; and the lower the liquidity preference, the lower the consumption.
Disposable income: The higher the disposable income, the higher the consumption; and the lower the disposable income the lower the consumption.
Population size: The bigger the population size the higher the consumption; and the smaller the population the lower the consumption.
Nature of income distribution: When income is fairly distributed among the people, consumption will be higher than when income is in the hands of the few.
Availability of goods and services: When goods and services are available, consumption will be higher than when goods are not in plenty.
Degree of speculation: When people expect prices to go down in the future, consumption will be low at present but if prices are expected to be high in the future, consumption will be high at present.
Government policy of taxation: If the government overtaxes the people, they will be left with little income, hence low consumption.But when there are low taxes, income and consumption will be high.
Availability of credit facilities: Consumption will be high if there are credit and hire purchase facilities, but it will be low when these cannot be accessed.
- Marginal propensity to consume (MPC). The higher the MPC, the higher the consumption; and the lower the MPC, the lower the consumption.
4.1.4 Average propensity to consume (APC)
Activity 2
Higiro, a house helper in Nyamiyonga sector, Nyagatare District, used to earn 10,000 FRW per month from which he used 3,000 FRW for consumption and the remaining for saving. After one year, his earnings increased to 15,000 FRW per month. He decided to increase his consumption to 5000 FRW.Individually, using the case study above, work out and explain the following in your exercise books:
1. The fraction of income that is put to use.
2. Fraction of change in income that is put to use.
3. Suggest measures that can be put to increase Higiro’s fraction of income put to use.
4. What lesson have you learnt from Higiro’s behaviour?
Average Propensity to Consume (APC): This refers to the ratio of total consumption to the level of disposable income.
APC=C/Y.
The average propensity to consume declines as income increases. This is because as income increases, more is saved than consumed.
Marginal propensity to consume (MPC): This refers to the fraction of an individual’s additional income that is spent on consumption.
MPC= ∆C/∆Y
As the income rises, MPC falls. Rich people tend to consume a smaller proportion than the poor people. Normally, MPC is less than 1. It can be equal to one only when all the additional income is consumed.
4.1.5 Measures to raise the APC and MPC
Advertisement and propaganda which help to make the consumers familiar with the use of the products and attracts them to consume more;
Development of infrastructure for example, from producing centres to different parts of the country which encourages and enlarges markets for the product and this reduces prices due to reduced costs of transport, thus encouraging consumption;
Urbanisation which increases people’s consumption because of changes in conditions that attracts them to new articles and because of demonstration effect;• Increased wages leading to increased incomes which leads to increased purchasing power;
Increased government expenditure such as giving unemployment benefits/allowances, old age pension, etc. which help reduce uncertainties;
Offering cheap and easy credit facilities, thus as people are availed with loans, thus leading to increased consumption;
Income redistribution policies, i.e. this tends to increase consumption among the poor for example subsidising them through taxing the rich highly; and
Ensuring peace and security in all parts of the country to ensure efficient earning of income to encourage consumption.
4.2 Savings
4.2.1 Meaning
Savings refers to the proportion of disposable income which is kept for future use. The total income of an individual is a summation of his or her consumption and the savings. What remains after consumption of the goods and services that is kept for future use is what is known as savings. It takes forms of personal savings, cooperative savings, and compulsory savings such as RSSB, mituelle, among others.
Activity 3
Whatever we do with money, we need to manage it well. A planned programme of financial education can help give learners as young peoplethe confidence, skills and knowledge they need to manage their money, now and in the future.
On average, most learners receive pocket money and grants; own some resources at home; purchase items; open bank accounts etc. Thus the need for young people to be in control of their money needs to be stronger through availing the young with knowledge of the saving culture; how to manage money; becoming critical consumers; as well as managing risks and emotions associated with money. From the statement above:
1. What message is portrayed from the statement above?
2. Share with the whole class how you can manage your money once earned.
3. What factors may determine your saving levels in case you decided to?
4.2.2 Savings function
Savings function shows the relationship between the level of saving and disposable income. S=F(Y). Savings depend on the level of income whereby if the income increases, also the savings increase, other factors remaining constant. This is more so with the rich individuals as compared to the poor individuals.
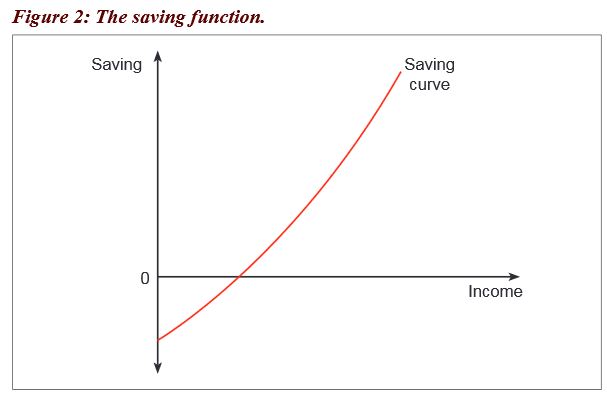
Figure 2 above shows the savings curve. As income rises, marginal propensity to save (MPS) increases. Rich individuals have a high MPS. This means that as their incomes increase, they save a bigger proportion of their additional income.
4.2.3 Factors influencing the level of savings
Level of income: The higher the level of income, the higher the savings; and the lower the level of incomes, the lower the savings.
General price level: The higher the general price level, the lower the savings; and the lower the price level, the higher the saving.
Level of interest rates offered by banks: The higher the interest rate offered by banks on deposits, the higher the savings; and the lower the rates, the lower the savings.
Level of development of financial institutions: If many financial institutions are set up, savings will be higher than when financial institutions are undeveloped.
Political situation: Political stability encourages production, capital accumulation and savings but political instability discourages savings.
Marginal propensity to save (MPS): The higher the MPS, the higher the savings; and the lower the MPS, the lower the savings.
Existing stock of capital: The bigger the stock, the more the output and savings; and the smaller the capital stock, the lower the savings
MPC: The higher the MPC, the lower the saving, and the lower the MPC, the higher the savings.
Spending habits: The higher the spending habits, the lower the savings; and the lower the spending habits, the higher the savings.
4.2.4 Average propensity to save (APS)
Activity 4
Gahongayire, a student at G.S Musha 2015, received 50,000 FRW as a prize for performing well in S.3 national exams by her school administrators. She decided to buy some items and kept 10,000 FRW. After a week, her uncle Mr. Musonera having got amused by her performance, as an appreciation over her success, gave her some money and her income increased to 70,000 FRW. She decided to buy other wants and kept some more money thus increased her savings to 12,000 FRW.From this case study above, individually work out the following:
1. The fraction of Gahongayires’ income that is saved.
2. The fraction of her additional income that is saved.
3. What advice would you give to Gahongayire over managing her money?
4. How do you relate her APC and MPC?
Facts
Average propensity to save (APS) refers to the ratio of saving to the level of disposable income. The APS increases as the income of the individual increases.
Average propensity to save = APS = S/Y
4.2.5 Marginal propensity to save (MPS)
This refers to the fraction of an individual’s additional income that is spent on savings.
Marginal propensity to save = MPS= ∆S/∆Y
Relationship between MPC and MPS
MPC+ MPS=1
Y= C+S∆
Y= ∆C+∆S
∆Y/∆Y= ∆C/∆Y+∆S /∆Y
1=MPC+MPS
4.3 Investment theory
4.3.1 Meaning
Investment can be defined as the expenditure on capital goods with an aim of increasing production. There are mainly two classes of investments:
1. Fixed income investment: This involves investments in assets such as bonds, fixed deposits and preference shares, among others.
2. Variable income investments: This involves investments such as business ownership or property ownership. It should be noted also that expenditure on education and health is recognised as an investment in human capital.
Activity 5
Visit areas near your school. Through research, find out the following:
1. What are the different ways in which people can invest?
2. What factors determine investment levels in any given area?
3. Discuss the limitations to investment levels in Rwanda.
4. In your view, as students of economics, suggest measures that can be put in place to increase investment levels in Rwanda.
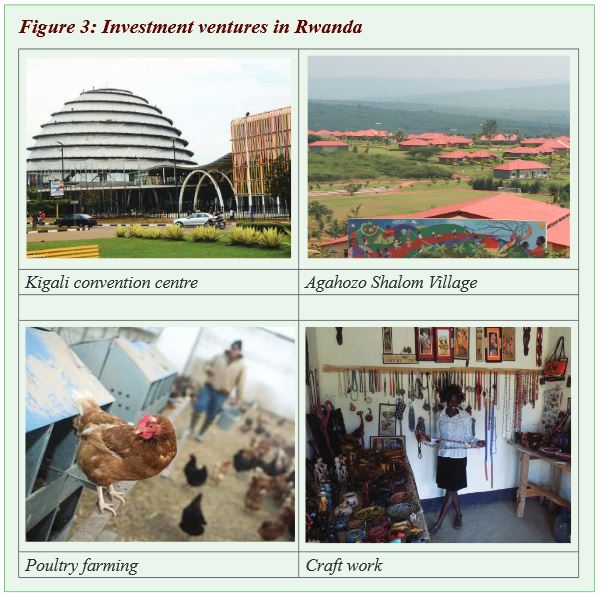
4.3.2 Factors that influence the level of investment in an economy
- General Price level: The higher the price, the higher the level of investments by the investors so as to enjoy the profits; and the lower the price, the lower the investment.
- Liquidity preference: The higher the liquidity preference than investing money, the lower the investment; and the lower the liquidity preference, the higher the investment.
- Disposable income: The higher the disposable income, the higher the level of investment; and the lower the income, the lower the investment.
- Level of demand: The higher the demand, the higher the level of investment; and the lower the demand for the goods and services, the lower the investment.
- Degree of speculation: When investors expect a boom, there will be high rates of investment than when they expect a slump or depression.
- Government policy of taxation and subsidisation: If the government overtaxes the investors, investments will be low but if the government subsidises people, investments will be high.
- Availability of credit facilities: Investment will be high if there are credit facilities accessed by people in form of loans but it will be low if these facilities are scarce.
- Political situation: Peace and stability encourages investment while insecurity discourages investment.
- Presence of capital: The presence of adequate capital resources increases the rate of investment and if capital is not enough, the rate of investment will be low.
- Level of entrepreneurs: Once the level of entrepreneurs is high, investments will be high; and once it is low, investment will be low.
4.3.3 Limitations of investment in Rwanda
Limited markets due to low incomes of the people and this limits the investors from putting up mega structures in terms of investments.
Underdeveloped infrastructure in some areas especially in rural areas limits the movement of potential investors, goods and services from areas of production to the markets.
Unfavourable investment climate in form of high taxes charged by the government to investors discourages them from investing. However, the trend changes where investors are given tax holidays depending on their capacities.
Limited capital: There is still a problem of limited capital whereby the local people do not have the necessary capital to invest. This leads to domination of foreign investors who carry and capital outflow through profit repatriation.
Political insecurity in some areas especially those surrounding Burundi and Congo:The instabilities in those countries cause panic in the Rwandan areas adjacent to those areas. Hence the investors fear to invest in such areas.
High population growth rate leads to increase in the dependence ratio among the families, leaving little disposable income for savings and investment.
High level of liquidity preference: Many people prefer to hold their money in cash or near cash form because of different motives such as precautionary and speculation, among others. This limits their capacity to invest.
Limited entrepreneural skills needed for inventing and innovating. Still the levels are low, meaning that there are no new things that may come on the market. The manpower needed to carry out the inventions is still low, hence leaving the levels of investments low.
Competition from outside countries that bring in their goods on the local market at a low price compared to the one at which home made goods are sold: This diverts people’s attention to buy cheap imported goods, leaving the local goods without market.
4.3.4 Ways of improving investments in Rwanda
Expanding the market through integration and signing treaties with other countries: This will help to solve the problem of lack of market for the home-made products and furthermore, it will bring in more foreign exchange
Developing more feeder roads in addition to the ones that already exist: These will help to link the rural inaccessible areas to the main roads and will ease the movement of goods and services, hence attracting more investors to those respective areas.
Availing a conducive investment climate: This is through reducing the rates of taxes that the beginner firms can pay. This has further been helped by the government setting up investment zones in the areas of Kabuga.
Availing capital: This can be through the commercial banks giving loans and credit at low rates of interests to attract the potential borrowers; furthermore, requesting for lower collateral security when seeking loans. This will attract many people to get soft loans that can be used for setting up investments.
Strengthening security in areas near countries with instabilities: This can be through working hand in hand with the respective governments or more deployments of security personnel in those areas. It will create confidence in the local people and the investors,hence increase capital and investments in those respective areas
Controlling the rate of population growth through a maximum number of children per family: This will reduce the rate of dependence in the families and it will leave the people with enough incomes that can be used for savings and investments in the long-run. Still, it will reduce the government expenditure on social services, leaving it with enough to invest in government-owned parastatals.
Encouraging people to reduce the rate of liquidity and carry out savings: This could be through increase in the interest rates offered on savings. In the long-run it will lead to capital accumulation which can further lead to investments.
Improving entrepreneur skills needed for inventing and innovating. This can be through on-job training and through seminars and workshops. Furthermore, the government has embarked on competence based form of education which helps learners to carry out research and critically think. This form will help students develop their own ideas, leading to constant innovation and inventions.
Competition can be reduced through economic integration and specialisation where countries within the same region produce different goods and sell to others. Furthermore, it can be reduced through producing good quality output through research. The government can also carry out protection to shield domestic industries from competition.
- Subsidisation policy by the government can help to reduce the problem of inadequate capital. At the same time, the goods produced will be sold at a lower price since the cost of production is also low; meaning that they may be sold at a price lower than the foreign goods, hence increasing their demand.
4.4 Multiplier
4.4.1 Meaning
Assuming that the economy is not in conditions of full employment, any increase in investment will not only have an initial effect upon output and income of the same amount, but will also have additional subsequent effects upon output and income. The final increase in income will be larger than the initial increase in investment expenditure. This is the process of the multiplier. Multiplier, therefore, refers to the number of times initial change in expenditure multiplies itself to give a final change in income. The multiplier can be shown as: Multiplier (M) = ∆Y/∆E.
The size of the multiplier is determined by the proportion of extra income going on extra consumption, i.e. MPC. The higher the MPC, the higher the multiplier. The multiplier process reflects the fact that extra spending becomes extra incomes, which in turn becomes partly extra spending. The MPC determines the increase in national income. The formula for determining the actual size of the multiplier is:

Activity 6
One of the reasons why changes in the amount of capital investments are of much significance in an economy is because any sudden change in the level of investment will have a magnified effect on total spending.
Any expenditure will always have a change in the total incomes. Thus, an initial change in investment has great effect on the final change in total spending in the economy.From the statement above, identify and explain the following.
1. What do we call the process through which investment expenditure brings about change in national income?
2. Identify any other forms of expenditures that may bring about a change in national income.
3. What do you think are the limitations to investment multiplier in Rwanda?
Example 1
Given that MPC = 0.4, calculate the multiplier magnitude.
Solution;
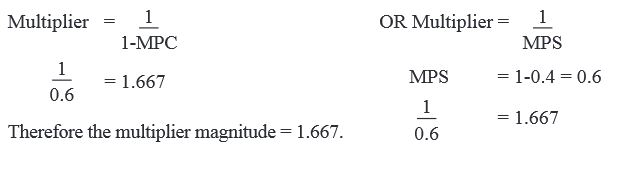
Example 2
If the initial increase in capital investment was 20 million FRW and this brought a final increase in total expenditure of 100 million FRW, the multiplier would be:
Multiplier (M) = ∆Y/∆E
100 million/20 million = 5
Note: It is important to point out that no increase in expenditure of any type (investment, consumption, government or exports) will increase the national output and income if the economy is already at full employment. For an economy already at full capacity, where no further increase in output can take place, any further increase in spending can only raise price so that although national income would rise in “money” terms, there would be no increase in “real” terms. Thus, in examining the effect of increased investment on national income, we must make it clear that there must be unemployed resources for national income to rise (excess capacity).
4.4.2 Types of multiplier
Multipliers can be classified according to the form of sectors that spend. These sectors are: government, firms, and foreign sector. The types of multipliers are seen below.
Government multiplier: It refers to the number of times initial government expenditure multiplies itself to give a final change in income, i.e. M = ∆Y/∆E
Investment multiplier: It refers to the number of times initial investment expenditure multiplies itself to give a final change in income. M = ∆Y/∆I or 1/MPS or 1/1-MPC
Consumption multiplier: It refers to the number of times initial change in consumption expenditure multiplies itself to give a final change in income. M = ∆Y/∆C
Export multiplier: It refers to the number of times a given change in export earnings multiplies itself to give a final change in income.M = ∆Y/∆X
Employment multiplier: It refers to the number of times a given change in employment multiplies itself to give a final change in income. M = ∆Y/∆Employment
Tax multiplier: It refers to the number of times a given change in tax expenditure multiplies itself to give a final level of income. M= ∆Y/∆Tax expenditure
Income multiplier: this is the number of times a change in total expenditure multiplies itself to give a final change in income.This explains the process by which a change in total expenditure (E=C+I+G+X-M) leads to a change in income.
4.4.3 Calculations
Activity 7
Work out and interpret the following calculations:
1. Given that MPS is 0.2, find the MPC and determine the magnitudeof the multiplier. Interpret your answer.
2. Given that the marginal propensity to consume is 0.75, calculate the size of multiplier. Interpret your answer.
3. Given that the current level of GDP is 300million FRW. The increase in national investment expenditure is 50 million FRW and the marginal propensity to save is 0.2. Calculate the final level of income.
Example 1
Given that as a result of increase in investment expenditure from 20 million FRW to 60 million FRW, national income increased from 3000 million FRW to 7000 million FRW. What is the investment multiplier?
Solution
Investment multiplier =∆Y/∆I
∆Y = 7000million FRW-3000million FRW = 4000million FRW
∆I = 60 million FRW-20 million FRW = 40 million FRW
Thus; I.M = 4000million/40 million = 100
This means that the initial investment expenditure has multiplied itself 100 times to give a final change in national income.
Note: Multiplier has no units; it is simply a number of times.
Example 2
Given that the final change in investment from 3 million FRW to 8 million FRW led to an increase in income from 200 million FRW to 400 million FRW, calculate the investment multiplier.
Solution
Investment multiplier = ∆Y/∆I
∆Y = 400million-200 million = 200 million FRW
∆I = 8 million- 3 million = 5million FRWThus,
I.M = 200 million/5million FRW = 4
Therefore, the investment multiplier = 4.
This means that the initial investment expenditure of 3million FRW has multiplied itself 3 times to bring about a final change in income of 400 million FRW.
Exercise
1. Given that government expenditure in an economy is increased by 100 million, where the MPC is 0.8. Find the final change in national income.
2. Given that MPS is 0.2, find the MPC and determine the magnitude of the multiplier.
3. Given MPC is 70%, find MPS.4.
(i) Calculate the magnitude of the multiplier where MPC is 40%.
(ii) Given that the multiplier in an economy is 2 and the final level of income is 100 million. Find the MPS and change in expenditure.
4.4.4 Factors limiting the operation of the investment multiplier in Rwanda
Activity 8
Explain the factors that hinder the operation of investment multiplier in Rwanda.
Facts
Of all the multipliers, the investment multiplier is said to have a bigger impact on the level of a country’s national income. The investment multiplier in Rwanda has been limited by several factors among which include the following:
Limited markets due to low incomes of the people and this limits the investors from putting up mega structures in terms of investments.
Underdeveloped infrastructure in some areas especially in rural areas limits the movement of potential investors, goods and services from areas of production to the markets.
Unfavourable investment climate in form of high taxes charged by the governments to investors discourage them from investing. However, the trend changes where investors are given tax holidays depending on their capacities.
Limited capital: There is still a problem of limited capital whereby the local people do not have the necessary capital to invest. This leads to domination of foreign investors who carry out capital outflow through profit repatriation.
Political insecurity in some areas especially those surrounding Burundi and Congo. The instabilities in those countries cause panic in the Rwandan areas adjacent to those areas. Hence the investors fear to invest in such areas.
High population growth rate leads to increase in the dependence ratio among the families leaving little disposable income for savings, and investment.
High level of liquidity preference. Many people prefer to hold their money in cash or near cash form because of different motives such as precautionary, speculation among others. This limits their capacity to invest.
Limited entrepreneural skills needed for inventing and innovating: Still, the levels are low, meaning that there are no new things that may come on the market. The manpower needed to carry out the inventions is still low, hence leaving the levels of investment low.
4.4.5 Accelerator principle
Activity 9
From the knowledge of multiplier principle in activity 6, explain the following:
1. What is the relationship between consumption and the changes in national income?
2. The accelerator principle.
3. Work out and interpret the following:
(i) As a result of an increase in milk consumption in the country, from 80,000 to100,000 liters per week, investment in the diary sector increased by 200 million FRW. Given the price of milk as 300 FRW per litre, calculate the accelerator magnitude.
(ii) The consumption expenditure increased from 30 million to 70 million FRW, which resulted into an increase in investment from 500 million to 800 million FRW. Estimate the accelerator magnitude.
Facts
As investment leads to a change in income directly, change in consumption leads to a change in income indirectly by inducing investment which also leads to a change in income.
The accelerator principle is the number of times the original change in consumption multiplies itself to give a final change in investment.
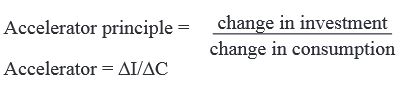
For instance, if the consumption of beans increases from 15 kg to 22 kg and increase in investment moves from 100 FRW to 150 FRW, the accelerator principle would be:
Unit assessment
1. Analyse the factors that may determine the consumption rates in Rwanda.
2. (i) Why do you think there are low levels of savings in Rwanda?
(ii)What should the government of Rwanda do to encourage the saving culture in Rwanda?
3. The government has of late encouraged location of many industries in Masoro, what other measures have been put in place to improve investment rates in Rwanda?
4.5 Glossary
Accelerator: The number of times a given change in consumption multiplies itself to give a final change in investment. Accelerator = ∆I/∆C
Actual consumption:The consumption of the flow of services that are provided by the commodities that are purchased by households.
Actual investment: The amount of investment goods which are required in a given period of time including all the desired or undesired accumulated inventories.
Autonomous consumption: The consumption at zero income i.e consumption that is independent of the level of income and output.
Autonomous Investment: Investment that is independent of the level of income and output.
Average propensity to consume (APC): The ratio of consumption to the level of national income. APC = C/Y
Average propensity to save (APS): The ratio of saving to the level of national income. APC = S/Y
Consumption: The expenditure on the purchase of goods for final use by the consumer.
Desired investment: The quantity of investment goods acquired in a given time, including desired accumulated inventories, but excluding the undesired accumulated inventories.
Fixed investment: Investment in plants and equipment.
Forced savings: A situation in which prices have risen faster than income so that fixed income earners reduce their level of consumption. Or it is a situation where current consumption is sacrificed in greater proportion so as to favour another section of society/community (usually government).
Gross fixed investment: The amount of investment capital that is invested into the country minus depreciation.
Induced consumption: Part of consumption which depends upon income. It varies with disposable income.
Induced investment: Changes in investment brought about by changes in output and income.
Inventories: A stock of resources in form of raw materials, semi-finished and finished goods held by the firm at the end of any given business interval.
Investment: The process of devoting part of a person’s income to production of capital goods OR it refers to the process of creation of capital stock.
Investment demand function: A negative relationship between the quantity of investment per period and rate, holding other factors constant.
Marginal efficiency of investment: The relationship between desired investments and the rate of interest, assuming all other things equal.
Marginal propensity to consume (MPC): The fraction of an individual’s additional income that is spent on consumption. MPC = ∆C/∆Y
Marginal propensity to save (MPS): The fraction of an individual’s additional income that is spent on consumption. MPS = ∆S/∆Y
Multiplier: The number of times initial change in expenditure multiplies itself to give a final change in income. M = ∆Y/∆E
Savings: The proportion of income which is kept for future use. It takes forms of personal savings, co-operate savings, compulsory savings, among others.
Saving income: Incomes which households do not pass back to firms through consumption expenditure.
Savings gap: The difference between the amount of money resources required to attain increased investment and actual investment available
Unit summary
Consumption
• Meaning
• Consumption function
• Determining factors
• Average propensity to consume (APC)
• Measures to raise APC
• Marginal propensity to consume
Saving
• Meaning
• Determining factors
• Average propensity to save (APS)
• Marginal propensity to save (APS)Investment
• Meaning
• Determining factors
• Limitations of investment
• Ways of improving investment levels in Rwanda
Multiplier
• Meaning
• Types of multipliers
• Calculations and their interpretations
• Limitations of the investment multiplier in Rwanda
Accelerator
• Meaning
• Calculations
Unit 5: MONEY
Key unit competence:Learners will be able to describe the role
of money in an economy.
My goals
By the end of this unit, I will be able to:- Explain the steps in the evolution of money.
- Identify the advantages and disadvantages of barter trade.
- Identify the various types, qualities and functions of money.
- Explain the motives of holding money according to Keynes.
- State and solve Fisher’s equation of exchange.
- Distinguish between M1, M2 and M3.
- Identify factors determining money supply, the types and factors that influence interest rate.
- Assess the impact of barter trade in an economy.
- Analyse the functions of money in an economy.
- Compare and contrast the barter economy and the monetary economy.
- Describe with illustrations the motives for holding money according to Keynes.
- Examine the applicability of Fisher’s equation of exchange in Least Developed Countries (LDCs).
- Describe the determining factors of money supply in Rwanda.
- Calculate interest rates and discuss factors that influence interest rates.
- Advocate for the regulation of demand and supply of money to maintain its purchasing power/value and stability in an economy.
- Choose the best type of interest rate to be used.
5.1 Money
5.1.1 Meaning of money
Money is defined as anything that is generally accepted as a medium of exchange for the goods and services andin settlement of obligations. This abstract definition of money avoids identifying money with a particular object whichmay at one time or another be used as money.All sorts of articles or objects have served as money throughout the ages. These include, among others, beads, salt,stones, gold, silver, paper and cattle.Activity 1
Using photographs in Figure 1 below, respond to the following questions:1. What do the photographs below show?2. Explain the meaning of the term money.3. Describe how money evolved from the past to the present.4. What type of transaction was being used before the introduction of money?5. What problems did the means of transaction talked about in (4) above have?6. What qualities should good money have and what is its function?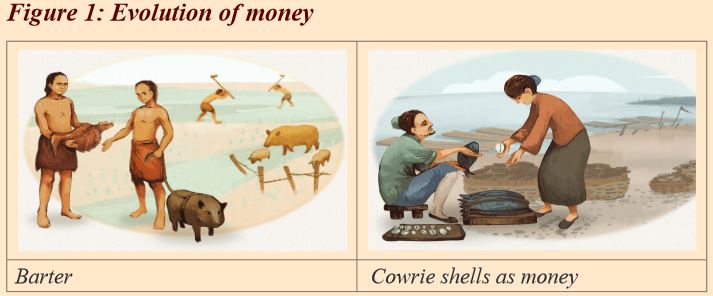
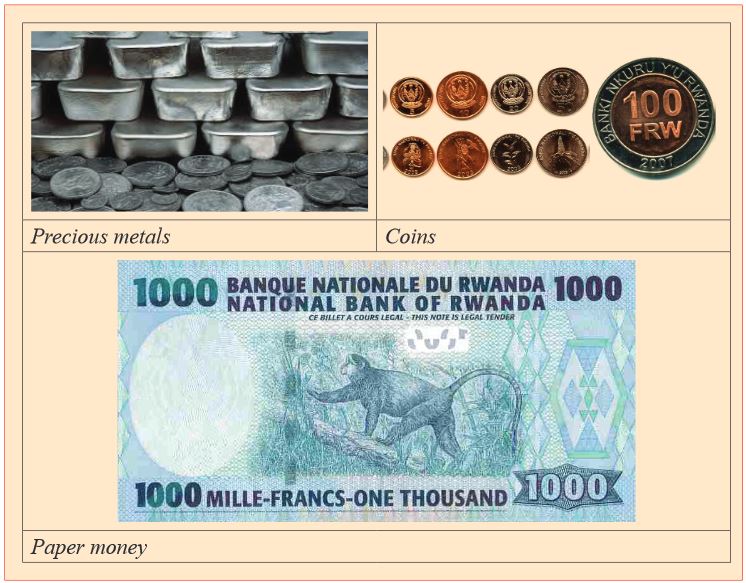
5.2 Evolution of money
Money was not invented overnight. It is as a result of a process of evolution through several hundreds of years.Money has passed through numerous historical stages such as barter, commodity, paper and bank money.It can be seen below how money evolved to the present:1. Barter trade:This was the first form of exchange where commodities were exchanged for commodities.For example, cassava for sheep.2. Commodity money: This replaced barter trade and consisted of commodities of high value such as salt,tobacco, cattle, etc.3. Durable commodities: These included iron, copper, and cowrie shells, among others.However, these were too common, hence they could not act as good money.4. Precious metals such as gold and silver replaced commodity money because they were found to have qualitiesof good money. Such metals were later cut into small pieces of different shapes called coins. At first, the metal valueof the coin was equal to its face value and such coins were called full bodied money. Later coins whose real value wasless than the real value were called token money.5. Paper money: This started with goldsmiths as receipts for gold banked with them for safety. Such receipts stated thename of the owner and the amount of gold deposits kept. Later, these were used as money because they were as goodas the gold kept. After some time, the goldsmith started issuing notes in excess of the gold reserves kept and this moneynot backed by gold is known as fiduciary issue.6. Banknotes: From the experience of the goldsmith, Britain and America started printing bank notes of smallerdenominations of 10, 20, etc. which could be used for transactions.5.3 Barter trade
Barter is a system where people exchange products or services directly. It depends on double coincidence of wants,a situation where two traders are willing to exchange their goods directly.Normally, it involved exchanging what one person had with what he or she wanted although it was a bit hard to findsomeone who wanted what you had and at the same time wanted what you had. Sometimes, the process involvedmoving long distances to acquire different products.The problems encountered during the process created the need for a commodity that would be generally accepted asa medium of exchange. Commodities started being used as mediums of exchange. Among them were sea shells,bananas, cattle, land and metal.Conditions of barter trade
• There must be two parties that are willing to exchange commodities.• There must be commodities that are to be exchanged.• There is no general medium of exchange.• There must be individuals that need commodities that some people have to exchange.Advantages of barter system
• Barter system is very simple, without any complications and suitable in international trade when countriesexchange commodities for commodities.• In this system the shortage of foreign exchange and imbalance in trade does not occur.• In a barter system, there is no wastage which occurs in monetary economy because goods are not overproducedor underproduced. Only the required quantity is produced.• The economic power is not concentrated at one particular place in the barter system because people do not gather wealth.Disadvantages of barter system
• Problem of portability: It was difficult to transfer certain items from one place to another. For instance, it would be difficultmoving around with sheep looking for market.• Limited production: Large scale production was limited since demand for goods was never certain.• Needs differentiate from man to man. If either party gets what they need, then it is double coincidence. If not, it is a troubleas they do not get what they need.• In the barter system, it was difficult to divide and sub-divide goods.Possibility of exchanging one’s good for only one goodnot for two or more.• The value of the goods could not be distributed equally as there was no measure during that period.• The exchange of goods worth a service of a person was impossible as it was inconvenient to measure it.The barter system cannot exchange goods for services.• Perishable goods could not serve as wealth for their future expenses. The economy could not contribute anythingtowards capital formation of the country, too.• There was a lot of cheating during the transaction. This was because there was no standard means of measurement.For instance, it was cheating when one exchanged a cow with a sack of cassava.5.4 Types of money
Commodity money
This was the first form of money that was used because of its intrinsic value. Historical examples included sea shells,cattle, salt, tobacco, etc. In the long-run, precious metals such as silver, gold etc. were used as money because of theirscarcity. These were later minted into the coins that have been common of late.Convertible paper money
The inventiveness of goldsmiths and their clients led to the origin of convertible paper money. People would alwaysdeposit their gold with the goldsmith and in return the goldsmith would give them receipts promising to give them thegold on demand.When a depositor wanted to make a large purchase, he would go to the goldsmith and withdraw the gold then giveit to the seller.If the people knew the goldsmith to be reliable, there was no need to go through the tiresome and risky business of physically carrying the gold. The buyer needed only to transfer the goldsmith’s receipts to the seller who would accept it as long as he was confident that the goldsmith would pay the gold when need arose. People, therefore, started transferring receipts from the goldsmith when buying goods from others, hence leading to the development of the convertible paper money.Fractionally backed paper money
This is money issued by the bank that is more redeemable in gold than the amount of gold that it held in its vaults.The notes issued are in excess of gold reserves held by the bank or goldsmiths.Fiat money
This is money that is not backed by reserves of another commodity. The money itself is given value due to an authoritysuch as the government acting like it has value. This type of money is issued on the directives of the governmentirrespective on the level of activities.Deposit money
This is defined as money held by the public in the form of deposits in commercial banks that can be withdrawn ondemand. Such deposits are called demand deposits, the most important of which are savings and current accounts.Cheques, unlike bank notes, do not circulate freely from hand to hand, hence they are not currency.Near money or quasi money
These are assets which can easily be converted to cash. These other currency and demand deposits can readily beconverted into currency and demand deposits. Examples include: cheques, treasury bills, bonds, etc. These assetsserve as temporary stores of value but may not directly perform the medium of exchange function. They can, however,be converted into cash or demand deposits. Because these assets are so closely related to money, economists calledthem near money.Token money
This is money whose real value is less than the face value.Full bodied money
This is money whose real value is equal to the face value.Advantages of using moneyMoney confers the following advantages to the user:• It widens the scope for individuals to maximise their satisfaction from a given amount of expenditure.An individual who receives his income in monetary form can exchange it for the assortment of goods,which would give him maximum satisfaction.• Money facilitates distribution: In a modern society, money is a mechanism through which most goods andservices are distributed through the pricing mechanism.• Transfer of immovable property: Money can facilitate the physical transfer of property, for example a buildingfrom one place to another.• It facilitates division of labour. Division of labour generates specialisation whose sustenance requires exchange.In the absence of money as a medium of exchange, specialisation would require exchange on barter terms, whichneed the double coincidence of wants.• Money facilitates lending. The use of money facilitates the development of deferred payments. Without the use ofmoney, deferred payment would be impossible. By foregoing consumption today in favour of the future, an individualwould be able to build up a stock of fund for future expenditure.5.5 Qualities of good money
Acceptability: Good money should be acceptable by everyone as a medium of exchange. This is the prime requirementfor money. The use of money is based on confidence. One is prepared to accept money provided one is confident thatothers will also accept it.Durability: The goods that are used as money should be durable. It would not be acceptable if it could deteriorate.For instance, if a metal is used, it should not wear away. It should be noted that the money’s durability lies in its value.Scarcity: Good money should be scarce because if it is common, it would lose value due to increase in demand.Its supply must be less than the demand but it must be available.Homogeneity: Good money should be similar. The features on the same denominations should be the same as onanother denomination. Varying degrees of quality will lead to confusion and uncertainty in the public and eventuallythere will be loss of confidence.Divisibility: Good money should easily be divisible in small units. Whatever physical commodity is being used as money,it must be capable of being divided into smaller amounts to make possible smaller transactions.Portability: One should be able to carry good money from one place to another. It must not be heavy in relation to its value.It must be transportable in terms of bulk and weight. Modern money consists of coins, bank notes, cheques and bank draftsand these can easily be carried without attracting attention.Difficult to forge: Good money should be hard to forge. It should be made of features and quality that cannot be easilyforged. Otherwise, forged money will increase money in an economy which leads to inflation and in turn money will losevalue. Money which is forged is called counterfeit money.5.6 Functions of Money
Medium of exchange: All transactions are made through the use of money. Previously in the old ages, there was use of commodity and barter system of exchange. The introduction of money eased the system of exchange because of its good qualities such as portability, divisibility, among others. Therefore, it is used as a medium of exchange.Measure of value: The value of goods and services and factors of production are expressed in terms of money.Determining the value of a commodity is based on how much an individual is prepared to pay for it. The higher theamount paid for a commodity, the more valuable it is; and the lower the amount paid, the less the value, other factorsremaining constant.Store of value or wealth: Wealth or goods can be stored for future use in form of money than assets. It is easy for Musoniin Musanze District to sell his Irish potatoes and store one million FRW for a period of one year than storing one hundredsacks of Irish potatoes. For example, it is easier to store one million FRW than storing one cow.Standard of deferred payments: Many transactions are conducted on the basis of credit where goods and services are sometimes given out on credit. When paying for the goods, it is more convenient to express these future obligations in termsof money.Distribution: In a modern society, money is a mechanism through which most goods and services are distributed throughthe pricing mechanism. Goods can be moved from one area to another mainly from areas of low price to areas of highprice through a process called arbitrage. All this can only be done through price mechanism which uses money.Transfer of immovable property: Money can facilitate the physical transfer of property. For example, it may be hard tomove a building from Nyamaseke to Gisenyi but the owner can sell the building and easily moves with his money to thenew area of location.Unit of account: All business transactions and accounting are made possible by use of money. When computing business transactions, statistics of national income, to mention but a few, money is the most suitable medium. It may be easy to record the amount got after selling a commodity than recording the actual commodity.Money enables specialisation to take place by ascertaining the demand for goods and services. People are able to carry out specialisation basing on the level of incomes that they possess.5.7 Demand for money
Activity 2
Mukabalisa, an entrepreneur working in Karongi, needed money to carry out many activities for business and also for herown welfare. When her income increased, she would demand for more goods and in the end, the prices would go up.This made her disappointed in the activities she was doing.Using the case study above, describe the following:1. The need for money by Mukabalisa is known as..............2. Explain reasons why Mukabalisa demanded for money.3. Explain what happened when Mukabalisa increased demand for the goods.4. Examine the relationship between money supply and price of the commodities.Facts
The demand for money arises from the fact that it is an asset for its holders. Since it is acceptable to all, people hold itnot only for paying debts but as a particular form of asset that can easily be converted into other goods and services.The demand for money is, therefore, called liquidity preference. It is the desire by the people to hold money in cash ornear cash form rather than investing it.Keynesian theory of demand for money
 According to Keynes, people demand for money because of the three main motives as explained below:Transactions motive: According to this motive, people demand for money so as to carry out everyday transactionssuch as buying food and clothes, among others, needed in the everyday life. You can also keep an inventory of moneyin form of deposits at the bank to make transactions such as paying rent, water and other bills. Keynes argued that thedemand to hold money to make transactions is determined by the level of income and by institutional factors.Precautionary motive: According to this motive, people demand for money to cater for unforeseen circumstances suchas sickness and travel, among others. For instance, if a person plans to travel for a long distance, he will expect to spend money on a travel ticket, lodging and food, among others, but still he may need to have some money aside for instancesthat may come unknowingly such as sickness on the way and increase in the travel tickets.Speculative motive: According to this motive, people demand for money in anticipation of future trends in the businessso as to profit from them. Normally, a change in prices in future will help the business people to benefit when they buy atlower prices and sell in future when the prices increase. Speculation helps business people to make abnormal profits in the future.Keynes assumed that individuals can hold their wealth in two ways.• In cash balances in excess of those needed to meet transactions demands; and• In bonds.
5.8 Interest rate
Activity 3
Research about the following:1. Definition and types of interests.2. Reasons why interest is paid.3. Determinants of interest.Facts
Interest is a payment for use of capital, or it refers to the cost of borrowing capital or money (principle).It can also be defined as a percentage that is paid on deposits by the banks. When people borrow moneyfrom financial institutions, they are supposed to pay a certain rate of interest.Interest rate is usually expressed as a percentage of the principle. It varies from time to time and from bank to bank.Most of the banks in Rwanda pay between 17- 19%. Interest is paid because of different reasons.5.8.1 Types of interest
There are four main types of interest, namely:• Simple interest;• Compound interest;• Real interest; and• Nominal interest.Simple interest
This is interest calculated based only on the principal amount or on that portion of the principal amountwhich remains unpaid.Simple interest = PxRxT/100Where P = Principal amount borrowedR = Rate of interestT = Duration of paymentCompound interestThis arises when interest is added to the principal so that from that moment on,the interest thathas been added also itself earns interest. This addition of interest to the principal is called compounding.for exampleif a loan of 30,000 FRW earns interest of 30% per month, after the first month, the total amount due will be the principalof 30,000 FRW plus the interest of 9000FRW, which totals 39,000Rwf. The interest for the second month will be calculated basing on the new amount 39,000Rwf.Compound interest = A-PWhere P = Principal amount borrowedA = The amount accumulated which is calculated using the formulaA = P( 1+ r)r = Rate of interestt = Duration of repaymentNominal interest
This is interest expressed in monetary terms. For example suppose you deposit 30,000 FRW into a bank account for1 year and you receive interest of 6000 FRW at the end of the year, the nominal interest rate, will be 20% per annum.Nominal interest rate is the rate of interest before any adjustment for inflation.Real interest
This is the interest rate that expresses the cost of borrowed funds after adjusting for the expected depreciation of thevalue of those funds due to inflation. For example if the interest received is 20% but during that time inflation has risenby 12%, the real interest is 8%. Much as you earn 20%, its purchasing power has been reduced by 12% because ofinflation and so the real value of money is just 8%.5.8.2 Reasons why interest is paid
Reward for saving to those people who postpone consumption: Normally, some people postpone consumptionand put their money in financialinstitutions, which money is also lent out to some other people. The person whodeposited money, therefore, is entitled to an interest.Payment for parting with cash: People part with cash that they would have used for carrying out activities.Price for use of credit: Interest is paid for use of loanable funds. This is interest charged by lenders on borrowers.Reward for management: Interest is paid to the lender so that he can meet the expenses of lending. These may be administrative such as calling and photocopying.Reward for risk bearing because parting with cash involves risks of losing it. Sometimes the borrower may refuse to pay money lent to them. The lender, therefore, may have to include an interest in case of failure to pay.Reward for inconveniences to the lender: Normally lending money involves inconveniences. The lender may also have purposes for the use of the money but then he or she decides to lend it out to an individual. So, an interest has to be paid for inconveniencing the lender.To cater for time value of money because money loses value as time goes on. There is a saying that money today is not equal to money tomorrow. This is because the amount of goods and services that for example 1000 FRW can buy today willbe more than what the 1000 FRW will buy in one month’s time. The purchasing power of the 1000 FRW will have fallen.When one lends you money today, when paying back in a month’s time, it will not have the same value, so an interest is needed to cater for the loss in value.5.8.3 Determinants of the rate of interest
Amount of money in circulation: The higher the amount of money in circulation, the lower the interest; and the lower the money, the higher the interest.Duration of the loan: In commercial banks, the longer the time of payment, the higher the interest; and the sooner the payment period, the lower the interest.Size of the loan: The bigger the loan, the smaller the interest; and the smaller the loan, the bigger the interest.Competition among financial institutions: If there is competition among financial institutions, there will be a lower interest than where there is no competition.Risks involved in lending: If there are high risks in lending, there will be a high interest than when there are low risks.Rate of productivity of capital: If productivity of capital is high, interest paid will be high compared to when the productivity is low.5.9 The quantity theory of money
Activity 4
Research about the following:1. Meaning of quantity theory of money.2. Assumptions and criticisms.
Facts
The quantity theory of money was first put forward by classical economists.It was later revised by Irving Fisher, an American economist. As developed by Fisher, the quantity theory of money explains the determinants of the value of money.In his book, “The purchasing Power of Money” (1911), he stated that the value of money in a given period of time depends on the quantity of money in circulation in the economy. Other things remaining unchanged, as the quantity of money in circulation increases, the price level also increases in direct proportion and the value of money decreases and vice versa.If the quantity of money is doubled, the price level will also double and the value of money will be one half. If the quantity of money is reduced by one half, the price level will also be reduced by one half and the value of money will be twice.According to this theory, the value of money depends on the following factors:1. The quantity of money in circulation, i.e. an increase in the quantity of money in circulation would bring about aproportionate increase in the prices.2. The velocity of circulation of money.3. The number of transactions that take place in the economy.Irving Fisher’s theory, therefore, states that; the general price level is determined by the quantity of money in circulation (M) assuming that the velocity of circulation (V) and the level of transaction (T) are held constant.As modified by Fisher, the quantity theory of money can be expressed by the equation below:MV = PT Or P = MV / TWhere; M = Quantity of moneyV = Velocity of circulation of money, i.e. number of times one unit of money is used to make transactionsT = number of transactionsP = General Price LevelExample
Assume V and T remain constant, if the quantity of money is increased, the price level will go up but the value ofmoney will fall and vice versa. Assume that:M = 100V = 10T = 50P = MV/T = 100x10/50 = 20If M = 200, then P = 200x10/50 = 40If M = 50, then P = 50x10/50 = 105.9.1 Assumptions of Fisher’s approach
Fisher’s theory is based on the following assumptions:• Price is a passive factor in the equation of exchange which is affected by other factors.• Velocity is assumed to be constant and is independent of changes in money in circulation.• Number of transactions also remains constant and is independent of other factors such as money in circulation and velocity.• It is assumed that the demand for money is proportional to the value of transactions.• The supply of money is assumed as an exogenously determined constant.• The theory is applicable in the long-run.• It is based on the assumption of the existence of full employment in the economy.• There is no hoarding of the increased money supply but it must be spent on buying goods and services.5.9.2 Criticism of the theory
Truism
According to Keynes, “The quantity theory of money is a truism.” Fisher’s equation of exchange is a simple truismbecause it states that the total quantity of money (MV) paid for goods and services must equal their value (PT).But it cannot be accepted today that a certain percentage change in the quantity of money leads to the samepercentage change in the price level.Other things not equal
The direct and proportionate relation between quantity of money and price level in Fisher’s equation is based on theassumption that “other things remain unchanged”. But in real life, V and T are not constant. Rather,all elements in Fisher’s equation are interrelated and interdependent. For instance, a change in M may cause a change in V. Consequently, the price level may change more in proportion to a change in the quantity of money.Constants relate to different time
Prof. Halm criticises Fisher for multiplying M and V because M relates to a point of time and V to a period of time. The former is a static concept and the latter a dynamic. It is, therefore, technically inconsistent to multiply two non-comparable factors.Failure to measure value of money
Fisher’s equation does not measure the purchasing power of money but only cash transactions, that is, the volume of business transactions of all kinds or what Fisher calls the volume of trade in the community during a year. But the purchasing power of money (or value of money) relates to transactions for the purchase of goods and services for consumption. Thus, the quantity theory fails to measure the value of money.Weak theory
According to Crowther, the quantity theory places a misleading emphasis on the quantity of money as the principal cause of changes in the price level during the trade cycle. According to him, prices may not rise despite increase in the quantity of money during depression; and they may not decline with reduction in the quantity of money during boom. Further, low prices during depression are not caused by shortage of quantity of money, and high prices during prosperity are not caused by abundance of quantity of money.Neglect of interest rate
One of the main weaknesses of Fisher’s quantity theory of money is that it neglects the role of the rate of interest as one of the causative factors between money and prices. Fisher’s equation of exchange is related to an equilibrium situation in which rate of interest is independent of the quantity of money.Unrealistic assumptions
Keynes in his General Theory severely criticised the Fisherian quantity theory of money for its unrealistic assumptions. First, the quantity theory of money is unrealistic because it analyses the relation between M and P in the long-run. Thus, it neglects the short-run factors which influence this relationship. Keynes also does not believe that the relationship between the quantity of money and the price level is direct and proportional.Velocity is not constant
Further, Keynes points out that when there is underemployment equilibrium, the velocity of circulation of money V is highly unstable and would change with changes in the stock of money or money income. Thus, it was unrealistic for Fisher to assume V to be constant and independent of M.Neglect of store of value function
Another weakness of the quantity theory of money is that it concentrates on the supply of money and assumes the demand for money to be constant. In other words, it neglects the store-of-value function of money and considers only the medium-of-exchange function of money. Thus, the theory is one-sided.Neglect of the role of government
The theory ignores the role of government in price control. There can be increase in money supply but the government fixes the prices, hence there will not be price increase.5.10 Value of money
Activity 5
Research about the following:1. Meaning of value of money.2. Determinants of value of money.Facts
Value of money can be defined as the amount of goods and services that money can buy. Or it can be defined as the purchasing power of money. We know that money can either be:(a) Nominal: which is money expressed in units such as francs, shillings and dollars, among others, and(b) Real which is the purchasing power of nominal moneyValue of money depends on the time at which the money is used. Is it used to buy goods now or to buy them in a future?The main importance of time value of money is that the value of 1000 FRW now is more than the value of 1000 FRW after some time. That is, the value of money today is more than the value of money after some time. Therefore, money available at the present time is worth more than the same amount in the future because of potentiality of future earnings.5.10.1 Determinants of time value of money
There are several determinants which are used to calculate the actual value of the money.Four commonly used determinants are:• Consumption preference of a person• Uncertainty of future• Inflation of the economy• Investment opportunity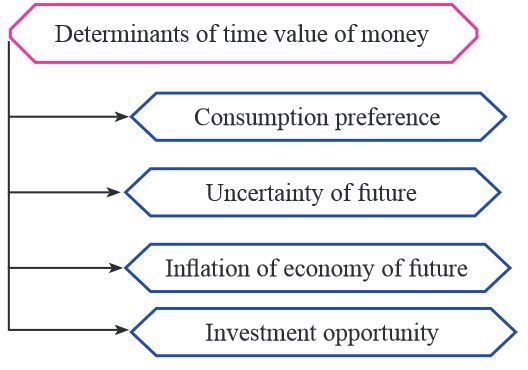
Consumption preference of a person
People prefer current consumption to future consumption if there is the same level of satisfaction. Most of the people are ready to sacrifice the current consumption if they find that in the future, they will be able to consume more than the present. A higher rate of return that is more than the required rates of return mainly leads them to take the decision to sacrifice current consumption. Some people think that the future is uncertain so it is better to consume now although they are not concerned about the benefit of the future.Uncertainty of future
The future is always uncertain. Nobody knows what will happen in the future. So, it is better to consume now rather than consume in the future if current consumption rate is more. People would like to compensate for uncertain future cash flow against certain cash flow.Inflation of the economy
Inflation is related to the purchasing power of money. With time, the purchasing power of money decreases. Every economy has inflation but the rate is different from country to country. If there is higher inflation, then the required rates of return of investor is higher. For a higher inflationary economy, consumers prefer current consumption rather than future consumption.Investment opportunity
Time value of money considers the idea of re-investment, that is, if an investment generates cash inflow periodically, then this periodic return can be re-invested which will generate higher return. If the cash flow comes now, it can be invested and generate additional cash flow, therefore, whatever may be the cash flow now. The future cash flow is more than its present cash5.11 Money supply
Activity 6
Basing on Activity 2, when Mukabalisa demanded for money, there was an increase in the amount to the extent that everyone in her area had a lot of money. Buying of goods increased and Mukabalisa’s sales revenue increased. However, with time, the prices increased and demand reduced because things became expensive.Describe the following:1. The increase in the amount of money in circulation is known as..............2. Explain factors that may have increased money in supply.3. Explain the effects that increase in money supply can lead to an economy.Facts
Money supply refers to the total amount of money in circulation together with that money held by commercial banks plus quasi money. It comprises of the total currency notes, coins and demand deposits with the banks, held by the public.In modern economies, money supply is divided into three levels, namely:1. M1 (Narrow money): This is money supply that involves cash( i.e. notes and coins) and demand deposits.It looks at money as a medium of exchange.2. M2 (Broad money): This is money supply that involves cash ( i.e notes and coins), demand deposits and time deposits(deposits that require notice before withdrawn). That is M2= M1+ time deposits3. M3 (Broader money): This involves cash ( i.e. notes and coins), demand deposits, time deposits and money marketinstruments such as certificates of deposit. That is M3= M2+ fixed deposits.5.11.1 Types of money supply
Exogenous (Discretionary) money supply
This is money supply which is fixed and determined by issuing authority such as central bank. Such money supply is fixed regardless of the economic activities.Endogenous (Automatic) money supply
This is the money supply determined by the level of economic activities. The higher the level of economic activities, the higher the money supply; and the lower the activities, the lower the money supply.5.11.2 Determinants of money supply
Level of economic activities: The higher the level of economic activities, the higher the money supply; and the lower the activities, the lower the money supply.Buying and selling of security by the central bank. When the central bank buys security such as bonds from the public, it increases money but when it sells, it reduces money supply.Balance of payment surplus: When the export earnings are greater than the import expenditure, the money increases in supply but when they are low, money supply will be low.Rate of printing money: When more money is printed, it increases money in circulation. This is called financial accommodation.Rate of capital inflow and outflow:When the rate of inflow such as from tourists is high, there will be high money supply while high capital outflow reduces money supply.Level of monetarisation of the economy: When the economy uses money as a medium of exchange, money supply will increase while use of barter leads to low money in supply.Rate of credit creation by commercial banks: Where there is a high rate of credit creation, there will be increase in money supply while a low credit creation leads to low money supply.Rate of government borrowing: High rate of government borrowing increases money supply while low government borrowing leads to low money supply.5.11.3 Effects of increased money supply
Positive effects
• It encourages investment if it is channelled through bank as loans.• It increases demand for commodities by expanding the purchasing power of the public.• It increases employment by expanding production opportunities.• It checks on a depression/recession by increasing aggregate demand.• It increases tax revenue (if there is no inflation).• It can increase the stock of assets, as people prefer to keep fixed assets other than money.Negative effects of increased money supply
• It can result into inflation.• It leads to increase in interest rates as banks try to adjust interest rates to match inflation.• It reduces the external value (exchange rate) of the currency and increases prices of imports.• It reduces the portability of money. To buy a commodity, one has to carry a lot of paper and coins.• The country shifts to barter trade as people lose confidence in the currency.• It reduces lending by banks as there is fear to be paid back in an inflated currency.• It reduces local production as producers shift resource to production of exports whose prices are stable in the world market.• It reduces the real value of tax revenue, i.e. inflation reduces the purchasing power of tax revenue.• It increases the cost of production and eventually reduces productionUnit assessment
1. (i) What would make a good 5000 francs note?(ii) Why do people demand for money?2. How is Rwandan currency important in the economy?5.12 Glossary
- Barter trade: A system of exchange where goods are exchanged for goods and services for services or goods are exchanged for services.
- Capital market: One where long-term securities are traded.
- Demand for money:The desire by the people to hold money in cash or near cash form rather than investing it.
- Exogenous (Discretionary) money supply: Money supply which is fixed and determined by issuing authority such as central bank.
- Endogenous (automatic) money supply:The money supply determined by the level of economic activities.
- Full bodied money: Money whose real value is equal to the face value.
- Fiduciary issue: Money issued by the bank to settle debts and obligation but not backed by gold.
- Fiat money: Money issued on the directives of the government irrespective of the level of economic activities.
- Hard loan: One which is given at a market interest rate with a short repayment period.
- Liquidity preference: The desire to hold money in cash or near cash form than investing it.
- Money:Anything that is generally accepted as a medium of exchange for the goods and services and in settlement of obligations.
- Money supply: The total amount of money in circulation together with that money held by commercial banks plus quasi money.
- Money market: One in which short-term financial assets are exchanged.Nominal money: Money expressed in units such as francs, shillings and dollars, among others.
- Optional money:Money which is generally accepted by the public e.g. cheques.
- Quasi/ near money: Assets which can easily be converted to cash.e.g. cheques, treasury bills, bonds etc.
- Real money: The purchasing power of nominal money. Or the amount of goods and services that nominal money can buy.
- Soft loan: A loan which is given at a lower interest rate than the rate at the market and usually with a long repayment period of time.
- Token money:Money whose real value is less than the face value.
Unit summary
• Meaning and evolution of money• Barter trade• Meaning• Conditions• Advantages and disadvantages• Money types• Qualities of good money• Functions• Demand for money• Keynes theory• Quantity theory of money• Fisher’s theory• Value of money• Determining interest rateUnit 6: FINANCIAL INSTITUTIONS
Key unit competence: Learners will be able to describe the role of
financial institutions in economic development.
My goals
By the end of this unit, I will be able to:- Distinguish between banking and non banking financial institutions.
- Identify the different types of bank accounts and how commercial banks reconcile liquidity and profitability security.
- Distinguish between assets and liabilities of commercial banks.
- Explain the functions, role and limitations of commercial banks in Rwanda.
- Identify the role of foreign commercial banks in Rwanda.
- State the functions of the Central Bank of Rwanda.
- Explain the objectives and tools of monetary policy.
- Give examples of non banking financial institutions in Rwanda.
- Assess the role of the different types of financial institutions in an economy.
- Examine the conflicting ideas of profitability and liquidity for commercial banks.
- Describe the process of credit creation in commercial banks.
- Examine the applicability of monetary policy tools in Rwanda.
- Describe the operation of financial markets in Rwanda.
- Recognise the role of financial institutions in economic development and be a responsible citizen in relation to financial matters.
6.1 Financial institutions
6.1.1 Meaning
Financial institutions are institutions which bring together borrowers and lenders of money. Financial intermediaries can be described as those institutions, which stand between savers and borrowers, integrating and satisfying the interest of both.They accept time and saving deposits from customers and lend out money on a longer term basis. They transfer funds from those with surplus money balances to the would-be borrowers who wish to use these funds for investment or consumption purposes. They deal in primary and secondary securities.Activity 1
Using photographs a, b and c in figure 1 below, identify the following:1. What do the institutions below deal in?2. What are financial institutions?3. What are the functions of such institutions in Rwanda?4. Give any other institutions that deal in such an activity in your locality.5. Classify the various financial institutions in Rwanda.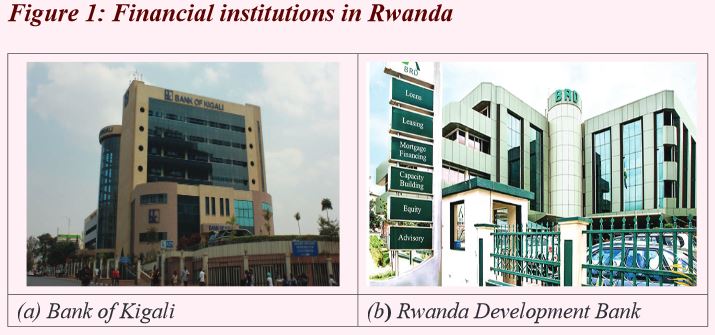

6.1.2 Types of financial institutions
There are basically two types of financial intermediaries and these include:1. Banking financial intermediaries such as commercial banks and the central bank; and2. Non-banking financial intermediaries.Functions of financial intermediaries
Specifically, financial intermediaries have vital roles to play in a modern economy which include:• They act as a go-between savers and borrowers. They facilitate direct contact between savers and borrowers.• They purchase government bonds and securities.• They improve the utilisation of scarce resources by providing facilities for investment in plant, equipment, and so on,through loans, mortgages, purchases of bonds share.• They spread their risk between different borrowers; create financial assets and substantially add to the stock offinancial assets available to the lenders.• They provide liquidity easily and quickly through the conversion of an asset into cash without any loss in their value.• They maintain equilibrium between the demand and supply of financial assets, bring about stability in the capital market;• They increase the liquidity of the financial system. Financial intermediaries increase the liquidity of the financial systemthrough giving out loans. They also invest the proceeds into treasury bills, bonds, business firm shares; and• They facilitate the pooling of risks. Lending is wrought with risks. Important among these is default by borrowers.In asituation where individual savers would have to find corresponding borrowers, the risk of one losing the savings wouldbe high.6.2 Banking financial institutions
Activity 2
Using photographs a, b and c in Figure 1 on page 182-183, individually work in your exercise books.1. What are banking financial institutions?2. Name the examples of commercial banks you know in Rwanda.3. What is the relationship is between photographs a b and c?4. What are the functions of commercial banks in Rwanda?5. Name the different accounts run by commercial banks.6. Which account would you open up and why?Facts
Banking financial institutions are institutions which receive deposits from the public; give loans on short-term basis and create new deposits by loaning more amounts of funds deposited by customers. They include:1. Commercial banks2. Central banks.6.2.1 Commercial banks
These are financial institutions that provide retail banking services such as providing types of accounts for their customers and facilitating a payment mechanism. Examples are Fina Bank, Eco Bank; Banque Populaire du Rwanda SA (BPR), Bank of Kigali-BK, Access Bank Rwanda, Commercial Bank of Africa (Rwanda), Guaranty Trust Bank (GTB), I&M Bank (Rwanda), Crane Bank Rwanda, etc.Functions of commercial banks
Credit creation
In this role, the commercial bank accepts deposits and lends money out (grant loans) at an interest.Transmission of money
Commercial banks provide facilities for domestic and foreign transfer of money. Provision of such facilities can be done through issuing of cheques, credit transfer, standing order, or direct debit transfer. Banks can also transfer funds outside the country by making payments abroad on behalf of their customer thus facilitating international trade. They sell traveller’s cheques to their customers wishing to travel abroad.Advisory services
Banks also offer advisory services to their customers usually charging for these services. The rangeof such services includes: trusteeship, foreign exchange, and investment management, among others.Other financial products Commercial Banks can offer other financial products to their customers such as mortgagesand insurance.Provision of credit facilities
Commercial banks channel the accumulated funds or deposits received under the different accounts into productive usesin the form of loans, advances, overdraft facilities and cash credits to their customers.Provision of facilities for safekeeping deposits
Commercial banks provide facilities for safeguarding of valuables like jewelery and documents such as land titles. They also look after the property of dead customers and distribute their assets as laid down in their respective wills.Open up and run different accounts
Commercial banks open up and run different accounts on behalf of their clients. These accounts include:1. Current accounts: The opening of a current account provides the customer with the facilities of drawing cheques, arrangingfor regular payments by standing orders and having payments such as salaries credited direct into the account.2. Savings accounts: The main feature of this account is that it stipulates a minimum/maximum monthly subscription whichmust be maintained for a set term usually a minimum of 12 months.3. Fixed deposit accounts: Here the customers deposit a certain amount of money for a period of time without withdrawingit. There is a high interest earned on this deposited money. The money is only withdrawn after a certain period of time.Liquidity and profitability in commercial banks
Activity 3
Visit any of the nearest commercial bank branches in your locality. Research on the following:1. How do commercial banks reconcile the conflicting objectives of liquidity and profitability?2. What is the difference between assets and liabilities of a bank?3. Give examples in each case.Facts
Each commercial bank has to maximise its profits without losing sight of its liquidity. Therefore, commercial banksmust be highly efficient in their portfolio management by maintaining an optimum balance between the two conflictingobjectives of liquidity and profitability.Liquidity: Liquidity is the bank’s ability to convert its assets into cash quickly without any loss of value. The presence of a high proportion of liquid assets in the total assets of a commercial bank is a sign of its strength. Liquid assets are assets which can conveniently, easily and quickly be converted into cash. The higher the proportion of such assets, the lower the liabilities of a commercial bank and vice versa. This partly means that the bank cannot invest most of its funds in long-term projects or securities. It also implies that the bank will be unable to earn high profits. Therefore, a commercial bank must manage its objectives of liquidity so as to gain public confidence and, therefore, the bank should keep all its deposits in cash or in a liquid form, i.e. near cash.Profitability:Profitability is the prime goal of any commercial bank. All its operations must bring income to enable it to meet its running costs; make payments of interest to its depositors; and yield reasonable return to its owners. Therefore, the bank should manage its portfolio in such a way that it maximises its profits.Liquidity-profitability dilemma
The objectives of liquidity and profitability are conflicting in nature. They are not compatible. A bank can either achieve the objective of liquidity or that of profitability but not both. Cash, money at call and short notice and bills are all liquid assets, in varying degrees, but they yield very low income or bring very low profits to the bank. Loans are quite profitable but are less liquid and investments fall in between these two.Banks must be prepared to make payments to its customers as and when they are needed by maintaining a high degree of liquidity, that is, it should have all its funds as cash reserves. However, this will not bring any profits to the bank. On the other hand, banks want to maximise profits by investing their funds in long-term assets, with high profitability but less liquidity. Thus the Liquidity-profitability dilemma.How commercial banks balance liquidity and profitability
Given the conflicting nature of the above objectives, the bank has to act very carefully to strike an optimum balance.To solve this conflict, the bank does the following:• Maintains a certain percentage of deposits in cash form (cash reserve ratio) to cater for the withdraw needs of customers –This maintains liquidity while the lent out amount caters for the profitability interests of the bank.• Maintains reserves at the central bank so that in case it is unable to meet the liquidity needs of depositors, it may make useof such reserves.• The bank may invest in security and other assets in an effort to make profits. However, the bank should make sure that whileit invests for profits, it invests in liquid assets which can easily be turned into cash in case need arises for liquidity, thus strikinga balance between liquidity and profitability.• As commercial banks lend out money in form of loans, it advances them in such a way that they receive repayments moreregularly, e.g. advancing both short-term, medium-term and long-term loans to ensure a regular and constant payment system.• Commercial banks set a minimum deposit balance on the customers’ account below which customers are not allowed to draw.This maintains sufficient liquidity since accumulated balance cannotbe withdrawn, pool up to a large sum that can meet theliquidity needs of depositors.• Commercial banks borrow from the central bank, as a lender of the last resort, in situations where they are unable to meetthe daily needs of its customers.• Commercial banks invest in non-banking activities such as transport, buildings, industries, etc. so as to maintain profitabilitythrough earning extra money to supplement bank activity-generated revenue.• Commercial banks charge a fee for the services they provide as a means of raising more revenue to increase profitability andliquidity e.g. bank statements, ledger fee cheques clearing, ATM withdrawals, storage of valuables, etc.
• Commercial banks discount bills of exchange and earn a profit at the maturity of the bills, i.e. buy the bills from holders atless than their value of maturity, thus achieving profitability.• Paying low interest to depositors and charging a high interest on borrowers, thus making profits and bringing in cash.• Demanding collateral security to avoid loss of money.Assets and liabilities of commercial banks
AssetsThese are possessions of the bank plus its claims on other financial institutions and clients. They include:• Cash in hand and reserves with the central bank;• Deposits with other banks and non-banks;• Loans advanced and overdrafts to customers; and• Fixed assets and long-term investments.LiabilitiesThese are claims by the outside world. Or they are properties that belong to the people but not the bank. They include:• Money on fixed, current and saving accounts;• Deposits by other banks and non-banks; and• Government deposits in the bank.Credit creation by commercial banks
Activity 4
Visit any nearest commercial bank branch in your locality. Research on the following:1. What is meant by credit creation?2. How do commercial banks create credit?3. What are the factors that determine ability of commercial banks to create credit?4. Analyse the difficulties met in the process of credit creation by commercial banks in Rwanda.Facts
Credit creation is the process by which commercial banks create credit by lending out money using cheques.OR It is the process by which commercial banks create additional deposits by way of extending loans to borrowers.The volume of money accumulates with time basing on the interest charged.Commercial banks are required to keep a certain amount of money to meet the daily requirements of its customersand this is known as cash ratio.Assumptions of credit creation
• Assumes one bank with many branches which have cooperation among themselves;• A certain cash ratio is given and maintained;• All banks are willing to advance loans to the borrowers who meet the minimum conditions for borrowing;• All payments are made through the banks using cheques;• The money that the bank loans out is deposited back in the same bank or another bank;• The public is willing to borrow from banks; and• There should be no government interference.Example
Assume a single bank with an initial deposit of 10,000 FRW with a cash ratio of 20% and 4 people A, B, C and D.(a) Describe the process of credit creation.(b) Find the rate of credit multiplier and final deposit.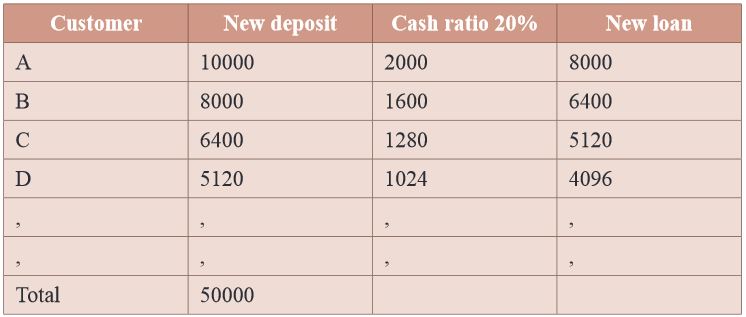 Customer A deposited 10000 FRW to the bank. The bank kept 20 %( 2000) as cash ratio and lent out 80 % (8000) to customer B. Customer B deposited the same cheque in the same bank. Out of 8000 FRW, the bank kept 20% (1600) as cash ratio and loaned out 6400 to customer C. The process continues until no further loans are available for lending out.Note The number of times initial deposit multiplies itself to give a final depositis called credit multiplier (cm).
Exercise
Work out, and interpret the following in your exercise books:1. Given a cash ratio of 20% and an initial deposit of 10,000.Calculate the credit multiplier and final deposit.
2. Given that the initial deposit in the bank is 20,000 FRW and the total credit created amounts to 100,000 FRW.Calculate the credit multiplier.3. Given that the final deposit is 80.000 FRW, and cash ratio is 20%, calculate the initial deposit. Given the initial depositof 20.000 FRW and credit multiplier of 4, calculate the total credit created.Determinants of commercial banks’ ability to create credit
Deposits make loans and loans make deposits. Nevertheless, commercial banks do not have limitless powers to create credit. The ability to create credit is thus determined by many factors which include the following:Conditions of trade and business in the economy
During times of business prosperity when opportunities for profitable investments are greater, there is a high demand for bank loans from individuals and businesses, thus banks are better positioned to create more credit. Contrariwise, during periods of recession, because of the limited scope of profitable investments, the demand for credit is low, thus the powers to create credit are diminished.Banking habits of individuals (Whether people believe in the use of cheques or cash)
The power of a commercial bank is reduced if people are accustomed to the use of cash in their transactions. On the other hand, the power of a bank to create credit is harnessed if there is increased use of cheques.Availability of good securities
If there is availability of adequate amounts of valuable collateral, for instance stocks, bill, bonds and shares, commercial banks can expand their lending activities and hence their powers to create credit are augmented. And if securities are not available in adequate amounts, then their powers for credit creation are limited.Willingness to deposit (propensity to deposit)
If individuals are willing to deposit, then credit creation will be high and vice versa.Cash reserves
The power of commercial banks to create credit depends on the cash reserves. The larger the cash reserves,the greater the credit creation and vice versa.Cash ratio
Cash ratio is the proportion of cash kept by commercial banks to meet the daily requirements of the customers. If the cash ratio is high, there will be less credit creation and vice versa.Propensity to demand loans
If the propensity to demand loans is high, then credit creation will be high and vice versa.The country’s monetary policy
If the country pursues an expansionary monetary policy, credit creation is likely to be high. However, if the country is pursuing a restrictive monetary policy, credit creation will be limited.Limitations of commercial banks to create credit in Rwanda
• Difficulty in mobilising savings because of widespread poverty among the people and this reduces money available tolend out.• Illiteracy of the people who do not keep their money in banks and do not know the operations of the banks.• Too much government interference in the activities of the banks makes it hard for them to carry out their activities.• Existence of a large subsistence sector which does not generate enough incomes to the people necessary to savein the banks.• Lack of credit worthiness among borrowers – Some people take loans from the banks and fail to pay back hence banksget losses.• Too much liquidity preference. People prefer to hold money in cash rather than depositing it. This reduces the moneyavailable with the commercial banks to lend out.• Low demand for loans because of lack of collateral security such as land, and other property.• Inflation which limits saving because money may have lost value so people prefer to invest than saving.• High competition for customers because most of them are located in urban centres and this leads to low deposits; and• Poor infrastructure characterised by poor roads, telecommunication all limiting the activities.Role of commercial banks in Rwanda
Activity 5
1. Analyse the role of commercial banks in the development process of Rwanda.2. State the problems that hinder the smooth operation of commercial banks activities in Rwanda.3. Suggest measures that can be taken by the government of Rwanda to boost the banking sector.Facts
In addition to the services that commercial banks provide to the public, they play a big role in fostering the economic development of Rwanda as below:• They advance short-term and long-term loans to the business community. This facilitates new investment and expansionof the existing ones, thus promoting economic growth and development.• They also offer loans to customers to improve their standards of living, e.g. to purchase houses, and other expensiveconsumer goods that they otherwise could not afford.• They create employment opportunities by employing people as auditors, accountants, managers, tellers, drivers, securityguards, cleaners, etc. This helps solve the unemployment problem in Rwanda.• They mobilise savings from the public by paying interest on deposits. This encourages flow of funds from savers to borrowers,therefore, encouraging productive investment activities that promote economic growth and development in the country.• Commercial banks provide technical and professional advice to customers, i.e. investors and business people, which helpsthem make sound investment decisions, e.g. on best projects to be financed and efficient running of companies, thus creatinga healthy and efficient economy.• Commercial banks pay taxes to the government from their profits made, of which revenue is used to finance variousgovernment expenditures.• Commercial banks facilitate international and domestic trade by making available foreign exchange, letters of credit andmoney transfer services. This increases the flow of technology, ideas and skills and other resources in the country thatfacilitates increase in the productive capacity of Rwanda.• Commercial banks act as agents of the central bank to implement monetary policy since they deal directly with the public.This enables the government through the central bank to regulate economic activities within the economy and achieve specificdevelopment goals, for example, controlling inflation in Rwanda• They receive payments for their customers, for instance, salaries which promotes effective and efficient planning byconsumers and producers.• Commercial banks facilitate quick and easy means of payments through use of cheques and standing orders. This helps tocreate money in the public without the central bank having to print more currency.• They help keep valuable documents and articles of customers such as marriage certificates diplomas, wills, etc.• They manage the property of the deceased customers and distribute assets as laid down in the will. This avoids conflict andsocial tension among the public, thus bringing about peace and harmony that is necessary for a conducive investment climatein an economy.
• They help in transforming the economy from a subsistence economy to a monetary economy especially in rural areasthrough advancing loans to the public for productive activities. This calls for the establishment of banks in most ruralareas, thus promoting development.• They promote technology in the economy, for example through the use of ATMs, SMS banking, all which bring abouteconomic development of the country.• They facilitate the process of capital formation through the promotion of savings and investment. This, therefore,expands productivity in the economy and breeds economic growth and development.Limitations of commercial banks in Rwanda
Much as the banking business in Rwanda provides a lot of benefits to the Rwandan economy, it is faced with many problems which limit its operation and they include, among others, the following:High liquidity preference among the public
Many people in Rwanda prefer to hold wealth in cash than depositing it with the commercial banks. This reduces the volume of transactions the commercial banks handle, thus reducing their would-be profit earnings to sustain their activities.Unfavourable policies against private commercial banks
In Rwanda, there is a rate of taxes charged on commercial banks which reduces their profit margin, thus adversely affecting their operation.Lack of well qualified, competent and trustworthy employees for commercial banks
The qualified personnel at times tend to be corrupt and end up misusing the banks’ resources.Stiff competition in the banking business
This has led some banks to reduce on the interest rate on loans, increase interest on deposits and introduce very many services. This has increased operating costs, reduced profit and in some cases, banks have even failed to meet running costs, leading to their closure.Low savings
In Rwanda, due to massive poverty, the level of savings and deposit is low. This has greatly affected the commercial bank in sustaining its operations due to insufficient deposits.The subsistence nature of most Rwandan societies
This, together with ignorance of most people in Rwanda, has greatly affected the banking activities in Rwanda.The prevalent fear of borrowing and loaning culture
Many people in Rwanda are unwilling to go for loans due to limited investment opportunities. This greatly affects the lending potential of commercial banks thus lowering their profits as well.Poor communication network in form of roads, telephone system and internet connections
This makes the flow of information and transactions difficult between or among the commercial bank branches countrywide.Bureaucracy, inefficiency and arrogance by some bank officials
This has scared away the would-be customers in some commercial bank branches in the country, thus hindering their operation as well.Banking conditions
Some commercial bank conditions tend to discourage the would-be customers who may wish to open up accounts with commercial banks, for example, a high minimum initial deposit.High marginal propensity to consume ( MPC)
In Rwanda, there is a high MPC implying a low MPS, thereby limiting commercial banks capacity to mobilise adequate savings.High government interference
The government of Rwanda at times has fixed high interest rates in order to fight inflation, as opposed by commercial banks, thereby discouraging people from getting loans from commercial banks.Insecurity
In most LDCs and Rwanda inclusive, there is political insecurity which has always scared people from depositing their money in the banking system thus reducing on operations of commercial banks.The role of foreign commercial banks in Rwanda
Activity 6
Using the photographs in Figure 2 below, identify and explain the following:1. What name would you give to such institutions?2. Give other examples of such banks in your locality or country.3. Through a whole class debate, examine and present the role of such institutions to the development process of Rwanda.

Facts
Foreign commercial banks are banks which have headquarters in outside countries, but have several branches in different countries. Banks incorporated in Rwanda include:• Kenya Commercial Bank (KCB),• Eco Bank,• Equity Bank,• Guaranty Trust Bank,• Crane Access, Etc.Foreign commercial banks have both positive and negative role in the development process of Rwanda as explained below.Positive role
• They attract foreign investors through transferring their money easily and safely from their countries of origin. This givesforeign investors confidence about the security of their investments.• They increase foreign exchange necessary for facilitating international trade, i.e. foreign commercial banks are able to bringforeign exchange into the country from their home country which makes it easy for importers to access it at favourable rates.• They promote increased efficiency through competition among the local banks. Thus better services and products producedby foreign commercial banks have been extended to local ones, for example use of ATMs, Internet banking, etc.• They provide employment opportunities to local professionals such as managers, accountants, loans officers, auditors,supervisors,tellers, drivers, etc. which increases their experience and soon or later use such skills/experience inmanaging/operating local commercial banks.• They promote international understanding among countries through movement of staff from one country to another,soliciting aid and loans from home countries. This, therefore, promotes cooperation and mutual understanding amongcountries in which they operate.• They have a responsibility by which they help the disadvantaged groups, protect environment, promote sports,education and health through their various programmes such as sponsoring students, donating scholastic materials,computers, building hospital wards, and giving relief supplies during times of hardships to people.• They contribute revenue to the government through taxation especially large-scale operations which pay a lot of taxesto the government.• They increase the level of savings as they mobilise savings from both rural and urban population.• They improve technology with their sophisticated equipment. Thus, they may encourage development of indigenoustechnology.• They facilitate international trade through providing documentary credit, bank drafts, telegraphic transfers, etc.• They contribute to the expansion and extensive modernisation of the existing infrastructure such as roads, communicationnetworks, power, etc.• They help in monetising the economy by reducing the subsistence sector through extension of credit facilities to the localpopulation to engage in economic activities.Negative role
• Foreign commercial banks worsen the unemployment problem of local skilled manpower because they tend toemploy people from their countries of origin at the expense of local manpower for top management, leaving citizens forlow level jobs.• They are discriminative towards individuals and firms from the home country of the banks in their service renderingfor example, giving letters of credit, charging different interest rates and general attention and services at the bank counters.• They are mostly urban-based thus leading to regional imbalances, i.e. urban against rural areas.• Foreign commercial banks repatriate their profits to their home countries which deprives the host countries of thealready scarce financial resources which limits domestic investments.• They enhance rural urban migration since they are mostly located in urban areas. Local people will, therefore, moveto enjoy their better and efficient facilities and services offered in urban areas. This deprives the rural areas of developmentopportunities.• They mostly follow policies and guidelines from their headquarters, of which policies normally conflict with the hostgovernment’s policies especially in implementing monetary policies.• They outcompete the local commercial banks, through more resources, skilled manpower, funds and better technology.Such stiff competition may result into failure to attract new clients and retain the old ones thus ending up closing down.This also causes unemployment and discourages further entrepreneurship in the local investors.6.2.2 Central bank Activity 7
Visit the library or Internet, basing on the photographs in figure 3 on page 202.1. What is a central bank?2. The Central Bank of Rwanda is called:(a) Bank of Kigali (c) Bank Populaire(b) National Bank of Rwanda (d) coins and notes3. Explain the functions of the Central Bank of Rwanda.4. Distinguish between commercial banks and the central bank.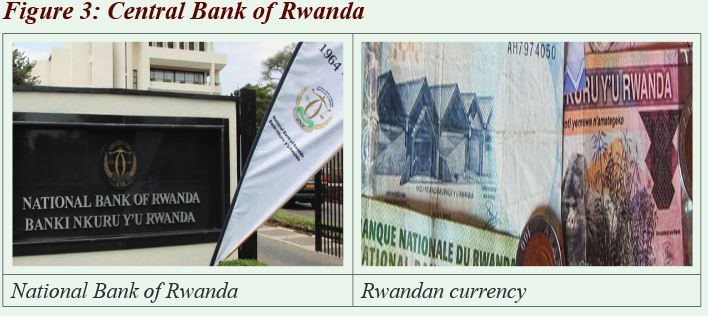
Facts
A central bank may be defined as that central monetary institution responsible for the management of the monetary systemof the country. It is an institution, which controls all other banks in the country. A central bank is an institution formed by the government with wide ranging powers including the issue of currency and control of other financial institutions in the country. NBR is the central bank of Rwanda.Functions of central banks
Most central banks perform various functions which include the following:Acts as government banker, fiscal agent and advisor
Central Banks in all countries act as the fiscal agent, banker and advisor on all important financial matters to governmentsof their countries. It conducts the banking accounts of government departments and enterprises; is financial advisor to the government; manages the national debt; and conducts transaction on behalf of the government involving the purchases orsales of foreign currencies.Banker’s bank
A central bank accepts deposits from commercial banks and will, on order, transfer them to the account of another bank. In this way, the central bank provides each commercial bank with the equivalent of a checking account and with a means of settling debts to other banks.It acts as a banker to overseas central banks and international financial institutions, for example, the World Bank, the IMF, etc.Issue of the country’s currency
A central bank enjoys the monopoly of the issue of a country’s currency. No bank other than the central bank is authorised by law to print currency notes. This allows the central bank to have control over the excessive credit expansion by commercial bank and allows for the issuance of uniform currency, thereby achieving the homogeneity characteristic.Lender of last resort
Acts as a lender of last resort to commercial banks and other financial institutions when they run out of cash. In its capacity as the lender of the last resort, the central bank meets all reasonable demands from commercial banks by providing temporary liquidity to commercial banks by making short-term loans to them.Keeps a nation’s foreign exchange reserves
A central bank performs this function in order to keep a favourable balance of payments and to maintain a stable exchange rate. It maintains the stability of internal and external value of the currency.Controller of credit
This is one of the major functions of a central bank. The central bank controls credit by means of various monetary policy instruments such as open market operations, bank rate, legal reserve requirements, moral suasion, selective credit controland special deposit. This is done by supervising the activities of commercial banks and other financial institutions.Bank of central clearance, settlement and transfer
Central clearance implies that it settles the differences of a financial nature between the various commercial banks by making transfers of accounts at the central bank since commercial banks keep their surplus cash reserves with the central bank. It is easier to clear and settle claims between them by making transfer entries in their accounts maintained with the central bank than if each commercial bank entered into separate clearance and settlement transactions with other banks individually.Differences between a central bank and commercial banks
• A central bank is established for public service. Its operations are not basically guided by the profit motive. A commercialbank is guided by the profit motive.• A central bank is responsible to the government whereas a commercial bank is responsible to its shareholders.• A central bank controls other banks while a commercial bank does not. I.e. the central bank has a supervisory roleover commercial banks.• A central bank is the only body legally permitted to issue a nation’s currency. Commercial banks are not permitted.• A central bank does not compete with commercial banks for business and will usually maintain the governments account.• A central bank generally does not deal directly with the public. It deals with the public indirectly through commercial banks.Commercial banks deal directly with the public.• A central bank acts as a lender of last resort to commercial banks when they are in liquidity problems.• A central bank can formulate and execute a monetary policy whereas a commercial bank does not.• A central bank is exclusively owned by the government, and it has a special relationship with the government of the country.A commercial bank can be owned by the government or individuals.• A central bank deals directly in the foreign exchange market. All foreign exchange earnings are submitted to it and it thenmeets the foreign exchange requirements of individuals, firms and commercial banks. Commercial banks do not deal directlyin the foreign exchange market. If they want to transfer money to foreign countries, they do so through the central bank.• A central bank is a banker’s bank unlike a commercial bank.Role of central banks
Activity 8
Examine the role of the Central Bank of Rwanda in the development process of the economy.Facts
In addition to its traditional functions, the central bank plays crucial roles in development. These include:• The central bank helps the government in the economic planning process. It provides the necessary financial economicdata which greatly facilitates government in its planning process.• The central bank develops the financial sector for example, it encourages the development of commercial banks whichtend to extend credit to stimulate rural activities for the mobilisation of domestic capital required for economic development.• The central bank through its monetary policy tools, such selective credit control, helps channel credit to the priority areasaimed at improving productivity and investment.• It regulates and controls the supply and demand for money with the objective of attaining high growth rates in GDP,adequate employment opportunities, price stability, etc.• Through favourable rate policies aimed at foreign exchange stability, both the public and private sectors are encouragedto save and invest, thus promoting economic growth and development.• It educates and trains bankers which increases efficiency in the banking sector.Monetary policy
Activity 9
Visit the school library or the Internet and research on the following:1. What is monetary policy?2. Explain the objectives of monetary policy in Rwanda.3. Explain the monetary policy tools that the Central Bank of Rwanda has used in attaining the monetarypolicy objectives stated in (2) above.4. To what extent are the monetary policy tools applicable in Rwanda?Facts
Monetary policy is the management of demand and supply of money together with the rate of interest in order to influence the level of economic activities. Monetary policy as an instrument of economic stabilisation has been used by various countries to manage their economies. Monetary policy is exercised by the central bank through various tools of monetary authority.Objectives of the monetary policy
• To maintain domestic price stability;• To influence the level of employment and attain full employment;• To influence the balance of payment position of the country;• To ensure stability of foreign exchange in the country;• To influence the nature and levels of investment in the country;• To encourage growth of the financial sector;• To achieve economic growth;• Ensure that government deficits are financed at low interest rates;• Create a broad and continuous market for government securities;• Maintain a continuously low structure of interest rates;• Encourage the public to save a larger fraction of its real income; and• Provide credit at differential interest rates.Tools/instruments of monetary policy
The central bank has a number of instruments, which can be used to control credit.The following are some of the tools/ instruments of monetary policy:1. Bank rate/discount rateThis is the interest rate at which the central bank advances money to commercial banks whose reserves are temporarily below the required level. To lower the amount of money in circulation, the central bank increases the rate, therefore, increasing the rate at which banks give loans to the people. To increase money in circulation, the central bank lowers the rate and also the commercial banks lower the lending rate for people who borrow.2. Open market operations (OMO)This involves buying and selling of treasury bills and bonds to the general public. This is done in order to curb deflationary and inflationary pressures in the economy. When the government wants to increase money in circulation, it buys securities from the people while selling the securities to the people will reduce money from circulation.3. Legal reserve requirement (LRR)This is the amount of money which by law is supposed to be kept by commercial banks in the central bank. When the central bank wants to reduce money in circulation, it increases the legal reserve requirement, while reducing the legal reserve requirement will increase the money available to lend out.4. Special depositsThe central bank may require commercial banks to create special deposits over and above the reserve requirements. This will reduce the amount of money available to lend to the people, hence reducing money in circulation. This is done during inflation.5. Moral suasion
This is the issuing of persuasive instructions by the central bank to commercial banks soliciting their co-operation in making its monetary and credit policy successful. The central bank informally asks the commercial banks to contract credit during inflation, and to expand credit during a slump. Although not backed by law, commercial banks will always agree.6. Selective credit control
The central bank can instruct commercial banks to favour or disfavour certain sectors to control the flow of credit into different activities in the economy. It aims at encouraging certain productive activities and discouraging others. The central bank issues directives to commercial banks to give or not to give loans for any specific purposes.7. Marginal reserve requirement (MRR)This is collateral security (requirement) needed by the commercial banks before giving out loans. When the banks want to increase money in circulation, it sets a lower requirement while to reduce the amount of borrowing, the bank asks for a high margin requirement.8. Currency reformThis is the last policy carried out when all others have failed to reduce money in circulation. Here the central bank introduces a new note (currency) to replace the worn out notes or (money that has lost value). One single note will be equal to large sums of currency which has lost value. People are required to take back the old notes for new currencies.Applicability of monetary policy tools
Some monetary policy tools have efficiently helped in achieving monetary policy objectives in Rwanda. This is seen below;1. Open market operationsThis consists of the BNR intervention on the money market to mop up or to inject liquidity in the banking system and keepthe reserve money on the desired path.These open market operations include notably repos or reverse repos operations, treasury bills issuance, standing deposits facility and standing lending facility and refinancing window.2. Reserve requirementsDepository institutions (commercial banks) are obliged to hold minimum reserves against their liabilities, predominantly in the form of balances at the central bank. There are three reasons for imposition of reserve requirements (RR): monetary control, liquidity management and prudential. The current reserve requirement ratio is 5% . Changes in reserve requirements affect the liquidity of the banking system and its capacity to create loans.3. Foreign exchange interventionThe National Bank of Rwanda intervenes in the foreign exchange market, among other reasons, in order to defend the exchange rate and to achieve a desired amount of international reserves. The intervention in the foreign exchange market directly affects reserve money and hence has a direct impact on overall liquidity in the economy and the stance of monetary policy.Limitations of monetary policy in RwandaThe implementation of monetary policies in Rwanda has not been very successfuldue to many reasons which include some of the following:• Existence of large subsistence sector which limits the operation of the monetary policy, since most transactions arestill carried out through barter exchange.• Most commercial banks in Rwanda are foreign-owned or act as branches of other banks abroad. This means thattheir liquidity needs are addressed by their mother banks abroad which make implementation of monetary policies difficult.• Corruption and lack of self-commitment among bankers which makes some monitory policy tools ineffective,for example selective credit control, as loans go to non-priority sectors.• High rate of liquidity preference among people due to ignorance and or general lack of confidence in the banking sector,thus making it difficult to implement the monetary policy tools.• Lack of collateral security by most people in Rwanda to act as guarantee for loan acquisition hence few qualify for loans.Therefore, even if the central bank wanted commercial banks to increase the level of lending, many people will not qualifyfor bank loans since they lack collateral security.• Limited investment opportunities together with an unconducive investment climate that discourages people fromgetting loans, for example, high interest rates on business loans, high taxes on investors, etc. which make monetarypolicy tools ineffective.• Poorly developed money markets which renders some tools ineffective such as Open Market Operation (OMO),therefore there will be no buying and selling of securities and thus the central bank cannot use such a policy to regulatethe amount of money in circulation.• Most people in Rwanda prefer investing their money in real assets such as land, cattle, houses, etc. than saving itwith banks. This is due to low interest given to depositors thus discouraging them from saving and thus affecting theoperation of monetary policy tools.• Conflict between political interest and monetary policy. The government in most cases wants to increase wages ofworkers, increase prices of agriculture products, etc. However, such policies may conflict with the existing monetary policy.• Insufficient supervisory capacity of central bank over commercial banks that leads to excess liquidity with commercialbanks thus ending up giving excess credit than what the central bank would wish to.• Existence of insecurity which leads to high economic uncertainties and thus reducing deposits with the commercialbanks, therefore, affecting the success of monetary policies.• Poor infrastructure in some parts of the country which reduces the bank services thereby reducing savings mobilisationin rural areas; and• Foreign interference that affects the smooth operation of central bank and execution of monetary policies as exemplified byconditions from the World Bank, the IMF and other donor agencies.6.3 Non-banking financial institutions (NBFIs)
Activity 10
Visit the library or Internet. Using photographs in Figure 4 below, identify and explain:1. The name given to such institutions.2. Give other examples of such institutions in your locality and Rwanda in general.3. What are the functions of such institutions?
Facts
Non-banking financial institutions (NBFIs) are financial institutions that accept deposits from people but do not create credit.They include development banks, for example Banque Rwandaise de Development (BRD), insurance companies, cooperatives, post office savings bank, housing and building societies, credit and savings societies, discount houses, and development housing companies, for example Housing Bank of Rwanda.These institutions operate in all sectors of productive investment in the economy of Rwanda, for example agriculture and livestock, manufacturing industry, education and health, ICT, transport and related facilities, micro finance, etc.Examples of non-banking financial institutions
Development Bank of Rwanda, commonly known as Banque Rwandaise de Development (BRD)The Development Bank of Rwanda began its operation in 1967, as a long-term financial service provider, with the financing geared towards national development projects.As of April 2011, the total assets valuation was approximately 72 billion, FRW with shareholders’ equity of approximately 25 billion FRW. The BRD has undergone re-structuring, re-Organisation and re-capitalisation, to repair the damage incurred during the 1994 Rwanda genocide. It has also financed rural development projects, since almost 90% of the population live in rural areas.Insurance companies
These are business institutions that provide coverage, in form of compensation resulting from loss, damages, injury, treatment, or hardship in exchange for premium payments. They pool clients’ risks to make payments affordable for the insured. The role of the insurance companies has been very remarkable in mobilisation of savings and investments in the social sector for so many years. They also offer various types of services ranging from life, retirement fund and medical fund, automobile, to property coverageThere are many insurance companies in Rwanda for example La Rwandaise d’Assurance Maladie (RAMA), SONARWA SA, SORAS SA, Phoenix, AAR Health Services, Military Medical Insurance (MMI), Prime Life Ltd, etc.Savings and credit co-operatives organisations (SACCOS)These are co-operatives formed to mobilise savings from members and lend some of the savings to members. Members normally make deposits on a weekly or monthly basis. They provide financial services to their members particularly facilities for saving and borrowing. Because the SACCOs are owned by the members, they are able to charge a lower rate of interest than the commercial banks. In many cases, members must be from a specific geographical location or working in the same industry for example Umurenge SACCO, Umwalimu SACCO, etc.Microfinance institutions (MFI)Micro means very small. Micro-finance or micro lending is defined as the provision of credit to people who are unable to obtain loans or credit from commercial banks because their only security is the fact that they have a regular source of income.In Rwanda, there are many microfinance entities varying from moneylenders,merchants, pawn brokers, loan brokers, burial societies, and savings groups to the more complicated rotating savings and credit associations. All these are run on a very small scale compared to the bigger financial institutions in terms of the amount they handle. Examples of microfinance institutions in Rwanda include:• AB Bank Rwanda, • Zigama CSS,• Agaseke Bank, • Goshen, and• Unguka Bank,• Urwego Opportunity Bank,• Vision Finance Company, etc.Characteristics of MFIs
• They are not deposit taking institutions and are, therefore, self-funding, unlike the formal banks.• Interest rates charged are high compared to formal banks because the average value of the loans is low while costsof granting and administering are high and fixed and a higher incidence of bad debts because of the target market’shigher risk profile.• MFIs operate out of low cost, unsophisticated branches. Customers do not feel intimidated to walk into a branch andare served by tellers who speak their language.Functions special to NBFIs
• Brokers of loanable funds: They intermediate between savers and investors. They sell indirect securities to the savers andbuy primary securities from investors. They thus take risk on themselves and reduce the risk of the lenders because lowreturns on some assets are offset by high returns on others.• Mobilisation of savings for the benefit of the economy: By providing expert financial services such as easy liquidity,safety of the principal amount and ready divisibility of savings into direct securities of different values, they mobilise morefunds and attract a larger share of the public’s savings.• Direct funds into investment channels: By mobilising the general public’s savings, NBFIs channel them into productiveinvestments and this directs public savings into investment, aids capital formation and economic growth.• Stabilisation of capital markets: NBFIs trade in the capital market in a variety of assets and liabilities and in turn equilibratethe demand for and supply of assets. By functioning within a legal framework and rules, they protect the savers’ interests andcreate stability in the capital market.• Provision of liquidity: NBFIs provide liquidity and they do this by advancing short-term loans and financing them byissuing claims against themselves for long periods and diversifying loans among different types of borrowers.Role ofnon- banking financial institutionsActivity 11
Visit the school library or Internet and research about different non-banking financial institutions in Rwanda.
Explain:1. The role of non-banking financial institutions in the development of Rwanda.2. Identify the challenges faced by these institutions in their operations.Facts
• Provision of employment opportunities to the nationals through setting up banks and people are employed asaccountants, managers, loans officers, etc.• Provision of security to property and people’s lives, for example insurance companies;• They act as intermediaries between potential savers and investors which creates assets and liabilities.• They give or offer loans to development production ventures such as small scale industries, agriculture, etc. whichcommercial banks are reluctant to support.• They act as avenues through which the donor, government and non-governmental organisations channel their fundsto facilitate development programmes.• They help in transformation of the rural sector from subsistence to monetary economy.• Non- banking financial institutions are spread all over the country, for instance credit unions, development banks,insurance companies, thus helping in mobilisation of savings which are then channelled to local rural-based projects.• They help in indiginisation of the economy, i.e. they advance loans to local entrepreneurs, women groups, the youth, etc.who are neglected by commercial banks.• They expand government revenue through paying taxes, on which government can invest in development programmes.Challenges of non-banking financial institutions in Rwanda
• Corruption, mismanagement and lack of self-commitment among employees which makes some non-bankingfinancial institutions ineffective.• Lack of credit worthy customers who normally fail to pay back in time or even completely fail to pay back.• High illiteracy and ignorance levels among the majority of the population, thus not able to save with non-bankingfinancial institutions and at times are not aware of services rendered by such institutions.• Government influence through high taxes, interest rate determination, all which do not favour these financial institutions.• Low savings among the population due to poverty among the majority of the population in Rwanda.• Existence of insecurity which leads to high economic uncertainties and thus reducing activities of non-bankingfinancial institutions, therefore, affecting the successful operation.• Poor infrastructure in some parts of the country which reduces the bank services thereby reducing savings mobilisationin rural areas.• High marginal propensity to consume ( MPC): In Rwanda, there is a high MPC implying a low MPS thereby limitingthe capacity of non-banking financial institutions to mobilise adequate savings.• Existence of large subsistence sector which limits the operation of non-banking financial institutions,since most transactions are still carried out through barter exchange.• High competition from banking financial institutions and non-banking financial institutions themselves.• Foreign influence especially from the International Monetary Fund (IMF) and the World Bank.• The prevalent fear of borrowing and loaning culture: Many people in Rwanda are unwilling to go for loans due tolimited investment opportunities. This greatly affects the lending potential of non-banking financial institutions,thus lowering their profits as well;• Lack of well qualified, competent and trustworthy employees for non-banking financial institutions.The qualified personnel at times tend to be corrupt and end up misusing the banks resources.6.4 Financial markets
Activity 12
Basing on photographs below, visit the school library or the Internet, make research and respond to the following:1. What do the institutions in the photographs deal in?2. What are financial markets?3. How are they classified and give examples in each.4. Identify and distinguish the different terms used in financial markets.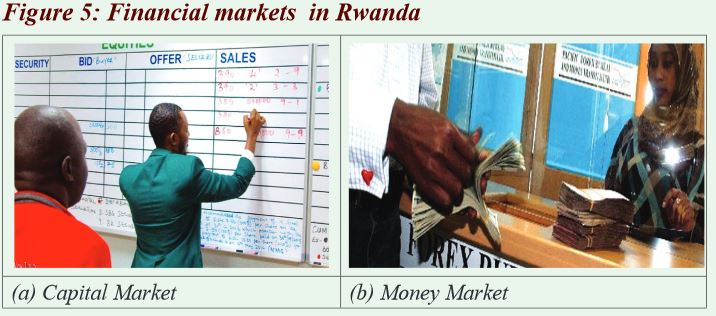
Facts
A financial market is an arrangement of possible buyers and sellers of financial securities such as bonds and treasury bills, commodities, and other fungible items (items that can be substituted for something of equal value or utility).The term “financial markets” is often used to refer solely to the markets that are used to raise finance. They deal in stocks/ shares, bonds, bills of exchange, foreign currency etc. Examples of financial markets include capital markets, derivative markets, money markets, and currency markets.Types of financial markets
There are basically two types of financial markets:1. Capital markets; and2. Money markets.1. Money markets
This is a financial market that gives investors access to short-term debt instruments such as treasury bills for less than one year. Money markets are, mainly accessible for large corporations and financial institutions.2. Capital markets
Capital marketsare markets in which long-term financial securities are traded. These may take mostly above two years to clear. Stock markets and bond markets are two types of capital markets that provide financing through the issuing of shares of stock or the issuing of bonds, respectively. Capital markets provide companies and governments access to long-term funding for expansion and development. Under capital markets, we can further see two different types namely:(a) Primary markets: These are markets that deal in newly formed or issued securities.(b) Secondary markets: These are markets that deal in providing a continuous and regular market for the buying andselling of securities. In other words, it is a market that deals in securities that have been on the market for some time.Terms used in money markets
1. Bank overdraftThis is an extension of credit from a lending institution when an account reaches zero. An overdraft allows the individual to continue withdrawing money even if the account has no funds in it. Basically, the bank allows people to borrow a set amountof money.2. Short-term loanThis is a loan that is scheduled to be repaid in less than a year. When your business does not qualify for a line of credit from a bank, you might still have success in obtaining money from them in the form of a one-time, short-term loan (less than a year) to finance your temporary working capital needs.3. Promissory noteThis is a financial instrument that contains a written promise by one party to pay another party a definite sum of money either on demand or at a specified future date. A promissory note typically contains all the terms pertaining to the indebtedness by the issuer or maker to the note’s payee, such as the amount, interest rate, maturity date, date and place of issuance, and issuer’s signature.4. Bill of exchangeThis is a written, unconditional order by one party (the drawer) to another (the drawee) to pay a certain sum, either immediately (a sight bill) or on a fixed date (a term bill), for payment of goods and/or services received. The drawee accepts the bill by signing it, thus converting it into a post-dated cheque and a binding contract.A bill of exchange is also called a draft but, while all drafts are negotiable instruments, only “to order” bills of exchange can be negotiated.5. Trade creditThis is an agreement where a customer can purchase goods on account (without paying cash) and he or she pays the supplier at a later date. Usually, when the goods are delivered, a trade credit is given for a specific number of days, say 30, 60 or 90.6. Certificate of deposit (CD)This is savings certificate entitling the bearer to receive interest. A certificateof deposit bears a maturity date, a specified fixed interest rate and can be issued in any denomination. Certificate of deposits are generally issued by commercial banks.7. BankerThis is an individual who is engaged in the business of banking especially as an executive or any other official.An investment bankeris an individual who works in a financial institution that is in the business primarily of raising capital for companies, governments and other entities. This is often carried out in an investment bank.8. Treasury billThis is a short-term government security with maturities ranging from a few days to 52 weeks. Bills are sold at a discountfrom their face value.Terms used in capital markets
1. EquityThis means net worth of a person or company computed by subtracting total liabilities from the total assets. In case of cooperatives, equity represents members’ investment plus retained earnings or minus losses. Or it can be defined as, ownership interest or claim of a holder of common stock (ordinary shares) and some types of preferred stock (preference shares) of a company. On a balance sheet, equity represents funds contributed by the owners(stockholders) plus retained earnings or minus the accumulated losses.2. StocksThis is a combination of several shares of a company held by an individual or group. Corporations raise capital by issuing stocks and entitle the stock owners (shareholders) to partial ownership of the corporation. Stocks are bought and sold on what is called a stock exchange market.3. BondsA bond,also known as a fixed-income security, is a debt instrument created for the purpose of raising capital. They are essentially loan agreements between the bond issuer and an investor, in which the bond issuer is obligated to pay a specified amount of money at specified future dates. A bond is normally issued for a period of more than one year and may mature after 30 years.4. DebentureThis is a corporate bond that is not secured by specific property (collateral security). Most bonds issued by corporations are debentures, which are backed by their reputation rather than by any collateral, such as the company’s buildings or its inventory.In case of bankruptcy, the holder of a debenture becomes a general creditor and, therefore, is less likely than the secured creditors to recover in full. Because of their high risk factor, debentures pay higher rates of interest than secured debt of the same issuer.5. Balanced schemesThese are schemes that aim at providing both growth and income by periodically distributing a part of the income and capital gains they earn. These schemes invest in both shares and fixed income securities, in the proportion indicated in their offer documents (normally 50:50).6. Collective investment schemesThis is a fund that is operated by a trust company or a bank and handles a pooled group of trust accounts. Collective investment funds combine the assets of various individuals and organisations to create a larger, well-diversified pool.Functions of financial markets
Activity 13
Through the research made in Activity 11, identify the following:1. What is the function of financial markets in Rwanda?2. What hinders smooth operation of financial markets in Rwanda?Facts
1. Financing tradeMoney market plays a crucial role in financing both internal as well as international trade. Commercial finance is made available to the traders through bills of exchange, which are discounted by the bill market. The acceptance houses and discount markets help in financing foreign trade.2. Financing industryMoney market contributes to the growth of industries in two ways:(i) Money market helps the industries in securing short-term loans to meet their workingcapital requirements through the system of financebills, commercial papers, etc.(ii) Industries generally need long-term loans, which are provided in the capital market. However,capital market depends upon the nature of and the conditions in the money market.3. Profitable investmentMoney market enables the commercial banks to use their excess reserves in profitable investment. The main objective of the commercial banks is to earn income from its reserves as well as maintain liquidity to meet the uncertain cash demand of the depositors. In the money market, the excess reserves of the commercial banks are invested in near-money assets (e.g. short-term bills of exchange) which can be easily converted into cash, thus, the commercial banks earn profits.4. Self-sufficiency of commercial bankDeveloped money market helps the commercial banks to become self-sufficient. In the situation of emergency, when the commercial banks have scarcity of funds, they need not approach the central bank and borrow at a higher interest rate. On the other hand, they can meet their requirements by recalling their old short-run loans from the money market.5. Help to central bankAlthough the central bank can function and influence the banking system in the absence of a money market, the existence of a developed money market smoothens the functioning and increases the efficiency of the central bank. Money market helps the central bank in two ways:(i) The short-run interest rates of the money market serves as an indicator of the monetaryand banking conditions in the country and, in this way, guide the central bank to adoptan appropriate banking policy,(ii) The sensitive and integrated money market helps the central bank to secure quickand widespread influence on the sub-markets, and thus achieve effective implementationof its policy.6. Mobilising savingsCapital markets help in mobilising savings and channelling them into productive investments. Consequently, it encourages capital formation and promotes the economic growth of the country.7. Promotes economic growthThis is through the rational allocation of resources. The various constituents of the capital market direct funds into productive investment channels. When the capital market is underdeveloped, surplus funds are generally used for wasteful and unproductive purposes.8. The capital marketbrings together the savers as lenders and investors as borrowers who are respectively known as surplus spending units and deficit spending units.Limitations of financial markets in Rwanda
• There is a lack of coordination between the various financial institutions. They adopt differentpolicies and due to this, lending and borrowing become difficult. There is overlapping and delaysin creating the needs of industrial and trade sector.• The economic policies are framed by the bureaucrats instead of technocrats, so they createmany problems. Many financial institutions are controlled by the bureaucrats and they haveno technical skill, so they lack decision making.• The professional and skilled persons in the financial institutions are engaging more profitablebusinesses and this has created a gap of talented persons in the financial institutions.• The branches of the financial institutions are not opened in the rural areas to collect the savingsof the villages.• In advancing loans, financial institutions compete with each other to show better performance.Sometimes, they lend the money to those people who cannot repay. So, before advancing loansthey must be careful in checking the character and financed condition of the borrower.• The complaints about default in loan repayments both by the public and private sector isincreasing day by day. Poor quality of manpower is employed in the financial institutionswhich causes low production.6.5 Financial sector in Rwanda
Activity 14
Visit the library or the internet and research on the state of financial sector in Rwanda.Facts
The financial sector in Rwanda is regulated by an independent Central Bank of Rwanda (BNR). Banking service operations date back in early 1960, originating from the oldest banks of BCR and Bank of Kigali respectively. Rwanda Financial Service Sector is composed of the following institutions:• 9 commercial banks,• 3 microfinance banks,• 1 development bank,• 1 co-operative bank,• 490 microfinance institutions of which 11 are limited companies and 479 SACCOs (including 416 UMURENGE SACCOs),• 12 insurance companies (7 non-life insurers, 3 life insurers and 2 public insurers),• 1 public pension fund, the Rwanda Social Security Board and around 40 private pension schemes,• 105 operational forex Bureaus, and• 1 stock exchange.Forty two per cent of the Rwandan population is in the formal financial system (23% served by commercial banks and 33% served by non-bank formal institutions), and 58% use informal financial mechanisms (Source: BNR and FinScope, 2012).The banking returns on average equal to 12.2% as of March 2013.There is an operational Capital Markets Authority (CMA)to undertake public education and awareness and scale up financial literacy among Rwandans.Recently, most commercial banks have centred their operations on trade finance as opposed to long-term debt financing.This has triggered off of productive investment activity, thus there is an urgent need to focus attention on the reform and strengthening of the financial sector.There are ready opportunities for investment in mortgage banks to enhance access to property, agricultural banks to offer agricultural credit to farmers and introduction of new financial products, including leasing and venture capital to minimise hardships of opening business as well as its continued successful operation.The 3 largest local banks are;
• Banque de Kigali with a market share of 31% of total banking assetsand 50 % share of the total commercial bankprofitability (BK 2011).• Banque Populaire du Rwanda (BPR): 65% cooperative members, 35% Rabobank.• Banque Commercial du Rwanda (BCR): 80% I&M from Kenya, 20% GoR.Eco bank, Access Bank, Equity Bank and Kenya Commercial Bank are among the large regional bankswith a presence in Rwanda.Unit assessment
1. How important is Bank of Kigali and Bank Populaire to the development of the Rwandan economy?2. Why has Rwanda found it necessary to create specialised institutions and development banks despitethe presence of a developed commercial banking system?3. How has the National Bank of Rwanda (BNR) influenced the level of economic activities in Rwanda?6.6 Glossary
- A bond: A debt instrument created for the purpose of raising capital. Or it is any evidence of debt carrying a legal obligation to pay interest and pay the principal at a stated future time.
- Assets: Possessions of the bank plus its claims on other financial institutions and clients. Or, things of value owned by a person, household, firm or other economic unit. Important examples are plant, equipment, land, patents, copyrights, goodwill, and financial assets such as money or bonds.
- Bank:A deposit-taking institution which is licensed by the monetary authority of a country to act as a repository for money deposited by the public and which undertakes to repay such deposits either immediately on demand (current accounts) or subject to due notice being given (deposit accounts).
- Bank deposit: A sum of money held on deposit with a commercial bank or a savings bank. Bank deposits are mainly of three types: demand deposits, savings deposits and time/fixed deposits.
- Bank deposit creation or credit creation: The ability of the commercial bank system to create new bank deposits and hence increase the money supply.
- Banking financial intermediaries:These are financial institutions engaged in the provision of short-term loans.
- Bill: A tradable security usually with an initial maturity of up to 6 months, which pays no explicit interest and so trades at a discount to its maturity value.
- Bills of exchange: Written orders to pay a sum of money to another person at a future date usually in exchange of the delivery of goods, widely used in the financing of international trade.
- Capital markets: Markets in which financial resources (money, bonds, and stocks) are traded.
- Cash ratio:The proportion of money which is supposed to be kept by commercial banks to meet the daily needs of the people/ customers.
- Central bank:A financial institution that is responsible for managing the central monetary system of an economy, for example, National Bank of Rwanda.
- Commercial banks: Financial institutions that provide retail banking services with an aim of making profits. Examples are Fina Bank, Eco Bank, Banque Populaire, Bank of Kigali, etc.
- Credit creation: The process by which commercial banks create credit by lending out money using cheques. The volume of money accumulates with time basing on the interest charged.
- Forex bureaus: Financial institutions whose major business activity is to buy and sell currencies, for example Red Fox Forex Bureau, Nyabugogo Forex Bureau, Ndoli Forex Bureau, etc.
- Legal reserve requirement: The amount which by law is supposed to be kept by commercial banks in the central bank.
- Liabilities: Claims by the outside world. Or, they are properties that belong to the people but not the bank.
- Maturity: The length of time until the redemption date of security such as bonds.
- Microfinance institutions (MFI): Financial institutions which provide financial services such as micro credit, micro savings, or micro insurance to basically low income earners.
- Money multiplier: The ratio of money stock to the monetary base.
- Monetary policy: The management of demand and supply of money together with the rate of interest in order to influence the level of economic activities.
- Non-banking financial intermediaries: Financial institutions that accept deposits from people and give out loans but do not create credit, for example development banks, insurance companies, cooperatives, post banks, etc.
- Reserve ratio: This is the fraction of total bank deposits that is not lent out. It includes legal reserve requirement and cash ratio.
- Savings and credit cooperatives organisations (SACCOS):Co-operatives formed to mobilise savings from members and lend some of the savings to members, for example, Umwarimu Sacco, Umurenge Sacco.
- Treasury bills: Bills of exchange sold and later bought back by the government in an endeavour to cover state spending and also regulate the amount of money in circulation.
Unit summary
• Banking financial institutions- Commercial banks
- Central banks
• Non-banking financial institutions• Financial markets- Money markets
- Capital markets
Unit 7: INFLATION
Key unit competence:
Learners will be able to describe the impact of inflation on an economy.
My goals
By the end of this unit, I will be able to:
- Identify the states,types and causes of inflation.
- Explain the effects of inflation and measures to control it by central banks.
- Explain the relationship between inflation and unemployment using the Philips curve.
- Examine the causes and effects of inflation on the Rwandan economy.
- Analyse measures to control inflation in Rwanda.
- Use the Philips curve to illustrate the relationship between inflation and unemployment.
- Be aware of the effects of inflation in an economy and advocate for appropriate measures to control it.
7.1 Inflation
7.1.1 Meaning
Inflation is a situation where there is a persistent rise in the general price level. The general price implies an average of different commodity prices.
Some commodity prices are falling, whereas others are rising and others are stable. However, an economy experiencing inflation has most of the commodity and service prices rising.
If prices stabilise at a certain high level for some time, such a situation is not referred to as inflation but just a high cost of living.
Activity 1
Mr Habiyambere has a family of seven people and stays in Rulindo District. The family enjoys eating rice and beans. The prices of these goods have increased from July 2015 to February 2016 from 600 FRW, 700 and 800 FRW for rice and 350, 400, 450 FRW and to 500 FRW for beans. Throughout the time, because of the increase in the prices, he has been forced to reduce the quantity he has been buying or even sometime, they fail to eat supper and their standard of living has gone down tremendously. It was widely seen that there was also low levels of employment. From the case study:
1. What name is given to the situation where prices keep on increasing time after time?
2. What are the types of increase in prices?
7.1.2 Measurement of inflation
Inflation can be measured by recording the per cent increase in an index of general prices over a period of a year. There are various indices that can be used for this purpose but the one most commonly used is the retail price index.
The retail price index records changes in the prices of a variety of goods and services that enter into the average household’s budget weighted according to their relative significance in the household expenditure.
The inflation rate is the percentage rise in the price level. That is:

Where P1is the current year’s price level and P0 is last year’s price level.
If for example, a kilogramme of meat did cost 2,000 FRW in 2015 and it costs 2,500 FRW in 2016, the rise in prices is

7.1.3 Terms used in inflation
Stagflation: This refers to the situation where there is coexistence of both inflation and unemployment in an economy. The relationship between inflation and unemployment is that when unemployment rate is low, workers will be in strong position to demand for high wages which will lead to increase in prices by the employers, hence high rate of inflation. On the other hand, when the rate of unemployment is high, there will be competition for jobs and this brings down the wage rate which results into a lower rate of inflation.
Deflation: This refers to the persistent fall in the general prices of goods and services in an economy.
Reflation: This is the deliberate government policy of forcing prices upward to recover the economy from a depression. It uses policies that increase aggregate demand such as reduction in taxation, increase in government expenditure, encouraging exports, expansionary monetary policy and increase in wages, etc.
Suppressed inflation: This refers to the situation where aggregate demand exceeds aggregate supply but prices are not allowed to rise because of government price control.
Open inflation: This refers to inflation that is not suppressed, i.e. prices are permitted to rise without being interfered with by the relevant authorities.
Underlying inflation: This is inflation calculated by not considering the prices of foodstuffs.Headline inflation:This is inflation calculated by considering the prices of foodstuffs.Inflationary spiral: This is a situation where the increase in price leads to increase in the demand for high wages which in turn increases the cost of production and employers react by increasing the prices and the process increases.
7.1.4 Classification of inflation
Inflation can be classified according to the following:
1. According to the degree of intensity
Under this, we have the following types of inflation:
(a) Creeping or mild or gradual inflation
This refers to the slow increase in the price of goods and services at a rate which is less than 3%. Creeping inflation is the mildest form and is conducivefor economic progress and growth. It is a good state of inflation because a small rise in price acts as an incentive to producers. Savings, investment, output and employment opportunities all increase. In this form, the prices rise unnoticeably over a long period of time.
(b) Walking or trotting or moderate inflation
This is where the increase in the price level is a single digit or less than 10% per annum. It is a warning to the government to control it before it gets out of control.
(c) Running inflation
This is the type where the prices increase at a rate between 10-20% per annum.
(d) Hyper inflation or galloping or runaway inflation
This is the rapid increase in the price of goods and services between the rates 20 to even more than 100%. In hyper-inflation, the prices rise every moment without limit. In effect, money becomes worthless and in time, a new currency will have to be introduced. This state of inflation is noticeable by the public and it is a bad state of inflation. It discourages producers since consumers are reluctant to buy commodities at high prices. Savings, investment, output and employment opportunities reduce.
2. According to the causes
(a) Demand-pull or excess demand inflation
This is the persistent increase in the prices of goods and services brought about by demand exceeding supply of goods and services at full employment levels of incomes. This happens when the economy is operating at full capacity and no further increase in output can be achieved. If in such circumstances, the level of aggregate demand continues to rise so that it exceeds what the economy can produce. The effect of this excess demand is to cause prices to rise.

P represents price.
Y represents output.
AD represents aggregate demand.
LRAS represents long-run aggregate supply.
From Figure 1 above, it can be seen that when aggregate demand increases from
 to
to  the price level increases from
 to
to 
Causes of excess Demand Inflation
Activity 2
Visit the library or the Internet and research on the following:1. Causes of demand-pull inflation.2. Ways of reducing demand-pull inflation.
Facts
There are a number of different ways in which aggregate demand for goods and services can be greater than full employment aggregate supply. Aggregate demand may increase due to a number of factors which include:
Trade union activities: In countries where labour laws are respected, trade unions are very strong. They constantly demand for higher wages, shorter working hours, more holidays with pay and other amenities. In democratic countries, governments are often compelled to accede to the unreasonable demands of the workers. The increase in the wages increases the purchasing power of the workers and, therefore, the aggregate demand.
Deficit financing: In times of war or under other abnormal situations requiring huge increases in government spending, the government to be able to meet this expenditure may resort to deficit financing which increases the money supply in the hands of the public which increases their demands for goods and services, resulting in inflation.
Increase in population: Increases in the population of a country raises the general level of aggregate demand of the people for goods and services. If population increases rapidly when there is no corresponding increase in the volume of goods and services, there will be excess demand which in turn will shoot up the prices.
Credit expansion: The expansion of credit may be resorted to either as a matter of policy by the government or by commercial banks. The central bank can expand credit by lowering the bank rate or by purchasing government securities. The commercial banks can expand credit through lowering the cash reserves. The expansion of credit is generally resorted to in periods of increasing economic activity and once it starts, it continues for a sufficiently long time period.
Increase in public expenditure: Aggregate demand may also increase due to an increase in public expenditure. This may either be to meet the requirements of defence or of economic development or for boosting the level of economic activity in the country. This increases money in circulation, hence demand and prices will go up.
Expansion of exports: If the export of commodities increases, fewer goods would be available for domestic consumption. Consequently, this would make the existing demand at home excessive of the available quantity of goods and in the end, the prices will go up.
Reduction in taxation: This increases disposable income of the people, hence increasing their demand. This will further increase the prices of goods and services if not backed by increase in the supply of goods and services.
Policies for demand-pull inflation
Policies to address demand-pull inflation should be geared towards reducingdemand in the economy.
Such policies include the following:
Restrictive monetary policy to reduce the amount of money in circulation: This can be done with the use of the monetary policy instruments:
Open market operations: This involves buying and selling of treasury bills and bonds to the general public by the central bank through the commercial banks. When the government wants to reduce money in circulation, it will sell securities to the public and when the public buys, money will reduce in circulation.
Legal reserve requirements (variable reserve requirements): This is the amount of money which by law is supposed to be kept by commercial banks in the central bank. When the central bank wants to reduce money circulation, it increases the legal reserve requirement such that the commercial banks do not have enough money to lend to the public. Sometimes the commercial banks ask the people to make special deposits which are above the legal reserve requirement.
Bank rate: The central bank raises the bank rate to the commercial banks. In turn, all commercial banks raise their interest rates. The business people and other borrowers find it very difficult and expensive to get credit. In this way, therefore, credit is restricted and hence less money in circulation.
Selective credit control: The central bank can instruct commercial banks to favour some sectors of the economy and disfavour others. For instance in Rwanda, commercial banks can be instructed to favour the agricultural and industrial sectors, and loans made more difficult to obtain for those people who want to buy cars or luxurious goods.
Moral suasion/persuasion: The central bank persuades commercial banks to control the amount of money being lent to customers to reduce the amount of money in circulation. Although not backed by law, commercial banks will always agree.
Margin requirement: This is collateral security (requirement) needed by the commercial banks before giving out loans. When the banks want to reduce money in circulation, it sets a higher requirement to reduce the amount of borrowing.
Fiscal policy: Under fiscal policy, the following can be adopted to address demand-pull inflation:
(a) Reduction in government expenditure: One way of reducing demand for goods and services is to decrease government expenditures. This will mean that people will get lower incomes. Employment rates will be reduced; and consequently aggregate demand will fall, thereby reducing the inflationary pressures.
b) Increase taxes: Another alternative to reduce aggregate demand for goods and services is to increase taxes. Taxes are always used to remove money from the pockets of the public and this reduces the disposable income. Aggregate demand falls, tending to reduce the inflationary pressures provided this increase in taxation does not lead to wage increases.
Reduction in tariffs: Reduction in tariffs or increases in import quotas may help ease aggregate demand for domestic goods. However, this may encourage dumping and consequently home industries may adversely be affected.
Price and income policies: This is the least effective method of controlling demand-pull inflation. This policy is concerned with controlling prices of major commodities and keeping down wages. The government fixes minimum prices. However, maximum priceshave a number of problems, for instance, the creation of black markets and corruption.
(b) Cost-push inflation
Activity 3
Visit the library or the Internet and research on the following:
1. Causes of cost-push inflation.
2. Ways of reducing cost-push inflation.
Facts
Cost-push Inflation is also called supply inflation or sellers’ inflation. It is the persistent increase in the prices of goods and services brought about by increase in the cost of production. According to the cost-push theories, inflation is caused by powerful unions or by powerful firms. The process is explained as follows:
Trade unions demand higher wages for their members. Because unions are so powerful, employers accede to their demands even if there are no increases in productivity. But higher wages mean higher costs of production for the firms. Hence, in order to protect their profits, the firms raise their prices.
The higher prices force the unions to demand even higher wages. The firms then raise their prices even higher. This wage-price spiral, as it is often referred to, continues, and the process becomes a vicious circle. Cost-push inflation happens when firms’ costs go up. To maintain their profit margins, firms then need to put their prices up.

P represents price.
Y represents output.
AD represents aggregate demand.
SRAS represents short-run aggregate supply.
From Figure 2 it can be seen that when the costs of production increase, aggregate supply reduces from SRAS1 to SRAS2. Output reduces from
 to
to  leading to price increase from P1to
  .
.Cost-push inflation may arise from various sources which include:
Wage increases: Wages are a major proportion of costs for many firms and so if wages are increasing, this may well cause cost-push inflation.
• Government: If the government changes taxes, this may push up firms’ costs. This is particularly true with excise duties on fuel and oil.
• Changes in interest rates: This can also affect firms’ costs if they have borrowed significant amounts.
• Exchange rate:Exchange rate changes can affect firms’ costs,particularly if they import many of their raw materials. Exchange rate depreciation will increase import prices and may, therefore, increase firms’ costs.
• Increase in the operating costs: These include, among others, high costs of raw materials, high cost of rent, electricity, borrowing capital and advertisements. Normally, when these costs increase, the costs of production will increase and producers react by increasing the prices so that they are able to cover the costs.
Other forms of cost-push inflation may include:
- Price- wage inflation: This occurs when the increase in the price of goods and services forces the workers to demand for higher wages to meet the increasing cost of living and the producers will react by increasing the prices of the goods and the process will continue.
- Wage-price inflation: This occurs when workers demand for high wages through their trade unions and this increases the cost of production hence producers react by increasing the prices of the goods.
- Wage-wage inflation: This occurs when workers of a particular firm demand for high wages as those earned by a different similar firm and this increases the cost of production, hence price increase.
Controlling cost-push inflation
Increase in the level of domestic output: The government should increase local production by encouraging local and credit facilities, tax holidays. etc.
Imports encouraged: The government should encourage the importations of commodities that are scarce in the domestic economy. There should be no policies trying to block the importation of such commodities. The government should reduce import taxes. It can subsidise importers. This will increase the quantity of goods leading to a fall in prices.
Discourage the export of goods: Commodities that are lacking in the economy should not be exported. This can be done by imposing high export taxes, and in so doing, the quantity of goods in the country will increase. Prices will consequently fall.
Price and incomes policy: The other policy which could be adopted for curbing wage-push inflation is to moderate the increasesin incomes and prices. These are known as prices and incomes policies”. The basic idea of a prices and incomes policy is to reduce the wage-price spiral by curbing the growth of prices and incomes, and thereby lowering people’s expectations of inflation. If the rapid growth of wages can be curbed, then subsequent price increases will be reduced.
Organisational controls: Organisational controls are sometimes adopted in controlling cost-push inflation. The government assumesownership of major distribution channels. The government may practise rationing. The consumer is not able to get whatever amount of the commodity that he desires.
(c) Profit-push or price mark inflation
Profit-push depends on the degree and extent to which prices are being administered — being determined by the monopoly and oligopoly elements.
The greater the number of oligopolies and monopolies, the greater the possibility of profit-push inflation. Market forces are not important in price determining. Oligopolists and monopolists may raise prices more than enough to offset any cost increase in the hope of getting excessive profits.
(d) Bottleneck/ scarcity/ demand shift or structural inflation
Activity 4
Visit the library or the Internet and research on the following:
1. Meaning of bottleneck inflation.
2. Causes of bottleneck inflation.
3. Ways of reducing bottleneck inflation.
Facts
This is a type of inflation that results from supply rigidities/constraints that cause a reduction in supply of goods and services. It is another variety of cost inflation and it is mainly experienced in LDCs. The inflationary processin LDCs is fundamentally structural, led by food prices due to inelastic nature of food supplies relative to faster growing demand. This inflation is due to structural problems or supply rigidities, which keep down the level of output and hence high prices.
Causes of bottleneck inflation
Structural breakdown causing a shortage of goods and services in an economy: The productive capacity of the economy reduces. Capital machines depreciate and there is inadequate capital maintenance, leading to low production.
Insecurity scares away investors both domestic and foreign. There is a fear of making substantial investment due to the insecurity that prevails. As a result, output reduces and prices rise.
Reduction in production of the major sector — agriculture:This may be due to uncontrollable factors such as weather, pests, etc. Agricultural inputs may be lacking, leading to a reduction in agricultural output which pushes up prices.
There may be foreign exchange bottlenecks which are due to poor export performance. The export sector performs below capacity. Consequently, less foreign exchange is obtained to buy capital equipment which can be used to set up industries and increase the productive capacity of the economy. Besides, there can be a misallocation of foreign exchange. Instead of using foreign exchange in productive projects, it may be used in non-productive projects
Lack of technical and entrepreneurial skills: Structural inflation can also be due to the lack of technical, capital and entrepreneurial skills. This results in a decline in the supply of commodities, leading to a sharp increase in the prices.
Policies for controlling structural inflation
Increase the local production of goods and services: The government should offer incentives to private individuals such as credit facilities. Government also should set up its own industrial establishments in an effort to increase local production so as to push down prices.
Improve the export sector: This can be done, say by diversifying the economy. Both agricultural and industrial commodities should be exported. The quality of exports should be improved. More foreign exchange can then be obtained which can be used to import capital goods for setting up industries that will increase the level of output. This will help in reducing the prices.
Increase the level of agricultural output: Generally, agriculture should be improved. This can be done in a number of ways as for instance, setting up irrigation schemes, provision of credit facilities, improvement of transport facilities, increased agricultural commodity prices, and others.
Price and income policy.
Proper management of the economy.
(e) Imported inflation
Activity 5
Visit the library or the Internet and research on the following:
1. Meaning of imported inflation.
2. Causes of imported inflation.
3. Ways of reducing imported inflation.
Facts
According to this theory, inflation may be caused by an increase in the prices of imported inputs or by increases in the prices of imported goods. If the prices of imported inputs rise, importers will raise the prices of their products. In addition, if there is inflation abroad, the prices of imported goods will rise, resulting ultimately in domestic inflation.
Policies for controlling imported inflation
Imported inflation is hard to fight because it is exogenous to the economy. It originates from outside the economy. However, there are some solutions.
Import restrictions: Certainly, this will make the country go without certain commodities although prices are reduced.
Import-substitution strategy: Setting up industries to produce goods formerly imported. However, some commodities cannot be import-substituted, for instance, petroleum products.
Subsidisation of importers by the government: If importers are subsidised, they will sell their produce at a lower price and hence, a fall in the inflation rate.
(f) Monetary inflation
According to the monetary economists, it is the persistent increase in the prices of goods and services brought by increase in money supply without corresponding increase in goods and services.
(g) Expectation inflation
This is caused by speculation among producers that prices may rise in the future. Hence they create artificial shortage to increase prices.
7.1.5 Consequences of inflation
Activity 6
Describe the effects of inflation in an economy.
Facts
Inflation is considered beneficial as long as it leads to an increase in the income level, output and employment. If it does not achieve the above objectives, it becomes hazardous to the economy. Therefore, inflation has wide ranging effects on the economic, social and political life of a country. Inflation is generally undesirable because it produces some serious social and economic problems. Inflation does not only affect individuals, but also causes problems for the whole economy. The costs of inflation include:
1. Inflation and social effects
Citizens of countries that suffer high levels of inflation year after year generally feel insecure and have a high level of financial anxiety. High levelsof inflation have adverse effects on the poor members of society since they cannot, in the short-run, raise their incomes. Generally, the weaker sections of the population experience poor living conditions in terms of poor feeding, poor clothing and poor housing.
2. Inflation and income distribution
Inflation brings about a redistribution of real income within the society. Some groups become better, and others worse off. This is not a desirable result, for it tends to be the weaker sections of society who lose, and the stronger who gain. Those who become worse off are fixed income recipients such as salary/wage earners, individuals living on past savings and pensioners. As prices rise, the purchasing power reduces. The real income of these persons falls. Related to the above during inflation, the lenders lose money while the debtors gain since they pay back with inflated currencies that have lost value.
3. Inflation and worker’s effort
Generally, inflation encourages individuals to work harder. This is so because individuals would like to maintain their current levels of living. (In Rwanda, individuals work in different places in order to maintain their current levels of living).
4. Inflation and economic growth
Generally, it is believed that rising prices boost the profit expectations of producers and investors. They are encouraged to increase their investments thereby increasing both output and employment. Keynes believes that moderate or creeping inflation will encourage production while galloping or hyper inflation would be dangerous because it creates uncertainties which are not good for production. This prohibits the economic growth performance because it discourages:
• Investors by reducing their confidence in investing projects with long gestation periods;
• Exports by reducing their competitiveness in the international market; and
• Financial savings by eroding their future values.
5. Uncertainty
If inflation keeps varying, then firms may be reluctant to invest in new plant and equipment as they may be unsure of what the government will do in the future. People also may be uncertain and reluctant to spend. Both of these factors could reduce the long-term level of economic growth.
6. Inflation versus business operations
Inflation distorts business operations. Since prices do not all changeuniformly and at the same speed, it becomes very difficult for business to gauge truly the demands of consumers or the cost of their operations. Specifically, there are a number of ways in which inflation can distort the working of the economic system and in particular the business sector.
• Mortgage rates: Mortgage rates tend to increase and this makes house purchase more expensive. It is also likely to adversely affect the construction industry engaged in house building, the demand for which will be reduced.
• Higher short-term interest rates: Costs of holding stock and of financing in progress are raised. Companies relying heavily on bank finance for their working-capital requirements are most affected.
• Higher long-term interest rates: This poses a problem for companies planning to finance long-term expansion with external borrowing. There is always an element of uncertainty surrounding long-term planning during the time of inflation.
• Distortion of company profits: During inflation, company profits appear to be higher than they actually are. The damage that can result from such misleading measurements of company profits is: the payment of excessive dividends to shareholders with the result that inadequate profits are retained within the company; and wage claims from trade unions in view of the high recorded profits as evidence of a strong company position.
• Adverse effects on investment behaviour: Inflation may affect the behaviour of investors and lead to less savings being invested in productive ventures. Savings are put into the purchase of residential property, antiquities, gold and various consumer durable goods, all of which would be to hold their value during inflation.Inflation retards saving and investment by reducing the purchasing power of the people.
7. Inflation and the balance of payments
If domestic prices are increasing faster than those in other countries, then domestic goods will have no market. This will have a negative effect on the balance of payments. In other words, if the rate of inflation in a country exceeds that of its competitors, then its exports will become relatively more expensive on international markets.
Likewise, on the home market, imports will become relatively cheaper. The result of this will be to reduce the country’s exports and to increase its imports, depending on the price elasticity of demand for exports and imports. A balance of payments deficit will result.
8. Failure to achieve other goals of economic policy
Inflation makes it more difficult to attain the other targets of economic policy.Full employment becomes very difficult to attain. There is a need for a high level of aggregate demand to create full employment, but inflation can curb the components of aggregate demand (Y = C + + G + X – M).
9. Inflation and politics
Inflation adversely affects the political life of a country. This is because it increases corruption among politicians and erodes political discipline. There is a growing feeling of discontent among the people which results in the loss of faith in the government. Mass discontent sometimes results in political upheavals, which may even result in the fall of the government.
Inflation creates tensions and industrial unrest which can give rise to political unrest and lead to increased support for extreme political parties.
General cures for inflation
Activity 7
Visit the library or the Internet and carry out research on the following:
1. Measures that can be used to reduce the persistent increases in the prices.
2. Relationship between inflation and unemployment.
Facts
Many governments have now come to the conclusion that the successful fight against inflation is their economic priority number one if long-term economic and social stability of a country is to be enjoyed by its citizens.
The success in the fight against inflation is assured when appropriatefiscal and monetary policies are implemented. The specific actions that are undertaken to bring inflation under control include:
Containing government borrowing
The most successful weapon against inflation is maintenance of discipline in the management of public finances. The ideal situation is to aim for a balanced budget that is having expenditures match revenues. The second best option, in the event of a manageable budget deficit, is to finance the deficit from financial markets. Borrowing from the central bank, which is resorting to printing money, should be extremely restricted and at best eliminated.
Avoiding excessive credit expansion
It is the responsibility of the central banks to regulate the stock of money in an economy by using various monetary policy instruments at their disposal. These policy instruments include:
• Restriction of direct lending to government.
• Increase cash ratio and reserve requirements on the commercial banks and financial institutions.
• Sale of securities through open market operation.
• Intervening in the foreign exchange market by selling or buying foreign exchange.
• Adopting a strict monetary policy aimed at reducing money in circulation, for example, selling securities.
• Tight fiscal policy including increased taxation to reduce the amountof disposable income possessed by the people. This will reduce their demand for goods.
• Price and income policies: These include controlling wages and prices such that they do do not increase at any time in order to reduce the rate at which people demand for the goods and services.
• Limiting exports and encouraging imports: Limiting exports will ensure that there are more goods kept at home to meet the demands of the people. Encouraging imports will, on the other hand, increase the inflow of goods in the country.
• Encouraging savings through increasing the interests that are given on the deposits in the financial institutions. This will reduce the amount of money in circulation, hence reducing demand.
• Privatisation so as to encourage the private sector to produce more goods and services. This may be through increased competition and the desire to get more profits during inflation.
• Currency reform: The government can remove the currency which has lost value from circulation and replace it with another currency which has value.
• Promotion of private investment by setting up a conducive investment climate to boost production. This will increase output in an economy.
7.2 Rwanda inflation rates (1997-2016)
The inflation rate in Rwanda was recorded at 6.80% in December 2015. Inflation rate in Rwanda averaged 6.09% from 1997 until 2015, all time high of 28.10% in February of 1998 and a record low of -15.80% in February of 1999. Inflation rate in Rwanda is reported by the National Institute of Statistics of Rwanda.
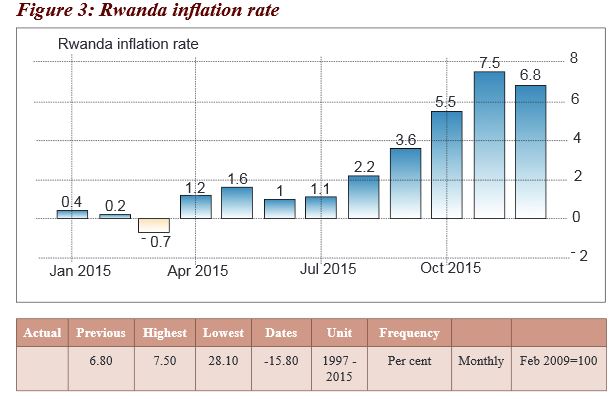
In Rwanda, the inflation rate measures a broad rise or fall in prices that consumers pay for a standard basket of goods. This page provides Rwanda inflation rates actual values, historical data, forecast, chart, statistics,economic calendar and news. Rwanda Inflation Rate: actual data, historical chart and calendar of releases was last updated in February 2016.
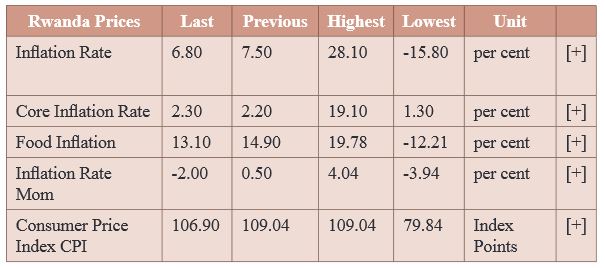
7.3 Unemployment and inflation: The Phillips curve
 The coexistence of persistent inflation and widespread unemployment is a relatively new phenomenon. Before 1950, many economists believed that unemployment and inflation could not exist simultaneously.A. W. Phillips, a British economist was among the first to call attentionto the relation between the rate of change in wages and the level of unemployment. He developed what he called the Phillips curve.The Phillips curve expresses an inverse relationship between the rate of increase in wages and the unemployment rate. He explained that workers are less likely to demand wage increases when there is a large army of unemployed persons, hence a lower inflation rate. When unemployment is low, competition among employers for scarce labour services, forces wages up, hence a higher inflation rate.This inverse relationship between the rate of inflation and the unemploymentrate is called the Phillips curve. He then concluded that:“The higher the rate of unemployment, the lower the rate of inflation; and the lower the rate of unemployment, the higher the rate of inflation.”
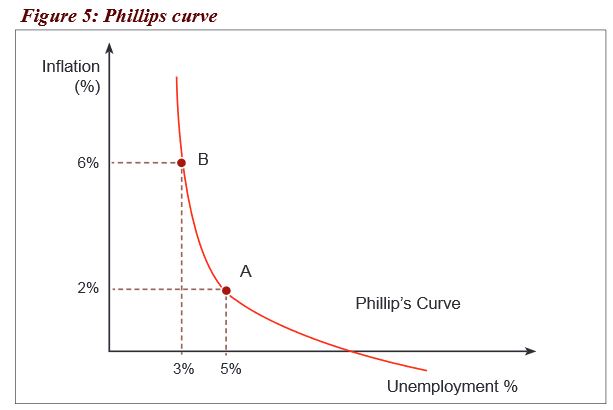 From Figure 5 above, point A shows a lower rate of employment at 2% while the rate of unemployment is high at 5%. Point B shows a higher rate of interest of 6% while the unemployment rate is low at 3%.
7.4 Circumstances under which an increase in money supply may not lead to inflation
Increase in money supply may always lead to an increase in demand for goods and services which in turn may cause persistent increase in the prices of goods and services. However sometimes, an increase in money in an economy may not necessarily lead to inflation under some circumstances as follows:When there is an effective tax system, increased money will be taxed. Due to this, an increase in taxation will reduce the money in circulation, hence the prices may not increase.
When increased money is saved: This means that the additional money is saved, hence the demand may remain low leading to low prices and low rates of inflation.
In case of high marginal propensity to save, all the additional money that the persons received will be saved. This only works when the people have a low marginal propensity to consume.
In case there is a corresponding increase in the goods and services, increased demand will be served with increased supply.
In case the additional money supply is used to service an external debt: It means that all the money that increases in the economy is going to move out of the country through capital outflow.
When there is a high price control: This may be by the government through price legislation. Even if the demand increases through an increase in the money in circulation, the prices will not increase because of government price control.
Unit assessment
1. Study the table below on inflation forecast for Rwanda and answer the question that follows.
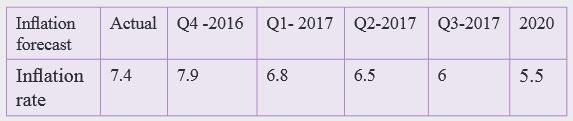
Basing on the inflation forecast in Rwanda, in your own view as an economics student, examine the possible measures that the government of Rwanda should take to control inflation to its minimum level.
2. Inflation is sometimes caused when too much money purchases few goods, under what circumstance may too much Rwandan francs not cause inflation in the country?
3. The persistent increase in the prices of goods of late has been both a blessing and a curse to the people of Rwanda. Elaborate the statement.
7.5 Glossary
Creeping inflation:The slow increase in the price of goods and services at a rate which is less than 3%.
Cost-push inflation: The persistent increase in the prices of goods and services brought about by increase in the cost of production. It is sometimes called supply or seller’s inflation.
Demand pull inflation: One which results from demand exceeding supply. It is sometimes called excess demand inflation.
Deflation: The persistent fall in the general prices of goods and services in an economy.
Disinflation: The fall in the inflation rates.
Expectation inflation: The type of inflation caused by speculation among producers that prices may rise in the future. Hence, they create artificial shortage to increase prices.
Headline inflation: Inflation calculated by considering the prices of food stuffs.
Inflationary spiral: A situation where the increase in price leads to increase in the demand for high wages which in turn increases the cost of production and employers react by increasing the prices and the process continues.
Imported inflation: The type of inflation that occurs from importation of goods and services from countries already suffering from inflation.
Monetary inflation: The persistent increase in the prices of goods and services brought about by increase in money supply without corresponding increase in goods and services.
Open inflation: Inflation where prices are permitted to rise without being interfered with by the relevant authorities.
Reflation: The deliberate government policy of forcing prices upward to recover the economy from a depression.
Structural inflation: The persistent increase in the price of goods and services brought about by supply rigidities or bottlenecks.
Stagflation: The situation where there is coexistence of both inflation and unemployment in an economy.
Suppressed inflation: The situation where aggregate demand exceeds aggregate supply but prices are not allowed to rise because of government price control.
Trotting inflation: Onewhere the increase in the price level is a single digit or less than 10% per annum.
Underlying inflation: The type of inflation which is calculated by not considering the prices of foodstuffs.
Walking inflation: The type of inflation where prices increase at a rate between 10-20% per annum. Hyper-inflation is the rapid increase in the price of goods and services between the rates 20 to even more than 100%. It can also be called run away or galloping inflation.
Unit summary
• Meaning and measurement of inflation
• Terms used in inflation
• Classification of inflation
• According to intensity
• According to causes
• Consequences of inflation
• Solutions to inflation
• Rwanda inflation rate
• Phillips curve
• Money supply and inflation
Unit 8: UNEMPLOYMENT
Key unit competence:Learners will be able to analyse the impact
of unemployment on economic development.
My goals
By the end of this unit, I will be able to:- Distinguish between voluntary and involuntary unemployment.
- Explain the types, causes,effects and solutions of unemployment.
- Distinguish between under and full employment.
- Explain the measures to attain full employment in Rwanda.
- Explain the Keynesian theory of unemployment.
- State the causes and effects of rural urban migration.
- Calculate the employment multiplier.
- Explain Okun’s Law with the aid of an illustration.
- Assess the causes and effects of unemployment in the Rwandan economy.
- Analyse the factors that may lead to full employment in an economy.
- Analyse the reasons why it’s difficult to attain full employment in Rwanda.
- Use illustrations to analyse the applicability of the Keynesian theory of unemployment.
- Examine the causes,effects and measures to control rural urban migration in Rwanda.
- Calculate and interpret the employment multiplier.
- Be aware of the effects of unemployment in an economy and advocate for measures to control unemployment.
- Take part in job creation.
8.1 Unemployment
8.1.1 Meaning
Unemployment is a state in which some members of the labour force are idle. Or it can be defined as a situation where a factor of production is able and willing to work at the ongoing wage rate but fails to find a job.Activity 1
Using photos in figure 1 below.1. Describe the activities in the photos below.2. What do you think are the causes of such activities in (i) above?3. What may be the causes of lack of jobs?4. Explain the effects of having no jobs.5. What should be done to reduce the unemployment problem in Rwanda?
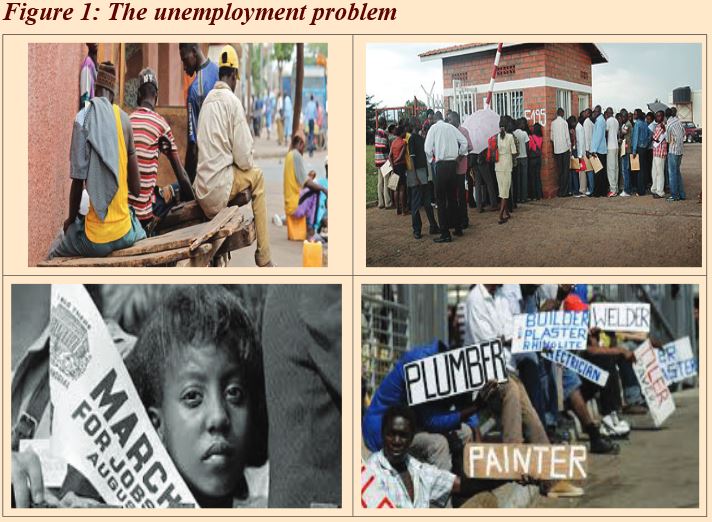
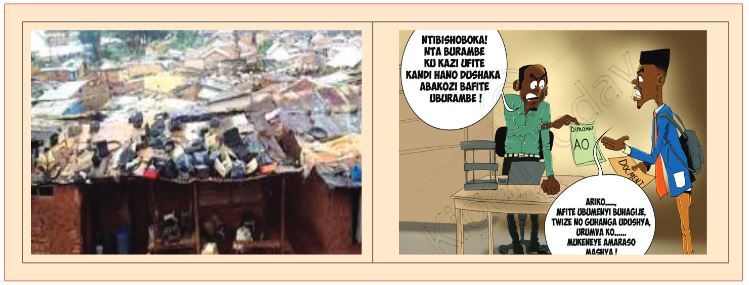
Facts
According to Lord Keynes, unemployment takes two forms;(a) Voluntary unemploymentThis refers to the situation where jobs are available but people are not willing to work at the ongoing wage rate.Causes of voluntary unemployment
• Presence of low wages: The low wages may not attract the labour to work even if the job is available.• Desire to live on personal or family wealth: Some times labour may live on already accumulated wealth that maybe personal or for the family. So even if the jobs are available, the labour may not prefer to work.• Presence of target workers:These are people who work for a specificperiod of time because they want to achieve acertain target. After achieving their target, they may not go back to work even if the jobs are available.• Poor working conditions: Sometimes workers prefer to work in luxuries or good working conditions so when theconditions of work are poor, they may not work even if the jobs are available.• Too much desire for leisure: Some people prefer to enjoy leisure to work since it is part of welfare. Those who preferleisure may not work even when the jobs are available. To them the opportunity cost for leisure is work.• Unfavourable geographical conditions: Some jobs are located in remote areas which may not be accessed byroad because of the relief. Workers may not be willing to work in areas that are not accessible even if the there are jobs.• High risks involved in doing the jobs: Some jobs are risky for the workers. For example jobs like mining, digging pitlatrines, fishing among others. Some of these may be risky since they may involve death in case of accidents. So even ifthere are wages being offered, labour may not work.• Early retirement by an individual: Different countries have different retirement ages, for example in Rwanda thecurrent retirement age is 55 years while the normal retirement age is 65 years. If the people have reached the retirementage, they may not be legible to work even if the jobs are available.(b) Involuntary unemploymentThis is a situation where members of the labour force are idle but are willing to work in the existing situations atthe current wage. Individuals want to work but there is no employment.Business cycles and growth are directly related to unemployment in any given country’s economy. When an economy is growing, unemployment usually falls and; when an economy is in a downturn, unemployment usually rises. The causes of involuntary unemployment are the causes of unemployment in general.8.1.2 Measurement of unemployment
To measure unemployment, we must first consider those people who are considered eligible to work. The definition of the labour force is all employed or unemployed civilians (15+ years of age) plus armed forces stationed in a given country. Excluded from the labour force are students, housekeepers for a working wife, those who have given up looking for work, and others who are considered non-labour force participants.Employment includes the number of adult workers who hold jobs. Unemployment includes the number of adult workers who are not employed but who are actively searching for a job. The unemployment rate is equal to the number of unemployed people expressed as a fraction of the labour force — it represents the fraction of people wanting jobs who do not currentlyhave one. The labour force comprises of all unemployed (U) and employed (E) persons. That is, Where NPUE is the number of people unemployed; and NPLF is the number of people in the labour force.
8.2 Under and full employment
Activity 2
Visit the library or research on the internet about the following:1. Distinguish between full and underemployment.2. Why is it difficult to achieve full employment in Rwanda?Facts
Under employment
This is a situation where the marginal productivity of a worker is less than what it should be. Or a situation where the person’s capacity to work is underutilised.Labour that falls under the underemployment classification includes those workers that are highly skilled but working in low paying jobs, workers that are highly skilled but work in low skill jobs and part-time workers that would prefer to be full-time. For example a person holding a university degree working in a kiosk or shop.Full employment
According to Lord Keynes, full employment is a situation where a person who wants a job gets it i.e. there is no involuntary unemployment. F. W Parish says that full employment is a situation where 3% or less of the people is unemployed.At any given time, there are people looking for work and firms looking for people to employ — unemployed people and job vacancies. Full employment is a state in which the number of people looking for a job equals the number of job vacancies.Equivalently, full employment occurs when all unemployment is frictional and structural and there is no cyclical unemployment. Thus there is always some unemployment, even at full employment. At less than full employment, other types of unemployment are present as well.The unemployment rate at full employment is called the natural rate of unemployment.How to achieve full employment
• Increase government expenditure so as to raise aggregate demand, increase output through investment and employment.• Deficit financing. This involves borrowing money with an aim of increasing aggregate demand, disposable income whichleads to greater production and employment.• Use of expansionary monetary policy especially lowering the bank rate so as to encourage borrowing for investment whichin turn increases employment.• Use of a good fiscal policy where people are not taxed heavily such that they can have enough funds for investment leadingto employment creation.• Political stability which will encourage both domestic and foreign investors hence creating employment.• Subsidisation of the enterprises so as to lower the cost of production and expand the businesses hence creatingemployment opportunities.• Political stability which will encourage both domestic and foreign investors hence creating employment.• Subsidisation of the enterprises so as to lower the cost of production and expand the businesses hence creatingemployment opportunities.Reasons why it is difficult to attain full employment in Rwanda
• Low government expenditure. The government expenditure is still low despite its arrangements of one cow per familyhowever the trend is improving and more employment is to be created.• Contractionary monetary policy. Many banks charge a high interest rate when people borrow loans. This has mademany people shun away from the loan scheme hence little income to create jobs.• Tight fiscal policy with high taxation. The tax system is a bit tight and some of the small scale businesses have hard toclose down because of little earnings, still the would be small scale investors also fear to open up in fear of the tax system.• Political insecurity. Rwanda as a nation is politically stable however the surrounding countries mainly in the west suchas Democratic republic of Congo, and Burundi in the south have caused insecurities on the areas that boarder with Rwanda.People who stay in those areas near the countries mentioned above are not so secure leading to constant movement inother urban areas.• Presence of disabled people. These may not be able to take up some jobs that require people who are mentally and physicallywell. This type of unemployment is called residual unemployment and it is common in many countries due to disability ofsome people.• Low levels of income. The presence of low incomes sometimes leads people to leave work and secondly it is not able tohelp create more employment opportunities.• Illiteracy among the people. Some people are no educated and may not be employed in formal jobs available. Still theylack enough skills to compete in the labour market leading to constant unemployment.• Ignorance of the people about the existing jobs. Because of low levels of advertisements and ignorance, some people maynot be aware of the available jobs in the different areas. This has left employers lacking workers while at the same timethe would be workers lacking jobs.• Use of capital intensive techniques. Some of the employments generating industries have resorted to use of capitalintensive techniques of production. This is to enable them produce more quality and quantity and the same time solvingthe problems associated with labour.• Desire to live on accumulated capital. Some people desire to live on accumulated capital and hence even if the jobsare available, there is always voluntary unemployment.• Large subsistence sector. This is the production for home consumption and the incidental surplus is sold. This meansthat there is not enough earnings by the people to help them put up investments that can create employment opportunities.8.3 Types, causes and policies for unemployment
There are many different possible causes of unemployment, and unfortunately for governments, it is never easy to identify which is the most important and what to do about it. The causes of unemployment can be split into two main types:(a) Demand-sideThe first cause of unemployment (demand-side) is simply a lack of aggregate Demand. When there is not enough demand, employers will not need as many workers, and so demand-deficient unemployment results. Keynesian economists in particular focus on this cause.(b) Supply-sideUnemployment caused by supply-side factors results from imperfections in the labour market. A perfect labour market will always clear and all those looking for work will be working — supply will equal demand. However, if the market does not clear properly, there may be unemployment. This may happen because wages do not fall properly to clear the market. These two types can further be divided into different categories as shown below;1. Open urban unemploymentThis is when the members of the labour force are unemployed in the urban areas — both voluntary and involuntary. Open urban unemployment can best be explained by the theory of rural-urban migration. Rural-urban migration is a process whereby individuals move from rural to urban areas. It occurs as a result of a combination of push and pull factors.The process of rural-urban migration is brought by push (from villages) or pull factors (from towns) and depends on a number of factors, which are both economic and non-economic. Some of them are; unequal distribution of resources and services, social problems and population pressure among others. This can be basically reduced or controlled by developing rural areas such that people are no longer attracted to urban areas since all the services are equally distributed.2. Seasonal unemploymentSeasonal unemployment is unemployment which is caused by economic slowdowns related to seasonal variations. Certain jobs, like fruit packing, may be seasonal. At the end of the season, the workers may become unemployed. Agricultural workers are employed during clearing, planting, weeding and harvesting periods but are unemployed for the rest of the year. Others are construction workers, people who fish for a living.Solutions
• Little can be done to overcome this form of unemployment. However, employers should see to it that employeesare offered yearly contracts.• The agricultural sector should be diversified so that there is employment throughout the year. This can be done byintroducing various crops with different times of planting, weeding and harvesting.• Set up a comprehensive industrial program to provide part-time employment.3. Disguised unemploymentThis type of unemployment does exist mainly in countries which are over-populated. It is the type where labour’s productivity tends to zero. Or the capacity of labour to work is underutilised. E.g. office messengersThe marginal product of labour is either zero or negative. One finds that there are more workers than those that are needed for a particular job.Less labour could have done the same work and therefore labour is said to be underutilised. In some cases, labour works less time than desired due to poor methods of production and poor capital equipment. Disguised unemployment is common in Rwanda, especially in the agricultural sector, service industry and government.Solutions
• Introduction of a comprehensive industrial program to help the redundant people.• Introduction of better methods of production. More and better tools should be introduced.• Population control.• Land which is not used should be made productive.4. Frictional unemploymentFrictional unemployment is essentially short-term unemployment. It results when the people are switching from one job to another. This may occur when people constantly change their jobs, some quit or others are fired.These constant changes result in frictional unemployment. There are always some firms with unfilled vacancies and some people looking for work. The period of unemployment between losing one job and finding another is included under frictional unemployment.There are a variety of reasons to explain the existence of frictional unemployment but these can be explainedin the two categories below;• Normal labour market turnover. This arises from two sources. First, people are constantly changing their economicactivities — young people are leaving school and joining the labour force and secondly, old people are retiring and leavingthe labour force temporarily for some other reason, and then joining it.• The fortunes of businesses are constantly changing— some are closing down and laying off their workers; new firmsare starting up and are hiring.Solutions
The policies for dealing with frictional unemployment aim at increasing the labour mobility.• Providing information about job opportunities and available workers. Employers should be fully informed of the potentiallabour supply.Unemployed workers should be informed of the availability of employment opportunities. There should bean efficient system of job notification and placement and there should be job centres in all small townships.• The remedy of occupational immobility is to provide retraining facilities so that workers learn new skills. However, theproblem could be lessened in the first place if the education system gave the potential workforce more appropriate training.Considering the changes in technology and the growth in demand for skilled and professional workers, retraining programwill be of increasing importance in the future.• Barriers to geographical labour mobility should be reduced. This should be either moving the unemployed to the jobsor moving the jobs to the unemployed. The government may give moving grants, provide information of jobs in otherareas; and set up houses, schools and hospitals in those areas where employment exists. To move firms into thedepressed regions, the government may attract them there with grants, tax relief, rent-free factories etc.•Human resource planning. Human resource planning should be undertaken so that workers can be guided as to what skillsare required by the economy.5. Structural/secular unemployment
Activity 3
Umucyo company in Nyamagabe has been specialised in making dresses and it has been employing many workers. However with the change in trend, where ladies have resorted to putting on trousers, the company has lost market hence laying off workers.1. What do you understand by the term structural unemployment?2. What are the causes of this type of unemployment mentioned above?3. What can be done to reduce this type of unemployment?Facts
This is unemployment caused by changes in structural set up such as change in demand. For example if there is a change in demand from dresses to trousers, the workers in the dress industry will become unemployed.Structural unemployment represents a mismatch between supply of labour and demand for workers. Because the economy is constantly changing and adapting, at any moment there will always be some mismatch between the characteristics of the labour force and the characteristics of the available jobs.The mismatch may occur, for example, because labour does not have the skills that are in demand or because labour is not in the part of the country where there is demand. Individuals who fall into this category have trouble finding jobs because of a lack of adequate skills or regional employment problems.This is because of the immobility of labour. There are three distinct reasons for such immobility; occupational, geographical/regional (within a country), and international competition.(a) Occupational unemployment results from a mismatch between the demand and supply of labour in specific industries.The demand for workers in growing fields such as health care may exceed the supply of available workers, while thesupply of labour in declining areas may be in surplus. As a result, there is high unemployment in stagnant or decliningjob areas, while demand is strong for alternative occupations.(b) Geographical/regional imbalance between the supply and demand for labour also occurs geographically, and is knownas regional unemployment. For many countries, growth is not uniform across the landscape. Some areas may enjoyrapid growth and thus have a strong demand for labour, while other locations are stagnant and the surplus labour leadsto high local unemployment rates. The unemployed workers will not move to a different area due to social ties, housingproblems and social problems.(c) International competition is an additional source of long-term structural unemployment. The argument is that less-skilled workers in developed countries are increasingly being displaced by foreign workers in less-developedcountries (LDCs) who are paid significantly lower wages. In developed countries,the average wage for less-skilledworkers is relatively high compared to that in LDCs due to greater living costs, union power, and tradition.Solutions
Structural unemployment is the most difficult for economic policy makers to deal with, and solutions evolve slowly.• Individuals stuck in occupations that allow for little future growth need to be retrained and educated to gain the skillsnecessary to work productively in areas where they are needed. Time, information, and money are required to dealwith structural unemployment.• The government can take an active role in providing vital information about jobs and help in financing education andtraining for displaced workers.• There should be facilities for the retraining of workers whose skills are no longer in demand.• It is important to identify in advance where shortages will occur in the future, so that retraining of unemployed workerscan be in the right direction. This will enable workers to move to other expanding industries.6. Technological unemployment
This is the type brought about by machines replacing people because of technological advancement.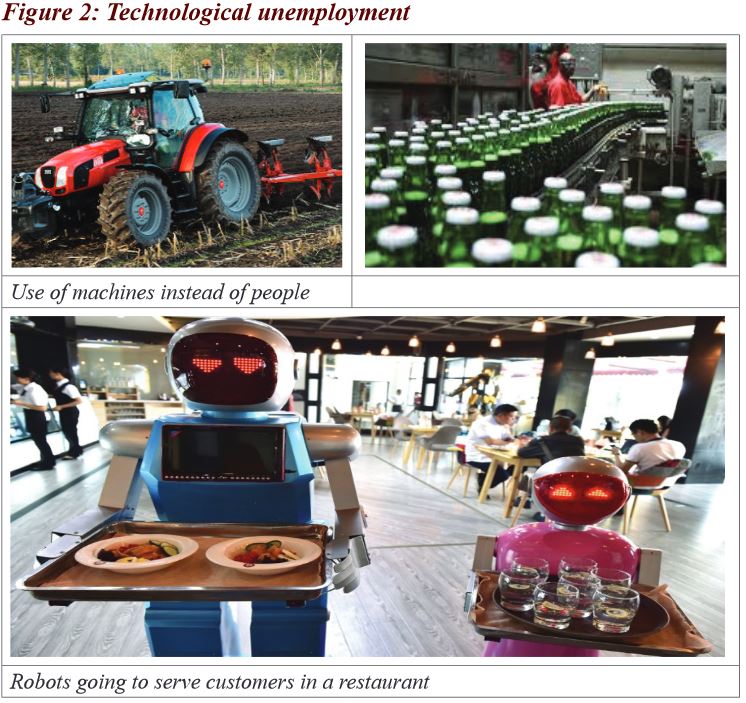 As firms introduce new technologies into their production processes,they may replace labour with machines.This has been occurring with computerisation, automation and robotics in many industries as seen above infigure 2. For the firm, costs are cut and output and profits raised but for labour the demand is decreased.
Solutions
• To cure this type of unemployment is not easy. Either he stops the technological developments, which would slow downeconomic growth, or find alternative work for those who have lost their jobs. The main solution would involve retraining.7. Casual/ Erratic unemployment
 This is a form of unemployment that results from expiry of contracts and target workers. It commonly occurs to people like private doctors, lawyers, and car washers, who work if they have clients. The private doctor works when he has a patient to attend to. If he has no patients, he becomes unemployed and hence casual unemployment. This type of unemployment ishard to cure because it comes at irregular intervals. It cannot be predicted unlike the seasonal unemployment.
8. Residual unemployment
This is a type that occurs to a factor of production especially labour because it is mentally or physically handicapped like the lame, mad people among others. Labour may become unemployed when the work that is available needs someone who is physically and mentally able.9. Transitional unemployment/ Normal unemployment
This is brought about by production stopping temporarily for sometime. Production may always stop becauseof many different reasons like repairing due to breakdown, renovation, and painting the industry among others.8.4 Theories of unemployment
1. Cyclical / Keynesian / deficiency in demand unemployment
Activity 4
Visit the library or any other source, research about the following and explain;1. The meaning of Keynesian unemployment.2. The solutions to unemployment according to Keynes.3. The relevance and limitations of Keynesian theory in LDCs.Facts
This is unemployment brought about by reduction in aggregate demand especially during a depression when incomes and output fall which results into employers laying off workers.This type results from fluctuations in the business cycle. Cyclical unemployment rises significantly during economic downturns (recessions) and falls during growth phases. It is therefore natural to refer to the high unemployment, in these recurring periods of recession as cyclical. The term “cyclical” means that such unemployment occurs periodically.When there is a fall in aggregate demand, the entrepreneurs will find themselves with unsold goods. They will be forced to reduce investment and consequently lay off workers.Keynes stressed two concepts, the marginal propensity to consume(MPC) and the investment multiplier. If individuals consume a greater proportion of the additional income, entrepreneurs willbe encouraged to increase their investment and hence more employment opportunities. However, if MPC is low, unemployment is bound to occur since the investment multiplier process will be small.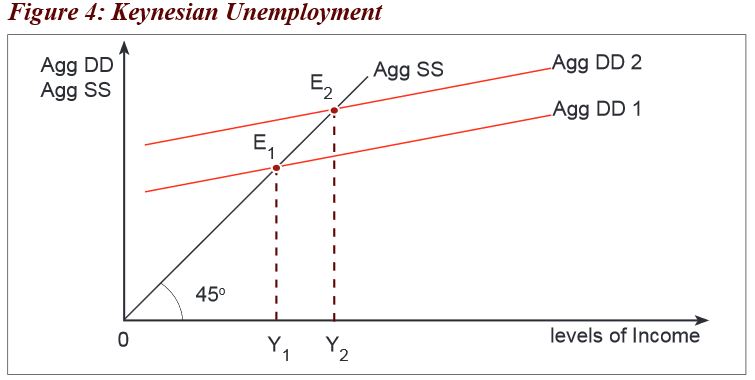 From Figure 4 above,
 is the equilibrium point with employment level
  ; some of the workers willing to work have notbeen absorbed. It means that (effective demand point) is an under employment equilibrium and is under employment level of income.The unemployed workers can be absorbed if the aggregate demand increases from Agg dd1 to Agg dd2 and a new equilibrium point
 is established with employment level
  which we assume is the full employment level. Hence increase in aggregate demand from Agg dd1 to Agg dd2 leads to increase in employment
Solutions
To eliminate Keynesian unemployment, aggregate demand should be increased in the following ways:• Government expenditure should be increased, leading to increase in the demand and in the end, incomesif the firms will increase and finally may need more workers to produce the needed goods.• Reduce tax on people’s incomes which will lead to more disposable income, and hence an increase in demand thatwill stimulate the producers to set up more investments and create more employment in turn.• Buy securities from the public. This will lead to increased money in the hands of the public and in end their demandwill increase hence the need for increased output will cause the producers to demand for more workers.• Reduce the bank rate. This will attract people to seek for loans from the financial institutions which will further increasemoney in circulation, increase demand and employers will react by increasing the demand for workers.• Reduce legal reserve requirements. This is the amount that is by law supposed to be kept by commercial banks in thecentral bank. Reducing implies that there will be enough money held by commercial banks to lend to the public whichwill further increase aggregate demand.• Encouraging exports. This could be through lowering the tax rates and joining regional cooperation for an extended market.It will increase incomes and investment and in turn create employment opportunities.• Improvement in investment climate. This is through encouraging investors to invest in the country through givingthem subsidies like tax holidays, gazetted land in economic zones among others. These investors will in turncreate employment opportunities for the people.• Increasing wages of the people so as to increase their demand.Relevance of the Keynesian theory of unemployment to less developed countries
• As suggested by Keynes, in LDCs, demand for labour is derived demand. This implies that a fall in demand for goodsand services will lead to a fall in incomes of the employers because their products have no market and in the end theywill react by laying off workers.• Through exports, new markets are got for the local goods and this implies that the local investors will earn more income.They will be able to set up more investments in order to satisfy the market and hence they will need to employ more workers.• Reduction in tax as suggested by Keynes can lead to increase in household income and expenditure. This will in turnincrease aggregate demand, the investors will react by needing to produce more to satisfy the increased demand and inthe end they will need to hire and employ more workers leading to increased employment opportunities.• Increasing government expenditure as suggested by Keynes increases money supply in the economy. This willfurther increase aggregate demand provoking producers to increase production which they can only do afteremploying more workers.• A conducive investment climate as suggested by Keynes encourages investment through attracting investors. These willin turn need to increase production and in the end they will end up employing more workers.Limitations
• Keynes viewed unemployment from the demand side when he said that unemployment is as a result of reduction inaggregate demand. This cannot be applicable in LDCs because in these countries unemployment is mostly as a resultof inadequate capital.• Increasing government expenditure as suggested by Keynes so as to increase aggregate demand will instead worsenthe problem. This is because the increased money in circulation will instead shoot up the prices and it may further betoo high for the people to buy hence the goods will lack market and still the employers may lay off the workers whichwill cause inflation.• Keynes didn’t consider institutional and structural problems in LDCs such as poor road network, poor land tenure systemwhich affect the level of investment and job creation.• Increasing government expenditure will not increase employment opportunities especially in the agricultural sector.This is because people prefer white collar jobs than blue collar jobs so there may not be increase in employmentdespite increase in expenditure by the government.• Assumes a fully monetarised economy. This is because according to him, the aggregate demand can only be increasedwhen there is increase in money in circulation but he does not consider the fact that in LDCs there is a large subsistencesector where people survive on the foods that they grow and they don’t take it to the market to earn incomes• Investments in industries may not absorb all the labour. This is because the need to increase output by these industriesto gain more profits, may force the industries to use capital intensive techniques of production as opposed to labourintensive techniques and so unemployment may persist.• LDCs have got inelastic demand for imports. Even if the prices increase, their demand remains almost the same.Increase in aggregate demand means that the there will be more investments in those countries that supply thegoods and employment will be created there and not in the countries where they export their goods.Thus unemployment will persist in the countries that receive the goods.• Increasing money supply may not increase aggregate demand. This is because people in developing countries preferto hold money in form of wealth or cash. Therefore there will still be deficiency in demand and unemployment.• Keynes didn’t consider the causes and solutions to other types of unemployment. He only considered deficiencyin demand yet we know that unemployment is broad with many causes and needs a variety of solutions if fullemployment is to be achieved.2. Rural-urban migration
Activity 5
Using the photographs in figure 5 below, describe the following:1. What do you think caused such activities in the photos below?2. The activity of people moving from a rural area to an urban area to stay is known as..........3. What do you think are the effects of such an activity in (ii) above?4. What do you think should be done to limit the movement of people from rural areas to urban areas with an intention ofstaying?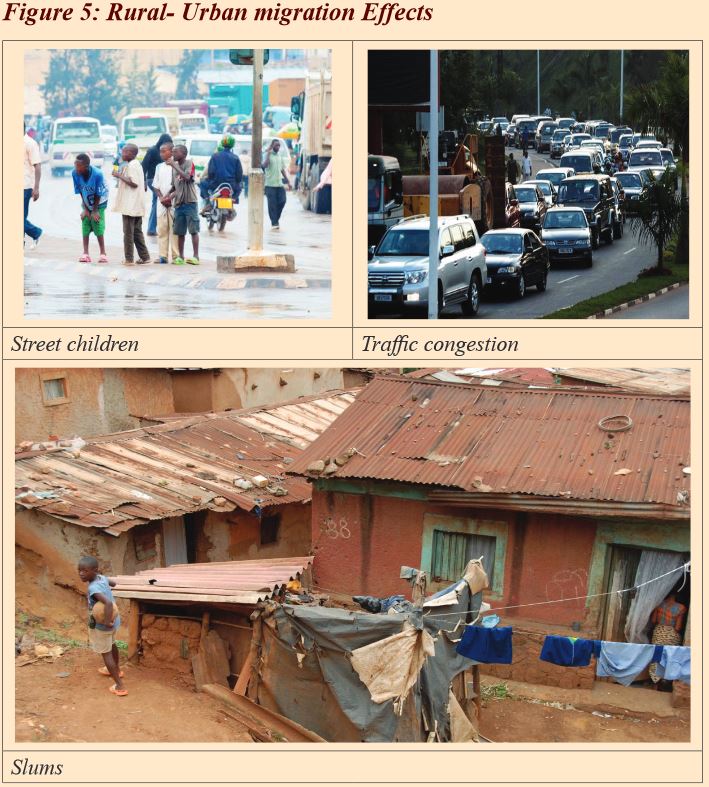
Facts
Rural-urban migration is a process whereby individuals move from rural to urban areas with an intention of staying.It occurs as a result of a combination of push and pull factors. This causes three things to happen;1. Urban growth - towns and cities are expanding, covering a greater area of land.2. Urbanisation - an increasing proportion of people living in towns and cities.3. Depopulation in the rural areas because of people constantly moving to urban areas.The process of rural-urban migration is brought by push (from villages) or pull factors (from towns) and dependson a number of factors, which are both economic and non-economic. Some of these are discussed below:• Unequal distribution of economic activities. Unequal distribution of economic activities with urban areas having morethan the rural areas. The government tends to allocate more development expenditures in the urban areas and forgetthe country sides where the majority of the people stay hence individuals have then tended to move to urban areas inhope of getting highly paid jobs.• Unequal distribution of social services. Unequal distribution of social services with urban areas having more than therural areas. More and better education, medical, cinema halls, night clubs and transport facilities are allocated to urbanareas than in the rural areas. Individuals then move to urban areas to enjoy these facilities.• Population pressure. Population pressure in the rural areas has also contributed to rural-urban migration. There islimited fertile land in the rural areas and yet there are increasing numbers of people on land. This causes diminishingreturns. Individuals who have no access to land move to urban areas in search of employment.• Formal and inappropriate education. Theoretical subjects which lack any practical bias and prepare students for white collarjobs are being taught in schools. The school-leavers lack any specific qualifications. They search for jobs appropriate to theirkinds of formal education received in schools. Therefore, after leaving school, individuals tend to stay in urban areasunemployed.• Minimum wage. To a small extent, there can be migration to urban areas arising from the setting up of minimum wagesfar above the average wage in the rural areas. Individuals tend to migrate to urban areas whenever they hear of anyincrease in the urban minimum wage. Unfortunately, the number of jobs in the urban areas is not increased. In somecases, the number of jobs is decreased.• Standard of living. The rural people view the urban standard of living to be better than the rural standard of living andhence rural-urban migration. The rural people have a belief that the urban standard of living is far much better than therural one.• Social problems. This also plays a minor role towards rural-urban migration and urban unemployment. Fear ofwitchcraft, circumcision and others are in most cases associated with rural areas. Individuals then try to escapeto the urban areas where such are least experienced.Consequences of rural-urban migration
• Open urban unemployment. Because of the constant movement of people from rural areas, there will be an increasein the number of people in urban areas who will be idle without jobs.• The problem of dependants. Normally when the people move to urban areas, they tend to stay with their relatives.Therefore they may cause increased dependency on the side of their hosts which leads to low standards of living.• Creation of slums. The presence of many people from villages to towns may cause scarcity of housing facilities.This in conjunction with low incomes, may cause the people to develop shanty housings leading to creation of slums.• Government expenditure on social services increases. There will be increase in government expenditure on socialservices like hospitals and schools among others to cater for the growing population in the urban centers.• High cost of living in urban areas. The increase in the number of people in urban centers will lead to an increase inthe demand for the goods and services. This may not be accompanied by corresponding increase in the supply of goods.In the end, the prices will go up.• The demand for social services exceeds the supply. There will be strain on the social services in the urban centers. Thisis because there is increase in the number of users and in the end there will be high costs of maintenance.• Food prices increase as well as house rents. The prices of food as well as house rent will shoot up due to the increase inthe number of users and in the end problems of poor standards of living and welfare will come up.• Low agricultural output. Agriculture is mostly carried out in rural areas, therefore the increase in rural-urban migrationmeans that the number of energetic young men and women who would stay and produce food will be moving to urbancenters. Therefore there will be reduced productivity in rural areas.• Rural development will be delayed. This is because as more and more people move to urban centers, the governmentwill concentrate on the urban centers and neglect the rural areas since there are fewer people hence rural underdevelopment.Measures to control Rural –Urban Migration
1. Rural development policy: This can be through:
• The economic base of the rural areas must be strengthened so that productivity and earnings from agriculture are raised.A big percentage of the export earnings should be returned to the rural areas in form of farm implements so thatincreased capital formation can take place in the rural areas. Agricultural output can be improved by provision ofmore and better tools; provision of credit facilities; improvement of transport facilities; higher agricultural prices tofarmers etc.• A comprehensive industrial program to employ otherwise redundant people should be introduced. Small-scalelabour-intensive industries should be set up.• Special attention should be paid to building in small-country towns in rural areas, schools, hospitals, cinema halls andthe like since people are more likely to remain in the countryside when amenities are reasonably close to where they live.In other words, rural areas should be made attractive.2. Population control: The high population growth rates must be brought to a halt using various policies like use of family planning methods, giving a maximum number of children per family, reducing incentives like free education among others.3. Education policy: To overcome the problem of school leavers, educationalists should change the educational curriculumto subjects with a more practical bias like farming, carpentry, simple mechanics and the like, to create more job seekers.4. Financial infrastructure: The government should create an effective financial infrastructure that can assist people in rural areas with microloans that are to be paid back with a small interest rate. This will help in the mobilisation of savings, which can be loaned to the farmers and they will be able to stay in rural areas.5. Wage policy: The minimum wage policy should either be abolished or made effective throughout the country such that even in the rural areas, people can earn the same wage as their colleagues in towns. This will reduce their movements to towns.6. Rural-rural migration: There should be rural-rural migration. For instance, moving from Nyamirama to Ruramira not from Nyamirama to Kayonza town. However, this is difficult to manage.8.5 General causes of unemployment
Activity 6
Explain the following and present to the class.1. Causes of unemployment in Rwanda.2. Possible solutions to unemployment in Rwanda.Facts
• High population growth rate: The high population growth rate which does not correspond with increasein job creation has left many unemployed.• Poverty: Because of poverty, people are not able to have access to business activities and they cannot affordcapital to use in the production process.• Use of capital intensive technology: The desire to produce high quality out and more in the shortest time possiblehas led to the use of machines than people hence people have been left out of jobs.• Slow growth of economies: These especially LDCs due to low incomes, low savings and low investments which makesit difficult to generate employment opportunities.• Existence of a large subsistence sector: Agriculture in LDCs is still backward and still uses primitive methods which leadsto low production, underemployment and unemployment.• Government policy towards employment: In developing countries there is lack of national policies regarding employmentand because of this, jobs have been advertised to people who already have them leading to unemployment of the newlyqualified.• Defective education system: This creates more job seekers than creators and it imparts little skills to them thus lookingfor jobs instead of creating them.• Social discrimination: This is done by the employers where they offer jobs basing on race, tribe and religious groundsleading to discrimination and unemployment.• Uneven distribution of development: The social and economic infrastructure is lacking in rural areas hence forcing thepeople to move to urban centers causing open urban unemployment.• Seasonal changes: This occurs in the agricultural sector where crops are grown in particular seasons henceduring unproductive seasons, the farmers become unemployed.• Political instability: This causes uncertainty which discourages production, limits investment and job creation.Dangers of unemployment/ unemployment problems
• Factors of production are wasted when they are out of production for a long period of time and this leads to loss of skilland creativity.• Human suffering because of failure to get jobs meaning that people do not have a source of income leading to lowstandards of living.• Results in income inequality between the employed and the unemployed where by the rich will become richer and thepoor poorer causing social unrest.• Social and economic dualism among the employed and the unemployed groups which affects the level of developmentsince some will look at themselves as unprivileged.• Retards economic growth because it brings about discontent among the citizens and the citizens resort to criminalactivities which will in turn lead to destruction of property and retards development• High dependence burden which increases the government expenditure in order to support the helpless.• Low levels of gross national product. This is because the factors of production are not fully utilised and some areunder employed meaning their productivity is low.• Low revenue to the government because the tax base is reduced since variety are unemployed. This means thatthe government may not be able to carry out its activities like infrastructure development i.e. roads, hospitals andschools among others that are vital for development.• Brain drain comes up because of the people’s desire to find employment. This denies the country productive labourwhich would have been used for development. This labour in turn moves and helps in development of other skillsthrough providing human capital.• Rural urban migration will come up. This is because the unemployed people in the rural areas will move to towns witha hope of finding jobs. These people will in turn become unemployed which will lead to problems like increased crimerates, slums among others.8.6 General solutions/cures of unemployment
• Population control policy through family planning and education programmes to match population growth with job creation.• Rural transformation through extension and improvement of social economic and infrastructure such as roads, powerand establishment of small scale industries in rural areas to reduce rural urban migration.• Appropriate manpower planning to match labour supply and labour demand.• Reforming the education system to train job seekers as opposed to job seekers by putting emphasis on practicaland vocational studies.• Maintaining peaceful politically stable atmosphere which encourage both local and foreign investors and expandedemployment opportunities in various sectors.• Privatisation of government parastatals to promote efficiencyand increase their productive capacity hence moreemployment opportunities.• Diversification of economic activities such as mining, fishing,agriculture tourism etc. to widen employment opportunities.• Encouraging the use of appropriate technology to reduce the problem of technological unemployment.• Modernisation of the agriculture sector to expand employment in the agriculture sector as well as reducing dependenceon nature• Land reforms to increase people’s access to land and mortgage land for loans from financial institutions to createself-employment• Provision of cheap credit facilities for the unemployed school leavers, poverty eradication programs etc. to enablepeople create self-employment projects.• Advertising available jobs through different media and setting up job information centers which reducesfrictional unemployment.• Improving on social economic infrastructure especially in rural areas to increase geographical mobility of labour.• Creation of wider market e.g. through economic integration thus increasing production and employment opportunities.• Liberalisation of the economy thereby attracting both local and foreign investors and expanded employment opportunities.• Encouraging small scale labour intensive industries especially in rural areas.• Attracting of investors through provision of incentives like taxi holidays, improve on infrastructure, setting up institutionsthat help investors and restoration of peace and stability in all parts of the country.• Education and training programmes to equip labour with the necessary skills required in the labour market.8.7 Employment multiplier
When there is a change in development because of increased government expenditure, it generates additional change in employment in related production activities and sectors and as a result, the initial change in employment results in greater in total employment. For example if the government spends on road construction, it directly employs the people.This is called primary employment. The road works will lead to increased demand for cement, bitumen, stones etc. this will create additional jobs in the cement, bitumen production and stone quarries. This is called secondary employment.The employment multiplier therefore is the number of times initial employment will multiply itself to give a final change in total employment. If the initial jobs created are 5 and as a result the total employment created is 25, then the multiplier is
 Arthur Okun was a Yale professor and an economist born in November 1928. In his law (Okun’s law), he analysed and developed a relationship between unemployment and national output (economic growth). He further said that, because of unemployment, some people are not engaged in production and so do not contribute to national income.This implies that unemployment reduces the level of national income. If the unemployed people were to be employed,national income would increase. National planners therefore would want to determine the exact relationship between unemployment and gross national product for proper planning and plan implementation.
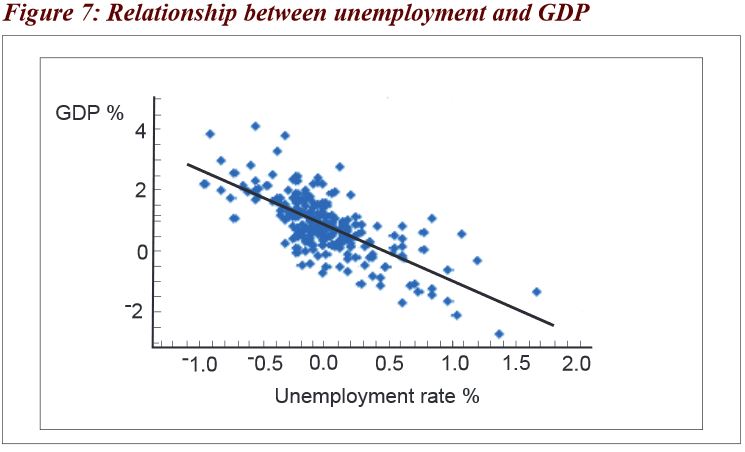 Considering figure 7 on page 290, it is seen that an increase in the unemployment rate to 2.0%, the percentage of GDP reduces to even negative. While a reduction in the unemployment rate to -1.0%, there is an increase in the GDP to more than 2%.One version of Okun’s law has stated very simply that when unemployment falls by 1%, GNP rises by 3%. For example a fall in the rate of unemploymentby 1% from 14% to 13%, causes gross national product to increase by 3% from 100 billion francs to 103 billion francs.Another version according to Okun’s states that, a percentage increase in unemployment causes a 2% fall in GDP and a percentage fall in unemployment, causes an increase in GDP by 2%.
Unit assessment
1. Examine reasons why some people in Rwanda do not want to work.2. Why is it difficult to get all people in Rwanda employed?3. What do you think the Rwandan government should do to reduce the unemployment problem?4. How has the unemployment problem affected the development process in Rwanda?8.8 Glossary
- Casual unemployment/ erratic: It’s a form of unemployment that results from expiry of contracts and target workers.
- Disguised unemployment: This is the type of unemployment where labour’s productivity tends to zero. Or the capacity of labour to work is underutilised.
- Full employment: According to Lord Keynes, it is a situation where a person who wants a job gets it. F.W Parish says that full employment is a situation where 3% or less of the people is unemployed.
- Frictional unemployment: This is the type of unemployment that results from labour switching from one job to another
- Involuntary unemployment: A situation where people are willing to work at the ongoing wage rate but fail to get jobs.
- Keynesian unemployment:This is unemployment brought about by reduction in aggregate demand which results into employers laying off workers. It is sometimes called cyclic or mass unemployment.
- Open urban unemployment: This is unemployment caused by labour moving from rural areas to urban centers because of uneven distribution of resources.
- Residual unemployment: This is a type of unemployment that occurs to a factor of production especially labour because it is mentally or physically handicapped e.g. lame, mad etc.
- Structural unemployment: This is unemployment caused by changes in structural set up of an economy such as change in demand. It can also be called secular unemployment.
- Seasonal unemployment: This is unemployment that results from seasonal changes in production especially in the agricultural sector where crops are growing according to particular seasons.
- Technological unemployment: This is the type brought about by machines replacing people because of technological advancement.
- Transitional unemployment: This is the type of unemployment brought about by production stopping temporarily for some time because of renovation/ repairing taking place in the production plants (industry). It is sometimes called normal unemployment.
- Under employment: This is a situation where the marginal productivity of a worker is less than what it should be. OR a situation where the persons capacity to work is underutilised.
- Voluntary unemployment: This refers to a situation where jobs are available but people are not willing to work at the ongoing wage rate.
• Meaning and forms of unemployment• Measurement of unemployment• Under and full employment• Types, causes and policies for unemployment• Theories of unemployment• Keynesian theory
•Rural urban migration• General causes of unemployment• Effects of unemployment• Employment multiplier• Okun’s lawUNIT 9 : PUBLIC FINANCE 1
Key unit competence:
Learners will be able to analyse the role of public finance in economic development.
My goals
By the end of this unit, I will be able to:
- Identify the branches and sources of government revenue.
- Explain the objectives, types of budgets and the problems of budgeting in Least Developed Countries(LDCs).
- Explain why governments incur debt.
- Explain the different types and purpose of government expenditure.
- Analyse the sources of government revenue.
- Describe the role of budgeting in an economy.
- Examine the effects of public debt on an economy.
- Assess the impact of government expenditure on economic development.
- Appreciate the role of budgeting and public expenditure in an economy.
- Appreciate the need for a government to spend.
9.1 Public finance
9.1.1 Meaning
Public finance is macroeconomic discipline that concerns the collection of government revenue and how it is allocated for public expenditure so as to achieve targeted objectives.
Fiscal policy on the other hand refers to the deliberate use of taxation, government borrowing and government expenditure to regulate the level of economic activities.
Activity 1
Visit the school library or internet, do research on the following and respond to these questions:
1. What is the difference between public finance and fiscal policy?
2. Explain the different branches of public finance.
9.1.2 Branches of public finance
Public finance is made up of the following five branches:
1. Public Revenue. Deals with methods or collecting public revenue through taxation plus the principles governing taxation.
2. Public Expenditure. This deals with the total amount of money the government spends on social services and the effects of such expenditure.
3. Public Debt. Handles the causes and effects of the debt which the state and local authorities borrow for various reasons.
4. Financial Administration. This handles the preparation and sanctioning of the budget and auditing of all other organs of the state.
5. Fiscal policy. Studies the use of public finance operations especially taxation through the budget so as to bring about economic stability.
Government and the economy
Activity 2
Describe the role of government in the economy.
Facts
The major aim of government in economic activities and intervention is to improve the welfare of the people and to ensure economic stability. Government intervention in economic activities differs from country to another depending on the type of economic system.
Government intervenes in economic activities and regulates the activities of the private sector in any of the following ways:
• Establishing laws enforcing them to ensure an orderly business environment.
• Producing goods and services especially those which the private sector may not properly or adequately produce and supply e.g. defence.
• Regulating activities of the private sector to ensure proper use of national resources and protect consumers from exploitation.
• Providing and administrating infrastructure in form of hospitals, schools, roads, dams, water systems, power, telecommunications etc.
• Imposing taxes and providing subsidies for purchase of goods and services from the private sector to encourage or discourage certain activities or products.
• Stabilising the economy through the use of monetary and fiscal policies so as to regulate prices, unemployment and foreign trade.
• Reducing income inequalities among the individuals, sectors, and regions of the economy.
• Controlling strategic industries in the economy.
• Planning and implementing policies that direct and control a large part of the economy.
• Attracting private foreign capital investment through joint ventures to increase resource exploitation, increase employment levels and increase the national income levels of the country.
9.2 Sources of public revenue
Activity 3
1. Identify the different sources of government or public revenue in Rwanda.
2. Explain the different methods that Rwanda can employ to expand sources of government revenue.
Facts
• Taxes: A tax is a compulsory contribution imposed by a public authority, irrespective of the exact amount of service rendered to the tax-payer in return. This is the most important source.
• Licenses: This is a payment made to the government to secure permission to carry out any gainful activity.
• Fees: Payment made by an individual for personal services rendered to them by the government. Examples of fees are postal services, medical fees charged in private wards of government hospitals, weighing vehicles, surveying land for a person etc.
• Fines: Penalties imposed on citizens who break laws e.g. traffic offenders.
• Loans: Governments can borrow either internally or externally.
• Compulsory savings: Like insurance payments, social security funds.
• Rent of government property.
• Gifts and grants: These are contributions made by individuals and societies to the government for meeting the cost of specific projects or schemes in public interest; for relief work in the event of an earthquake, flood, famine, or war; for reconstruction or for development. However, this is an uncertain source of revenue to the government.
• Privatisation: I.e. sale of public enterprises.
• Deficit financing. This means the issuing of new notes or borrowing from the central bank.
• Earning a surplus from gambling: This is common especially in a more developed country. e.g. the national lottery.
• Earning profit from its commercial ventures. Governments at times set up commercial enterprises from which they earn some revenue.
• Special assessments: A special assessment is a compulsory contribution, levied in proportion to the special benefits, derived to meet the cost of a specific improvement to property undertaken in the public interest.
9.3 Methods of expanding sources of government revenue
• Ensuring political stability and security in all parts of the country to encourage smooth production and business.
• Attracting more investors both local and foreign so as to expand the tax base.
• Monetising the economy so as to increase income earners who contribute to the revenues of the economy in different ways.
• Train and retrain manpower to properly assess taxpayers and collect tax revenue.
• Diversification of the economy so as to widen the tax base and increase tax revenue as the major source of government revenue.
• Introducing new forms of taxes both direct and indirect.
• Tax education to the public through radios, televisions, posters and seminars to reduce tax defaulters.
• Strengthening anti-smuggling measures.
• Fighting corruption in all revenue collection offices.
• Seeking aid and grants.
• Privatisation of government enterprises which don’t bring in much revenue to the government in form of profits.
9.4 National budget
Activity 4
Visit the school library or the internet; do research on the following:
1. What is meant by a national budget?
2. Why should governments budget?
3. Explain the different types of budget.
4. Why may governments plan for;
(a) Surplus budget?
(b) Deficit budget?
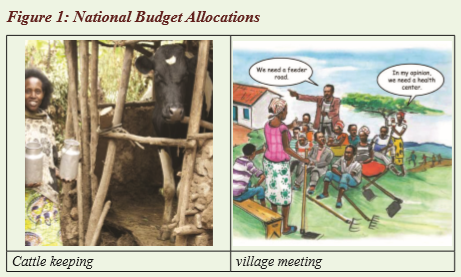

Facts
A budget is a statement, which consists of the revenue and expenditure estimates of the government for one particular financial year. It is prepared on an annual basis and presented by the Minister of Finance before Parliament i.e MINECOFIN. It deals with policy techniques, both monetary and fiscal that are aimed at directing the economy of the country for the coming fiscal year.
Objectives of government budget
The original purpose of the budget was to raise revenue to meet government expenditures. Nowadays, the budget is the major instrument for regulating the economy. In effect, a budget process is a key instrument in national policy-making. With the use of a budget, a country states which actions to be taken. The main objectives of the budget are to:
• To raise revenue for providing social services.
• To reduce income inequality and achieve equitable distribution of income.
• To maintain a favourable balance of payments position of the country.
• To maintain a high level of employment.
• To protect home infant industries.
• To discourage the consumption of undesirable commodities.
• To trace the sources of revenue.
• To cater for the sectors that need urgency towards the development of the country.
• To control government expenditures.
• To stimulate the rate of economic growth.
• To control inflation.
Types of budgets
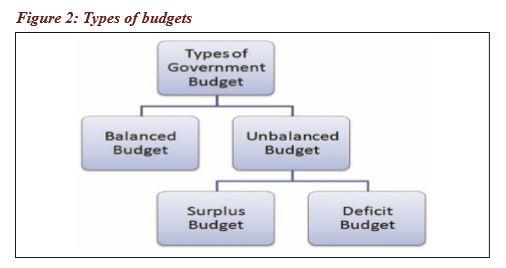
Figure 3 indicates the types of budget and their classifications
There are basically two types of budgets, namely:
1. Balanced budget
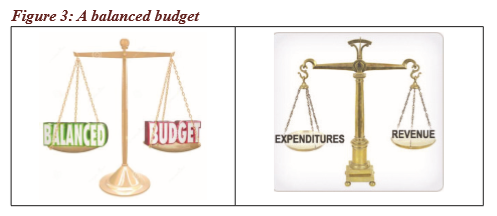
This is the type of government budget where the estimated government revenue is equal to expected expenditure in a financial year. For example, if government plans to spend FRW 200 million and expects to collect FRW 200 million then that is a balanced budget. This type of budget is not common within the developing countries even the developed world.
2. Unbalanced budget

Figure 4‘a’ shows estimated expenditures greater than estimated revenues while ‘b’ shows estimated expenditures are less than estimated revenues.
This is the type of budget where the estimated revenue is either greater or less than the expected expenditure in a financial year. It has two categories namely:
a) Deficit budget
This is the type of budget where the expected expenditure is greater than the estimated revenue. This type of budget is common in developing countries because of different reasons and it can be financed in the following ways:
• External borrowing from developed countries or international organisations.
• Internal borrowing by selling securities to the people.
• Increasing taxation by widening the base or the tax rate.
• Privatisation to generate more income.
• Borrowing from the central bank through financial accommodation.
• Use of the sinking fund and drawing from the reserves held by other countries.
b) Surplus budget
This is the type of budget where the estimated revenue is greater than the expected expenditure in a financial year
Why government may plan for an unbalanced budget
Surplus budget
Government may deliberately plan for a surplus budget due to the following reasons:
• To reduce money in circulation and reduce aggregate demand thus controlling inflationary tendencies.
• To accumulate reserves for future investment needs.
• To reduce government expenditure.
• To achieve economic stability in case of a boom which may lead to an economic crisis .
• For redeeming national debts.
• To improve on the BOP position by reducing expenditure on imports.
• To set aside funds so as to give grants and loans to others countries.
Deficit budget
Government may deliberately plan for a deficit budget because of the following reasons;
• Need to raise aggregate demand and stimulate the economy out of a recession.
• Fear of social and political consequences of high taxes i.e. to reduce political resentment.
• To increase peoples incomes through the government multiplier process.
• To stimulate economic activities.
• Borrowing or soliciting aid may be easier, quicker and cheaper in raising funds for government.
• When the taxable capacity is low.
• To improve standards of living by raising their disposable income.
• To avoid negative effects of taxation such as political uprising or industrial unrest.
• To increase the debt servicing capacity so as to reduce public debt burden on the future generation.
• To collect BOP disequilibrium by increasing expenditure on and subsidisation of exports.
• To expand employment opportunities by increasing expenditure on employment generating project.
• To rally political support of masses.
• To encourage investment both private and public hence increasing capital accumulation.
Causes of budget deficit in LDCs
Activity 5
1. Analyse the reasons as to why there are budget deficits in your country.
2. Suggest possible solutions to Rwanda’s budget deficit.
Facts
Rwanda recorded a Government Budget deficit equal to 4.30 per cent of the country’s Gross Domestic Product in 2014. Government Budget in Rwanda averaged -1.94 per cent of GDP from 2006 until 2014, reaching an all-time high of -0.10 per cent of GDP in 2010 and a record low of -5.20 per cent of GDP in 2013. A budget deficit occurs when a government spends more money than it takes in and this is usually due to:
• Low taxable capacity due to wide poverty and low levels of income.
• Deteriorating terms of trade for most LDCs’ products which generate little foreign exchange earning.
• Price fluctuations of LDCs primary products which lead to fluctuations in government revenue.
• Existence of a large subsistence sector which doesn’t produce for the market and export hence loss of domestic revenues and foreign exchange.
• High population growth rates which calls for higher government expenditure in excess of government receipts.
• High levels of tax evasion tax avoidance resulting into low tax revenue.
• Rising costs of imported inputs and manufactured goods due to frequent depreciation of local currencies.
• Heavy tax concessions and exemptions or holidays on infant firms with an aim of attracting private investment.
• Low levels of industrialisation and business profitability hence low revenues from corporate and profit taxes.
• Financial indiscipline/ corruption and embezzlement of public funds by tax collectors and tax administrators which reduces government revenue.
• High inflationary rates which erode away the value of tax revenue hence requiring supplementary budget.
• Breakdown of major economic infrastructure like roads and directly productive activities.
• Increased political instability and insecurity and other calamities
• High level of unemployment and under employment hence low tax revenue.
• Persistent debt servicing.
• Over ambitious programs and projects as a result of poor planning.
• Improving the value of domestic market by processing their products so as to increase foreign exchange value.
• Restoration of peace security, law and order in all parts of the country so as to reduce military expenditure.
• Reducing the levels of corruption and fraud in tax assessment and administration through proper accountability and transparency.
• Civil service reforms so as to reduce expenditure on a large public sector through retrenchment.
• Population control programs through family planning campaigns and education for females.
• Modernisation of agriculture so as to increase the value of agriculture products that respond to market demand.
• Increasing capital development expenditure rather than expenditure on unproductive projects.
• Reducing the subsistence sector by monetising the economy.
• Diversification of economic activities so as to increase the tax base and eventually increasing the export base.
• Privatisation of public companies so as to reduce government expenditure through financial accommodation and generating more revenues from taxing private companies.
• Adopting export promotion industrialisation so as to increase foreign exchange earnings.
Development budget and recurrent budgets
Activity 6
Visit the nearby sector offices and inquire from the sector executive secretary about the following:
1. The difference between a development budget and a recurrent budget.
2. The different activities that require a development budget and or recurrent budget.
Facts
A development budget also known as a capital development budget is where government out lines its estimated expenditure to be allocated for long-term projects which lead to increase in production directly or indirectly. Such expenditures include financing of industries, road and railway construction, construction of energy facilities, mining etc.
A recurrent budget is where estimated government revenue and expenditures are devoted to maintaining the existing capacities or day to day programs e.g. payment of wages of public servants, day to day office expenses, cost of wear and tear capital assets etc.
Importance of budgeting
Activity 7
1. Examine the importance of budgeting in your country.
2. Identify the problems of budgeting in Rwanda/LDCs.
Facts
• It is useful in raising revenue through taxation or forced and voluntary savings.
• It is used as a correcting tool during both inflationary periods and periods of economic depression so as to achieve economic stability.
• It is used in correcting BOP disequilibrium by discouraging imports and subsidising exports.
• It is instrumental in creating a conducive climate for creating and maintaining employment opportunities.
• It is used in redistribution of income and wealth among citizens/ regions through taxation and subsidisation.
• It is used to attract private investments both domestic and foreign hence increasing capital accumulation.
• It is used in protecting infant industries by reducing expenditure on imports and subsidising domestic industries.
• It is used in mobilisation of foreign capital through aid, grants or loans.
• It is used in discouraging of harmful or demerit commodities by increasing taxes on them.
• It is used to encourage production of essential commodities by increasing expenditure on them.
• It is used in soliciting or rallying political support of citizens because it is a statement of accountability for use of national revenue.
• It is a background for future economic planning because it is used to review economic progress of a nation.
• It is used to correlate and coordinate financial administration of various government departments.
Problems of budgeting in LDCs
Making a national budget is not a simple process, since different sectors, regions, departments of the national economy that have to be involved have different problems and needs. The problems facing the budgeting process especially in LDCs include among others the following:
• Unpredictable sources of revenue due to low tax base hence making it hard for government to achieve objectives in the budget.
• Inadequate skilled manpower / personnel to collect data and draw the national budget in proper consideration of all the needs of all the sectors and regions of the country.
• Poor accountability/ corruption which causes misappropriation of revenues in some departments in favour of some groups and regions leaving out those that are in most need.
• High rates of inflation which reduces the real value of estimated revenue thus causing short falls in budget estimates.
• Political instability and insecurity which reduce the capacity of revenue collection and call for supplementary budgets.
• Donor pressure and dependency i.e. donors tend to dictate the direction budgeting should take and at times it is not where LDCs feel there is need but where donors wish.
• LDCs have a large public sector and find it difficult to ration the little available resources to several government projects.
• There is no logical consistency in budgeting i.e. allocation of funds to build up on projects year after year is lacking which leads to wastage of resources.
• Change in exchange rates i.e. depreciation of LDCs currencies makes it difficult to plan since money collected may not adequately finance the budgeted expenditure.
• Natural hazards and emergencies which divert resources from one sector to another and this distorts the functioning of the entire system.
• LDCs normally make over ambitious development budgets which cannot be financed from the available revenue sources.
• High capital outflow which drains LDCs revenue.
9.5 Public debt/borrowing
Activity 8
Visit the school library or internet and research on the following
1. Distinguish between a public debt and a national debt. Explain the classification and types of debts.
2. Why does your country need to borrow?
3. Examine the consequences of a public debt to your country.
Facts
This involves the principle of borrowing as well as public debt management.
A public debt is a debt incurred by the central government, local government, and public corporations as a result of borrowing from within the country or external sources.
A national debt on the other hand is the debt owed by the government to its people and institutions within the borders or to foreigners, excluding the debts of local authorities and public corporations.
9.5.1 Classification/types of debts
1. According to the source of borrowing. Under this we have;
(a) Internal debt: This is raised from the public within the country especially in developed countries where there are rich people and companies which can afford to lend to the government by buying its securities like bonds.
(b) External debt: This is raised by developing countries from abroad to raise money for development normally got from individual countries or organisations like IMF, World Bank etc.
2. According to how a debt is going to be used.
(a) Reproductive debt/ self-liquidating debt: This is a debt which is used to finance projects that bring returns to the government. It is self-liquidating because it can be able to repay itself in the long-run.
(b) Dead weight debt/ non-reproductive debt: This is a debt used to finance unproductive ventures like wars. It is usually for short-term expenditures.
3. According to the methods of debt repayment.
(a) Funded debt: This is where the specific date of paying back the debt (redemption) is not known. The government keeps on paying annual interest on it until when it feels it is ready to pay the principal.
(b) Unfunded debt/ floating debt: This is where the specific period and date of paying back is known. It consists of short-term debts like treasury bills.
4. According to the maturity period;
(a) Short-term debt: This is a debt which has to be paid within one year or less than one year.
(b) Medium term debt: This is a debt which has to be paid between 2-10 years.
(c) Long-term debts: This is a debt which has to be paid in a period of more than 10 years.
9.5.2 Causes of public debt
The following are some of the causes of public debt in LDCs:
• To fill the foreign exchange gap because it brings in foreign exchange in case it is a public debt.
• Most governments resort to borrowing in order to reduce the tax burden on citizens of the country that would reduce savings, discourage work and consumption and even make the government unpopular. • To win government more support from the people than taxation.
• To fight and reduce economic depression in the economy by increasing money supply in the economy which increases aggregate demand and production.
• To finance the balance of payment deficit when the country’s earning from the exports are lower than the expenditures on imports.
• To fill the saving- investments gap especially where the domestic savings are low.
• To pay any mature debts which may have been acquired long time ago.
• To accumulate government reserves which can be used to facilitate the implementation of the monetary policy.
• To reduce inflation in the country through with drawing excess money from the hands of the public by selling to them securities.
• To finance the budget deficit through borrowing so as to meet actual expenditure.
• To finance emergencies like wars, natural disasters etc. which do not coincide with budget plans.
9.5.3 Consequences of a public debt
Public debt/ borrowing has got the following consequences:
• It increases aggregate demand/ market by reducing taxes on household incomes and providing credit facilities or subsidies to consumers.
• It fills the manpower gap by importing expatriates or increasing expenditure on education.
• Borrowing leads to foreign exchange outflow when paying the debts and this leads to balance of payment deficits.
• Loans are a public burden because the people repay through increased taxation and reduced standard of living.
• Borrowing encourages laziness and dependence. People are reluctant to work because of the expected funds.
• Debt servicing leads to reduced savings, investments, capital accumulation and lowers the rate of economic growth.
• Borrowing leads to extravagance because the public looks at it as free money yet it has to be paid back.
• Unproductive long-term loans shifts the burden to the future generation who have to pay without seeing any benefits.
• Debt servicing leads to foregoing of current consumption especially social services and infrastructure development.
• Some external debts need to be paid back in terms of goods and services and this reduces the variety that would serve the local population.
• Internal borrowing worsens income inequality because the poor are over taxed to pay off the rich who lend the government so resources flow from the “have-nots to the haves”.
9.5.4 Public debt management
Activity 9
Invite a resourceful person from the sector/ district/ national level, in charge of economic planning and social welfare, inquire about the following and present in class after;
1. The meaning of public debt management.
2. The objectives/ aims of public debt management in Rwanda.
3. The methods Rwanda has used to service or pay off her public debt.
Facts
Public debt management refers to the ways and means of how the public debts are administered.
Objectives/ aims of public debt management
• To influence the prevailing rate of interest
• To make investment attractive
• To mobilise external resources
• To regulate liquidity as stabilisation measure
• To ensure debt repayment and servicing
• To reduce the debt burden
9.5.5 Methods of clearing public debt
Government usually clears off their debts whether internal or external through either debt servicing or debt redemption.
1. Debt Servicing is the government act of paying interest on borrowed money and sometimes part of the principle.
2. Debt Redemption/ Retirement is the government act of paying back maturing debts with their interests on. Debt servicing and redemption is usually through the following methods:
Ways of clearing internal debts
• Using a sinking fund: This refers to that fixed amount of money set aside annually for the purposes of paying debts.
• Taxation: Government can widen the tax base, increase the tax rate so as to raise money to pay the debts.
• Debt conversion: This refers to the government act of borrowing new loans from a cheaper source so as to pay the old debts.
• Borrowing from the central bank through financial accommodation.
• Using promissory notes: These are documents issued by monetary authorities promising to pay creditors at a future date.
• Reduction in government expenditure to save money and clear off the debts.
• Through acquiring gifts and grants.
• Privatisation to raise money etc.
Ways of clearing an external debt
• Debt conversion: This involves borrowing from new low interest rate source to pay off old debts.
• Using sinking funds: Here government sets aside some money in every financial year and the accumulated funds are used to service or repay the debt.
• Dis-investment: The government may sell its foreign investments through privatisation and uses the proceeds to raise foreign exchange to service or pay back the debt.
• Printing more money for payment of internal debts. However this causes inflation.
• Adoption of export promotion to raise money for servicing the debts.
• Adoption of import substitution to save foreign exchange.
• Using foreign reserves that may be held in other countries.
• Debt cancellation/ debt relief: Here a country negotiates for relief from the lender. Most LDCs are being forgiven debts they owe the rich countries and multilateral financial institutions like World Bank and IMF.
• Debt rescheduling: This is the act of extending the debt repayment date in case the recipient country is unable to pay immediately.
• Repudiation: This is the complete refusal of the debtor country to pay debts. A country decides not to acknowledge debt obligations especially of the previous regimes. This normally attracts serious penalties from other countries or lenders.
• Local currency servicing strategy: This is when the donor country allows the recipient country to service the debt in local currency and this helps to reduce the demand for foreign exchange.
• Unrequited exports: This involves exporting goods to the lender without expecting any payment and using the value of the goods to offset the debt.
• International liquidity (SDRs): A country may use its Special Drawing Rights at the IMF to pay off debts.
9.5.6 Burden of the public debt
Activity 10
Visit the school library or the internet and research on:
1. What is meant by a debt burden?
2. Classify and distinguish the forms of debt burden.
Facts
The burden of public debt refers to the cost of borrowing (effects) on the present and future generation.
Burden of an internal public debt
The burden of the internal public debt is indirect and comes about in form of the cost of taxation to finance the debt. These include;
• Taxation reduces the rate of private capital formation.
• Repayment of the debt by taxation reduces the work effort of the people.
• Government may resort to financial accommodation (printing money)\ and this results to inflation.
• Favours the rich who use services like roads, electricity among others yet the poor are also taxed to pay.
• Internal debts worsen income inequality because it is the rich who can afford to buy the government securities and are the ones to be paid.
Burden of an external debt
• Deprives the country of foreign exchange which is used to pay the debt with an interest.
• The government has to cut its expenditure on social services so as to pay the debt.
• Sometimes the external aid is tied with strings meaning that it cannot be used by the government on any other activity.
• For a dead weight debt, the future generation has to suffer to pay the debt whose benefits they do not see.
• External borrowing leads to dependence and hinders self-sustenance.
• External debts lead to balance of payment problems and worsen poverty since there is a lot of capital outflow.
9.6 Government/public expenditure
Activity 11
Visit the school library or internet, basing on photos a, b, c, and d in figure 5 on page 320:
1. Define the term public expenditure.
2. Identify different activities in your area on which Rwandan government can spend her resources.
3. Explain the types of public expenditure.
4. Why is there much public expenditure in Rwanda?
5. Suggest the measures that Rwanda should employ to reduce on her public expenditure.
...... 3 ......
Facts
Public expenditure refers to the spending made by the central government and local or regional governments which includes development and recurrent expenditure. It is any money that goes out of government coffers for various purposes.
9.6.1 Types of public expenditure
There are basically two ways / types of government expenditure and these include:
1. Recurrent expenditure: This refers to expenditure by the government on day to day activities like payment for wages, rent, interest, debts, transfer payments, payment for public consumption (drugs) etc.
2. Development expenditure: Sometimes referred to as capital expenditure and it’s the expenditure made to finance development projects in the country e.g. Infrastructure development like roads, electricity, communication lines, industries, schools among others.
9.6.2 Reasons for/purpose of public expenditure in LDCs
• Presence of political instabilities making high public expenditure on defence.
• High levels of corruption and embezzlement by public officials leading to high expenditure of government money.
• High population rates leading to several dependants and increasing government expenditure in form of social service provision.
• Operation of inefficient enterprises that don’t make profits but survive on government subsidies.
• Poor planning by the government ministries and departments leading to spending of more revenue on projects which in the end fail to work.
• Foreign missions abroad by the government officials and even within the country increase government expenditure.
• Quite often but not expected occurrences like famine, floods, drought etc. increase state spending.
• Servicing the debts which were acquired unfortunately some debts are unproductive.
• Expenditures on ever increasing civil servants, cabinets among others.
9.6.3 Ways of reducing government expenditure
• Privatisation. Transferring government assets to the hands of the private individuals.
• Acquiring concessional loans i.e. those with a low interest rate and long period of payment.
• Reduction in the privileges given to government allowances like unnecessary allowances.
• Controlling population growth rate and this will reduce expenditure on social services.
• Ensuring peace and stability in the country to reduce expenditure on defence.
• Merging of some ministries so as to reduce expenditure on a single ministry.
• Introduction of cost sharing for public services like education, health etc.
• Demobilisation of soldiers and retrenchment of civil servants to reduce government expenditures on salaries and allowances.
• Encourage investment to increase production levels and increase production levels.
Unit assessment
1. Examine alternative methods by which Rwanda might finance the public utilities program including the construction of roads and airports.
2. “Borrowing is a necessary evil” Discuss.
3. (i) Examine the reasons behind the continued high government expenditure in Rwanda.
(ii) What advice would you give the government of Rwanda in order to reduce its expenditure?
9.7 Glossary
- Balanced budget: The type of government budget where the estimated government revenue is equal to expected expenditure in a financial year.
- Burden of the Debt: The true cost to society of the national debt. Interest charges on debt which arises as a result of borrowing by individuals, firms and governments.
- Dead weight debt: A debt used to finance unproductive ventures like wars.
- Debt burden: The cost/ effects of borrowing on the future and present generation.
- Debt financing: The government act of fulfilling its expenditure requirements through public borrowing either from internal or external sources or both.
- Debt Redemption: The government act of paying back maturing debts with their interests. It is sometimes called debt retirement.
- Debt Servicing: The government act of paying interest on borrowed money with or without the principle.
- Deficit budget: The type of budget where the expected expenditure is greater than the estimated revenue.
- Development expenditure: The expenditure made to finance development projects in the country e.g. Infrastructure development like roads, electricity, communication lines, industries, schools among others. It is sometimes called capital expenditure.
- External debt: A debt raised by developing countries from abroad to raise money for development. Normally got from individual countries or organisations like IMF and World Bank.
- Funded debt: This is where the specific date of paying back the debt (redemption) is not known.
- Fiscal policy: This refers to the deliberate use of taxation, government borrowing and government expenditure to regulate the level of economic activities.
- Government budget: This is an estimate of the revenue the government intends/ expects to raise and how it plans to spend that revenue in a financial year.
- Internal debt: A debt raised from the public within the country especially in developed countries where there are rich people and companies which can afford to lend to the government.
- National debt: The debt owed by the government to its people and institutions within the boarders or to foreigners, excluding the debts of local authorities and public corporations.
- Public debt: A debt incurred by the central government, local government, and public corporations as a result of borrowing from within the country or external sources.
- Public debt management: The ways and means of how the public debts are administered.
- Public finance: This is macroeconomic discipline that concerns the collection of government revenue and how it is allocated for public expenditure so as to achieve targeted objectives.
- Recurrent expenditure: This refers to expenditure by the government on day to day activities like payment for wages, rent, interest, debts, transfer payments etc.
- Reproductive debt: This is a debt which is used to finance projects that bring returns. It is sometimes called self -liquidating debt.
- Surplus budget: This is the type of budget where the estimated revenue is greater than the expected expenditure in a financial year.
- Taxation financing: This refers to the government act of meeting its expenditure requirements through raising revenue from taxation.
- Unfunded debt: This is where the specific period and date of paying back is known. It consists of short-term debts like treasury bills. It is sometimes called floating debt.
- Unbalanced budget: This is the type of budget where the estimated revenue is either greater or less than the expected expenditure in a financial year.
Unit summary
• Public finance
• Meaning and branches of public finance
• Government and the economy
• Sources of government revenue
• Methods of expanding sources of government revenue
• National Budget
• Meaning of National budget
• Objectives
• Types of budgets
• Problems with budgeting
• Public debt/ borrowing
• Meaning
• Types of public debt
• Causes of public debt
• Consequences of public debt
• The burden of public debt
• Public expenditure
• Meaning of public expenditure
• Purpose of public expenditure
• Types of government expenditure
Unit 10: PUBLIC FINANCE 2
Key unit competence:
Learners will be able to analyse the role of public finance in economic development.
My goals
By the end of this unit, I will be able to:
Explain the common terminologies used in taxation
Explain the principles and role of taxation.
Identify the problems encountered in collecting taxes and policies to improve tax collection in LDCs.
Explain the functions, tools and forms of fiscal policy.
Analyse the role of taxation in Rwanda.
Describe the types and the classification of taxes.
Analyse the effects of taxation on individuals and on the level of economic activity in Rwanda.
Examine the problems encountered when assessing and collecting taxes in Rwanda.
Analyse the policy measures taken to improve tax assessment and collection in Rwanda.
Compare and contrast debt financing and taxation financing.
Discuss the functions, tools and forms of fiscal policy.
Appreciate the role of taxation in government revenue and advocate for tax assessment and collection improvement.
Acknowledge the role of fiscal policy in regulating the level of economic activity.
10.1 Taxation
10.1.1 Meaning
Taxation is a process of collecting tax revenue from different sources to be used by the government in the development of the economy. Taxation can either be through direct taxation or indirect taxation depending on the base on which it is imposed.
Activity 1
There are many ways of how different people earn income. Some are business personnels who own property while others are employed and given salary. At the end of a certain period, these people are charged a certain fee by the responsible authority. Sometimes this affects their standard of living, a reason why some refuse to pay. For standardisation, the body responsible had to introduce electronic billing machines and tap to pay cards so as to avoid refusing to pay.
Explain the following:
1. What name is given to the fee mentioned above and which body is responsible for collecting it in Rwanda?
2. The process of collecting that fee is known as..........
3. Explain the role that the fee mentioned above plays to the government.
4. What are the two types of the fee mentioned above?
5. What are the effects of such a fee on the people of Rwanda?

Facts
In Rwanda the body responsible for this process of taxation is called the Rwanda Revenue Authority. The body is advanced to the extent that cases of evasion and avoidance are not to the extremes. This has been due to the introduction of electronic billing machines (EBM) that are fixed in buses that move in Kigali especially KBS and different restaurants and bars. These machines have eased the tax payment.
The Central Government through the Ministry of Finance was responsible for tax collection. The Rwanda Revenue Authority was established under the law n°15/97 on 8 November 1997 as a quasi-autonomous body with the mission of assessing, collecting, and accounting for tax, customs duties and other specified revenues.
A tax is a non quid-proquo compulsory contribution by the residents of the country levied by a public authority. Each person who is legible to pay a tax has to do so without exceptions apart from exemptions and tax holidays that are given to the investors for a specific period of time.
Common terms used in taxation
Tax base: Activities or items upon which taxes are imposed. The activities may be farming, manufacturing and processing, selling in kiosks, restaurants among others. The items on the other hand may be land, houses, cars, and people themselves among others. Basing on what is taxed, the tax may either be direct or indirect.
Taxable income: This is income which is liable to taxation by the tax authority. According to the tax system in Rwanda, there is a certain amount of income that is liable to taxation and below that, there are no taxes imposed.
Taxable capacity: This is the ability of the tax payer to pay a tax levied without affecting his or her standard of living. Sometimes individuals are left in a poor state, i.e. they are not able to sustain a good standard of living they are accustomed to. So the ability to pay a tax and at the same time remain in the same state of life is taxable capacity.
Tax evasion: This is the deliberate refusal of the tax payer to pay the tax levied on him. This can be through willful non-payment of due taxes or deliberately under stating his taxable income. Whereas tax evasion is an offence (punishable by both civil and criminal penalties), tax avoidance is not.
Reasons for tax evasion
Discontent with the services provided. Sometimes the people are not contented with the services that are offered to them after paying tax so they decide not to pay anymore.• Lack of adequate information about taxes. Some people lack information about the taxes they are supposed to pay so they end up not paying the tax.
Low income levels. Some people have got very low incomes such that if they pay a tax, they may not be able to sustain their well being so they decide to evade taxes.
Desire to retain all earnings. After making the profits, some people may desire to retain or take all the profits for their own benefit so they decide to evade the profits.
Loopholes in the tax system not to follow up the people who evade taxes. Sometimes there may be loopholes in the tax system such that they are not able to follow up those who evade the taxes so they also keep on doing the same
Opposition by the political leaders. Some oppositional leaders encourage local people not to pay tax in order to win their support.
Tax avoidance/ tax mitigation: This refers to the exploitation of the loopholes by the tax payer to pay less or no tax at all. Or it can be defined as the use of legal methods to modify an individual’s financial situation in order to lower the amount of income tax owed. This is generally accomplished by claiming the permissible deductions and credits.Tax impact: This is the first resting place of a tax. Or is a person from whom government collects money in first instance. For example, suppose government levies a tax on bottled water in Rwanda the tax will be paid to government in first instance by manufacturers of water such as Inyange, Nill and Nyirangarama industries respectively. Impact of tax is, therefore, on them. If the processing firms add tax to price and succeed in selling water to consumers, burden of tax is thus shifted on to consumers.
Tax incidence: Tax incidence is the final resting point of a tax i.e. who finally bears the burden of the tax. For example if a father in a home who takes care of the family is taxed, his family members will bear the burden of a tax when the necessities that were being bought before taxation are no longer being bought.
Effect of a tax: This refers to the repercussions or consequences of imposition of a tax on individuals and on community in general. This may be in form of poor standard of living due to failure to afford the basic needs in life.
Tax transformation: This refers to substituting the production of a taxed commodity by a non taxed commodity so as to avoid the effect of a tax for example if a person has been importing clothes in Rwanda and they are taxed, he or she can shift to electronics like computers that are tax free.
Tax rebate: This is a refund on taxes when the tax liability is less than the taxes paid. Or this refers to the reduction of tax rates to private investors to encourage investments.
Tax burden: This refers to direct impact/ effect felt by the person who pays the tax. e.g. when a person pays tax, he may remain with little disposable so tax leads to loss of money by the tax payer.
Tax shifting: This refers to transferring part or whole amount of the tax liability/burden from the original tax payer to someone else i.e. producer/ seller to consumer or raw material provider. It may either be:
(a) Forward shifting: Here the tax payer shifts the burden/ liability to the next party in the chain of distribution inform of high prices e.g. producer shifts it to the consumer by charging him or her high prices.
(b) Backward shifting: Here the tax payer shifts the liability/ burden to the previous party in the chain of distribution. E.g. producer to the raw material provider in form of paying low prices for the raw materials.The purpose of taxation
Activity 2
Describe the role of taxation in Rwanda.
Facts
The aims of taxation should not be confused with the principles or canons of taxation, although an aim may well be to arrange the tax system as much as possible in accordance with the principles of taxation. Governments impose taxes to:
1. Raise revenue
The purpose of taxation is to raise revenue for the government with legitimate revenue requirements which can only be met through some form of taxation. It is the responsibility of the people who benefit from the activities of government to pay individually a portion of those costs as taxes. The purposes of collecting taxes are to pay the debts, and provide for the common defense and general welfare of the citizens of the country. The revenue obtained can be used to finance development. It is used to promote economic growth.
2. Protect home industries especially the infant industries
Taxes are imposed on imported goods in order to protect home industries especially the infant industries. This consequently encourages the consumption of domestic goods.
3. Fight inflation
Taxes may be imposed for the reason of fighting inflation. If direct taxes are imposed on incomes, there will be less disposable income leading to a fall in the demand for goods. This consequently will lead to a fall in prices.
4. Correct a balance of payments deficit
When taxes are imposed on incomes, there is less disposable income. The demand for goods including the foreign goods falls leading to a fall in foreign exchange expenditure and hence an improvement in the balance of payments position. The imposition of taxes on commodities leads to increases in commodity prices. The demand for goods reduces leading to a fall in the foreign exchange expenditure and hence an improvement in the balance of payments position.
5. Discourage the importation of certain goods
The government can improve taxes on goods with hope of discouraging the importation of certain goods. For instance, heavy taxes could be imposed on cigarettes, alcohol etc.
6. Discourage dumping
Dumping is the selling of a commodity abroad at a cheaper price than at home. Such goods may discourage the development of local industries since they are cheaper than the locally produced commodities. To overcome this problem, taxes may be imposed on the dumped commodities.
7. To correct market failures
One of the major reasons why government intervenes in the economy is to correct or reduce various market failures. The government is justified in using taxation to:
Tax monopoly profits, both to deter monopoly and to remove the “windfall gain” accruing to a monopolist as a result of barriers to entry and inelastic supply.
Finance the collective provision of public goods and merit goods. The market might fail to provide public goods such as roads and defence, while education, health care and other merit goods might be under consumed at market prices.
Discourage the consumption of demerit goods. Demerit goods such as tobacco might be over consumed at market prices. Note that a conflict may arise between the revenue raising aim of taxation and the aim of reducing the consumption of demerit goods.
Alter the distribution of income. The government may decide that the distribution of income resulting from unregulated market forces is undesirable. Taxation and transfers can be used to modify the distribution of income resulting from market forces. A progressive tax system is used to redistribute income.
Principles of taxation/canons of taxation
Activity 3
Visit the library or internet, research and describe the following:1. Canons of taxation 2. Classification of taxes
Facts
A tax is a non quid-proquo compulsory payment from the public to the government. It imposes a burden on the tax payer by reducing his disposable income. It is precisely because of its adverse effects on tax payers that economists have debated “what constitutes a good tax”.
It was not until 1776 that qualities of a good tax were laid down. Writing in his book “Wealth of Nations”, Adam Smith laid down his four canons of taxation, which he said should be followed when imposing a tax. These canons concerned four aspects of taxation — equality or equity, certainty, convenience and economy.
1. Equality or equity principle
A good tax should impose equal sacrifice on all tax payers. The burden should be distributed according to people’s ability. Equity is said to well serve progressively in a given tax. Equity considerations are of two types;
(a) Horizontal equity. People with similar income situation should be treated equally e.g. people with same incomes charged equally.
(b) Vertical equity. People with un similar income situations should be treated differently e.g. the rich should be charged differently from the poor by being charged a higher rate.
2. Principle of certainty
The time of payment, the manner of payment, the amount to be paid, ought in all cases to be clear and plain to the contributor and to every other person. What Adam Smith had in mind was simply that the imposed tax should be simple and easy to understand by tax payers. It should be clear to him in terms of liability.
3. Principle of convenience
Adam Smith stated that every tax ought to be levied at the time or in the manner in which it is most likely to be convenient for the contributor to pay it. Individuals should be taxed when it is most convenient for them to pay. The time and the mode of payment of the tax should be convenient. For instance, farmers are taxed when they sell their crops; office workers are taxed when they receive their salaries etc.
4. Principle of economy
It should be economical to the government. The cost of collection of the tax should be small in relation to the tax revenue. It should be unwise to spend too much on collection relative to the actual amount collected. The cost of collection should not exceed 5% of the total tax revenue. With changed times and changing thinking on taxation, other principles have been added on the four originally stated by Adam Smith. These are:
5. The principle of productivity (adequacy)
It should bring in a lot of revenue. It is now widely believed that a tax must produce sufficient revenue to justify its imposition. A tax system must be capable of providing the flow of funds deemed appropriate by the government in any given period.
6. Principle of elasticity
A tax system should be income-elastic. As national income increases, the share of taxation in national income should rise more than proportionately.
7. Simplicity
It should be easy and simple to understand as well as to administer. The tax system must be set in the clearest language easily understood by the people to whom it applies.
8. Comprehensiveness
A good tax system should have multiple taxes rather than a single tax. It should not cover a single base but a wide range of tax bases.
9. Flexibility
A tax system should be flexible depending on the economic circumstances and according to the requirements of the state. The system should be able to change according to the prevailing conditions in the economy i.e. during times of boom and a depression.
10. Neutrality
A good tax system should minimise distortion of relative prices. It should reduce the inequality of incomes. Neutrality is important because a tax is to enable the government’s role of protecting the economy and providing for the general welfare. A tax that oppresses any element of the economy is thus counterproductive. Taxes that discourage consumption, investment and production are undesirable.
11. Political acceptability
It must be politically acceptable to the people. The government should be able to collect the necessary revenue without incurring the hostility of the tax payers.
12. Consistence
This means that a tax should be in line with national economic objectives especially in allocation of resources.
10.1.2 Classification of Taxes
Taxes can be classified according to the behaviour of their rates or related to the tax base. They can be classified as proportional, progressive, regressive or de- regressive.
1. A proportional tax
This is a tax system where the tax rate is the same for all income levels. It has a uniform percentage for different income groups. I.e. the rich pay more than the poor in real terms but the percentage is the same e.g. All the people may pay a tax rate of 10% but still some people may pay more than others in real terms.
2. A progressive tax
This is a type of tax system where the rate of tax increases with increase in income level. The higher income group pays a higher amount of a tax both in real terms and percentage terms than the low income earners. The rate of increase of the tax is more than the rate of increase in the income. It has the following effects:
• Redistributes tax in an economy where the rich are taxed highly than the poor.
• Raises more income revenue to the government.
• Discourages work effort by the high income earners.
• Reduce the level of savings and investments.
• Encourages tax avoidance by the rich in the economy.
• Discourages foreign investors from investing in the country.
3. A regressive tax
This is a tax system where the rate of tax decreases with increase in income. The poor are taxed more than the rich in relative means as those who get more income suffer less. The rate of increase of this tax is less than the rate of increase in the income. Those who get more income suffer less from this tax. It has the following effects:
• Leads to exploitation of the poor.
• Widens the gap between the poor and the rich.
• Lowers standard of living of the poor.
• Encourages tax evasion by the poor.
• Leads to social unrest and tension in the society.
• Encourages hard work by the poor and rich.
4. De-regressive tax
This is a tax system which has progressive elements at lower levels of income but the amount remains uniform at higher levels of income.
These types of taxes can be shown below:
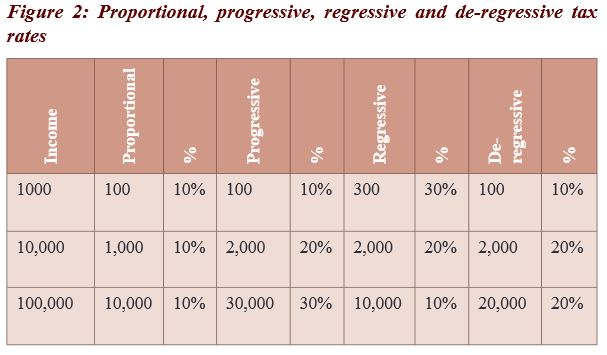
From the figure above, it is seen that;
• Proportional tax, the tax rates are the same for different income groups,
• Progressive tax, the rates increase with increase in incomes
• Regressive tax, the tax rate reduce with increase in income
• De-regressive tax, the tax rates increase first then they become constant at some state. i.e. it has progressive nature and then proportional rate at a later stage.
The rates can further be illustrated as seen below.
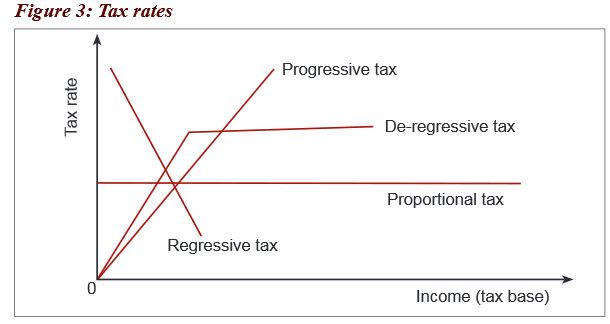
From Figure 3 above, it is seen that, Proportional tax rates are the same for different income groups, Progressive tax rates increase with increase in incomes, Regressive tax rates reduce with increase in income and De-regressive tax rates increase first then they become constant at some state.
Types of taxes
Activity 4
Mr Nkurunziza works in king Faisal hospital as a doctor. He earns a gross salary of FRW100, 000 at the end of the month. After removing taxes, his net income is worth Frw60, 000 which is not enough to cater for his basic needs and worse still, he is discouraged to work and sometimes stays home to carry out farming to supplement his little income. Respond to the following questions:
1. What type of tax is charged on Mr Nkurunziza’s income?
2. What are the effects of such a tax on Mr Nkurunziza’s family?
Facts
Direct Taxes
A direct tax is a tax levied on the individual’s or company’s income or wealth. The total burden of paying is suffered by the tax payer and is inescapable. It is a tax paid by the person on whom it is imposed. The government expects that the tax burden rests permanently on the person who pays the tax. The tax paid normally varies with the status of the tax payer. Examples include;
(a) Income tax: This is a tax levied on individuals who receive income over and above a certain amount (taxable income) in a given period of time.
(b) Corporate tax: Levied on company profits or any other trading organisations.
(c) Estate duty (death tax): Tax paid on the assessed wealth or estate of a person at the time of his death.
(d) Gift tax: Payable on the assessed wealth of a person at a time of transfer to another person.
(e) Capital gains tax: Imposed on increase in the value of an asset when imposed at a higher price than the acquired value.
(f) Poll tax: Imposed on a fixed rate on every individual,household irrespective of one’s income.
(g) Graduated tax: Levied on one’s income mostly for the employed wage or salary earners.
Property tax: Levied on properties like land, houses among others.
(i) Inheritance tax: Levied on inheritors of property who may be one or many. The greater the value of the property inherited, the greater the tax.
Merits of direct taxes
• Equitable: The burden is equitably distributed as they are progressive in nature. It affects the rich more than the poor ones. Horizontal and vertical equity are satisfied. Certain direct taxes are based on the canon of certainty. Time of payment and amount are known.
• Reduce income inequalities: It tends to redistribute income within the economy since it is in most cases progressive.
• Fight inflation: A direct tax can reduce inflation since disposable income reduces. The fall in disposable income leads to a fall in demand.
• Simplicity: They are simple and easy to understand.
• Economical: The cost of collection of direct taxes is low. This is especially true with the income tax. The salaries of the individuals working in the government are automatically reduced by the amount of the tax.
• Flexibility: The government can increase or decrease the rates of direct taxes according to the requirements of the economy.
Demerits of direct taxes
• Inconvenience: In most cases, direct taxes are payable in advance and in lumpsum except in the case of salaried persons. This represents an inconvenience to the tax payers.
• Burden to tax-payers: Direct taxes are a burden to tax-payers because they have to be paid directly out of their incomes.
• Evasion: They may not be paid and this results into loss of revenue to the government.
• Discourage saving and investment: When people know that with the increase in the income and wealth, they will have to pay a large portion in the form of taxes, they are reluctant to save and invest.
• Employment opportunities will be limited: On the other hand, since direct taxes reduce disposable incomes, there will be less demand. The fall in the demand acts as a disincentive to producers and hence less investment.
• Discriminatory tax: Direct taxes are not imposed on all income groups. This is normally true with the low income group which is exempted from paying the tax.
• Wage- Push inflation: When direct taxes are imposed, disposable income decreases. Workers may then demand higher wages resulting into wage-push inflation.
• Direct taxes affect the workers’ effort: People’s willingness to work may be affected by direct taxes. It is hard to determine one’s taxable capacity. Individuals have different sources of income which may not be known to the taxation authorities.
• Direct taxes discourage production: This is usually the case with corporation taxes which are charged according to the profits made.
Indirect tax
Activity 5
Referring to activity 4, Mr Nkurunziza decided to quit working at the hospital and got engaged in farming, concentrating on growing rice and matooke. He harvested a lot that he sold to different markets in the country and further continued to surrounding countries like Burundi and Congo. He realised still that there was always a tax he had to pay when processing his goods and when exporting among others.
Respond to the following questions:
1. What type of tax is charged on Mr Nkurunziza’s activities?
2. What are the effects of such a tax on Mr Nkurunziza’s activities ?
Facts
Indirect tax is a tax levied on the activities of an individual and companies. They are levied initially on the importer, producer or whole seller but ultimately paid by the consumer since they are included in the price of the final products sold at the market. This depends on the price elasticity of demand. Examples include:
(a) Value Added Tax: This is a tax charged on the activities at every stage of production process.
(b) Customs duty: Levied on goods being moved across the boundaries of a country. It’s composed of import and export duty
(c) Excise duty: Taxes imposed on locally manufactured goods whether they are for home consumption or export.
(d) Sumptuary tax: Levied on commodities to discourage their consumption by making their prices high.
(e) Octori tax: Charged on goods passing through the territories of a country.
(f) Specific tax: Tax levied per unit of output.
(g) Advalerem tax: This is a tax charged according to the value of the commodity. The more valuable the commodity, the more tax that is charged.
(i) Consumption tax: Tax paid by the consumer when buying the goods for consumption. This tax is paid unknowingly by the consumer.
Merits of indirect taxes
• Avoidance of high direct taxes: Indirect taxes save the government the problem of imposing heavy direct taxes. The government for instance, can impose a tax of FRW.15 million on imported goods but cannot impose it on one’s income without resulting in serious disincentives on effort and initiative.
• Indirect taxes are convenient: They are less inconvenient and less burdensome. They are paid only when a commodity or a service is bought. Since these taxes are included in the prices of commodities, buyers do not feel the burden of these taxes.
• Less Evasion: Indirect taxes can hardly be evaded since they are included in the prices of commodities. They can be evaded only when consumers do not buy the taxed commodities.
• Less harmful to effort and initiative: Incentives and enterprise are not harmed, as in the case of direct taxes. This is because indirect taxes are not linked to earnings.
• Wide coverage: Indirect taxes cover a variety of commodities and services. The government is sure of sufficient tax revenue from all income groups. Indirect taxes are therefore very productive.
• Flexibility: Indirect taxes can be adjusted either downwards or upwards depending on the country’s prevailing economic situation.
• Check the consumption of harmful goods: Indirect taxes can be used to discourage the production of goods that are injurious to the welfare of society. Indirect taxes can check the consumption of harmful goods when the government levies heavy taxes on such commodities.
• Economical: Indirect taxes are easy to collect. They involve little cost of collection.• Indirect taxes do not discourage work’s efforts: Workers do not offer less hours of work instead they put in more work effort in order to be able to buy those commodities that cannot be avoided.
• Powerful tool of economic policy protection of home industries: The government can levy heavy import taxes on the foreign goods if it wants to protect and develop the domestic industry. In this way, output and employment opportunities will increase. Indirect taxes can be imposed to protect against dumping. Dumping can discourage the development of home industries.
Demerits of indirect taxes
• Indirect taxes are regressive in nature: The rich and the poor have to pay the same amount of tax on essential goods — say on soap, kerosene. The burden of tax is heavier on the low income group. Indirect taxes therefore do not satisfy the canon of equity.
• Unreliable revenue: Indirect taxes can be unreliable as a source of government revenue. It is not possible to accurately estimate the effect of indirect taxes on the demand for products.
• Inflation: Indirect taxes lead to higher prices, higher costs of production, higher cost of living and therefore higher wages. Note the problems of inflation.
• Adverse effects on production and employment: Indirect taxes may at times adversely affect the production of certain commodities.
• Indirect taxes tend to raise the prices of commodities, which lead to the fall in demand. The fall in the demand is a disincentive to producers. Consequently, production and employment opportunities all decline.
• Diversion of resources: Indirect taxes lead to the diversion of resources from taxed commodities to non-taxed commodities which may lead to the misallocation of resources.
General Effects of taxation
Positive effects
- Redistributes revenue in an economy where the rich are taxed highly than the poor hence reducing income inequality.
- Raises more income revenue to the government and this plays a big role in the economy.
- Encourages hard work. Sometimes the poor are encouraged to work harder in order to sustain their way of life.
- Reduces consumption of harmful commodities in excessive amounts since it increases their price and hence reduction in the consumption.
- Sometimes reduces imported inflation since it raises prices of imports hence reducing their demand. However it should be known that demand for imports in LDCs is inelastic even if the prices increase, demand always remains the same.
Negative effects
- Discourages work effort by the high income earners. The progressive tax will affect the rich since they will pay depending on their income
- Reduces the level of savings and investments among the people since their income is taken by the tax authorities.
- Discourages foreign investors from investing in the country. The corporate tax is charged at the profit of the business where by the more profits you earn, the more tax you pay.
- Leads to exploitation of the poor. The poor are exploited especially in the regressive tax system where they pay a large percentage rate the rich.
- Widens the gap between the poor and the rich. Regressive taxes always make the rich become richer than the poor hence leading to a big gap between the rich and the poor.
- Lowers standard of living of the poor since they cannot afford to buy the basics in life.
- Leads to social unrest and tension in the society since people don’t have money to pay in form of a tax.
- High level of taxation may lead to social evils like smuggling in order to save the little income they earn.
Structure of taxation in Rwanda
Structure of taxation refers to the composition, ways taxes are levied and its effects on the citizens. The structure can be seen below
1. Composition: Most of the tax revenue is got from indirect taxes like customs, sales among others.
2. Tax administration: Revenue is normally collected by Rwanda Revenue Authority on behalf of the central government and the local government authorities.
3. Objective of taxation: Major objective is to raise revenue for recurrent and development expenditure.
4. Tax base: Tax base is narrow because system is not comprehensive as not all wealth, income and expenditure is taxed.
5. Taxable capacity: This is low because of a large subsistence sector and high levels of poverty.
6. Taxation impact: Most taxes especially indirect taxes are regressive and they tend to affect the poor more than the rich.
7. Taxation effort: Direct taxes which are progressive tend to discourage the work effort of the people hence there is reduction in productivity.
8. Tax avoidance and evasion: Rate of evasion is high especially through defaulting. Tax avoidance is low because most indirect taxes are levied on essential goods. However this has been solved by introduction of the electronic billing machines.
9. Tax GDP ratio: The proportion is not very much because of low taxable capacity and low tax base however the trend is increasing.
Problems facing taxation system in Rwanda
Activity 6
The government of Rwanda in its attempt to ensure further development in the country is to use borrowing or continue to tax the citizens so as to raise the funds. All the two methods have different outcomes, importance and problems.Basing on the photo (a) in figure 4 below, the revenue collected by Rwanda Revenue Authority in the first half of the financial year, was more than what was expected. One wonders why this hasn’t been the case for the previous years.Basing on the photos in figure 4 below, respond to the followingquestions:
1. What problems do you think affected RRA previously that led to low revenues?
2. What policies have been adopted by RRA such that the revenues have increased as shown in the New times?
3. In what ways does the government of Rwanda use its tax revenue collected?
4. Explain why Rwanda should resort to borrowing other than taxation in order to raise revenue for development.
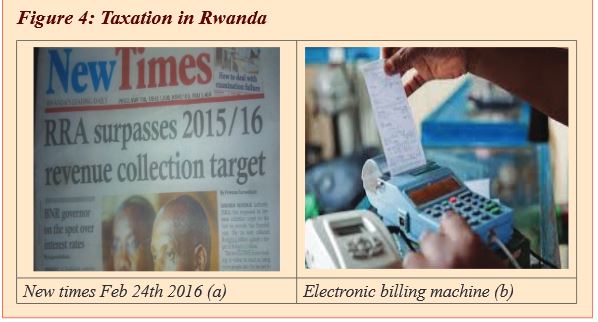

Facts
• Difficulty in determining the taxable income because the government lacks records of all the people’s incomes and jobs. This is because some people do a lot of activities some of which may not be declared to the government.
• High rates of tax evasion and avoidance: There has been lots of people refusing to pay taxes and others under declaring their incomes to the tax authority. This has however been reduced by the introduction of electronic billing machines which have been put in public buses like KBS, Royal buses among others. These machines automatically cut off the revenue when the user uses it.
• Large subsistence sector reduces tax base: Most of the people grow food for home consumption. They therefore do not have money to pay taxes. This has led to a narrow tax base.
• Scattered tax payers and this increases the cost of collecting the tax revenue. Since people do not carry out business in the same area, it may involve the tax collector to move from one place to another hence increasing the cost of collecting tax.
• Hostility of the tax payers especially in case of unfair direct taxes. Some tax payers are very hostile because of some taxes that may seem unfair to them. So they end up being hostile to the tax collectors.
• A high rate of smuggling reduces the tax base and revenue to the government sometimes the goods are smuggled into the country without paying taxes. This reduces the tax collected.
• There is a low level of income per capita because of poverty hence low revenue. By 2014 the per capita income of Rwanda was 695.7. This implies that the people were earning little income therefore their ability to pay was very low.
• High rates of corruption and embezzlement and this reduces the revenues meant to be collected by the government.
• Many illegal activities which yield income but are not taxed e.g. prostitution. This also leads to low tax base to the government hence little revenue.
Policies to improve tax collection in LDCs
• Improvement in administrative machinery, which will help to minimise the rates of tax evasion and avoidance hence increase tax revenue.
• Encourage income generating activities especially in rural areas to provide opportunities for employment so as to expand the tax base. This will increase the revenue to the government.• Providing adequate facilities to ease the process of tax collection e.g. transport, computers. This will reduce problems of computerised taxation and also access areas that are inaccessible.
• Tax diversity. New taxes have to be introduced. These will help to widen the tax base and the government will be able to receive more revenue.
• Improving economic activities like in the manufacturing sector, monetary expansion to increase investments and employment opportunities. This will also increase the revenue.
• Ensuring political stability so as to access areas from which taxes can come. The tax collectors will be able to cover those areas without any fear hence increasing tax revenue.
• Adopting a tax payer friendly system where the tax payers can freely pay at their time of convenience without pressure from the tax authority.
• Reduction on the grace period like tax holidays and exemptions given to investors. This will as well increase the tax base of the country.
• Reviewing the existing tax structure, policies and programs so that they are in line with the required targets.
Debt financing versus taxation financing
Debt financing refers to the government act of fulfilling its expenditure requirements through public borrowing either from internal or external sources or both. Or it is a practice in which a government spends more money than it receives as revenue, the difference being made up by borrowing or minting new funds.
Taxation financing refers to the government act of meeting its expenditure requirements through raising revenue from taxation. Taxation can either be direct or indirect which can either be levied on people’s income or goods and services.
Advantages of debt financing over taxation financing
Activity 7
Explain the arguments for and against debt financing over taxation financing on an economy.
Facts
• Borrowing is a more reliable source of income than taxation which has high rates of tax avoidance and evasion.
• More revenue is realised through borrowing unlike taxation whose revenue comes in bits.
• Borrowing encourages savings because the public is able to buy government securities which is a means of savings while taxation which reduces peoples income and savings.
• External borrowing increases aggregate demand because it may increase money in circulation unlike taxation which reduces people’s disposable income .
• Borrowing is cheaper in terms of costs administration and time unlike taxation with its high administration costs.
• Borrowing strengthens ties between the lending and borrowing country than taxation which causes unrest in the country once high taxes are levied.
• Internal borrowing can be used to fight inflation than taxing the people.
• Borrowing can be used to raise money in times of emergence which is quite hard with taxation.
• Individuals and institutions are willing to lend because of the interest involved than paying tax.
Disadvantages of debt financing/ advantages of taxation
• Borrowing increases dependence on other countries and international bodies unlike taxation which enhances self –reliance.
• Borrowing is associated with debt servicing which encourages capital flight unlike taxation where funds remain in the economy.
• Borrowing increases the debt burden which may lead to BOP disequilibrium.
• Borrowing involves strings attached such as use of expatriate manpower thus capital flight unlike taxes which is non-quid pro quo.
• Repaying the loans has external and internal burden to the citizens of the borrowing country which may not be the case with taxation.
• Borrowing may be inflationary in the long-run, if it is a dead weight debt yet taxes on incomes reduce or may control inflation.
• Borrowing may lead to wastage if the borrowed funds are not properly utilised i.e funds may be mistaken to be free money which is not the case with taxation.
• The burden of borrowing may be shifted to the future generation who may not have borrowed from the borrowed funds which isn’t possible with taxation.
10.2 Fiscal policy
Activity 8
Visit the school library or the internet and research on the following:
1. Meaning of fiscal policy.
2. Tools and functions of fiscal policy.
Facts
Fiscal policy refers to the deliberate use of taxation, borrowing and government expenditure to regulate the level of economic activities or stabilise development. In more developed countries, the role of the fiscal policy is to stabilise the economy, while in less developed countries, the fiscal policy is designed as an instrument of economic development. The policy instruments of fiscal policy include the following;
(a) Taxation. This is the most effective instrument of the fiscal policy. Taxes can either be direct or indirect.
(b) Public borrowing. This is either internal or external and can be either national borrowing or public borrowing.
(c) Government expenditure. This involves ways of how the government uses the revenue got. It can either be through re-current expenditure (expenditure for day to day activities) or capital expenditure or development expenditure (expenditure on development like infrastructure).
10.2.1 Forms of fiscal policy
There are two basic types of fiscal policy.
1. Expansionary fiscal policy: This type of fiscal policy is aimed at stimulating the economy and creating more growth. The government either spends more or cuts taxes, or both if it can. The idea is to put more money into consumers’ hands, so they spend more. This jumpstarts demand, which keeps businesses running and hopefully adds jobs.
2.Contractionary fiscal policy: This type mainly is used to control inflation and hence to slow economic growth. The tools of contractionary fiscal policy are used in reverse: taxes are increased, and spending is cut leading to reduction in demand.
10.2.2 Objectives of fiscal policy
The fiscal policy aims at achieving the following;
1.To increase the rate of economic growth: Fiscal policy promotes and accelerates the rate of investment both in private and public sectors. This can be done by reducing consumption while encouraging savings which can be used to finance investment. Public expenditure on economic and social overheads provides larger employment opportunities, raises incomes and increases the productive capacity of the economy.
2. To increase employment opportunities: Fiscal policy can be used to create employment. The Government can increase its expenditure on social and economic overheads. When the Government starts public works like the construction of roads, power projects and the like, it creates employment opportunities.
3.To reduce inflation: The fiscal policy can be used to overcome inflation. Taxes can be used on people’s incomes so as to reduce their demand. The fall in demand results into a fall in prices. However, the aim of the fiscal policy is not only to overcome inflation but also maintain stability in the general price level.
4. To reduce balance of payment deficit: A balance of payments deficit can be overcome through taxation. Direct taxes reduce the disposable income leading to a fall in demand for all goods including foreign goods. This consequently improves the balance of payments position since there is a fall in demand for foreign exchange.
5. To reduce income inequality: The fiscal policy can redistribute income from the rich to the poor. A progressive tax can be used to redistribute income. The amount of tax revenue obtained from the rich can be invested in productive projects which can help to increase the income of the poor.
Unit assessment
1. Analyse why Rwanda Revenue Authority has to levy taxes.
2. Examine the reasons as to why some people in Rwanda refuse to pay taxes.
3. Why does Rwanda rely more on borrowing than taxation to finance her development budget?
4. Advise the government of Rwanda on how to increase the tax base and capacity in the country.
10.3 Glossary
Advalerem tax: This is a tax charged according to the value of the commodity.
Backward shifting: This is where the tax payer shifts the liability/ burden to the previous party in the chain of distribution. E.g. producer to the raw material provider in form of paying low prices.
Customs duty: This is a tax levied on goods being moved across the boundaries of a country. It is composed of import and export duty.
Consumption tax: This is a tax paid by the consumer when buying the goods for consumption.
Debt financing: The government act of fulfilling its expenditure requirements through public borrowing either from internal or external sources or both.
Direct tax: This is levied on the income or property of the consumer the burden of which cannot be transferred to another person.
De-regressive tax: This is where a tax rate has progressive elements at lower levels of income but the amount remains uniform at higher levels of income.
Excise duty: This is a tax imposed on locally manufactured goods whether they are for home consumption or export.
Forward shifting: This is where the tax payer shifts the burden/ liability to the next party in the chain of distribution inform of high prices e.g. producer to the consumer.
Fees: Payment made by an individual for personal services rendered to them by the government.
Fines: These are penalties imposed on citizens who break laws.
Horizontal equity: This states thatpeople with similar situation should be treated equally e.g. people with same incomes charged equally.
Indirect taxes: These are taxes imposed on goods and services.
Licenses: This is a payment made to the government to secure permission to carry out any gainful activity.
Octori tax: is tax charged on goods passing through the territories of a country.
Proportional tax: This is where the tax rate is the same for all income levels. It has a uniform percentage for different income groups.
Privatisation: This is the transfer of ownership from the public sector to the private sector.
Progressive tax: This is where the rate of tax increases with increase in income level. The higher income group pays a higher amount of a tax both in real terms and percentage terms than the low income earners.
Rent: This is the provision of government assets to private individuals for commercial purposes.
Regressive tax: This is where the rate of tax decreases with increase in income. The poor are taxed more than the rich in relative means as those who get more income suffer less.
Specific tax: This is a tax levied per unit of output.
Sumptuary tax: This is a tax levied on commodities to discourage their consumption by making their prices high.
Sales tax: This is a tax levied on sales and paid by the seller
Structure of taxation: This refers to the composition, ways taxes are levied and its effects on the citizens.
Taxation financing: This refers to the government act of meeting its expenditure requirements through raising revenue from taxation.
Taxable capacity: This is the ability of the tax payer to pay a tax levied without affecting his or her standard of living.
Tax transformation: This refers to substituting the production of a taxed commodity by anon taxed commodity so as to avoid the effect of a tax.
Tax rebate: This refers to the reduction of tax rates to private investors to encourage investments.
Tax burden: This refers to direct impact/ effect felt by the person who pays the tax.e.g. loss of money.
Tax: This is a non quid-pro-quo compulsory payment by an individual to a tax authority.
Tax base: This refers to all activities or items upon which taxes are imposed.
Taxation: This is a process of collecting tax revenue from different sources to be used by the government in the development of the economy.
Taxable income: This is income which is liable to taxation by the tax authority.
Tax evasion: This is the deliberate refusal of the tax payer to pay the tax levied on him.
Tax avoidance: This refers to the exploitation of the loopholes by tax payer to pay less or no tax at all.
Tax impact: This refers to the first resting place of a tax.
Tax incidence: This is the final resting point of a tax.
Tax shifting: This refers to transferring part or whole amount of the tax liability/burden from the original tax payer to someone else.
Value Added Tax: This is a tax charged on the value of activities at every stage of production process.
Vertical equity: This states that people with un similar situations treated differently e.g. the rich should be charged differently from the poor.
Unit summary
• Meaning and common terms used in taxation• Purpose of taxation• Principles of a good tax system• Classification of taxes• Progressive• Proportional• Regressive• De-regressive• Types of taxes• Direct taxes• Indirect taxes• Structure of taxation in Rwanda• Problems and policies to improve taxation• Debt taxation and taxation financing• Fiscal policy• Forms• FunctionsUnit 11: POPULATION
Key unit competence:Learners will be able to analyse the impact of
population growth on economic development.
My goals
By the end of this unit, I will be able to:- Explain the terms used in relation to population.
- Identify the reasons why the population census is carried out and the difficulties encountered. Explain population structures and the population pyramid.
- Explain the factors and impacts of population growth.
- Explain the assumptions of Malthusian population theory and the limitations.
- Distinguish between under, over and optimum population.
- Illustrate population structures using pyramids.
- Describe the population distribution.
- Calculate population density and population growth and analyse its impact on an economy.
- Assess the relevance of population control measures.
- Illustrate and analyse the relevance of Malthusian population growth theory in LDCs.
- Discuss with the aid of illustrations the stages of demographic transition theory and its limitations.
- Use illustrations to explain the causes and effects of under population and overpopulation.
- Be aware of the impact of population growth in an economy and advocate for population control measures.
11.1 Population
11.1.1 Meaning Population
refers to the number of people living in an area at a particular period of time. It includes both permanent and temporary residents. While the sociologist is concerned with the social problems which arise from changes in population structure, an economist is generally more interested in the way population changes affect the production and distribution of goods and services. There are two major functions of population and these include:• Population is the major consumption unit• Source of labour which is the major factor of productionActivity 1
Basing on photos a, b and c in figure 1 on page 365, visit the library or internet and research on the following:1. What is population?2. How do we discover population of a given area /country?3. Rwanda counted her population in:(a) 1992 (b) 2002 (c) 2012 (d) 20154. Why does a country count its population?5. What problems are faced in the exercise of counting the population of an area/ country?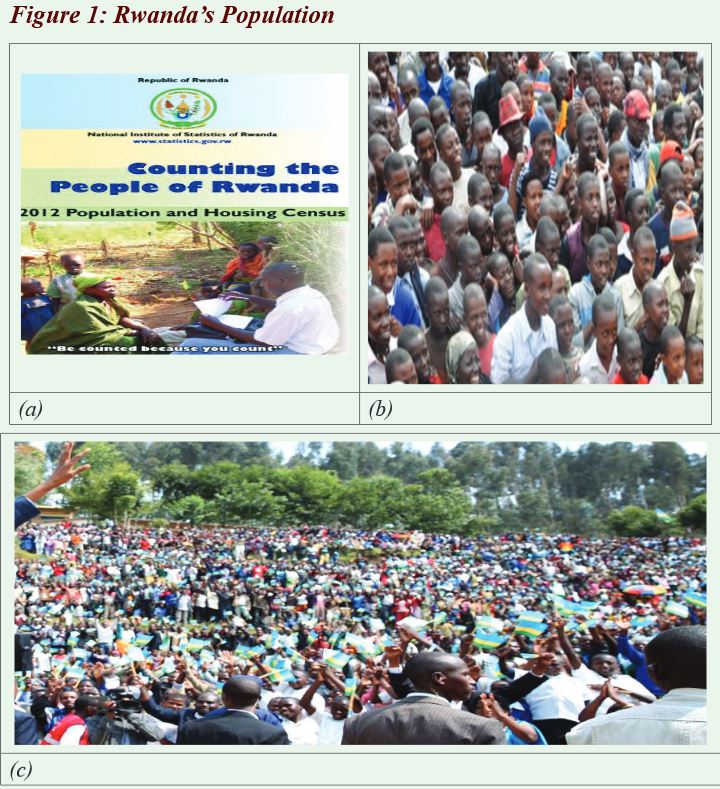
11.1.2 Terms used in population
Population census
Population census is an enumeration or the counting of people living in a particular area / country at a particular period of time. The major reason for carrying out a population census is planning. As a standard recommendation, each country needs to conduct a census at least once every 10 years in order to update information collected in the previous endeavour e.g. In Rwanda, the first population census was conducted in August 1978, the second in August 1991, followed by the third in August 2002and the population was estimated to be 10,537,222 peopleas of August 15 th 2012 “census night”Reasons for carrying out population census
Population census in any given country is carried out for different reasons. But Rwandacarried out national housing and population census because of the following reasons.• To determine the current size of the population of Rwanda, its spatial distribution among Provinces, Districts, Sectors,Cells and Villages and among rural and urban areas.• To determine the present demographic, social, economic and cultural characteristics of the population of Rwanda.• To determine the level, structure and trends of fertility, mortality and migration in order to come up with the natural andoverall growth rates of the population of Rwanda.• To provide indicators to enable advocacy for particular groups of the population such as women, children, youth,elders, disabled persons.• To determine characteristics of households, housing conditions and household welfare in Rwanda to further usethis information for a more elabourate poverty mapping of the country.• To produce national population projections using updated demographic data and other information on populationdynamics to enhance future planning.• To update database providing information right down to the smallest administrative unit in order to enhance thecurrent government policy of “villagisation”.• To provide clear details of the current statutory boundaries of all administrative units of the country to whichappropriate geographical codes shall be assigned.• To constitute an updated sampling frame for Rwanda and produce maps for each Enumeration Area (EA) for futuresample surveys.• To promote the use of census data at national and local levels in formulating, monitoring and evaluation ofdevelopment programs.Difficulties met in population census in Rwanda
Different countries face different problems during the census and even the same country faces differentproblems at different times and places. These are some of the difficulties faced in carrying out a census:• It costs a lot of money which poor countries cannot afford e.g. paying enumerators, processing data, logistics in formof stationary etc. which are expensive.• Remoteness of some areas which are inaccessible e.g. because of mountains, deserts, hills, forests etc. So suchpeople cannot be easily reached during a census which leads to estimations.• Wars and instability make it difficult since people are scattered everywhere.• Nomads i.e. people who move from place to place, also make counting difficult as its difficult to locate them on thecensus day.• Illiterate persons are unable to provide required information e.g. some don’t know when they were born or when theygave birth to their children.• Some people don’t give the actual information about population data for economic, political and religious reasonse.g. some people think the government will use the data to charge them more taxes.• Traditions and cultures are a problem e.g. some cultures don’t allow people to count their children with a belief thatafter being counted they die and such people even hide from census personel.• Poor infrastructure makes some places unreachable.• Lack of qualified personel in most cases the census is conducted by village chiefs and primary school teachers whomay lack complete competence to conduct the exercise.11.1.3 Population density
Activity 2
Basing on Figure 2 on page 368, visit the person in charge of social and economic welfareat your district headquarters and research:1. What is population density?2. What is the population density of your district and Rwanda in general?Which is the most densely and sparsely populated district/region in Rwanda?3. Identify the consequences of densely and sparsely populated areas.
Facts
Population density is the average number of people per unit space. It is an expression of the population existing overa specified area unit usually expressed in terms of the number of inhabitants per such an area unit which may be square kilometer, hectare or acre.The population density of Rwanda has increased from 321 persons per sq.km in 2002 to 416 in 2012 at national level;the highest in the East African Region and quite high compared with other countries globally.
With the exception of Kigali City whose density exceeds a thousand people per sq.km, the highest densely populated province is the Northern Province with 528 persons per sq.km, while the province with the lowest density is the Eastern Province with 275 persons per sq.km.At the district level, except in Kigali City where district densities exceed 1,200 persons per sq.km, the densities are higher in the Districts of Rubavu (1,041) and Musanze (695), while the districts with the lowest densities are Kayonza (179) and Nyagatare (243). For example:Rwanda had a population of 10,537,222in 2012 people and a total area of 26,338sqKms,its population density was calculated as:
11.1.4 Population structure, trend and distribution and impact
Activity 3
Visit the library or the internet and research about the structure of Rwanda’s population in terms of:(a) Age and sex composition(b) Geographical distribution(c) Occupational distribution(d) Structure in terms of quality.(e) Citizenship.(f) Religious denomination(g) Marriage/ marital statusFacts
When looking at the structure of the population, we look at age composition/ distribution, sex composition/distribution, population densities, employment structure, literacy patterns quality of the population and population growth rates.Age and sex composition of a population is shown by use of population pyramids. Population pyramid is arranged with the youngest age group at the bottom and the oldest at the top, at intervals of 5-10 years. It has two bar graphs, one for males and another for females side by side. Their shape reflects birthrate and death rate patterns as well. The shape of a pyramid varies according to the structure of the population i.e. expansive pyramid (broad base indicating high population of children and narrow top indicating low proportion of older people).This is common in LDCs as illustrated below: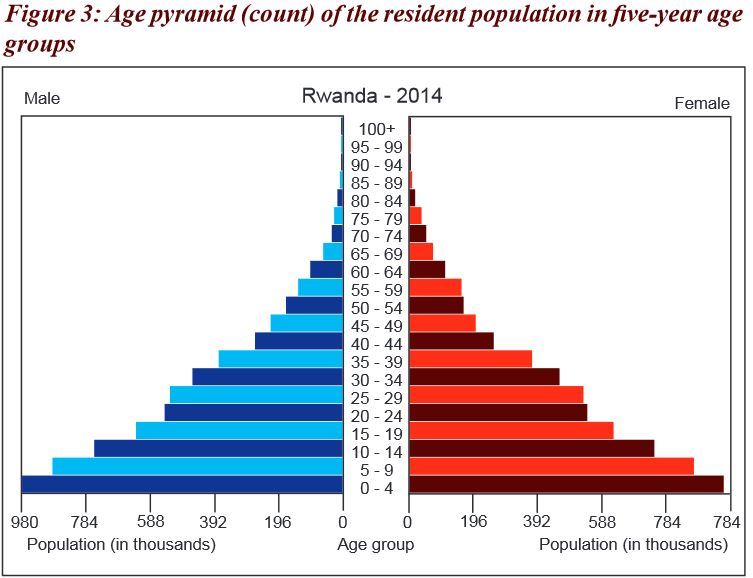 The age distribution shown in the age pyramid above in figure 3, indicate the largest population as the young between 0-14,as years go by, population goes on reducing to the extent that there are few people who reach the age of 80 years. If one compares the distribution to the situation at the time of the 2002 Census (SNR, 2005), an increase in the proportion of the oldest age groups is clear. The share of people over 80 years old increased from 12% in 2002 to 16% in 2012. This alsoreflects the positive change in terms of life expectancy over the past decade.The age distribution also shows that a higher proportion of women than men are in the older age categories, especially inurban areas. Living conditions and health may deteriorate faster among elderly men than among elderly women. Conversely,a larger proportion of elderly men are in the 60–64 age groups.
Implication of the above pyramid
• Low life expectancy• High birth rate• Effect of civil wars• A large number of the rural population• Poor living conditions1. Age distribution
Here we look at the young (0-15 years), working age (15-64 years) and the old (64 +). The old and the youngare called dependants. Age distribution is affected by fertility rate, mortality rate, death rate and migration.2. Dependence ratio
Dependence burden is the ratio of non-working to the working population. The non-workinginclude the young (0-15years). These are called dependants. The working include (15-64years).
Implications of a high dependence ratio in an economy
Activity 4
Assess the implication of a high dependence ratio in Rwanda.Facts
Positive implications
• Greater percentage of the young is a source of cheap labour in the future.• There is a large market potential which will increase aggregate demand and investment.• A high dependence ratio awakens the government to plan well for the citizens.• Encourages hard work to meet the demands etc.Negative implications
• Low levels of savings and consumption because of high rate of consumption.• Unfavourable balance of payment position because of the increased importation to supplement the local output.• Underutilisation of resources due to a small percentage of labour force.• High dependence burden frustrates the smaller working class and this may lead to brain drain.• May lead to demand pull inflation because of low output by the small working population.• Income inequality because of high rates of expenditure and dependence.• Strains the existing services like med-care, education among others.• Fall in per capita income and the standard of living as one’s income is used to sustain a number of dependants. etc.3. Sex composition
Here population is characterised according to number of females to males. The sex ratio of a population expressesthe number of males to every 100 females in a given population. E.g. in Rwanda, there are 93 males for every100 females. Figure 4 below shows the change between 2002 and 2012 at national and provincial levels.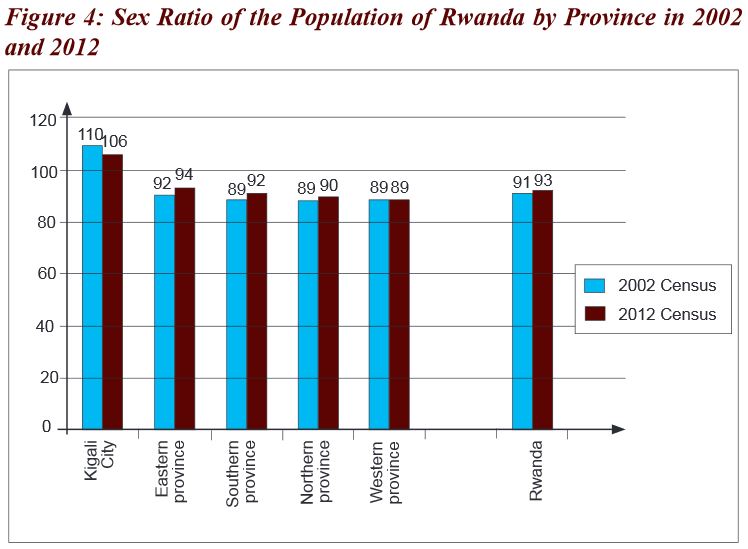 Figure 4 above shows that, apart from the districts of Kigali City where there are more males than females (sex ratio of 106), there are more females than males in the rest of the districts with sex ratios varying between 99 (Nyanza District) and 86 (Ngororero District). 11.2.3
4. Geographical distribution
This is assessed basing on density i.e. number of people per square kilometer, regional distribution, rural and urbandistribution etc. In Rwanda, at the provincial level, the Eastern Province has the highest population of about 2,600,814people, followed closely by the Southern Province and the Western Province with 2,594,428 and 2,476,943 peoplerespectively, while Kigali City, with 1,135,428 people, has the lowest population.At the district level, Gasabo and Nyagatare are the districts with the highest population numbers with 530,907 and 446,944 people respectively, while the districts with the least population numbers are Nyarugenge and Rulindo with 284,860 and 288,452 people respectively.
5. Structure in terms of quality
Here educated levels and health status are determined. Rwanda’s education levels have tremendously improved from the past, where many children are joining and completing primary, secondary and university as well, with the implementation of universal primary and secondary education. This has improved not only their literacy levels but health as well and standard of living in general.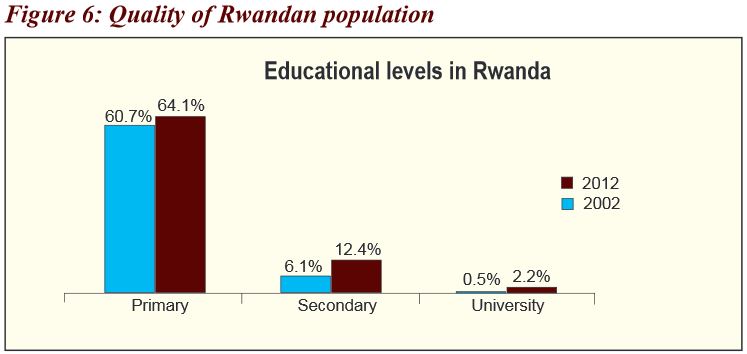 Figure 6 indicates a great improvement in primary, secondary, and university levels of education inRwanda from 2002 to 2012 which implies an improvement in literacy rates of Rwandan population
6. Citizenship
Here we determine the indigenous population and the foreign population e.g. close to 100% of elderly as well as younger persons living in Rwanda are of Rwandan nationality, although in urban areas the percentage of foreign nationals is slightly higher (3%). Among those persons who have a foreign nationality, neighboring countries represent the majority of foreign nationals in Rwanda.More than half are from the DRC (54%), although this represents a decreasefrom 2002, when over 70% of foreign nationals were Congolese (SNR, 2005). Nationals from Burundi rank second, contributing 15% of the foreignnationals in Rwanda. European nationals are more common among the elderly population with foreign nationality (6.2%) than among the younger population (1.4%).7. Religious denomination
Religions and their composition are determined. In Rwanda there are many religious affiliations where everyone has a right to join any religion he / she wishes to. More than one in every two elderly persons in Rwanda is Catholic, fewer than three in every 10 are Protestants and one in every 10 is Adventist.There are very few elderly persons with other religious beliefs. Compared to the younger population, a larger proportion of elderly are Catholics and a smaller proportion are Protestants. A certain resistance to embracing religions that are newer to the country may explain this difference.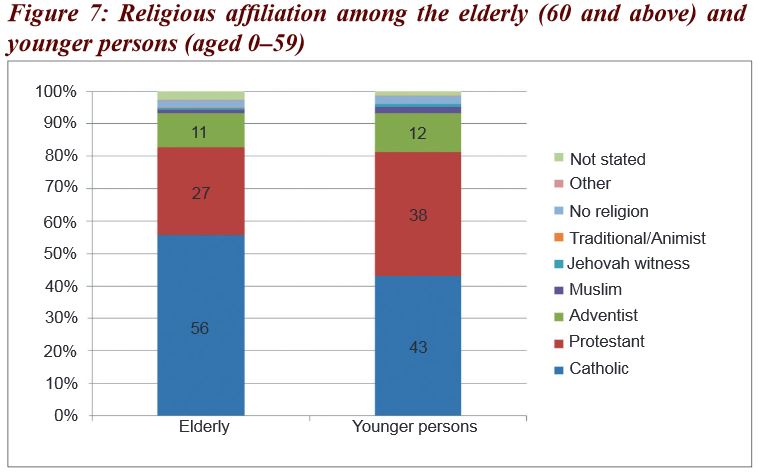
Source: Fourth Rwanda Population and Housing Census.
8. Marriage/ marital status i.e. single, married, divorced, separated, widowed
In Rwanda, 57% of the elderly are currently married, 39% are widowed, and 2% have never been married and 2% are divorced. When distinguishing by sex, one observes a very high percentage of currently married elderly men (84%), while this is the case for only 38% of elderly women, who tend to be already widowed (58%).Factors that may explain this difference include women benefiting from higher life expectancy, higher rates of re-marriage among elderly men than elderly women. The marital status of elderly people is similar across areas of residence. The percentage of those never married, divorced, and widowed is slightly higher in urban areas, while in rural areas a larger share of the elderly were married at the time of the census.9. Ability and disability
i.e. difficulties in performing various activities (walking, seeing, hearing, etc.),
We find the disability prevalence to be higher among the elderly than the general population e.g. 100,657 persons aged 60 or older declare that they are living with a disability, out of which around 60% are women and 40% men. Similar to the general distribution of the elderly population across areas of residence, most disabled elderly people live in rural areas.11.1.5 Population growth
Activity 5
Visit the school library or the internet and research on the following.1. What is population growth?2. What is the population growth rate of Rwanda?3. Discuss the effects of such a population growth rate in Rwanda.4. What determines the population growth of a country?5. Compare the population growth rate in Rwanda and her neighbouring countries.Facts
Population growth is the rate at which the population of the country increases or decreases over time. It is measured by percentage change in the population. The average annual population growth rate of Rwanda (2.6%) is among the highest in Africa. It is higher in the Eastern Province (4.3%) and Kigali City (4.0%) and lowest in the Northern Province (1.0%) and Southern Province (1.9%).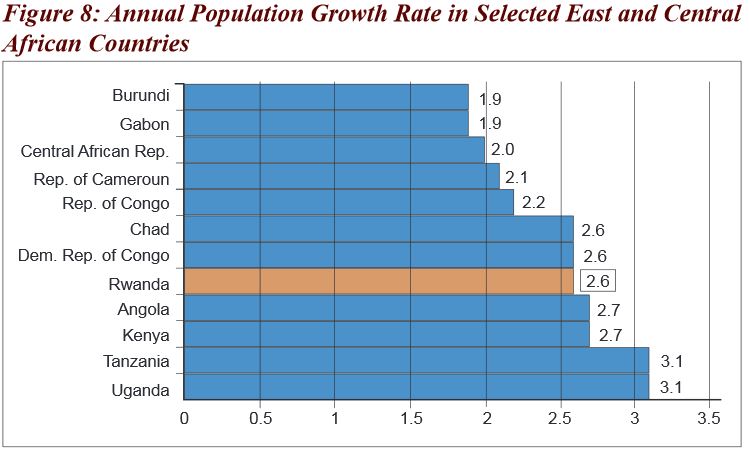 There are three major types of population growth as shown below:
Activity 6
Basing on the knowledge from the research in activity 5 on page 377,work out and present the following in your exercise books:1. Identify the ways in which population growth can be measured.2. What are the factors that influence birth rate and death rate in an economy?3. Given that the rate of a given area is 80 and death rate is 45, calculate the population growth of that area.Facts
1. Natural population growth rate
This is brought about by an increase in the birth and a fall in the death rate.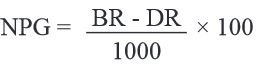
2. Artificial population growth
This is due to migration. I.e. immigration refers to the coming of people to stay in the country therefore it increasesthe number of people in the country while emigration refers to people moving to settle in other countries thereforeit reduces number of people in the country.3. Actual population growth
This is population growth resulting from combination of natural and artificial growth.Actual population growth = BR-DR + Net migration (immigration-emigration)The population of a country may increase due to the following factors:• Birth rate may be increasing more than the death rate• Death rate may be falling while birth rate remain constant• Immigration may be greater than emigration• When the percentage of married women in the total population is big• When women are given low status in society i.e. when they are thought to be only producers of children.There are three major determinants of population growth of a country1. Birth rate
This is the number of children who are born per 1000 of the population in a year.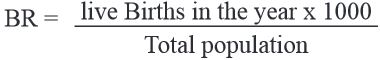 Birth rate is affected by the following factors:• Ratio of women to men. The higher the ratio of women to men, the higherthe birth rate and the lower the ratio, the lower the birth rate.• Level of education. Educated people tend to produce less children compared to the uneducated.• Rate of birth control. The higher the use of control measures like family planning,the lower the birth rate and the reverse is true.• Number of married people in the country. In some countries people delay to get married while others remainsingle and this reduces the birth rate, where marriage is at a high rate, birth rates will be high.• Religion. Some religions do not accept the use of family planning methods while others accept polygamy andall these increase birth rates.• Marriage age. Where the marriage age is high e.g. above 18, birth rates will be low while a lower age, will increasethe birth rate.• Culture. Some cultures believe in polygamy while others believe in children as a source of wealth. This increases birth rates.• Government policy towards limitation of the number of children one can produce.
2. Death rate
This is the number of people who die per 1000 of the total population in a year.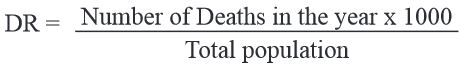 Death rates of the country depends on the following:• Medical care. If medical care if available, death rates will be low and vice versa.• Poverty levels, the higher the rates of poverty, the inability of the person to get the basics hence highdeath rates, lower rates of poverty will lead to low death rates.• Political situation. High rates of instabilities will cause high death rates compared to good political atmosphere.• Natural disasters like earth quakes, floods among others increase death rates.• Accidents like fire, motor etc. all increase death rates.• Incidences of diseases in some areas also influence the death rates. etc.
3. Migration
Migration refers to people coming in to settle in the country (immigration) and people going out of the countryto settle in other countries (emigration). People move from one country to another because of many reasons like;• Political instabilities in their countries• Looking for jobs• Weak migration laws making it easy to move to other countries• Some countries allow duo citizenship so people find it easy to move from one country to another• Desire to change environment• Having friends and relatives• Seeking for education etc.Measures to control population growth
Activity 7
Rwanda education Board (REB), through its department of curriculum development, has of recent taken a decision of revising the schools’ curriculum in all subjects at all levels. One of the cross cutting issues addressed in all subjects at all levels, is comprehensive sexuality education.1. What do you think was the intension of REB to tackle this issue?2. What impact does it have on population growth rate of Rwanda?3. Why is it necessary for your country to control the rapid population growth rate?4. What other measures can be taken by the government of Rwanda to control population growth?Facts
Population is controlled because of the problems associated with a big size of population. If populationis not controlled, then a number of problems will occur. Thus it is important to control population through:• Introducing sex education in the school curriculum to educate the youths/ teenagers about the dangersof early sex which normally results into unwanted pregnancies which increases birth rate.• Encouraging family planning which includes the use of contraceptives.• Promoting girl child education since educated people produce few children because of different reasons.• Discouraging early marriage by raising the age of consent and punishing those who break the law.• Legalise abortion to prevent unwanted pregnancies where marriage laws are difficult to enforce.• Encouraging international migrations so that people can move to different countries.• Setting up institutions to encourage population control e.g. family planning clinics, hospitals etc.• More campaigns to discourage polygamy which results into high birth rates.• Improve health facilities to reduce infant mortality rates to assure parents that the few children produced will survive.• Reducing the demand for children by reducing their incentives like free education and bursaries. etc.• Rural development programs e.g. modernisation of agriculture and establishing socio- economic infrastructure.• Use of coercive measures e.g. fines, penalties, jail sentences or sterilisation of men who break population laws.• Increasing government expenditure so as to increase productivity such that economic growth copes with population growth.• Encouraging social mobility among women by taking up formal jobs.• Provision of social and economic incentives to small families as a means of discouraging people from havinglarge families e.g. giving free child education to the first 2 children in a family, housing and free medical facilitiesto such families.• Economic disincentives are instituted on large families e.g. denial of free education, medical care, high taxes onsuch families etc.• Encouraging internal migrations from areas of dense population to sparsely populated areas.• Massive sensitisation to the public by the government and non-government organisation about the dangersof high population growth rate and consequences of many children..11.2 Population theories
Malthusian population theory
Activity 8
Visit the school library or the internet; carry out research and present in class.1. State the Malthusian population theory.2. What are the assumptions underlying the theory?3. Illustrate the Malthusian population theory on a graph.Facts
This was put up by Reverend Thomas Robert Malthus an English Economist (1798 — 1823) who pointed out the dangers of over population in relation to the supply of food in relation to food supply. It explains the relationship between the growth in food supply and in population. Population depends on food supply.When food supply increases, population growth increases and vice versa. The theory states that population increases faster than food supply and if unchecked leads to misery. Man’s biological capacity to reproduce himself exceeds his physical capacity to increase the food supply.Assumptions of the Malthusian population theory
Reverend Malthus assumed that:• Population growth depends on food growth and that when food supply increases, population also increases.• The supply of land is fixed thus the operation of the law of diminishing returns.• Population grows at a geometric rate i.e. 2,4,8,16,32, etc.• Food increases at an arithmetic rate of 2, 4,6,8,10,12, etc.• Man’s capacity to reproduce himself is greater than his capacity to produce food. Malthus therefore concluded that atone time population growth will be too much to be fed by the available food and this will lead to misery, suffering and death.• Every effort to improve the conditions of people through state subsidies and private charity would fail because of theincreased population growth it generates.Malthus predicted that there will be a point where population growth will be equal to food production and he termed this population trap and beyond this point the food resources will not be enough to feed the population.Malthus identified positive checks and negative checks on population growth. The positive checks check on populationgrowth in a crude way and they include famine, death, accidents, wars etc. the negative checks check on population growthby reducing the birth rates. They include late marriage, family planning, moral restraint etc. From the figure 9 above, Line bcd represents the growth of population in the absence of any checks. The actual population growth rate is represented by line bce in the presence of checks. Beyond time
 , population growth exceeds food supply, and therefore people are likely to starve to death. Malthus indicates that always there are positive and negative checks operating.
Applicability/ Relevance of the Malthusian theory in LDCs
Activity 9
From the research made in activity 8 on page 383, basing on the assumptions of the theory,to what extent do you think is the theory applicable to Rwanda and LDCs in general?Facts
To a small extent, the Malthusian population theory is applicable in LDCs’ economies in the following ways:• Farming planning measures are being used in many countries as suggested by Malthus to control population growth.• The positive checks like diseases, accidents etc. exist in many countries.• In many parts of the world, pressure on land forces many people into disputes and migration.• Some areas in the world face food shortages as suggested by Malthus.• Land being a fixed factor, faces diminishing returns in that when population increases, productivity of the land decreases.Criticisms/ limitations of Malthusian theory
To a big extent the theory is criticised because of the following:• He did not consider the role of foreign aid in assisting the increasing population.• Malthus never stated the time when population growth would equal the food supply (population trap).If the time were known, then probably the government would devise ways and means of either increasingfood supply or controlling population.• Food is not the only determinant of population growth as suggested by Malthus but there are other causeslike migration, level of education, cultural values etc.• He underrated the agricultural technological developments in the production of food. He could not foresee theunprecedented improvements in agricultural technology. Due to this rapid improvement in agricultural technology,the food supply has increased much faster than the arithmetical progression.• The theory did not put into consideration international trade which can increase food supply by importation but considereda closed economy.• The possibility of modernising agriculture to increase agriculture was not foreseen by Malthus.• There is no mathematical relationship between food growth and population growth.• International migrations were ignored by the theory. The population could not outstrip the food supply due to internationalmigrations. i.e. he did not consider people moving from one country to another to reduce population pressure.• Malthus never thought of the possibility of getting additional supplies of land by opening up new areas.• According to Malthus, preventive checks possibility only pertains to moral restraint and late marriages. Malthus neverthought of the introduction of modern techniques of family planning devices.• Malthus takes the increase in population as a result of rising birth rate. Population, however, has increased tremendouslydue to a decline in the death rate. He could not foresee the rapid improvements in medical facilities.11.3 The theory of demographic transition
Activity 10
Visit the school library or internet, carry out research and present the following in class;1. What is demography?2. Explain, with the aid of illustrations, the stages of demographic transition.3. According to stages of this theory, where do you think Rwanda’s current level is and why?Facts
Demography is the study of population characteristics like birth rates and death rates and their effects on population changes. The theory explains population growth in historical perspective in developed countries. According to this theory, population in developed countries has passed through 5 stages to reach where it is today and it is shown in the figure 10 below.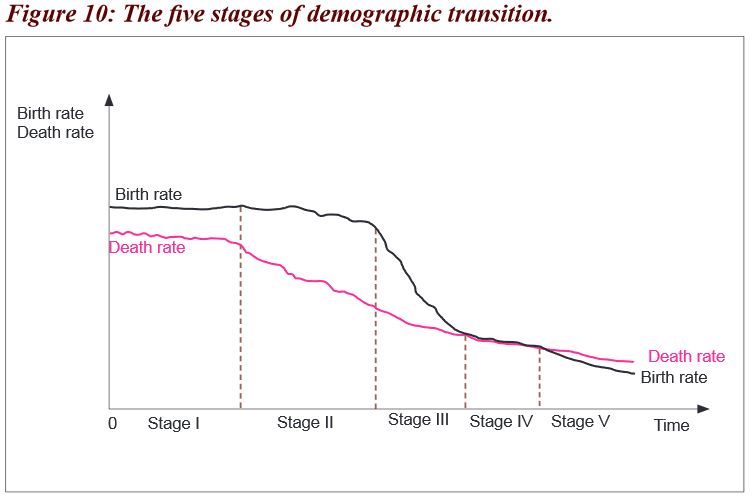 Stage I: At this stage there is a high population growth rate and it is stagnant because of a high birth rate and high death rate. The high death rate is due to poor living conditions, poor technology, food shortages, and illiteracy among others.The stage is characterised by widespread poverty, large families where children are taken as assets, source of income and a source of employment.Birth control is not heard of and hence, high birth rates. Along with the high birth rates, the death rates are also high due to: poor medical facilities, poor medicare, poor nutrition, poor housing and poor clothing. Consequently, the high birth and death rates remain approximately equal during this stage leading to more less a static equilibrium with zero population growth rates.Stage II: Expanding phase marked by high birth rate and high but declining death rate. The economy enters the phase of economic growth. Agricultural and industrial productivity increases leading to increases in incomes. The birth rate remains high and stable as in stage I. Individuals do not have any inclination to reduce the birth rate since children are able to add more to the family income.The death rate is declining due to good quality food products, improved medical and health facilities and introduction of modern drugs. With a stable birth rate and decline in the death rate, population increases at a rapid rate leading to a population explosion. Population is increasing at an increasing rate.Stage III: It is a stage of declining population growth rate. The declining birth rate is accompanied by rapid decline in the death rate. As a consequence, population growth rate declines.Stage IV: The low stationary stage with low birth rate balanced by low death rate. The birth rate declines and tends to equal the death rate so that the population growth rate is almost zero. In this stage, the standard of living is generally high.Stage V: The declining stage with low death rate, lower birth rate and an excess of deaths over births. In this stage, the decline in birth rates is greater than the decline in the death rate leading to a negative population growth rate.
Problems of applying the demographic transition
• Developing countries differ in many respects from Western nationsas they moved through the demographic transition.• Population growth is higher now in many countries than before.• Mortality declines have been much more rapid.• Fertility levels are much higher.• Migration does not serve as a safety valve.The concept of optimum, under and over population
Activity 11
Visit the school library or internet and research on the following:1. Distinguish between optimum, under and over population.2. Examine the social-economic implication of optimum, under and over population.3. With the aid of an illustration, show the relationship between optimum, under and over population.Facts
Optimum population
This is that size of population which is neither too big nor too small for the existing amounts of resources. Or itis that population that is just appropriate for the existing resources. This population has got implications such as• There will be full employment level• High standard of living• High output per worker• There can be no dependants on imports• Minimum income inequality• High tax revenue to the governmentUnder population
This is a situation where population is less than the available resources. Or it is that populationwhich is insufficient in relation to the available resources.It has got the following implications:Positive implications
• Over exploitation of resources is reduced.• Reduced government expenditure on the provision of social services.• Limited imports hence avoiding balance of payment deficits.• Limited income inequality due to enough resources for everyone.• High output per person due to the resources available.• Minimal social and political instability.Negative implications
• Leads to excess capacity in the country i.e. producing less than the installed capacity.• Small market size which leads to low aggregate demand.• Low tax revenue to the government.• Low levels of economic growth due to limited production of goods and services.• Limits international trade due to low levels of imports and exports.• Low levels of specialisation and a tendency to undertake subsistence production.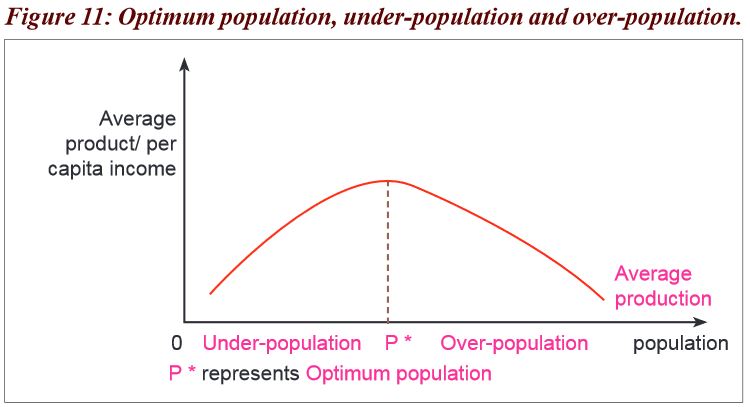 In the above figure 11, before point
 , the population is still low compared to the resources available. At point p* there is optimum population where the population matches the available resources and after that point the population exceeds the available resources and utilisation of resources.
Overpopulation
This is a situation where there are excess people in relation to the available resources.Or it is the population which is in excess of the optimum population.Positive implications
• Big market size due to the large population.• Generates cheap energetic and mobile labour force.• Encourages specialisation in production hence promotes trade.• High tax revenue due to a wider tax base.• Increased resource exploitation due to high levels of innovation and invention.• Increases pressure on development projects due to competition.• Government is awakened the responsibility of providing social services.• Initiates effort to work harder to sustain the big population.Negative implications
• Heavy dependence burden especially when there is an increase in the young and the old.• Excessive demand for social services like hospitals and schools among others which increases government expenditure.• Low saving rates because of excessive consumption leading to low investments and low capital accumulation.• Over exploitation of natural resources which speeds up resource depletion.• Low standard of living due to decrease in the per capita income.• Unemployment and underemployment results due to limited opportunities in relation to the population.• High rates of illiterates because of inadequate education facilities.• High rates of brain drain due to skilled labour being unemployment.• Social and political problems arising from competition for opportunities and food riots.• Too much congestion in rural and urban areas which results in diseases and crimes etc.11.3.1 An ageing population
Activity 12
Through individual work, in your exercise books, explain the following;1. An ageing population.2. The effects of an ageing population in an economy.Facts
An ageing population is a population which is experiencing an increase in the old people and a fall in the percentageof the young. It is caused by factors that increase life expectancy combined with those factors that reduce birth rates.Effects of an Ageing population
• Decline in labour force for the future.• High dependence burden.• Labour immobility i.e. the old are immobile.• High levels of conservativeness because the old tend to obstruct new ideas.• Increased government expenditure on retirement benefits.• Reduction in aggregate demand for some commodities because the clothes for the youth may not be consumed by the old. This may lead to laying off of some workers.• There is a change in the patterns of consumption i.e. goods for the old like huts, long dresses, big trousers among others.• The burden of paying taxes and developing the economy falls on the young ones.• More goods for the old people are now being produced e.g. hats, walking sticks, big trousers, very long dresses, big shirts,etc.• Structural unemployment. As the demand for the products of those industries engaged in products for the young falls,there is the possibility of some workers being laid off.• There will be shortage of labour to new industries. If the population is ageing, it will be unable to supply the required labourto both new and expanding industries.• Older people are more conservative and less innovative and this therefore, retards development.Declining population
This is the population which is continuing to be small in numbers. It is causedby factors that increase death rates and reduce birth rates.11.4 The population structure of Rwanda
Activity 13
Visit the school library or the internet and research about the population structure of Rwanda.Facts
• There is generally low life expectancy i.e. according to National institute of statistics in Rwanda 2011 lifeexpectancy for males was 58years while females 59.5 years.• There is high levels of unemployment and underemployment.• More than 70% of the population is employed in agriculture either directly or indirectly.• There is a high level of illiteracy levels especially among the old.• There are more women compared to the number of men in the total population.• Nearly half of the population is below 18 years and a few are above 65 years.• Population grows at a rate of about 2.6 per cent.• There is variation of population density with levels of about 416 per square kilometer and fewer in other areas.11.5 Population problems in LDCs
Activity 14
Identify different problems of population in LDCs and present in class.Facts
• Dependants — Heavy dependence burden and therefore poor standards of living.• Population pressure.• Low capital accumulation — low saving, investment levels, low income per capita.• Diseases, poor health and housing conditions — generally low standards of living.• Problem of feeding the population.• Poor quality of the population — low education.• Unfavourable balance of payments.• Rural-urban migration with all its consequences like urban unemployment, creation of slums, crime, etc.• Heavy government expenditure on social services increases.• High rates of income inequalities/ disparities.• High rates of social evils like prostitution, witchcraft among others.• Increased pressure on land.• Increased pressure on infrastructure like social services.• High rates of brain drain in search for employment.• Unemployment problem.Unit assessment
1. Discuss the social – economic implication of an economy where 60% of the population is below adult age,10% is above retirement age and annual population growth rate of 4%.2. (i) Analyse the population problems that your country is facing.(ii) Advise Rwanda government on how to control population growth11.6 Glossary
- Actual population growth: This is population growth resulting from combination of natural and artificial growth. Actual population growth = BR-DR + Net migration (immigration-emigration.
- A declining population: This is one which is continuing to be small in numbers as shown by low birth rates and an increase in death rates.
- Age Structure:This is the age composition of a given population.
- An ageing population: This is one which is experiencing an increase in the old people and a fall in the percentage of the young. It is caused by factors that increase life expectancy combined with those factors that reduce birth rates.
- Artificial population growth: This is due to migration i.e. both immigration and emigration.
- Birth rate: This is the number of children who are born per 1000 of the population in a year.
- Child mortality Rate: This is the number of children who die between the ages of 1 to 5 per 1000 live births in the year.
- Death rate:This is the number of people who die per 1000 of the total population in a year.
- Declining population: This is the population which is continuing to be small in numbers. It is caused by factors that increase death rates and reduce birth rate.
- Demography: This is the study of population characteristics like birth rates and death rates and their effects on population changes.
- Fertility Rate: This refers to the average number of children a woman is expected to produce in her life time.
- Infant mortality Rate: This refers to the measure of the number of deaths of infants. Children who die between the ages of 0 to 1 per 1000 live births in the year.
- Life expectancy: This refers to the average number of years a person is expected to live.
- Natural population growth rate: This is brought about by an increase in the birth and a fall in the death rate.
- Optimum population: This is that size of population which is neither too big nor too small for the existing amounts of resources. Or it is that population that is just appropriate for the existing resources.
- Over population: This is a situation where there are excess people in relation to the available resources. Or it is the population which is in excess of the optimum population.
- Population: This refers to the number of people living in an area at a particular period of time.
- Population census: This is the counting of people in a particular area at a particular period of time.
- Population growth: This is the rate at which the population of the country increases or decreases over time. It is measured by percentage change in the population.
- Under population: This is a situation where population is less than the available resources. Or it is that population which is insufficient in relation to the available resources.
Unit summary
• Population• Meaning• Terms used in population• Population Census• Population density• Population structure, trend and distribution• Population growth• Population Theories• Malthusian population theory• Demographic Transition theory• Theory of Optimum populationUnit 12: LABOUR AND WAGES
Key unit competence:Learners will be able to explain the impact
of labour mobility on the economy.
My goals
By the end of this unit, I will be able to:- Identify categories of labour and characteristics of the labour force in LDCs.
- Explain the factors influencing labour demand, supply,efficiency, and mobility.
- Identify man power problems in LDCs.
- Explain the methods of determining wages in an economy.
- Identify the causes of wage differentials in an economy.
- Explain the forms of wage control in an economy.
- Explain the objectives, types,tools, benefits,disadvantages, and weaknessesof trade unions in LDCs.
- Analyse the impact of labour mobility in an economy.
- Discuss the methods used to determine wages in Rwanda.
- Examine the applicability of wage theories including the backward bending supply curve in LDCs.
- Describe the effects and measures to reduce wage differentials in Rwanda.
- Justify the need for government control of wages and its effect on an economy.
- Describe the operation of trade unions in an economy.
- Assess the impact of trade unions on the efficiency of labour.
- Acknowledge the role of labour mobility in solving manpower problems in LDCs.
- Appreciate the role of trade unions in bridging wage gaps in LDCs.
12.1 Labour and wages
12.1.1 Meaning
As a factor of production, the term ‘labour’ can be used to define any human effort both mental and physical directed towards the process of production of goods and services. The type of job one does and the financial compensation received for it are very important in our society. In the past, the terms blue collar or white collar or pink collar employees were used to describe the type of job.Blue collar implies manual labourers, white collar for officer workers,and pink collar represents jobs associated with women like nursing, secretarial.Activity 1
Using photos in figure 1 below, discuss the following questions:1. Define the term labour and give the different categories of labourbasing on the activities they do as seen in the photos.2. Explain reasons why labour is needed in society.

Categories of labour
Labour can be categorised into the following:1. Unskilled labourThis is labour which has received no special training and has few specific skills. As our society has grown into an increasingly technological one, the members of this group have developed more and more skills. A mechanic, for example, used to be considered unskilled labour. Today that is no longer the case. Mechanics require a great deal of skill and training to work with today’s modern engines.2. Semi-skilled labourThis refers to labour which has some training to handle certain tasks but with little or no skills.3. Skilled labourThis is labour that has received specialised training to do their jobs. They have developed a special skill and may or may not need to be licensed or certified by the state. Some examples of skilled labour are: carpenters,plumbers, electricians, business executives and managers, artisans, accountants, engineers, police, mechanics, etc.4. ProfessionalsThese are the elite of the labour grades and include those workers who need an advanced degree to do their jobs. The three primary groups of professionals are doctors, lawyers and teachers. These are white collar workers.Labour can also be grouped under;(a) Productive and unproductive labour: Productive labour is that labour which isactively involved in the production process and it is paid wage or salary.(b) Unproductive labour is one that isn’t involved actively in the production of goods and services.Labour force
This is defined as the number of people who are in the working age whether they are employed or not. In Rwanda the working age is believed to be eighteen years of age. Anyone below that age when involved in work is regarded as child labour. Anyone above that age is regarded as working class whether employed or not.Determinants of Labour force
• Size of the population: The bigger the size of the population, the more the labourforce while if population size is small, labour force will be small.• Structure of the population: If the population is composed of many women as compared to men,the labour force will be low especially in work that is suitable for the men as compared to the women.• Age of the population: If the population is comprised of many young children, the labour force will be lowwhile if the population is composed of many old people, labour force will be large.• Rate of brain drain: When the rate of brain is high, labour force in that country will be low but it will be highin that country where labour moves to.• Migration rate: High rates of emigration reduces the size of labour in a country where labour is coming fromwhile immigration increases the size of labour force in the receiving country.• Retirement age: When the retirement age is low, the size of the labour force will be low but if the retirement ageis high, the size of labour force will be big.• Political situation: Political instability and insecurity, reduces the size of the labour when labour seeks for refugeein other countries while stability will always lead to a large size of the labour force.• Rate of population growth: The higher the rate of population rate, the higher the size of labour force while a lowpopulation growth rate leads to low labour force. etc.12.2 Demand for labour
Activity 2
Explain the following:1. Meaning of demand and supply of labour.2. Factors that affect demand and supply of labour.3. Explain the reasons why people may leave work even when wages are high.Facts
Demand for labour refers to the number of labourers needed by an employer at a given wage in a given period of time.The demand for labour is always derived. Labour is demanded not for its own sake but because there exists a demandfor the goods or services which the entrepreneur may produce with the help of labour. If the demand for a certain good is increasing, the demand for labour will also increase and vice-versa.Factors affecting demand for labour
• The demand for labour also depends on the supply of other factors of production. As land and capital cannot be usedwithout labour, the demand for labour must also depend on the supply of these factors.• The price of other factors of productionalso influences the demand for labour. For instance if the price of capital is high,the demand for labour may increase, as there could be substitution of labour for capital.• Demand for products which labour produces: If the demand for the product is high, more labour will be needed to produce
that product hence the demand for labour will increase.• Cost of labour: If the cost of labour compared to the total cost of production is high, less labour will be demanded and viceversa.• The ease of substitution of labour: If labour can easily and cheaply be substituted, the demand for it will be low because anemployer will prefer to use its substitutes like machines.• Degree of competition: If the competition for labour among the firms is high, the demand for labour will be high and vice versa.• Elasticity of demand for the final product: If the demand for the final product is high, the demand for labour will be high and if itis low the demand for labour will be low.12.2.1 Labour supply
This refers to the number of hours an individual is willing to offer for work per day, week, month, or year. For an individual, the decision on how many hours to offer to work depends on the real wage and on an individual’s attitude towards leisure and income.The supply of labour is offered by households, and the traditional assumption is that more work will be offered for higher wages, implying an up sloping supply curve for labour as seen in figure 2 on page 407.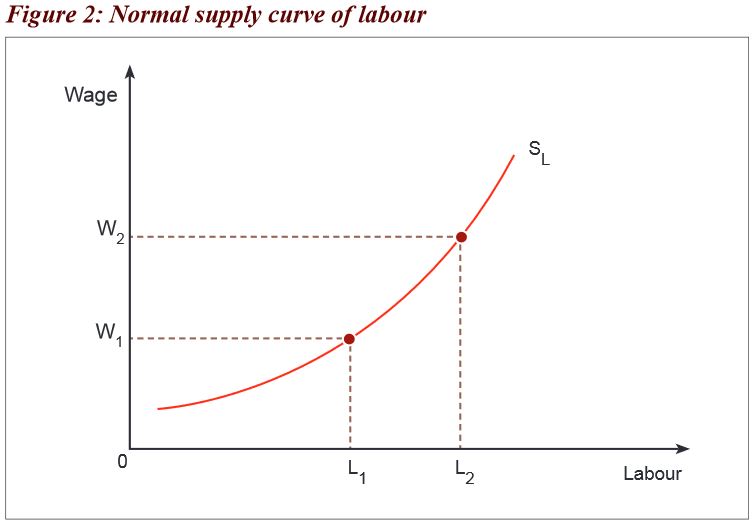 From Figure 2 above at a higher wage
 , the supply of labour is
  while at a lower wage
 , the supply of labour is only
  However, it has long been recognised that for some individuals or groups of workers, higher wages might lead to a reduction in hours of work offered. This may lead to a backward bending supply curve. The shape of the curve may be due to the following:• The worker in effect prefers leisure at higher wages.• It is also the case with target workers. After achieving the target, the worker eitherreduces effort or stops to work despite an increase in the wage.• Desire to live on accumulated wealth.• Old age where even if the wages are high, labour may not increase supply etcHowever, it has long been recognised that for some individuals or groups of workers, higher wages might lead to a reduction in hours of work offered. This may lead to a backward bending supply curve. The shape of the curve may be due to the following:• The worker in effect prefers leisure at higher wages.• It is also the case with target workers. After achieving the target, the workereither reduces effort or stops to work despite an increase in the wage.• Desire to live on accumulated wealth.• Old age where even if the wages are high, labour may not increase supply etc.
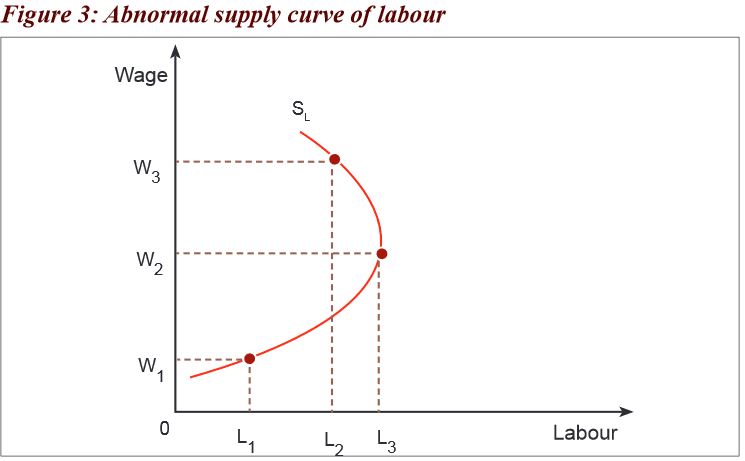 From Figure 3 above, at W1, supply is
 when the wage increases to
  , the supply will increase to
 , however when the wage increases to
 , labour supply reduces to
 .
.Factors determining labour supply
• Size of the population: In a country where the population is big, the labour force will also be big leading to a highlabour supply• Structure of the population: If the majority of the population is below the working age, or mainly full time students,labour supply will be low and vice versa.• Incentives offered: If these such as wages and salaries are high, labour supply will be high and if low, labour supplywill be low.• Level of education: In a country where the people are educated, the supply of skilled labour will be high and vice versa.• Health conditions of workers: If the conditions of workers are good, they are willing to supply more labour becausethey are able to work and vice versa.• Retirement age: Ihe earlier the retirement age, the higher the rate at which the people will leave the jobs and thelower the supply of labour.• Political situation: If a country is politically stable, people are guaranteed securityand labour supply will be high andis low in areas where people fear to risk their lives.• Job security: Jobs that have high risk of retrenchment attract less labour force compared to those that have low risksof retrenchment.• Job esteem: Jobs that command high respect especially professional jobs attract a large part of labour force thanthose where respect is low. E.g toilet cleaning• Period of training: The longer the period of training, the lower the supply of labour in the short-run but the shorter theperiod of training, the higher the supply of labour.12.2.2 Efficiency of labour
Activity 3
Mr Murekeraho has been teaching economics at Nyamata high school for the last eight years.He has worked so hard that he has always produced the best results in Bugesera district and waseven given a prize by the district mayor in 2014.Basing on this information, respond to the following questions.1. What do we call the act of producing better results by Mr Murekeraho?2. Explain the factors that determine Mr Murekeraho’s capability.3. What factors may limit his capability?Facts
Efficiency of labour refers to the ease with which labour is able to produce good quality and high quantity output in the shortest time possible. Labour is said to be efficient if it can produce good quality and quantity output in the shortest timepossible.Factors influencing efficiency of labour
• Physical condition of labour: If the health conditions of labour, levels of nutrition of the labour force is poor,its efficiency will be low but it will be high where labour is healthy and well-fed.• Level of technology: Where modern equipment are provided and used such as computers, efficiency of labourtends to be high compared to situations where primitive technology is used (traditional tools).• Working conditions of labour: When these are good especially job security, transport allowances etc, efficiency oflabour will be high and it will be low when the conditions are poor.• Degree of specialisation: If labour is highly specialized and skilled, it will become more experienced and efficient.• Quality and quantity of other factors of production: If other factors of production are available and of high quality,labour efficiency will be high and it will be low if the others of production are of poor quality.• Political atmosphere: Political security encourages concentration and efficiency among the labourers but whereinstabilities prevail,labour tends to be inefficient because it cannot settle at work.• Climatic conditions: Harsh conditions such as very hot and very cold tend to make labour inefficient but if conditionsare ideal or favourable, labour will be efficient.12.3 Labour mobility
Activity 4
Referring to activity 3, due to Mr Murekeraho’s efficiency, he has been given part time jobs to teachin several schools in the country and currently he has been offered a job at Riviera high school in Kabuga.Basing on this information, discuss the following questions and make a presentation to the class.1. How do we call Mr Murekeraho’s movement from one school to another and from one area to another?2. Explain the factors that determine his movements.3. What factors may hinder movement of labour from one place and work to another?Facts
Labour mobility is the ease with which labour can move from one occupation or area to another.Labour mobility can therefore be geographical or occupational. Labour can either be;(a) Specific labour: This is labour that cannot be changed from one production activity to another for example doctors.(b) Non specific labour: This is labour that can be transferred from one use to another for example unskilled labour likecar washers.Labour mobility can be either geographical or occupational as seen below;Geographical mobility of labour
This is the ease with which labour can move from one geographical area to another in search for work. People always move from one place to another depending on the activities that may interest them. Some move for economic reasons, social reasons and political reasons among others. The movement of labour from one area to another is influenced by many factors are seen below;Factors influencing geographical mobility of labour
• Transport and communication: The lower the transport cost, the easier for labour to move from one areato another and the higher the transport costs, the more hard for labour to move from one place to another.• Degree of ignorance: In cases where people are ignorant about the available jobs, the lesser the rate of movementbut if people are aware of the available jobs, mobility of labour will be high.• Nature of climate:Areas with good climate tend to attract more labour compared to areas which have harsh climatei.e. too hot and too cold.• Level of wages: Areas with high wages attract more labour than areas which give low wages.• Cost of living: Labour tends to move away from areas with a high cost of living to areas with low cost of living.• Degree of advertising: If the rate of advertising is high, labour will tend to move to those areas where the jobs are butwhen the rate of advertising is low, labour will be immobile.• Institutional barriers: This includes things like language barrier and if this exists, immobility of labour will be low becauseit becomes hard to communicate.• Political situation: Areas which are stable tend to attract more labour than those which are unstable.Factors limiting geographical mobility of labour
• High level of ignorance about the existing jobs: Some people do not know about the existing jobs in otherareas so they end up not moving from one place.• High wages got at the current job: If a worker is given a high wage at the current wage, he may not need tomove to another area looking for a job.• Poor transport and communication: Sometimes the transport and communication may be poor. Related toaccessibility, the worker may not be able to move to another place.• Good climate at the current place: People prefer to stay in good climate. When the climate in the current placeis conducive to the worker, he or she may not leave that place to go to another place.• Low cost of living at the current place: A cost of living in the current area may not tempt the worker to move toanother area where the cost of living may be high.• Low level of advertising: The low rates of advertising about the existence of other jobs in different areas may keepthe labour in the same area of region.• High level of attachment to family members: Some people are so much attached to their families to the extent thatthey cannot leave them. This closeliness may hinder labour to move to another area.• Inadequate Institutions: People are interested in areas that have institutions like banks, stadiums, movie halls amongothers. So if these are not found in a particular area, people may not move to such areas.• Political instability and insecurity: Some region may be politically unstable so people may not move to them for fearof their lives.• Language barrier: Internationally, people may fear to move to other regions because of the problem of language.For Rwanda, this may not be a limitation because the people all speak one language irrespective of the region of origin.• Old age limits movement: Old people normally always want to stay in one place so they may not move to another area.Occupational mobility of labour
This is the ease with which labour can move from one occupation to another. Normally according to the job search theory, labour will never stay in one area or job but it will still keep on looking for other jobs that may pay more. It involves two categories;(a) Horizontal mobility: A situation where labour changes from one occupation to another but it does not change its statuse.g. from a teacher Good Hope High School to a teacher in Corner Stone Leadership Academy.(b) Vertical mobility of labour: A situation where labour changes from one occupation to another but affects or changesits status e.g. from a teacher to a headmaster. The movement of labour from one area to another is influenced bymany factors as seen further;Factors determining occupational mobility of labour
• Level of education: If labour is highly educated, it becomes occupationally immobile because it cannot be substituted.• Degree of advertising: Where the workers are knowledgeable about the existing jobs, labour mobility will be high totake up such jobs and if the workers are ignorant about the existing jobs, mobility will be low.• Cost and length of training: Jobs which involve high cost and long duration of training don’t experience much labourmobility but where the cost and the length of training is low, mobility will be high.• Skills required: Jobs where highly specialized skills are required such as accountancy, and doctoring, mobility of labouris low but jobs where specialisation is not required, mobility of labour is high.• Age of the workers: As workers grow old, they tend to settle down on their jobs and they are unwilling to changeoccupation thus they become immobile but where workers are young, they tend to move from one job to another.• Government policy of retrenchment: When such a policy is carried out by the government, labour mobility will be highbut if such policies are not carried out, labour will be immobile.Factors that limit occupational mobility of labour
• Low Level of education: Because of the low level of education, labour may not be able to move to another job that mayrequire higher qualifications.• Better working condition in the current job: When the working conditions are favourable in the current job, labour maynot go out looking for other jobs.• Limited information about other jobs somewhere else: Some times labour is unaware of the existing jobs so it mayremain in one occupation.• Better wages at the current job: Better wages at the current job will keep the labour at the job and limit its mobility.• High prospects of promotion in the current job: When labour is expecting to be promoted in the long-run, it may notmove to another job instead it will become immobile.• High discrimination in the labour market: Sometimes there is discrimination in the labour market where by jobs are giveto the few known people so this hinders labour to move to other occupations.• High degree of specialisation: Labour that is so specialised may not change occupation. For example a doctor maynot easily change to a teacher.• Low status of the alternative job e.g. toilet cleaning: When the alternative job has low status for example toiletcleaning, labour may not move to that place instead it will remain in the current job.• High cost of training for the alternative jobs: Moving to new jobs requires training that sometimes the labour may notafford hence it will keep operating at the current station.• Old age of the worker: Old people normally always want to stay in one job so they may not move to another area sincethe employers sometimes prefer young and energetic youth.12.4 Manpower problems in LDCs
Activity 5
Discuss the following and present to the class.1. Causes of manpower problems in LDCs.2. Effects and solutions of manpower problems.Facts
Manpower is the labour force within a country. In any given economy, the quantity and quality of labour as a factor of production is important to the labourers themselves, the employers, the government, and the economy as a whole. Most developing countries are faced with numerous manpower related problems, which include among others the following;• Excessive labour supply in some sectors e.g. agriculture.• Scarcity of labour in some sectors e.g. engineering, medical services etc.• Low skills and competence due to low and poor education system.• Low levels of occupational mobility.• Brain drain of highly skilled manpower to developed countries.• Educated people are trained for white collar jobs which are not readily available.• High rural urban migration due to an urban biased education system.• Poor health due to poor feeding and diseases e.g. HIV/ AIDS.• Over dependency on certain categories of labour e.g. in consultancy work.Causes of manpower problems in LDCs
• Inappropriate education system which is based on the colonial arrangements before independence that does notaddress specific needs and interests of most LDCs . It thus creates white collar job seekers than makers.• Poor planning by government for expanding labour force with proper education, health and training, and putting upenterprises that absorb excess labour.• Structural changes within the economy e.g. if tastes and preferences change, it would change goods and servicesneeded, hence changes in labour requirements of employers.• Technological development which leads to replacing labour in production which creates technological unemployment.• High population growth rates which leads to excessive supply of labour.• Low wages paid to the professionals which has led to brain drain i.e. people especially highly skilled personnel who moveto Most Developed Countries (MDCs) to look for “greener pastures” or highly paying jobs.• Low levels of education due to high rates of poverty in LDCs thus leading to excessive supply of unskilled labour in LDCs.• Political instability and insecurity in some regions leading to shortage of labour in some areas or sectors.• Cultural and social ties/ beliefs that hinder people to move from one job to another.Manpower planning
This refers to a long-term projection of labour demand and supply aimed at attaining a balance between labour demand and supply at different levels of economic development. It is investment in education through a particular number of people/ labour in specific fields so that in the long-run there are no deficits or surpluses in the labour market.It involves a wide range of predictions and forecasting of the unskilled, semi-skilled and skilled workforce in an endeavour to develop the necessary human resource requirements of the economy.Measures to minimise the current manpower problems in LDCs
• Appropriate manpower planning necessary to minimise such irregularities.• Redeployment of the workforce should be undertaken to reduce shortage of manpowerin some sectors of the nationaleconomy.• The education system should be revised to avoid the production of more job seekers instead more job makers shouldbe produced.• Retrenchment i.e. the old, the sick, and the very disabled workers should be terminated to create an effective labour force.• Official exchange of manpower should be enhanced between governments, to not only reduce shortages of indigenousmanpower but also increase the supply of labour in all productive sectors of the economy.• Promotion of science and technology in all the needy fields e.g. medical, engineering etc.• Encourage the indigenous manpower to return home to serve in fields where there are apparent shortages.• There is need to improve working conditions and increase workers’ morale so as to reduce brain drain. e.g. setting ofa favourable minimum wage attractive the highly skilled indigenous manpower.• Encouragement of local entrepreneurs by enabling them to acquire loans so as to increase the supply oflocal entrepreneurs.12.5 Wages
Activity 6
Visit the library and research on the following then thereafter make a presentation to the classroom.1. What is a wage?2. Explain the different forms of wage and the determinants of a wage.Facts
A wage is a reward to labour as a factor of production for services rendered. A salary is a fixed reward to labour and it does not change because of time or pieces of work done.Real Wage is a wage in terms of what money can purchase. It is the purchasing power of money.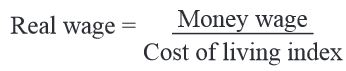
Forms of wages
Wages can be described in three forms as shown below;1. Living wages:Living wages has been defined differently by different people in different countries. The best definition is given by Justice Higgins which reads “Living wage is a wage sufficient to ensure the workman food, shelter, clothing, frugal comfort, provision for evil days etc. Thus living wages means the provision for the bare necessities plus certain amenities considered necessary for the wellbeing of the workers in terms of his social status.2. Minimum wages:The minimum wage may be defined as the lowest wage necessary to maintain a worker and his family at the minimum level of subsistence, which includes food, clothing and shelter. When the government fixes minimum wage in a particular trade, the main objective is not to control or determine wages in general but to prevent the employment of workers at a wage below an amount necessary to maintain the worker at the minimum level of subsistence.3. Fair wages: A fair wage is something more than the minimum wages. Fair wage is a mean between the living wage and the minimum wage. While the lower limit of the fair wage must obviously be the minimum wage, the upper limit is the capacity of the industry to pay fair wage which compares reasonably with the average payment of similar task in other trades or occupations.Methods of wage determination
There are different ways through which wages are determined some of which are seen below:Piece-rate earning Here a wage is given to the worker basing on how much work he or she has done. The wage very much depends on the effort of the worker — the greater the effort, the higher the wage and vice versa. This method is associated with the following advantages:• It stimulates output; the more the worker produces, the more he earns.• Less supervision is required.• Workers can proceed at their own pace.• The employer’s costing calculations are simplified.• The employer can identify inferior worker.• Quality may improve.• The inefficient workers cannot cheat the employer.Time-rate earning
This is a situation where a fixed sum of money is paid to a worker for a certain period of time say an hour or a month. The period is agreed upon by both parties — the employer and the worker. It is associated with the following advantages:• It is easily understood by both parties.• There is a regular income to the worker even during the time of sickness.• It is easy to calculate where work is hard to measure, e.g. Doctor’s services.• Time rates are more satisfactory than piece rates where a high quality of work is essential.• Encourages hard work/ over time.• Reduces conflicts between employers and employees leading to industrial peace.• Less hard working workers will benefit where there is no supervision.Sliding Scale
This is a method of wage payment, which is related to the cost of living. Workers are paid more if the cost ofliving increases, and they are paid less if the cost of living decreases. It has the following advantages:• The worker does not suffer from higher prices; and it protects the worker from rises in the cost of living.• Real income is maintained.Minimum wage legislationThis is the setting of a wage by the government above the equilibrium/ ruling market wage below which it is illegal to pay the workers. The wage set is known as a minimum wage. The goal in establishing minimum wages is to protect the workers from exploitation by their employers through paying very low wages. FromFigure 4 above, the minimum wage is fixed at
 above the equilibrium wage where demand for labour meets with labour for labour.
Through Trade unions
A trade union is a legally accepted association comprised of workers who come together in order to achieve specific objectives. The trade union as said earlier is made up of workers. These elect leaders who run the union on behalf of others. These trade unions through their representatives hold round table discussions (collective bargaining) with the employers in an attempt to achieve their objectives. Some of these may be increase in wages and good standard of living. So wages can be determined through the trade unions.12.5.1 Wage theories
1. The marginal productivity theory of wages
This theory states that a worker should be given a wage which is equivalent to his additional output. According to the theory, there is a direct functional relationship between the level of wages and the level of employment, and that a rational employer will attempt to adjust one or both of these variables so that the marginal product of labour is equal to the wages of labour.The theory states that under conditions of perfect competition, every labour will receive a wage equal to the value of its marginal product. The marginal product of one unit of labour is determined by adding to, or by withdrawing one unit of labour from a business, provided the supply of other factors of production is kept fixed. Assuming the supply of other factors of production constant and the price of the product remaining the same, the employment of more and more units of labour in a firm will increase the total product at a diminishing rate.Assumptions
• Employers are able to measure and predict in advance the marginal product of labour.• There is a free and complete competition among the employers for workers.• There is a free and complete competition among workers for jobs• Labour knows its marginal product.• Capital and labour are perfectly mobile.• Labour and capital are fully employed.• Labour is homogeneous.• Government does not interfere in wage determination. It is the forces of demand and supply that determine the wage.• The bargaining power of labour and management are equal.Weakness of the marginal productivity theory of wages
The weaknesses are discussed in light of LDCs.• Most of the employers do not have enough information to assess the marginal productivity of labour. They employlabour basing their judgment on the demand of their products in consumption markets. Many employers will pay fairlyhigh wages if the demand for their products is high.• Labour does not know its marginal product.• Wages are not determined according to the marginal productive theory but instead government sets wages — minimumwages.Government is justified to set wages since it is the major employer of both skilled and unskilled labour.• Labour is not homogeneous. There are skilled and unskilled workers.• There is no free and complete competition among workers for jobs due to tribalism, nepotism, religious differences, etc.• Labour and capital are not completely mobile.• To a very great extent, the bargaining power of labour management in LDCs is not equal. This is partly due to highlyelastic supply of unskilled labour drawn from redundant labour in the agricultural sector.2. Wages Fund Theory
This theory was developed by Adam Smith (1723-1790). His theory was based on the basic assumption that workers are paid wages out of a pre-determined fund of wealth. This fund, he called, wages fund created as a result of savings. According to Adam Smith, the demand for labour and rate of wages depend on the size of the wages fund. Accordingly, if the wages fund is large, wages would be high and vice versa.3. The Bargaining Theory of Wages
John Davidson was the profounder of this theory. According to this theory, the fixation of wages depends on the bargaining power of workers/trade unions and of employers. If workers are stronger in bargaining process, then wages tends to be high. In case, employer plays a stronger role, then wages tends to be low.4. Iron’s law of wages
This also called the subsistence wage theory was propounded by David Ricardo (1772-1823). According to this theory, “The labourers should be paid a wage that can enable them to meet their basic necessities in life. This payment is also called as ‘subsistence wages’. The basic assumption of this theory is that if workers are paid wages more than subsistence level, workers’ number will increase and, as a result wages will come down to the subsistence level.On the contrary, if workers are paid less than subsistence wages, the number of workers will decrease as a result of starvation, death, malnutrition, disease etc. and many would not marry. Then, wage rates would again go up to subsistence level. Since wage rate tends to be at, subsistence level at all cases, that is why this theory is also known as ‘Iron Law of Wages’. The subsistence wages refers to minimum wages.5. Residual Claimant Theory
This theory was developed by Francis A. Walker (1840-1897). According to Walker, there are four factors of production or business activity, viz., land, labour, capital, and entrepreneurship. He views that once all other three factors are rewarded, what remains is paid as wages to workers. Thus, according to this theory, worker is the residual claimant i.e. he should be given what remains after paying all other factors of production.12.6 Wage differentials
Activity 7
In Nyamaseke district, Mukangarambe and Umulisa are two different working class women though Umulisa is more educated than Mukangarambe. They are both nurses in a government and private hospitals respectively in the district. However, Umulisa earns amore salary as compared to Mukangarambe and because of this, her standard of living and way of life is far better than that of Mukangarambe.Basing on this information;1. What do we call the difference2. What factors make some people earn more than others?3. How has this difference in earnings affected the people in different societies?4. What should be done to solve the problem of differences in earnings in Rwanda?Facts
Wage differentials is a situation where different people in different or the same occupations or places earn different wages.It is very common experience that earnings in different occupations are strikingly different. There are occupations where the earnings are extremely low. There are others where the earnings are exceptionally high.The causes of such disparities lie on the side of both demand for labour and supply of labour. If demand for a certain type of labour is very high, the earnings must also be correspondingly high. If, on the other hand, a particular type of labour is not much in demand, their earnings are bound to be very low. The chief causes of variations in wages are:Causes of wage differentials in LDCs
• Human capital: Human capital is the knowledge, skills, education, training, and ability possessed by workers. Skilledworkers are those with lots of human capital; unskilled workers possess little human capital. Skilled workers receive ahigher wage than unskilled workers.• General attractiveness of the job: If a job is pleasant, many people will be attracted to it. The result will be that wageswill tend to be less than those occupations which are unpleasant.• Cost of learning a job: If there are certain jobs which require a very long training, the entry into that occupation orprofession will be very much restricted. The earnings in such a profession are naturally very high compared to a jobwhich requires short training.• Regularity and irregularity of employment: Those jobs which provide a regular employment throughout the year willbe accepted by the people even if the earnings are low. On the other hand, earnings in irregular jobs must be high enoughto attract people who are prepared to put up with the precarious nature of the job.• Immobility of labour: Workers are often unwilling to leave the area in which they live even if higher wages can be earnedby moving elsewhere. If labour is immobile, a lower wage will be paid unlike to the one which is mobile.• Future prospects: If an occupation gives hope of future promotion, or other benefits, people will accept a lower wage startin it, as against another occupation offering higher initial reward but no chances of rise in the future.• Social discrimination by race or sex: In some cases, wage differentials are due to race or sex.• Compensating wage differentials: Compensating wage differentials make up for high risk or poor working conditions.Construction workers on skyscrapers receive a higher wage because of the greater risk of death than construction workersrenovating a house.Effects of wage differentials
• Minimum economic welfare of some group of people because of low wages received by some people.• Reduction in aggregate demand: The rich have a lower marginal propensity to consume than the poor.The low wage earners are left with little money to purchase commodities. The reduction in aggregatedemand discourages investment.• Misallocation of resources: The high income earners spend on luxuries leaving the low income earnersto go without basic need.• Capital outflow especially when the high income earners are non-citizens who always repatriate their earningsto their home countries. In countries which are politically unstable, the high income earners prefer to invest/banktheir money in other countries where there is political stability.• It leads to reduction in government revenue since the majority of the people would be having little or no incomes to tax.• It leads to social disharmony where by the low income earners feel neglected and not catered for which results intoinsecurity and political instability.• It leads to failure of government programs when the majorities have no adequate means to participate in developmentactivities.• Regional imbalances come up because the regions with high income earners develop at the expense of others with lowincome earners.Measures to reduce wage differentials
• Education reforms have been undertaken: This has helped many people to access education so that they can beprepared to get high paying jobs.• Land tenure reforms: This is through land redistribution policies and making it accessible to all people in society sothat they can be able to carry out agriculture to increase their incomes.• Kick start funds like the one cow per family has helped people to access cows that can be used as source of incomethrough selling the milk and supplement their incomes.• Progressive taxation: This has reduced the gap between the high income earners and the low income earners.• Improving infrastructure like roads which helps in the movement of low income earners to other areas where theycan access high incomes.• Liberalisation of the economy: This has helped people to participate in economic activities and trade hence increasingtheir incomes and standards of living.• Controlling population growth: This has helped to reduce the demand for work leading to low competition for the fewjobs available hence giving high wages for those who take them.• Modernising agriculture: This has helped increase incomes of people in rural areas where the activity is fully based.The people are able to increase the quality and quantity of their products hence receiving more incomes.• Improvement of the investment climate: This has been through giving tax holidays and free land like the free investmentzone in Masoro. This has attracted more investors, reduced their costs of production hence paying workers relatively highwages.• Improvement of the political climate: This has created good environment for production where by low income earners canengage in other activities to supplement their incomes.• Encouraging development of small scale enterprises: These have alsocreated more employment for the people in Rwanda and hence improving their standard of living.• Actively participating in trade unions: This will help to advocate for better payments in areas of work and also good workingconditions.• Setting a minimum wage: This will enable the employers not to give workers very low wage.12.7 Wage controls
Activity 8
Visit the library and research on the following:1. What are wage controls?2. Differentiate between maximum and minimum wage.3. What are the advantages and disadvantages of wage legislation?Facts
Wage controls refer to the setting of a wage by the government above or below the equilibrium/ ruling market wage, below or above which it is llegal to pay the workers. There are different reasons why this is done by the government but the major ones are to;(a) Reduce exploitation of the workers by the employers through paying them a very low wage.This is reduced by setting a higher wage by the government at which to pay the workers.(b) Reduce exploitation of the employers by the employees through requesting and being paid very high wages.This is reduced by setting a limit beyond which the employers should not pay though this is not common.The two instances can further be explained.Minimum and maximum
The wage set above the equilibrium is known as a minimum wage. The goal in establishing minimum wages is to assure wage earners a standard of living above the lowest permitted by health and decency and to protect them from exploitation by the employers.The wage set below the equilibrium wage is called the maximum wage. Its major objective is to protect the employers from paying a very high wage to their workers. However this kind of wage legislation is not common in low developing countries. It is not common to find the government setting a wage above which people should not pay since wages are mostly determined by demand and supply of labour. From Figure 5 above, the minimum wage is fixed at above the equilibrium wage while the maximum wage is fixedat below the equilibrium.
Arguments in favour of minimum wage legislation
• To encourage employers to use labour intensive methods, thereby providing employment to more employees.• To discourage labour mobility especially from rural to urban areas. Paying the same wage to rural and urbandwellers discourages rural-urban migration.• To reduce wage differentials and as a consequence, the gap between the poor and the rich is reduced.• To satisfy the workers’ needs and raise standard of living.• To protect the workers from employers’ exploitation.• To increase the purchasing power of the workers. Consumption expenditures increase which in turn stimulatesdemand, investment and consequently employment opportunities are generated. The increase in the purchasingpower of the people gives an incentive to producers and hence an increase in productivity.• Minimum wages prove beneficial to the employers. This is because labour efficiency increases.• Minimum wages tend to reduce labour unrest and maintain industrial peace. Workers are now more satisfied.• It reduces relative geographical and industrial wage differential.Disadvantages of a minimum wage
• Cost of production increases leading to high prices.• A minimum wage makes employers to have preference for high wage.• Unemployment results. As wages increase, employers demand less workers but supply increases and hence unemployment.• Employers may now prefer to use capital-intensive techniques of production because machines may not demand for wages.• The purchasing power may decrease due to unemployment and consequently this discourages producers.• Leads to rural-urban migration since they are normally set and adopted in urban areas.12.8 Trade unions
Activity 9
The workers in Rwanda who are under the teaching profession, basing on the problems that they encounter during their activities, decided to formulate a group that could help to iron out their problems.Indeed the group that they formed has done a lot in assisting them have increase in wages, good working conditions among others. This prompted other workers of different profession to follow suit. Despite the success, the above groups have had many problems in attempt to fulfill their cause.Discuss the following questions:1. What name is given to the group formed by teachers mentioned in this activity?2. Explain the reasons why the group was formed.3. How has the group formed above benefited the members?4. What challenges has the group encountered in its attempt to fulfill its objectives?Facts
A trade union is an association of workers in a particular firm or industry that is formed with an aim of achieving specific objectives.It is a continuing and permanent democratic organisation, voluntarily created by and for the workers to protect them at their work. Normally they carry out their work through round table discussions through their representatives and the employers. They have the following objectives:• To advocate for high wages.• To advocate for good employer-employee relationships• To advocate for good working conditions.• To advocate for social benefits like medicine, transport amongothers.• To advocate for respect between employers and employees.• To advocate for job security.• To advocate for representation in company’s decision making.Types of trade unions
There are different types of trade unions and these include:1. Craft unionsThese are trade unions formed to organise workers according to their particular skills. E.g. engineers, teachers, printers, doctors, lawyers etc. Members of such unions can be in different organisations.2. Industrial unionsThese are unions which attempt to organise all workers in a particular industry, regardless of the job done by workers and their skills. It is a common type of workers’ organisation.3. White collar unionsThis is a union that brings together members in the clerical and administrative staff who are paid salaries. This is common in teaching, banking and legal services.4. Open shop or General unionsThese are unions that allow any one into membership i.e. Workers from all types of industries and with any level or range of skills are recruited. Such unions usually have a large number of unskilled memberships.5. Closed shop unionsThese are unions where particular employees are required to join a given trade union before they are employed in an Organisation or firm. Membershipof the union is a prerequisite for gaining or retaining employment in a particular firm or Organisation.Tools / methods used by trade unions to achieve their objectives
Trade unions use a diversity of methods which are either peace or violent or both to achieve their objectives. Such methods include, among others the following:1. Collective bargainingThis refers to the negotiation process between employers and employees association regarding establishment of procedures that concern conditions of work, terms and rates of pay.This is a peaceful method/ process that aim at strengthening worker employer relationship.2. Giving ultimatum/ Grace periodEmployers are given a time limit to respond to the workers’ demands beyond which workers may withdraw their labour services.3. Go slow tacticsWorkers in here slow down their pace of working by reducing their pace of working and reduce their productivity and total output as well. This is done by reducing hours of work and output so as to make the employer feel the impact of it on the organisation.4. Work to rule/ dotWorkers apply the firm’s rules and procedures to the ‘letter’ with the aim of slowing down production. For example, workers arrive at work on time and leave on time regardless of quantity or quality of work done. In here, there is malicious obedience.5. Sit down strikeHere workers lay down their tools, they will report at their work place but they will not work at all.6. DemonstrationThese are open protests against unfair treatment of workers e.g. marching through the streets. They carry placards/posters along. The aim is to shame the employer, attract attention and sympathy from the public and government against the employer.7. PicketingThis is whereby the trade union members prevent their fellow members from working, by positioning or deploying of members at the entrance of business premises stop any potential workers from proceeding to work. This is designed to make the organisation feel the impact of the workers absence.8. Boycott of the firm’s product/ sabotageTrade unions may de-campaign the firm’s product openly in the public so that the product loses market, pack wrong weights or members may also boycott from consuming any of the product. This is aimed at causing severe loss of revenue to the company/ Organisation. This method however requires a lot of finance or it may be expensive.9. Mediation or arbitrationThis involves the intervention of a neutral party acceptable to both parties (employers and employees/ Trade unions) to resolve the industrial dispute or make the recommendations for resolving the disputes. For example, ministry of labour and social welfare. It is normally agreed beforehand that the two parties will accept and respect the decisions and recommendations of the arbitrator.10. Industrial courtHere workers can present their claims or case to the industrial /Organisation court which examines the case or dispute and makes the recommendations or ruling which is binding to both parties. The court may award or reject their claims.11. Mass media campaign against the firm (press war)Here, trade union members can approach a re-known radio, television newspaper etc. so as to get their demands clearly spelt out and it is intended to capture sympathy as well as public support.12. Further education and trainingTrade unions may organise seminars and workshops for members so as to improve their skills required in the labour market hence increasing labour productivity. This is aimed at improving their bargaining power as well as increased demand.13. Boycott of personnelWorkers may also decide to reject some person and refuse to work with them as their supervisors. This happens when such persons (the supervisors) are in disfavor of workers’ interests.14. Restricting labour supplyThis is where trade unions restrict employers to employ more new workers without permission. i.e. members require a particular employee to first join a given union in order to retain or obtain employment. This is aimed at strengthening the bargaining power of trade union members.15. Violent industrial strikeThis is done as a last resort in case all the above peaceful methods fail. It is a violent process which involves withdrawal of labour, putting down tools, destruction of buildings, machines and even loss of lives. It is intended to force employers to accept the needs of employees immediately.Benefits of trade unions
Trade unions have played a big role in increasing the wages of theirworkers whom they represent basing on the following arguments:• A rise in the cost of living: Trade unions demand higher wages because of an increase in the cost of living.This is because a rise in the cost of living reduces the real wage of the trade union members.• Comparative wage rates argument: This is based on the idea that people doing similar jobs should get more-or-lesssimilar rewards. For instance, a teacher of G. S. Kibungo should get almost the same salary as the one of Green hillsacademy. Hence different institutions have tried to increase the wages basing on that argument.• The increased profit argument:The increased profits in the industry justify a higher return to labour. The trade unionis justified to press for higher wages whenever the profits in the industry increase. However, the trade union may notknow the profits earnedin the industry.• The productivity argument: Trade unions demand higher wages if productivity increases. However,there are several problems involved with this argument:(a) Most increases in productivity arise from improvements in the quality and performance of the capital equipment onwhich labour is employed. This would be unfair to those workers in the industries where there are no rapid changesin technology.(b) A larger number of workers are employed in occupations where it is difficult or impossible to measure productivitye.g. the productivity of teacher, doctor, etc.(c) In some occupations, it may be very difficult or even impossible to increase the productivity. This may be dueto circumstances beyond control of the worker, e.g. the driver who cannot increase his productivity becauseof increased traffic congestion.• Trade unions have also played a big role in improving the standards and working conditions of the peoplethrough advocating for fair treatment at their areas of work.• Trade unions also have helped in creating and advocating for job security for the people they represent. This isthrough seeking for work permits for their members and this has helped to reduce fear from the people about theuncertainty of their jobs.Failure/ weakness of trade union in low developing countries
Trade Unions in LDCs have failed to raise wages due to the following reasons:• Workers have no keen interest in the trade union: Trade unions represent a small proportion of the total labourforce and therefore, they are in a weak bargaining position.• Leadership problem: Trade unions have poor leadership as they fail to present their wage claims in the right manner.They have no correct approach thus their wishes have not always been granted.• Unemployment: There is open unemployment in LDCs. There is a large surplus of labour in the agricultural sector.On top of this, there are so many job seekers migrating from the countryside to the urban sector. In a position like this,where the possible supply of workers is much greater than demand, it will be quite difficult for the trade unions to pushwages up.• Financial difficulties: Trade unions are always in financial difficulties. To begin with, the incomes of union members aregenerally low, and they are therefore reluctant to pay union dues.• Government interference: In most cases, governments of LDCs interfere in the running of trade union affairs. Strikes ofany nature are made illegal.• Tribal, religious, political and racial differences cause disunity in the trade union; This particularly makes a trade unionvery weak and it is in a weak bargaining position.• A high proportion of migrants within the work force: The composition of the labour force changes continuously.Organisation of a trade union becomes particularly very difficult. People are not interested in becoming members of atrade union. This puts a trade union in a weak bargaining position.• Trade unions are normally used as a springboard to the achievement of a big position in the government. Leaders oftrade unions lack in terest in the union affairs. Their interest is to achieve a big post in the government.Unit assessment
1. Explain how wages are determined in Rwanda?2. Why do you think that some workers are paid more than others in Rwanda?3. Give a justification for trade union’s demand for high wages12.9 Glossary
- Collective bargaining:This is a round table discussion between employers’ and workers’ representatives with an aim of reaching and enforcing agreements concerning wages, conditions of work and worker’s welfare.
- Geographical mobility of labour:This is the ease with which labour can move from one area to another.
- Labour efficiency: This is the ease which labour can produce good quality and quantity output in the shortest time possible.
- Labour productivity: This is output per unit of labour.
- Labour mobility: This is the ease which labour can move from one area or occupation to another.
- Iron law of wages: This states that a worker should be given a wage which is just enough to enable him meet his necessities in life and nothing more.
- Living wage: This is a wage given to a worker to only satisfy his basic needs. It is sometimes called a subsistence wage.
- Marginal productivity theory of wages: This states that a worker should be given a wage which is equivalent to the value of his additional output.
- Minimum wage: This is a wage set by the government above the equilibrium/ ruling market wage, below which, it is illegal to pay the workers.
- Occupational mobility: This is the ease with which labour can move from one occupation to another.
- Piece rate system: This is when a worker is paid according to the work done
- Sliding scale: This is when workers are paid more if the cost of living increases, and they are paid less if the cost of living.
- Specific labour: This is labour that cannot be changed from one productivity activity to another.
- Skilled labour: This is labour that has got skills and under gone training.
- Semi-skilled labour: This is labour that has got some training and gained some skills.
- Time rate: This is a system of wage payment where a worker is paid according to the time spent at work.
- Trade union:This is a legally accepted association comprised of workers who come together in order to achieve specific objectives.
- Un-skilled labour:This is labour that has no any training and has no skill at all.
- Wage freeze: This is the deliberate government policy of maintaining wages at their current levels so as to control inflation.
- Wage restraint: This is the voluntary restriction of wage increase by workers in order to control inflation.
Unit summary
• Meaning and categories of wages• Demand for labour• Labour supply• Efficiency of labour• Labour mobility• Geographical• Occupational• Manpower problems• Wages• Determinants• Forms• Wage theories• Wage differentials• Wage controls• Trade unions