General
- Economics S5 SB File Uploaded 28/01/22, 14:53
- S5: Economics TG File Uploaded 11/08/22, 23:04
Unit 2: MEASURING NATIONAL INCOME
Key unit competence:
Learners will be able to analyse the importance of measuring national income in an economy.
My goals
By the end of this unit, I will be able to:
Explain the different key terms used in national income.
Explain the approaches of measuring national income.
Identify the determining factors of national income levels in an economy.
Explain the importance of measuring national income and the difficulties met in an economy.
Explain the national income equilibrium level.
Identify characteristics of different phases of the business cycle.
Identify the causes and effects of income inequality.
Examine the approaches for measuring national income.
Discuss the determining factors of national income in Rwanda.
Assess the importance of measuring national income and the difficulties met in Rwanda
Illustrate the circular flow of income and the equilibrium level of national income.
Illustrate and explain the business cycle.
Use per capita income figures of different periods and countries to compares tandards of living in a country and between countries.
Examine the causes and impact of income inequality on standards of living in Rwanda.
Show income distribution amongst the population using the Lorenz curve and Gini coefficient.
Appreciate the importance of measuring national income and participate willingly in promoting the level of national income.
Show concern for low income earners and act to improve their standard of living.
Be aware of the fluctuations in national income and adapt to those changes.
2.1 National income
Activity 1
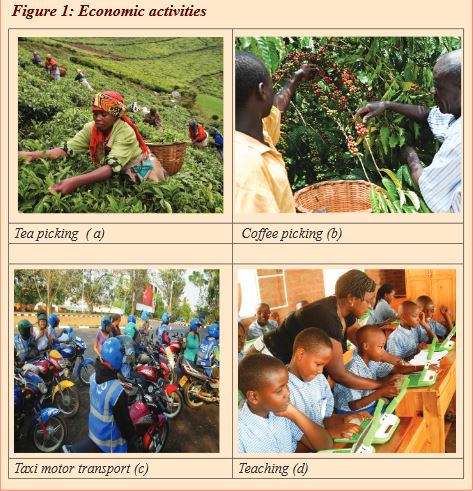
Using the photographs in figure 1.
1. Describe the activities in photographs a, b, c and d in figure 1 below.
2. What is the purpose of the activities below to the economy?
3. Relate the activities to national income.
4. Who should participate in such activities?
Facts
National income is the monetary value of goods and services arising from productive activities of a country in a given period of time, usually a year. For an individual, the income during any given period of time largely consists of earnings received from participation in the productive activity carried out in the economy.
National income of a country is the aggregate of all incomes of those individuals who are residents of the country. Incomes that are received in form of gifts or transfer receipts from other individuals, business firms and governments, do not form part of national income because they are not from corresponding productive activities.
2.1.1 Concepts used in national income
Gross Domestic Product (GDP)
This is the monetary value of goods and services produced in the country by both nationals (residents) and foreigners. Foreigners include foreign investors and expatriates.
GDP=GNP-Net income from abroad (x-m)
Gross National Product (GNP)
This is the monetary value of goods and services produced by the nationals within the country and those nationals that live outside the country (abroad). It excludes the incomes earned by foreigners living in the country.
GNP = GDP + Net Factor Income from Abroad (x-m)
Net National Product (NNP)
This is the monetary value of goods and services produced by nationals of a country in a given period of time less depreciation costs.
NNP= GNP-Depreciation.
Net Domestic Product (NDP)
This is the monetary value of goods and services produced in the boundaries of a country by both nationals and non nationals less depreciation.
NDP = GDP-Depreciation.
Income per- capita
This is income earned per person in a given period of time.
Per capita income = National Income
Total Population
Personal income
This is the total income received by an individual from both productive and unproductive activities.
Disposable income
This is a fraction of income that remains for spending after deducting the taxes.
Nominal income
This refers to incomes expressed in monetary units such as dollars, shillings, francs, etc.
Real income
This refers to the amount of goods and services that nominal income can buy.Net factor (Property) This is the difference between income earned by nationals abroad and income earned by foreigners in the country. Such earnings may be in form of salaries, rent from properties, dividends, profit, royolities, etc.
National income at market price (NNP mp)
This is the monetary value of goods and services valued at market prices. When the goods are in the market, we add indirect taxes but we subtract subsidies. NNPmp=NNPfc + indirect taxes – subsidies
National income at factor cost (NNPfc)
This is the monetary value of goods and services produced in a country at a given period of time valued at factor cost.
NNPfc = NNPmp + subsidies – indirect taxes
2.1.2 Approaches/methods of measuring national income
Activity 2
Using photographs in figure 2 below;
1. Describe the activities in the photographs a, b, c, and d below.
2. How do the activities above contribute to the measurement of national income?
3. Explain the approaches used in measuring national income as shown in the photographs below.
4. Identify the problems of using the different approaches in measuring national income.
5. Explain how the three approaches give the same results.

Facts
There are tree methods of measuring national income namely: • The income approach;• The expenditure approach; and• The product (output) approach.The income approach
Using the income approach, we add the incomes received by individuals, firms and government from the exchange of goods and services in form of wages, rent, profits and interests. All these incomes should be from productive activities, therefore, illegal activities such as black marketing, smuggling, prostitution and transfer payments should be excluded.
Transfer payments are incomes received without any corresponding level of activities done. They include gifts, pocket money, grants, sick benefits, famine relief, etc.
NY=W+R+P+I where, NY- National income = W-Wages, R-Rent, P-Profits, I- Interest
Therefore, national income arrived at using the income approach is called National income at factor cost because it considers payments for the factors of production.
The expenditure approach
The expenditure approach considers GDP from the expenditure side (National Expenditure). In this approach, we add up expenditure on final commodities.
Expenditure must be on final commodities to avoid double counting, for example, expenditure on bread and expenditure on wheat which was used to make bread would involve double counting of wheat and, therefore, we should consider only expenditure on bread (final good).
To get total expenditure, we add up expenditure by all sectors of the economy, i.e.
NY=C+I+G+(x-m) where C- expenditure on consumer goods and services, I- expenditure on capital goods / investment expenditure, G-government expenditure on goods and services, x-m net expenditure from abroad.
X stands for exports and M stands for imports.
Therefore, national income using the expenditure approach is National income at market price because it considers prices paid for final goods and services at the market.
The product approach/output approach
This is the most direct approach of estimating the value of output produced by the country. In this approach, we add up ‘value added’ on output by all sectors during the course of the year. All final goods and services produced must be included, whether they are sold to consumers, government, firms as capital goods or sold abroad as exports.
Intermediate goods or goods still in the process of production should not be included so as to avoid double counting. Value added includes only what was added on output during the process of production. Value added is the difference between the value of the final product and that of the intermediate inputs at each stage of production.
Example
Stage 1: Masera a farmer in Byumba grows cotton and sells it to a ginnery at10,000 FRW. This represents an income of 10,000 FRW to Masera. The value added is 10,000 FRW.
Stage 2: The ginnery sorts out the good cotton from the poor cotton and sells it to a spinner at 15,000 FRW meaning that the value added on the cotton is equal to 5,000 FRW.
Stage 3: The spinner uses the good quality cotton to make threads that it sells to Utexrwa, a cloth-making industry, at 25,000 FRW, meaning the value added to the cotton to make threads is 10,000 FRW.
Stage 4: Utexrwa turns the threads into a dress and sells it to Umutoni at 40,000 FRW meaning the value added onto the threads is now 15,000 FRW.
The total value added on to the cotton up to the time of its sale is: 10,000+ 5,000+ 10,000+ 15,000= 40,000which is equal to the value of the final dress. This can further be illustrated in the table below;
National income = 10,000+ 5,000+ 10,000+ 15,000= 40,000 FRW.
Therefore, using the output approach, NY= C+I+G+ (x-m) by value added.
Reasons why LDCs use the output approach to measure national income
LDCs have inadequate information on the incomes of the people especially the self-employed in informal sector and this makes the income approach less useful.
Developing countries do not have information regarding private consumer expenditure and this makes the expenditure approach less useful.
Using the income approach and the expenditure approach will involve double counting. So to avoid this, they use the output approach.
The expenditure approach cannot be depended upon because expenditure on intermediate goods may be valued yet expenditure should be on final goods and services.
Under the output approach, output of individual sectors can be determined easily to determine the exact output (value added).
Government expenditure abroad is hard to estimate and this makes the expenditure approach less useful.
Identical results of the approaches to national income
The three approaches of measuring national income are expected to give the same (identical) result unless there are some errors in calculations. This is shown below.

From Figure 4 above:
- The expenditure on goods and services in the market is paid out to the factors of production as rewards for their contribution to the production of goods and services in form of wages, interests, rent, profits, and, therefore, the income approach is equivalent to the expenditure approach, i.e. Y≡E.
- The money value of goods and services produced by the firms is reflected in the prices paid for them in the market and, therefore, the output approach is equivalent to the expenditure approach, i.e. O≡E.
- The value of goods and services produced by firms is also reflected in the incomes received by the different factors of production, therefore, the output approach is equivalent to the income approach, i.e. O≡Y.
Since Y≡ E, O≡ E, O≡ Y, therefore, O≡ Y≡ E2.2 The circular flow of income
This is a system that illustrates the flow of resources and commodities and the flow of expenditure and incomes between households and firms. The flow of resources and commodities is known as real flow while the flow of receipts and incomes is called money flow. Therefore, the circular flow of income involves both real and money flows.
2.2.1 Circular flow of income in a closed economy
In a closed economy, (where there is no foreign trade); assuming there is no government intervention, the circular flow of income would appear as follows:
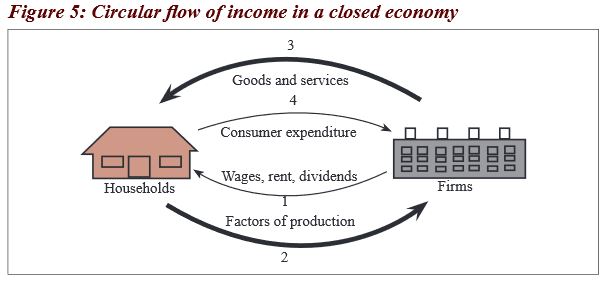
From Figure 5 above, we note the following:
- Firms buy factors of production from households (2) and pay for these factors of production (1). Firms use the factors of production to produce goods and services which they sell to households (3). In turn, households pay for these goods and services (4).
- Arrow (2) and arrow (3) show real flows,i.e. the flow of factors of production and commodities, respectively.
- Arrow (1) and arrow (4) show monetary/financial flows, i.e. flow of income and expenditure, respectively.
- The value of goods and services (output approach) is equal to households’ expenditure on them (expenditure approach), O=E.
Receipts received by firms from sale of goods and services(expenditure approach) are spent on buying factors of production (income approach), E=Y. The value of the goods and services is also reflected in the incomes received by the factors of production,O=Y. Therefore, the three approaches should give equivalent results if there are no errors, i.e. O ≡ Y ≡ E.2.2.2 Circular flow of income in an open economy
An open economy is that economy that has economic relationship with outside countries, i.e. there is international trade, so as to protect infant industries, check on profit repatriation by foreign investors and save the volume of foreign savings injected into the domestic economy. It tends to utilise other sources apart from the household to provide capital, which is injected into the circular flow of income.The sources could be foreign investment and the government. In an open economy, both domestic and foreign firms interact, thus it involves domestic house holds, domestic producers, government interference and the foreign sector as well. Thus, showing how the economic agents interact, i.e. C+ I+ G + (X-M).
From Figure 6 above, it is noted that:
- The household owns all factors of production and hires them to the domestic producers. In turn, they receive income in form of rent, salaries, interest and profits from the business sector (domestic producers) which is used to pay for goods and services from the producers. The remaining income after consumption is used to make savings through financial system which lend to the business firms.
- Firms buy factors of production from domestic households and use them to provide goods and services which are consumed locally and at times exported to the foreign sector. When they run short of funds for paying for factor services and investment, they have to borrow from the financial institutions in order to raise capital to produce.
- Taxes are paid to the government by firms’ profits.
- The state spends the tax revenue received to provide social services to the people.
- The foreign sector provides market, i.e. for domestic exports and providing imports to the domestic households.
- The financial sectors stand between savers (households) and borrowers (investors) by receiving savings from households on which it pays interest. It provides business loans for firms for investment on which it charges interest which is higher than that paid to depositors. The difference is the surplus for this sector.
2.3 Determinants of a country’s national income
Activity 3
Visit the library or internet and carry out a research on the;
1. Determinants of a country’s national income.
2. Importance of national income statistics.
3. Difficulties of measuring national income in LDCs.
4. Shortcomings of using national income figures.
Facts
Stock of natural resources: These include resources such as land, minerals, soils, etc. When such resources are available and exploited, national income will be high but if they are scarce and not exploited, national income will be low.
Availability of capital: When capital in form of machines and money is available, national income will be high compared to when capital is scarce.
Technological progress: Once technology is advanced, output will increase and national income will be his/her than when technology is outdated.
Human resource: If the country’s labour force is highly productive with good entrepreneur skills, national income will be high compared to when the quality of labour is low.
Political situation: Political stability will lead to increase in productivity and high national income while instability will cause low production and national income.
Level of market: A big market for goods and services will lead to high productivity and national income; while a small market will discourage production, hence low income.
Level of infrastructure development: Once infrastructure such as roads and communication, among others, are well developed, it will encourage investment, hence increasing national income. But when they are under developed, national income will be low.
Government policy of taxation and subsidisation: Once the government overtaxes the people, it will discourage investment and national income will be low but once the government subsidises the people, investment and national income will increase.
Organisation of factors of production: Once factor inputs such as land, labour and capital are well coordinated and organised, national income will be higher than when these factors are poorly coordinated.
Institutional factors such as culture, religion and people’s attitude towards work. If people’s attitudes towards work are high, national income will be high but low attitude will lead to low national income.
2.3.1 Importance of national income statistics
National income data/statistics are of great importance for the economy of a country. It tells us aggregates of a nations income, output and product result from the incomes of different individual products or industries and transactions of international trade. It is thus important to compile national income data because of the following reasons:
National policy analysis: For example, policies on employment can be based on the level of output, investment, etc.
Research: Both economy and social research can be carried out in respect of incomes, savings, investments, consumption patterns, etc. Data on these indicators can be got from the statistics of national income.
Per capita income (national income divided by total population) is a good indicator of improvement or decline in the standard of living.
National income statistics show the distribution of income among the various factors of production and sectors of the economy, namely: the household, business and the government sectors. This is important in planning for taxes and governments expenditure.
They are important in estimating the level of international transactions and the degree to which an economy depends on other economies. This can be estimated from the figures of imports and exports.
They show the patterns of expenditure:This is shown by figures of private and public expenditure. This is important in the making of the national budget where there is the need to estimate private and public expenditure.
They show regional performance and improvements: Incomes of different regions in the country can be compared so as to make plans on how to improve backward regions.
They are used for international comparisons which are necessary if improvement in economic performance is to be achieved.
They are used for comparisons of economic performance in one country over time so as to make improvements.
They show the rate of resource utilisation: The increase in national income may be the result of increased utilisation of national resources.
- They measure the size of various economic sectors, i.e. agriculture, industry and infrastructure or monetary and subsistence sector. This is helpful in tracing the source of economic growth and allocation of resources among these sectors.
2.3.2 Difficulties of measuring national income in LDCs
There are a number of statistical and conceptual problems which are encountered when measuring national income. Conceptual problems are those problems that arise from the interpretation of the subject matter of national income for example, defining the boundary of production.While statistical problems are those that arise from the exercise of collecting and processing national income data, such as inadequate information, lack of enough qualified personnel, etc.A combination of both statistical and conceptual problems includes the following:Defining the term nation: There is difficulty in defining the term nation in national income. Every country has its own political boundaries but in national income estimation, the term nationincludes the income earned by nationals of a country in a foreign country beyond the territorial boundaries of the country in question.
Double counting: There is a possibility of counting some commodities more than once. For example, wheat as an intermediate good may be counted and at the same time bread as the final good.
Non-monetary output: National income is measured in monetary terms, but there are some goods and services which are difficult to measure in monetary terms, for example, Subsistence output, services of housewives, etc.All these activities add to economic welfare and all use economic resources yet none of them is included in official measures of national income and product. This leads to underestimation of national income.
Inadequate information especially on private expenditure and other private incomes, information on fisheries, crops and animal husbandry, among others, on which very little data is available leads to national income figures underestimated.
Shortage of facilities such as computers to collect and process national income data may also bring about statistical errors when computing national income.
Price changes: When the price level in the country rises, national income also shows an increase although the production level may have fallen. Also, there might be a decrease in the price and national income also shows a reduction although production levels may have increased. Thus, due to price changes, national income cannot be adequately measured.
Timing of production: It is very difficult to determine output produced in the country during the year. For example, crops may stay in the field for more than one year and there is a likelihood that they may be counted year after year.
Inflation: Changes in prices affect the value of GNP and the effect of inflation is difficult to adjust accurately.
It is difficult to determine transfer payments such as unemployment benefits, gifts, etc. It is hard to tell whether such payments were received as a result of providing services or not yet they are part of the incomes of the giver.
Omissions from GDP: There are activities that may be omitted from national income such as prostitution and smuggling, among others. Although those bring welfare and incomes to the people, they are not included when calculating national income. Therefore, it leaves national income figures underestimated.
It is difficult to determine net exports and income earned from abroad since import and export trade is carried out by many people or groups of people also there are lots of goods that come in and go out undetected due to smuggling.
2.3.3 Shortcomings of using national income figures
National income data are highly useful in several ways, but it is necessary to use them with caution. They have the following shortcomings:Comparison between countries: The per capita income of a country whose principal diet is rice and fish as in Korea is not comparable with Rwanda’s, where the diet is so much varied. Money units do not measure these differences in the kinds of products consumed.
Changes in the country’s stock of capital: National income statistics do not consider the changes in the country’s stock of capital equipment. The calculation of depreciation on capital goods is not accurate.
Changes in quality: The qualitative aspect is totally ignored. The GNP figures do not take into account the quality of goods and services.
Marketed activities: National income data are confined to goods and services sold in the market. But, in the majority of underdeveloped countries, most production takes place in the homes of people. Measures of national income confined to production for home consumption underestimate per capita income in such countries, since the national income is underestimated.
Use of national income figures over a long period: For shorter periods of two or three years, comparisons of income totals are valid for most purposes. But over a longer span of time, they can be misleading. Over a longer period, a number of new products may appear in the economy and a number of old products may disappear. It, therefore, becomes difficult to compare two periods with unlike items.
2.3.4 Equilibrium level of national income
Meaning of Equilibrium
Equilibrium can be defined as a state of stability in economic conditions irrespective of the forces influencing different economic agents. That is, there is no tendency for consumers and firms to change their economic behaviour. This means that the variables in an economy are equal and have no tendency to change. As already pointed out, during equilibrium, national product and national income must be equal and also national income is equal to national expenditure since it is derived from this income.
Activity 4
Visit the library or internet and carry out a research on:
1. What is equilibrium?
2. Explain situations when national income is in equilibrium.
3. Illustrate the situations for national income equilibrium.
4. The additions to the circular flow of income are called..........., while the withdraws are called...................
5. The situation when aggregate demand is greater than aggregate supply at full employment is known as......... and when aggregate supply is greater that aggregate demand at full employment is known as.........
6. With illustrations, explain how the gaps in (5) above can be closed.
Approaches to national income equilibrium
a) National income equilibrium: leakages – injections approach
National income is in equilibrium when total leakages are equal to total injections.
Leakages refer to elements which withdraw money from the circular flow of income. They include savings -S, consumption-C, taxation -T, imports-M and capital outflow-Ko. These elements remove money from the circular flow of income, i.e. C+ S+ T+ M+ Ko.
Injections refer to elements that add to the circular flow of income. They include investment-I, consumption-C, government expenditure-G, exports-X and capital inflow-Ki. These elements add money to the economic activities in an economy, i.e. C+ I+ G+ X+ Ki. Thus, national income is in equilibrium when S+ T+ M+ Ko = I+ G+ X+ Ki. This can be seen in the following ways:
i) National income equilibrium in a closed economy
A closed economy is one where transactions take place within the country without any foreign trade. The major factors, which determine the level of income (Y), are consumption (C), saving (S) and investment (I).
The country’s income can be used for the consumption and saving. These are known as leakages or withdrawals. The identity is Y = C + S. If the level of income is to be maintained, saving must be put back into the economy in form of investment so as to create more income.
Consumption must also take place. These are known as injections. The identity is C +I =Y. Therefore, we have Y = C + S and Y = C +I; equating the two expressions yields C + S = C + I = Y. In a closed economy without government, equilibrium income is a situation where savings are equal to investments. This can be illustrated as below:
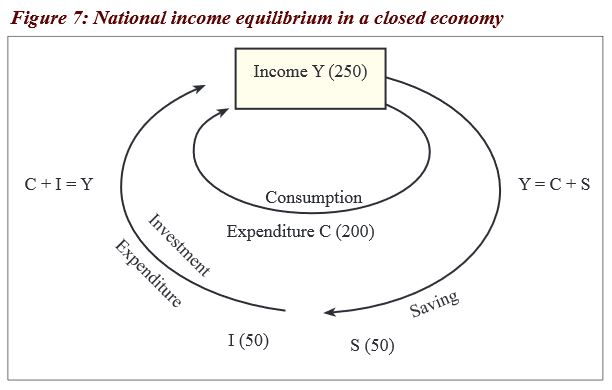
The left hand side of Figure 7 shows how income is being created through consumption and investment. The right hand side shows how income is being used through consumption and saving. Our objective is to determine precisely the equilibrium level of GDP and to see what factors it depends upon. Thus, C+I=C+S=Y which then means I (an injection) =S (a leakage) in a closed economy.
Equilibrium income determining: Saving-investment approaches

From Figure 8 above, it is seen that equilibrium income can also be determined through the saving- investment approach. Planned saving is equal to planned investment. The intersection of the saving and investment schedules determines equilibrium income and output at
 . The savings are positively related to the income while investment is autonomous.
 The economy will reach equilibrium at full employment only if the amount that consumers wish to save out of their income is precisely equal to the amount that investors want to invest. At any income below
, planned investment exceeds planned saving. Aggregate demand exceeds aggregate supply. This forces investors to increase the rate of production until . At any level of income beyond , savings exceed investment. Aggregate supply exceeds aggregate demand. Consequently, there are unsold inventories and investors will be forced to reduce the rate of production until S =I.
ii) National income equilibrium in an open economy
An Open economy is one where there is foreign trade. So far, we have dealt with a very simple economy consisting of only households and businesses. All the income created in the process of production was passed on to households as disposable income. Thus, GNP and disposable income were identical.
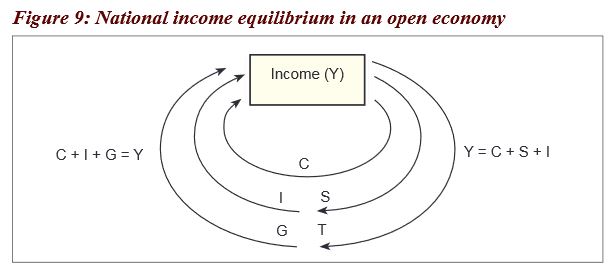
From Figure 9 above, in our simple economy, when the government sector is added, it levies taxes and makes expenditures on the purchase of goods and services. The government also makes transfer payments. Aggregate demand now consists of consumption (C) investment (I) and government demand for goods and services (G). Therefore, C + I + G = Y. Not all the income from the production of output is disposable income to the households. A portion is now absorbed by the government as net tax receipts.
Net tax receipts are total tax receipts less that portion which is returned to the private sector in the form of government transfer payments. While government tax receipts reduce disposable income, government transfer payments such as unemployment allowances increase disposable income.
The income is used for consumption, saving and tax. Y = C + S + T. Therefore, equilibrium income is where S + T = I + G, i.e. leakages = injections. When government expenditure is added on, the equilibrium income increases from
 to where I + G = S + T.
Equilibrium income determining: The leakages-injections approach

When the foreign sector is introduced, income is created through consumption, investment, government expenditure and exports. Thus, C + I + G + X = Y. The income is used for consumption, saving, tax and imports. This is indicated by the following equation Y = C + S + T + M.
Equilibrium income is, therefore, equal to S + T + M = I+ G + X. Leakages = injections. The equilibrium income is indicated in Figure 11 below;
Equilibrium income with the foreign sector

From Figure 11 on page 82, it is seen that when the foreign sector is added on, injections become C + I +G + X and leakages become C + S + T + M. Therefore, the equilibrium income increases to Ye where, I+ G + X = S + T + M.
Equilibrium income determining: Leakages-injections approach

From Figure 12 above, investment, government spending and exports are known as the injections into the flow of income. They increase the circular flow of income. Savings, taxes and imports are referred to as withdrawals or leakages from the flow. They reduce the country’s income — the circular flow of income.
The condition for the equilibrium income is that injections = leakages. When injections exceed leakage, the level of income increases whereas if leakages exceed injections, the income level reduces.
b) National income equilibrium: Inflationary gap and deflationary gap approach
According to the classical economists, equilibrium income is determined where aggregate demand is equal to aggregate supply. At such a point, savings are equal to investment, and all the resources are fully employed.
Keynes, on the other hand, disagrees with this analysis. According to him, full employment level of income (
 ) may not equal to the equilibrium income (
 ). It is possible to have ( ) being greater than (Ye ) and hence the deflationary gap. It is also possible to have ( ) being greater than () and hence the inflationary gap.
A deflationary gap is a situation where aggregate supply exceeds aggregate demand at full employment. All that is produced is not demanded. Realised investment is greater than the actual demand. A deflationary gap is caused by deficiency in demand.

From the figure 13 above, gap a-b is a deflationary gap
How to close a deflationary gap
It can be closed by increasing aggregate demand from aggregate demand (1) to aggregate demand (2) and this can be done through using the policies that increase demand for goods and services.
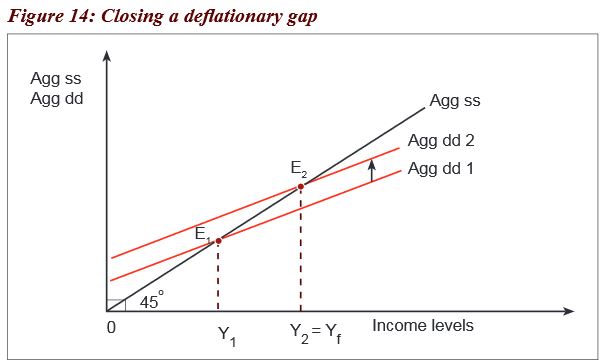
From Figure 14 above, Agg ss- aggregate supply, Agg dd- aggregate demand, E1- equilibrium 1, E2 equilibrium 2, Y1 – income 1, Y2= Yf – shows full employment levels of resources.
Policies that can be used to increase aggregate demand
Increasing the volume of exports so as to get rid of the surplus;
Discouraging imports so as to avoid increasing the volume of goods in the country;
Adopting an expansionary monetary policy – This will help to increase money in the hands of the people, hence increase their demand.
Increasing government expenditure – This will also increase money in the hands of the people, hence increasing their demand.
Increasing wages such that the people can have access to income and increase demand;
Reducing taxes – This will increase the disposable income in the hands of the people, hence increasing their demand.
Adopting price control especially maximum price which is low and will encourage demand.
An inflationary gap is a situation where aggregate demand exceeds aggregate supply at full employment level. Realised investment is less than actual demand. Supply is not enough.
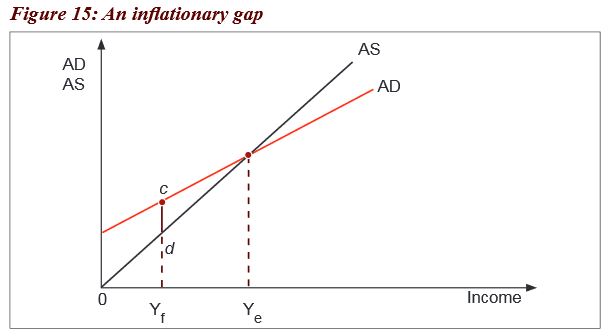
From Figure 15 above, gap c-d is an inflationary gap.
At point (
), national income is in equilibrium when aggregate demand is equal to aggregate supply. Before ( ), aggregate demand exceeds aggregate supply and this is called an inflationary gap. How to close an inflationary gap
An inflationary gap can be closed by reducing aggregate demand from aggregate demand (1) to aggregate demand (2) as shown below and this can be done through the policies which reduce the money in the hands of the people so that because of little income, demand is also reduced.

From Figure 16 on page 86, Agg ss- aggregate supply, Agg dd- aggregate demand,
 - equilibrium 1,
  equilibrium 2,
  =
=  shows full employment levels of resources,
  - income.
Policies that can be used to reduce aggregate demand
Adopting a restrictive monetary policy – This will reduce the amount of money supply and hence lower aggregate demand.
Increased imports – This can help to increase the volume of goods available when demand is greater than supply.
Reduced exports – This is to reduce the amount of goods going out of the country so as to make them enough for the people.
Increased taxes – This is to help reduce the disposable income of the people so that they do not have a lot to spend.
Reduced government spending – This is aimed at reducing and controlling the amount of money in circulation which leads to limited liquidity and low demand.
Adopt price control especially minimum price legislation which is a high price that can reduce the demand for goods and services.• Reducing wages by adopting a tight income and wage policy.
2.3.5 Fluctuations in national income /Business cycle
Activity 5
Abahuzamugambi association of coffee growers in Maraba in Huye District- Southern Province is well known for having excelled in coffee production. They mostly harvest their coffee during the rainy season between March and May. During coffee harvest, employment opportunities, output, saving levels, demand, prices, income levels are all high, hence high standards of living to the community.
However, this does not remain static. Coffee harvesting comes to an end due to changes in seasons which leads to a fall in the employment opportunities, output, saving levels, demand, prices, income levels, hence reduced standards of living.
As the next season comes in, output, saving levels, demand, prices, income levels output, saving levels, demand, prices, income levels and standards of living start to rise slowly up to the point where the season is at its highest peak. This trend is a cycle of fluctuations in coffee production/harvest.
From the case study above;
1. Identify the phases of coffee harvesting.
2. Explain the characteristics of each stage.
3. Illustrate the stages above on a graph.
4. Describe the effects of each stage on the community.
Facts
In any given economy, economic conditions and circumstances do not remain constant over a long period. There are always upward and downward swings in business activities or trade.
According to Professor Mitchell, it is a type of fluctuations found in aggregate economic activities of nations that organise their work mainly in business enterprises.
The course of trend of business activities passes through phases of prosperity and adversity which are referred to as trade/business cycles. They occur in every economy periodically and they follow a particular pattern. Each cycle takes a different period from the other and a time taken in each cycle is different in different economies.
A typical business cycle is generally divided into 4 phases although some scholars argue that they are five as seen below.
• Boom phase (upswing)
• Recession phase (upper turning point)
• Depression or slump or trough phase ( downswing)
• Recovery phase (lower turning point)
• Prosperity
There are basically four stages of business growth although some scholars argue that they are five as seen below.
Expansion (Boom)
This is a stage where business activities are at high levels and they tend to acquire profits. The business is normally in the upswing mode as shown by the high levels of economic activities. It is characterised by the following:
There is increase in the demand for both capital and consumer goods.
Companies invest in more production facilities with a view of making profits from the increase in sales.
Banks lend capital for expansion at low rates because they have confidence in the investors paying back.
There are high rates of employment brought about by high aggregate demand and investments.
Business is at its peak and makes supernormal profits.
Recession
This stage is the upper turning point and shows that the economy is in a decline as shown by the characteristics below:Level of sales and production orders start declining.
Production facilities become underutilised.
Companies reduce the work rate.
Workers hired on casual basis are laid off.
There is reduction in the level of output.
Banks raise the interest rates to counter the rise in risk of default on loans.
Most of the companies reduce the price of their goods so that they can increase demand.
Depression
This is the bottom of a cycle where economic activity remains at a low level. It has the following characteristics:Demand for products and services reduce, forcing some companies to shut down some production facilities.
There are rampant cases of unemployment brought by closing of industries.
There are high rates of poverty.
The purchasing power in an economy becomes very low.
The gross domestic product declines and so does the standard of living of the people.
The fall in price of capital goods is more than that of consumer goods.
Demand for loans declines because the investors become irritated by the economic situation.
Recovery
This is the stage where business begins regaining its strength. Business may sell output at very low prices to retain the operating costs; carry out some repairs; or gets some credit, among others. This helps it to begin moving from the trough. The stage is characterised by the following:Business become confident in the market and they begin buying goods so the business begins making profits.
The bank rates become low so the companies can afford to borrow and finance projects.
There is an increase in production because of increase in aggregate demand.
Companies begin employing people and so there is a reduction in unemployment levels.
Standards of living of the people improve since they can afford to buy goods and services.
Profit margins of business start rising and the gross domestic productalso begins to rise.
Prosperity
This is where business regains its strength and activities are at their peak. The following are its characteristics:There are high employment levels in an economy.
There are high incomes due to the employment levels.
High levels of production is common at this stage
There is high aggregate demand and cost which leads to a rise in investment and prices for goods and services.
The existing capacity of plants is underutilised.
This can be illustrated in the figure below.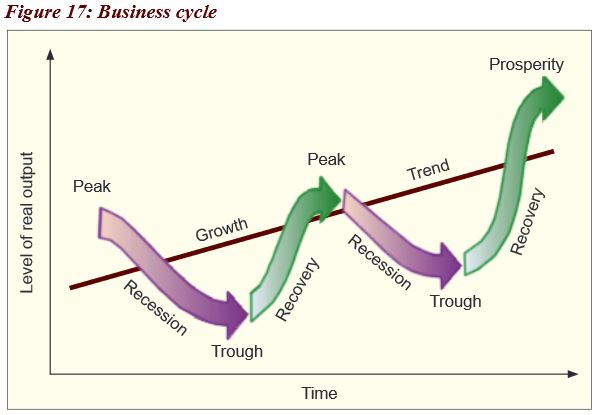 Figure 17 above shows business growth through ups and downs.
2.3.6 National income and standard of living
Activity 6
Mr Nkurunziza and Mrs Umutoni are two nationals of Rwanda who earn 30,000 and 100,000 FRW, respectively. However, after compiling statistics by the national statistics of Rwanda, it is shown that they all earn the same amount 50,000 FRW.
When you compare their average earnings and that of an American, it is very low and hence their standard of living and way of life is still low.
From the case study above, respond to the following questions.
1. What economic term is given to the average amount that they both earn?
2. Explain reasons to explain why you think the average income they earn is low.
3. Give reasons to explain why the average income they get is not a good measure of standard of living in:
(a) A country over a period of time.
(b) Between two countries.
Facts
National income of a given country reflects the way of life of its people during a specified period. The way of life people live or hope to live is what we call standard of living. The higher the level of national income, the higher the standard of living and vise-versa, holding other factors constant. The standard of living will depend on the average income of the people in the country at a particular time.
Per capita income
Per capita income is income received per person in a period.

Example 1
If the total national income is 200 billion francs and the population is 50 million people, then;

Example 2
Study the table below showing population and GNP of countries A and B and answer the questions that follow.
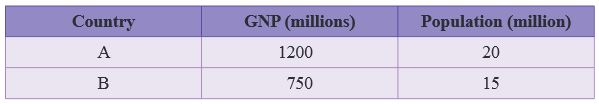
i. Calculate the per-capita income of countries A and B
Country A

Country B

Per capital income is used as an indicator of the standard of living in a country; and to compare the standard of living between countries because it is available for all countries and it is the most relevant among other available measures. Using national income figures to compare standard of living comes with many shortcomings as seen below:
Limitations of using per capita income figures as a measure of good standard of living in a country for period of time
Per capita income does not take into account the distribution of income. It may be high but when in the hands of a few people and many are poor, it may not reflect a good standard of living in the country.
Per capita income does not take into account the pattern of goods produced, either capital or consumer goods. It may be high but when capital goods are produced as compared to consumer goods that yield satisfaction to the consumers.
Per capita income does not consider the working conditions of the people. It may be high but when the working conditions of the people are poor, it may not reflect a good standard of living.
Per capita income does not take into account the amount of leisure. It may be high but when the people do not have leisure yet we know that leisure is one of the attributes of good welfare, meaning the standard of living will become low.
Per capita income does not consider the level of subsistence sector. It looks at the monetary terms of the output but the subsistence sector where food is grown for home consumption is not considered yet it is a basis for good welfare in the rural areas.
Per capita income does not consider the level of prices. It may be high because the prices of goods and services are very high implying that the people cannot afford them, hence leading to poor standards of living.
Per capita income does not put into consideration the political climate. It may be high but when there is political instability in the country, meaning that the people are always on the run. This may not show good standards of living.
Per capita income does not consider the quality of goods produced. It may be high but when the quality of goods produced is low. This means that the quality of life of the people will also be poor.
Inaccurate statistical data for example, population figures. It may be high but when the population figures given are inaccurate. This means that the per capita income figures will not reflect what is actually on the ground.
Per capita income can also be used to compare the standard of living between two different countries. The figures got from the different countries are compared and the country with a high per capita income figure is assumed to be having a high standard of living. However, this is not true in reality as seen further.Limitations of using the figures of per capita income to compare the standard of living between countries
It does not consider the types of goods produced. Per capital income may be high in the country, which produces many capital goods, which do not improve the welfare directly in the short-run.
It does not take into account leisure which contributes to welfare. Per capita income may be high in a country where people work hard and forego leisure, which may be on top of their scale of preferences.
Transport differences: Two countries may produce the same quantity and quality of product but may have different figures of per capita income because of the difference in transport costs.•
Per capita income figures do not reflect some factors, which influence the welfare of the people. For example, it may be high in a country where there are wars, accidents, diseases, pollution, etc.
In LDCs, it is likely that population figures are inaccurate because of inadequate facilities and, therefore, the figures for per capita income are unreliable.
Per capita income may be underestimated in a country where there are omissions in measuring GNP for example due to a large fraction of subsistence sector, high non-monetary output, etc.• There are people who live on illegal activities such as gambling and smuggling, which are not included in national income figures.
Countries use different concepts and definitions of national income. For example, some countries value subsistence output while others do not. Others use GNP at factor cost while others use GNP at market prices, etc.
Income distribution: A country may have high-income per capita figures when income is in the hands of few people while the majority of the population are suffering.
Price structures: figures of national income may be high because of inflation and this does not means that people are better off. Also a commodity may be cheap in one country and expensive in another but generate the same welfare.
Per capita income may be high in a country where there is unemployment which affects welfare of affected people/households.
Causes of low per capita income in Rwanda
Low levels of education: This makes the people get casual low-paying jobs leading to low levels of income and in the end the per capita income will be low.
Under developed infrastructure especially in the rural areas: This complicates movement of people and their goods from one place to another. This further limits the level of earnings of the people and some of the output may remain unsold.
High levels of unemployment: Lack of jobs means that the output in the country will be low leading to a low national income and per capita income figures.
Low levels of income: Some institutions give people low incomes despite their high contributions to the economy. Some may end up getting subsistence wage that will reflect a low income per person.
Dependence of agriculture which depends on climate: Agriculture in Rwanda depends on climate and in situations where there is a mismatch between the seasons, the farmers suffer with no output and income leading to low income per person.
Large subsistence sector: This yields little income since only the incidental surplus is sold. Most of the foods grown here are for home consumption implying that the there are no incomes expected during the production process.
Unbalanced development: Some areas are highly developed with many economic activities while others are lagging behind in terms of development. The least developed areas yield low productivity and the general national income will be affected, leading to a low per capita income.
Lack of capital to invest in businesses: There is still lack of enough capital to invest in production activities. This is evidenced by the low level of manufacturing industries. This leads to low productivity, low national income and finally low per capita income.
Low prices of agriculture products: This accompanied by high rates of price fluctuation and little earnings from the agricultural sector, leading to low national income and hence low income per person.
2.3.7 Income distribution
Activity 7
In figure 18, using photographs a, b, c and d:
1. Describe the two categories of people and regions.
2. What term is given to the differences in the appearances in the photographs below?
3. Explain the advantages and disadvantages of some people or areas being richer than others.
4. Suggest what can be done by the government of Rwanda to ensure that all the people and regions are equally the same in terms of resources.

Facts
Income distribution refers to the way income is spread among various social groups in an economy. It may be between different people in the same region or in another region or it may be how resources are distributed in different regions.
Inequality means an instance of being unequal which may imply difference in size, degree or circumstances, among others. In economics though, inequality is always talked of in terms of two major forms or types:
Types of inequality
1. Personal inequality: refers to the economic difference between the very poor and the rich people in society.
2. Regional inequality: refers to a situation where there is a difference in terms of resource endowments, developments through infrastructure such as roads and industries, among others. These make one region appear different and more developed than others.
3. National inequality: This is where some countries are richer than others in terms of resources and development.
4. Sector inequality: This where some sectors are richer and developed compared to other sectors e.g Industry being more developed than agricuture.
5. Occupational inequality: This where some occupations are more advanced in terms of technology used and payments etc. than other occupations.
Causes of income inequality
Income inequalities may be among different social groups or even among people in the same social group. Income inequality is caused by historical, geographical, social, economic and political factors.
Some of these factors are:
Differences in distribution of resources, for instance, people who have access to fertile land are likely to get more income than those who live on marginal land, for example pastoralists.
Differences in social and economic infrastructure such as roads to ease the transportation of goods and services from one area to another;
Government policies such as a regressive tax which taxes the poor more than the rich causes income differences.
Historical factors for example one can get much income because of inheriting property from rich parents. In rural areas, most people become rich because of inheriting land.
Differences in natural abilities, for example, when one is physically handicapped, he/she is likely to have less income than one who is physically well.
Differences in employment, i.e. some jobs bring in more money than others, hence income inequality.
Differences in education levels: Educated people have higher chances of being employed and earning higher salaries than the illiterate.
Uneven distribution of investment opportunities: Most of the investments are done in the urban centres and others are neglected, hence leading to regional inequalities.
Difference in sex: Females are generally poorer than males because of limited access to income-generating properties such as land and credit.
Lorenz curve
The Lorenz curve is a graphical representation of the distribution of income or wealth in an economy. It was developed by Otto Max Lorenz in 1905 to represent the inequality of wealth distribution. It looks at the line of perfect equality where there it is assumed to be income equality and as we move away from the line, the gap between the rich and the poor also increases.

From Figure 19 above, the further away the Lorenz curve from the line of perfect equality, the more the income inequality. And the nearer the Lorenz curve from the line of perfect equality, the less the income inequality.
Gini coefficient
This is also known as the Gini index or the Gini ratio and it is the measure of statistical dispersion intended to represent the income distribution of a nation’s residents. The Gini coefficient is a number between 0 and 1 where 0 corresponds to perfect equality (where everyone has the same income) and 1 corresponds to perfect inequality (where one person has all the income and everyone else has zero income).
Advantages of income inequalities
Income is in hands of few people who can invest it and produce commodities for other people and the society at large.
It encourages the poor to work hard so as to survive in the ever-changing economy.
It encourages savings among the rich which can be used for further investments, employment creation and production of goods and services.
The rich can invest in research and innovations and improve technologies and this can help to speed up production and economic growth.
The few rich employ the poor through investments in industries and factories, hence improving their standard of living.
More tax revenue is realised by taxing the rich and this can lead to increase in national income through progressive taxation.
The poor take up low category jobs such as cleaners, mortuary attendants etc. which would have nobody to take them up if all people were in the same average class
. The rich invest in assets, which increase the wealth of the country.
Foreign exchange is earned by rich export firms. This, through export promotion industries, can lead to increase in the foreign exchange earnings and reduce the balance of payment problems of a country.
Disadvantages of income inequality
There is minimum economic welfare of some group of people because of absolute poverty, i.e. inability to purchase basic needs.
Reduction in aggregate demand: The rich have a lower marginal propensity to consume than the poor. The poor people are left with little money to purchase commodities. The reduction in aggregate demand discourages investment.
Misallocation of resources: The very rich people spend on luxuries, leaving the poor to go without basic needs.
Capital outflow especially when the very rich are non-citizenswho always repatriate their earnings to their home countries – In countries which are politically unstable, rich people prefer to invest/bank their money in other countries where there is political stability.
It leads to a reduction in government revenue since the majority of the people would be having little or no incomes to tax.
It leads to social disharmony whereby the poor feel neglected and not catered for which results into political instability.
It leads to failure of government programmes when the majority have no adequate means to participate in development activities.
Regional imbalances come up because the regions with resources develop at the expense of others without resources.
Measures to control income inequality in Rwanda
Education reforms have been undertaken. This has helped many people to access education so that they can be prepared to get jobs
Land tenure reforms: This is through land redistribution policies and making it accessible to all people in society so that they can be able to carry out agriculture.
Kick-start funds such as the “one cow per family” have helped people to access cows that can be used as a source of income through selling the milk.
Progressive taxation: This has reduced the gap between the rich and the poor people since the revenues collected are used to subsidise the poor.
Improving infrastructure such as roads which helps in the movement of people and goods from areas of production to markets helps people to increase their earnings.
Liberalisation of the economy: This has helped people to participate in economic activities and trade, hence increasing their incomes and standards of living.
Controlling population growth: This has helped to reduce the ratio of resources to the population and also dependence burden among the families.
Modernising agriculture: This has helped reduce the level of poverty in rural areas where the activity is fully based. The people are able to increase the quality and quantity of their products, hence receiving more incomes.
Improvement of the investment climate: This has been through giving tax holidays and free land such as the free investment zone in Masoro. This has attracted more investors, hence creating employment opportunities.
Improvement of the political climate: This has created good environment for production whereby the people are not scared of carrying out any activity.
Encouraging development of small-scale enterprises: These have also created more employment for the people in Rwanda, hence improving their standard of living.
- Formation of co-operatives: This has been the basis for reducing income inequalities among the people. These cooperatives such as Saccos, for example, umurenge sacco, umwarimu sacco, producer co-operatives, among others, have encouraged micro savings and given small loans to the local people.
Unit assessment
1.(i) Examine why the government of Rwanda undertakes compilations of annual gross domestic product.
(ii) Analyse the measures that the government of Rwanda can undertake to improve the level of gross domestic product.
2. (i) Given that the per-capita income of an average Kenyan is three times greater than that of an average Rwandan, does it necessarily mean that an average Kenyan is better off than an average Rwandan?
(ii) If you are analysing per-capita income in Rwanda for this year, Why are the figures not a good measure for standard of living in the country?
3. Explain how the construction of good roads may help to increase national income of Rwanda.
2.4 Glossary
Black economy: A non-marketed economic activity which is not recorded in the national income accounts, either because such activity does not pass through the market place or because it is illegal.
Black market: A situation in which there is illegal selling of goods at prices above a legal maximum set by the government.
Business cycle or trade: Fluctuations in the level of economic activity alternating between periods of depression and boom conditions.
Circular flow of income expenditure: A process consisting of both the real flow of resources and commodities and the money flow of expenditures and income between businesses and households.
Closed economy: An economy in which there are no foreign trade transactions or any other form of economic contracts with the rest of the world.
Circular flow of income: The flow of resources, commodities (real flow) and flow of expenditure and incomes (money flow) between households and firms in an economy.
Disposable income: A fraction of income that remains for spending after removing the taxes and other compulsory payments. Disposable income equals personal income minus personal taxes.
Equilibrium GNP: A price at which quantity supplied equals quantity demanded.
Factor cost: A term used to indicate the market price of a commodity less all items in its cost other than those of the factors of production employed in its manufacture. For example, indirect taxes, specific factor of production, are excluded from the concept of factor cost.
Gross domestic product (GDP):The monetary value of goods and services produced in the country by both nationals and foreigners. GDP=GNP-Net income from abroad (x-m).
Gross national product (GNP): The monetary value of goods and services produced by only nationals with in the country and those nationals that live outside the country. GNP = GDP + Net Factor Income from Abroad (x-m).
Income inequality: A situation where there is a disproportionate distribution of total income among the households.
Income approach to GNP: The calculation of GNP by summing income received by all factors of production: the sum of wages, profits, rent, interest and capital consumption allowances.
Income per capita: The total GNP divided by the total population of a country. It is the major indicator of the levels of standard of living and development. Income per capita: is income earned per person in a given period of time.
Injection: An autonomous increase in total spending. It is an increase in government spending, investment, exports, or consumption not induced by an increase in income.
Leakage: An autonomous decrease in total spending. This includes an increase in saving, taxes and imports.
Net national product (NNP): The monetary value of goods and services produced by nationals of a country in a given period of time minus depreciation costs: NNP= GNP-Depreciation.
National income: The monetary value of goods and services arising from productive activities of a country in a given period usually a year.
Nominal income: Incomes expressed in monetary units such as dollars, shillings, francs, etc.
Net domestic product (NDP): The monetary value of goods and services produced in the boundaries of a country by both nationals and non-nationals minus depreciation. NDP= GDP-Depreciation.
Net factor (Property) income from abroad: The difference between income earned by nationals from abroad and income earned by foreigners in the country.
National income at market price (NNPmp): The monetary value of goods and services produced in a country valued at market prices: NNPmp=NNPfc + indirect taxes – subsidies.
National income at factor price (NNPfc): the monetary value of goods and services produced in a country valued at factor cost: NNPfc = NNPmp + subsidies – indirect taxes.
Open economy: An economy which engages in foreign trade and has financial and non-financial dealings with the outside world.
Personal income: The portion of national income, which is received by households. It is the sum of the wages and property income received by households plus transfer payments to households.
Potential GNP: The level of GNP that would occur at full employment.
Price index: An index number that shows how the average price of a bundle of goods has changed over a period of time.
Producer price index: The price index of wholesale goods such as steel, wheat and oil.ཀྵReal flow: The exchange of goods for services of factors of production.
Real income: The amount of goods and services that nominal income can buy.
Real GNP: The GNP adjusted for price change. Real GNP equals nominal GNP divided by the GNP deflator.
Recession: A period of economic downturn in which output and employment drop with declines appearing in consumption and in investment.
Standard of living: The minimum of the necessities of luxuries of life to which a person or a group may be accustomed or to which they aspire.
Transfer payment: Any payment, usually by the government, but not in exchange for goods or services. Student grants, welfare and social insurance payments are examples.
Underground economy (Unreported economic activity): The underground economy includes otherwise legal activities not reported to the taxing authorities such as garage sales or services ‘bartered’ among friends, and illegal activities such as the drug trade, gambling and prostitution.
Value added: An addition to the value of product at each stage of production.
Unit summary
• Key concepts in national income
• Methods / approaches in measuring national income
• Income approach
• Expenditure approach
• Output approach
• Circular flow of income
• Open economy
• Closed economy
• Determining factors of national income
• Importance of measuring national income
• Difficulties in measuring national income
• National income equilibrium
• Injections and leakages approach
• Inflationary and deflationary gaps approach
• Fluctuations in national income (Business cycle)
• National income and standard of living
• Income distribution