- Explain the terms used in relation to population.
- Identify the reasons why the population census is carried out and the difficulties encountered. Explain population structures and the population pyramid.
- Explain the factors and impacts of population growth.
- Explain the assumptions of Malthusian population theory and the limitations.
- Distinguish between under, over and optimum population.
- Illustrate population structures using pyramids.
- Describe the population distribution.
- Calculate population density and population growth and analyse its impact on an economy.
- Assess the relevance of population control measures.
- Illustrate and analyse the relevance of Malthusian population growth theory in LDCs.
- Discuss with the aid of illustrations the stages of demographic transition theory and its limitations.
- Use illustrations to explain the causes and effects of under population and overpopulation.
- Be aware of the impact of population growth in an economy and advocate for population control measures.
11.1 Population
11.1.1 Meaning Population
refers to the number of people living in an area at a particular period of time. It includes both permanent and temporary residents. While the sociologist is concerned with the social problems which arise from changes in population structure, an economist is generally more interested in the way population changes affect the production and distribution of goods and services. There are two major functions of population and these include:
• Population is the major consumption unit
• Source of labour which is the major factor of production
Activity 1
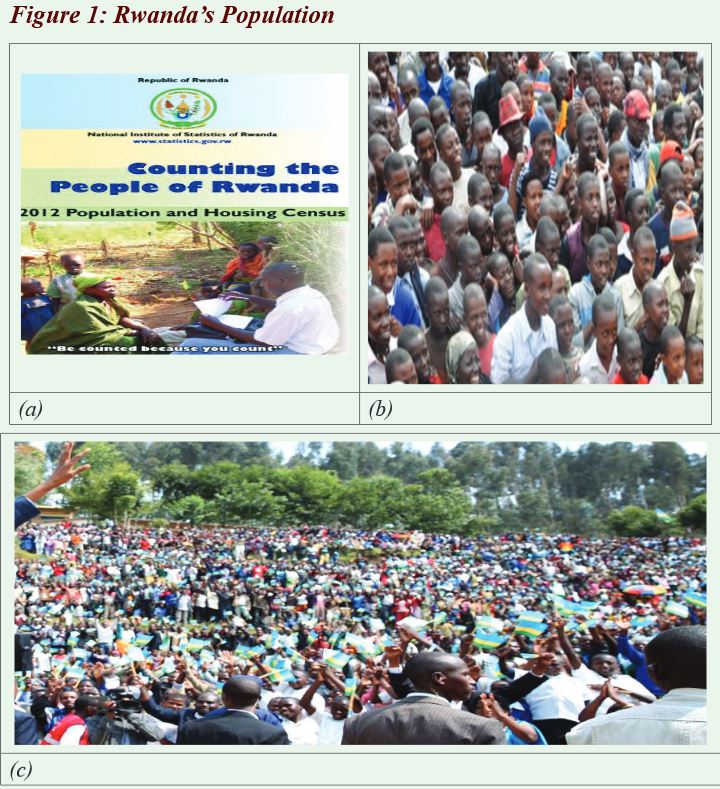
Basing on photos a, b and c in figure 1 on page 365, visit the library or internet and research on the following:
1. What is population?
2. How do we discover population of a given area /country?
3. Rwanda counted her population in:
(a) 1992 (b) 2002 (c) 2012 (d) 2015
4. Why does a country count its population?
5. What problems are faced in the exercise of counting the population of an area/ country?
11.1.2 Terms used in population
Population census
Population census is an enumeration or the counting of people living in a particular area / country at a particular period of time. The major reason for carrying out a population census is planning. As a standard recommendation, each country needs to conduct a census at least once every 10 years in order to update information collected in the previous endeavour e.g. In Rwanda, the first population census was conducted in August 1978, the second in August 1991, followed by the third in August 2002and the population was estimated to be 10,537,222 peopleas of August 15 th 2012 “census night”
Reasons for carrying out population census
Population census in any given country is carried out for different reasons. But Rwanda
carried out national housing and population census because of the following reasons.
• To determine the current size of the population of Rwanda, its spatial distribution among Provinces, Districts, Sectors,
Cells and Villages and among rural and urban areas.
• To determine the present demographic, social, economic and cultural characteristics of the population of Rwanda.
• To determine the level, structure and trends of fertility, mortality and migration in order to come up with the natural and
overall growth rates of the population of Rwanda.
• To provide indicators to enable advocacy for particular groups of the population such as women, children, youth,
elders, disabled persons.
• To determine characteristics of households, housing conditions and household welfare in Rwanda to further use
this information for a more elabourate poverty mapping of the country.
• To produce national population projections using updated demographic data and other information on population
dynamics to enhance future planning.
• To update database providing information right down to the smallest administrative unit in order to enhance the
current government policy of “villagisation”.
• To provide clear details of the current statutory boundaries of all administrative units of the country to which
appropriate geographical codes shall be assigned.
• To constitute an updated sampling frame for Rwanda and produce maps for each Enumeration Area (EA) for future
sample surveys.
• To promote the use of census data at national and local levels in formulating, monitoring and evaluation of
development programs.
Difficulties met in population census in Rwanda
Different countries face different problems during the census and even the same country faces different
problems at different times and places. These are some of the difficulties faced in carrying out a census:
• It costs a lot of money which poor countries cannot afford e.g. paying enumerators, processing data, logistics in form
of stationary etc. which are expensive.
• Remoteness of some areas which are inaccessible e.g. because of mountains, deserts, hills, forests etc. So such
people cannot be easily reached during a census which leads to estimations.
• Wars and instability make it difficult since people are scattered everywhere.
• Nomads i.e. people who move from place to place, also make counting difficult as its difficult to locate them on the
census day.
• Illiterate persons are unable to provide required information e.g. some don’t know when they were born or when they
gave birth to their children.
• Some people don’t give the actual information about population data for economic, political and religious reasons
e.g. some people think the government will use the data to charge them more taxes.
• Traditions and cultures are a problem e.g. some cultures don’t allow people to count their children with a belief that
after being counted they die and such people even hide from census personel.
• Poor infrastructure makes some places unreachable.
• Lack of qualified personel in most cases the census is conducted by village chiefs and primary school teachers who
may lack complete competence to conduct the exercise.
11.1.3 Population density
Activity 2
Basing on Figure 2 on page 368, visit the person in charge of social and economic welfare
at your district headquarters and research:
1. What is population density?
2. What is the population density of your district and Rwanda in general?
Which is the most densely and sparsely populated district/region in Rwanda?
3. Identify the consequences of densely and sparsely populated areas.
Facts
Population density is the average number of people per unit space. It is an expression of the population existing over
a specified area unit usually expressed in terms of the number of inhabitants per such an area unit which may be square kilometer, hectare or acre.
The population density of Rwanda has increased from 321 persons per sq.km in 2002 to 416 in 2012 at national level;
the highest in the East African Region and quite high compared with other countries globally.
With the exception of Kigali City whose density exceeds a thousand people per sq.km, the highest densely populated province is the Northern Province with 528 persons per sq.km, while the province with the lowest density is the Eastern Province with 275 persons per sq.km.
At the district level, except in Kigali City where district densities exceed 1,200 persons per sq.km, the densities are higher in the Districts of Rubavu (1,041) and Musanze (695), while the districts with the lowest densities are Kayonza (179) and Nyagatare (243).
For example:
Rwanda had a population of 10,537,222in 2012 people and a total area of 26,338sqKms,
its population density was calculated as:
11.1.4 Population structure, trend and distribution and impact
Activity 3
Visit the library or the internet and research about the structure of Rwanda’s population in terms of:
(a) Age and sex composition
(b) Geographical distribution
(c) Occupational distribution
(d) Structure in terms of quality.
(e) Citizenship.
(f) Religious denomination
(g) Marriage/ marital status

Ability and disability
Facts
When looking at the structure of the population, we look at age composition/ distribution, sex composition/distribution, population densities, employment structure, literacy patterns quality of the population and population growth rates.
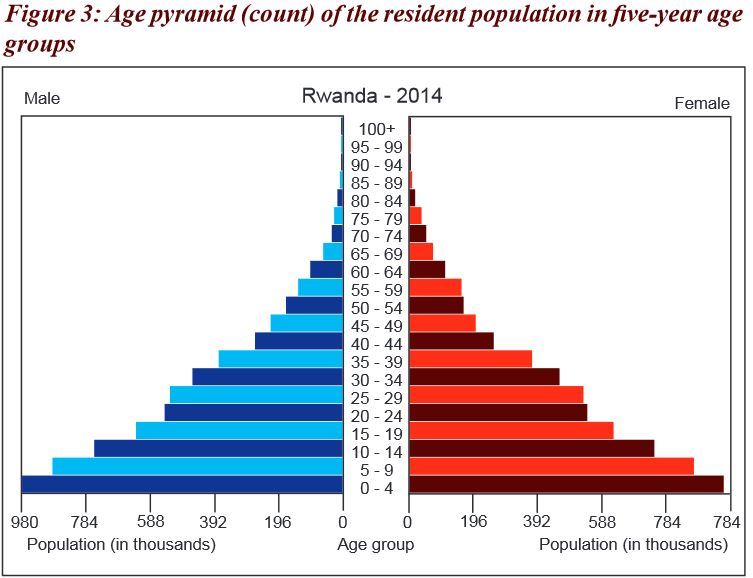
Age and sex composition of a population is shown by use of population pyramids. Population pyramid is arranged with the youngest age group at the bottom and the oldest at the top, at intervals of 5-10 years. It has two bar graphs, one for males and another for females side by side. Their shape reflects birthrate and death rate patterns as well. The shape of a pyramid varies according to the structure of the population i.e. expansive pyramid (broad base indicating high population of children and narrow top indicating low proportion of older people).This is common in LDCs as illustrated below:
The age distribution shown in the age pyramid above in figure 3, indicate the largest population as the young between 0-14,
as years go by, population goes on reducing to the extent that there are few people who reach the age of 80 years. If one compares the distribution to the situation at the time of the 2002 Census (SNR, 2005), an increase in the proportion of the oldest age groups is clear. The share of people over 80 years old increased from 12% in 2002 to 16% in 2012. This also
reflects the positive change in terms of life expectancy over the past decade.
The age distribution also shows that a higher proportion of women than men are in the older age categories, especially in
urban areas. Living conditions and health may deteriorate faster among elderly men than among elderly women. Conversely,
a larger proportion of elderly men are in the 60–64 age groups.
Implication of the above pyramid
are called dependants. Age distribution is affected by fertility rate, mortality rate, death rate and migration.
Dependence burden is the ratio of non-working to the working population. The non-working
include the young (0-15years). These are called dependants. The working include (15-64years).
Assess the implication of a high dependence ratio in Rwanda.
• Greater percentage of the young is a source of cheap labour in the future.
• There is a large market potential which will increase aggregate demand and investment.
• A high dependence ratio awakens the government to plan well for the citizens.
• Encourages hard work to meet the demands etc.
• Low levels of savings and consumption because of high rate of consumption.
• Unfavourable balance of payment position because of the increased importation to supplement the local output.
• Underutilisation of resources due to a small percentage of labour force.
• High dependence burden frustrates the smaller working class and this may lead to brain drain.
• May lead to demand pull inflation because of low output by the small working population.
• Income inequality because of high rates of expenditure and dependence.
• Strains the existing services like med-care, education among others.
• Fall in per capita income and the standard of living as one’s income is used to sustain a number of dependants. etc.
3. Sex composition
Here population is characterised according to number of females to males. The sex ratio of a population expresses
the number of males to every 100 females in a given population. E.g. in Rwanda, there are 93 males for every
100 females. Figure 4 below shows the change between 2002 and 2012 at national and provincial levels.
Figure 4 above shows that, apart from the districts of Kigali City where there are more males than females (sex ratio of 106), there are more females than males in the rest of the districts with sex ratios varying between 99 (Nyanza District) and 86 (Ngororero District). 11.2.3
4. Geographical distribution
This is assessed basing on density i.e. number of people per square kilometer, regional distribution, rural and urban
distribution etc. In Rwanda, at the provincial level, the Eastern Province has the highest population of about 2,600,814
people, followed closely by the Southern Province and the Western Province with 2,594,428 and 2,476,943 people
respectively, while Kigali City, with 1,135,428 people, has the lowest population.
At the district level, Gasabo and Nyagatare are the districts with the highest population numbers with 530,907 and 446,944 people respectively, while the districts with the least population numbers are Nyarugenge and Rulindo with 284,860 and 288,452 people respectively.
5. Structure in terms of quality
Here educated levels and health status are determined. Rwanda’s education levels have tremendously improved from the past, where many children are joining and completing primary, secondary and university as well, with the implementation of universal primary and secondary education. This has improved not only their literacy levels but health as well and standard of living in general.
Figure 6 indicates a great improvement in primary, secondary, and university levels of education in
Rwanda from 2002 to 2012 which implies an improvement in literacy rates of Rwandan population
6. Citizenship
Here we determine the indigenous population and the foreign population e.g. close to 100% of elderly as well as younger persons living in Rwanda are of Rwandan nationality, although in urban areas the percentage of foreign nationals is slightly higher (3%). Among those persons who have a foreign nationality, neighboring countries represent the majority of foreign nationals in Rwanda.
More than half are from the DRC (54%), although this represents a decreasefrom 2002, when over 70% of foreign nationals were Congolese (SNR, 2005). Nationals from Burundi rank second, contributing 15% of the foreignnationals in Rwanda. European nationals are more common among the elderly population with foreign nationality (6.2%) than among the younger population (1.4%).
7. Religious denomination
Religions and their composition are determined. In Rwanda there are many religious affiliations where everyone has a right to join any religion he / she wishes to. More than one in every two elderly persons in Rwanda is Catholic, fewer than three in every 10 are Protestants and one in every 10 is Adventist.There are very few elderly persons with other religious beliefs. Compared to the younger population, a larger proportion of elderly are Catholics and a smaller proportion are Protestants. A certain resistance to embracing religions that are newer to the country may explain this difference.
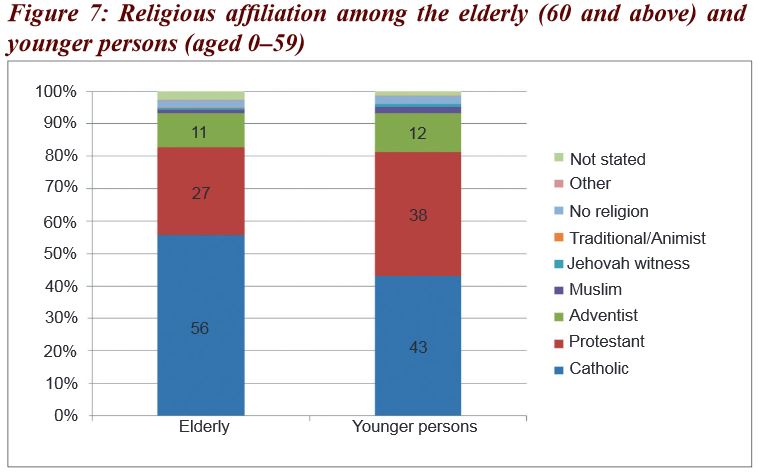
Source: Fourth Rwanda Population and Housing Census.
8. Marriage/ marital status i.e. single, married, divorced, separated, widowed
In Rwanda, 57% of the elderly are currently married, 39% are widowed, and 2% have never been married and 2% are divorced. When distinguishing by sex, one observes a very high percentage of currently married elderly men (84%), while this is the case for only 38% of elderly women, who tend to be already widowed (58%).
Factors that may explain this difference include women benefiting from higher life expectancy, higher rates of re-marriage among elderly men than elderly women. The marital status of elderly people is similar across areas of residence. The percentage of those never married, divorced, and widowed is slightly higher in urban areas, while in rural areas a larger share of the elderly were married at the time of the census.
9. Ability and disability
i.e. difficulties in performing various activities (walking, seeing, hearing, etc.),
We find the disability prevalence to be higher among the elderly than the general population e.g. 100,657 persons aged 60 or older declare that they are living with a disability, out of which around 60% are women and 40% men. Similar to the general distribution of the elderly population across areas of residence, most disabled elderly people live in rural areas.
11.1.5 Population growth
Activity 5
Visit the school library or the internet and research on the following.
1. What is population growth?
2. What is the population growth rate of Rwanda?
3. Discuss the effects of such a population growth rate in Rwanda.
4. What determines the population growth of a country?
5. Compare the population growth rate in Rwanda and her neighbouring countries.
Facts
Population growth is the rate at which the population of the country increases or decreases over time. It is measured by percentage change in the population. The average annual population growth rate of Rwanda (2.6%) is among the highest in Africa. It is higher in the Eastern Province (4.3%) and Kigali City (4.0%) and lowest in the Northern Province (1.0%) and Southern Province (1.9%).
There are three major types of population growth as shown below:
Activity 6
Basing on the knowledge from the research in activity 5 on page 377,
work out and present the following in your exercise books:
1. Identify the ways in which population growth can be measured.
2. What are the factors that influence birth rate and death rate in an economy?
3. Given that the rate of a given area is 80 and death rate is 45, calculate the population growth of that area.
Facts
1. Natural population growth rate
This is brought about by an increase in the birth and a fall in the death rate.
2. Artificial population growth
This is due to migration. I.e. immigration refers to the coming of people to stay in the country therefore it increases
the number of people in the country while emigration refers to people moving to settle in other countries therefore
it reduces number of people in the country.
3. Actual population growth
This is population growth resulting from combination of natural and artificial growth.
Actual population growth = BR-DR + Net migration (immigration-emigration)
The population of a country may increase due to the following factors:
• Birth rate may be increasing more than the death rate
• Death rate may be falling while birth rate remain constant
• Immigration may be greater than emigration
• When the percentage of married women in the total population is big
• When women are given low status in society i.e. when they are thought to be only producers of children.
There are three major determinants of population growth of a country
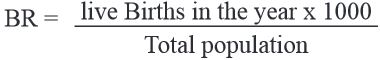
1. Birth rate
This is the number of children who are born per 1000 of the population in a year.
Birth rate is affected by the following factors:
• Ratio of women to men. The higher the ratio of women to men, the higher
the birth rate and the lower the ratio, the lower the birth rate.
• Level of education. Educated people tend to produce less children compared to the uneducated.
• Rate of birth control. The higher the use of control measures like family planning,
the lower the birth rate and the reverse is true.
• Number of married people in the country. In some countries people delay to get married while others remain
single and this reduces the birth rate, where marriage is at a high rate, birth rates will be high.
• Religion. Some religions do not accept the use of family planning methods while others accept polygamy and
all these increase birth rates.
• Marriage age. Where the marriage age is high e.g. above 18, birth rates will be low while a lower age, will increase
the birth rate.
• Culture. Some cultures believe in polygamy while others believe in children as a source of wealth. This increases birth rates.
• Government policy towards limitation of the number of children one can produce.
2. Death rate
This is the number of people who die per 1000 of the total population in a year.
Death rates of the country depends on the following:
• Medical care. If medical care if available, death rates will be low and vice versa.
• Poverty levels, the higher the rates of poverty, the inability of the person to get the basics hence high
death rates, lower rates of poverty will lead to low death rates.
• Political situation. High rates of instabilities will cause high death rates compared to good political atmosphere.
• Natural disasters like earth quakes, floods among others increase death rates.
• Accidents like fire, motor etc. all increase death rates.
• Incidences of diseases in some areas also influence the death rates. etc.
3. Migration
Migration refers to people coming in to settle in the country (immigration) and people going out of the country
to settle in other countries (emigration). People move from one country to another because of many reasons like;
• Political instabilities in their countries
• Looking for jobs
• Weak migration laws making it easy to move to other countries
• Some countries allow duo citizenship so people find it easy to move from one country to another
• Desire to change environment
• Having friends and relatives
• Seeking for education etc.
Measures to control population growth
Activity 7
Rwanda education Board (REB), through its department of curriculum development, has of recent taken a decision of revising the schools’ curriculum in all subjects at all levels. One of the cross cutting issues addressed in all subjects at all levels, is comprehensive sexuality education.
1. What do you think was the intension of REB to tackle this issue?
2. What impact does it have on population growth rate of Rwanda?
3. Why is it necessary for your country to control the rapid population growth rate?
4. What other measures can be taken by the government of Rwanda to control population growth?
Facts
Population is controlled because of the problems associated with a big size of population. If population
is not controlled, then a number of problems will occur. Thus it is important to control population through:
• Introducing sex education in the school curriculum to educate the youths/ teenagers about the dangers
of early sex which normally results into unwanted pregnancies which increases birth rate.
• Encouraging family planning which includes the use of contraceptives.
• Promoting girl child education since educated people produce few children because of different reasons.
• Discouraging early marriage by raising the age of consent and punishing those who break the law.
• Legalise abortion to prevent unwanted pregnancies where marriage laws are difficult to enforce.
• Encouraging international migrations so that people can move to different countries.
• Setting up institutions to encourage population control e.g. family planning clinics, hospitals etc.
• More campaigns to discourage polygamy which results into high birth rates.
• Improve health facilities to reduce infant mortality rates to assure parents that the few children produced will survive.
• Reducing the demand for children by reducing their incentives like free education and bursaries. etc.
• Rural development programs e.g. modernisation of agriculture and establishing socio- economic infrastructure.
• Use of coercive measures e.g. fines, penalties, jail sentences or sterilisation of men who break population laws.
• Increasing government expenditure so as to increase productivity such that economic growth copes with population growth.
• Encouraging social mobility among women by taking up formal jobs.
• Provision of social and economic incentives to small families as a means of discouraging people from having
large families e.g. giving free child education to the first 2 children in a family, housing and free medical facilities
to such families.
• Economic disincentives are instituted on large families e.g. denial of free education, medical care, high taxes on
such families etc.
• Encouraging internal migrations from areas of dense population to sparsely populated areas.
• Massive sensitisation to the public by the government and non-government organisation about the dangers
of high population growth rate and consequences of many children..
11.2 Population theories
Malthusian population theory
Activity 8
Visit the school library or the internet; carry out research and present in class.
1. State the Malthusian population theory.
2. What are the assumptions underlying the theory?
3. Illustrate the Malthusian population theory on a graph.
Facts
This was put up by Reverend Thomas Robert Malthus an English Economist (1798 — 1823) who pointed out the dangers of over population in relation to the supply of food in relation to food supply. It explains the relationship between the growth in food supply and in population. Population depends on food supply.
When food supply increases, population growth increases and vice versa. The theory states that population increases faster than food supply and if unchecked leads to misery. Man’s biological capacity to reproduce himself exceeds his physical capacity to increase the food supply.
Assumptions of the Malthusian population theory
Reverend Malthus assumed that:
• Population growth depends on food growth and that when food supply increases, population also increases.
• The supply of land is fixed thus the operation of the law of diminishing returns.
• Population grows at a geometric rate i.e. 2,4,8,16,32, etc.
• Food increases at an arithmetic rate of 2, 4,6,8,10,12, etc.
• Man’s capacity to reproduce himself is greater than his capacity to produce food. Malthus therefore concluded that at
one time population growth will be too much to be fed by the available food and this will lead to misery, suffering and death.
• Every effort to improve the conditions of people through state subsidies and private charity would fail because of the
increased population growth it generates.
Malthus predicted that there will be a point where population growth will be equal to food production and he termed this population trap and beyond this point the food resources will not be enough to feed the population.
Malthus identified positive checks and negative checks on population growth. The positive checks check on population
growth in a crude way and they include famine, death, accidents, wars etc. the negative checks check on population growth
by reducing the birth rates. They include late marriage, family planning, moral restraint etc.
From the figure 9 above, Line
bcd represents the growth of population in the absence of any checks. The actual population growth rate is represented by line
bce in the presence of checks. Beyond time

, population growth exceeds food supply, and therefore people are likely to starve to death. Malthus indicates that always there are positive and negative checks operating.
Applicability/ Relevance of the Malthusian theory in LDCs
Activity 9
From the research made in activity 8 on page 383, basing on the assumptions of the theory,
to what extent do you think is the theory applicable to Rwanda and LDCs in general?
Facts
To a small extent, the Malthusian population theory is applicable in LDCs’ economies in the following ways:
• Farming planning measures are being used in many countries as suggested by Malthus to control population growth.
• The positive checks like diseases, accidents etc. exist in many countries.
• In many parts of the world, pressure on land forces many people into disputes and migration.
• Some areas in the world face food shortages as suggested by Malthus.
• Land being a fixed factor, faces diminishing returns in that when population increases, productivity of the land decreases.
Criticisms/ limitations of Malthusian theory
To a big extent the theory is criticised because of the following:
• He did not consider the role of foreign aid in assisting the increasing population.
• Malthus never stated the time when population growth would equal the food supply (population trap).
If the time were known, then probably the government would devise ways and means of either increasing
food supply or controlling population.
• Food is not the only determinant of population growth as suggested by Malthus but there are other causes
like migration, level of education, cultural values etc.
• He underrated the agricultural technological developments in the production of food. He could not foresee the
unprecedented improvements in agricultural technology. Due to this rapid improvement in agricultural technology,
the food supply has increased much faster than the arithmetical progression.
• The theory did not put into consideration international trade which can increase food supply by importation but considered
a closed economy.
• The possibility of modernising agriculture to increase agriculture was not foreseen by Malthus.
• There is no mathematical relationship between food growth and population growth.
• International migrations were ignored by the theory. The population could not outstrip the food supply due to international
migrations. i.e. he did not consider people moving from one country to another to reduce population pressure.
• Malthus never thought of the possibility of getting additional supplies of land by opening up new areas.
• According to Malthus, preventive checks possibility only pertains to moral restraint and late marriages. Malthus never
thought of the introduction of modern techniques of family planning devices.
• Malthus takes the increase in population as a result of rising birth rate. Population, however, has increased tremendously
due to a decline in the death rate. He could not foresee the rapid improvements in medical facilities.
11.3 The theory of demographic transition
Activity 10
Visit the school library or internet, carry out research and present the following in class;
1. What is demography?
2. Explain, with the aid of illustrations, the stages of demographic transition.
3. According to stages of this theory, where do you think Rwanda’s current level is and why?
Facts
Demography is the study of population characteristics like birth rates and death rates and their effects on population changes. The theory explains population growth in historical perspective in developed countries. According to this theory, population in developed countries has passed through 5 stages to reach where it is today and it is shown in the figure 10 below.
Stage I: At this stage there is a high population growth rate and it is stagnant because of a high birth rate and high death rate. The high death rate is due to poor living conditions, poor technology, food shortages, and illiteracy among others.
The stage is characterised by widespread poverty, large families where children are taken as assets, source of income and a source of employment.
Birth control is not heard of and hence, high birth rates. Along with the high birth rates, the death rates are also high due to: poor medical facilities, poor medicare, poor nutrition, poor housing and poor clothing. Consequently, the high birth and death rates remain approximately equal during this stage leading to more less a static equilibrium with zero population growth rates.
Stage II: Expanding phase marked by high birth rate and high but declining death rate. The economy enters the phase of economic growth. Agricultural and industrial productivity increases leading to increases in incomes. The birth rate remains high and stable as in stage I. Individuals do not have any inclination to reduce the birth rate since children are able to add more to the family income.
The death rate is declining due to good quality food products, improved medical and health facilities and introduction of modern drugs. With a stable birth rate and decline in the death rate, population increases at a rapid rate leading to a population explosion. Population is increasing at an increasing rate.
Stage III: It is a stage of declining population growth rate. The declining birth rate is accompanied by rapid decline in the death rate. As a consequence, population growth rate declines.
Stage IV: The low stationary stage with low birth rate balanced by low death rate. The birth rate declines and tends to equal the death rate so that the population growth rate is almost zero. In this stage, the standard of living is generally high.
Stage V: The declining stage with low death rate, lower birth rate and an excess of deaths over births. In this stage, the decline in birth rates is greater than the decline in the death rate leading to a negative population growth rate.
Problems of applying the demographic transition
• Developing countries differ in many respects from Western nations
as they moved through the demographic transition.
• Population growth is higher now in many countries than before.
• Mortality declines have been much more rapid.
• Fertility levels are much higher.
• Migration does not serve as a safety valve.
The concept of optimum, under and over population
Activity 11
Visit the school library or internet and research on the following:
1. Distinguish between optimum, under and over population.
2. Examine the social-economic implication of optimum, under and over population.
3. With the aid of an illustration, show the relationship between optimum, under and over population.
Facts
Optimum population
This is that size of population which is neither too big nor too small for the existing amounts of resources. Or it
is that population that is just appropriate for the existing resources. This population has got implications such as
• There will be full employment leve
l• High standard of living
• High output per worker
• There can be no dependants on imports
• Minimum income inequality
• High tax revenue to the government
Under population
This is a situation where population is less than the available resources. Or it is that population
which is insufficient in relation to the available resources.It has got the following implications:
Positive implications
• Over exploitation of resources is reduced.
• Reduced government expenditure on the provision of social services.
• Limited imports hence avoiding balance of payment deficits.
• Limited income inequality due to enough resources for everyone.
• High output per person due to the resources available.
• Minimal social and political instability.
Negative implications
• Leads to excess capacity in the country i.e. producing less than the installed capacity.
• Small market size which leads to low aggregate demand.
• Low tax revenue to the government.
• Low levels of economic growth due to limited production of goods and services.
• Limits international trade due to low levels of imports and exports.
• Low levels of specialisation and a tendency to undertake subsistence production.
In the above figure 11, before point

, the population is still low compared to the resources available. At point p* there is optimum population where the population matches the available resources and after that point the population exceeds the available resources and utilisation of resources.
Overpopulation
This is a situation where there are excess people in relation to the available resources.
Or it is the population which is in excess of the optimum population.
Positive implications
• Big market size due to the large population.
• Generates cheap energetic and mobile labour force.
• Encourages specialisation in production hence promotes trade.
• High tax revenue due to a wider tax base.
• Increased resource exploitation due to high levels of innovation and invention.
• Increases pressure on development projects due to competition.
• Government is awakened the responsibility of providing social services.
• Initiates effort to work harder to sustain the big population.
Negative implications
• Heavy dependence burden especially when there is an increase in the young and the old.
• Excessive demand for social services like hospitals and schools among others which increases government expenditure.
• Low saving rates because of excessive consumption leading to low investments and low capital accumulation.
• Over exploitation of natural resources which speeds up resource depletion.
• Low standard of living due to decrease in the per capita income.
• Unemployment and underemployment results due to limited opportunities in relation to the population.
• High rates of illiterates because of inadequate education facilities.
• High rates of brain drain due to skilled labour being unemployment.
• Social and political problems arising from competition for opportunities and food riots.
• Too much congestion in rural and urban areas which results in diseases and crimes etc.
11.3.1 An ageing population
Activity 12
Through individual work, in your exercise books, explain the following;
1. An ageing population.
2. The effects of an ageing population in an economy.
Facts
An ageing population is a population which is experiencing an increase in the old people and a fall in the percentage
of the young. It is caused by factors that increase life expectancy combined with those factors that reduce birth rates.
Effects of an Ageing population
• Decline in labour force for the future.
• High dependence burden.
• Labour immobility i.e. the old are immobile.
• High levels of conservativeness because the old tend to obstruct new ideas.
• Increased government expenditure on retirement benefits.
• Reduction in aggregate demand for some commodities because the clothes for the youth may not be consumed by the old. This may lead to laying off of some workers.
• There is a change in the patterns of consumption i.e. goods for the old like huts, long dresses, big trousers among others.
• The burden of paying taxes and developing the economy falls on the young ones.
• More goods for the old people are now being produced e.g. hats, walking sticks, big trousers, very long dresses, big shirts,etc.
• Structural unemployment. As the demand for the products of those industries engaged in products for the young falls,
there is the possibility of some workers being laid off.
• There will be shortage of labour to new industries. If the population is ageing, it will be unable to supply the required labour
to both new and expanding industries.
• Older people are more conservative and less innovative and this therefore, retards development.
Declining population
This is the population which is continuing to be small in numbers. It is caused
by factors that increase death rates and reduce birth rates.
11.4 The population structure of Rwanda
Activity 13
Visit the school library or the internet and research about the population structure of Rwanda.
Facts
• There is generally low life expectancy i.e. according to National institute of statistics in Rwanda 2011 life
expectancy for males was 58years while females 59.5 years.
• There is high levels of unemployment and underemployment.
• More than 70% of the population is employed in agriculture either directly or indirectly.
• There is a high level of illiteracy levels especially among the old.
• There are more women compared to the number of men in the total population.
• Nearly half of the population is below 18 years and a few are above 65 years.
• Population grows at a rate of about 2.6 per cent.
• There is variation of population density with levels of about 416 per square kilometer and fewer in other areas.
11.5 Population problems in LDCs
Activity 14
Identify different problems of population in LDCs and present in class.
Facts
• Dependants — Heavy dependence burden and therefore poor standards of living.
• Population pressure.
• Low capital accumulation — low saving, investment levels, low income per capita.
• Diseases, poor health and housing conditions — generally low standards of living.
• Problem of feeding the population.
• Poor quality of the population — low education.
• Unfavourable balance of payments.
• Rural-urban migration with all its consequences like urban unemployment, creation of slums, crime, etc.
• Heavy government expenditure on social services increases.
• High rates of income inequalities/ disparities.
• High rates of social evils like prostitution, witchcraft among others.
• Increased pressure on land.
• Increased pressure on infrastructure like social services.
• High rates of brain drain in search for employment.
• Unemployment problem.
Unit assessment
1. Discuss the social – economic implication of an economy where 60% of the population is below adult age,
10% is above retirement age and annual population growth rate of 4%.
2. (i) Analyse the population problems that your country is facing.
(ii) Advise Rwanda government on how to control population growth
11.6 Glossary
- Actual population growth: This is population growth resulting from combination of natural and artificial growth. Actual population growth = BR-DR + Net migration (immigration-emigration.
- A declining population: This is one which is continuing to be small in numbers as shown by low birth rates and an increase in death rates.
- Age Structure:This is the age composition of a given population.
- An ageing population: This is one which is experiencing an increase in the old people and a fall in the percentage of the young. It is caused by factors that increase life expectancy combined with those factors that reduce birth rates.
- Artificial population growth: This is due to migration i.e. both immigration and emigration.
- Birth rate: This is the number of children who are born per 1000 of the population in a year.
- Child mortality Rate: This is the number of children who die between the ages of 1 to 5 per 1000 live births in the year.
- Death rate:This is the number of people who die per 1000 of the total population in a year.
- Declining population: This is the population which is continuing to be small in numbers. It is caused by factors that increase death rates and reduce birth rate.
- Demography: This is the study of population characteristics like birth rates and death rates and their effects on population changes.
- Fertility Rate: This refers to the average number of children a woman is expected to produce in her life time.
- Infant mortality Rate: This refers to the measure of the number of deaths of infants. Children who die between the ages of 0 to 1 per 1000 live births in the year.
- Life expectancy: This refers to the average number of years a person is expected to live.
- Natural population growth rate: This is brought about by an increase in the birth and a fall in the death rate.
- Optimum population: This is that size of population which is neither too big nor too small for the existing amounts of resources. Or it is that population that is just appropriate for the existing resources.
- Over population: This is a situation where there are excess people in relation to the available resources. Or it is the population which is in excess of the optimum population.
- Population: This refers to the number of people living in an area at a particular period of time.
- Population census: This is the counting of people in a particular area at a particular period of time.
- Population growth: This is the rate at which the population of the country increases or decreases over time. It is measured by percentage change in the population.
- Under population: This is a situation where population is less than the available resources. Or it is that population which is insufficient in relation to the available resources.
Unit summary
• Population
• Meaning
• Terms used in population
• Population Census
• Population density
• Population structure, trend and distribution
• Population growth
• Population Theories
• Malthusian population theory
• Demographic Transition theory
• Theory of Optimum population

 For example:Rwanda had a population of 10,537,222in 2012 people and a total area of 26,338sqKms,its population density was calculated as:
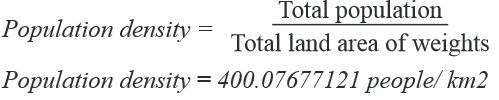
 The age distribution shown in the age pyramid above in figure 3, indicate the largest population as the young between 0-14,as years go by, population goes on reducing to the extent that there are few people who reach the age of 80 years. If one compares the distribution to the situation at the time of the 2002 Census (SNR, 2005), an increase in the proportion of the oldest age groups is clear. The share of people over 80 years old increased from 12% in 2002 to 16% in 2012. This alsoreflects the positive change in terms of life expectancy over the past decade.The age distribution also shows that a higher proportion of women than men are in the older age categories, especially inurban areas. Living conditions and health may deteriorate faster among elderly men than among elderly women. Conversely,a larger proportion of elderly men are in the 60–64 age groups.
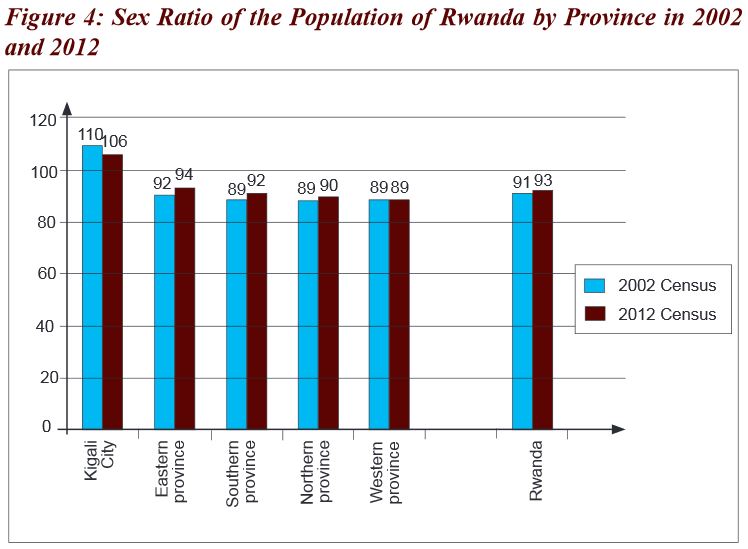 Figure 4 above shows that, apart from the districts of Kigali City where there are more males than females (sex ratio of 106), there are more females than males in the rest of the districts with sex ratios varying between 99 (Nyanza District) and 86 (Ngororero District). 11.2.3
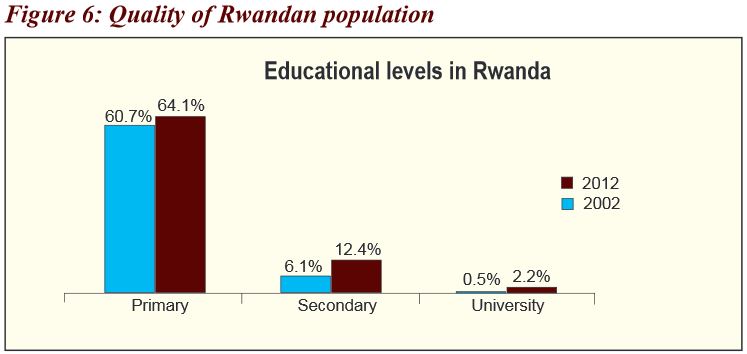 Figure 6 indicates a great improvement in primary, secondary, and university levels of education inRwanda from 2002 to 2012 which implies an improvement in literacy rates of Rwandan population
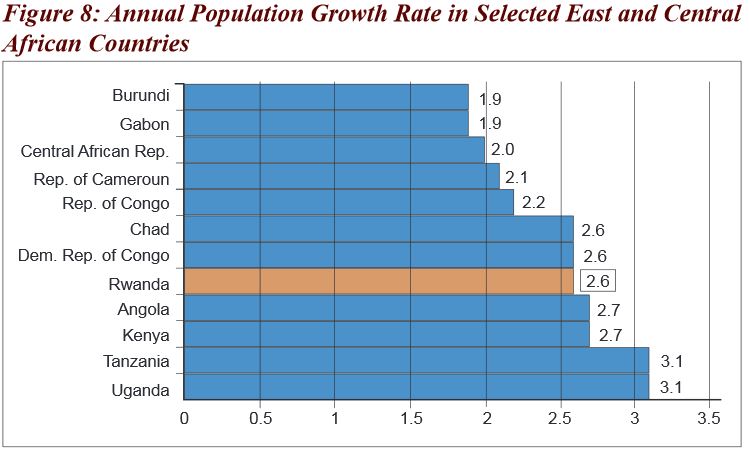 There are three major types of population growth as shown below:
 Birth rate is affected by the following factors:• Ratio of women to men. The higher the ratio of women to men, the higherthe birth rate and the lower the ratio, the lower the birth rate.• Level of education. Educated people tend to produce less children compared to the uneducated.• Rate of birth control. The higher the use of control measures like family planning,the lower the birth rate and the reverse is true.• Number of married people in the country. In some countries people delay to get married while others remainsingle and this reduces the birth rate, where marriage is at a high rate, birth rates will be high.• Religion. Some religions do not accept the use of family planning methods while others accept polygamy andall these increase birth rates.• Marriage age. Where the marriage age is high e.g. above 18, birth rates will be low while a lower age, will increasethe birth rate.• Culture. Some cultures believe in polygamy while others believe in children as a source of wealth. This increases birth rates.• Government policy towards limitation of the number of children one can produce.
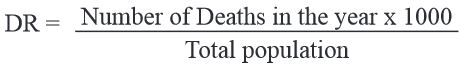 Death rates of the country depends on the following:• Medical care. If medical care if available, death rates will be low and vice versa.• Poverty levels, the higher the rates of poverty, the inability of the person to get the basics hence highdeath rates, lower rates of poverty will lead to low death rates.• Political situation. High rates of instabilities will cause high death rates compared to good political atmosphere.• Natural disasters like earth quakes, floods among others increase death rates.• Accidents like fire, motor etc. all increase death rates.• Incidences of diseases in some areas also influence the death rates. etc.
 From the figure 9 above, Line bcd represents the growth of population in the absence of any checks. The actual population growth rate is represented by line bce in the presence of checks. Beyond time
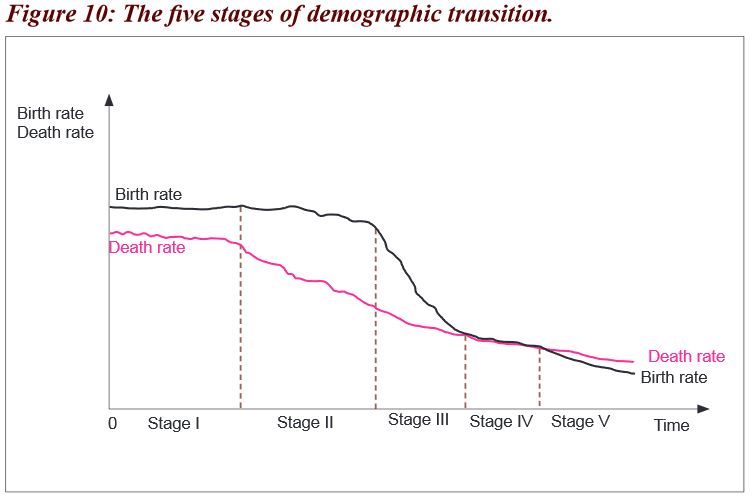 Stage I: At this stage there is a high population growth rate and it is stagnant because of a high birth rate and high death rate. The high death rate is due to poor living conditions, poor technology, food shortages, and illiteracy among others.The stage is characterised by widespread poverty, large families where children are taken as assets, source of income and a source of employment.Birth control is not heard of and hence, high birth rates. Along with the high birth rates, the death rates are also high due to: poor medical facilities, poor medicare, poor nutrition, poor housing and poor clothing. Consequently, the high birth and death rates remain approximately equal during this stage leading to more less a static equilibrium with zero population growth rates.Stage II: Expanding phase marked by high birth rate and high but declining death rate. The economy enters the phase of economic growth. Agricultural and industrial productivity increases leading to increases in incomes. The birth rate remains high and stable as in stage I. Individuals do not have any inclination to reduce the birth rate since children are able to add more to the family income.The death rate is declining due to good quality food products, improved medical and health facilities and introduction of modern drugs. With a stable birth rate and decline in the death rate, population increases at a rapid rate leading to a population explosion. Population is increasing at an increasing rate.Stage III: It is a stage of declining population growth rate. The declining birth rate is accompanied by rapid decline in the death rate. As a consequence, population growth rate declines.Stage IV: The low stationary stage with low birth rate balanced by low death rate. The birth rate declines and tends to equal the death rate so that the population growth rate is almost zero. In this stage, the standard of living is generally high.Stage V: The declining stage with low death rate, lower birth rate and an excess of deaths over births. In this stage, the decline in birth rates is greater than the decline in the death rate leading to a negative population growth rate.
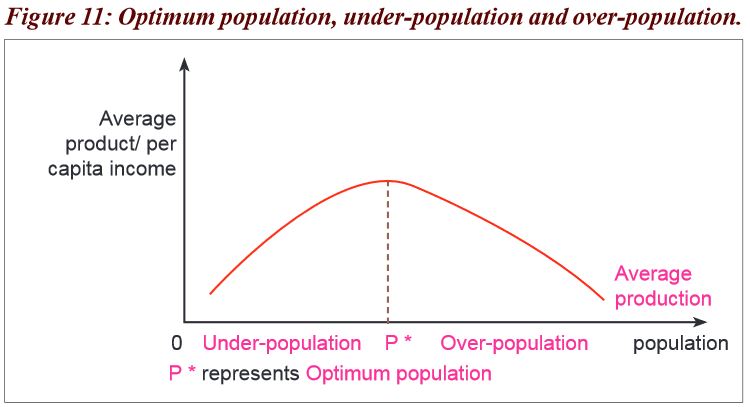 In the above figure 11, before point