Unit 4:SIMULTANEOUS LINEAR EQUATIONS 4 AND INEQUALITIES
Key unit competence: By the end of this unit, the leaner should be able to solve
word problems involving simultaneous linear equations and inequalities.Unit outline
• Simultaneous linear equation
• Inequalities
- Graphical representation of linear inequalities
- Forming inequalities from given regions
- Linear inequalities in two unknowns
- Graphical solutions of simultaneous linear inequalities
- Linear inequalities from inequality graphs
Introduction
Unit Focus Activity
1. (a) On the same axes draw the graph of the lines whose
equations are:
–2x + y = –1 ................(i)
x + 2y = 4 ..................(ii)
(b) State the coordinates of the point where the two lines
intersect. What meaning do
you attach to this answer?2. Using the same equations in 1 (a)above.
(a) Use equation (i) and express x in terms of y.
(b) Substitute your answer from (a) in equation (ii) to obtain an
equation in y.(c) Solve the above equation to obtain the value of y.
(d) Substitute the y value in equation (i) to obtain the value of x.
3. Consider the situation below:
A learning institution employs men and women during the school
vacation. A day’s wage for 3 men and 2 women is 4 000 FRW. For 1
man and 5 women the wage is 3 500 FRW.(a) If a man earns x FRW and a woman y FRW per day, write
two equations in terms of x and y for the given situation.(b) Solve the equations using different methods.
4. Consider the inequalities:
(i) y > x + 1 (ii) 2x + y ≤ 5(a) On a Cartesian plane, draw the line y = x + 1. Pick a point
clearly not on the line and substitute the x and y values
in y = x + 1 to determine the region of y > x + 1
On the same axis draw the line y + 2x = 5
By substitution identify the region y + 2x ≤ 5(b) Identify the region that satisfies both the inequalities
y > x + 1 and y + 2x ≤ 54.1 Simultaneous linear equation
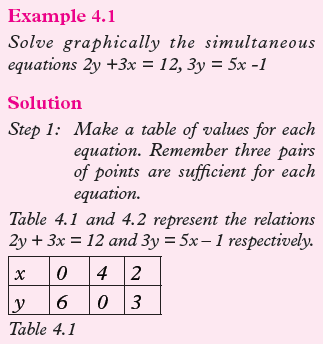
4.1.1 Solving simultaneous equations graphically
Activity 4.1
Using the equations
(i) y = 2x + 1 (ii) 2y = x – 41. Make separate tables of values for each equation for values of
x: –3 ≤ x ≤3.2. On the same axes, draw the two lines.
3. Do the lines intersect? If yes state the coordinates of the point where
they intersect.4. Describe the significance or the meaning of the point of intersection
of the two lines.Points to note
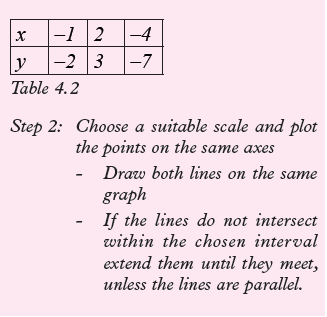
1. Before drawing any graph it is usually necessary to;i. Make a table of values for at least three pairs of points.
ii. Plot points from the table.
2. In each of the equations, there are two variables, x and y. x is called
the independent variable, marked on the horizontal axis; y is called the
dependent variable marked on the vertical axis.3. Choose an appropriate scale depending on the values on the table.
If the number is small we use a small scale such as 1cm represent 1 unit on
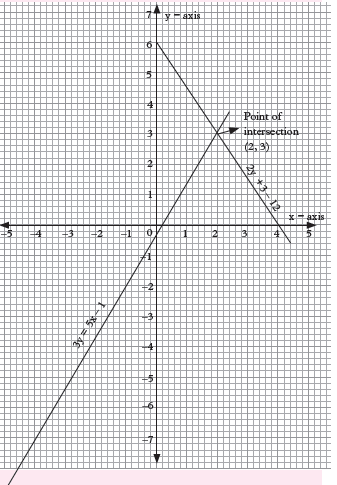
both sides.• We can use a graphical method to solve any pair of simultaneous
equations.• If a pair of equations produces parallel lines when graphed, then the equations have no solution
since the lines never intersect.• Remember when two lines are coincident, then the lines
represent a pair of equations which are said to have an infinite
solution set. This means that for any value of x picked there is a
corresponding value of y on the graph.• If the lines intersect, there is one unique solution.

Exercise 4.1
Use graphical method to solve the following
simultaneous equations. Verify your
answers by substituting your solutions in
the given equations.
1. x + y = 3 2. x – 2y = 5
4x – 3y = 5 2x + y = 53. x + y = 0 4. x + 2y = 5
2y – 3x =10 4x + 2y = 15. 4x – 3y = 1 6. 6x – y = –1
x – 4 = 2y 4x + 2y = –67. 4x – y = –3 8. 5x + 2y = 10
8x + 3y = 4 3x+7y = 299. 2x – 4y = 8 10. 1/2x – 2y = 5
3x – 2y = 8 1/2x + y = 111. 2x – 4y +10= 0 12. 3x – 5y = 23
3x + y – 6 = 0 x – 4y = 3
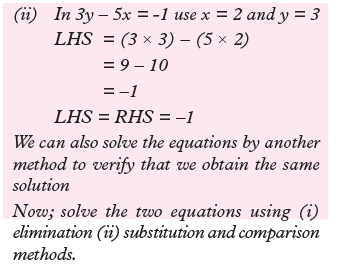
13. Solve questions 1 to 12 using;i. Elimination method
ii. Substitution method
iii. Comparison method
4.1.2 Solving problems involving simultaneous equations
Activity 4.2
Two numbers x and y are such that x < y. The sum of x and y is 90 and a
third of the smaller number equals a seventh of the larger.1. Form a relation connecting x, y and 90.
2. Relate a third of the smaller number and a seventh number of
larger in an equation.3. State two equations in terms of x and y.
4. Solve the equations in (3) above simultaneously.
5. Hence state the value of the two numbers x and y.
In this section we shall deal with situations which give rise to simultaneous equations.
Points to note
• To form simultaneous equations from a given situation, we must
define the two variables, say x and y.• Relate the two variables using the
given information i.e. form two distinct equations in x and y.• Simultaneous equations can be solved either algebraically or
graphically.• To solve simultaneous equations, graphically, we draw the lines
representing the two equations on the same graph.• If the equations have a solution, the lines will intersect at a point.
The x and y values at the point of intersection represent the solution
of the equations.• If no solution, the lines will be parallel.
• If the lines are coincident, it means the equations have an infinite
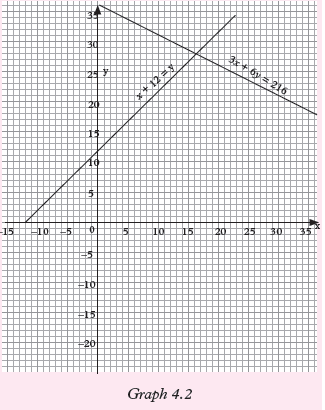
solution.Example 4.2
Some bird watchers travelled along the river for 3 hours and then travelled in the forest
for 6 hours. The total distance travelled was 216 km. If they went 12 km/h faster in the
forest than along the river, what would have been the different speed?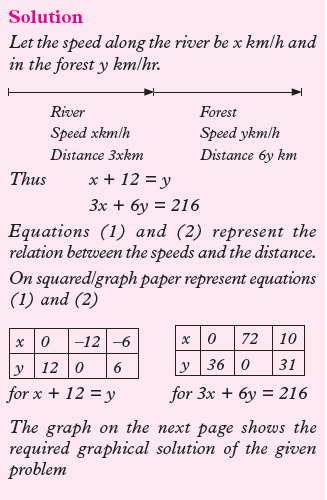
Exercise 4.2
1. Find the total distance in terms of x and y for each of the following:
(a) A car travels for x hours at 60km/h and y hours at 100 km/h.
(b) A person ran for 5 hours at x km/hr and 10 hours at y km/h.
2. Write an equation in two variables for each of the following:
(a) The total interest on an amount of money invested at 10% p.a
and another amount invested at 12% p.a is 1 609 FRW.(b) The interest on an amount of money invested at 8% p.a exceeds
the interest on another amount of money invested at 9% p.a by 100.3. Write an equation in two variables for each of the following:
(a) The sum of two numbers is 48.
(b) One number exceeds another by 5.
(c) The sum of the width and length of a rectangle equals 96
units.(d) When Jane’s age is added to Anne’s age, the sum is 36 years.
4. Two numbers are such that their sum is 84 and three times the greater
exceeds the twice the smaller by 62. Form two simultaneous equations
and solve them to find the numbers.5. John has a total bill of $580 consisting of $5 bills and $10 bills. If he has a
total of 76 bills, how many of each does he have?6. Mary invested her savings of 4800FRW partly at 9% p.a and the rest
at 10% p.a. At the end of the year the interest from the 9% interest was
4300 FRW less than the interest from the 10% investments. Form a pair of
simultaneous equations and solve them to find how much was invested
at each rate.7. James rented a tourist van and went
at 40 km/h on all weather road and at 10 km/h through a park. It took 5.75
hours to travel 185 km on the trip. Use simultaneous equations to find
the number of kilometres he drove through the park.8. A newspaper editor hired a writer for
jokes or cartoons. The cost for 8 jokes and 6 cartoons is 610 FRW. The cost
of 6 jokes and 8 cartoons is 510 FRW. How much do a joke and a cartoon
together cost?9. Two numbers are such that their sum
divided by 4 is equal to 14. If the greater number is increased by 24, the
result equals three time the smaller number. Find the two numbers.10. At an environmental studies conference, there were 168 more
engineers than chemists. However, there were 268 physicists. If there
were a total of 1134 engineers and chemists, how many of each were
there?11. At the beginning of the rainy season, a farmer bought 470 sacks of corn seeds
at 8 FRW per sack and bean seeds at 12 FRW per sack. For each 250 ha,
112 sacks of corn seeds are needed. If the total cost was 4260, how many
sacks of bean seeds were bought?4.2 Inequalities
4.2.1 Graphical representation oflinear inequalities
So far, we have represented inequalities on a number line. In this section we are going
to represent inequalities on a Cartesian plane. Remember that, (x, y) denotes any
point on the Cartesian plane. Graph. 4.3 shows the graph of x = 3.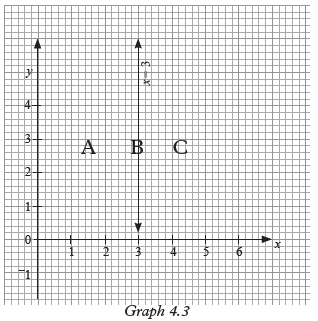
The line x = 3 divides the cartesian plane into three sets (3 regions) of points. These
are:i) the set of point B on the line,
(ii) the set of point A on one side of the line i.e. to the left of the line.
(iii) the set of points C on the other side of the line i.e. to the right of the line.
The same line divides the plane into two regions A and C one on either side of the
line.Activity 4.3
Use Fig. 4.3 to do this activity. Imagine that a Cartesian plane extends
indefinitely in all directions and that a line also extends indefinitely in two
directions in Fig. 4.3.1. Into how many sets of points does the line x = 3 divide the Cartesian
plane?
2. Identify and describe each set of points with reference to the line.3. Into how many regions (areas) does the line divide the plane?
The x-co-ordinate for every point to the left of the line x = 3 is less than 3, i.e. x < 3.
For all the points to the right of line
x = 3, the x-co-ordinate is greater than 3,
i.e. x > 3.
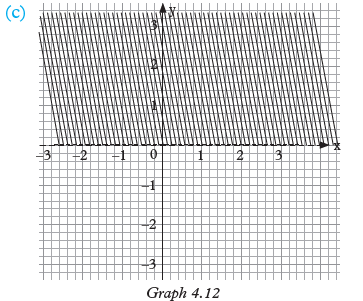
Graph 4.4 (a) shows the region containing all points (x , y) for which x < 3. This is
shown with a dotted line meaning that points on the line are not part of the
region.
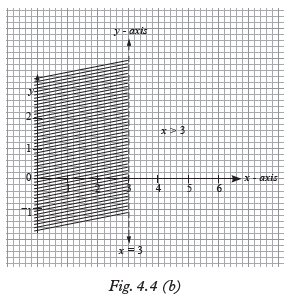
Graph 4.4 (b) shows the region containing all points (x , y) for which x ≥ 3. This is
shown with a solid line, meaning that points on the line are part of the required
region.Note the following:
(a) Any line divides a plane into threesets of points i.e.(i) Points on the line.
(ii) Points on either side of the line
(b) In a Cartesian plane, each set of points can be defined with reference
to the line. For example, points on the line are defined by the equation
of the line. Points on either side of the line can be described using the
inequalities notation(s) >, ≥ ,<, ≤
with reference to the equation of the line. As shown in the graphs below.
Note:
In both cases, the unwanted region (i.e. the region in which the inequality is not
satisfied) is shaded.
Also, on line x = 3 in graph. 4.4(a) are not wanted, so the line is ‘dotted’.
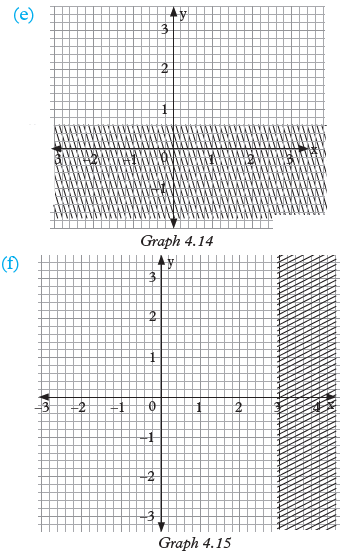
Graph 4.5 shows the region for which y ≥ –1.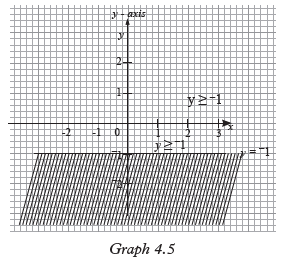
Note that the line y = –1 is continuous.
This means that the points on the line are included in the required region.To represent an inequality on a graph, we use the equation corresponding with
that inequality as the equation of the boundary line;
e.g. y > –1: Boundary line is y = –1.If points on the line are included in the required region, the line is continuous
(solid). If not, the line is dotted (broken). The normal convention is to shade the
unwanted region.4.2.2 Forming inequalities from given regions
Points to note
To form inequalities from a given graph of inequalities, we use a step by step
approach.Activity 4.4
Step 1:
(i) Identify the line that defines the given region (boundary line).
(ii) Step 2: Find the equation of the boundary line.
(iii) Step 3: Identify the wanted region (unshaded region) and from it pick
a point clearly not on the line.(iv) By substituting the coordinates in the equation in (iii) above you will
be able to identify the inequality t satisfies.
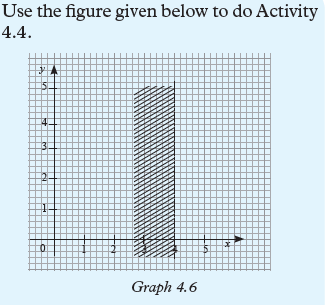
The respective lines in Fig. 4.6 divide the Cartesian plane into two regions.
• Line (a) passes through the point with coordinates (0, 3). The line has the
equation y = 3 and the points below the line are shaded. For all the points in
the unshaded region, y value is greater than 3. Therefore, the region satisfies
the inequality y ≥ 3. The points on the line are also included since the line is
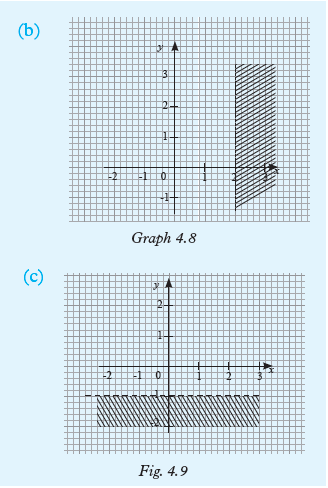
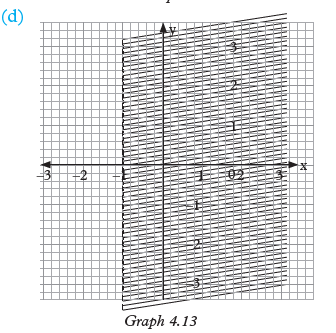
continuous.• Line (b) is not continuous and passes through the point (2, 0). The
required region is to the left of the line x = 2. Therefore, the required
region satisfies the inequality x < 2.• Line (c) is broken and passes through (0, –2). The equation of the line is y
= –2 and the required region is belowthe line. Therefore, the required region satisfies the inequality y < –2.
If the required region is defined by a vertical line, the inequality will be of the
form x ≤ k or x ≥ k where k is a constant and line is solid.If the line is horizontal, the inequality will be of the form; y ≥ c or y ≤ c where
c is a constant. If line is broken, then the inequality will be y > c or y < c.Exercise 4.3
Show each of the following regions on a Cartesian graph.
1. (a) x > 1 (b) x < 52. (a) x < –2 (b) x ≥ –1
3. (a) y ≤ 2 (b) y > 0
4. (a) y < 1/2 (b) y ≥ –1.5
5. 4x – x2 ≤ x(1 – x) + 18
6. Find the inequalities represented by the following unshaded regions Fig.4.7.

4.2.3 Simultaneous linearinequalities with one unknown
When regions are defined by two or more inequalities, those inequalities are referred
to as simultaneous inequalities.In Fig. 4.8, the unshaded region R lies between two inequalities. The two
boundary lines are x = –1 and x = 3. The region R satisfies both the inequalities
x < 3 and x ≥ –1 simultaneously.
∴ We can say –1 ≤ x and x < 3. In one statement, we write –1 ≤ x < 3.Exercise 4.4
By shading the unwanted regions, show the regions which satisfy the given inequalities
in questions 1 to 4.
1. (a) 3 < x < 4 (b) 1 < x ≤ 52. (a) –2 ≤ y < 2 (b) –1 ≤ y ≤ 1
3. (a) 2 – 1/3 x ≤ x ≤ 4
(b) 2x > 7 and 3x ≤ 18
4. y + 5 ≤ 4y < 2y + 14
5. Find the inequalities represented
by the following unshaded regions.Write your answer in a single
statement, that is a ≤ x ≤ b or a ≤ y ≤ y ≤ b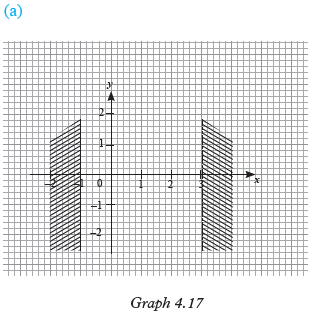
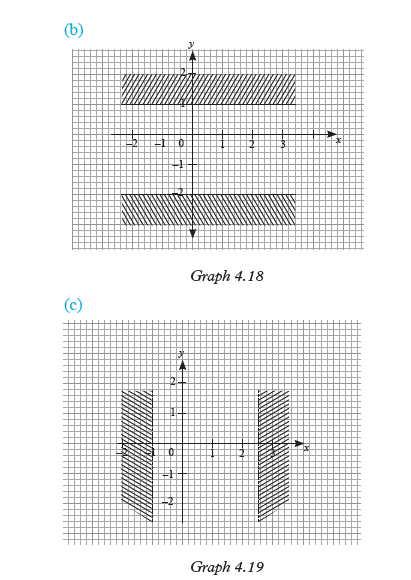

In (d) above, what is the name of the region represented by the inequalities?
In questions 6 to 8, show the regions
satisfied by the given inequalities:
6. –1 < 1/2x < 37. –1 ≤ 3x – 1 < 6
8. –2 < y < 4
4.2.4 Linear inequalities in twounknowns
We have dealt with inequalities of the form x ≤ a, x ≥ b, y ≥ c, etc. where a, b
and c are constants.In this section, we look at inequalities of the form ax + by ≤ c, ax + by ≥ d, etc.
where a, b, c and d are constants. Such an inequality is represented graphically by a
region containing all the ordered pairs of values (x , y) which satisfy that inequalityActivity 4.5
Using a graph paper, draw a line represented by the equation 2y = 3x + 6
1. Into how many regions does the line divide the Cartesian plane?
2. Identify one point (x, y) on one side of the line and substitute for x and
y in the given equation. What do you notice?
Describe the region containing the point using inequality notation.3. Do a similar substitution as in (2) above with a point from the other
side of the line. Comment on your answer.
Now repeat Activity 4.5 above using the equation x + y = 4.
Graph 4.21 shows the graph represented by the equation x + y = 4.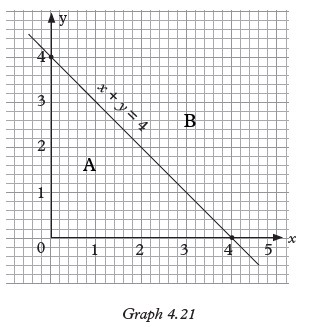
(a) The line x + y = 4 divides the plane into two regions A and B
(b) Using a point such as (2,1) substitute in the equation, x + y =4.
LHS = 2 + 1 = 3
Therefore (2, 1) satisfies x + y < 4
Thus x + y is less than 4. The point (2, 1) in region A satisfies the
inequality x + y < 4. But since the line is drawn solid, we can denote the
region as x + y ≤ 4. Similarly, points on the other side
satisfy the inequality x + y ≥ 4. Now consider the graph in graph 4.22.
The boundary line in graph 4.22 is
broken.
This means unshaded (required) region does not include points on the line in
order to define the required region, we use
coordinates of any point not on the line. For example use the point (1,1) substitute
for x and y in the equation x + 2y = 4 as follows: in the equation x + 2y = 4,
LHS: x + 2y = 1 + 2 × 1
= 1 + 2 = 3
R H S = 4The value on the LHS is less than the value on the RHS, thus, 3 < 4.
This means x + 2y < 4.
Therefore the unshaded region contains
the points that satisfies the inequality
x + 2y < 4.Note: If the boundary line does not pass
through the origin, it is more convenient and faster to determine the required
region using the origin.Exercise 4.5
Show the region which contain the set of points represented by each of the following
inequalities in questions 1 to 4.1. (a) x + y < 4 (b) y – x < 4
(c) 2x + 3y ≥ 6
2. (a) x – y ≤ 0 (b) 4x + 5y ≤ 10
(c) y + 3x > –6
3. (a) 3x < y + 6 (b) 1/2 x – 2y > 2
(c) y + 5/2 x ≤ –5
4. (a) x + y ≥ 3 (b) 4y – 3x > 0
(c) 5y – x < 15
4.2.5 Graphical solution of simultaneous linear inequalities
with two unknownsActivity 4.6
Using the same axis show the regions
(i) x + y > 3
(ii) 3x + 2y < 12
1. In each case, find the equation of the boundary line.
2. Draw the line, one at a time.
3. In each case show the required region by shading the unwanted
region.4. Denote the unshaded region with letter R.
When solving linear simultaneous equations, we look for values of the two
unknowns that make the two equations true at the same time. Similarly, linear
inequalities with two unknowns are solved to find a range of values of the two
unknowns which make the inequalities true at the same time. The solution is
represented graphically by a region. To identify the required region, we deal
with one inequality at a time to avoid confusion.5. What can you say about this region?
(i) Draw one line.
(ii) Identify the required region by shading the unwanted inequalities.
(iii) Repeat parts (ii) and (iii)for each of the given inequalities.
(iv) The unshaded region represents the set of the given inequalities.
Example 4.3 below illustrates the procedure of solving simultaneous
linear inequalities.Example 4.3
Draw the region which satisfies the following
inequalities simultaneously:
x > 0, y > 0, x + 2y ≤ 6
State the integral values of x and y that satisfy the inequalities.Solution
In Fig. 4.12, x + 2y = 6 (solid line),
x = 0 (broken line), y = 0 (broken line) are the boundary lines. All the ordered
pairs of values (x , y) that satisfy the three inequalities lie within the unshaded region.
Exercise 4.6
For questions 1 to 5, show the region defined by all inequlities in each question.1. x + y ≥ 0, x < 1, y > 1
2. 2x + 3y > 6, y > 0, x > 0
3. y – x < 0, x < 4, y ≥ 0
4. 3x + 5y > 15, 5x + 3y < 30, x > 0, y > 0
5. y ≥ 0, y < 4, 4x + 3y > 0, 5x + 2y < 15
6. On the same graph, represent the solution of the simultaneous
inequalities.
x <7, y < 5 and 8x + 6y ≥ 487. Use graphical method to solve the following inequalities simultaneously.
x ≥ 0, y ≥ 0, x + y ≤ 48. Draw on the same diagram to show the regions representing the following
inequalities.
5x + 4y < 60
3x – y > –6
8x + 3y ≥ 24
9. Find the points with integral coordinates which satisfy the
inequalities simultaneously
x ≤ 4, 3y ≤ x + 6 and 2x + 3y > 610. R is the region in a cartesian plane whose points satisfy the inequalities
0 ≤ x < 5, and 3 ≤ 3y + x < 9. Show R on the graph11. On the same graph show the region that is satisfied by the inequalities
x ≥ 0, y ≥ 0, x + y ≤ 12,
x + 2y ≤ 16 and y ≥ –4
3– x + 4
12. Use graphical method to solve simultaneously the inequalities
x ≥ 0, y ≥ 0 and x + y ≤ 413. A region R is given by the inequalities
x ≤ 6, y ≤ 6, x + y < 9 and 6x + 5y ≥ 30
Represent this region graphically and list all the points in the region which
have integral coordinates.4.2.6 Linear inequalities from inequality graphs
Activity 4.7
Consider the graph of line l in Graph4.24
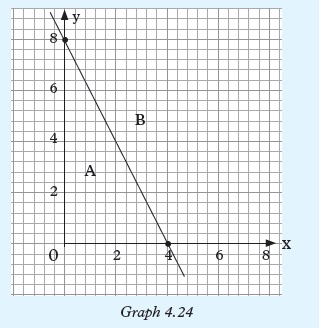
1. State the coordinates of at least five points on the line.
2. Use any two points to calculate the gradient of the line.
3. Find the equation of the line.
4. Describe the two regions A and B with reference to the line l.
Now consider graph 4.25.
Below, line L divides the Cartesian plane
into two regions, the shaded and the unshaded.
In order to form an inequality from a given graph, we must be able to identify the
line and find its equation first, and then proceed as per the following discussion:
(i) We find the equation of: line l that defines the region. For example, line
l passes through many points (x, y). Using points such as (1, 1), (2, 2)…,
we find gradient = 2 – 1/2 – 1 = 1
General equation of a line is given by
y = mx + c where m is the gradient and c is the y-intercept of the line. Thus
m = 1, c = 0. Therefore the equation of the line is y = x.(ii) Identify the required region. By convention, we shade the unwanted
region. Thus we are interested in the unshaded region i.e. finding
an inequality that describes the unshaded region.(iii) Identify a point (x, y) on the plane, in the unshaded region, which is clearly
not on the line i.e. (2, 3). Substitute the values of x and y in the
equation, one value at a time using equation y = x and point (2, 3), LHS = 3
RHS = 2
We see that the value on the LHS is greater
than that of the RHS i.e. 3 > 2.
This means that for all the points (x, y) in
the unshaded region, y > x.
Since the line is drawn solid, it means
points on the line should also be included
in the required region.
Therefore, the required region is described
by the inequality y ≥ x.Example 4.4
Write down the inequalities which are
satisfied by the unshaded region in graph 4.26.
Solution
Line L1 is the x-axis i.e. y = 0 (solid line)
Points required are on the line or above it.∴ the inequality is y ≥ 0
Line L2 is a solid line.
Let L2 be y = mx + c.
Since L2 intersects y-axis at y = 2 thus,
c = 2.
Point (2, 4) is on line L2 . Substituting it
in the equation of the line;y = mx + c becomes 4 = 2m + 2
⇒ m = 1∴ Equation of L2 is y = x + 2 or y – x = 2
Point (2, 2) is on the wanted region. To
know the inequality sign (i.e. < or >) we substitute(2, 2) in the equation. Thus
y = x + 2 becoms 2 = 2 + 2The result shows 2 < 2 + 2 thus, y < x + 2
Since L2 is a solid line, the inequality is
y ≤ x + 2 or y – x ≤ 2.
Equation of line L3: y = mx + c
L3 cuts the y – axis at y = 6, thus , c = 6.
Also, point (10, 0) is on line L3.
Exercise 4.7
1. Write down the inequalities satisfied by the region in graph. 4.27.

2. Write down the inequalities satisfied by the unshaded region R in Graph.
4.28.
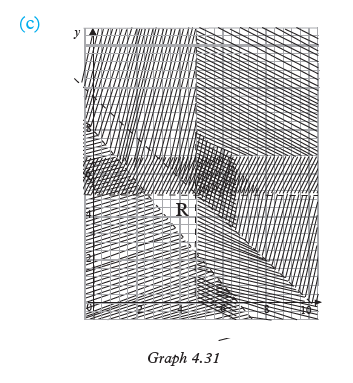
3. Use Graphs 4.29, 4.30 and 4.31 to find the equations of the boundary lines and
hence find the inequalities that satisfy the unshaded regions.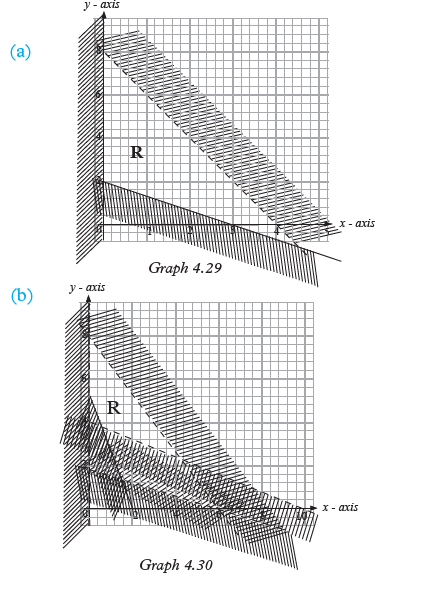
Unit Summary
• To solve simultaneous equations graphically, we draw graphs of lines,
representing the equations. If the equations have a unique solution, the
lines will intersect at a point whose coordinates represent the solution
set. If equations have no solutions, the lines will be parallel. If the equations
have an infinite solutions set, the lines will be coincident. This means
that any value of the variable you substitute will satisfy the equations.• When forming simultaneous equations from a given situation, we begin by
defining the variables we intend to use, then relate the two variables using
the given information and solve the equations as recommended.• Unlike in equations which have unique solutions, inequalities have a region
for the solution set. The solutions may have closed or an open region.
Remember:-
The unshaded region R satisfies the inequality 3y + 4x ≥. This is
the example of an open region.
The unshaded region R satisfies the
inequalities y ≤ 3, x ≤ 3 and x + y ≥ 3. R is an example of a closed
region.Remember:
• A line divides the Cartesian plane or any other plane into 2 regions.• If also divides a plane into 3 sets of points i.e points on the line,
and points on either side of the line each of which is defined by inequality rule.Remember the meaning of expressions such as
x<a, x≤a, y>b, y≥b, ax + by <c or x > c with reference to regions in
inequalities.• Inequalities can be formed from given:
(i) inequality graphs
(ii) situations.
Forming inequalities from graph:
(i) Identify the boundary line.
(ii) Find the equation of the line.
(iii) Using a point not on the line
substitute the coordinates of the
chosen point in the equation in order to determine the
required region. Remember that by convention, we shade
the unwanted region in order to leave the wanted region clean.Unit 4 Test
1. Find the solution of each of the equations, graphs represented in the
following graphs.
2. For which simultaneous equations is the ordered pair (3, –2) a solution?
(a) x + y = 1 (b) 2x + y = 4
x – y = 5 2y – x = -6(c) 3x = 5 – 2y
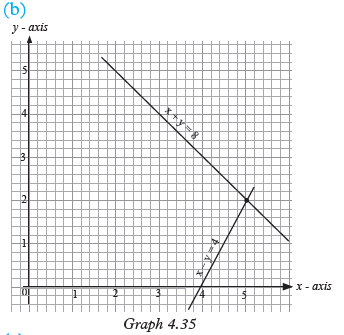
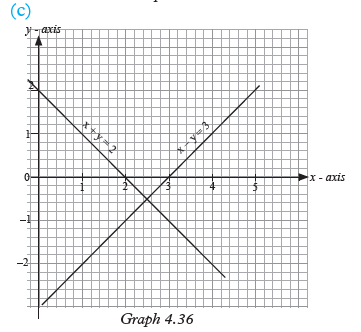
x + y = 13. Draw the graphs of x + 2y = 8 and x – 2y = –4 on the same axes. Use
your graph to find the solution of the simultaneous equations x + 2y = 8 and
x – 2y = –4.4. Use graphical method to solve the following equations.
(a) x +2y = 15 (b) 2x = y – 5
2x – y = 0 y = x – 35. The sum of James’ and David’s ages is 34 years. Five years ago, the sum
of twice James’ age and three times David's age was 86 years. Using an
appropriate variable for each age, form a pair of simultaneous equations and
solve them to find the respective ages of the two boys.6. Dan bought 5 boxes of sweets and 3 bags of candies for 1 205 FRW. If the
cost of boxes and bags were reversed, the cost would have been 1 107 FRW.
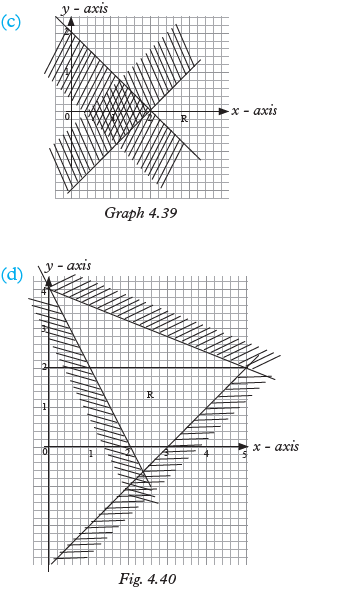
Find the cost of 1 box of sweets and 1 bag of candies.7. For each graph below write the inequalities that satisfy the unshaded
region marked R.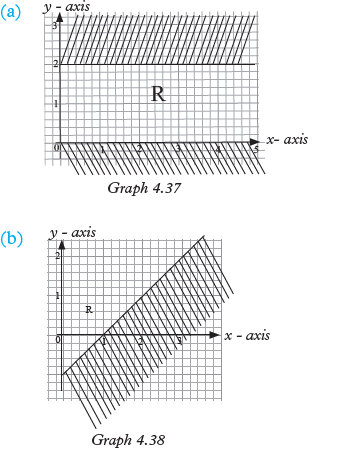
8. (a) Draw the region given by the inequalities x > 0,
5x + 4y < 32, x +2y>10.(b) State the coordinates of the vertices of the region in (a).
Table of contents
- Lesson 1:Solving Quadratic Equation Using Factorisation Method
- S3 : Matematics SB
- S3: Mathematics TB
- video on introduction on set
- Assessment : Review of union, intersection and complement of sets
- Assessment : Representation of problems using a Venn diagram
- Assessment : Simplification of fractions
- Assessment : Operations on algebraic fractions
- Assessment : Solving rational equations
- Assessment : Simultaneous linear equations
- Assessment : Solving quadratic equations
- Assessment : Problems involving quadratic equations
- Assessment : Linear functions
- Assessment : Quadratic functions
- Assessment : Reverse percentages and compound interest
- Assessment : Review of Pythagoras theorem
- Assessment : Introduction to trigonometry
- Assessment : Trigonometric ratios
- Assessment : Elements of a circle and disk
- Assessment : Circle theorem
- Assessment : Similarity
- Assessment : Enlargement
- Assessment : Composite translations in two dimensions
- Assessment : Composite reflections in two dimensions
- Assessment : Composite rotations in two dimensions
- Assessment : Representing bivariate data using scatter diagrams
- Assessment : Correlation
- ASSESSMENT