Topic outline
Unit 1: PROBLEMS ON SETS
Key unit competence: By the end of this
unit, the learner should be able to solve problems involving sets.
Unit outline
• Analysis and interpretation of problems using sets.• Representation of a problem using a Venn diagram.
Introduction
Unit focus Activity
Use your knowledge on sets to solve the following problem.
"For planning purposes, a Physical Education (P.E) teacher asked a Senior
3 class of 24 students to vote by raising of hands for the ball games they liked playing from among football, volleyball and basketball. After the voting, he
observed that each of the 24 students liked at least one game. 1 student liked all the three games. 2 students liked volleyball and basketball but not football. 2 students liked volleyball
and football but not basketball. In summary, he noted that 6 students liked
volleyball, 12 liked basketball and 15 liked football’’.The teacher went back to the staffroom and realised that he had not established
the number of students who liked football and basketball but not volleyball.
He has called you to help him determine that number using your knowledge, to avoid calling the whole class to vote again. Kindly, determine the number and give to the teacher.The knowledge of operations on set is very useful in solving some complex real life
problems that are not easy to solve through other analytical methods. In Senior 1 and
Senior 2, we learned some basic concepts and operations on sets. In this unit, we will
practice the application of those concepts and extend them to solve slightly more
challenging problems.1.1 Review of union, intersectionand complement of sets
Activity 1.11. Remind your partners what a set is.
2. Given that A = {East African
community countries}B = {countries bordering Rwanda}
C = {countries which share Lake
Victoria}:(a) With the aid of a map or an
atlas, list the members of:(i) Set A (ii) Set B
(iii) Set C
(b) Find: (i) n(A) (ii) n(B)
(iii) n(C)
(c) Find: (i) (A∩B) (ii) (A∩C)
(iii) (A∪B∪C)
(iv) (A∪B∩C)
3. Given that ε = {1, 2, 3, 4, 5, 6};
A = {2, 3, 5}; B = {3, 4, 5}, list the
members of:(i) A' (ii) B'
(iii) A'∩B (iv) A'∪B'
(v) (A∩B)' (vi) A'∩B'
The set of common elements which appear in two or more sets is called the
intersection of the sets. The symbol used to denote intersection of sets is ∩.
Intersection of sets is also represented by “and” in word statement. For example,
“sets A and B” means A∩B.
When the elements of two or more sets areput together to form a set, the set formed
is known as union of sets. The symbol forthe union of sets is ∪.
Union of sets is also represented by “or” in word statement. For example, “Sets A
or B” means A∪B that is the union of sets A and B.
Complement of a set is the set of all elements in the universal set that are not
members of a given set. The complement of set A is denoted by A'. A universal set contains all the subsets under consideration. It is denoted by the symbol ε.Example 1.1
Given the following sets A = {a, b, c, d, e, f}
and B = {a, b, c, h, i,} find:
(i) (A∩B) (ii) (A∪B)Solution
(i) (A∩B) = {a, b, c}
(ii) A∪B = {a, b, c, d, e, f} ∪ {a, b, c, h, i,}
= {a, b, c, d, e, f, h, i}Example 1.2
Given A = {1, 2, 3, 4, 5}, B = {2, 4, 6} and
C = {1, 3, 5, 7, 9}, answer the questions
below about the sets A, B and C.(a) List the set A ∩ B.
(b) Write down n(A).
(c) List the set A ∪ B.
(d) List the set A ∪ B ∪ C.
Solution
(a) A∩B={2,4}
(b) n(A)= 5
(c) A ∪ B = {1, 2, 3, 4, 5, 6}
(d) A ∪ B ∪ C = {1,2,3,4,5,6,7,9}
Exercise 1.1
1. If A = {2, 4, 6, 8}, B = {1, 2, 3},
C = {6, 8, 10 } and D = {2, 3, 6}find:
(a) n(A) (b) n (B) (c) n (C)(d) n (A) + n (B)
(e) n (A) + n (C) – n (B)
(f) A∪B∪C
(g) n(A∪B∪C)
n(A∪C∪D)
2. Find the union of the following sets:
A = {positive even numbers from 0 to 20}
B ={Integers greater than -2 but less than 9}
C = {Prime numbers between 1 and 7}
3. If P ={counting numbers from 1 to 15}
and Q ={Even numbers from 2 to14},find: (i) (P∪Q)' (ii) (P∩Q)'
(iii) ε (iv) n(ε)4. Given that A = {3, 5}, B = {7, 9, 11,13},
C = {3, 5, 7} and ε = {3, 5, 7, 9,11, 13},
find:
(i) A' (ii) (A∩B)' (iii) B'(iv) (A∪B) (v) (A∩C)'
(vi) (B∩C)'
1.2 Representation of problems using a Venn diagram
1.2.1 Venn diagrams involving two sets
Activity 1.2
A survey was carried out in a shop to find the number of customers who bought bread or milk or both or neither. Out of a total of 79 customers for the
day, 52 bought milk, 32 bought bread and 15 bought neither.(a) Without using a Venn diagram, find
the number of customers who:
(i) bought bread and milk
(ii) bought bread only
(iii) bought milk only
(b) With the aid of a Venn diagram,
work out questions (i), (ii) and (iii)in (a) above.
(c) Which of the methods in (a) and(b) above is easier to work with?
Give reasons for your answer.From the activity above, we clearly see that a Venn diagram plays a very important role
in analysing the set problem and helps in solving the problem very easily.
First, express the data in terms of set notations and then fill the data in the Venn
diagram for easy solution. Some important facts like “intersection”,
“union” and “complement” should be well considered and represented when drawing
Venn diagrams. Consider two intersecting sets A and B
such that A = {a, b, c, d, e, f} and
B = {a, b, c, d, g, i, j, k, l}.
We represent the two sets in a set diagram asshown in Fig 1.1 below.

The union of sets A and B is given by the number of elements.
n (A ∪ B) = n(A) + n(B) - n(A ∩ B)
In the Venn diagram in Fig 1.1,
n(A) = 6, n(B) = 9 and n(A ∩ B)=4
⇒ n(A∪B)= 6 + 9 - 4 = 11Example 1.3
Fig. 1.2 shows the marks out of 15 scored
by a number of Senior 3 students in groups
C and D.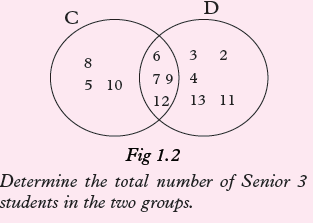
Solution
n(C∪D) = n(C) + n(D) - n(C∩D)
= 7 + 9 - 4
= 16 - 4
= 12Example 1.4
A survey involving 120 people about their
preferred breakfast showed that;55 drink milk at breakfast,
40 drink juice at breakfast and 25 drink both milk and juice at breakfast.(a) Represent the information on a Venn diagram.
(b) Calculate the following:
(i) Number of people who take milk only.
(ii) Number of people who take neither milk nor juice.
Solution
(a) Let A be the set of those who drinkmilk and B be the set of those
who drink juice, x be the numberof those who drink milk only,
y be the number of those who drink juice only and z represents number of
those who did not take any.
By expressing data in set notation;
n(A) = 55, n(B) = 40, n(A∩B′) = x,
n(A∩B) = 25, n(A′∩B)= y.
n(ε) = 120.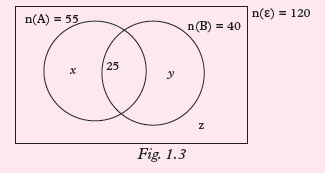
(b) (i) We are required to find the number of
those who take milk only.
x = 55 – 25 = 30
So, 30 people take milk only.(ii) To find the value of z;
30 + 25 + 15 + z = 120.
z = 120 – (30+ 15 + 25).
z = 120 – 70 ⇒ z = 50.
So, 50 people take neither eggs nor juice
for breakfast.Example 1.5
In a class of 20 pupils, 12 take Art (A) and
10 take Chemistry (C). The number that
take none is half the number that take both.(a) Represent the information on a Venn
diagram.(b) Use the Venn diagram to determine the
number that take:
(i) Both (ii) NoneSolution
We first extract the data and represent it in set notation.
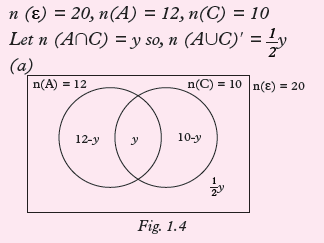
(b) By solving for the value of y;
12 – y + y + 10 – y + 1/2y = 20So, 22 – 1/2y = 20
Collecting like terms together,
we get, – 1/2y = 20 – 22
– 1/2y = –2
–y = –4y = 4
(i) Those who take both are equal to
4.
(ii) Those who take none
= 1/2 × 4 = 2Exercise 1.2
1. In a certain group of children, all of them study French or German or
both languages. 15 study French but
not Germany, 12 study German of
whom 5 study both languages.(a) Draw a Venn diagram to show
this information.(b) Calculate how many children are
there in the group.2. In a class of 30 students, students are required to take part in at least
one sport chosen from football and volleyball. 18 play volleyball, 22 play
football. Some play the two sports.(a) Draw a Venn diagram to show this information.
(b) Use your diagram to help
determine the number of students who play the two sports.3. In a group of 17 pupils, 10 offer Economics and 9 offer Mathematics.
The number that offer both Economics and Mathematics is twice the number
that offer none of the two subjects.(a) Draw a Venn diagram to represent
the information.(b) Calculate the number of pupils
that;
(i) Offer both subjects(ii) Offer only one subject
(iii) Offer none of the subjects.
4. Of 35 students in a class, 26 play football, 20 play volleyball and 17
play both games.(a) Represent the information on a Venn diagram.
(b) Calculate the number of students
who play neither of the games.5. In a school of 232 students, 70 are members of Anti-AIDS club, 30 are
members of debating club and 142 do not belong to any of the mentioned
clubs.
(a) Represent the information on the Venn diagram.(b) Use the Venn diagram to calculate
the number of students who belong to debating club only.DID YOU KNOW?
Being a member of Anti-AIDS club can help you to learn many methods
of keeping yourself safe and free from HIV-AIDS. Being a member
of debating club can also help you to become a good public speaker.6. The pupils of senior three class were asked about the sports they play. 17 of
them play football. 14 play tennis. 5 of them play both football and tennis.
There are 30 pupils in the class.(a) Draw a Venn diagram to show this information.
(b) How many play football but not tennis?
(c) How many play neither football nor tennis?
7. For the two events A and B,
we aregiven that, n(A∩B) = 5, n(A) = 11, n(A∪B) = 12 and n(B' ) = 8.
(a) Copy and complete the Venn diagram below.

b) Find:
(i) n(A∩B)′(ii) n(A′)
8. A group of 50 married men were asked if they gave their wives
flowers or chocolates on Valentine’s Day. Results revealed that 31 gave
chocolates, 12 gave flowers and 5 gave both flowers and chocolates.(a) Represent the information on aVenn diagram.
(b) Find the number of men who;
(i) Gave flowers only.
(ii) Gave Chocolates only.
(iii) Gave neither flowers norchocolates.
1.2.2 Venn diagrams involving three
setsActivity 1.3
A survey was done on 50 people about which food they like among rice, sweet
potatoes and posho. It was found out that 15 people like rice, 30 people like
sweet potatoes, 19 people like posho. 8 people like rice and sweet potatoes,
12 rice and posho, 7 people like Sweet potatoes and posho. 5 people like all the
three types of food.(a) Extract the data and represent it in set notation.
(b) Without using a Venn diagram;
(i) Find the number of people who like none of the foods.
(ii) Find the number of those who like posho and rice only.
(iii) Find the number of those who like sweet potatoes and rice only.
(c) With the help of a Venn diagram
find out the solutions for (b) (i), (ii) and (iii) above.
(d) Was it easy to do (b) (i), (ii) and
(iii) without a Venn diagram?
From the above activity, it is clearly seen that without a Venn diagram, the problems
involving three or more sets become complicated to handle.
A Venn diagram makes the problem easier because we can represent the data
extracted in each region and then calculate the values required.
Consider the venn diagram shown in Fig. 1.6
showing the numbers of students who take the foreign languages German (G),
Spanish(S) and French(F) in a college.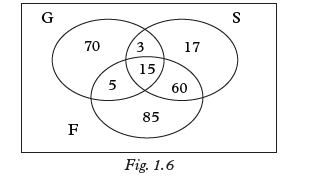
The total number of students taking languages is given by the union of the three
sets as shown by the following formulan(G∪S∪F) = n(G) + n(S) + n(F)
- {n(G∩S) + n(G∩F)+(S∩F)+n(G∩S∩F)}From the Venn diagram in Fig 1.6,
n(G∪S∪F) = 93 + 95 + 165
- (18 + 20 + 20 + 75) + 15
= 353 - 113 + 15
= 255Example 1.6
The students in Senior 3 class did a survey on their names regarding whether they
contained the letters B, C and D. The following Venn diagram shows the results of
the survey in terms of the number of names in each category: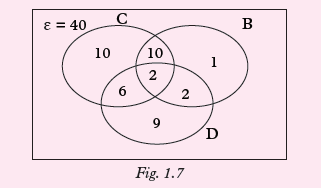
Use the Venn diagram to determine the
number student's names that contained in;(a) All the three letters
(b) Letter D
(c) Letters B and D but not C
(d) Only two of the letters
(e) The total number of students
Solution
(a) All the three letters
n(B∩C∩D) = 2
(b) n(D)= 9 + 6 +2 +2 =19(c) Letters B and D but not C
n(B∩D)-n(B∩C∩D)= 4 -2 = 2(d) Only two of the letters
= 6 +10 + 2 =18(e) The total number of students
n(B∪C∪D)= n(B) + n(C) + (C)
-{n(B∩C) + n(B∩D)+n(C∩D)} +n(B∩C∩D)
= 15 + 28 + 19 -{12 + 4 + 8} + 2
= 62 - 24 + 2
= 40 StudentsExample 1.7
A group of 40 tourists arrived in Rwanda and visited Akagera National park
(A), Nyungwe forests (N) and Virunga mountains (V). Results showed that 33
visited Akagera, 21 visited Nyungwe and
23 visited Virunga. 18 visited both Akagera and Nyungwe, 10 visited both Nyungwe and
Virunga, and 17 visited both Akagera and Virunga. All tourists visited at least one of
the places.
(a) Represent the information on a Venn diagram.(b) Find the number of tourists that visited:
(i) Akagera only.
(ii) Did not visit Nyungwe.
Solution
n(ɛ) = 40.
n(A) = 33, n(N) = 21, n(V) = 23.
n(A∩N) = 18, n(N∩V) = 10,
n(A∩V) = 17.
Let n(A∩N∩V) = y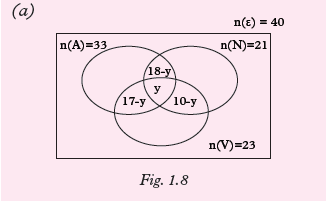
n(A) only = n(A∩N′∩V′).
n(A∩N′∩V′) = 33 – (18 – y + y + 17 – y).
n(A∩N′∩V′) = 33 – 35 + y = y – 2.
n(A∩N′∩V′) = y – 2.
n(N) only = n(A′∩N∩V′).
n(A′∩N∩V′) = 21 –(18 – y + y + 10 – y).
n(A′∩N∩V′) = 21 – 28 + y= –7 + y.
n(A′∩N∩V′) = y – 7.
n(V) only = n(A′∩N′∩V).
n(A′∩N′∩V) = 23 – (17 – y + y + 10 – y).
n(A′∩N′∩V) = 23 – 27 + y.
n(A′∩N′∩V) = y – 4.
The Venn diagram in Fig. 1.9 shows the
data in specific regions.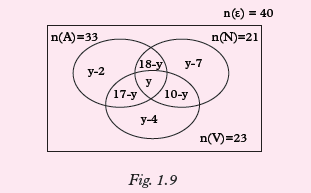
y – 2 + 18 – y + y- 7 + 17– y + y + 10 - y + y – 4 = 40
y + 32 = 40.
y = 8.(b) (i) Those who visited Akagera only
are y – 2 = 8 – 2 = 6.(ii) Those who did not visit Nyungwe
are y – 4 + 17 – y + y – 2
= 8 – 4 +17 – 8 + 8 – 2
= 19
Example 1.8The Venn diagram below shows the allocation of the members of the Board
of Directors of a school in three different committees;Academic (A), Production (P) and Finance (F).
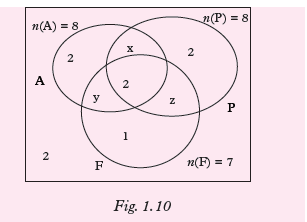
(a) Determine the values of x, y and z.
(b) What is the total number of members
in the Board of Directors?(c) Find the number of those who are not
members of the academic committee.(d) How many belong to at least two committees?
Solution
(a) For Academic,
2 + x + 2 + y = 8.
x + y = 8 - 4.
x + y = 4........(i)
For Production,
2 + x + 2 + z = 8.
x + z = 8 – 4.
x + z = 4................(ii)
For Finance,1+ y + 2 + z = 7.
y + z = 7 – 3.
y + z = 4..............(iii)
Make x the subject in equation (i)
x = 4 — y........(iv)
Substitute equation (iv) into (ii)
4 – y + z = 4.
–y + z = 0........(v)
Solving (iii) and (v) simultaneously
y + z = 4
+ – y + z = 02z = 4 ⇒ z = 2
So, y = 4 - z = 4 - 2 = 2
∴ y = 2.
x + y = 4 and so x = 4 – y = 4 – 2 = 2.
∴ x = 2.(b) Total number of members are
2 + 2 + 2 + 2 + 2 + 2 + 1 + 2 = 15
(c) Those who are not members of academic
committee are: 2 + 1 + z + 2
= 2 + 1 + 2 + 2 = 7
(d) Those who belong to atleast two
committees are: y + 2 + x + z
= 2 + 2 + 2 + 2 = 8Exercise 1.3
1. In a class of 53 students, 30 study
Chemistry, 20 study Physics, 15 study Mathematics. 6 study both
Chemistry and Physics, 4 study both mathematics and Chemistry, 5 study
both Physics and Mathematics. All
the students study at least one of thesubjects.
(a) Represent the information on a Venn diagram.(b) Find the number of students
who study all the three subjects.(c) How many study;
(i) Physics only.
(ii) Physics but not Mathematics
(iii) Two subjects only.
2. Out of 100 students in a school, 42 take English, 35 take Kiswahili and
30 take French. 20 take none of the subjects, 9 take French and English,
10 take French and Kiswahili, 11 take English and Kiswahili.(a) Represent the information on a Venn diagram.
(b) Find the number of students who
take three subjects.
(c) Find the number of students who
take English only.
(d) Find the number of students who
take Kiswahili and French.
3. A school has a teaching staff
of 22 teachers. 8 of them teach
Mathematics, 7 teach Physics and
4 teach Chemistry. 3 teach both
Mathematics and Physics, none
teaches Mathematics and Chemistry.
No teacher teaches all the three
subjects. The number of teachers
who teach Physics and Chemistry is
equal to the number of teachers who
teach Chemistry but not Physics.
(a) Represent the data on a Venn
diagram.
(b) Find the number of teachers who
teach;(i) Mathematics only.
(ii) Physics only.
(iii) None of the three subjects.
4. In a class of 60 students, 15 are members of debating club (D), 30
are members of never again club (A) and 20 are members of Science club
(S). 3 are members of debating and never again only. 4 are members of
never again and science club only while 1 is a member of debating and
science club only. 7 students do not belong to any of the clubs.(a) Represent the data on the Venndiagram.
(b) Find the number of students that belong to;
(i) Only one club.
(ii) Atleast two clubs.
(iii) Do not belong to debatingclub.
5. In a class of 45 students, 7 like Mathematics (M) only, 2 like Physics
(P) only, and 3 like Chemistry (C) only. 18 like Mathematics and Physics,
16 like Physics and Chemistry, 14 like Mathematics and Chemistry. The
number of students who like none of the three subjects is half the number
of those who like all the three subjects.(a) Show the above information in a Venn diagram.
(b) Determine the number of students who;
(i) Like none of the three subjects.
(ii) Who do not likeMathematics.
6. A survey involving 50 people was done to find out which religious
events they attend among Catholics,Protestants, and Muslim. It was
found out that 15 people attend Catholic event, 30 people attend
Protestant event, 19 people attend Muslim event. 8 people attend both
Catholic and protestant events, 12 people attend both Catholics and
Muslim events, 7 people attend both Protestant and Muslim events. 5
people attend all the three categories of religious events.(a) Represent the information onthe Venn diagram.
(b) (i) How many people attendCatholic event only?
(ii) How many attend Catholicand Protestant events, but
not at Muslim event?(iii) How many people do notattend any of these religious
events?BEWARE!!!
Religious differences should not cause divisionism. We should all
learn to value one another to stay together as peaceful Rwandans.Unit Summary
• A set - is a well-defined collection of distinct objects, considered as an object in its own right.
For example, the numbers 2, 4, and 6 are distinct objects when considered
separately, but when they are considered collectively, they form a
single set of size three, written {2, 4, 6}.• Union of a set: In set theory, theunion (denoted by ∪) of a collection
of sets is the set of all elements in the collection. It is one of the fundamental
operations through which sets can be combined and related to each other.
For example if A = {1, 2, 3, 4, 5} and
B = {4, 5, 6, 7, 8, 9}, then we have a
union set for A and B as:
A∪B = {1, 2, 3, 4, 5, 6, 7, 8, 9}• Intersection of sets: In mathematics, the intersection A∩B of two sets
A and B is the set that contains all elements of A that also belong to B
(or equivalently, all elements of B that also belong to A), but no other
elements. For three sets A, B and C,
we write A∩B∩C.
For example, if A = {1, 2, 3, 4, 5} and
B = {4, 5, 6, 7, 8, 9}, then we have an intersection set for A and B as
A∩B = {4, 5}• Compliment of a set. In set theory, the complement of a set A refers
to elements not in A. The relative complement of A with respect to a set
B, also termed the difference of sets A and B, written as B \ A, is the set of
elements in B but not in A. For example, consider universal set
U = {1, 2, 3, 4, 5, 6, 7}, and we will define our subset as A = {1, 3, 4}.
The complement of A is the set of all the elements in U that are not in A.
Therefore, the complement of A is
{2, 5, 6, 7}.• A Venn diagram. It is a diagram representing mathematical or logical
sets pictorially as circles or closed curves within an enclosing rectangle
(the universal set), common elements of the sets being represented by
intersections of the circles.Unit 1 Test
1. The following facts were discovered in a survey of course preferences of
110 pupils in senior six: 21 like engineering only, 63 like engineering,
55 like medicine and 34 like none of the two courses.(a) Draw a Venn diagram representing this information.
(b) (i) How many like Engineering or Medicine?
(ii) How many like Engineering and Medicine?
(iii) How many like only Medicine?
2. A survey was carried out in a shop to find out the number of customers
who bought bread or milk or both or neither. Out of a total of 79 customers
for the day, 52 bought milk, 32 bought bread and 15 bought neither.(a) Draw a Venn diagram to show this information and use it to
find out:(b) (i) How many bought bread and milk.
(ii) How many bought breadonly.
(iii) How many bought milk only.
3. Five members of Mathematics club
conducted a survey among 150 students of Senior 3 about which
careers they wish to join among Engineering and Medical related
courses. 83 want to join Engineering, 58 want to join medical related
courses. 36 do not want to join any of the careers.
Represent the data on the Venn diagram. Find the number of students
who wish to join both careers.4. A survey was done on 50 people about
which hotels they eat from among H, S and L. 15 people eat at hotel H, 30
people eat at hotel S, 19 people eat at hotel L, 8 people eat at hotels H and
S, 12 people eat at hotels H and L, 7 people eat at hotels S and L. 5 people
eat at hotels H, S and L.
(a) How many people eat only at Hotel H?(b) How many people eat at hotels H and S, but not at L?
(c) How many people don’t eat at any of these three hotels?
5. A survey involving 50 students was
carried out and research revealed that 21 of them like Kiswahili (K)
while 32 of them like Mathematics(M).(a) Represent the information inthe Venn diagram.
(b) How many students like only one subject?
6. A group of 50 people were asked about the sections they read very
keenly in a newspaper among politics, advertisements and
sports. The results showed that 25 read politics, 16 read advertisement,
14 read sports. 5 read both politics and advertisement, 4 read both
advertisement and sports, 6 read both politics and sports, and 2 read all the three sections.(a) Represent the data on the Venn diagram.
(b) Find the number of people who read;
(i) At least one of the three sections.
(ii) Only one of the three sections.
(iii) Only politics.
7. Given that, n(A∪B) = 29, n(A) = 21,
n(B) = 17, n(A∩B) = x.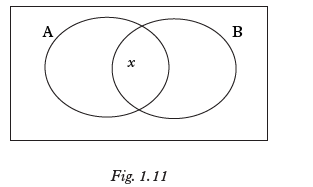
(a) Write down in terms of the elements of each part.
(b) Form an equation and hence find the value of x.
8. In a school, each student takes atleast one of these subjects; Mathematics,
Physics and Chemistry. In a group of 60 students, 7 take all the subjects,
9 take Physics and Chemistry only, 8 take Physics and Mathematics, 5 take
Mathematics and Chemistry only. 11 students take Mathematics only,
2 take Physics only and 15 students take Chemistry only.(a) Draw a Venn diagram for the information above.
(b) Find the number of those who do not take any of the subjects.
(c) Find the number of students who take Mathematics.
URLs: 2Files: 3Quizzes: 23Unit 2 :NUMBER BASES
Key unit competence
By the end of this unit, the learner should be able to present number bases
and solve related problems.Unit Outline
• Definition of number bases.
• Change of base.
• Operations using bases (addition,
subtraction, division and
multiplication)
• Special bases (binary and
duodecimal systems)
• Solving equations involving different bases.Introduction
Unit Focus Activity
In everyday life, we count or estimate quantities using groups of ten items or
units. This may be so because, naturally, we have ten fingers. For example, when
we count ten, i.e. we write 10 meaning one group of 10 and no units. A quantity
like twenty five, written as 25 means 2 groups of 10 and 5 units
Suppose instead we had say 6 fingers(i) How, in your opinion would we do our counting?
(ii) If we had eight fingers, how would we count?
(iii) Demonstrate symbolically how counting in groups of 3, 4, 5, 6, 7…
can be done.(iv) Do you think we could also do operations such as addition,
subtraction, multiplication and division using such groups? If your
answer is yes, demonstrate this with simple examples.
In this unit, we will learn a number of different numeration systems including
the decimal (base ten) system that we are all familiar with. We will also learn how
to convert between different numeration (counting) systems.2.1 Numbers and numerals
Activity 2.1
Use a dictionary or internet to define:
(i) Number(ii) Numeral
(iii) Digit
In mathematical numeral systems, we use basic terms such as number,
numeral and digit. In order to deal with number bases, we must be able
to distinguish between the three terms.A number is an idea, a numeral is the
symbol that represents the number. The number system that we use today is a
place value system. A unique feature of this system is that the value of any of the
digits in a number depends on its position. For example the number 7 707 contains
three sevens, and each of them has a particular value as shown in table 2.1.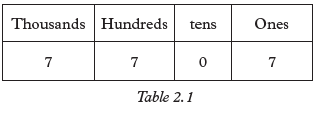
The 1st seven from the right represents
7 ones or units. The 2nd seven stands for 100s or 102 and the 3rd seven stands for
1 000s or 103.The zero holds the place for the tens (10s) without which, the number would be 777
which is completely different from 7 707.A digit is any numeral from 0 to 9. Anumeral is made of one or more digits.
For example, number one hundred and thirty five is represented by the numeral
135 which has three digits 1, 3 and 5. The number 7 707 contains four digits,
each of which has a specific value depending on its place value.The abacus
Activity 2.2
1. Use a Mathematics dictionary or internet, to describe an abacus.
2. Describe how the abacus is used to count in base ten.
One device that has been used over time to
study the counting in different numeration
systems is the abacus.
An abacus is a calculating device consisting of beads or balls strung on wires or rods
set in a frame. Fig. 2.1, shows a typical abacus on which the place value concept
can be developed very effectively.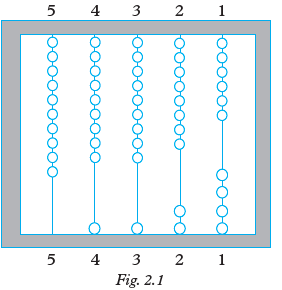
On each wire, there are ten beads. Let us
consider the beads at the bottom of the
wire. Beginning from the right:10 beads on wire 1 can be represented by
1 bead on wire 2. Similarly, 10 beads on
wire 2 can be represented by 1 bead on
wire 3 and so on.This means:
1 bead in wire 1 represents a single bead.
1 bead in wire 2 represents 10 beads.
1 bead in wire 3 represents
(10 × 10) beads.
1 bead in wire 4 represents
(10 × 10 × 10) beads.
So, the number shown in Fig. 2.1 is 1 124.
If we had x beads in each wire such that
x < 10, it would mean that:In wire 1 we had x beads
In wire 2 we had 10x beads
In wire 3 we had 102x beads
In wire 4 we had 103x beads and so on.
The place values from right to left are
100 101 102 103 104 ...
Ones 10s 100s 1 000s 10 000s etc2.2 Number bases
2.2.1 Definition of number bases
Activity 2.3
1. Use a dictionary or internet to find
the meaning of number bases.2. Give some examples of numberbases.
Why do you think we count in groups of
ten?If we had 6 fingers, most probably we
would count using groups of 6, if 8 fingers,groups of 8 and so on. In the system that
we use, every ten items make one basic group which is represented in the next
place value column to the left as shown
in Fig. 2.2 below.
(a) The 1 bead in wire B represents 10 beads in wire A i.e. it represents a
group of 10 beads.(b) The 1 bead in wire D represents 6
beads in wire C, thus making a groupof 6 beads.Counting in different groups of numbers
such as 10, 6, 5, 8 etc means using
different number systems. We call them
base ten, base six, base five, base eight
respectively etc.
Now consider Fig. 2.3.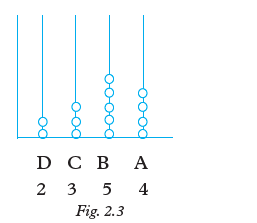
Counting in base six, what numbers do
the beads on each wire represent?
(i) There are 4 beads in wire A. This
represents 4 ones.(ii) There are 5 beads in wire B. This
means 5 groups of 6 beads each.
i.e. 5 × 6 = 30 beads written as 50six
.
(iii) There are 3 beads in wire C. This
means 3 groups of six sixes i.e.
3 × 6 × 6 = 108 beads, written as
300six
.
(iv) There are 2 beads in wire D. This
means 2 groups of six six sixes ie
6 × 6 × 6 = 216 × 2 = 432
written as 2 000six
.
The whole number represented in Fig. 2.3
is 4six + 50six + 300 six + 2 000 six = 2 354six
The answer 2 354 six is read as; two three
five four base six. The number 2 354six has
a value of 575ten.Example 2.1
Given that the number represented in
Fig. 2.4 is in base six, find the number in
base 10.
Solution
Column A represents 3 ones.
Column B represents 5 sixes.
Column C represents 2 six sixes.
the number = ( 3 × 60) + (5 × 6) +(2 × 62)
= 3 + 30 + 72
= 105ten
253six = 105ten
Note that 253six and 105ten are two different
symbols for the same number.2.2.2 Change of base
(a) Changing from base 10 to any
other baseActivity 2.4
Consider the number 725 given in
base ten.
1. Divide 725 by 8 and write down
the remainder.2. Divide the quotient obtained in (1) above and write down the
remainder.3. Repeat this process of division by 8 until the quotient is less than
8 which you should treat as a remainder and write it down.4. Write down the number made by the successive remainders
beginning with the first one on the right going left.5. Describe the number in part (4) above in terms of a base
In this activity, you have just converted 72510 to a number in base 8.
In converting
any number from base ten to any other base, we use successive division of the
number by the required base. The new number is obtained by writing down
the remainders beginning with the
first remainder on the right to the last
remainder on the left.
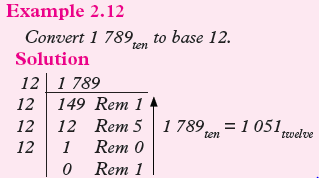
For example, to change 42510 to base 6,
we do successive division by 6.
425 ÷ 6 = 70 Rem 5
70 ÷ 6 = 11 Rem 4
11 ÷ 6 = 1 Rem 5
1 ÷ 6 = 0 Rem 1
The successive remainders read upwards
form the number 1545.∴ 42510 = 1 5456

Exercise 2.1
1. Convert the following numbers from
base 10 to base 5.
(a) 50 (b) 36 (c) 2312. Convert the following numbers in
base 10 to base 9.
(a) 82 (b) 190(c) 144 (d) 329
3. Convert the following numbers in
base 10 to specified base.
(a) 145 to base 2(b) 5204 to base 6
(c) 800 to base 2
(d) 954 to base 8
(e) 512 to base 3
(f) 1280 to base 12
(g) 896 to base 16
(b) Converting any base to base 10
Activity 2.5
Consider the number 125 given in
base six.
Using number place value method;(a) Find the value of digit 1, 2and 5.
(b) Add up the values obtained in part (a) above.
(c) What does this value represent?
In this activity, you have converted a
number from base 6 to base 10. To
convert a number from one base to base
ten, we use number place values. For
example to convert 2539 to base 10, we
say:
2359 means 5 ones + 3 nines + 2 nine
nines.∴ 2359 = (5×90) + (3×91 + (2×92)
= (5 × 1) + (3 × 9) + (2 × 92)
= 5 + 27 + 162
= 194
∴ 2359 = 19410(a) Consider Fig 2.5 below.
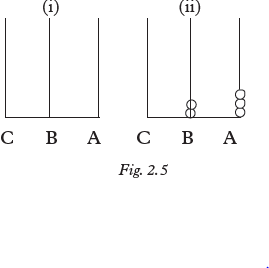
Suppose in Fig 2.5, each spike is designed to hold six beads, and that
each bead in spike B represents six beads in spike A. Thus in Fig 2.5 (b)
there are two beads in B and three beads in spike A. The 2 beads mean
2 groups of six i.e 2 × 6 or 12 beads. The 3 beads are said to represent 3
ones. Thus the number represented in Fig 2.5(b) is written as 23six
Therefore, 23six = 15ten This is read as two three base six
equal one five base ten: 23six and 15ten are different numerals
for the same number
(b) Now consider Fig 2.6 below: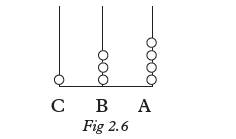
The number shown in Fig 2.6 can be written as 134six. What does the single
bead in spike C represent? It is the same as six beads in spike B which is
equal to six × six (or thirty six) beads
in spike A.
Hence 134six means:
The 1 stands for 1 six sixes or 36ten
The 3 stands for 3 six or 3 × 6ten
The 4 stands for 4 ones or 4ten
So we would write
134six as (36 + 18 + 4ten) = 58ten
i.e 134six = 58ten
(c) Now consider the number represented
in Fig 2.7 below.
When reading off a number in base six, it may help us to think in powers
of six. The number represented in
Fig 2.7 can be written as
145six = 1×6 sixes + 4 sixes + 5ones
= (1 × 62) + (4 × 6) + (5 × 1)
= 36 + 24 + 5
= 65tens(d) Now, let us think of a number like
28ten. How can we represent 28 on a base six abacus?
We find the number of sixes contained in 28.
To do this we divide 28 by 6. Thus
28 ÷ 6 = 4 Rem 4.
So, 28ten is 4 sixes and 4 ones.
This number can be written on theabacus as shown in Fig. 2.8.
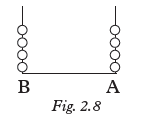
i.e on the abacus, there are 4 beads
on spike A and 4 in spike B. i.e
28ten = 44six
Use a similar method to show on a base
six abacus the following numbers.
81ten and 324ten
Note:
We can use a similar method to represent
any base ten number in another base.
Also, a number such as 65ten can be
expressed as a number in base six as:
65 ÷ 6 = 10 Rem 5 5 ones
10 ÷ 6 = 1 Rem 4 4 sixes
1 ÷ 6 = 0 Rem 1 1 × 6 sixes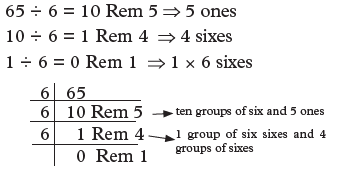
The answer is then written starting with
the last remainder, followed by the next
remainder, etc vertically up till the first
remainder.
65ten = 145sixExample 2.4
Express 415six as a number in base ten.Solution
We use place values to change from base
six to base 10.415six = (5 × 1) + (1 × 6) + (4 × 62)
= 5 + 6 + (4 × 36)
= 5 + 6 + 144
= 155
∴ 415six = 155tenExercise 2.2
1. Convert the following numbers from
specified base to base 10.
(a) 859 (b) 10012(c) 23435 (d) 123
(e) 6157 (f) 1425
(g) 12324
2. Are the following valid or invalid?
(a) 1232 (b) 2345
(c) 10022 (d) 34676
(c) Converting from one base to any other base
Suppose we wish to change from base m
to base n where m ≠ n ≠ 10 and m and n
are positive numbers.Activity 2.6
Consider the number 467.
(a) Convert 467 to a number in base 10 as you did in activity 2.5
(b) Use your answer to part (a) above and convert it to a number in
base 5.(c) Describe the procedure of converting a number from a
number in base x to a number in base y where x ≠ y.In this activity, you just converted a
number from base seven to base five.To convert a number from a base other than ten to another base, follow the steps
below.
(i) Change or convert the given number to base 10.(ii) Convert the result of part (i) to a number in the required base, for
example,To convert 1213 to base 4;
Convert 1213 to base 10.
Thus 1213 = 1 + 2 × 3 + 1 × 32
= 1610
Then convert 1610 to base 4, by
successive division by 4.
16 ÷ 4 = 4 Rem 0
4 ÷ 4 = 1 Rem 0
1 ÷ 4 = 0 Rem 1
1213 = 1004
Now let us repeat activity 2.6 using
386nine
• 386nine means 6 ones, 8 nines and
3 nines
We first change 386nine to base ten as
follows:
3869 = 6 × 1 + 8 × 9 + 3 × 92
= 6 + 72 + 243
= 321ten
• To convert to base 6, we do successive
division of the number in base 10.Note: to convert a number from a base
other than 10 to another base, we first
convert from the given base to base 10.
Then from base 10 to the required base.
Example 2.5
Convert 5148 to base 9.
Solution
To convert from base 8 to base a,(i) First convert to base 10
(ii) Then convert result (i) to base 9
5148 = 4 × 1+ 1 × 8 + 5 × 82
= 4 + 8 + 320
= 33210
To convert 33210 to base 9, we do
successive division by 9, noting the
reminder at each step.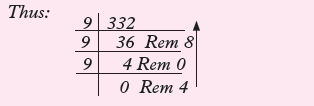
From down upwards the reminders form
number 408.
This means 8 ones
0 nines
4 nine-nines
Thus 5148 = 4089.Exercise 2.3
1. Convert the following to base 7.
(a) 4115 (b) 3216
(c) 156 (d) 3024
2. Express 637 to base 5
3. Given that 8510 = 221x. Find the
value of x.4. Convert the number 7038 to;
(a) Base 6 (b) Base 10
(c) Base 9 (d) Base 2
In short;
To convert from base ten to
another base:
1. Do successive division by the required base noting the
remainders at every step.2. Write down the remainders beginning with the last one on the
left.3. These remainders make up the required number.
To convert from any base x to base 10:1. Multiply every digit in the number by its place value i.e. 1, x, x2, x3 etc.
2. Add the results. To convert from base m to base n,
where m ≠ 10 and n ≠ 10:1. First convert from base m to base 10:
2. Then, convert from base 10 to base n.
Numbers in other bases can be expressed
in the same way as we have done.
The following are some other bases
and the numerals used.Base Numerals
Nine 0 1 2 3 4 5 6 7 8
Eight 0 1 2 3 4 5 6 7
Seven 0 1 2 3 4 5 6
Six 0 1 2 3 4 5
Five 0 1 2 3 4
Four 0 1 2 3
Three 0 1 2
Two 0 1
and so on.(e) Base 4
In any base, the numeral equal to the base
is represented by 10.
i.e. 55 = 105 66= 106 1010= 10
88 = 108 etc
When a base is greater than 10, say 12,
we need to create and define a symbol to
represent 10 and 11.Exercise 2.4
1. Write the first twenty numerals of:
(a) Base six (b) Base seven(c) Base eight
2. What does 8 mean in:
(a) 108ten (b) 180ten
(c) 801ten (d) 88 801ten
3. Write down in words:
(a) 203six (b) 302four(c) 15six (d) 3 215eight
4. Convert the number 703eight to:
(a) base 6 (b) base 10
(c) base 9
5. Convert the following into decimal
system:(a) 411five (b) 321six
(c) 207eight (d) 750nine
6. Express 63seven to base 5
7. Write in words the meaning of :
(a) 12three (b) 21four,
(c) 142five, (d) 180nine
8. Use abacus to show place values for the numerals in:
(a) 211five (b) 615seven
(c) 173eight (d) 1 254ten
9. Convert 118nine to base 5.
2.3 Operations using bases
2.3.1 Addition and subtraction
Activity 2.7
Table 2.2 shows part of the addition
table for numerals in a certain base(i) State the base.
(ii) Copy and complete the table.
(iii) Use your table to evaluate.

Now consider table 2.3.
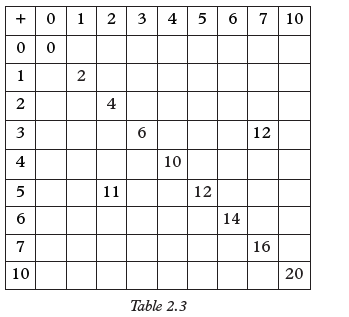
• Identify the base used in this table.
• Copy and complete the addition.
Table 2.3.
• List the numerals used in this table.
• Use your table to formulate some
equations involving subtraction.Note:
To add or subtract, numbers must be in the same base.In performing addition or subtraction,
whatever the base, the digits to be added or subtracted must be in the same place
value. For example in 65ten + 18ten, 5 and
8 have the same place value while 6 and 1 have another place value.
The base used is 8.
This is the required table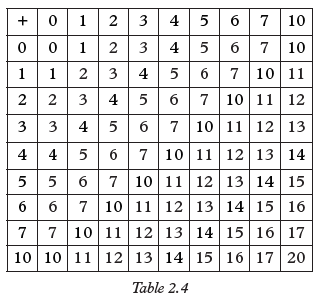
• The numerals used range from 0 to 20.
• Some examples of questions and answers
11 – 2 = 7; 17 – 10 = 7, 10 – 1 = 9 etcNote:
• While working in base eight, eight
must not be one of the numerals in
use.• In base eight, there are only 8 digits
i.e. 0, 1, 2, 3, 4, 5, 6, 7Example 2.6
Evaluate: 332six + 25six
Solution
It is best to set work vertically so that the place values correspond.
332six + 25six→ 3326+256
1. Illustrate the two numbers on
different abaci (Fig. 2.9).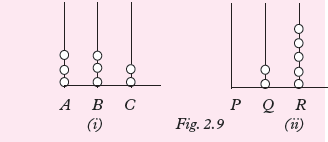
2. Remove all the 5 beads from R and
place them in C to make 7 beads.One bead remains at C another
goes to B to represent another group of six
(Fig. 2.10).
3. Remove the two beads from Q and place them on B to make
6 beads. No bead remains at B, but one bead goes to A to
represent another group of six sixes.
(Fig. 2.11).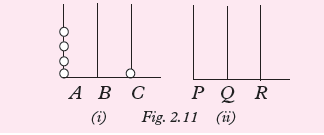
4. The result of the addition is 401six
Alternatively,
332six → 330 + 2
25six → 20 + 5
350 + 11
= 350
+ 11/401six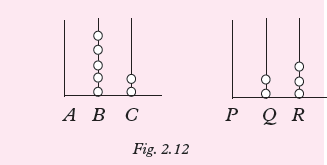
Since we cannot subtract beads in R from
beads in C,1. Remove one bead from B and place it on wire C so that there is a total
of 10 in C, (Fig. 2.13)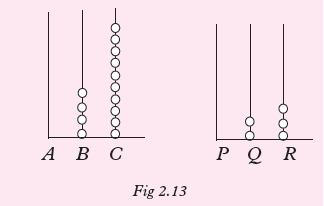
2. Remove 3 beads from C and R (Fig 2.14).
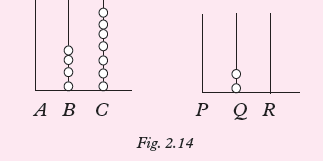
3. Remove 2 beads from B and Q so that the result is as represented in
Fig. 2.14 below.
∴ 528 – 238 = 278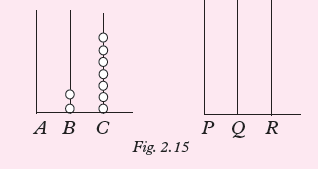
Alternatively,
528 → 50 + 2 → 40 + 10
– 238 → 20 + 3 → 20 + 3
20 + 7 = 27 eightExercise 2.5
1. Work out the following in base eight:
(a) 17 + 211 (b) 106 + 12
(c) 257 + 462
2. Evaluate the following in base six:(a) 31 – 25 (b) 145 – 51
(c) 55 – 43 (d) 403 – 54
3. Evaluate the following in base nine:(a) 122 + 85 (b) 103 – 86
(c) 17 – 8 (d) 66 + 35
4. The following calculations are correct.
State the base used in each case.(a) 36 (b) 53 (c) 3
+ 26 + 36 + 23
––––– ––––– –––––
64 111 31
––––– ––––– –––––
5. Each of the following calculations
were done using a certain base. Three
of them are correct.
Identify:
(a) the base(b) the incorrect ones and explain why.
(i) 22 (ii) 68
– 16 + 15
––––– ––––
6 84(iii) 100 (iv) 177
– 64 + 19
––––– ––––––
25 2072.3.2 Multiplication
Activity 2.8
Table 2.4 shows part of the
multiplication table for numerals in a certain base.
(a) Identify the base.
(b) Copy and complete the table.
(c) Given that x is a numeral, use your
table to find the value of x if:
(i) 6x = 13 (ii) 3x = 23(iii) 7x = 46
(d) Use your table to formulate three
equations using a variable of your
choice.Note that for any base;
(i) the highest numeral is always one less than the base and
(ii) the least is zero (0).
Consider the product:
2six × 3six
Whether in base ten or base six, 2 by 3
remains the same
2 × 3 = 6ten = 106Example 2.8
Use long multiplication to evaluate
45six × 23 six.
Solution
×45
23
––––
1340
+ 223
–––––––
2003
–––––––
(i) 1st row products
5 × 2 = 10ten = (14six, we write 4 and carry 1)
2 × 4 = 8ten (12six plus the 1 we carried )
= 12six + 1= 13six (we write 13six )
45 × 2 = 134six
(ii) 2nd row products
3 × 5 = 15ten = 23six (We write 3 and
carry 2)
3 × 4 = 12ten = 20six (20 plus 2 we carried)
20six + 2six = 22six
∴ 45 × 3 = 223six.
Add the products in the 1st and 2nd rows
to get 2003six2.3.3 Division
Activity 2.9
(a) Given that a, b and c are numerals
in base ten such that ab = c,
express:
(i) a in terms of b and c.(ii) b in terms of a and c.
(iii) Describe the operation
used to obtain the results
above.
(b) Given that 2six x 5six = 14six,
express:
(i) 2six in terms of 5six and 14six.(ii) 5six in terms of 2six and 14six.
What operation have you used
to obtain your results?(c) Make a multiplication table for base six and use it to confirm
your findings in part (b) above.(d) Use the table in (c) above
to create more examples of division.Now consider the example 23six ÷ 5six.
To do this, you ask yourself, 'by what
can I multiply 5six to obtain 23six?'
This question can be answered using the
multiplication table.Example 2.9
Evaluate: 15six ÷ 2six
Solution

2 × 5 = 10ten = 14six15six ÷ 2six = 5 Rem 1
We could also divide by first changing
the number to base 10, then change back to base 6.15six = (1 × 6) + 5 = 11
2 six = 2ten
15six ÷ 2six = 11ten ÷ 2ten = 5 Rem 1
5six = 5ten and 1six = 1ten
15six ÷ 2six = 5six Rem 1
But this is a long and an unnecessary
process.Exercise 2.6
1. Copy and complete the multiplication
table in base eight and use it to answer
the questions below.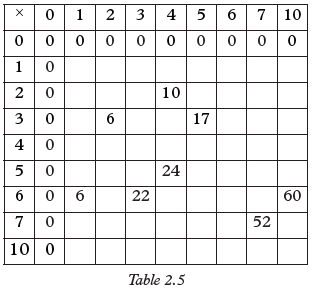
(a) 528 ÷ 78 (b) 438÷ 58
(c) 348 ÷ 78 (d) 208÷ 48
2. Evaluate the following:
(a) 15six × 11six
(b) 216 × 126
(c) 56 × 56
(d) 1 3336 ÷ 356
3. (a) 2 1224 ÷ 234
(b) 100 1224 ÷ 20344. (a) 1 2168 ÷ 38
(b) 1 0326 ÷ 46
2.4 Special bases
2.4.1 The binary system (base two) Base two
Activity 2.10
1. Write down all the digits used in the base 10 system.
2. Convert each of the digits in (a) to base 5.
3. Present your findings in a table similar to table 2.6.

A binary system is a number system that
uses only two digits 0 and 1. Numbers are expressed as powers of 2 instead of
powers of 10 as in the decimal system. Computers use binary notation, the two
digits corresponding to two switching position, on and off, in the individual
electronic devices in the logic circuits. Remember; in any base there is no
numeral equal to the base. Such a numeral always takes the form of 10.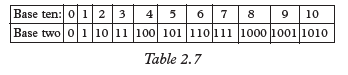

Note: Just as in division in decimal
system, remember to put a zero in the
answer any time the divisor fails to divide.Exercise 2.7
1. Evaluate:
(a) 10112 + 11012
(b) 100012 + 1100112
(c) 111012 + 112 + 101012
(d) 12 + 112 + 10112+ 1100112
2. Calculate:
(a) 101112 – 11012
(b) 110002 – 11102
c) 111112 – 100102
(d) 10101012 – 11112
3. Evaluate:
(a) 1012 × 112
(b) 11112 × 11012
(c) 101012 × 111
(d) 11102 × 1112
4. Evaluate:
(a) 1010112 ÷ 112
(b) 111001012 ÷ 1012
(c) 100010112 ÷ 10112
(d) 1000100112÷ 1012
(e) 1001000012 ÷ 102
5. Find the prime factors of 10111002.
6. Convert the following to the binary system.
(a) 18ten (b) 135six(c) 65seven (d) 35eight
7. Convert 10110two to base four.
8. Evaluate the following giving your
answers in base two.
(a) 15ten + 23ten (b) 35ten – 12ten2.4.2 Base twelve (Duodecimal system)
Activity 2.11
1. Think of examples of items
where we group in twelves.2. Use your dictionary to find the meaning of the word dozen.
A system of numbers whose base is twelve is called duodecimal system. When
buying or selling in bulk, often, items are counted in groups of twelve i.e. dozens.
Earlier in the chapter, we saw that the numeral equivalent to the base is always
represented by 10. Therefore, in the case of base twelve, we have to define two
different variables to use in place of 10 and 11 to avoid confusion. Such substitutions
are necessary when working with any base greater than 10, i.e. base eleven, thirteenetc. To be able to list the digits used in base twelve, let letter A represent 10, and
B represent 11. Thus, the digits in base twelve are:
0, 1, 2, 3, 4, 5, 6, 7, 8, 9, A, B.
 Exercise 2.8
In question 1 to 4, A represents 10 and B
represents 11.1. Express the following in decimal.(a) 9712 (b) AB12(c) 9A12 (d) B7122. Evaluate:(a) AB12 + 9912(b) 101112 + A0B0123. Calculate:(a) B912 – A812(b) 41912 – AB124. Multiply:(a) B1A12 by A0112 (b) 8A12 × 9B125. Convert: 1 332four to base twelve.6. Convert 1 705ten to base twelve.
Given that A stands for ‘ten’ and B
stands for ‘eleven’, answer the following
questions.7. Evaluate: 7A12 + B512. Convert your
answer to base 10.8. Perform the following duodecimal
calculations.(a) 5BA – BA (b) A5 + 5A + 9(c) A × 64 (d) B × 45(e) 12 × 8 – 72.5 Solving equations involving numbers in other bases
Activity 2.12
Solve the equations;
(a) (i) x – 6 = 10 (ii) x –(–3)= –5
(iii) x÷4 + 3 = 5
given that you are working
with base 10 system.
(b) Solve the equations in (a) above
using base 6.
Now, consider the equations below.
(i) x + 5 = 12 (ii) x – (–2)= 4
(iii) 2x÷3 + 3 = 5
Working with base ten system,
(i) x + 5 =12 ⇒ x = 7
(ii) x + 2 = 4 ⇒ x = 2(iii) 2x÷3 + 3 = 5 ⇒ x = 3
Now, working in base six,
(i) x + 5 = 12 can be written as
x + 5 = 20 (since 1210 = 206⇒ x + 5 = 20
x = 20 – 5
= 11six
Alternatively, we can assume thatx + 5 = 12
x = 12 – 5
= (6 + 2) – 5
x = 3six
(ii) x – (–2) = +4
x + 2 = 4
x = –2 + 4
= 2six
(iii) 2x÷3 + 3 = 5…..3 × 3 = 910 =13six
And 5 × 3 = 1510 = 23sixThus 2x÷3 + 3 = 5 becomes
2x + 13 = 23 (base six)…..
multiplying each
term by 3
2x = 23 – 13……….. subtracting
13six from
both sides
= 10six
x = 3six………… after dividing both
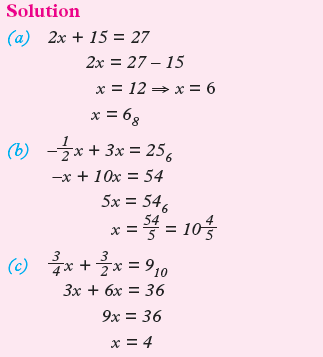
sides by 2_(six )Example 2.13
Solve for the unknown in:
(a) 2x + 15 = 17 (base 8)(b) 1÷2x – 3x = 20 (base 6)
(c) 3÷4x + 3÷2x = 9 (base 10)
Example 2.14
Solve for x in the equation 36x + 26x =64x
given that x is a number other than base
ten. Verify your answer.Solution
36x + 26x = 64x can be expressed as
3 × x + 6 + 2 × x + 6 = 6 × x + 4
(convert the equation to base ten then
solve for x)
3x + 6 + 2x + 6 = 6x + 4
5x + 12 = 6x + 4
12 – 4 = 6x – 5x
8 = x
Thus x = 8.
To verify the answer, substitute 8 = x in the
given equation 36x + 26x = 64x
In 36x + 26x = 64x,
LHS 36x + 26x = 3x + 6 + 2x + 6
= 3 × 8 + 6 + 2 × 8 + 6
= 24 + 6 + 12 + 6
= 30 + 22
= 52RHS 64x = 6x + 4
= 6 × 8 + 4
= 48 + 4
= 52
Thus LHS = RHS = 52
x Represents base 8 in the given equation.
Exercise 2.9
1. Solve for x in:(a) 21023 = 72x
(b) 110011two = 23x
2. Solve for x if 1101012 = x8
3. Given that A and B represent ten and
eleven respectively in a certain base x,
solve for x in:(a) A7x + 5Bx = 19810
(b) BA1x = 170510
4. Find x if 10011two = 23x.
5. Given that x is the base, solve the
equation:(a) 25x + 13x = 42x
(b) 32x + 24x= 100x
(c) 142x + 33x = 215x
6. Solve for x in the following:
(a) 12x – 6x = 5x
(b) 31x – 16x = 12x
(c) 32x – 24x = 6x
(d) 142x – 53x = 67x
7. Given that A and B represent 10 and
11 respectively in base twelve, solve
for x in;
(a) 12A12 + 4AB12 = xten(b) 78912 – AB12 = x nine
Unit Summary
• A numeral is a symbol for a number
for example number twenty five is represented by the numeral 25.• A numeral is composed of one or more digits. Thus a digit is a single numeral.
• 2 is a numeral mode of a single digit
365 is a numeral, each of 3, 6, 5 is a digit 365 is made up of three digits.• In base ten, we use nine digits or
numerals 0, 1, 2, 3, 4, 5, 6, 7, 8, 9 in base 8, we need eight digits i.e 0, 1,
2, 3, 4 , 5, 6, 7 working with number bases, we never use a numeral equal
to the base.• The value of a digit depends on its
position in the numeral thus, in a number such as
452ten the value of 4 is 4 × 10², the value of 5 is 5 × 10 And the value
of 2 is simply 2. 452 = 4 × 10² + 55 × 10 + 2
Similarly, in 452six, the value of 4 is
4 × 62, that of 5 is 5 × 6 and 2 remains 2.
∴ 452six = 4 × 62 + 5 × 6 + 2,
= 176ten.
• If a base is greater than ten, the
numerals above ten must be represented by a simple variable or
symbol. For example, in base 12 we need to invent a symbol to represent
10 and 11. We could use A for 10, B for 11 or any other variable provided
we define it i.e we could say let
A = 10
B = 11
The number equal to the base is
always represented by 10.
In base 12, we use 10 for 12, in base
13 we use 10 for 13 and so on.Unit 2 Test
1. Add 3554six to 44six giving your
answer in the same base.2. (a) Express 101eight in base 2.
(b) Calculate 110two × 1010two giving
your answer in base two and also
in base ten.3. Write 230n as an algebraic expression
in terms of n.4. Given that 10022three = 155n, find the
value of n.5. Write each of the numbers as a mixed
number in the base number(a) 101.11ten
(b) 21.01five
6. If 13 × 21 = 303 find the base of the
multiplication.
7. In this binary addition, t and r, stands
for a particular digit i.e 0 or 1 find t
and r complete the addition.
1trrt
+ 1trr/1....r8. Carry out the following in base six
(a) 115 + 251 + 251
(b) 53412 - 34125
(c) 123 × 54
9. If A stands for 10 and B stands
for eleven, perform the following
duodecimal calculations:(a) 59A + AB (b) 4A + AB + 9
(c) 10 × 54 (d) 45B – A1
(e) 11 × 7 – 8 (f) 32 + 6B
(g) 159A – 6BA
10. Solve the equation:
31x – 17x = 16x
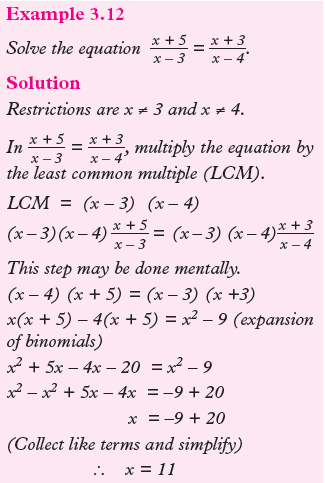
Unit 3 :ALGEBRAIC FRACTIONS
Key unit Competence: By the end of the unit, the learner should be able to perform
operations on rational expressions and use them in different situations.
Unit Outline
• Definition of algebraic fraction
• Simplification of algebraic fractions
• Subtraction and addition of algebraic
fractions with linear denominator• Multiplication of algebraic fractions
• Division of algebraic fractions
• Solving of rational equations.
Introduction
Unit Focus Activity
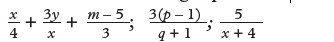
(a) Consider a fraction such as 2÷2x – 4 .
(i) Find the value of the fraction
when x = 0, 1, 2, 3, 4.(ii) Is there any value of x for which
there cannot be any meaningful
value for the fraction in (i)
above? If your answer is yes,
explain.(b) Given group of numbers such as
(i) 2, 3, 4 (ii) x, 2x, 2x + 6, find the
LCM of each group.
Express each of the following as a
single fraction under a common
denominator: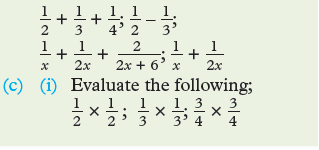
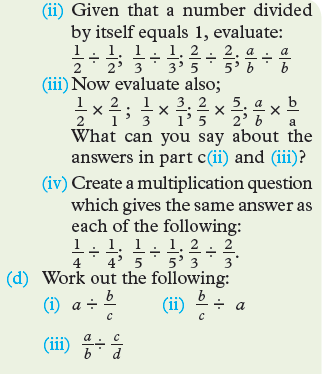
(ii) Given that a number divided
by itself equals 1, evaluate:
1/2 ÷ 1/2 ; 1/3 ÷ 1/3; 2/5 ÷ 2/5 ; a/b ÷ a/b(iii) Now evaluate also;
1/2 × 2/1 ; 1/3 × 3/1 ; 2/5 × 5/2 ; a/b × b/a
What can you say about the
answers in part c(ii) and (iii)?(iv) Create a multiplication question
which gives the same answer as
each of the following:
1/4 ÷ 1/4 ; 1/5 ÷ 1/5; 2/3 ÷ 2/3.(d) Work out the following:
(i) a ÷ b/c (ii) b/c ÷ aIntroduction
Unit Focus Activity
(a) Consider a fraction such as 2/2x – 4 .
(i) Find the value of the fraction
when x = 0, 1, 2, 3, 4.(ii) Is there any value of x for which
there cannot be any meaningful value for the fraction in (i)
above? If your answer is yes,explain.(b) Given group of numbers such as
(i) 2, 3, 4 (ii) x, 2x, 2x + 6, find the
LCM of each group.
Express each of the following as a
single fraction under a common
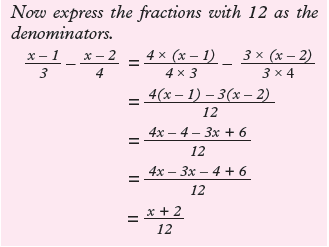
denominator:1/2 + 1/3 + 1/4; 1/2 – 1/3
1/x + 1/2x + 2/2x + 6 ; 1/x + 1/2x
(c) (i) Evaluate the following;
1/2 × 1/2 ; 1/3 × 1/3; 3/4 × 3/4
Consider the following expressions:
In each of these expressions, the numerator
or the denominator or both contain a
variable or variables. These are examples of algebraic fractions.
Since the letter used in these fractions and for real numbers, we deal with
algebraic fractions in the same way as we do with fractions in arithmetic.3.1 Definition of algebraic fraction
Activity 3.1
Consider the fractions: 3y/1 – x , 5/y + 4 , 2/7
5x – 6/x + 3, x + y/2, 3/4
.
1. Identify the algebraic fractions.2. Find the value of the variable.
that makes each of the following
expressions zero:(i) x + 3 (ii) y + 4
(iii) 1 – x
3. What do your answer in (2) above
reveal to you about the fractions
such as:5x – 6/x + 3 , 5/y + 4 and 3y/1 – x ?
Now consider the following fractions:
(i) 2/x (ii) x + 3/x – 1
(iii) y – 4y – 6
The expressions 2/x, x + 3/x – 1 and y – 4/2y – 6 are
all algebraic fractions.(i) 2/x , the fraction is valid for all real
numbers except when x = 0(ii) x + 3/x – 1 exists only if x – 1 ≠ 0
x – 1 ≠ 0 if x ≠ 1.
∴ the fraction is not defined when
x = 1.(iii) y – 4/2y – 6 , the fraction is defined
(exists) only if the denominator
is not equal to zero.
Thus if 2y – 6 = 0, then 2y = 6,
y = 6
2 = 3.
∴ y – 4/2y – 6 exists for all real values of
y except when y = 3.
Note:(a) If x = 0 (in (i) above), it means dividing
2 by zero which is not defined.(b) If x = 1 (in (ii) above), the denominator
or divisor becomes zero which is not
defined/which does not exist.(c) Similarly, in (iii) if y = 3, then 2y – 6
= 0 (the divisor)which is not defined/
which does not exist.In general, an algebraic fraction exists
only if the denominator is not equal to zero. The values of the variable that
make the denominator zero is called a restriction on the variable(s). An
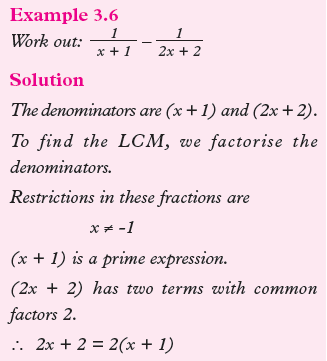
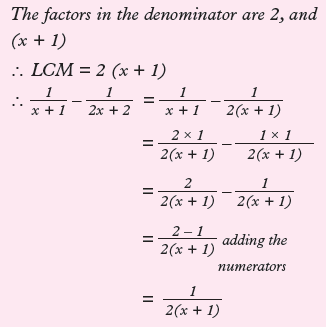
algebraic fraction can have more than one restriction.Example 3.1
Identify the restriction on the variable in
the fraction 3xy/(x + 3) (x – 2) .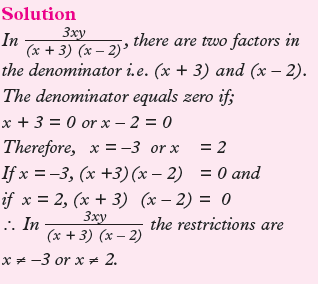
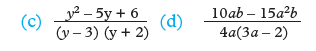
Exercise 3.1
1. Identify the restrictions on the
variables of each of the following
fraction.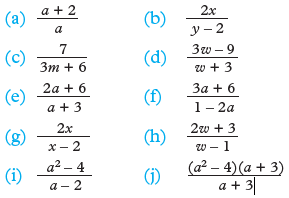
2. Find the restrictions on the variables
in:-
3. Find the restrictions on the variables
in the following fractions: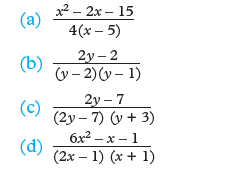
3.2 Simplification of Fractions
Activity 3.2
Write the following fractions in the
simplest form: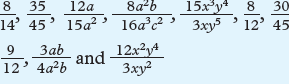
A fraction is in its simplest form if its
numerator and denominator do not have common factors. To simplify means to
divide both numerator and denominator by the common factor or factors.
A numerator and a denominator can be divided by the same factor without altering
the value of the fraction.
For example, in 8/12, the numerator and denominator
have a common factor 4.∴ 8/12 = 8 ÷ 4/12 ÷ 4
= 2/3
We say that 8/12 and 2/3 are equivalent
fractions.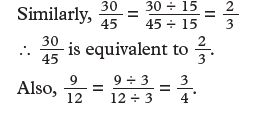
∴ 9/12 is equivalent to 3/4 .
If both the numerator and denominator
of a fraction have more than one term, we
simplify the fraction by:(i) Factorising both numerator and
denominator where necessary.(ii) Cancelling by the common factor.
Remember: In Senior 2, you learnt to
factorise algebraic expressions.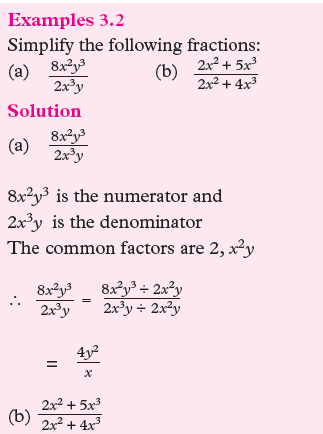
Both the numerator and the denominator contain two terms
each.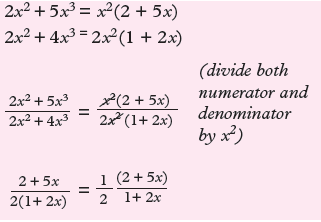
The Activity 3.3 introduces fractions
involving quantratic terms which can be expressed as products of linear
expressions.Activity 3.3
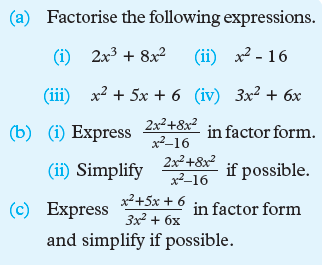
Factorise the following expressions:-
(a) x2 – 81 (b) 3x2 – 3(c) x2 – x –12 (d) 2x2 – 9x +10
Now consider the following expressions:
(a) x2 – 144 (b) 2x2 – 2(c) x2 – 11x + 28 (d) 2x2 + 11x + 12
Factorise completely:
(a) x2 – 144 is a difference of twosquares.
∴ x2 – 144 = x2 – 122
= (x – 12) (x + 12)
(factors of a difference of two squares)
(b) 2x2 – 2 = 2(x2 – 1)
(2 is a common factor)
∴ 2x2 – 2 = 2(x –1) (x +1)
is a difference of two
squares.
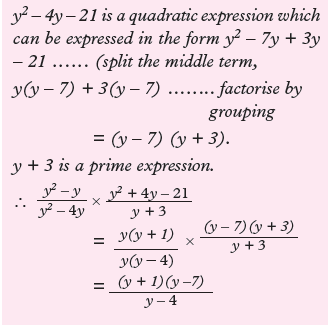
(c) x2 – 11x + 28 is a quadratic
expression.
x2 – 11x + 28 = x2 – 7x – 4x + 28
(split the middle term)x2 – 11x + 28 = x(x – 7) – 4 (x – 7)
(factorise by grouping)
x2 – 11x + 28 = (x – 7) (x – 4)(d) 2x2 + 11x + 12
= 2x2 + 8x + 3x + 12 (Split middle term)
= 2x(x + 4) + 3 (x + 4)
(factorise by grouping)
= (x + 4) (2x + 3)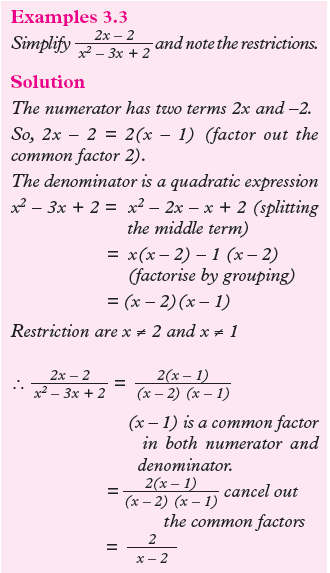
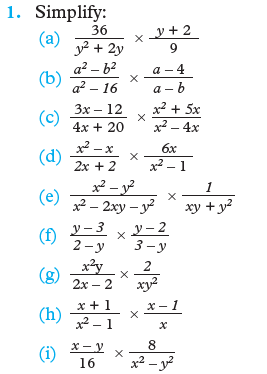
Exercise 3.2
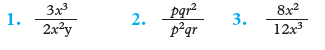
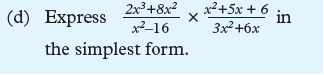
Simplify the following fractions:
For each of the following fractions in
question 8 and 9 below;(i) write the expression in factor form
(ii) note the restrictions on the variables
(iii) simplify the fractions.
3.3 Addition and subtraction of algebraic fraction with linear
denominatorActivity 3.4
Remember: To add or to subtract simple fractions, first, find the LCM
of the denominator then convert each fraction into a fraction having this LCM
as denominator. Add or subtract the numerators and simplify your answer.
Now let us consider numbers 3a, 4b, 5c,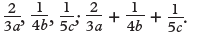
To find the LCM of two or more numbers,
first express each number as a product of
its prime factors.
3a = 3 ×1 × a
4b = 2 × 2 × b = 22b
5c = 5 × 1 × c
LCM of 3a, 4b and 5c is 3a × 22b × 5c =
60 abcFinding equivalent factions means expressing with common denominator.

Note:
1. Addition of algebraic fractions is
performed in the same way in the
activity 3.4 above.2. You can only add fractions if their
denominators are the same.3. The basic rule governing fractions
is that numerator and denominator can be multiplied by the same factor
without altering the value of the fraction.
Your skills in arithmetic should extend to
skills in algebra.
Exercise 3.3
1. Find the least common multiple of
each of the following:-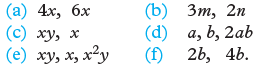
Simplify the fractions in the following
questions.


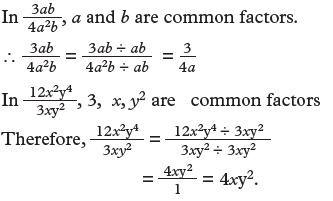
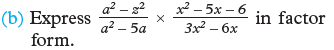
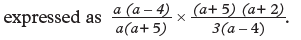
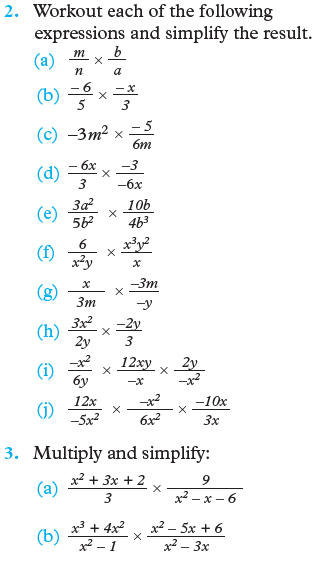
3.4 Multiplication of algebraic fractions
Activity 3.5
In order to multiply fractions, we identify
common factors, or possible factors of given expression and divide both the
numerator and denominator by the common factors.
For example, to simply an expression such as: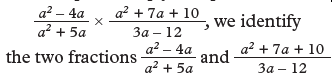
have no common factor is evident.
But it is possible to factorise the expressions
in both numerators and denominators. In Senior 2 we learned howto factorise.
(a) Now factorise the following:
(i) a2 – 4a (ii) a2 + 5a
(iii) 3a – 12
(iv) a2 + 7a + 10
a2 – 4a is a quadratic expression with only 2 terms, a is a common factor.
∴ a2 – 4a = a(a – 4)
a2 + 5a is another quadratic expression
with two terms whose common factor
is a.
∴ a2 + 5a = a(a + 5)
3a – 12 is a linear expression 3 is a common factor.
∴ 3a – 12 = 3 (a – 4)
a2 + 7a + 10 is a quadratic expression with three terms.
a2 + 7a + 10 = (a + 2)(a + 5)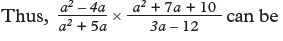
Note that there are some common factors
in both numerator and denominator
which can cancel out.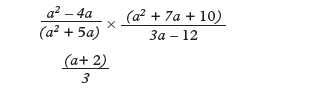
Exercise 3.4
3.5 Division of algebraic fractions
Activity 3.6
In general,
if a and b are whole numbers, then
1/a is the reciprocal of a and b /a isthe reciprocal of a/b .
In order to divide a fraction, we must
be able to identify the reciprocal of the
divisor.


Exercise 3.5
1. Write down the reciprocal of each of
the following:
3.6 Solving rational equations
Activity 3.7
Find the LCM of the following.
(a) 12, 16, 24 (b) a, b(c) (a – 3), 2a2 – 18 (d) a2, (a + 1)
(e) b, 6, 3b2
Now let us repeat activity 3.7 using:
(a) 6, 8, 16 (b) x, 2
(c) x – 3, x2 – 9 (d) x, (x + 1)
(e) y, 4, 3y
The LCM of a group of numbers is the
least or smallest number divided by the
given numbers.
Thus, we start expressing each number or
expression as a product of prime factors.
(a) 6, 8, 16: 6 = 2 × 3
8 = 2 × 2 × 2 = 23
16 = 2 × 2 × 2 × 2 = 24
LCM = 3 × 24 = 48(b) x and 2 are prime numbers.
∴ LCM of x and 2 is 2x.
(c) x + 3 and x2 – 9 are algebraic
expressions.
x + 3 is prime, but x2 – 9 is a difference
of squares.
∴ x2 – 9 = (x – 3) (x + 3)The prime factors involved are
(x + 3), (x – 3).
∴ the LCM = (x + 3) (x – 3).
(d) x and x + 1 are prime expressions
therefore LCM of x and (x + 1) is
x(x + 1).
(e) y, 4, 3y:
y is prime,
4 = 2 × 2 = 22
3y = 3 × y ∴ LCM = 22 × 3 × y
In order to be able to solve rational
equations;(i) Start by finding the LCM of the denominators in each equation.
(ii) Use the LCM to eliminate the denominators by multiplying each
fraction or term by the LCM.(iii) Then solve the resulting equation.

Exercise 3.6

Unit Summary
• An algebraic fraction is defined or said to exist only if its denominator
is not equal to zero. For example, a fuction such as 3/x is valid for all
values of x except when x = 0. The value of a variable that makes the
denominator of a fraction zero is called a restriction on the variable.• Two algebraic fractions are said to be equivalent if both can be reduced
or simplified to the same simpleast fraction. For example, 2/4 , 5/10 and 20/40, …
are equivalent, and all are reducible
to 1/2 .• To add or subtract algebraic fractions, we must first express
them with a common denominator, which represents the LCM of the
denominators of the individual fractions.• To multiply algebraic fractions,we begin by identifying common
factors in both numerators and denominators. The factors may not
be obvious in such a case, factorise all the algebraic expressions involved if
possible, then proceed to cancel andmultiply.•Division by a fraction, algebraic or atherimise, means multiplying the
divided by the receiprocal of the divisor. Remember the product of a
fraction and its reciprocal equal to 1. For example, reciprocal of 1/2 is 2,
that of a is 1/a , that of a/b is b/a and 30 on.• Algebraic equations involving fractions are also called rational equations. To
solve rational equations, we begun by eliminating the denominations by
multiplying all the terms by the LCM of the denominators. Then proceed
to solve the resulting equation.Unit 3 Test
Simplify each of the following algebraic fractions by expressing them as single
fractions in their lowest terms.


In each case list the restrictions that apply.
Unit 4:SIMULTANEOUS LINEAR EQUATIONS 4 AND INEQUALITIES
Key unit competence: By the end of this unit, the leaner should be able to solve
word problems involving simultaneous linear equations and inequalities.Unit outline
• Simultaneous linear equation
• Inequalities
- Graphical representation of linear inequalities
- Forming inequalities from given regions
- Linear inequalities in two unknowns
- Graphical solutions of simultaneous linear inequalities
- Linear inequalities from inequality graphs
Introduction
Unit Focus Activity
1. (a) On the same axes draw the graph of the lines whose
equations are:
–2x + y = –1 ................(i)
x + 2y = 4 ..................(ii)
(b) State the coordinates of the point where the two lines
intersect. What meaning do
you attach to this answer?2. Using the same equations in 1 (a)above.
(a) Use equation (i) and express x in terms of y.
(b) Substitute your answer from (a) in equation (ii) to obtain an
equation in y.(c) Solve the above equation to obtain the value of y.
(d) Substitute the y value in equation (i) to obtain the value of x.
3. Consider the situation below:
A learning institution employs men and women during the school
vacation. A day’s wage for 3 men and 2 women is 4 000 FRW. For 1
man and 5 women the wage is 3 500 FRW.(a) If a man earns x FRW and a woman y FRW per day, write
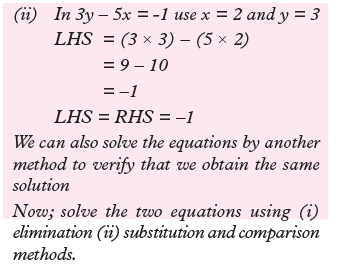
two equations in terms of x and y for the given situation.(b) Solve the equations using different methods.
4. Consider the inequalities:
(i) y > x + 1 (ii) 2x + y ≤ 5(a) On a Cartesian plane, draw the line y = x + 1. Pick a point
clearly not on the line and substitute the x and y values
in y = x + 1 to determine the region of y > x + 1
On the same axis draw the line y + 2x = 5
By substitution identify the region y + 2x ≤ 5(b) Identify the region that satisfies both the inequalities
y > x + 1 and y + 2x ≤ 54.1 Simultaneous linear equation
4.1.1 Solving simultaneous equations graphically
Activity 4.1
Using the equations
(i) y = 2x + 1 (ii) 2y = x – 41. Make separate tables of values for each equation for values of
x: –3 ≤ x ≤3.2. On the same axes, draw the two lines.
3. Do the lines intersect? If yes state the coordinates of the point where
they intersect.4. Describe the significance or the meaning of the point of intersection
of the two lines.Points to note
1. Before drawing any graph it is usually necessary to;i. Make a table of values for at least three pairs of points.
ii. Plot points from the table.
2. In each of the equations, there are two variables, x and y. x is called
the independent variable, marked on the horizontal axis; y is called the
dependent variable marked on the vertical axis.3. Choose an appropriate scale depending on the values on the table.
If the number is small we use a small scale such as 1cm represent 1 unit on
both sides.• We can use a graphical method to solve any pair of simultaneous
equations.• If a pair of equations produces parallel lines when graphed, then the equations have no solution
since the lines never intersect.• Remember when two lines are coincident, then the lines
represent a pair of equations which are said to have an infinite
solution set. This means that for any value of x picked there is a
corresponding value of y on the graph.• If the lines intersect, there is one unique solution.

Exercise 4.1
Use graphical method to solve the following
simultaneous equations. Verify your
answers by substituting your solutions in
the given equations.
1. x + y = 3 2. x – 2y = 5
4x – 3y = 5 2x + y = 53. x + y = 0 4. x + 2y = 5
2y – 3x =10 4x + 2y = 15. 4x – 3y = 1 6. 6x – y = –1
x – 4 = 2y 4x + 2y = –67. 4x – y = –3 8. 5x + 2y = 10
8x + 3y = 4 3x+7y = 299. 2x – 4y = 8 10. 1/2x – 2y = 5
3x – 2y = 8 1/2x + y = 111. 2x – 4y +10= 0 12. 3x – 5y = 23
3x + y – 6 = 0 x – 4y = 3
13. Solve questions 1 to 12 using;i. Elimination method
ii. Substitution method
iii. Comparison method
4.1.2 Solving problems involving simultaneous equations
Activity 4.2
Two numbers x and y are such that x < y. The sum of x and y is 90 and a
third of the smaller number equals a seventh of the larger.1. Form a relation connecting x, y and 90.
2. Relate a third of the smaller number and a seventh number of
larger in an equation.3. State two equations in terms of x and y.
4. Solve the equations in (3) above simultaneously.
5. Hence state the value of the two numbers x and y.
In this section we shall deal with situations which give rise to simultaneous equations.
Points to note
• To form simultaneous equations from a given situation, we must
define the two variables, say x and y.• Relate the two variables using the
given information i.e. form two distinct equations in x and y.• Simultaneous equations can be solved either algebraically or
graphically.• To solve simultaneous equations, graphically, we draw the lines
representing the two equations on the same graph.• If the equations have a solution, the lines will intersect at a point.
The x and y values at the point of intersection represent the solution
of the equations.• If no solution, the lines will be parallel.
• If the lines are coincident, it means the equations have an infinite
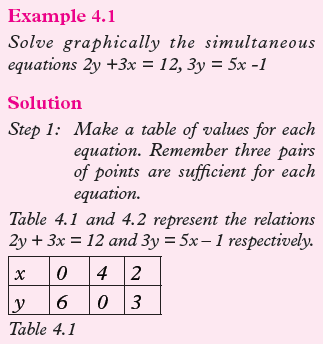
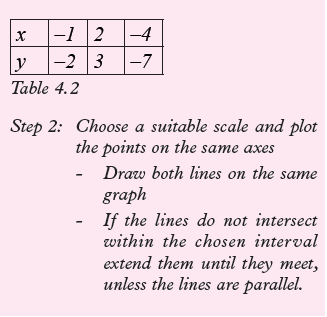
solution.Example 4.2
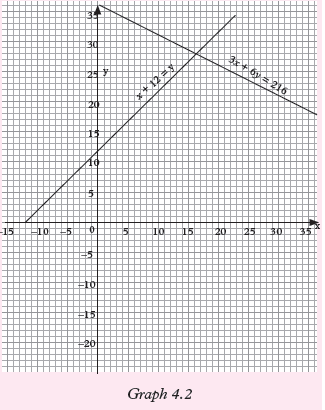
Some bird watchers travelled along the river for 3 hours and then travelled in the forest
for 6 hours. The total distance travelled was 216 km. If they went 12 km/h faster in the
forest than along the river, what would have been the different speed?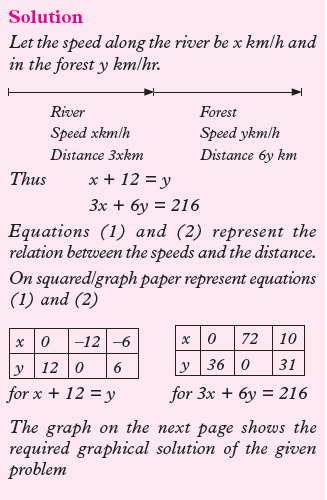
Exercise 4.2
1. Find the total distance in terms of x and y for each of the following:
(a) A car travels for x hours at 60km/h and y hours at 100 km/h.
(b) A person ran for 5 hours at x km/hr and 10 hours at y km/h.
2. Write an equation in two variables for each of the following:
(a) The total interest on an amount of money invested at 10% p.a
and another amount invested at 12% p.a is 1 609 FRW.(b) The interest on an amount of money invested at 8% p.a exceeds
the interest on another amount of money invested at 9% p.a by 100.3. Write an equation in two variables for each of the following:
(a) The sum of two numbers is 48.
(b) One number exceeds another by 5.
(c) The sum of the width and length of a rectangle equals 96
units.(d) When Jane’s age is added to Anne’s age, the sum is 36 years.
4. Two numbers are such that their sum is 84 and three times the greater
exceeds the twice the smaller by 62. Form two simultaneous equations
and solve them to find the numbers.5. John has a total bill of $580 consisting of $5 bills and $10 bills. If he has a
total of 76 bills, how many of each does he have?6. Mary invested her savings of 4800FRW partly at 9% p.a and the rest
at 10% p.a. At the end of the year the interest from the 9% interest was
4300 FRW less than the interest from the 10% investments. Form a pair of
simultaneous equations and solve them to find how much was invested
at each rate.7. James rented a tourist van and went
at 40 km/h on all weather road and at 10 km/h through a park. It took 5.75
hours to travel 185 km on the trip. Use simultaneous equations to find
the number of kilometres he drove through the park.8. A newspaper editor hired a writer for
jokes or cartoons. The cost for 8 jokes and 6 cartoons is 610 FRW. The cost
of 6 jokes and 8 cartoons is 510 FRW. How much do a joke and a cartoon
together cost?9. Two numbers are such that their sum
divided by 4 is equal to 14. If the greater number is increased by 24, the
result equals three time the smaller number. Find the two numbers.10. At an environmental studies conference, there were 168 more
engineers than chemists. However, there were 268 physicists. If there
were a total of 1134 engineers and chemists, how many of each were
there?11. At the beginning of the rainy season, a farmer bought 470 sacks of corn seeds
at 8 FRW per sack and bean seeds at 12 FRW per sack. For each 250 ha,
112 sacks of corn seeds are needed. If the total cost was 4260, how many
sacks of bean seeds were bought?4.2 Inequalities
4.2.1 Graphical representation oflinear inequalities
So far, we have represented inequalities on a number line. In this section we are going
to represent inequalities on a Cartesian plane. Remember that, (x, y) denotes any
point on the Cartesian plane. Graph. 4.3 shows the graph of x = 3.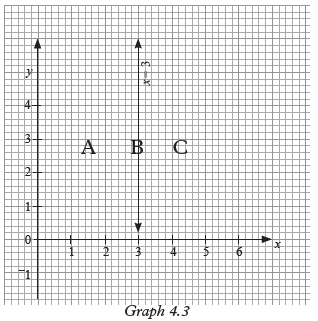
The line x = 3 divides the cartesian plane into three sets (3 regions) of points. These
are:i) the set of point B on the line,
(ii) the set of point A on one side of the line i.e. to the left of the line.
(iii) the set of points C on the other side of the line i.e. to the right of the line.
The same line divides the plane into two regions A and C one on either side of the
line.Activity 4.3
Use Fig. 4.3 to do this activity. Imagine that a Cartesian plane extends
indefinitely in all directions and that a line also extends indefinitely in two
directions in Fig. 4.3.1. Into how many sets of points does the line x = 3 divide the Cartesian
plane?
2. Identify and describe each set of points with reference to the line.3. Into how many regions (areas) does the line divide the plane?
The x-co-ordinate for every point to the left of the line x = 3 is less than 3, i.e. x < 3.
For all the points to the right of line
x = 3, the x-co-ordinate is greater than 3,
i.e. x > 3.
Graph 4.4 (a) shows the region containing all points (x , y) for which x < 3. This is
shown with a dotted line meaning that points on the line are not part of the
region.
Graph 4.4 (b) shows the region containing all points (x , y) for which x ≥ 3. This is
shown with a solid line, meaning that points on the line are part of the required
region.Note the following:
(a) Any line divides a plane into threesets of points i.e.(i) Points on the line.
(ii) Points on either side of the line
(b) In a Cartesian plane, each set of points can be defined with reference
to the line. For example, points on the line are defined by the equation
of the line. Points on either side of the line can be described using the
inequalities notation(s) >, ≥ ,<, ≤
with reference to the equation of the line. As shown in the graphs below.
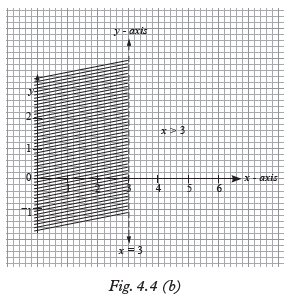
Note:
In both cases, the unwanted region (i.e. the region in which the inequality is not
satisfied) is shaded.
Also, on line x = 3 in graph. 4.4(a) are not wanted, so the line is ‘dotted’.
Graph 4.5 shows the region for which y ≥ –1.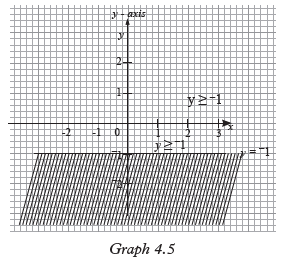
Note that the line y = –1 is continuous.
This means that the points on the line are included in the required region.To represent an inequality on a graph, we use the equation corresponding with
that inequality as the equation of the boundary line;
e.g. y > –1: Boundary line is y = –1.If points on the line are included in the required region, the line is continuous
(solid). If not, the line is dotted (broken). The normal convention is to shade the
unwanted region.4.2.2 Forming inequalities from given regions
Points to note
To form inequalities from a given graph of inequalities, we use a step by step
approach.Activity 4.4
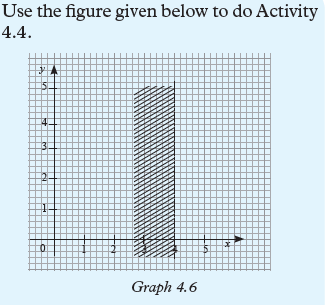
Step 1:
(i) Identify the line that defines the given region (boundary line).
(ii) Step 2: Find the equation of the boundary line.
(iii) Step 3: Identify the wanted region (unshaded region) and from it pick
a point clearly not on the line.(iv) By substituting the coordinates in the equation in (iii) above you will
be able to identify the inequality t satisfies.
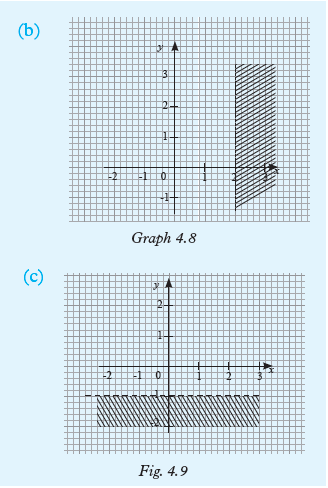
The respective lines in Fig. 4.6 divide the Cartesian plane into two regions.
• Line (a) passes through the point with coordinates (0, 3). The line has the
equation y = 3 and the points below the line are shaded. For all the points in
the unshaded region, y value is greater than 3. Therefore, the region satisfies
the inequality y ≥ 3. The points on the line are also included since the line is
continuous.• Line (b) is not continuous and passes through the point (2, 0). The
required region is to the left of the line x = 2. Therefore, the required
region satisfies the inequality x < 2.• Line (c) is broken and passes through (0, –2). The equation of the line is y
= –2 and the required region is belowthe line. Therefore, the required region satisfies the inequality y < –2.
If the required region is defined by a vertical line, the inequality will be of the
form x ≤ k or x ≥ k where k is a constant and line is solid.If the line is horizontal, the inequality will be of the form; y ≥ c or y ≤ c where
c is a constant. If line is broken, then the inequality will be y > c or y < c.Exercise 4.3
Show each of the following regions on a Cartesian graph.
1. (a) x > 1 (b) x < 52. (a) x < –2 (b) x ≥ –1
3. (a) y ≤ 2 (b) y > 0
4. (a) y < 1/2 (b) y ≥ –1.5
5. 4x – x2 ≤ x(1 – x) + 18
6. Find the inequalities represented by the following unshaded regions Fig.4.7.

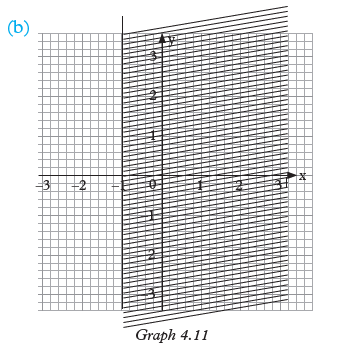
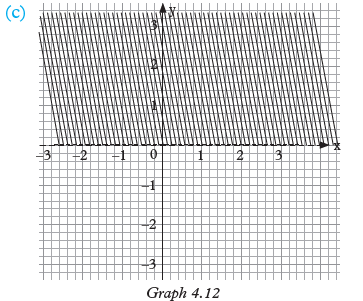
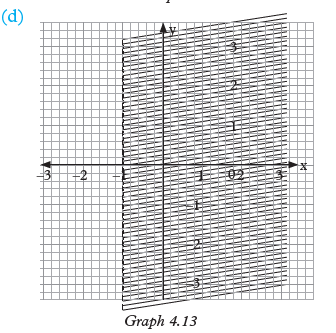
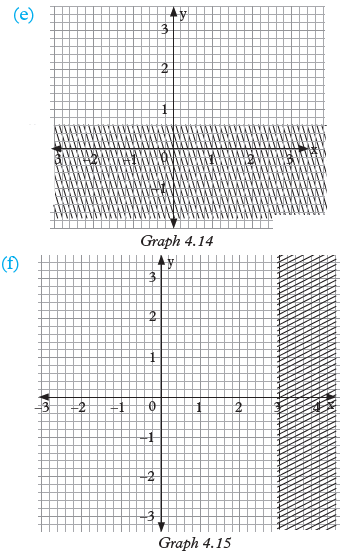
4.2.3 Simultaneous linearinequalities with one unknown
When regions are defined by two or more inequalities, those inequalities are referred
to as simultaneous inequalities.In Fig. 4.8, the unshaded region R lies between two inequalities. The two
boundary lines are x = –1 and x = 3. The region R satisfies both the inequalities
x < 3 and x ≥ –1 simultaneously.
∴ We can say –1 ≤ x and x < 3. In one statement, we write –1 ≤ x < 3.Exercise 4.4
By shading the unwanted regions, show the regions which satisfy the given inequalities
in questions 1 to 4.
1. (a) 3 < x < 4 (b) 1 < x ≤ 52. (a) –2 ≤ y < 2 (b) –1 ≤ y ≤ 1
3. (a) 2 – 1/3 x ≤ x ≤ 4
(b) 2x > 7 and 3x ≤ 18
4. y + 5 ≤ 4y < 2y + 14
5. Find the inequalities represented
by the following unshaded regions.Write your answer in a single
statement, that is a ≤ x ≤ b or a ≤ y ≤ y ≤ b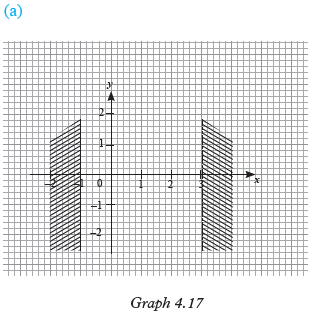
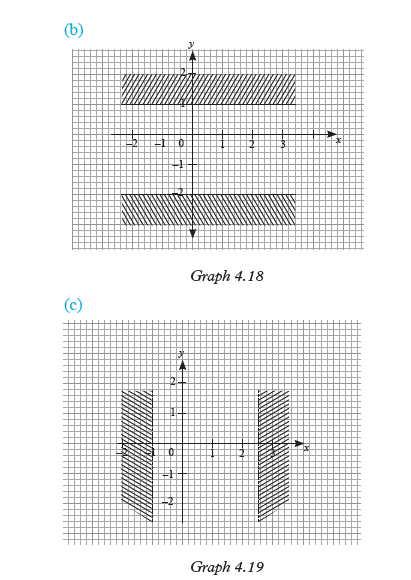

In (d) above, what is the name of the region represented by the inequalities?
In questions 6 to 8, show the regions
satisfied by the given inequalities:
6. –1 < 1/2x < 37. –1 ≤ 3x – 1 < 6
8. –2 < y < 4
4.2.4 Linear inequalities in twounknowns
We have dealt with inequalities of the form x ≤ a, x ≥ b, y ≥ c, etc. where a, b
and c are constants.In this section, we look at inequalities of the form ax + by ≤ c, ax + by ≥ d, etc.
where a, b, c and d are constants. Such an inequality is represented graphically by a
region containing all the ordered pairs of values (x , y) which satisfy that inequalityActivity 4.5
Using a graph paper, draw a line represented by the equation 2y = 3x + 6
1. Into how many regions does the line divide the Cartesian plane?
2. Identify one point (x, y) on one side of the line and substitute for x and
y in the given equation. What do you notice?
Describe the region containing the point using inequality notation.3. Do a similar substitution as in (2) above with a point from the other
side of the line. Comment on your answer.
Now repeat Activity 4.5 above using the equation x + y = 4.
Graph 4.21 shows the graph represented by the equation x + y = 4.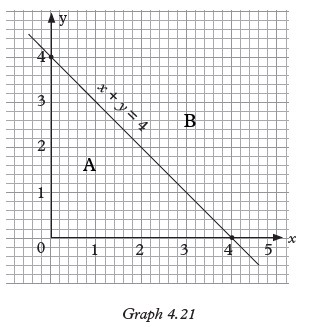
(a) The line x + y = 4 divides the plane into two regions A and B
(b) Using a point such as (2,1) substitute in the equation, x + y =4.
LHS = 2 + 1 = 3
Therefore (2, 1) satisfies x + y < 4
Thus x + y is less than 4. The point (2, 1) in region A satisfies the
inequality x + y < 4. But since the line is drawn solid, we can denote the
region as x + y ≤ 4. Similarly, points on the other side
satisfy the inequality x + y ≥ 4. Now consider the graph in graph 4.22.
The boundary line in graph 4.22 is
broken.
This means unshaded (required) region does not include points on the line in
order to define the required region, we use
coordinates of any point not on the line. For example use the point (1,1) substitute
for x and y in the equation x + 2y = 4 as follows: in the equation x + 2y = 4,
LHS: x + 2y = 1 + 2 × 1
= 1 + 2 = 3
R H S = 4The value on the LHS is less than the value on the RHS, thus, 3 < 4.
This means x + 2y < 4.
Therefore the unshaded region contains
the points that satisfies the inequality
x + 2y < 4.Note: If the boundary line does not pass
through the origin, it is more convenient and faster to determine the required
region using the origin.Exercise 4.5
Show the region which contain the set of points represented by each of the following
inequalities in questions 1 to 4.1. (a) x + y < 4 (b) y – x < 4
(c) 2x + 3y ≥ 6
2. (a) x – y ≤ 0 (b) 4x + 5y ≤ 10
(c) y + 3x > –6
3. (a) 3x < y + 6 (b) 1/2 x – 2y > 2
(c) y + 5/2 x ≤ –5
4. (a) x + y ≥ 3 (b) 4y – 3x > 0
(c) 5y – x < 15
4.2.5 Graphical solution of simultaneous linear inequalities
with two unknownsActivity 4.6
Using the same axis show the regions
(i) x + y > 3
(ii) 3x + 2y < 12
1. In each case, find the equation of the boundary line.
2. Draw the line, one at a time.
3. In each case show the required region by shading the unwanted
region.4. Denote the unshaded region with letter R.
When solving linear simultaneous equations, we look for values of the two
unknowns that make the two equations true at the same time. Similarly, linear
inequalities with two unknowns are solved to find a range of values of the two
unknowns which make the inequalities true at the same time. The solution is
represented graphically by a region. To identify the required region, we deal
with one inequality at a time to avoid confusion.5. What can you say about this region?
(i) Draw one line.
(ii) Identify the required region by shading the unwanted inequalities.
(iii) Repeat parts (ii) and (iii)for each of the given inequalities.
(iv) The unshaded region represents the set of the given inequalities.
Example 4.3 below illustrates the procedure of solving simultaneous
linear inequalities.Example 4.3
Draw the region which satisfies the following
inequalities simultaneously:
x > 0, y > 0, x + 2y ≤ 6
State the integral values of x and y that satisfy the inequalities.Solution
In Fig. 4.12, x + 2y = 6 (solid line),
x = 0 (broken line), y = 0 (broken line) are the boundary lines. All the ordered
pairs of values (x , y) that satisfy the three inequalities lie within the unshaded region.
Exercise 4.6
For questions 1 to 5, show the region defined by all inequlities in each question.1. x + y ≥ 0, x < 1, y > 1
2. 2x + 3y > 6, y > 0, x > 0
3. y – x < 0, x < 4, y ≥ 0
4. 3x + 5y > 15, 5x + 3y < 30, x > 0, y > 0
5. y ≥ 0, y < 4, 4x + 3y > 0, 5x + 2y < 15
6. On the same graph, represent the solution of the simultaneous
inequalities.
x <7, y < 5 and 8x + 6y ≥ 487. Use graphical method to solve the following inequalities simultaneously.
x ≥ 0, y ≥ 0, x + y ≤ 48. Draw on the same diagram to show the regions representing the following
inequalities.
5x + 4y < 60
3x – y > –6
8x + 3y ≥ 24
9. Find the points with integral coordinates which satisfy the
inequalities simultaneously
x ≤ 4, 3y ≤ x + 6 and 2x + 3y > 610. R is the region in a cartesian plane whose points satisfy the inequalities
0 ≤ x < 5, and 3 ≤ 3y + x < 9. Show R on the graph11. On the same graph show the region that is satisfied by the inequalities
x ≥ 0, y ≥ 0, x + y ≤ 12,
x + 2y ≤ 16 and y ≥ –4
3– x + 4
12. Use graphical method to solve simultaneously the inequalities
x ≥ 0, y ≥ 0 and x + y ≤ 413. A region R is given by the inequalities
x ≤ 6, y ≤ 6, x + y < 9 and 6x + 5y ≥ 30
Represent this region graphically and list all the points in the region which
have integral coordinates.4.2.6 Linear inequalities from inequality graphs
Activity 4.7
Consider the graph of line l in Graph4.24
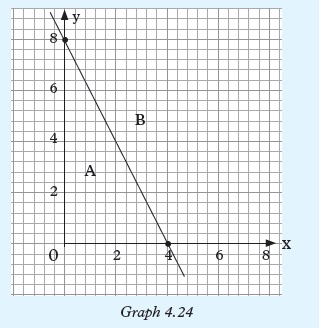
1. State the coordinates of at least five points on the line.
2. Use any two points to calculate the gradient of the line.
3. Find the equation of the line.
4. Describe the two regions A and B with reference to the line l.
Now consider graph 4.25.
Below, line L divides the Cartesian plane
into two regions, the shaded and the unshaded.
In order to form an inequality from a given graph, we must be able to identify the
line and find its equation first, and then proceed as per the following discussion:
(i) We find the equation of: line l that defines the region. For example, line
l passes through many points (x, y). Using points such as (1, 1), (2, 2)…,
we find gradient = 2 – 1/2 – 1 = 1
General equation of a line is given by
y = mx + c where m is the gradient and c is the y-intercept of the line. Thus
m = 1, c = 0. Therefore the equation of the line is y = x.(ii) Identify the required region. By convention, we shade the unwanted
region. Thus we are interested in the unshaded region i.e. finding
an inequality that describes the unshaded region.(iii) Identify a point (x, y) on the plane, in the unshaded region, which is clearly
not on the line i.e. (2, 3). Substitute the values of x and y in the
equation, one value at a time using equation y = x and point (2, 3), LHS = 3
RHS = 2
We see that the value on the LHS is greater
than that of the RHS i.e. 3 > 2.
This means that for all the points (x, y) in
the unshaded region, y > x.
Since the line is drawn solid, it means
points on the line should also be included
in the required region.
Therefore, the required region is described
by the inequality y ≥ x.Example 4.4
Write down the inequalities which are
satisfied by the unshaded region in graph 4.26.
Solution
Line L1 is the x-axis i.e. y = 0 (solid line)
Points required are on the line or above it.∴ the inequality is y ≥ 0
Line L2 is a solid line.
Let L2 be y = mx + c.
Since L2 intersects y-axis at y = 2 thus,
c = 2.
Point (2, 4) is on line L2 . Substituting it
in the equation of the line;y = mx + c becomes 4 = 2m + 2
⇒ m = 1∴ Equation of L2 is y = x + 2 or y – x = 2
Point (2, 2) is on the wanted region. To
know the inequality sign (i.e. < or >) we substitute(2, 2) in the equation. Thus
y = x + 2 becoms 2 = 2 + 2The result shows 2 < 2 + 2 thus, y < x + 2
Since L2 is a solid line, the inequality is
y ≤ x + 2 or y – x ≤ 2.
Equation of line L3: y = mx + c
L3 cuts the y – axis at y = 6, thus , c = 6.
Also, point (10, 0) is on line L3.
Exercise 4.7
1. Write down the inequalities satisfied by the region in graph. 4.27.

2. Write down the inequalities satisfied by the unshaded region R in Graph.
4.28.
3. Use Graphs 4.29, 4.30 and 4.31 to find the equations of the boundary lines and
hence find the inequalities that satisfy the unshaded regions.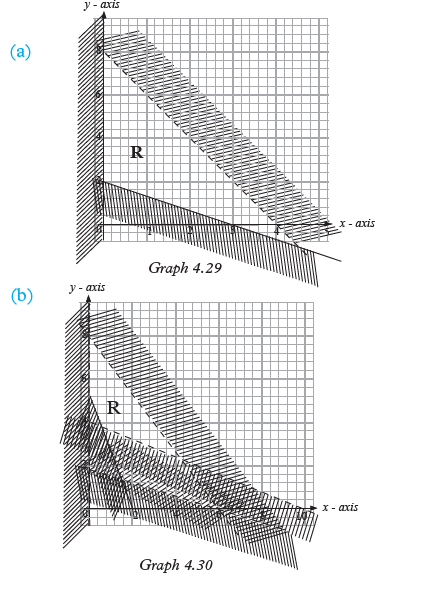
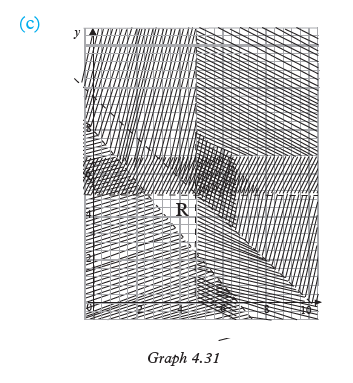
Unit Summary
• To solve simultaneous equations graphically, we draw graphs of lines,
representing the equations. If the equations have a unique solution, the
lines will intersect at a point whose coordinates represent the solution
set. If equations have no solutions, the lines will be parallel. If the equations
have an infinite solutions set, the lines will be coincident. This means
that any value of the variable you substitute will satisfy the equations.• When forming simultaneous equations from a given situation, we begin by
defining the variables we intend to use, then relate the two variables using
the given information and solve the equations as recommended.• Unlike in equations which have unique solutions, inequalities have a region
for the solution set. The solutions may have closed or an open region.
Remember:-
The unshaded region R satisfies the inequality 3y + 4x ≥. This is
the example of an open region.
The unshaded region R satisfies the
inequalities y ≤ 3, x ≤ 3 and x + y ≥ 3. R is an example of a closed
region.Remember:
• A line divides the Cartesian plane or any other plane into 2 regions.• If also divides a plane into 3 sets of points i.e points on the line,
and points on either side of the line each of which is defined by inequality rule.Remember the meaning of expressions such as
x<a, x≤a, y>b, y≥b, ax + by <c or x > c with reference to regions in
inequalities.• Inequalities can be formed from given:
(i) inequality graphs
(ii) situations.
Forming inequalities from graph:
(i) Identify the boundary line.
(ii) Find the equation of the line.
(iii) Using a point not on the line
substitute the coordinates of the
chosen point in the equation in order to determine the
required region. Remember that by convention, we shade
the unwanted region in order to leave the wanted region clean.Unit 4 Test
1. Find the solution of each of the equations, graphs represented in the
following graphs.
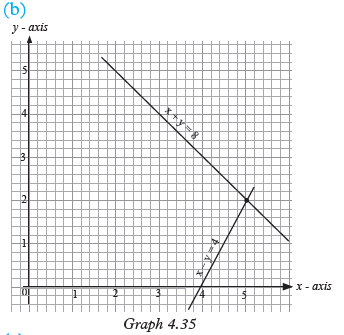
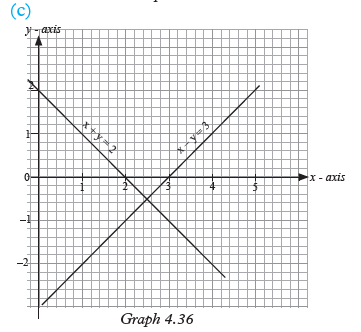
2. For which simultaneous equations is the ordered pair (3, –2) a solution?
(a) x + y = 1 (b) 2x + y = 4
x – y = 5 2y – x = -6(c) 3x = 5 – 2y
x + y = 13. Draw the graphs of x + 2y = 8 and x – 2y = –4 on the same axes. Use
your graph to find the solution of the simultaneous equations x + 2y = 8 and
x – 2y = –4.4. Use graphical method to solve the following equations.
(a) x +2y = 15 (b) 2x = y – 5
2x – y = 0 y = x – 35. The sum of James’ and David’s ages is 34 years. Five years ago, the sum
of twice James’ age and three times David's age was 86 years. Using an
appropriate variable for each age, form a pair of simultaneous equations and
solve them to find the respective ages of the two boys.6. Dan bought 5 boxes of sweets and 3 bags of candies for 1 205 FRW. If the
cost of boxes and bags were reversed, the cost would have been 1 107 FRW.
Find the cost of 1 box of sweets and 1 bag of candies.7. For each graph below write the inequalities that satisfy the unshaded
region marked R.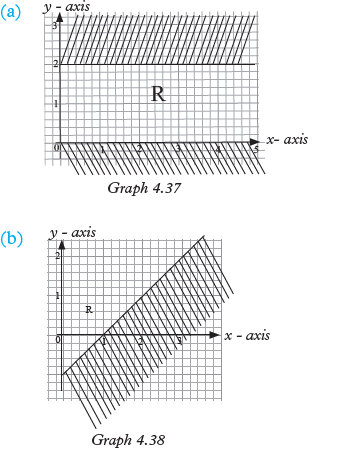
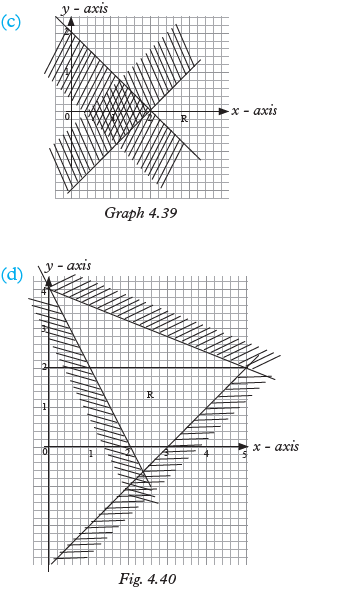
8. (a) Draw the region given by the inequalities x > 0,
5x + 4y < 32, x +2y>10.(b) State the coordinates of the vertices of the region in (a).
Unit 5 :QUADRATIC EQUATIONS
Key unit competence: By the end of this unit, learners should be able to solve
quadratic equations.Unit outline
• Definition and examples of quadratic equations.
• Solving quadratic equations.
• Problems involving quadratic equations.
Introduction
Unit Focus Activity
1. Use your knowledge of solving equations to solve the following
real- life problem. “A number of people planned to
contribute a total of 800 000 FRW to start a small self help groups
from where they could be getting small loans to boost their business.
They agreed to contribute each an equal amount of money. Four of
them withdrew from the venture. As a result, each of the remaining
people had to contribute 10 000 FRW more to reach the target”.
Determine the:(a) Original number (x) of people in the venture.
(b) Amount of money each contributed after the withdrawal
of the four.2. Compare your answer with those of other classmates during the class
presentations. Financial matters!
Pooling finances together for mutual benefit is one of the most successful ways
of empowering one another financially.There is strength and security in numbers. Advice your working parents,
siblings, friends and neighbours about it. Consider joining one as soon as you
finish schooling.5.1 Definition and examples of quadratic equations
Activity 5.1
1. Expand the following expressions.
(a) 3(5x + 6)
(b) (x – 5)(x – 2)
(c) (x – 1)(x + 2)(x – 3)
2. State the highest power of the unknown in each of the expression
in (1) above.3. Which of the expressions in question (1) above are quadratic?
A quadratic expression has the general form ax2 + bx + c where a, b and c are
real numbers. It is a polynomial of order 2. Examples of quadratic expressions include
x2 + 3x + 1, a2 + 2a, y2 – 2y + 1, c2 – 4 etc. The general form of a quadratic equation
is ax2 + bx + c = 0, where a, b and c are real numbers. Examples of quadratic
equations are: x2 + 3x + 1 = 0, x2 – 9 = 0, x2 – 5x + 6 = 0 etc.Exercise 5.1
Expand each of the expression and state
whether it is quadratic or not:
1. (a) (x + 3)(x + 1)(b) (x + 2)(x – 4)(x – 1)
(c) (x – 7)(x + 3) (x – 1)
(d) x(x – 4)(x – 3)
(e) (a2 + 8)(a – 3)
(f) (p + 2)(p – 5)
2. Which of the following belongs to quadratic expressions? Circle the
correct expression.(a) (x3 – 5)(0 + 4)
(b) (x + 5)(x + 4)
(c) (x + 2)(5 a + 3)/x – 1
(d) (3x + 2)(x – 4)
(e) (2x – 7)(4x – 3)
(f) (x + 3)(x + 3)
3. Write true/false in front of an expression if it is quadratic.
(a) (a – 4)(a2 – 4)
(b) 6(x + 7)(x)
(c) (5t + 3)(3t + 2)
(d) (2 – x)(3 – x)
(e) (3 + p)(5 – p)
(f) (4 – 2y)(1 – 3y)
(g) (3x + 1)(8 – 2x)
4. A man bought a certain number of shirts for 2 000 FRW. If each shirt
had cost 200 FRW less, he could have bought five more for the same money.(a) Form and simplify an expression from the above information.
(b) What name can be given to the above expression?
5. The perimeter of a rectangle is 42 cm. If the diagonal is 15 cm;
(a) Form an expression that relates the perimeter, diagonal, length
and width of the rectangle.(b) What special name is given to the expression in 5(a) above?
5.2 Solving quadratic equations
Quadratic equations are solved using the
following methods:• Factorisation method
• Graphical method
• Completing squares method
• Quadratic formula method
5.2.1 Quadratic equations by factorisation method
5.2.1.1 Factorising quadratic expressions
Activity 5.2
1. What do you understand by theterm “factorise”?
2. Factorise the following quadratic expressions:
(a) x2 + x (b) 4x2 + 2x
(c) x2 – 4
3. Factorise by grouping
x2 + 2 x + 3x + 6. Hence.
factorise x2 + 5 x + 6.4. Using the fact you have learnt in 3 above, factorise x2 – x –12.
In order to find the factors of an expression such as ax2 + bx, we look for the factors
that are common in both terms. The common factors of ax2 and bx is x.
Thus, ax2 + bx = x(ax + b). Therefore, the factors of ax2 + bx are x
and (ax + b). This means, ax2 + bx can be factorised as x(ax + b).
The process of finding the factors of an expression is called factorisation. This
is the reverse of expansion.Consider
(x + a)(x + b) = x(x + b) + a(x + b)
= x2 + bx + ax + ab
= x2 + (a + b)x + ab
The expressions (x + a) and (x + 6) are the factors of x2 + (a + b)x + ab. Similarly:
(x + 3)(x + 4) = x(x + 4) + 3(x + 4)
= x2 + 4x + 3x + 12
= x2 + 7x + 12.
The last expression shows the relationship between the terms of the quadratic
expression and its factors. Thus, a constant term ab of a quadratic expression is the
product of the number terms a and b. Whereas, the coefficient of x is the sum of
a and b. We can use these facts to factorise quadratic expressions.Consider the expression x2 + 10x + 21.
We can factorise it as follows;
Compare x2 + 10x + 21 and(x + __)(x + __), considering
x2 + (a + b)x + ab = (x + a)(x + b).
This means
x2 + 10x + 21 = x2 + (a + b)x + ab.
We need two numbers a and b such that a + b = 10 and ab = 21.Clearly, a and b are factors of 21 whose
sum is 10. These are 3 and 7.
Rewriting:
x2 + 10x + 21 as x2 + (3 + 7)x + 21 gives x2 + 3x + 7x + 21.
= x(x + 3) + 7(x + 3) (factoring
common terms)
= (x + 3)(x + 7).
Therefore, x2 + 10x + 21 = (x + 3)(x + 7).
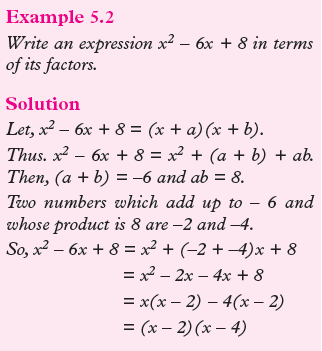

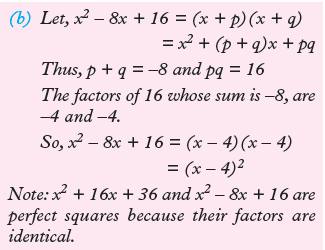
When factorising a quadratic expression of the form ax2 + bx + c we get two factors
whose sum is b and the product is ac. Consider a quadratic expression
6x2 + 5x – 4. It can be factorised as follows:
Comparing 6x2 + 5x – 4 to ax2 + bx + c, we find out that a = 6, b = 5 and c = –4.
We then get two values whose product is –24 and whose sum is 5 ie ac = –24 and
a + b = 5. These values must be the factors of –24 and they are –3 and 8.
We then write 6x2 + 5x – 4 = 6x2 + (8 – 3)x – 4
= 6x2 + 8x – 3x – 4.
By factorizing out the common factors,
We get
6x2 + 8x – 3x – 4 = 2x(3x + 4) – 1(3x + 4).
So, 6x2 + 8x – 3x – 4 = (2x – 1)(3x + 4)Example 5.4
Write down 7 + 3x2 – 22x in terms of its factors.
Solution.
Rearranging the terms,
7 + 3x2 – 22x = 3x2 – 22x + 7
We have the coefficients a = 3, b = –22
and c = 7.
Sum is -22 and product is 21. The two factors that can add to give –22 andmultiplyto give 21 are –21 and –1.
We write 3x2 – 22x + 7 = 3x2 – 21x – x + 7.
By factorising,
3x2 – 21x – x + 7 = 3x(x – 7) – 1(x – 7)
= (3x – 1)(x – 7)Exercise 5.2
1. Factorise the following expressions:
(a) x2 + 6x + 8
(b) x2 – 8x + 15
(c) x2 + 2x – 35
(d) x2 – 9
(e) x2 – 49
(f) x2 + x – 12
2. Can the following expressions factorise ? Write YES or NO for the
results.(a) x2 + 9x + 14
(b) x2 – 11x – 12
(c) 5u2 + 6u + 9
(d) 2t2 – t – 42
3. A man bought a certain number of shirts for 2 000 FWR. If each shirt
had cost 200 FWR less, he could have bought five more for the same
money.(a) Form and simplify an expression from the above information.
(b) What name can be given to the above expression?
(c) Factorise the expression obtained in 3(b) above.
4. The perimeter of a rectangle is 70 cm. If the diagonal is 25 cm:
(a) Form an expression that relates the perimeter, diagonal, length
and width of the rectangle.(b) Factorise the expression obtained in 4(a) above.
5.2.1.2 Solving quadratic equations by factorisation method.
Activity 5.3
1. Given that (x – 2)(x + 3) = 0, what are the possible values of (x – 2)
and (x + 3)? Obtain the values of x for each expression.2. Given that (x + 4)(x + 6) = 0, find two possible values of x.
3. Factorise completely 4x2 – 2x. Hence find the values of x given
that 4x2 – 2x = 0. (Hint: Use the idea learnt above.)In order to solve a quadratic equation, the quadratic expression is factorized
so that the equation is in the form (x + a)(x + b) = 0.
Then either (x + a) = 0 or (x + b) = 0.
Thus x = –a and x = –b.Example 5.5
Solve: (x – 4)(x + 1) = 0
Solution
If(x – 4)(x + 1) = 0, then either x – 4 = 0
or x + 1 = 0.
Therefore, x = 4 or x = –1.
Hence the roots of the equation
(x – 4)(x + 1) = 0 are 4 or –1.Example 5.6
Solve the equation x2 + 7x + 6 = 0.
Solution
x2 + 7x + 6 = 0
Factorizing, x2 +7x + 6, gives
(x + 6)(x + 1) = 0.
Therefore, x + 6 = 0 or x + 1 = 0;
Which means x = –6 or x = –1Example 5.7
Solve: x2 – x – 29 = 1
Solution
Always ensure that the quadratic expression is equated to zero. This is the only time the
method used in these examples can apply.
Thus, x2 – x – 29 = 1 should be rewritten
as x2 – x – 29 – 1 = 0. That is,
x2 – x – 30 = 0.
The factors of –30, whose sum is –1 and product –30, are –6 and 5.
We write x2 – 6x + 5x – 30 = 0
We then factorise and get,
x(x – 6) + 5(x – 6) = (x – 6)(x + 5) = 0.
Either x – 6 = 0 or x + 5 = 0.
x = 6 or x = –5.
The roots are –5 or 6.Example 5.8
Solve:
(a) x2 – 49 = 0 (b) x2 – 6x = 0Solutions
(a) x2 – 49 = 0 can be written as
x2 – 72 = 0
(x – 7)(x + 7) = 0
x – 7 = 0 or x + 7 = 0
x = 7 or x = –7.
The roots are -7 or 7.(b) Factorizing x2 – 6x = 0 gives
x(x – 6) = 0
Either x = 0 or x – 6 = 0
x = 0 or x = 6
The roots are 0 or 6.Example 5.9
Solve the quadratic equation.
6x2 + 5x – 4 = 0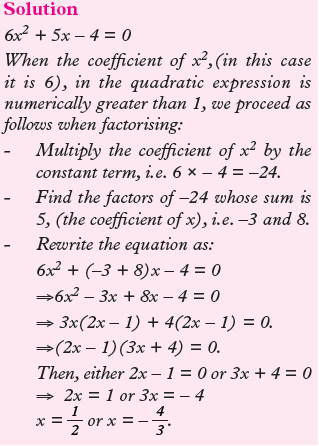
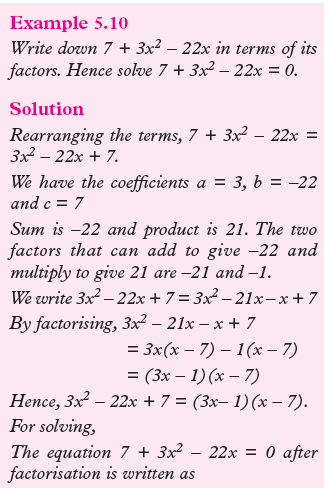
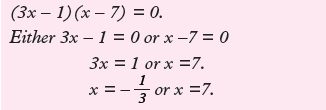
Exercise 5.3
1. Obtain the values of x from the following expressions.
(a) (x + 4)(x + 2) = 0(b) (x – 5)(x – 3) = 0
(c) (x – 5)(x + 7) = 0
(d) (x2 – 9) = 0
2. Factorise the following expressions hence find the values of unknowns.
(a) x2 + 9x + 14 = 0(b) x2 – 11x – 12 = 0
(c) u2 + 6u + 9 = 0
(d) t2 – t – 42 = 0
(e) a2 – 2a + 1 = 0
(f) y2 + 8y = 0
3. Can the following equations be solved by factorisation? Write True/
False and write down the solution set of equation.
(a) x2 + 10x = 24(b) x2 = 4x – 3
(c) 6x2 – 29x + 35 = 0
(d) 6x2 – x + 1 = 0
5.2.2 Solving quadratic equations by graphical method
Activity 5.4
Complete the following tables of values
for;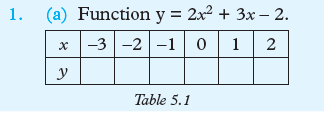
(b) Function y = x2 +3x + 6.

2. State the coordinates in 1 (a) and 1(b) in ordered pairs (x, y).
3. Plot the graphs for 1(a) and 1(b) on different Cartesian planes.
4. For each graph, read and record the x-coordinate(s) of the point(s)
where the graph cuts x-axis.5. Solve the equations 2x2 + 3x – 2 = 0 and x2 + 3x + 6 = 0 by factorisation
method.In a quadratic function graph, the x-coordinate of the point where the
graph cuts x-axis gives the solution to the quadratic equation represented by the
function.1. When the graph cuts the x-axis at one point, then the equation has one
repeated solution.2. When the graph cuts x-axis at two points, then the equation has two
different solutions.
3. When the graph does not cut x-axis at any point, then the equation has no
solution in the field of real numbers.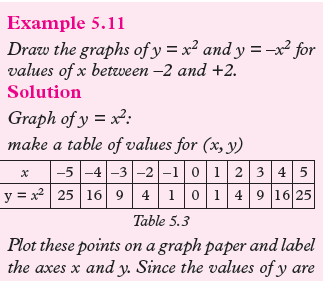
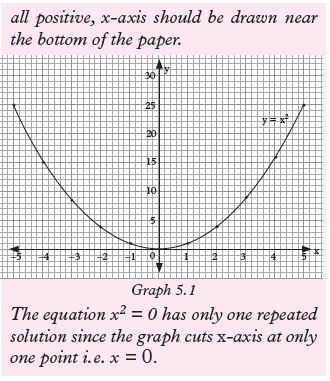
The graph of y = –x2
All values of y are numerically the same as the corresponding values of y in y = x2
but are negative. The shape of the curve will be the same but inverted.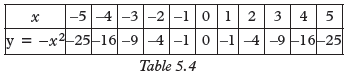
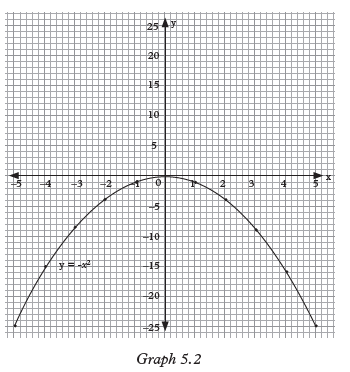
The equation x2 = 0 has only one repeated solution since the graph cuts x-axis at only
one point i.e. x = 0.
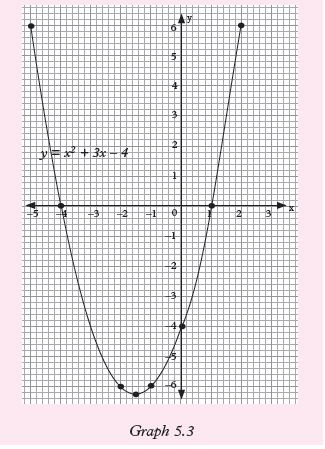
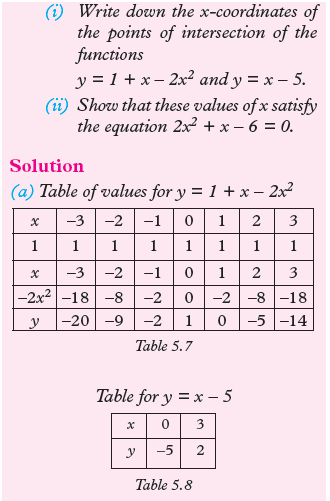

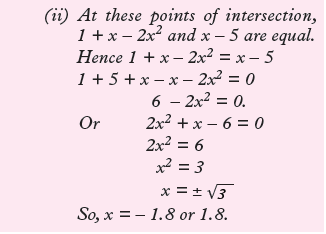
Exercise 5.4
1. Plot the graph of y = x2 – 4x + 4 for values of x from -1 to +5. Solve from
your graph the equations:
(a) x2 – 4x + 4 = 0(b) x2 – 4x + 1 = 0
c) x2 – 4x - 1 = 0.
2. Plot the graph of the function
x2 – 6x + 5 for –1 < x < 7. Use your
graph to solve the equation
x2 – 6x + 5 = 0.3. Draw the graph of y = 2x2 – 7x – 2 for
values of x from -3 to +3. Use your graph to solve the equations:
(a) 2x2 – x = 4,(b) 2x2 – x + 6 = 0
(c) 2x2 – x – 4 = 2x.
4. Plot the graph of y = 1
4 x2 for domain
–4 < x < 4. Using the same scale and
axes, draw the curve of y = 1/4 x2 – 3.5. Plot the graph of the function
y = 2 – x – x2 from domain –3 < x < 3.
Use your graph to solve the equation
x2 + x = 2.6. Draw the graph of the function
y = 2x2 – 7x – 2 for values of x from
–1 to 5. By drawing suitable lines on
the same axes, solve, where possible,
the following equations:
(a) 2x2 – 7x = 2,(b) 2x2 – 8x + 4 = 0
7. Copy and complete the following
table of values for y = 6 + 3x – 2x2.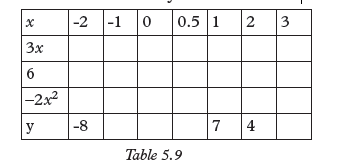
Draw the graph of y = 6 + 3x – 2x2
for domain –2 < x < 3.
Use the graph to obtain solutions of
the equations:(a) 6 + 3x – 2x2 = 0
(b) 2 + 3x – 2x2 = 0
(c) 3 + x – 2x2 = 0.
8. Plot the graph of y = x2 – x – 2 after completing the following table for
values of x and y.
By drawing a suitable straight line on your graph, solve the equation
x2 – 2x = 0.9. Draw the graph of y = ( 1/2 x – 3)(x + 3)
for domain –3 < x <4.
From your graph find the values of x
for which ( 1/2 x - 3)(x + 3) = 2.10. Plot the graph of the function
y = x2 – 3x for domain –1 < x < 4.
Use your graph to find:(a) The range of values of x for which
the function is negative.(b) The solutions of the equations
x2 – 3x = 1 and x2 – 2x – 1 = 0.11. Given that y = (3x + 1)(2x – 5), copy and complete the following table for
values of x and y.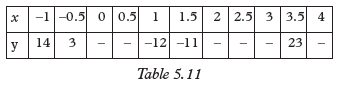
Plot the graph of y = (3x + 1)(2x – 5) from x = –1 to x = 4.
By considering the points of inter-section of the two graphs, a
certain quadratic equation in x can be solved. Write down and simplify
the equation and obtain its roots from the graphs.5.2.3 Solving quadratic equations by completing squares
method5.2.3.1 Perfect squares
Activity 5.5
Determine whether the following
quadratic expressions are perfect
squares or not.
(a) x2 + 8x + 16(b) x2 + 10x + 12
(c) 9x2 + 6x + 1
(d) 36x2 – 8x + 4
Recall that:
1. (a + b)2 = a2 + b2 + 2ab, and2. (a – b)2 = a2 + b2 – 2ab
The right hand sides of 1 and 2 are the expansions of the squares on the left hand
sides. Such expressions are called perfect squares. They may be written in words as:1. The square of the sum of two numbers is equal to the sum of their
squares plus twice their product.2. The square of the difference of two numbers is equal to the sum of their
squares minus twice their product.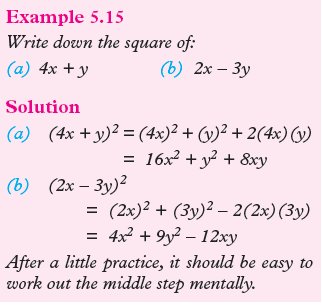
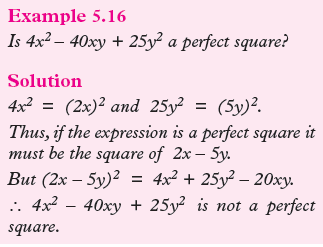
Note:
Instead of expanding (2x – 5y)2 in order to
compare the middle term with that of the given expression, we could alternatively
first check if –40xy is equal to 2(2x)(–5y). In this case, it is not. This indicates that
4x2 – 40xy + 25y2 is not a perfect square.Example 5.17
Complete 9p2 – 12pq + 4q2 =
2.
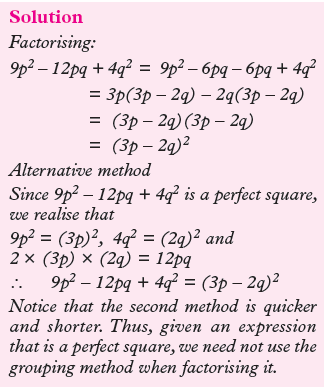
Exercise 5.5
1. Write down the squares of the following.
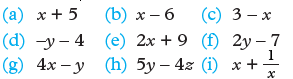
2. State whether each of the following expressions is a perfect square. If it
is, write it in the form (a + b)2 or (a – b)2.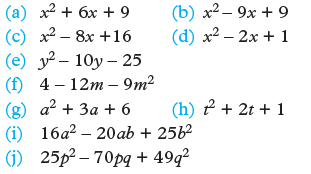
5.2.3.2 Completing squares and solving quadratic equations
Activity 5.6
1. What must be done to make the following quadratic expressions
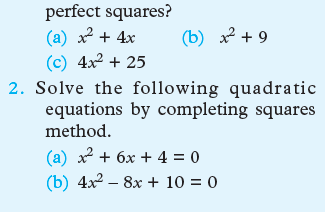
Completing the square when the coefficient of x2 is one
The quantity to be added is the square of half of the coefficient of x (or whatever
letter is involved), i.e. to make x2 + bx a perfect square, we add ( b/2 )2
to get
x2 + bx + ( b/2 )2= (x + b/2 )2
, where b is any positive or negative number.In some cases, it is not possible to solve a quadratic equation by the method of
factorisation because the LHS does not factorise. In such a case, we first rearrange
the equation to make the LHS a perfect square, i.e. we complete the square on
the LHS.If LHS of an equation factorises, it is better to use the method of factorisation
instead of completing the square.Example 5.18
What must be added to x2 + 8x to make
the result a perfect square?Solution
Suppose x2 + 8x +k is a perfect square and
that it is equal to (x + a)2, i.e.
x2 + 8x + k = (x + a)2.
We know that(x + a)2 = x2 + 2ax + a2
∴ x2 + 8x + k = x2 + 2ax + a2.
The expression on the LHS and that on the
RHS can only be equal if the corresponding
terms are equal.
Comparing coefficients of x:
2a = 8
∴ a = 4.
Comparing the constant terms:
k = a2 = 42 = 16.∴ 16 must be added to the expression x2 + 8x.
Then x2 + 8x + 16 = (x + 4)2.Check by opening the bracket on the RHS!
Example 5.19
Find the term that must be added to p2 – 6p
to make the expression a perfect square.
Solution
Suppose p2 – 6p + k is a perfect square.
Then, p2 – 6p + k = (p – a)2
i.e. p2 – 6p + k = p2 – 2ap + a2
Comparing coefficients of p:
–2a = –6
∴ a = 3.
Comparing the constant terms:
k = a2 = 32 = 9
∴ 9 must be added to the expression.
Then, p2 – 6p + 9 = (p – 3)2.Note:
In Example 5.18, the coefficient of x is 8;
half of 8 is 4; and the square of 4 is 16.
Hence, 16 must be added.In Example 5.19, the coefficient of p is –6;
half of –6 is –3; and the square of –3 is 9.
Hence, 9 must be added.Example 5.20
Solve the equation x2 + 8x + 9 = 0.

Example 5.21
Solve the equation q2 – 5q – 2 = 0.

Exercise 5.6
1. What term must be added to each of the expressions below to make the
expression a perfect square? Write
each expression as (a + b)2 or (a – b)2.(a) y2 + 10y (b) x2 – 8x
(c) p2 + 6pq (d) d2 + 5d
(e) a2 – 12ab (f) q2 – 7q
(g) n2 + n
2. Solve the equations below by factorising where possible, otherwise
by completing the square. Do not put the answer in decimal form.(a) x2 – 4x – 21 = 0
(b) y2 + 3y – 10 = 0
(c) x2 + 3x – 11 = 0
(d) d2 + 4d – 4 = 0
(e) p2 + 3p – 2 = 0
(f) 25 – 10x + x2 = 0
(g) n2 – 14n + 2 = 0
Completing the square when the coefficient of x2 is not equal to one
If the quadratic equation is of the form
ax2 + bx + c = 0, where a ≠ 1 and the LHS does not factorise, first divide both sides
by a to make the coefficient of x2 one and then complete the square.Example 5.22
Solve the equation 2x2 + 14x + 9 = 0,
giving your answer correct to 3 d.p.Solution
2x2 + 14x + 9 = 0
First make the coefficient of x2 one by dividing both sides by 2.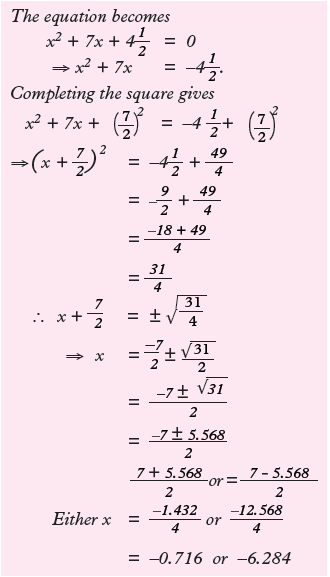
Exercise 5.7
1. Solve the following quadratic equations by completing squares
method.
(a) x2 – 2x – 8 = 0(b) x2 – 5x + 2 = 0
(c) x2 + 2x – 8 = 0
(d) x2 + 2x – 1 = 0
(e) 2x2 – 10x = 0
(f) 2x2 + 6x + 1 = 0
2. Complete the squares in the following expressions.
(a) x2 – 8x – 7 = 0(b) 2x2 + x – 6 = 0
(c) 2x2 – 5x + 2 = 0
(d) x2 + 4x = 0
(e) 3x2 – 2x – 6 = 0
(f) x2 + 1/2 x = 0
3. Solve the following equations by factorisation if possible, otherwise by
completing the square. Give your answers to 2 d.p. where necessary.
(a) 2x2 – 3x = 9(b) 2y2 – 4y + 1 = 0
(c) 2b2 + b + 1 =0
(d) 4x2 – 8x = – 1
(e) 4p2 – 8p + 3 = 0
(f) 4p2 = 8p + 3
(g) 3e2 = 9e – 2
(i) 5x2 = – 1 – 15x
(j) 2z2 + 10z + 5 = 0
5.2.4 Solving quadratic equations by using formula method
Activity 5.7
1. Use the steps that are applied in solving quadratic equations by
completing squares to obtain the values of x in terms of a, b and c
for which px2 + qx + r = 0(a) First divide the whole equation by p to make the coefficient of x2 be one.
(b) Solve for the value of x by completing the square.
(c) Make x the subject of the formula.
2. Use the expression you obtained in step 1 to solve the equation
2x2 – 3x – 4 = 0 by substituting
p = 2, q = –3 and r = –4.3. Solve the quadratic equation
2x2– 5x + 3 = 0 by factorization method.4. Compare your results for step 2 and step 3. What do you notice?
Consider the quadratic equation ax2 + bx + c = 0. Let us solve by
completing square method.1. Make sure the coefficient of x2 is one. This is done by dividing by a
throughout the given equation.
2. Half the coefficient of x, square it and subtract it from the given expression.
3. Take the constant part to the right hand side and find the square root
both sides and solve for the values of x.
Simplifying the expression under the square root using LCM and taking square
root of denominator we get
This formula is called the quadratic formula and it is used to solve any
quadratic equation provided the coefficients a, b and c are all known.
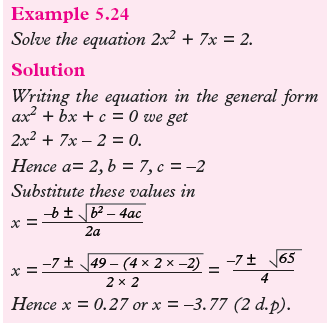
Exercise 5.8
1. Solve the following with the aid of quadratic formula, giving answers to
two decimal places where necessary:
(a) 2x2 + 11x + 5 = 0(b) 3x2 + 11x + 6 = 0
(c) 6x2 + 7x + 2=0
(d) 3x2 – 10x + 3 = 0
(e) 5x2 – 7x + 2 = 0
(f) 6x2 – 11x + 3 = 0
(g) 2x2 + 6x + 3 = 0
2. From the questions below, circle the correct solution.
(a) When the quadratic equation
2x2 + 5x – 3 = 0 is solved, the results obtained are;
(i) –3 and 2 (ii) –3 and 1/2(iii) 4 and – 2 (iv) 6 and –1
(b) The equation 2x2 – x – 6 = 0 when solved gives the values of x as;
(i) 2 and –3 (ii) –1 and 3
(iii) 3 and –2
(iv) None of the above
(c) Which of the solutions below is suitable solution for
2x2 + 3x – 5 = 0?(i) –2.5 and 1
(ii) –1.5 and 3
(iii) –3.4 and –2
(iv) None of the above
3. Write true/false for the statements
below.
(a) 1 and 9 are the solutions to x2 – 10x + 9 = 0(b) 3x2 – 10x + 3 = 0 is a perfect square
(c) x2 + 9x + 14 = 0 has no solution in the field of real numbers
(d) x2 + 5x – 500 = 0 has two solutions one is positive and
another is negative(e) The equation x2 – x – 12 = 0 cannot be solved by factorisation
method5.2.5 Solving Quadratic equations by synthetic division method
Activity 5.8
Use internet or library to research about factorisation of quadratic equations and
polynomials by using Horner’s rule. List the steps that are followed using
your own words.Consider the quadratic equation
ax2 + bx + c = 0.
To solve this quadratic equation, we proceed as follows:Steps

3. Identify all the factors of the constant c both positive and negative. Let the
factors of c be e, f, g, h etc. Choose the factor of c which can
reduce the quadratic expression to zero. Let the factor of c be f. This
means that f is one of the solutions of the quadratic equation provided. i.e.
x = f and the linear factor is (x – f)4. Arrange the coefficients and the factor f as shown below.
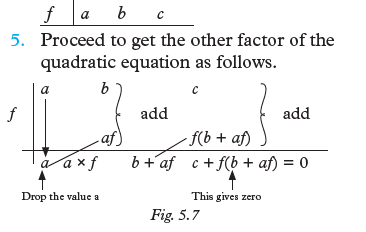
For vertical patterns, add terms while for the diagonal patterns, multiply by factor f.
Hence on dividing the expression ax2 + bx + c by (x – f), we should get the
other factor (quotient) as ax + (b + af). Thus the quadratic equation ax2 + bx + c
= (x – f)(ax + (b + af) in factorised form.
We therefore solve the values of x from the factors (x – f)(ax + (b + af)) = 0, meaning
x – f = 0 and ax + (b + af) = 0Example 5.25
Solve the quadratic equation x2 – x – 6 = 0 using synthetic division method.
Solution
The factors of 6 are ±1, ±2, ±3 and –6. The factor of -6 that can reduce the quadratic
equation to zero is 3.
Example 5.26
Solve the quadratic equation
3x2 – 5x – 2 = 0 by synthetic division method.
Exercise 5.9
Solve the following quadratic equations by synthetic division method.
1. x2 + x – 12 = 02. x2 + 9x + 14 = 0
3. u2 + 6u + 9 = 0
4. a2 – 2a + 1 = 0
5. x2 + 10x = 24
6. v2 – 36 = 0
7. x2 – 11x – 12 = 0
8. t2 – t – 42 = 0
9. y2 + 8y = 0
10. x2 = 4x – 3
11. 4x2 – 9 = 0
5.3 Problems involving quadratic equations
Activity 5.9
A 3 hour cruise ship goes 15 km upstream and then back again. The
water in the river has a speed of 2 km/h. Let x represent the speed of the ship.(a) Write down an expression for the speed of the ship upstream.
(b) Write down an expression for the speed of the ship downstream.
(c) Find expression for the time taken by the ship to move up and
downstream.(d) Write down and simplify an expression for the total time taken by the ship to move up and
downstream.(e) What name can be given to the expression obtained in (d) above?
(f) What is the ship’s speed and how long was the upstream journey?
Quadratic equation can be modelled out of a well given data. There is no clear
and specific method for this apart from reading and understanding the problem
word by word and then applying what you have understood to model out a correct
mathematical expression.Example 5.27
The perimeter of a rectangle is 46 cm. If the diagonal is 17 cm, find the width of
the rectangle.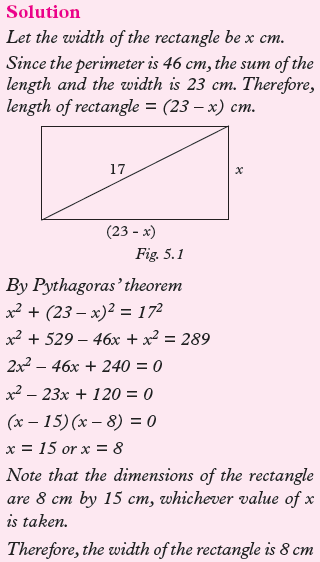
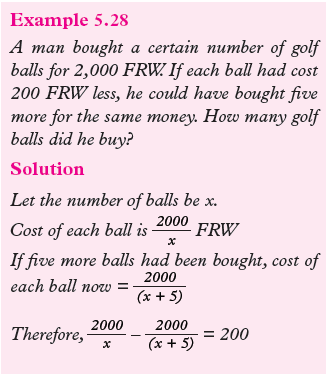
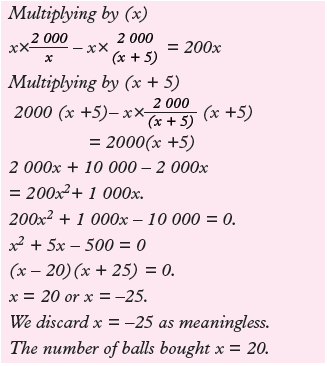
Exercise 5.10
Solve by forming a quadratic equation:
1. Two numbers which differ by 3,have a product of 88. Find the two
numbers.2. The product of two consecutive odd numbers is 143. Find those two odd
numbers.3. The length of a rectangle exceeds the width by 7 cm. If the area is 60 cm2,
find the length of the rectangle.4. The length of a rectangle exceeds the width by 2 cm. If the diagonal is 10 cm
long, find the width of the rectangle.5. The area of the rectangle exceeds the area of the square by 24 m2. Find x.
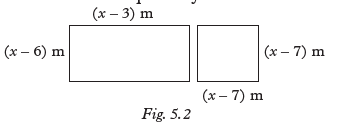
6. The perimeter of a rectangle is 68 cm. If the diagonal is 26 cm, find the
dimensions of the rectangle.7. A man walks a certain distance due North and then the same distance
plus a further 7 km due East. If the final distance from the starting point
is 17 km, find the distances he walks north and East.8. A farmer makes a profit of x FRW on
each of the (x + 5) eggs her hen lays. If her total profit was 84,000 FRW,
find the number of eggs the hen lays.9. A number exceeds four times its reciprocal by 3. Find the number.
10. Two numbers differ by 3. The sum of their reciprocals is 7/10 ; find the
numbers.Unit Summary
• A quadratic equation: This is an equation that is of the form
ax2 + bx + c = 0 where a, b and c are constants and a ≠ 0.
Examples of quadratic equations are
x2 + 9x + 14 = 0, u2 – 5u + 4 = 0,
7 – 6r + r2 = 0 etc.• Quadratic equations can be solved by the following methods.
• By factorisation method
• Graphical method
• Completing squares method
• Quadratic formula method
• Synthetic division method
• In order to solve a quadratic equation,
the quadratic expression is factorized
so that the equation is in the form
(x + a)(x + b) = 0.
Then either (x + a) = 0 or (x + b) = 0
Thus x = –a and x = –b• In a quadratic function graph, the x-coordinate of the point where the
graph cuts x-axis gives the solution to the quadratic equation represented
by the function.(a) When the graph cuts the x-axis at one point, then the equation
has one repeated solution.(b) When the graph cuts x-axis at two points, then the equation has
two different solutions.(c) When the graph does not cut x-axis at any point, then the
equation has no solution in the field of real numbers.• Before solving any quadratic equation by completing squares method, it is
better to understand what perfect squares are.
For example x2 + 6x + 9 = (x + 3)2 is a perfect square.
Remember that (a + b)2 = a2 + 2ab +b2 and that (a – b)2 = a2 – 2ab + b2• The quadratic formula
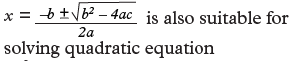
ax2 + bx + c = 0 provide the coefficients a, b and c are all known.
• The quadratic equation
ax2 + bx + c = 0 can also be solved by
synthetic division method as long as the value x = f is the factor of constant
c. We follow the trend below.
For vertical patterns, add terms while for the diagonal patterns, multiply by
factor f.
Hence, on dividing the expression
ax2 + bx + c by (x – f), we should get the other factor (quotient) as
ax + (b + af)
Thus the quadratic equation
ax2 + bx + c = (x – f)(ax + (b + af)) in factorised form.
We therefore solve the values of x from
the factors (x – f)(ax + (b + af)) = 0.
Meaning x – f = 0 and ax + (b + af) = 0Unit 5 Test
1. A cyclist travels 40 km at a speed of x km/h. Find the time taken in terms of
x. Find the time taken when his speed is reduced by 2 km/h. If the difference
between the times is 1 hour, find the value of x.2. A train normally travels 240 km at a certain speed. One day, due to bad
weather, the train’s speed is reduced by 20 km/h so that the journey takes two
hours longer. Find the normal speed.3. An aircraft flies a certain distance on a bearing of 135º and then twice
the distance o a bearing of 225º. Its distance from the starting point is
then 350 km. Find the length of the first part of the journey.4. In the following figure, ABCD is a rectangle with AB = 12 cm and
BC = 7 cm. AK = BL = CM = DN =
x cm. If the area of KLMN is 54 cm2 find x.
5. The numerator of a fraction is 1 less
than the denominator. When both numerator and denominator are
increased by 2, the fraction is increased1/12
. Find the original fraction.6. The perimeters of a square and a
rectangle are equal. One side of the rectangle is 11 cm and the area of the
square is 4 cm2 more than the area of the rectangle. Find the side of the square.7. In a right angled triangle PQR,∠Q = 90º, QR = x cm, PQ = (2x – 2)
cm and PR = 30 cm. Find x.8. Draw the graph of y = x2 – 4x + 4 for values of x from –1 to +5. Solve from
your graph the equations:
(a) x2 – 4x + 4 = 0(b) x2 – 4x + 1 = 0
(c) x2 – 4x – 1 = 0.
9. Solve the following quadratic equations by synthetic division method.
(a) x2 + x – 12 = 0(b) x2 + 9x + 14 = 0.
Unit 6: LINEAR AND QUADRATIC FUNCTIONS
this unit, learners should be able to solve problems involving linear and quadratic
functions and interpret the graphs of quadratic functions.Unit outline
• Linear functions
- Definition of linear functions.
- Slope/gradient of a linear function
- Cartesian equation of line
- Parallel and Perpendicular lines
• Quadratic functions
- Table of Values
- Vertex of a parabola and axis of symmetry.
- Intercepts
- Graph in Cartesian plane
Introduction
Unit Focus Activity
1. Consider line L1 that passes through points A(3, 10) and
B(6, 7) and L2 that passes through point C(1, 2) and D(3, 8).
Determine without drawing the line that is steeper.2. The straight line y = 3
2 x + 9 meets the y-axis at A and the x-axis at B.(a) State the coordinates of A and B.
(b) Find the equation of a line through A perpendicular to
y = 3/2 x + 9.(c) Find the equation of a line through B that is parallel to
y = 3/2 x + 9.3. (a) Draw the graph of the quadratic function
y = 2x2 + 5x – 9 for the values of x from –4 to 2.
Hence, solve the equation
2x2 + 5x – 9 = 0.(b) State the equation of the line of symmetry for the curve.
(c) Use your graph to solve the equations 2x2 + 3x – 4 = 0
6.1 Linear functions
6.1.1 Definition of linear functions
Activity 6.1
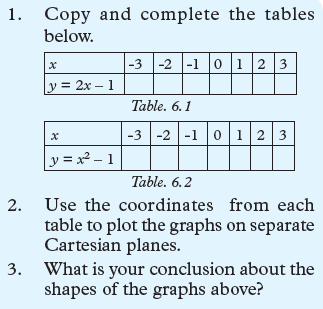
Any function of the form y = mx + c where constants m and c given is a straight line
graph when drawn in a Cartesian plane. Such functions are known as linear
functions. The constants can be zero or other integers.The highest degree of a linear function
is one.
Examples of linear functions are y = 2x,
y = 5x+ 4, 3x + y = 4, and so many others.6.1.2 Slope/Gradient of a linear function
Activity 6.2
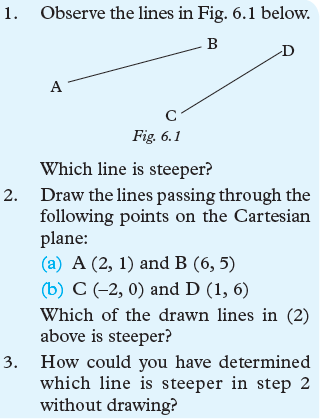
Activity 6.3
From the graph on the Cartesian plane below, answer the questions that follow.
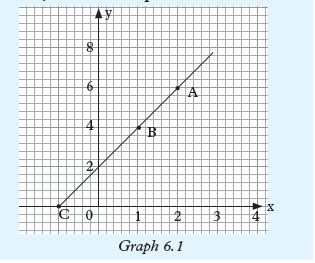
1. Read and record the coordinates of points A, B and C
2. Find gradient of AB and BC
3. What do you notice in part (2) above?
Every straight line has a slope with respect to the horizontal axis. The measure of the
slope is called the gradient.In the Cartesian plane, the gradient of a line is the measure of its slope or
inclination to the x-axis. It is defined as the ratio of the change in y-coordinate
(vertical) to the change in the x-coordinate (horizontal).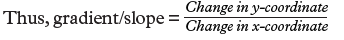
Consider a line passing through the points A (x1, y1) and B(x2, y2).
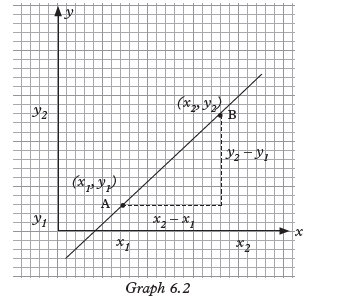
From A to B, the change in the x-coordinate (horizontal change) is x2 – x1 and the
change in the y-coordinate (vertical change) is y2 – y1. By definition, gradient/slope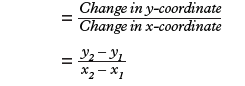
Or =y1 – y2/x1 – x2
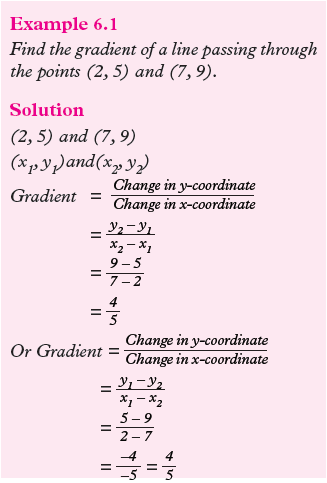
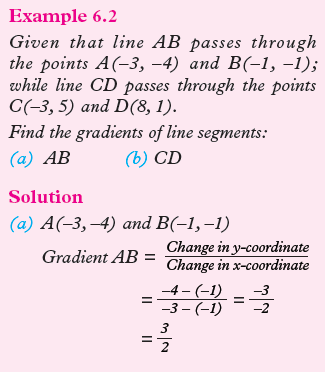
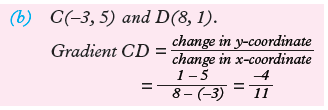

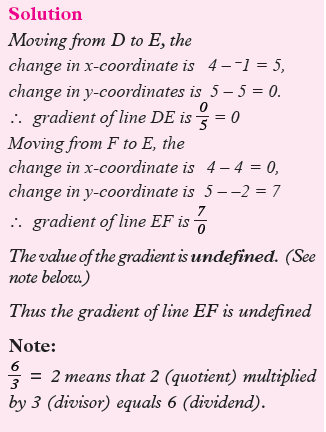
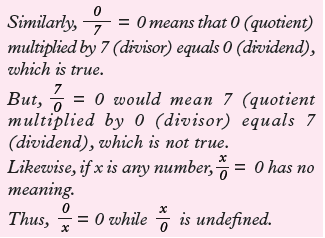
I f , for an increase in the
x-co-ordinate, there is no changein the y-co-ordinate, i.e. the line is
horizontal, the gradient is zero.2. If there is no change in the x-co-ordinate while there is an
increase in the y-co-ordinate, i.e. the line is vertical, the gradient is
undefined.Note that any two points on a straight line gives the same value of the gradient/slope
of that line. Hence any two points on a line can be used
to find its gradient.Exercise 6.1
1. For each of the following pairs of points, find the change in the x-coordinate
and the corresponding change in the y-coordinate. Hence find the gradients
of the lines passing through them.(a) (0 , 2) and (3 , 4)
(b) (0 , 2) and (5 , 0)
(c) (–2 , –2) and (2 , 0)
(d) (–1 , –2) and (1 , 8)
(e) (–1 , 2) and (3 , –2)
(f) (0 , –2) and (0 , 3)
(g) (2 , –8) and (–2 , 8)
2. Find the gradient of the line which passes through each of the following
pairs of points.
(a) (3 , 5) and (9 , 8)(b) (2 , 5) and (4 , 10)
(c) (7 , 3) and (0 , 0)
(d) (1 , 5) and (7 , 2)
(e) (0 , 4) and (4 , 0)
(f) (–2 , 3) and (5 , 5)
(g) (–7 , 3) and (8 , –2)
(i) (–1, 4) and (–3, –1)
(j) (3 , –1) and (3, 1)
3. In each of the following cases, the coordinates of a point and the gradient
of a line through the point are given respectively. State the coordinates of
two other points on the line.(a) (3 , 1), 3 (b) (4 , 5), 2
(c) (–2 , 3), –1 (d) (5 , 5), – 1
(e) (–4 , 3), undefined
(f) (–4, 3), 0
4. Find the gradients of the lines l1 to l5 in graph 6.4.

DID YOU KNOW? Gradients are applied in Economics, Physics and
Entrepreneurship. In Economics, we have demand and supply where the gradient of
a demand curve is a negative indicating the relationship between demand and
price, supply curve has positive gradient. In Physics, gradients are applied in linear
motion.6.1.3 Cartesian Equation of a line
6.1.3.1 General form of Cartesian equation of a straight line
Activity 6.4
1. Write down the gradients and y-intercepts of the lines whose
equations are:
(a) y = 3x + 4 (b) y = –2x + 5(c) y = 6 – 5x (d) y = 7x
2. Re-write the equations x – 2y = –6,
2x + 3y = 6, y = –1
4x + 2y = 5, 2y = x – 4, and
4x – y = 6 in form of y = mx + c.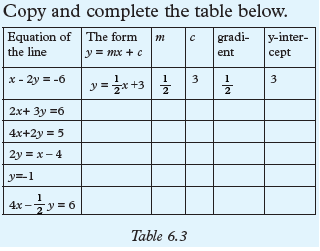
At the beginning of this unit, we learnt that a linear function has a general form
y = mx + c. In this case, m is the gradient of the line and c is the y – intercept.The graph below shows the line y = 2x + 1.
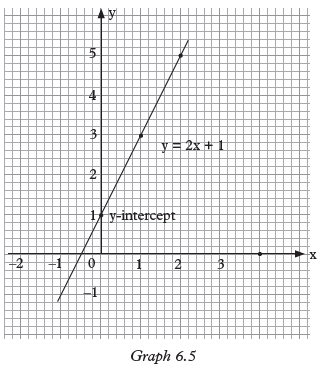
The line has gradient of 2 and y-intercept of 1.
Example 6.4
Find the gradient of the line 3x – y = 2 and draw the line on squared paper.
Solution
To find the gradient of the line, we need to first find any two points on the line.
We write the equation 3x – y = 2 as y = 3x – 2, choose any two convenient
values of x and find corresponding values of y.
For example, when
x = 0, y = 3 × 0 – 2 = –2,∴ point (0, –2) lies on the line.
When x = 2, y = 3 × 2 – 2 = 4,∴ point (2,4) lies on the line.
Thus gradient of the line is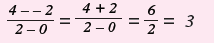
Fig. 6.6 shows the line 3x – y = 2.
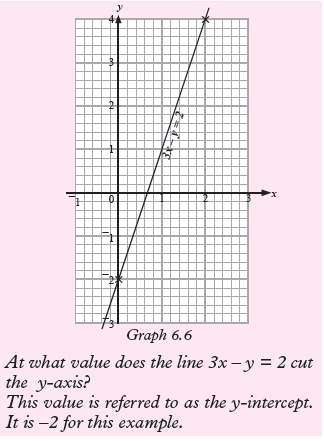
Example 6.5
Find the gradient and y-intercept of the line whose equation is 4x – 3y – 9 = 0. Sketch
the line.
Note that for an increase of 3 units in the x-coordinate, the increase in the
y-coordinate is 4 units. Hence, point (3, 1) is on the line.Exercise 6.2
1. In each of the following cases, determine the gradient and
y-intercept by writing the equation in the form y = mx + c. Sketch the
line.(a) 5x = 2y
(b) y = 2x + 1
(c) 2x + y = 3
(d) 4x – 2y + 3 = 0
(e) 2x + 3y = 3
(f) 5 = 5x – 2y
(g) 2x + 3y = 6
2. Find the y-intercepts of the lines with the given gradients and passing
through the given points.
(a) 3, (2 , 6)(b) 5/3, (–2 , 3)
(c) –2, (7 , 4)
(d) –1/4, (2 , 4)
(e) 0, (–3 , –2)
(f) Undefined, (1, 3)
3. Write down, in the gradient-intercept form, the equations of lines (a), (b),
(c) and (d) in Graph 6.8.
6.2.3.2 Finding the equation of a straight line given gradient and a point on the line
Activity 6.5
You are given the straight line that
passes through the point (3, -1) and its
gradient is 2.1. Taking (x) as any other general point through the line, form an
expression for the gradient using the two points (2, –1) and (x, y).2. Find the equation of the line by equating an expression you
obtained in step 1 to the gradient of 2. Simplify the equation in form
y = mx + cExample 6.6
A straight line with gradient 3 passes through the point A(3,–4). Find the
equation of the line.Solution
Fig. 6.9 is a sketch of the line.
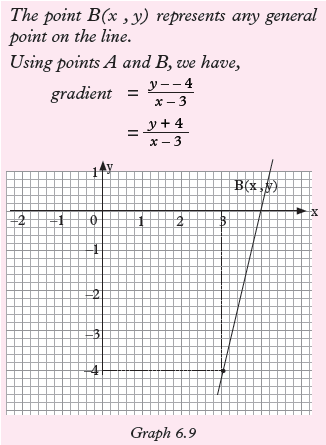
Since gradient = 3,
Then, y + 4
x – 3 = 3
⇔ 3(x – 3) = y + 4
⇔ 3x – 9 = y + 4
⇔ 3x – y = 13 (This is the equation of the line).In general, the equation of a straight line, of gradient m, which passes through
a point (a, b) is given by y – b/x – a = m.Exercise 6.3
1. In each of the following cases, the gradient of a line and a point on the
line are given. Find the equation of the line.
(a) 3; (3, 1) (b) 1/2; (4, 5)(c) –1; (–2, 3) (d) –1/5; (5, 5)
(e) 0; (–4, 3)
(f) Undefined; (–4, 3)
(g) 2/3; (–3 , 0)
2. In each of the following, find the equation of a line whose gradient and
a point through which it passes are:
(a) –3; (0, 0) (b) 2/3; (1/2, 1/3)(c) –5/2; (4, 0) (d) 0; (4, 3)
3. Find the equations of lines described below.
(a) A line whose gradient is –2 and x-intercept is 1
(b) A line whose gradient is –1/5 and y-intercept is 4
4. The gradients of two lines l1 and l2are –1/2 and 3 respectively. Find their
equations if they meet at the point(2, 3).5. Line L1 has a gradient of -1 and passes through the point (3, 0). Line
L2 has a gradient of 23 and passes
through the point (4, 4). Draw the two lines on the same pair of axes and
state their point of intersection.6.1.2.3 Equation of a straight line given two points
Activity 6.6
You are provided with the pointsA(–1, 1) and B(3, 2) along the straight
line.
1. Find the gradient of the line joining the two points A and B.2. Taking the point C (x, y) as the general point on the line and the
point A(–1, 1), find an expression for the gradient of line AC.3. Equate gradient obtained in step 1 to the gradient obtained in step 3
Simplify the result.4. Repeat step (2) and (3) using (3,2) and (x,y)
5. Compare the results. What do you notice?
Example 6.7
Find the equation of the straight line which passes through points A(3 , 7) and B(6 , 1).
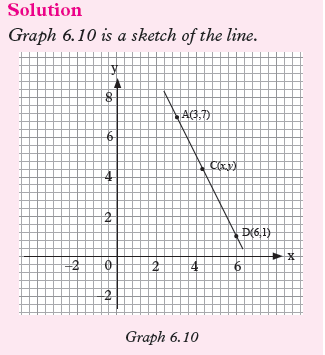
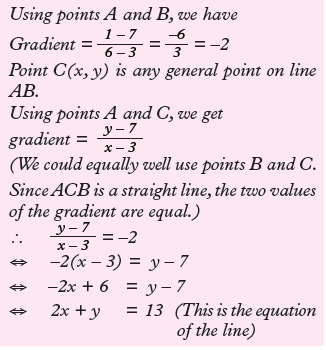
In general,
The equation of a straight line which passes through points (a, b) and (c, d) is
given by,


Equating the two gradients, we get
3/4 = y – 3/x – 0
So, 3x = 4y – 12 we get y = 3/4 x + 3Exercise 6.4
1. Find the equation of the line that passes through the points
(a) (–1, 1), (3, 2)(b) (7, 2) (4, 3)
(c) (2, 5), (0, 5)
(d) (5, –2), (6, 2)
(e) (6, 3), (–6 , 2)
(f) (2, –5), (2, 3)
(g) ( 1/4 , 1/3 ), ( 1/3 , 1/4 )
2. (a) Find the equation of the straight line which passes through the
points (0, 7) and (7, 0).(b) Show that the equation of the straight line which passes through
(0, a) and (a, 0) is x + y = a.3. A triangle has vertices A (–2, 0), B(–1,3) and C(2,3). Find the
equations of the sides of the triangle.4. Two lines, l1 and l2, both pass through the point (4, k).
(a) If l1 passes through the point (5 , –3), and has a gradient –11/3 ,
find the value of k(b) If l2 passes through (–14 , 0), find its equation
5. Find the equations of lines described below
(a) A line whose x-intercept is 0 and passing through the point (–3,1)
(b) A line whose y-intercept is –5 and passing through point (–4, –1)
(c) A line whose x and y- intercepts are 4 and –5
6. Line L1 passes through the point
(–1, 3) and has a gradient of 3. Line L2 passes through the point (2, 3)
and meets line L1 at the point (0, 6).(a) Find the equations of the two lines.
(b) Draw the lines L1 and L2 on the same pair of axes.
7. Determine the gradients and the y-intercepts of the straight lines:
a) y = 8x + 1
(b) y = x
(c) y = 3 – 2x
(d) y + x = 0
(e) 3y + x = 9
(f) 2x + 5y + 10 = 0
(g) 1/2 y + 1/3 x = 2
8. Show that the point (–1, –4) lies on the line y = 3x – 1.
9. Show that the equation of the straight line passing through (0, k) and (k, 0)
is y + x = k.10. Given that the line y = 3x + a passes through (1, 4), find the value of a.
6.1.4 Parallel and Perpendicular lines
6.1.4.1 Parallel lines
Activity 6.7
Consider Graph 6.11 below

Lines are parallel if they have the same gradient.
Consider two lines y = m1x + c1 and
y = m2x + c2. These lines are parallel only and only if m1 = m2Example 6.10
Find the equation of a line which passes through the point (3, 5) and is parallel to
2y = 2 – 6x.Solution
The equation of the required line is in the form of y = mx + c. The gradient of the
line 2y = –6x + 2 ⇒ y = –3x + 1 is –3.
Since the two lines are parallel m = –3. Thus, y = –3x + c.
The fact that the required line passes through (3,5),5 = –3 × 3 + c
5 = –9 + c
c = 14
The required equation is y = –3x + 146.1.4.2 Perpendicular lines
Activity 6.8
Consider graph 6.12 below.
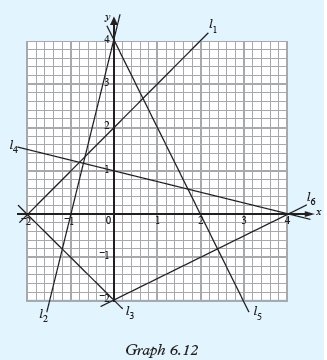
1. Observe and state which pairs of lines are perpendicular?
2. (i) Calculate the gradients of all the lines, use the results to
complete the table below.
(ii) What do you notice about m1× m2?
Lines are said to be perpendicular if the product of their gradients gives –1.
i.e. m1× m2 = –1Example 6.11
Find the equation of the line through (5, 2)
which is (a) parallel, (b) perpendicular to the line 5y – 2x = 10.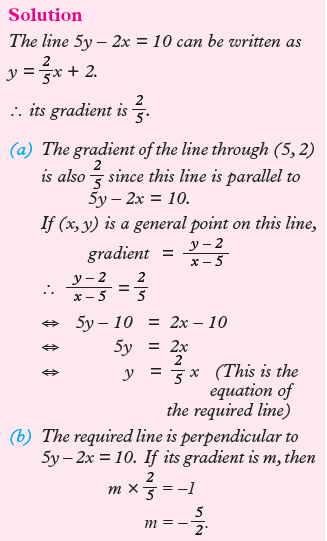
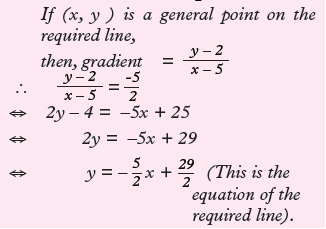
Exercise 6.5
1. Determine the gradients of the following pairs of equations and
state whether their lines are parallel without drawing.
(a) y = 2x – 7 (b) y = 4
3y = 6x + 2 y = –3(c) y = 2x + 3
y = 4x + 6
(d) 5y + 3x + 1 = 0
10y + 6x – 1 = 0(e) 2y + x = 2 (f) 2x + y = 3
3y + 2x = 0 3x + y = 1(g) x + 2y = 4
x + 3y = 6 2y = 4x – 7(i) 3y = 5x + 7 (j) 5y = x + 2
6y = 10x – 3 4y = x + 32. Without drawing, determine which of the following pairs of lines are
perpendicular.(a) y = 2x + 5 and 2y + x = 3
(b) 2x – y = 7 and x + y = 5
(c) 3y= 2x + 1 and 2y + 3x – 5 = 0
(d) 7x – 2y = –2 and 14y – 4x = –1
(e) y = 3/4 x – 2 and the line through
(8, 10) and (2, 2).(f) A line through (2, 2) and (10, 8) and another through (5, 6) and(8, 2).
3. A line through the points (–2,4) and (3, 5) is parallel to the line passing
through the points (a, 6) and (–4,1).
Find a.4. Line L is parallel to a line whose equation is y = 4x – 7 and passes
through the point (1, –2). Find the equation of line L.5. Find the equation of the line that is parallel to another line whose
equation is 4y + 5x = 6 and passes through the point (8, 5).6. Find the equation of the line that is parallel to another line whose
equation is y = 2/5 x + 2 and passes through the point (–2, –3).7. Write down the equation of the line perpendicular to:
(a) 3x + 4y – 1 = 0 and passes through (1, 2),
(b) y = 3/4 x + 3/4 and passes through the origin,
(c) 3x – 2y + 7 = 0 and passes through (–1, 0),
(d) 5y + x + 4 = 0 and passes through (3, 5).
8. Find the equation of the line that is parallel to another line whose
equation is y = 2
5 x + 2 and passes
through the point (–2, –3).6.2 Quadratic functions
Activity 6.9
Study the following functions and decide which of them are quadratic
functions. Give reasons to support your answer.(a) y = 3x + 4
(b) y = 3x2 – 9x – 3
(c) y = x3 – 4x2 + 10
(d) y = x2
(e) y = 2x/x2 – 4 – 8
The expression y = ax2 + bx + c, where a, b and c are constants and a ≠ 0, is called a
quadratic function of x or a function of the second degree (highest power of x is two).Examples of quadratic functions are
(a) f(x) = x2 – 9 (b) f(x) = 2 – 3x + x2
(c) f(x) = 2x2 – 3x – 4 (d) y = x2 + 8
6.2.1 Table of values
Activity 6.10
Given the quadratic function
y = x2 – x – 6. (Hint: Refer to Unit 5)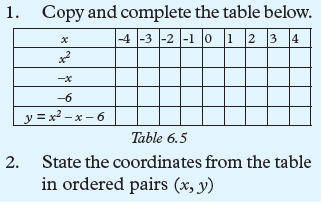
Table of values are used to determine
the coordinates that are used to draw the graph of a quadratic function.
To get the table of values, we need to have the domain (values of an independent
variable) and then the domain is replaced in a given quadratic function to find range
(values of dependent variables). The values obtained are useful for plotting the
graph of a quadratic function. All quadratic function graphs are parabolic
in nature.Example 6.12
Draw the table of values of y = x2 and
y = –x2 for values of x between –5 and +5.
Plot the graphs.Solution
Table of y = x2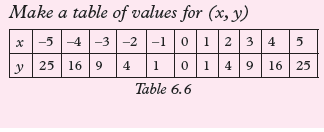
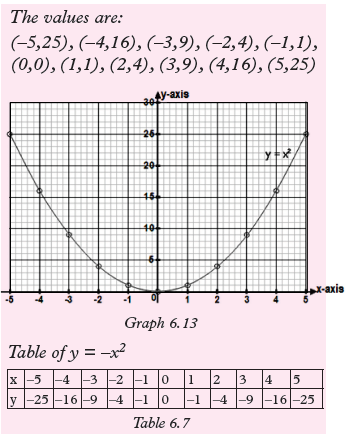

Example 6.13
Draw the table of y= x2 – 3x + 2, for values of x between -1 and +4.
Solution
Make a table of values of x and y

Exercise 6.6
1. (a) Draw the table of y = 1 + x – 2x2, taking values of x in the domain
–3 < x < 3. State the coordinates obtained.(b) Use the same domain to draw the table of y = 2x – 5. State the
coordinates obtained.2. Draw the graph of y = 2x2 + x -2 from x = -3 to x = 2. Hence, find the
appropriate values of the roots of the equation 2x2 + x – 2 = 0.3. Copy and complete the following table of values for y = 6 + 3x – 2x2.
Plot the graph of the function.
4. Given that y = x2 – x – 2 complete the following table for values of x and y.
State the coordinates in ordered pairs (x, y) . Plot the graph.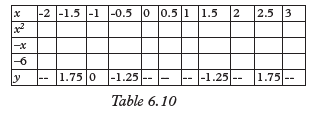
5. Given that y = (3x + 1)(2x – 5), copy and complete the following
table for values of x and y. State the coordinates in ordered pairs and plot
the graph.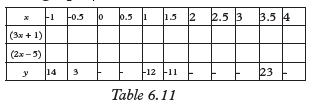
6.2.2 Determining the Vertex of aquadratic function and axis of symmetry from the graph.
Activity 6.11
Use internet or dictionary to explain the following terms.
(a) Line of symmetry
(b) Maximum point
(c) Minimum point
Any quadratic function has a graph which is symmetrical about a line which is
parallel to the y-axis i.e. a line x = h where h = constant value. This line is called axis
of symmetry as shown in graph 6.16 below.
For any quadratic function
f(x) = ax2 + bx + c whose axis of
symmetry is the line x = h, the vertex is the point (h, fExample 6.14
1. Given that of y = x2 + 2x – 2 is a quadratic function.
(a) Prepare the table of values for the function y = x2 + 2x – 2
for –4 ≤ × ≥ 2.(b) Draw the graph.
(c) From the graph, identify;
(i) the value of y when x = 1.5
(ii) the value of x when y = –1,
(iii) the least value of y.
(d) Determine the line of symetry of the function.
Solution
(a) Table below is the required table of values. Values of y are obtained by
adding the values of x2, 2x and –2. Note that breaking down the expression into
such components makes the working much easier.
(b) Choose a suitable scale and plot the values of y against the corresponding
values of x. Join the various points with a continuous smooth curve to obtain a
graph like that of graph 6.16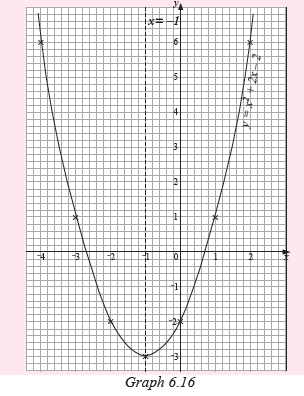
(c) From graph 6.16,
(i) when x = 1.5, y = 3,
(ii) when y = –1, x = –2.4 or 0.4,
(iii) the least value of y is –3.
(c) For the graph y = x2 + 2x – 2, the symmetry is line
x = –1.
Reason: It is the x-value of the lowest point on the graph.Example 6.15
Draw the graph of y = 2 + 2x – x2 for values of x from –2 to 4. From the graph,
find:(a) the maximum value of 2 + 2x – x2
(b) the value of x for which y is greatest
(c) the range of values of x for which y ispositive
(d) the axis of symmetry.
Solution
The table 6.13 is the required table of values.
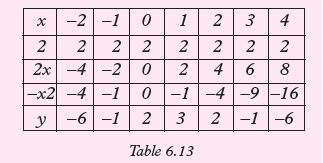
Fig. 6.17 shows the graph of y = 2 + 2x – x2.
From the graph
(a) the maximum value of 2 + 2x – x2 is3,(b) the value of x for which y is greatest is1,
(c) y is positive for all parts of the curve above the x-axis, i.e. when x > –0.8
and x < 2.8. In short, y is positive over the range –0.8 < x < 2.7.(d) the axis of symmetry for the graph of y = 2 + 2x – x2 is x = 1.
Notice that the graph 6.17 is upside down as compared to graph 6.15.
This is always the case when the coefficient of x2 is negative.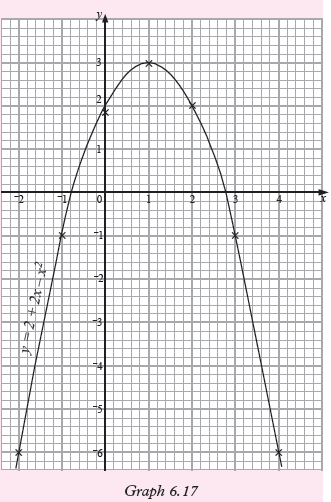
Exercise 6.7
1. Plot the graph of y = x2 – 4x + 5 for
–1< x <5. Use the graph to answer the questions below.(a) Where does the graph cut x-axis?
(b) State the axis of symmetry of the graph.
(c) Find the vertex of the graph.
(d) Find the value of y when x=3.
2. Given that y = x2 – x – 2 complete the following table for values of x and y.
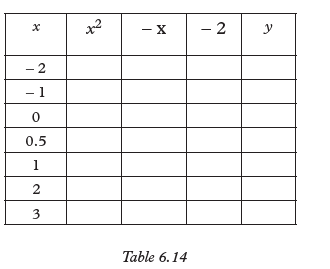
(a) State the co-ordinates in orderedpairs
(b) Plot the graph of the function
(c) Find the axis of symmetry from the graph plotted in (b).
(d) Find the vertex of the function from the graph plotted in (b).
3. The table below shows the values of y = x2 – 3x + 2
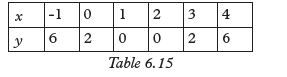
(a) Using a suitable scale, draw a graph of y = x2 – 3x + 2.
(b) What is the axis of symmetry of y = x2 – 3x + 2?
(c) What is the vertex of the function y = x2 – 3x + 2.
(d) Use the graph drawn to solve y = x2 – 3x + 2.
4. (a) Plot the graphs of y = 3x – x2 and y = x2 – 3x in for –1 ≤ x ≤ 4 on
the same axes.(b) What is the relationship between
the two graphs plotted in 4(a)above?6.2.3 Determining the intercepts, vertices and sketching
quadratic functionsActivity 6.12
Consider the graph in Graph 6.18 below,
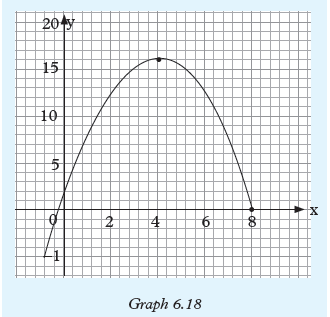
1. Read and record the vertex of the graph.
2. What is the axis of symmetry from the graph?
3. Read and record the points where the graph cuts and axes.
The vertex of a quadratic function is the point where the function crosses its axis
of symmetry.If the coefficient of the x2 term is positive, the vertex will be the lowest point on the
graph, the point at the bottom of the U-shape. If the coefficient of the term x2
is negative, the vertex will be the highest point on the graph, the point at the top of
the ∩-shape. The shapes are as below.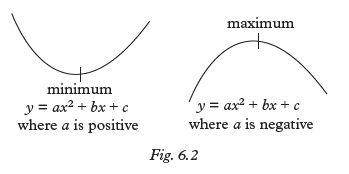
The standard equation of a quadratic
function is y = ax2 + bx + c.
Since the quadratic expression written as f(x) = ax2 + bx + c, then we can get the
y-coordinate of the vertex by substituting the x-coordinate = –b/2a .So the vertex becomes
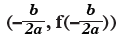
The axis of symmetry is the x-coordinate of
the quadratic function. Axis of symmetry
is therefore calculated from x = –b/2a .
The intercepts with axes are the points where a quadratic function cuts the axes.
There are two intercepts i.e. x-intercept and y-intercept. x-intercept for any
quadratic expression is calculated by letting y = 0 and y intercept is calculated
by letting x = 0
The graph of a quadratic expression can be sketched without table of values as long
as the following are known.(a) The vertex
(b) The x-intercepts
(c) The y-intercept
Example 6.16
Find the vertex of y = 3x2 + 12x – 12. State
the axis of symmetry.Solution
The coefficients are a = 3,b = 12 and c = –12
The x-coordinate h = –b/2a , = –12
2(3) = –2.Substituting the x-coordinate to get y coordinate, we have
y= 3(–2)2 + 12(–2) – 12 = –24.
The vertex is at (–2, –24)
The axis of symmetry is the line x = –2.Example 6.17
Find the vertex and axis of symmetry of the parabolic curve y = 2x2 – 8x + 6Solution
The coefficients are a = 2, b = –8 and c = 6
The x-coordinate of the vertex is
h = –b./2a = (–8)
2(2)
– = 8
4 = 2.
The y-coordinate of the vertex is obtained
by substituting the x-coordinate of the
vertex to the quadratic expression. We get
y = 2(2)2 – 8(2) + 6 = –2.
The vertex is(2, –2) and the axis of
symmetry is x = 2.Example 6.18
Find the intercepts of the graph of the
function y = 2x2 – 8x + 6
Solution
When x = 0, y = 2(0)2 –8(0) + 6 = 6
The y-intercept is (0, 6)
When y = 0, 0 = 2x2 – 8x + 6
We therefore solve the quadratic equation
for the values of x
2x2 – 8x + 6 = 0.
2x2 – 6x – 2x + 6 = 0.
2x(x – 3) – 2(x – 3) = 0.
(2x – 2)(x – 3) = 0.
Either 2x – 2 = 0 or x – 3 = 0.
x = 1 or x = 3.
The x-intercepts are (1,0) or (3,0)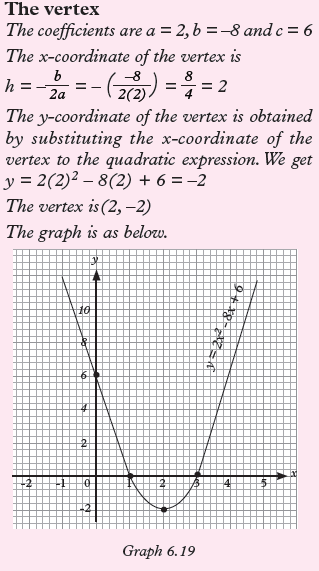
Example 6.19
Sketch the graph of y = x2 – 3x + 2
Solution
The intercepts.
When x = 0, y = 2. The y-intercept is (0, 2)
When y = 0, then x2 – 3x + 2 = 0
Solving the quadratic expression,
x2 – 3x + 2 = 0.
x2 – 2x – x + 2 = 0.
x(x – 2) –1(x – 2) = 0.
(x – 1)(x – 2) = 0.
x = 1 or x = 2.
(1,0) and (2,0) are x-intercepts.

3. Without tables of values, state the vertices, intercepts with axes, axes of
symmetry, and sketch the graphs.
(a) y = 2x2 + 5x - 1(b) y = 3x2 + 8x - 6
(c) 2x2 - 7x – 15 = 0
(d) y = 3 + 4x – 2x2
Unit Summary
• Linear function is of the form y = mx + c where m = gradient and
c = y-intercept.
Examples of linear functions are: y = 2x – 1, y = 8, y = 7 – 7x• Gradient of a straight line: For line joining two points as shown in the
figure.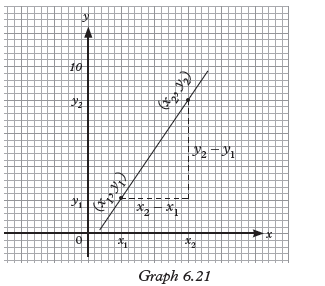
Gradient of the line is m =y2 – y1/x2 – x1.
• Parallel condition: When lines are parallel, they have the same gradient
i.e. Consider two lines y = m1x + c1 and y = m2x + c2. These lines are
parallel only and only if m1 = m2• Perpendicular condition: When lines are perpendicular, the product of
their gradients is –1 i.e. Two lines y = m1x + c1 and y = m2x + c2 are said to be perpendicular if the
product of their gradients gives –1.
i.e. m1 × m2 = –1.• Equation of a straight line: The equation of a line y = mx + c can be
obtained when it passes through one point and gradient is given or when it
passes through two given points.• Quadratic function: The expression y = ax2 + bx + c, where a, b and c
are constants and a ≠ 0, is called a quadratic function of x or a function
of the second degree (highest power of x is two).• Axis of symmetry: A quadratic function has axis of symmetry x = h. The axis of
symmetry is parallel to the y - axis.• Vertex of a quadratic function: Every quadratic function has vertex. The
graph turns at its vertex. The vertex is the coordinate ([h, f(h)) where
x = h is the axis of symmetry. For the expression y = ax2 + bx + c, if
the coefficient of the x2 term is positive, the vertex will be the lowest point on
the graph, the point at the bottom of the "∪"-shape. If the coefficient of the
term x2 is negative, the vertex will be the highest point on the graph, the
point at the top of the "∩"-shape.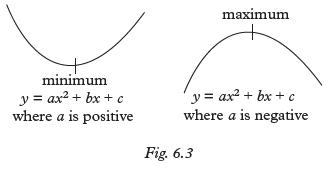
• Intercepts of a quadratic function:
The intercepts with axes are the points where a quadratic function
cuts the axes. There are two intercepts i.e. x-intercept
and y-intercept. x-Intercept for any quadratic expression is calculated
by letting y = 0 and y-intercept is calculated by letting x = 0Unit 6 Test
1. Show that the equation of the straight line passing through (0, p) and (p, 0)
is y + x = p.2. Given the function f(x)=–2x2 + 4x – 6.
(a) Identify the function and explain why.(b) Find the vertex of the function.
(c) Find the intercepts of the function with axes.
(d) Sketch the graph of the function on a Cartesian plane.
3. Consider the function
f(x) = 2(x – 3)(x + 1).
(a) Is the curve open up or open down? Explain.(b) Find the vertex and intercepts of the curve.
(c) What is the axis of symmetry of the curve?
(d) Sketch the curve on a Cartesian plane.
4. Sketch the graph of y = –(x + 4)(x – 9)
5. Find the equation of the line that is parallel to another line whose
equation is 4y + 5x = 6 and passes through the point (8, 5).6. (a) Show that the point (–1, –4) lies on the line y = 3x – 1.
(b) Find the equation of the line that is parallel to another line whose
equation is x + 2y + 8 = 0 and passes through the point (–2, –3).7. (a) Given that the line y = 3x + a passes through (1, 4), find the
value of a.(b) Sketch the graph of y = –2x2 – 6x – 9.
Unit 7:COMPOUND INTEREST, REVERSE PERCENTAGE AND COMPOUND PROPORTIONAL CHANGE
Key Unit Competence: By the end of this unit, learners should be able to solve
problems involving compound interest, reverse percentage and proportional
change using multipliers.Unit Outline
• Reverse percentage.
• Compound interest.
• Compound proportional change.
Introduction
Unit Focus Activity
Lucie, a farmer from the village has saved 1 000 000 FRW from her tea and
livestock farming. She wants to invest the money in financial institution for
three years to safeguard it and also get some interest. She visited two different
financial institutions to get advice. The first institution told her that she could
invest her money with them at 10% p.a simple interest for the 3 years. The
second institution told her that she could invest her money with them at
10% p.a compound interest for the 3 years.
Unfortunately, Lucie did not fully understand the difference and so she
does not know the best option to take. She has come to you for proper advice
in regard to:
(a) What is (i) simple interest (ii)
compound interest?(b) Which of the two types of investment better?
(c) What would be the difference in the total interest generated through the
two types of investments after the 3 years?By performing the necessary calculations, kindly write down on a piece of paper
your full advice to Lucie regarding her three queries.7.1 Reverse Percentage
Activity 7.1
Consider an iron box that costs 450 FRW after a 25% increase in its original price.
1. Explain how you can determine the original price of the iron box. Then
determine that price.2. Compare the current price and the original price of the iron box.
Which is higher? Why?Reverse percentage involves working out the original quantity of an item
backwards after the increase or decrease in its quantity. This method is applied
when given a quantity after a percentage increase or decrease and one is required
to find the original quantity.Example 7.1
A radio is sold at 620 FRW after a 40% increase in the price. Find the original price.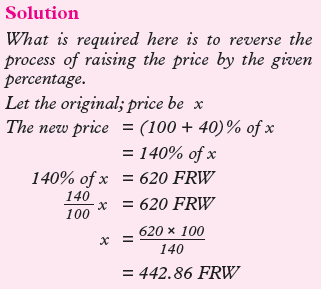
Example 7.2
For purposes of sales promotion, the price of a book has been reduced by 20% to 3 600 FRW.
What was the price before the reduction?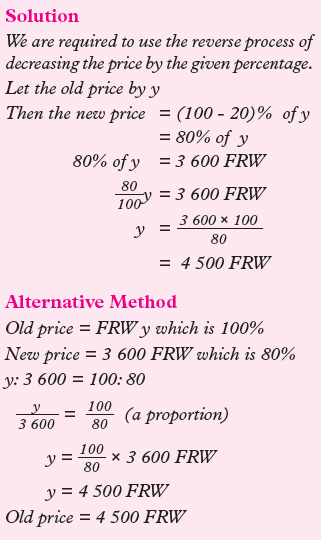
Exercise 7.1
1. A man’s daily wage was increased by 25% to 500 FRW. Find how much it
was before the increase.2. The price of an article is decreased by 5% to 1 900 FRW. What was the
price before the decrease?3. A company produced 23 000 shirts in September. This was 8% less than the
August production. How many shirts did the company produce in August?4. A new car falls in value by 30% a year. After a year, it is worth 84 000 FRW.
Find the price of the car when it was new.7.2 Compound interest
7.2.1 Definition of compound interest
Activity 7.2
Find out from reference books or the
internet the:1. definition of interest and some of the area of its application.
2. ways of calculating compound interest.
3. difference between compound interest and simple interest.
When money is borrowed from or deposited in a financial institution, it
earns an interest at the end of each interest period as specified in the terms
of investment, for example at the end of each year, half year etc. Instead of paying
the interest to the owner, it is added to the principal at the end of each period
i.e. compounded with the principal. The resulting amount is then taken to be theprincipal for the next interest period. The interest earned in this period is higher
than in the previous one. The interest so earned is called compound interest.Therefore, compound interest defines the interest calculated on the initial principal
and also on the accumulated interest of previous periods of a deposit or loan.
There are two ways of calculating compound interest:(a) the step by step method
(b) the compound interest formula.
7.2.2 Step by Step Method
Activity 7.3
Using a step by step method, determine
to amount accumulated by a principal of 500 000 FRW invested at 8%
compound interest for 4 years. What is the total interest realised?
Compound interest can be calculated step by step through compounding the
interest generated with the principal.

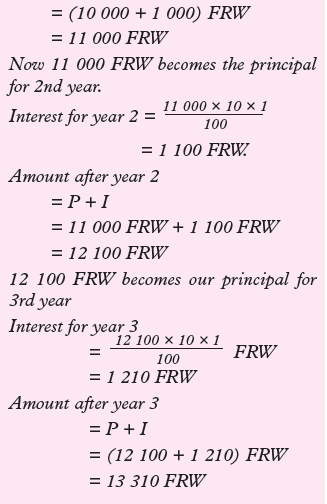
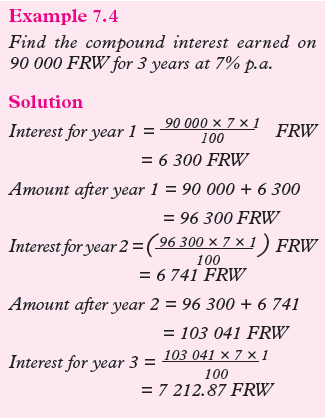
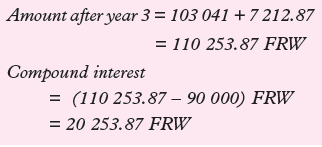
Example 7.5
Daka borrows 3 800 FRW from Jane at 10% p.a. compound interest. At the end of
each year, he pays back 910 FRW. How much does he owe Jane at the beginning of
the third year?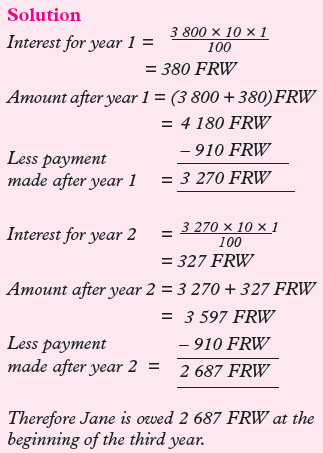
Example 7.6
Find the accumulated amount of money after 112
years, for 10 500 FRW, invested at the rate of 8% p.a. compounded semiannually.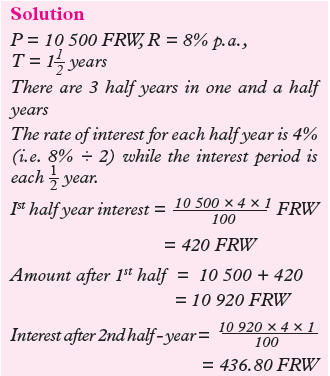

Exercise 7.2
1. Find the amount and the compound interest for each of the following
correct to the nearest FRW:(a) 8 000 FRW invested for 3 years at 4% p.a. compound interest.
(b) 48 000 FRW invested for 2 years at 6% p.a. compound interest.
(c) 36 000 FRW invested for 2 years at 5% p.a. compound interest.
2. Determine the difference between the simple interest and compound
interest earned on 15 000 FRW for 2 years at 3% p.a.3. Kampire invested P FRW, which amounted to 8 420 FRW in 3 years
at a rate of 4.5% p.a. compound interest. Find the value of P.4. Determine the compound interest earned on 45 000 FRW after 3 years
at the rate of 6% p.a.5. Mugisha borrows a sum of 8 000 FRW at 10% p.a. simple interest and
lends that to Neza at the same rate compound interest. How much will
Mugisha gain from this transaction after 3 years?7.2.3 The compound interest formula
Activity 7.4
1. Consider the case in which 10 000 FRW is invested in a bank
for 3 years at the rate of 5% p.a.compound interest.2. Using the step by step method calculate the amount of money
accumulated after every year.Assuming 5 000 FRW is the principal amount compounded at 6% p.a.The
amount of money accumulated after every year is calculated as follows:Amount after 1st year
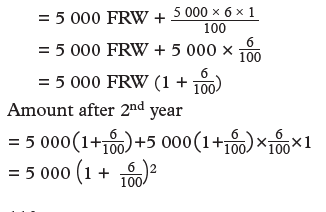
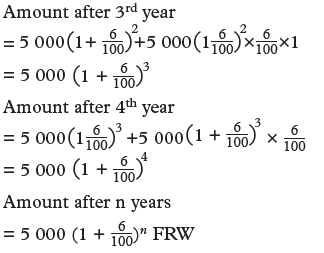
Considering the case in which P is invested in a bank for n-interest periods
at the rate of r% p.a. The accumulated amount (A) after the given time is given
by:
A = P (1 + r/100)n
where n is the number of interest periods.
This is called the compound interest formula. It is conveniently used in
solving problems of compound interest especially those involving long periods
of investments or payment.In this method, the accrued compound interest is obtained by subtracting the
original principal from the final amount. Thus, Compound interest =
Accumulated amount(A) – Principal(P) Note that the principal and the interest
earned increased after each interest period. We can also deduce that;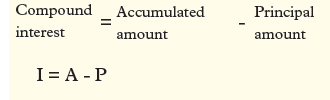
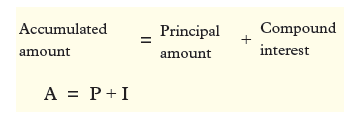
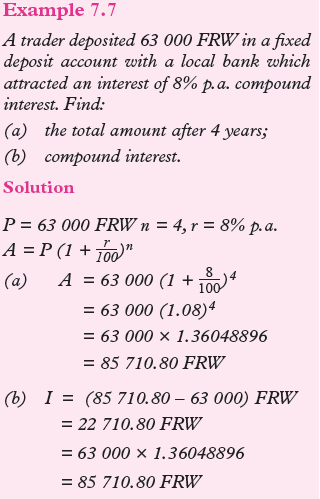
Example 7.8
Find the accumulated amount that 30 000 FRW will yield if deposited for 2 years at
6% p.a. compounded semi-annually.Solution
For every year there will be two interest
periods;
Thus, in 2 years we will have (2 × 2) interest periods i.e. n = 4
The rate per interest period = 6 ÷ 2 = 3%
Thus, A = 30 000 FRW (1 + 3/100)4
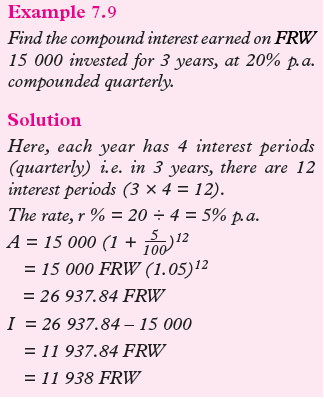
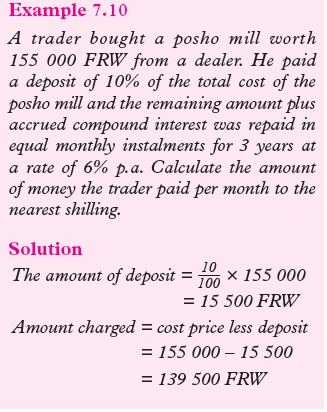
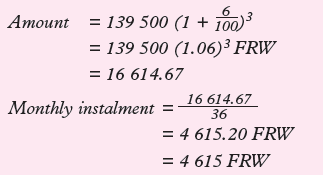
Exercise 7.3
1. Determine the accumulated amount for each of the following:
(a) 19 000 FRW invested for 2 years at 3% p.a. compound interest.(b) 8 300 FRW invested for 3 years at 4% p.a. compound interest.
2. A businesswoman invested 4 500 FRW for 2 years in a savings account. She
was paid 4% per annual compound interest. How much did she have in
her savings account after 2 years?3. Adams invests 4 500 FRW at a
compound interest rate of 5% per annum. At the end of n complete
years the investment has grown to 5 469.78 FRW. Find the value of n.4. A company bought a car that had
a value of 12 000 FRW. Each year the value of the car depreciates with
25%. Work out the value of the car at the end of three years.5. Erick invested 60 000 FRW for 3 years
in a savings account. He gets a 3% per annum compound interest. How
much money will Erick have in the savings account at the end of 3-years?7.3 Compound proportional change
Activity 7.5
Consider that 3 people working at the
same rate can plough 2 acres of land in 3 days.What do you think will happen if the working days are increased to five
working at the same rate? Discuss. Sometimes, a quantity may be
proportional to two or more otherquantities. In such a case, the quantities are said to be in compound proportion.
Problems involving rates of work, and other similar problems, often contain quantities
that are in compound proportion. Such problems are solved using either the ratio
or unitary method.Example 7.11
Eighteen labourers dig a ditch 80 metres long in 5 days. How long will it take 24
labourers to dig 64 metres long? What assumptions have you made?Solution
Notice that the number of days depends on
the number of labourers as well as on the length of the ditch. Thus, this is a problem
in compound proportion.1. Ratio method
Length of ditch decrease from 80 m to 64
m, i.e. in the ratio 64 : 80.A shorter ditch takes a shorter time.
∴ multiply days by 64/80 .
Number of labourers increases from 18 to
24, i.e. in the ratio 24 : 18.
More labourers take a shorter time.∴ multiply days by 18/24 .
80 metres of ditch are dug by 18 labourers in 5 days.64 metres of ditch are dug by 24 labourers in
5 × 64/80 × 18/24 days = 3 days.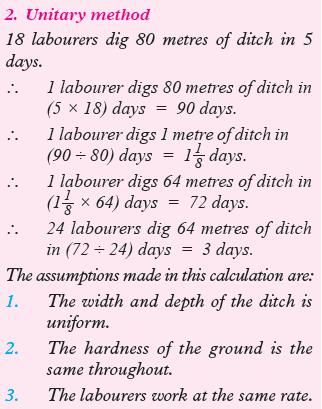
Example 7.12
To plant a certain number of tree seedlings Mutoni takes 5 hours. Gahigi takes 7
hours to plant the same number of seedlings. If Mutoni and Gahigi worked together,
how long would they take to plant the same number of seedlings?
Note: We first found out the fraction of the number of seedlings that each
person plants in 1 hour, then the fraction of the number of seedlings that
they plant together in 1 hour. Invert this fraction, and the result is
the number of hours they take working together.
Exercise 7.4
1. 16 men dig a trench 92 m long in 9 days. What length of trench can 12
men dig in 15 days?2. To unclog a silted drain 85 m long, 15 workers take 10 days. Find how
many workers are required to unclog a similarly silted drain 51 m long
drain in 5 days.3. Six people pay 40 320 FRW for a 7 day stay at a hotel. How much would
eight people pay for a 3 day stay?4. A car hire company with 24 cars uses 2 940 litres of petrol in 5 days. How
long would 4 116 litres of petrol last if the company had 28 cars and the
consumption rate does not change?5. A transport company charges 54 800 FRW to move a load of 2.8 tonnes
for 350 km. For what load will the corporation charge 47 040 FRW for 400 km?6. A man, standing next to a railway line, finds that it takes 6 seconds fora train, 105 m long,
travelling at 63km/h, to pass him. If another train,100 m long, takes 5 seconds to pass
him, at what speed is it moving?7. It takes 15 days for 24 lorries, each of which carries 8 tonnes, to move
1 384 tonnes of gravel to a construction site. How long will it take 18 lorries,
each of which carries 10 tonnes, to move 1 903 tonnes of the gravel?8. A car moving at 65 km/h takes 2 h 24 min to travel 156 km. What distance
does the car travel in 48 min moving at 55 km/h?9. Twelve men, working 8 hours a day, can do a piece of work in 15 days.
How many hours a day must 20 men work in order to do it in 8 days?Unit Summary
• Reverse percentage is the working out of original price of a product
backwards after the increase.• Compound interest: is the interesst calculated on both the amount
borrowed and any accumulated previous interests.• The compound interest formula states as shown:
A = P(1 + r/100 )n where n is the number of interest periods, r is the
rate, A is the initial amount and P is the principalUnit 7 Test
1. After the prices of fuel increased by 15%, a family’s annual heating bill
was 1 654 FRW. What would the bill have been without the increase in
price?2. An insurance company offers a no claim discount of 55% for drivers who have
not had an accident for 4 years. If the discounted premium for such a driver
is 3 340 FRW, how much did the driver save?3. After a long-haul flight, the total weight of a passenger jet had
decreased by 27% to 305 000 kg. What weight of fuel was the aircraft
carrying at take off?4. Lange borrows 16 000 FRW to buy a coloured TV set at 10% p.a.
compound interest. He repays 980 FRW at the end of each year. How
much does he still owe at the end of 3 years?5. If 12 000 FRW is invested at 12% p.a. compounded quarterly, find the
accumulated amount after one year to the nearest Francs.6. Mwiza borrowed 2 000 FRW at 5% p.a. compound interest from a
microfinance company. She paid back 350 FRW at the end of each
year. How much does Mwila still owe the company at the end of the second
year?7. A sum of money is invested at compound interest and it amounts
to 420 FRW at the end of the first year and 441 FRW at the end of the
second year. Determine;(a) the rate in percent
(b) the sum of money invested.
8. Calculate the amount after 3 years if 7 800 FRW is invested at 121/2 % p.a.
compound interest (give your answer to the nearest francs).9. If you deposit 4 000 FRW into an account paying 6% annual interest
compounded quarterly, how muchmoney will be in the account after 5 years?
10. If you deposit 6 500 FRW compounded monthly into an account
paying 8% annual interest compounded monthly, how much
money will be in the account after 7 years?11. If you deposit 8 000 FRW into an account paying 7% annual interest
compounded quarterly, how long will it take to have 12 400 FRW in the
account?12. One pipe can fill a bath in 5 minutes and another can empty the same bath
in 10 minutes. Both pipes are opened at the same time and after 5 minutes,
the second pipe is turned off. What fraction of the bath is then full? How
long will it take for the first pipe to fill the bath completely from then?13. A man can do a job in 41/2 days. Another man can do the same job in
9 days. How long will the two men take on the job if they work together?14. Workmen A and B, working together, do a certain job in 1 hour. Workman
A alone does the job in 3 hours. How long does it take workman B alone to
do the job?15. Working alone, Alex can do some job in 6 days. John, also working alone,
can do the same job in 9 days. Alex starts alone, but is joined by John
after 1 day. How long do they take to finish the work together?16. Three persons, Peter, Mike and James, build a certain length of wall
in 2 days. Peter and Mike together could build the same length of wall in
4 days, and Mike and James together would take 3 days.(a) Find the fraction of the length of the wall that Mike and James
build in 2 days and hence find how long Peter would take by
himself.(b) Find the fraction of the length of the wall that Peter and Mike
build in 2 days and hence find how long James would take by himself.(c) Similarly, find how long Mike would take by himself.
Unit 8:RIGHT-ANGLED TRIANGLES
Key unit competence
By the end of the unit, learners should be able to find the length, sides and angles in
right-angled triangles using trigonometric ratios.Unit Outline
• Definition of a right-angled triangle.
• Elements of a right-angled triangle.
• Relationship between the elements of a right-angled triangle through the
use of Pythagoras theorem.• Median and perpendicular heights.
• Determining the sides of right-angled triangle given their orthogonal
projections on the hypotenuse.• Solving problems in right-angled triangles using the element properties
and the Pythagoras theorem• Trigonometric ratios in a right-angled triangle: sine, cosine and tangent.
Introduction
Unit Focus Activity
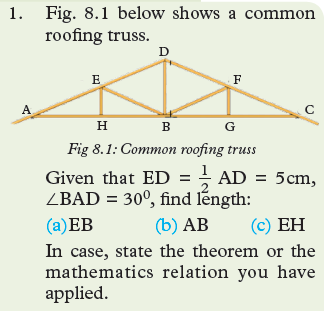
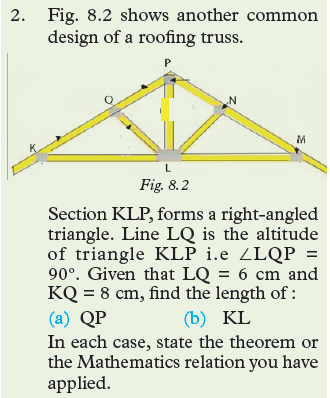
8.1 Review of Pythagoras theorem
Activity 8.1
1. Draw and label all features and sides of a right angled triangle.
2. Show the relationship between the three sides of a right angled triangle.
In a right-angled triangle, one angle is 90°. The longer side in a right-angled triangle
called the hypotenuse and the two shorter sides (legs).
Consider the right-angled triangle in Fig 8.3 below.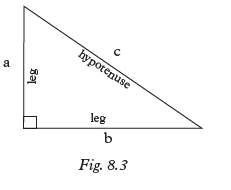
Pythagoras theorem states that the square of the hypotenuse (the side
opposite the right angle) is equal to the sum of the squares of the other two sides.
Pythagoras theorema2 + b2 = c2
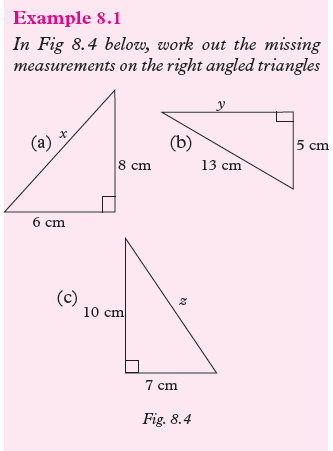
Solution
(a) Triangle (a)Use Pythagoras theorem
a2 + b2 = c2
Let a = 6 cm, b = 8 cm; c = x cm
62 + 82 = x2
36 + 64 = x2
100 = x2
Finding the square root of 100
x = √100 cm
x = 10 cm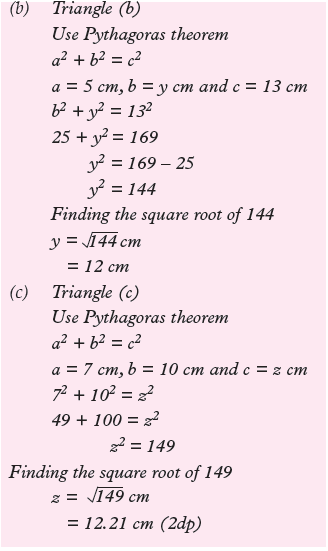
Exercise 8.1
1. Determine, to two decimal places, the length of the third side of the
right angled triangle where the one side and the hypotenuse have given
below.
(a) 5 cm, 12 cm(b) 1 cm, 2 cm
(c) 3 cm, 4 cm
(d) 2.5cm, 3 cm
(e) 1 cm, 1.73 cm
(f) 2 cm, 7 cm
2. The diagram in Fig 8.5 shows a wooden frame that is to be part of the
roof of a house.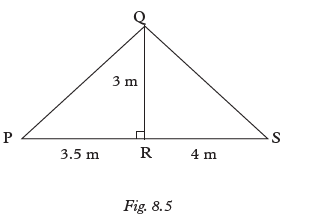
(a) Use Pythagoras theorem in triangle PQR to find the length
of PQ(b) Calculate the length QS
3. Fig 8.6 below shows an isosceles triangle with a base of length 4 m and
perpendicular height 8 m. Calculate length labeled x of one of the equal
sides.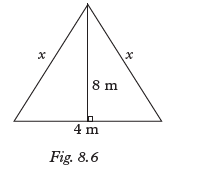
4. The diagram in Fig 8.7 shows a vertical flagpole of height 5.2 m with
a rope tied to the top. When the rope is pulled tight, the bottom end is
3.8 m from the base of the flagpole. Calculate the length of the rope.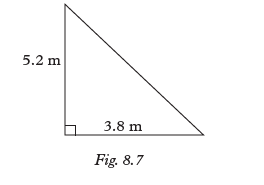
8.2 Median theorem of a rightangled triangle
Activity 8.2
1. Using a ruler and pair of compass or protractor, draw any rectangle
ABCD with measurements of your choice.2. Draw the diagonals AC and BD and label the point of their intersection
as E.3. Measure and compare the diagonal segments BE and ED, and AE with
EC. What do you notice? What can you say about the diagonals of a
rectangle?4. Consider the right angled-triangle ABD in Fig. 8.8 below isolated
from rectangle ABCD.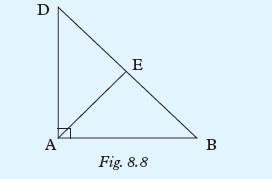
(a) Measure and compare the segment BE and DE of the
hypotenuse. What do you notice?(b) In what proportions does point
E divide the hypotenuse DB? What is the name of point E in
relation to side DB?(c) What is the name of line AE that is drawn to from vertex A
to point E?(d) Measure and compare the length of AE to the hypotenuse
DB. What do you notice?Activity 8.3
1. Draw any right-angled triangle PQR, with dimensions of your
choice and ∠Q = 90°.2. Measure and locate the midpoint of the hypotenuse PR and label it
S. Join vertex Q to points with a straight line.3. Measure and compare the lengths QS and the hypotenuse PR. What
do you notice?4. Measure and compare the lengths QS with PS and RS. What do you
notice?.Consider a right-angled triangle. A line drawn from any vertex of the triangle to
the midpoint of the side opposite to that vertex is called a median, Fig. 8.9 below.
XR, ZV and YU are the medians of triangle XYZ (Fig. 8.9).
Let us consider the median XW from the right-angled vertex X to the midpoint W of
the hypotenuse YZ as shown in Fig. 8.10.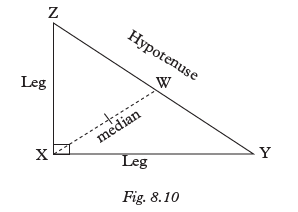
We observe the following:
WX = 1/2YZ
Hence WX = WZ = WY.Theorem
The median theorem of a right-angled
triangle states that: the median from the right angled vertex to the
hypotenuse is half the length of the hypotenuse.Median = 1/2 Hypotenuse
As such, that median subdivides the
right-angled triangle into two similar
isosceles triangles.Example 8.2
In a right-angled triangle ABC, line BC is the hypotenuse and AN is 5 cm long.
What is the length of the hypotenuse?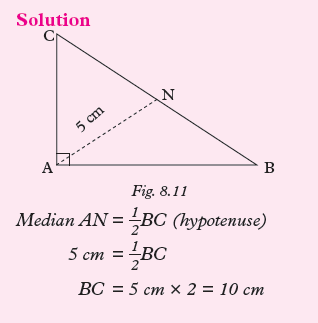
Example 8.3
In a right-angled triangle, the median to the hypotenuse has a length of (3x –
7) cm. the hypotenuse is (5x – 4) long. Find the value x, hence find the length
of the hypotenuse.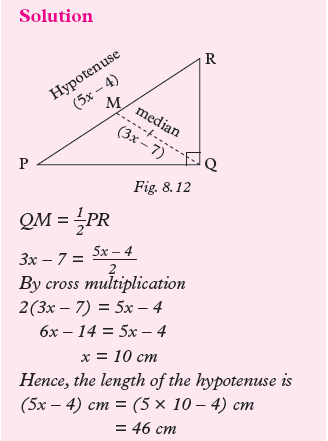


Exercise 8.2
1. In a right-angled triangle, the median to the hypotenuse is 4.5 cm. What is
the length of the hypotenuse?2. One leg of a right triangle is 12 cm. The median to the hypotenuse is
7.5 cm. Find the:(a) length of the hypotenuse.
(b) length of the other leg of the hypotenuse.
3. The two legs of a right-angled triangle are 4.5 cm and 6 cm long. Find the
length of the median from the rightangled vertex to the hypotenuse.4. Triangle KLM is right-angled at vertex L and ∠LKM = 24°. N is the
midpoint of the hypotenuse KM . Find the value of angle:(a) KLN (b) LNM
5. In a right-angled triangle EFG, the hypotenuse is (3x + 8)cm long. The
median to the hypotenuse is (5x – 10) long. Find the value of x hence find
the length of the median.8.3 Altitude (Height) theorems of a right-angled triangle
Activity 8.4
Materials: Manila paper, protractor, ruler, pencil, a pair of compasses.
1. Draw a right-angled triangle ABC with dimensions of your
choice on a manila paper.2. Drop a perpendicular from the right-angled vertex C to intersect
the hypotenuse at point N. Line NC is known as the altitude of
the triangle.3. Cut off triangles ANC and NBC from the manila paper.
4. Rotate the triangular cut out NBC by 90° anticlockwise.
6. Test triangles ANC and CNB for similarity using equality of
corresponding angles. What do you notice?Activity 8.5
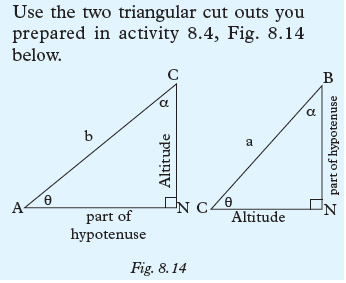
1. Measure the length of the altitude CN and each of the two segments
of the hypotenuse i.e. AN and NB.2. Determine and compare the ratios of the corresponding sides
NC/AN and NB/NC . What do you notice?A line drawn from any vertex of a triangle to intersect the side opposite
to the vertex perpendicularly is known as an altitude of the triangle.
The altitude from the right-angled vertex of a right-angled triangle to
the hypotenuse divides the triangle into two similar triangles. The
corresponding those two angles are equal.For example, triangle EFG(Fig 8.15) forms two similar triangle, EHG and
GHF, when cut along the altitude GH as shown in Fig. 8.15.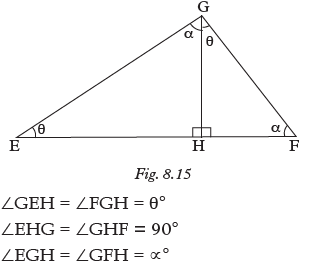
Consider a right-angled triangle EFG with the altitude drawn from the right-angled
vertex G to the hypotenuse.
This is the mathematical representation of the
altitude theorem of a right-angled triangle.Thus, the altitude theorem of a rightangled
triangle states that,“The altitude to the hypotenuse of a right-angled triangle is the mean
proportional between the segments into which it divides the hypotenuse.”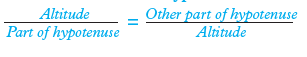
Example 8.5
In a right-angled triangle ABC, AD is the altitude from vertex A to the
hypotenuse. If AD = 6 cm and DC = 9 cm, find the length of segment BD
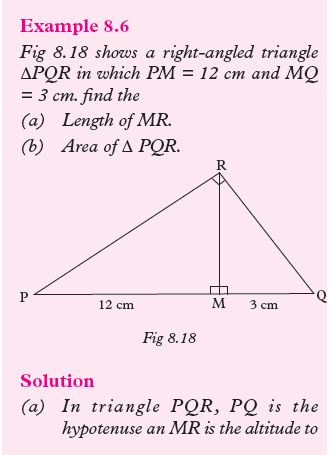
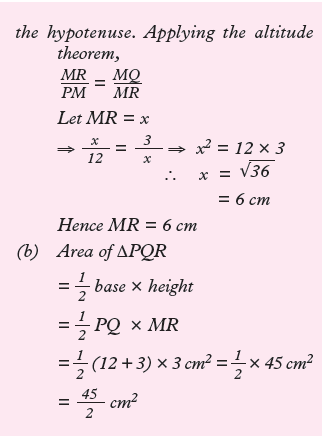
Exercise 8.3
1. Find the length AD in triangle ABC in Fig. 8.19 given that DC = 10 cm
and DB = 8 cm.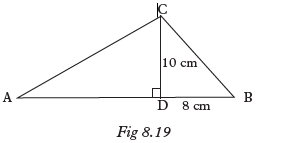
2. Find the length MP in triangle MNO shown in Fig. 8.20 given that OP = 4
cm and NP = 12 cm.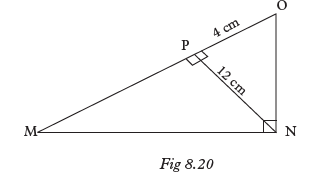
3. In the right-angled triangle EFG shown in Fig. 8.21, EH = 4 cm and
HF = 9 cm. Find the altitude to the hypotenuse.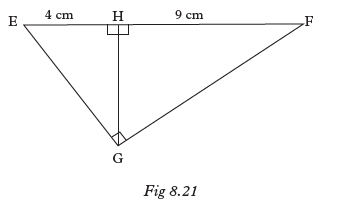
4. In triangle PQR shown in Fig. 8.22, PQ = 7 cm, PS = 3.6 cm and SQ is
the altitude to the hypotenuse. Find the length: (a) SQ (b) SR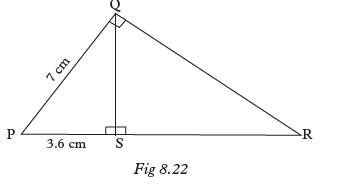
5. The altitude to the hypotenuse of a right-angled triangle is 8 cm long. If
the hypotenuse is 20 cm long, what are the lengths of the two segments of
the hypotenuse?6. The altitude to the hypotenuse of a right-angled triangle divides the
hypotenuse into segments that are 12 cm and 15 cm long. Find the
length of the altitude.7. Find the value of x in triangle KLM shown in Fig 8.23 given that
KM = (x + 5) cm, NL = x cm and NM = 6 cm.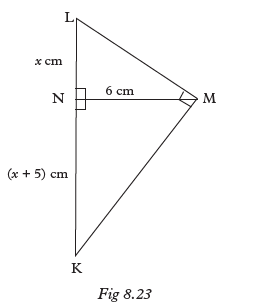
8. Triangle EFG is right angled at F. FH is the altitude to the hypotenuse and
has length of 10 cm. If the lengths of the two segments EH and HG of the
hypotenuse are in the ratio 1 : 4, find their actual lengths in centimetres.
(Hint: Sketch the triangle and let EH = x)9. The length of the hypotenuse of a right-angled triangle is 29 cm.
If the length of the altitude from the hypotenuse is 10 cm long, find the
lengths of the two segments of the hypotenuse.10. The legs of a right-angled triangle are 4.5 cm and 6 cm long. Calculate
the length of the altitude to the hypotenuse of the triangle.8.4 Leg theorem of a right-angled triangle
Activity 8.6
1. Draw and cut out on a manilapaper two identical right angled
triangular cut outs ABC with the dimensions AC = 8 cm, CB = 6
cm AB = 10 cm and ∠ACB =90°.2. One of the cut out, drop a perpendicular from vetex C to
meet the hypotenuse at point D.3. Cut out the two triangles ADC and DBC and compare each of
them with the ‘mother’ triangular cut out ABC (the represented by
the unsubdivided cut out).4. Test each of similarity with the ‘mother’ triangle using the
corresponding angles. What do you notice?
Measure and compare the ratios of:
What do you notice?
Measure and compare the ratios;
What do you notice?
Activity 8.7
Look at the right-angled triangles EFG and PQR in Fig 8.24 and Fig.8.25.

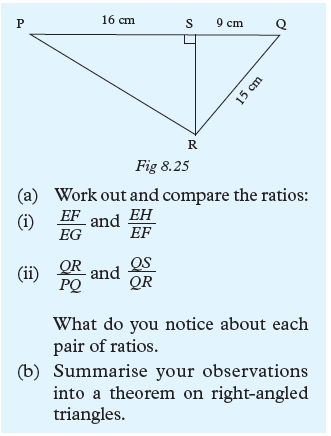
Consider triangle UVW
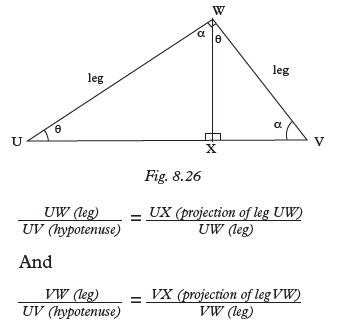
These observations are summarized into what is known as the leg theorem.
It states that “the leg of a right-angled triangle is the mean proportional betweenthe hypotenuse and the projection of the leg on the hypotenuse.” This is
mathematically represented as;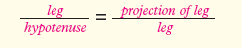
Example 8.7
Fig. 8.27 below shows a right angled triangle in which AB = 12 cm, AD = 3 cm
and CD is the attitude to the hypotenuse. Find the length AC.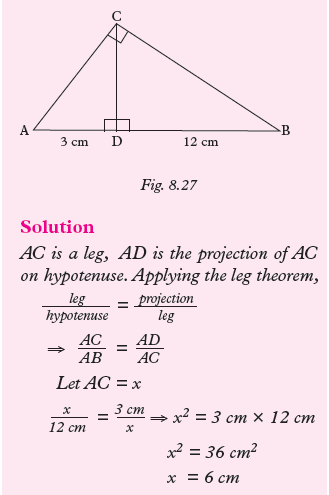
Example 8.8
Fig. 8.28 shows a right-angled triangle
PQ in which PQ = 6 cm. QT = 3.6 cm.
Find the length of RT. Hence or otherwisefind the length of QR.
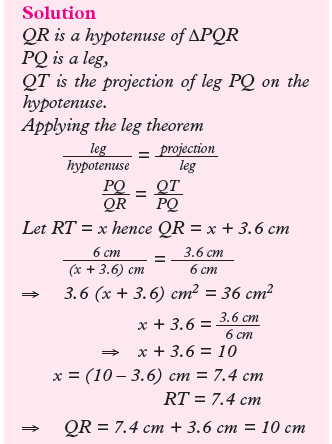
Exercise 8.4
1. Find the length of AC in the rightangled
triangle ABC shown in Fig.8.29.
2. What is the length PR in the rightangled triangle PQR shown in Fig.
8.30 below given that PS = 6 cm and PQ = 14 cm?

3. Find the length NP in triangle MNO shown in Fig. 8.31 below. NO = 10 cm.

4. What are the lengths of BD and AC in triangle ABC, Fig. 8.32, given that
AD = 8 cm and CD = 12 cm?
5. Find the length of WX in triangle WXY, Fig. 8.33, given that WY = 7 cm
and YB = 9 cm.
6. The hypotenuse of a right-angled triangle is 5 cm long and the longer
leg of the triangle is 4 cm long. What is the length of the projection of the
shorter leg on the hypotenuse?7. In triangle UVW in Fig. 8.34,
UX = 6 cm and VW = 8 cm.
Find: (a) XV (b) XW
8. Fig. 8.35 below shows triangle KLM.
Given that KM = 12 cm, ML = 9cm and KL = 15 cm, find;
(a) KN (b) NL (c) NM
9. In Fig. 8.36, O is the centre of the circle. PR = 12 cm and PT = TU = UR.
Find; (a) QR (b) PQ (c) SU
10. The altitude to the hypotenuse of a right-angled triangle EFG divides
the hypotenuse into 9 cm and 12 cm segments.
Find the lengths of the:
(a) altitude to the hypotenuse(b) shorter leg of triangle EFG
(c) longer leg of triangle EFG.
8.5 Introduction to trigonometry
Activity 8.8
With reference to angle θ, name the adjacent side, the opposite side and
the hypotenuse in each of the triangles in Fig. 8.37.

The word ‘trigonometry’ is derived from
two Greek word: trigonon meaning a triangle and metron, meaning measurement. Thus
trigonometry is the branch of mathematics concerned with the relationships between
the sides and the angles of triangles. In trigonometry, Greek letters are used
to indicate, in a general way, the sizes of various angles.
The most commonly used of these letters
are:
α = alpha; β = beta; γ = gamma;
δ = delta; θ = theta; φ = phi;
ω = omega.In senior 2, we studied the relationship between the lengths of the sides of a
right-angled triangle, which is known as the Pythagorean relationship. In this unit,
we shall study the relationships between the acute angles and the sides of a rightangled
triangle.The sides of such a triangle are named, with reference to specific angle e.g. θ, as
shown in Fig. 8.40.
If C is used as the reference angle in Fig 8.41 AB becomes the opposite
side and BC the adjacent side. These
definitions of the sides apply to any rightangled
triangle in any position.
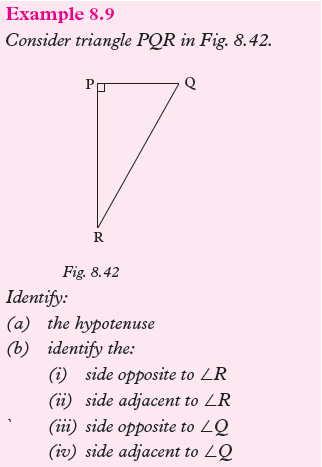
Solution
(a) hypotenuse is QR(b) (i) PQ (ii) PR (iii) PR
(iv)PQExercise 8.5


8.6 Trigonometric Ratios
In any right-angled triangle, there are three basic ratios between the sides of
the triangle with reference to a particular acute angle in the triangle. They are sine,
cosine and tangent.8.6.1 Sine and cosine of an acute angle
Activity 8.9


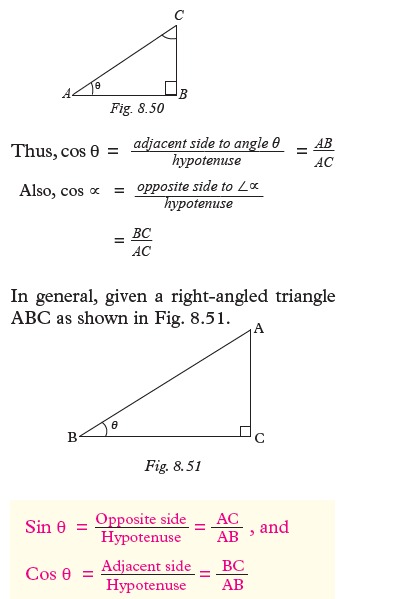
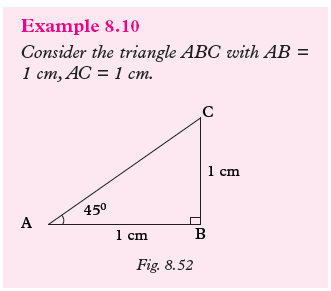
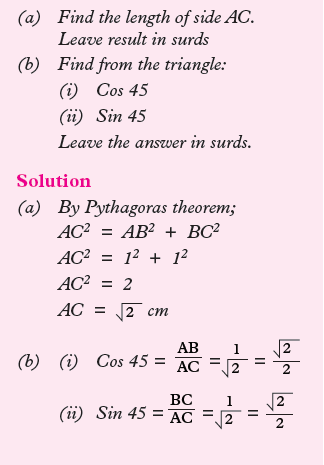
Exercise 8.6
1. By drawing and measuring, find the approximate values for:
(a) sin 20°, cos 20°(b) sin 42°, cos 42°
(c) sin 65°, cos 65°
(d) sin 78°, cos 78°
2. Find, by drawing and measuring, approximate sizes of the angles whose
sines and cosines are given below.
(i) sin I = 0.65
(j) cos J = 0.23
(k) cos K = 0.34
(l) cos L = 0.56
Hint for parts (g) to (l): First convert the decimals into fractions.8.6.2.1 Finding sine and cosine using calculators
Activity 8.10
Use your scientific calculator to find the sines and cosines of the following.
(a) 32º (b) 17.89º (c) 73.5º
Note that as the angles increase from
0° to 90°,
(i) their sines increase from 0 to 1, and(ii) their cosines decrease from 1 to 0.
Example 8.11
Use calculators to find the value of:
(a) sin 53.4° (b) cos 71.2°Solution
(a) Press sin, type 53.4º press =
(0.802817… is displayed)
Thus, sin 53.4° = 0.802 8(b) Press cos, type 71.2º press =
(0.3222656… is displayed)
Thus,cos 71.2° = 0.322 3Example 8.12
Use a calculator to find the angle whose
(a) sine is 0.866(b) cosine is 0.7071
Solution
(a) Let θ be the angle whose sine is 0.866.
So, Sin θ = 0.866.
We use sin-1 function called Sine
inverse to find the value of angle θ
∴ θ = sin-1 (0.866) = 60º.On your scientific calculator, press shift,
press sine button, type 0.866, press equal
signs.We get θ = 60°
(b) Let ∝ be the angle whose cosine is
0.7071
So, Cos ∝ = 0.7071
We use cos-1 function called Cosine
inverse to find the value of angle ∝
∴ θ = cos-1 (0.7071) = 45ºOn your scientific calculator, press shift, press cosine button, type 0.7071, press
equal signs.We get θ = 45°
Exercise 8.7
1. Use calculators to find the sine of:
(a) 3° (b) 13° (c) 70°(d) 63° (e) 13.2° (f) 47.8°
(g) 79.2°
2. Use calculators to find the cosine of:
(a) 18° (b) 27° (c) 49°
(d) 70° (e) 19.5° (f) 36.6°
(g) 77.7°
3. Use calculators to find the angle whose sine is:
(a) 0.397 1 (b) 0.788 0(c) 0.927 8 (d) 0.996 3
(e) 0.948 9 (f) 0.917 8
4. Use calculators to find the angle whose cosine is:
(a) 0.918 2 (b) 0.564 1(c) 0.123 4 (d) 0.432 1
(e) 0.880 1 (f) 0.555 5
8.6.2.2 Using sines and cosines to find angles and lengths of sides of
right-angled trianglesActivity 8.11
Use your knowledge of sines and cosines to find the values of unknown
sides and angles in the following triangles.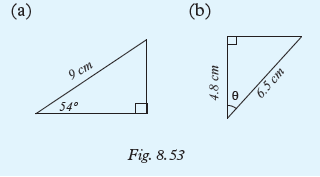

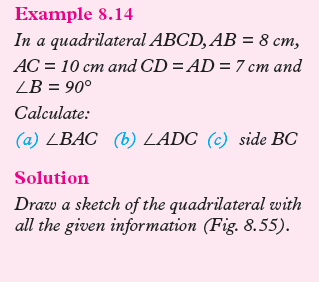
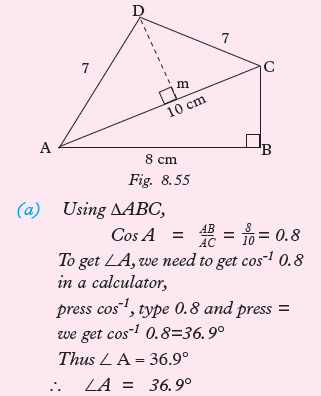
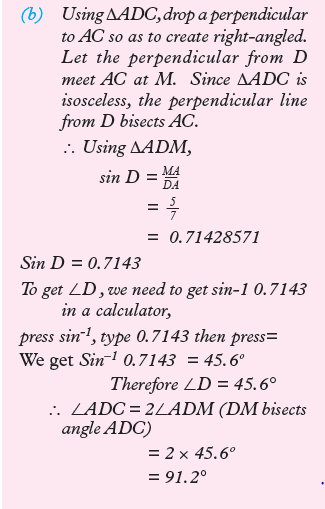

Exercise 8.8
1. In Fig.8.56, find the lengths marked with letters.The lengths are in
centimetres. Give your answer correct to 3 decimal places.
2. Find the lengths marked with letters in Fig. 8.57. Measurements are in
centimetres. Give your answers to 3 significant figures.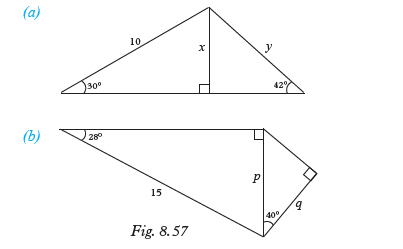
8.6.2 Tangent of an acute angle
8.6.2.1 Definition of tangent of an angle
Activity 8.12
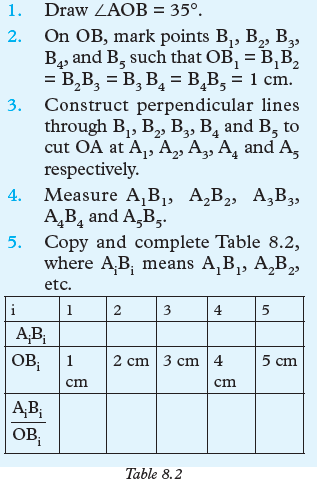
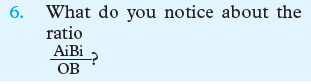
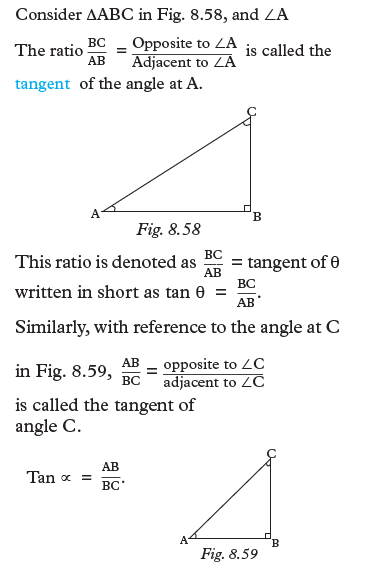
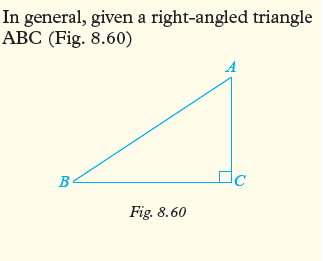

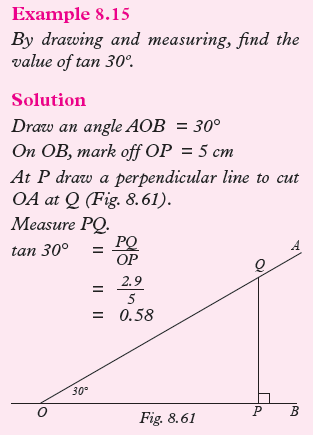
Example 8.16
By drawing and measuring, find the
angle whose tangent is 2/3 .Solution
Let the angle be θ.
tan θ = opposite/adjacent = 2/3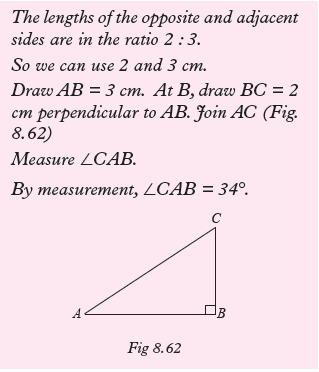
Exercise 8.9
1. Find the tangents of the following angles by drawing and measuring.
(a) 40° (b) 45° (c) 50°(d) 25° (e) 33° (f) 60°
2. By drawing and measuring, find the angles whose tangents are as follows:
(a) 1/4 (b) 2/5 (c) 3/7(d) 5/4 (e) 6/5 (f) 7/4
(g) 8/3
8.6.2.2 Use calculators to find tangent of angles and angles
given their tangentsActivity 8.13
Use scientific calculator to find tangent of:
(a) 7° (b) 13.6° (c) 50°In lower levels, we learnt how to use calculators in simple mathematical
operations. We can also use calculators to find tangents, cosines or sines of given
angles. The following examples will show how to find tangents of given angles.Example 8.17
Use calculators to find the tangents of
the following:
(a) 67° (b) 60.55° (c) 38.88º.Solution
(a) (Press tan, type 67 and press) =
tan 67° = 2.355 9(b) To find tan of 60.55°:
Press tan enter 60.55
Press =, (1.7711 is displayed)∴ tan 60.55º = 1.771 1
(c) tan 38.88°
Press tan, type 38.88
Press = (0.8063 is displayed∴ tan 38.88° = 0.806 3
Example 8.18
Use a calculator to find the angle whose
tangent is:
(a) 1.28 (b) 0.875Solution
We use the function tan-1 read as inverse
to find the angle whose tangent is given.(a) tan-1 1.28
Press tan-1, type 1.28 then press =
We get tan-1 1.28= 52º
The angle is 52º.(b) tan-1 0.875
Press tan-1, type 0.875 then press =
We get tan-1 0.875= 41.1º
The angle is 41.1º.Exercise 8.10
Use a calculator to find the tangents of the
following angles:
(a) 7° (b) 13.6° (c) 50°(d) 47.7° (e) 80.5° (f) 2.21°
(g) 18.46°
(j) 51° (k) 64° (l) 73°
8.6.2.3 Using tangents to find lengths of sides and angles of
right-angled trianglesActivity 8.14
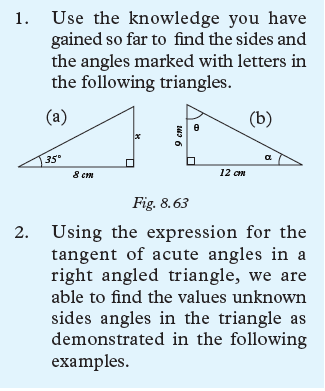
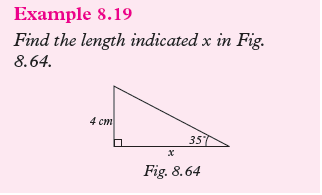
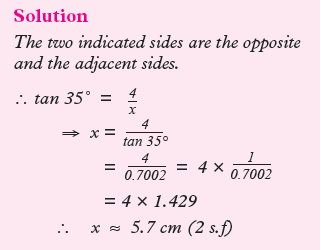
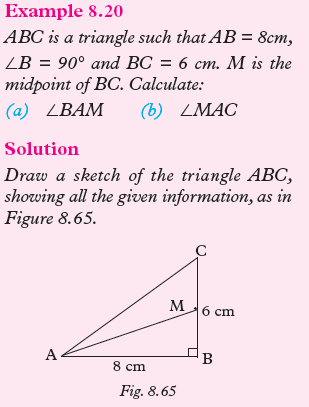
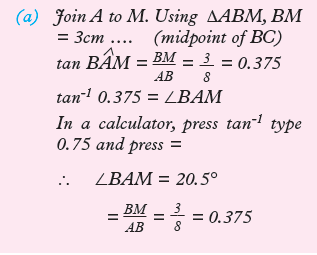

Exercise 8.11
1. Find the length of the side indicated in each of the triangles in Fig. 8.66.
State your answer to 3 s.f.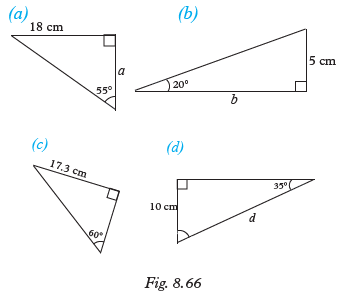
2. Find the length of the side indicated in each of the triangles in Fig 8.67.
State your answer in 3 s.f.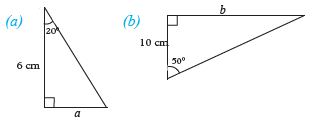

3. For this question, use ΔABC which is right angled at B to calculate the
required angle given the following information;
(a) AB = 8 cm, BC = 4.25 cm.
Calculate angle BAC.(b) AB = 12cm, BC = 5 cm.
Calculate ∠A.(c) AC = 6 cm, BC = 2.82 cm.
Calculate ∠A.(d) AC = 9 cm, AB = 5.03 cm.
Calculate ∠BAC.(e) AC = 15 cm BC = 11 cm,
calculate ∠ACB.8.6.3 Application of trigonometic ratios (sine, cosine and tangent)
Activity 8.15
Let A be the foot of the tower and x be the height of the tower which can be
viewed from points B and C at angles α and β as Fig 8.68 below shows. Points
B and C are a cm apart.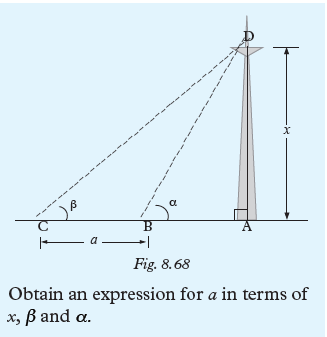
The following examples illustrate some of the calculations involved when faced with
real life situations.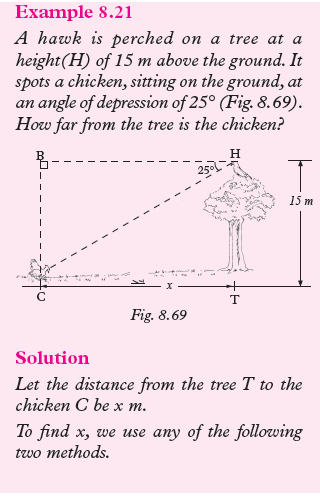
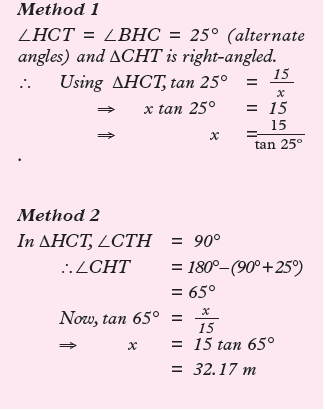
Note that 65° is the complement of 25°, and that it is easier to multiply 15 by tan
65° (Method 2) than to divide 15 by tan 25° (Method 1). Hence, given a problem
like the one above, it is better to find the complement of the given angle and then
use it to solve the problem. However, if you are using a calculator, either method will do.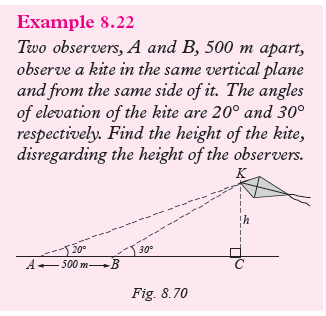
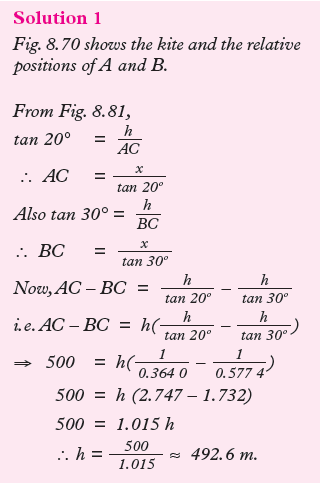
Exercise 8.12
1. A ladder of length 5.5 m rests against a vertical wall so that the angle
between the ladder and the ground is 60°. How far from the wall is the foot
of the ladder?2. A boy is flying a kite using a string of length 56 m. If the string is taut
and it makes an angle of 62° with the horizontal, how high is the kite?
(Ignore the height of the boy).3. Find the dimensions of the floor of a rectangular hall given that the angle
between a diagonal and the longer side is 25° and that the length of the
diagonal is 10 m.4. A plane takes off from an airport and after a while, an observer at the top of
the control tower sees it at an angle of elevation of 9°.
At that instant, the pilot reports that he has attained an altitude of 2.4 km.
If the height of the control tower is 50m, find the horizontal distance that
the plane has flown?5. After walking 100 m up a sloping road, a man finds that he has risen 30
m. What is the angle of slope of theroad?6. The tops of two vertical poles of heights 20 m and 15 m are joined by
a taut wire 12 m long. What is the angle of slope of the wire?7. A man walks 1 000 m on a bearing of 025° and then 800 m on a bearing of
035°. How far north is he from the starting point?8. Two boats A and B left a holiday resort at the coast. Boat A travelled 4
km on a bearing of 030° and boat B travelled 6 km on a bearing of 130°.(a) Find which boat travelled further eastwards and by how much.
(b) How far to the north is boat A from boat B?
9. A bridge crosses a river at an angle of 60°. If the length of the bridge is
170 m, what is the width of the river?10. A man sitting at a window with his eye 20 m above the ground just sees
the sun over the top of a roof 45 m high. If that roof is 30 m away from
him horizontally, find the angle of elevation of the sun.11. The shaft of a mine descends for 100 m at an angle of 13° to the horizontal
and then for 200 m at an angle of 7° to the horizontal. How far below the
starting point is the end of the shaft?12. Two girls, one east and the other west of a tower, measure the angles
of elevation of the top its spire as 28° and 37°. If the top of the spire is 120 m
high, how far apart are the girls?13. Jacob and Bernard stand on one side of a tower and in a straight line with
the tower. They each use a clinometer and determine the angle of elevation
of the top the tower as 30° and 60° respectively. If their distance apart is
100 m, find the height of the tower.14. Fig. 8.71 shows the side view of an ironing board. The legs are all 95 cm
long and make 60° with the floor when completely stretched.(a) How high is the ironing surface from the floor, given that the
board is 2.5 cm thick?(b) How far apart are the legs at the floor?
Unit Summary
• Pythagoras theorem Consider the right-angled triangle
ABC shown in Fig 8.72.
Pythagoras theorem states that a2 + b2 = c2
• The median theorem of a rightangled triangle states that.
The median from the right-angled vertex to the hypotenuse is half the
length of the hypotenuse. Consider the right angled triangle
XYZ Fig. 8.73.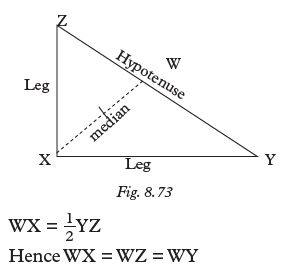
• The altitude theorem of a right angled triangle states that:
“The altitude to the hypotenuse of a right-angled triangle is the mean
proportional between the segments into which it divides the hypotenuse.”
Consider the right-angled triangle EFG. Fig. 8.74.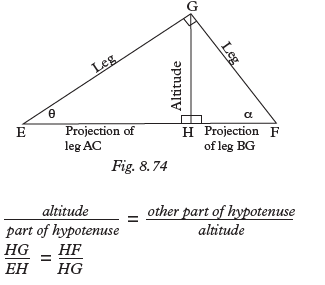
• The leg theorem of a right-angled triangle states that “the leg of a
right-angled triangle is the mean proportional between the hypotenuse
and the projection of the leg on the hypotenuse.” It can be simply
presented as;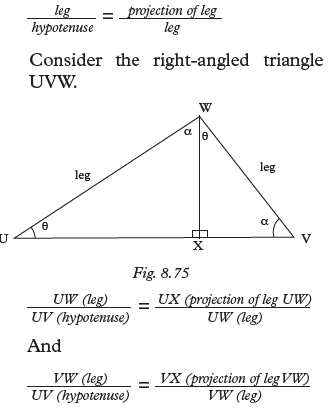
• Naming of sides and angles in a right angled triangle
c
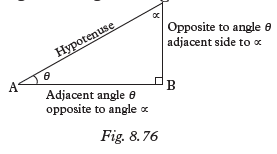
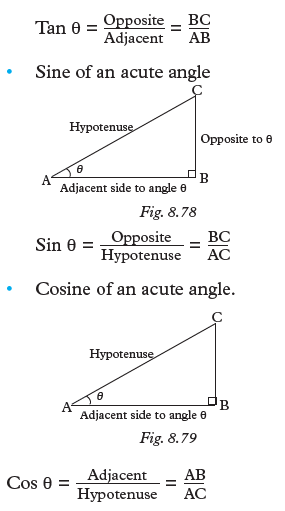
Unit 8 Test
1. Find the missing sides in Fig. 8.80. (Measurements are in cm).
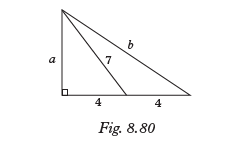
2. A ladder which is 6 m long leans against a wall. If the top of the ladder
is 4 m above the ground, how far from the wall is the foot of the ladder?3. In a right-angled triangle, the median to the hypotenuse is 6.4 cm. What is
the length of the hypotenuse.4. In a right-angled triangle the length of the median to the hypotenuse is
(3x – 7) cm long. The hypotenuse is
(5x – 4) cm long. Find the length of the hypotenuse.5. Find the lengths of the sides marked with letters in the following triangle.
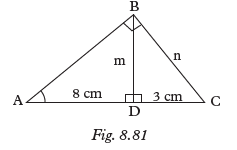
6. A right-angled triangle ABC has its leg a = 5 cm long and altitude to the
hypotenuse h = 3 cm. Find the length of sides b and c.7. In a right-angled triangle the altitude
to the hypotenuse is 8 cm high. The hypotenuse is 20 cm long. Find
the lengths of the segements of the hypotenuse (Hint: let the length of
the segment be x.)8. Find the length AB in the triangle ABC below Fig. 8.82.
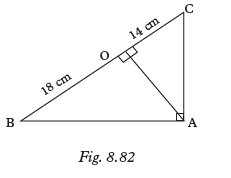
9. A boat is 300 m from a vertical cliff. The angle of elevation of the top of
the cliff is 30°. After the boat moves a distance x metres towards the cliff,
the angle of elevation becomes 70°. Find the value of x, to the nearest 1 m.10. Two tall buildings A and B are 40 m apart. From foot A, the angle of
elevation of the top of B is 60°. From the top of A, the angle of depression
of the top of B is 30°. Find the heights of A and B, to the nearest 1 m.11. Find the value of the side marked with letters in the following figures:
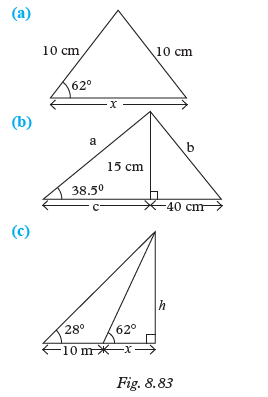
Unit 9 :CIRCLE THEOREM
Key unit competence
By the end of the unit, learners should be able to construct mathematical arguments
about circles and discs. Use circle theorems to solve related problems.Unit outline
• Elements of circles and discs.
• Circle theorem.
Introduction
Unit Focus Activity
1. Research from reference books or Internet the angle theorems for circles.
2. Apply the theorems to find the values of angles given in Fig. 9.1
below given that K, L, M and N are points on the circumference of
a circle centre O. The points K, O, M and P are on a straight line.
3. State the reasons and theorem supporting for your in each case.
4. Compare your solutions with those of other classmates in a class
discussion.In P5, we already learned some basics concepts about circles, their properties and
how to get their area and circumference. We also learnt types of angles and he
angle sum in a triangle. In this unit, we will investigate the relationships between
angles when they are drawn in a circle. Let us begin this by refreshing our knowledge
on elements of a cricle.9.1 Elements of a circle and disk
Activity 9.1
1. Use a pair of compass and a pencil to draw any circle in your exercise
books.The basic elements of a circle are:
(a) Centre – Is a point inside the circle and is at an equal distance from the
point on the circumference.2. Draw a straight line that passes through the centre of the circle
and measure the distance from the centre of both ends.3. Cut off the circle you have drawn using a razor blade or scissors.
4. Label its parts.
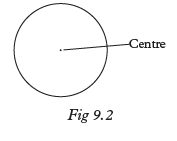
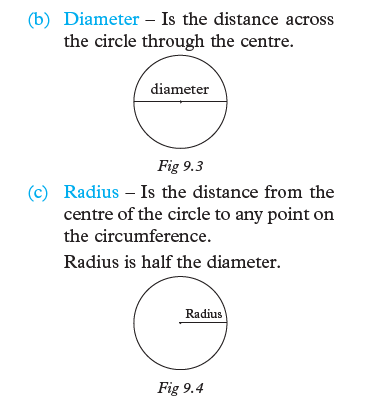


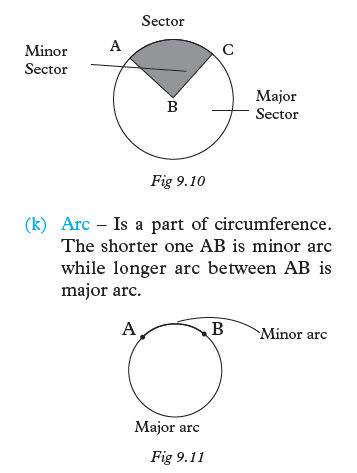
9.2 Circle theorem
9.2.1 Angles at the centre and the circumference of a circle
Activity 9.2
1. Draw a circle of centre O with any convenient radius.
2. Mark two points A and B on the circumference such that AB is a
minor arc.3. Mark another point P on the major arc AB.
4. Draw angles AOB and APB.
5. Measure ∠AOB and ∠APB.
6. What is the relationship between the two angles?
7. Compare your observations with those of other members of
your class. What do you notice?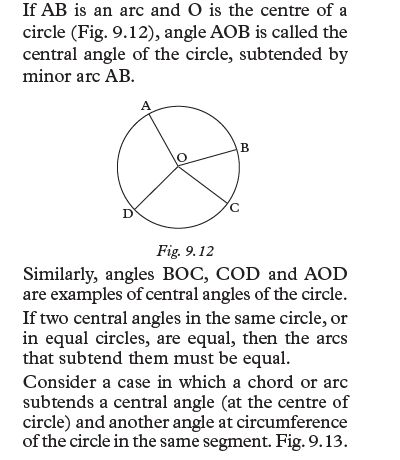
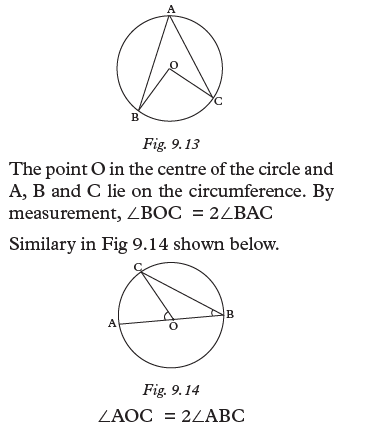
Theorem 1
Angle subtended at the centre of a circle is twice the angle subtended
by the same chord or arc on the circumference of the same circle in
the same segment.Proof
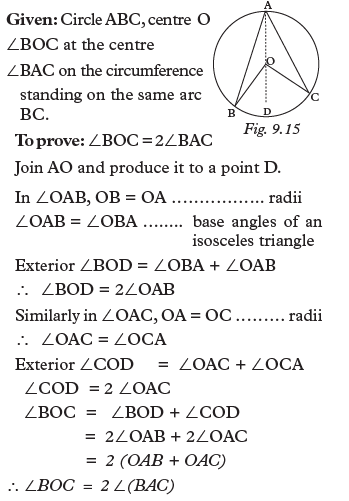
Note:
This theorem also relates the reflex angle subtended at the centre by a chord with
the angle subtended by the same chord in the minor segment as shown in Fig 9.16
below.
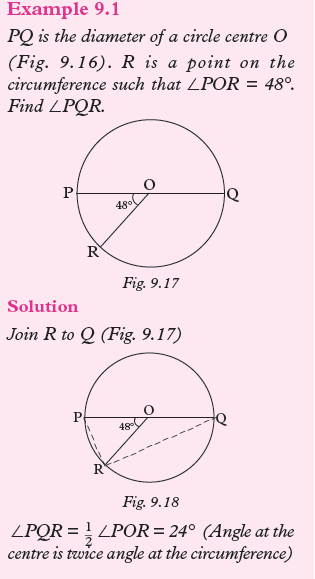

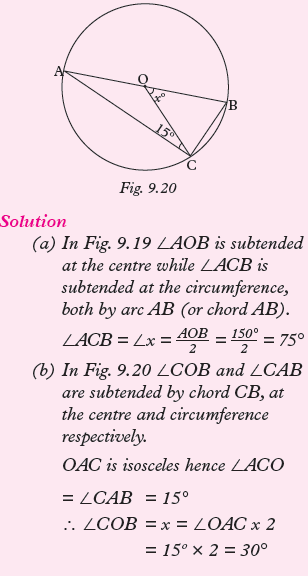
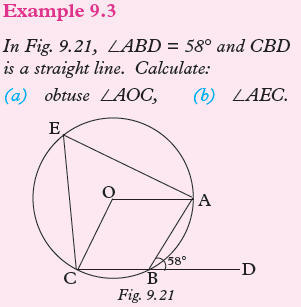
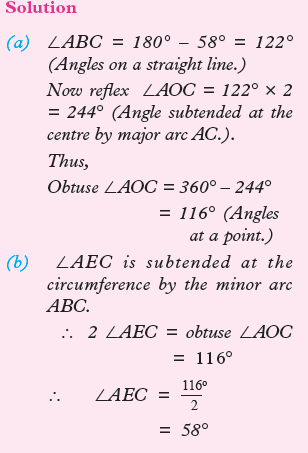
Exercise 9.1
1. In Fig. 9.22 below, O is the centre and AC is the diameter.

(a) If a = 24°, find x.
(b) If x = 62°, find b.
(c) If a = 52°, find b.
(d) If b = 28°, find a.
(e) Express x in terms of a.
(f) Express b in terms of a.
2. In Fig. 9.23, O is the centre of the circle. If c = 47°, find d and p.
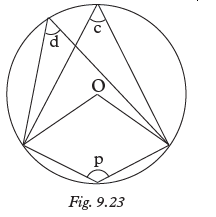
3. AB is the diameter of a circle and C is any point on the circumference. If
∠BAC = 2∠CBA, find the size of angle BAC.4. ABC is a triangle such that points A, B and C lie on circumference of a
circle, centre O. If AC = BC and angle AOB = 72°, find angle BAC.9.2.2 Angle in a semicircle
Activity 9.3
1. Draw a circle, centre O, using any convenient radius.
2. On your circle draw a diameter AB.
3. Mark another point C on the circumference and join A to C and
B to C.4. Measure angle ACB.
5. Compare your result with those of other members of your class. What
do you notice?
We can apply what we have just learned about the angle at the centre of a circle
and prove that the angle in a semicircle is always a right angle.Theorem 2
The angle subtended by the diameter at any point on the circumference of
a circle is a right angle.
Proof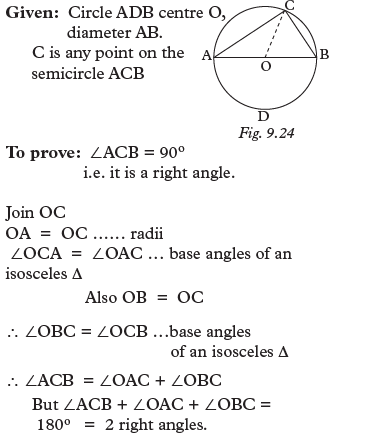


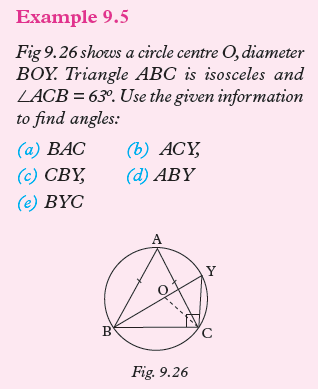
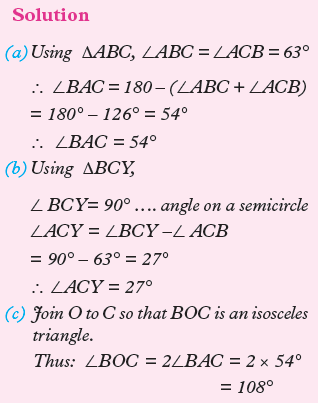
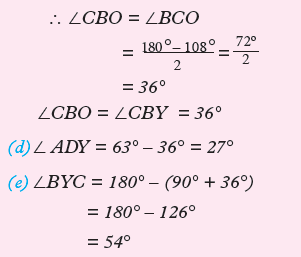
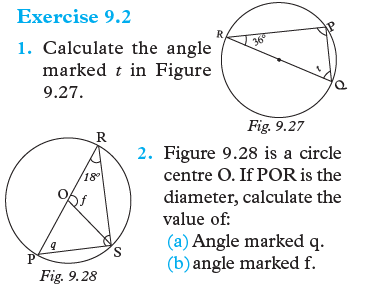
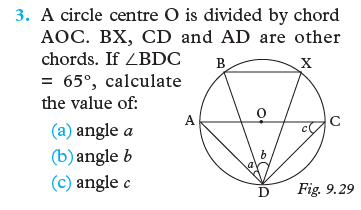
9.2.3 Angles in the same segment
Activity 9.4
1. Draw a circle centre O, with any convenient radius.
2. Mark off a minor arc AB.
3. On the major arc AB, mark distinct points P, Q, R and S.
4. Join each of the points in (3) above so as to form angles APB, AQB,
ARB and ASB.5. Measure the angles.
6. What do you notice about the sizes of the four angles?
Do your classmates have the same observation?We have already learnt that, a chord divides
the circumference into two arcs, a major and
a minor arc.If AB is a minor arc and P is any point on the major arc (Fig. 9.30), then ∠APB is the
angle subtended by the minor arc AB at the circumference of the circle.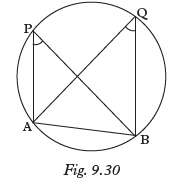
If Q is another point on the major arc AB (Fig. 9.30), ∠APB and ∠AQB are both
subtended at the circumference by the minor arc AB or chord AB. Such angles
are said to be in the same segment. Consider Fig. 9.31 below which ∠AEB
and ∠AGB are subtended by chord AB onto the circumference on the major
segement.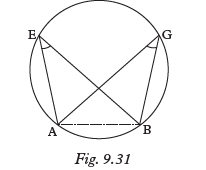
By measurement, ∠AEB = ∠AGB
Similarly, consider Fig. 9.32 below
∠ACB and ∠ADB that are subtended by chord AB or by the major arc AB at the
circumference. These are also angles in the same segment. Are they also equal? Check
by measuring.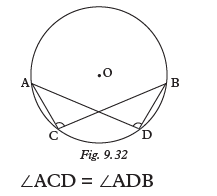
Theorem 3
Angles subtended on the circumference
by the same chord in the same segment are equal.Proof
Given: Circle centre O
Chord BC (Fig. 9.33)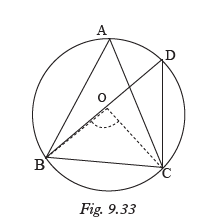
Let ∠BAC and ∠BDC be the angles
subtended by the chord BC on the major
arc BADC.
To prove: that ∠BAC = ∠BDC
Construction: Join BO, OC.
Proof: ∠BOC = 2 ∠BAC ………angle
at the centre of a circle is twice the
angle subtended by the same chord
on the circumference.Similarly, ∠ BOC = 2 ∠BDC.
∴ ∠BAC = ∠BDC.Activity 9.5
1. Draw a circle with any convenientradius.
2. On the circumference, mark points A, B, C and D such that
chord AB has the same length as chord CD.3. On major arc AB mark point P and on major arc CD mark point Q.
4. Draw angles APB and CQD.
5. Measure the angles APB andCQD.
6. What do you notice about thesizes of the angles?
7. Using a piece of sewing thread, measure the lengths of the minor
arcs AB and CD. What do you notice about their lengths?In this activity, we also learn that:
1. Equal arcs of the same circle subtend equal angles at the circumference.2. Equal chords of the same circle cut off equal arcs.
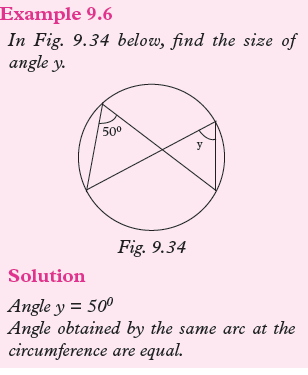
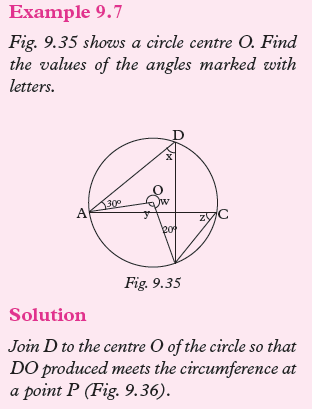
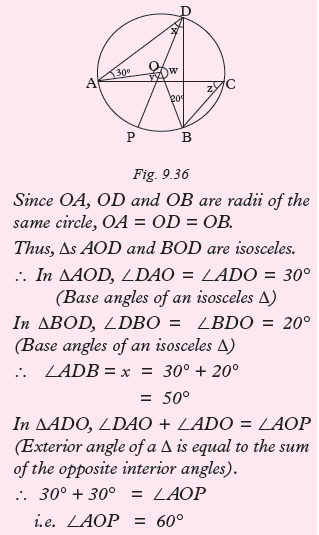
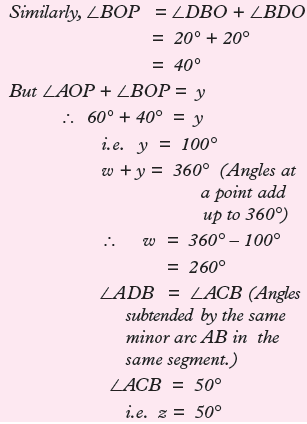
Example 9.8
ABCDE is a regular pentagon inscribed in a circle (Fig. 9.37). Show
that ∠ACD = 2 ∠ACB.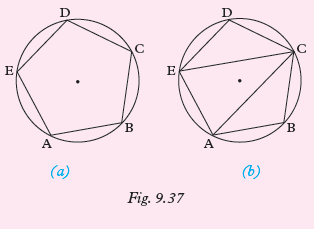
Solution
With reference to Fig. 9.37 (b), ∠ACB is subtended at the circumference of the
circle by the minor arc AB. ∠ECA is subtended at the circumference
of the circle by the minor arc AE. ∠DCE is subtended at the circumference
of the circle by the minor arc DE. But arcs AB, AE and DE are equal.
Therefore, they subtend equal angles at the circumference.
∴ ∠ACB = ∠ECA = ∠DCE
But ∠ACD = ∠ACE + ∠ECD∴ ∠ACD = 2∠ACB
Exercise 9.3
1. Find x and y in Fig. 9.38 below.
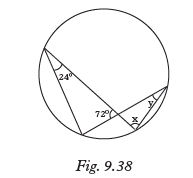
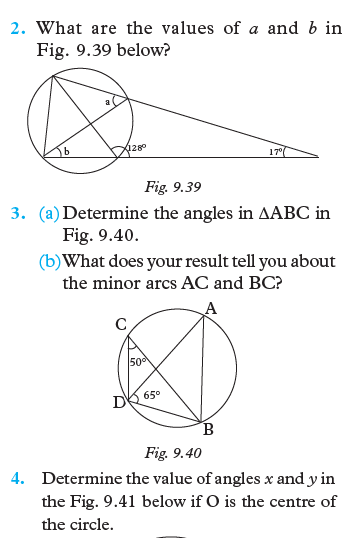
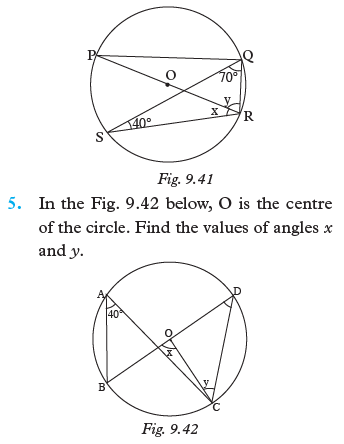
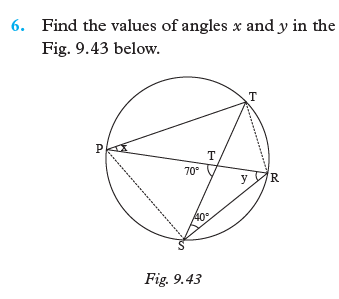
9.2.4 Angles in a cyclic quadrilateral
Activity 9.6
1. Draw a circle centre O using any convenient radius.
2. On the circumference, mark points A, B, C and D in that order and join
them to form a quadrilateral.3. Measure angles ABC and ADC. Find their sum.
4. Measure angles BAD and BCD. Find their sum.
5. What do you notice about the two sums in 3 and 4?
6. Are the pairs of angles in 3 and 4adjacent or opposite?
7. Do the other members of your class have the same observations as you
do?8. Produce side AB of the quadrilateral, and measure the exterior angle so
formed. How does the size of this angle compare with that of interior ∠ADC?A cyclic quadrilateral is a quadrilateral
whose vertices all lie on a circle.
The distinctive property of a cyclic
quadrilateral to be looked under this
theorem is that its opposite angles are
A cyclic quadrilateral is a quadrilateral whose vertices all lie on a circle.
The distinctive property of a cyclic quadrilateral to be looked under this
theorem is that its opposite angles are suplementary.Theorem 4.1
The opposite interior angle of a cyclic
quadrilateral are supplementary or add
upto 180º.Proof
Given: Quadrilateral
ABCD inscribed
in a circle centre O.
To prove:
(i) ∠ADC + ∠ABC = 2 right angles
(ii) ∠BAD + ∠BCD = 2 right angles
Join OA and OC.
∠ADC = 1–
2 ∠AOC …………∠ADC and
∠AOC subtended by the arc ABC at the
circumference and centre of the circle
respectively.
Theorem 4.2
If one side of a cyclic quadrilateral is produced, the exterior angle formed is
equal to the opposite interior angle of the quadrilateral.Proof
Given: Quadrilateral ABCD inscribed
in a circle centre O.
To prove:
(i) ∠ADC = the exterior angle at B.(ii) ∠BAD = the exterior angle at C
(iii) ∠DCB = exterior angle at A
(iv) ∠ABC = exterior angle at D Produce line AB to a point E.


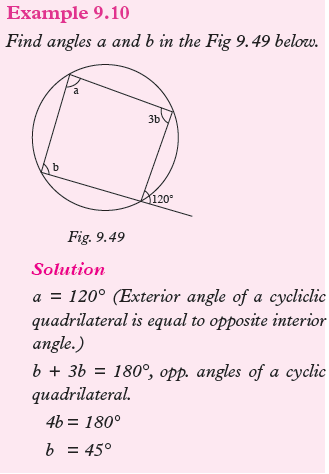
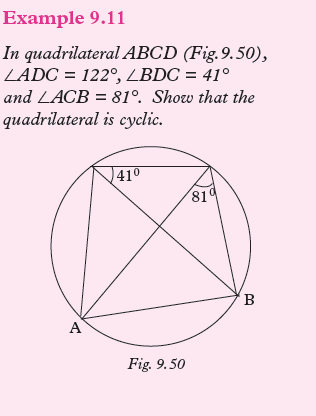
Solution
∠ADB = ∠ADC – ∠BDC
= 122° – 41°
= 81°
∴ ∠ADB = ∠ACB.
But these angles are subtended by the same
side AB at the points C and D, on the same
side of AB.
Therefore ABCD is a cyclic quadrilateral
and so, point A, B, C and D are concyclic.
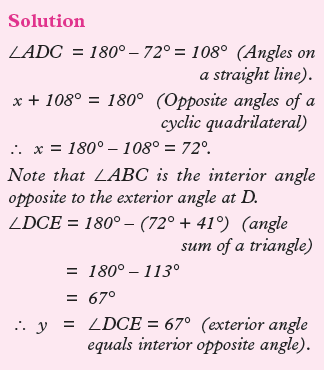
Exercise 9.4
1. A, B, C, D and E are five points, in
that order, on the circumference of a circle (Fig. 9.52).
(a) Write down all angles in the figure equal to ∠ACB.
(b) Write down all angles in the figure supplementary to ∠BCD.
(c) If ∠ACB = 40° and ∠ACD =75°, find the size of ∠DEB.
2. In Fig. 9.53, find:
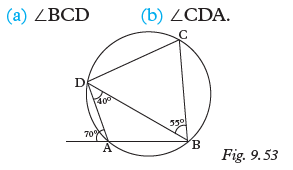
3. Fig. 9.54 consists of two intersecting
circles. Use it to find the angles marked by letters.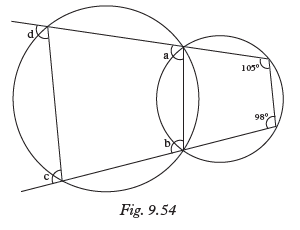
4. ABCD is a cyclic quadrilateral in a circle centre O.
(a) If ∠ABD = 32°, find ∠ACD.
(b) If AOC is a straight line, write down the size of ∠ABC.
5. AB is a chord of a circle centre O. If ∠AOB = 144°, calculate the angle
subtended by AB at a point on the minor arc AB.9.2.5 Tangent to a circle
9.2.5.1 Definition of tangent to acircle
Activity 9.7
1. Draw a circle of radius 10 cm.
2. Using a ruler and pencil, carefully draw lines that touch the
circumference at only one point. What is the name of such a line.4. ABCD is a cyclic quadrilateral in a circle centre O.
(a) If ∠ABD = 32°, find ∠ACD.
(b) If AOC is a straight line, write down the size of ∠ABC.
5. AB is a chord of a circle centre O. If ∠AOB = 144°, calculate the angle
subtended by AB at a point on the minor arc AB.9.2.5 Tangent to a circle
9.2.5.1 Definition of tangent to a circle
Activity 9.7
1. Draw a circle of radius 10 cm.
2. Using a ruler and pencil, carefully draw lines that touch the
circumference at only one point. What is the name of such a line.Consider Fig. 9.55
In Fig. 9.55(a), lines KL and PQ have only one point common with the circle.
A line with at least one point common with the circle is said to meet the circle
at that point.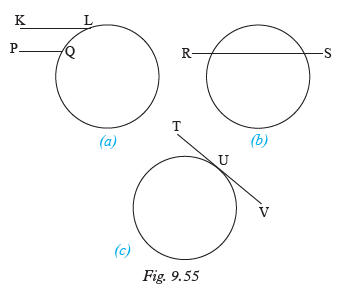
In Fig. 9.55(b), line RS has two distinct points common with the circle. Such a
line is said to meet and cut the circle at the two points.In Fig. 9.55(c), the line TV has one point of contact with the circle. Line TV is said
to meet and touch the circle at that point of contact. Point U is called the point of
contact.Note:
1. A line which cuts a circle at two distinct points (as in Fig. 9.45(b))
is called a secant of the circle.2. A line which has one, and only one point in contact with a circle
(as in Fig. 9.55(c)), however far it is produced either way, is called a
tangent of the circle.Activity 9.8
1. Draw a circle of radius 10 cm on amanilla paper.
2. As accurately as possible, draw a tangent to the circle at a point of
your choice.3. Join point P to the centre ofthe circle.
4. Measure the angle between the tangent and radius.
5. Repeat this for other tangents drawn at other points on the
circumference. What do you conclude.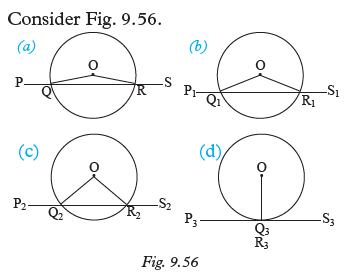
Fig. 9.56(a) to (d) shows what happens when the secant PQRS moves away from
the centre of the circle. As the secant moves further away, the points Q and R
get closer to each other and the chord QR gets shorter each time. Eventually Q and
R coincide at one point (Fig. 9.56(d)). On the other hand, angles OQP and ORS
become smaller and smaller. Eventually when Q and R coincide, angles OQR and
ORS each becomes 90°. Note that in ΔOQR, since OQ = OR,
∠OQR = ∠ORQ. It follows that ∠PQO = ∠SRO.Therefore, when Q and R coincide (Fig. 9.56(d)), ∠PQO =∠SRO = 90°.
Hence the radius is perpendicular to the tangent PS.Theorem 5
1. A tangent to a circle is perpendicular to the radius drawn through the
point of contact.2. Conversely stated the perpendicular to a tangent at its point of contact
passes through the centre of the circle.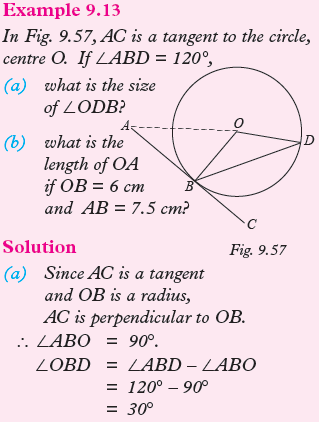
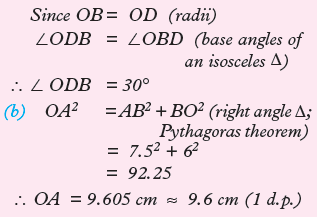
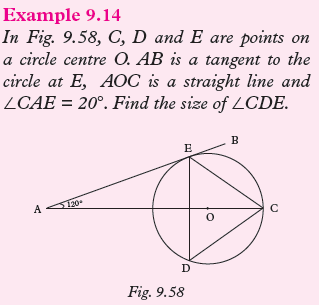
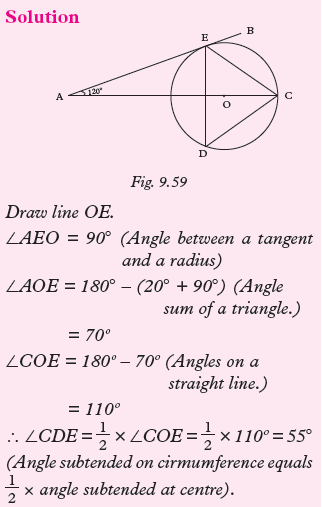
Exercise 9.5
1. In the Fig. 9.60 below, O is the centre of the circle while A and C are points
on the circumference of the circle. BCO is a straight line and BA is a tangent to
the circle. AB = 8cm and OA = 6cm.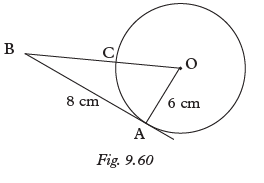
(a) Explain why ∠ OAB is a right angle.
(b) Find the length BC.
2. Fig. 9.61 shows a circle,centre O. PR is a tangent to the circle at P and PQ
is a chord.
Calculate:
(a) ∠RPQ given that ∠POQ = 85°.(b) ∠RPQ given that ∠PQO = 26°.
(c) ∠POQ given that ∠RPQ = 54°.
(d) ∠POQ given that ∠QPO = 17°.
3. In Fig. 9.62, ABC is a tangent andBE is a diameter to the circle.
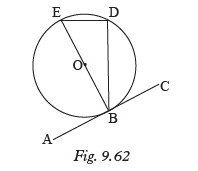
Calculate:
(a) ∠EBD if ∠CBD = 33°.
(b) ∠BED if ∠ABD =150°.
(c) ∠DBC if ∠DEB = 65°.
(d) ∠ABD if ∠BED = 38°.
4. Two circles have the same centre O, but different radii. PQ is a chord
of the bigger circle but touches thesmaller circle at A. Show that PA =
AQ.5. Two circles have the same centre O and radii of 13 cm and 10 cm. AB
is a chord of the bigger circle, but a tangent to the small circle. What is
the length of AB?6. A tangent is drawn from a point 17 cm away from the centre of a circle
of radius 8 cm. What is the length of the tangent?9.2.5.2 Constructing a tangent at any given point on the circle
Activity 9.9
1. Draw a circle, centre O, usingany radius.
2. Draw a line OB through any point A on the circumference,
with B outside the circle.3. At A, construct a line PQ perpendicular to OB.
To construct a tangent to a circle, we use
the fact that a tangent is perpendicular to
the circle at the point of contact.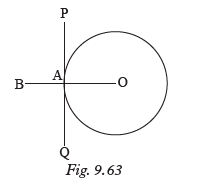
The line PQ (Fig. 9.63) is a tangent tothe circle at A.
9.2.5.3 Constructing tangents to a circle from a common point
Activity 9.10
1. Draw a circle of any radius and centre O.
2. Mark a point T outside the circle.
3. Join OT. Construct the perpendicular bisector of TO to
meet TO at P.4. With centre P, radius PO, construct arcs to cut the circle
at A and B.5. Join A to T and B to T. What do you notice?
Activity 9.11
1. Draw a circle of any radius, centreO.
2. Choose any points A and B on the circle. Construct tangents at
A and B3. Produce the tangents till they meet at a point T.
4. Join OA, OB and OT.
5. Measure: (a) AT, BT.
(b) ∠ATO, ∠BTO,
(c) ∠AOT, ∠BOT6. What do you notice?
7. Which points on a circle would have tangents that do not
meet?If two tangents are drawn to a circlefrom a common point:
(a) the tangents are equal;(b) the tangents subtend equal angles at the centre;
(c) the line joining the centre to the common point bisects the angles
between the tangents.

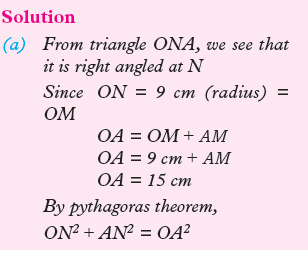
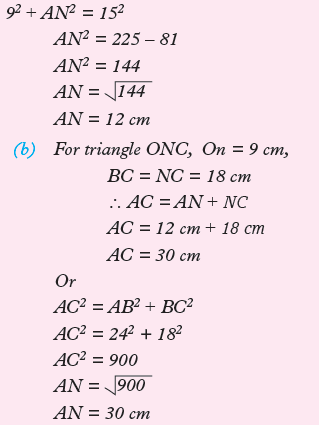
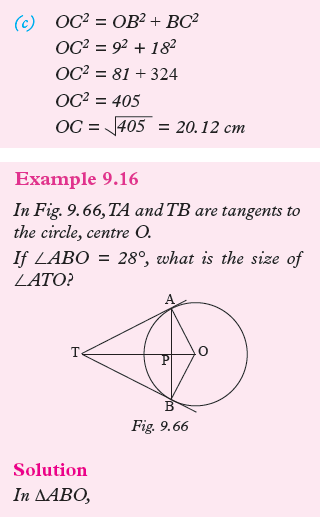
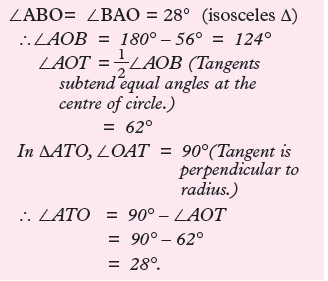
Exercise 9.6
1. In Fig 9.67 below, A, B and D are points on the circumference of a
circle centre O. BOD is the diameter of the circle while BC and AC are the
tangents of the circle. Angle OCB
= 34°. Work out the size of angle DOA.
2. In Fig 9.68 A and B are points on the circumference of a circle, centre X. PA
and PB are tangents to the circle. Angle APB = 86°. Find the size of angle y.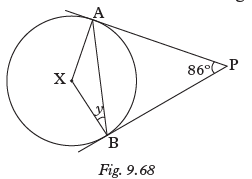
3. In Fig. 9.69, O is the centre of the circle. PT and RT are tangents to the
circle.
Calculate:
(a) ∠POT if ∠OTR = 34°.(b) ∠PRO if ∠PTR = 58°.
(c) ∠TPR if ∠PRO = 15°.
(d) ∠RTO if ∠POR = 148°.
4. Draw a circle, centre O, and radius 2.5 cm. Mark points A and B on
the circle such that ∠AOB = 130°. Construct tangents at A and B.
Measure:
(a) The lengths of the tangents.(b) The angle formed where the tangents meet.
5. In Fig. 9.70, O is the centre of the circle. If BO = 19.5 cm, BQ = 18 cm,
QC = 8.8 cm and AO = 9.9 cm, what are the lengths of:(a) AB (b) BC (c) AC?
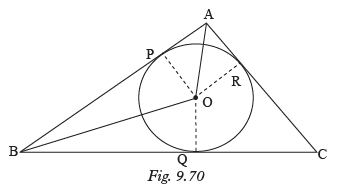
6. A tangent is drawn to a circle of radius 5.8 cm from a point 14.6 cm
from the centre of the circle. What is the length of the tangent?7. Tangents are drawn from a point 10 cm away from the centre of a circle
of radius 4 cm. What is the length of the chord joining the two points of
contact?8. Tangents TA and TB each of length 8 cm, are drawn to a circle of radius
6 cm. What is the length of the minor arc AB?9. Construct two tangents from a point A which is 6 cm from the centre of a
circle of radius 4 cm.(a) What is the length of the tangent?
(b) Measure the angle subtended at the centre of the circle.
10. Draw a line KL= 6 cm long. Construct a circle centre K radius 3.9 cm such
that the tangent LM from L to the circle is 4.5 cm. Measure ∠KLM.9.2.6 Angles in alternate segment
In Fig. 9.71, ABC is a tangent to the circle at B. Thechord BD divides the circle into
two segments BED and BFD. We say that BFD is the alternate segment
to ∠ABD.
Similarly, BED is the alternate segment to ∠CBD.
Activity 9.12
1. Draw a circle of any radius.
2. Draw a tangent at any point B.
3. Draw a chord BD.
4. Mark points P, Q, R on the circumference in the same
segment. Join BP, BQ, BR, DP, DQ and DR.5. Measure angles BPD, BQD and BRD.
What do you notice?Theorem 6
If a tangent to a circle is drawn, and from the point of contact a chord is
drawn, the angle which the chord makes with the tangent is equal to
the angle the chord subtends in the alternate segment of the circle. This
is called the alternate segment theorem.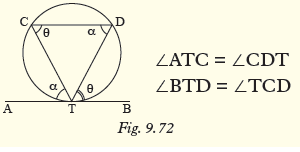
Proof
(a) We use Fig. 9.73(a) to show that ∠RQT = ∠QST.

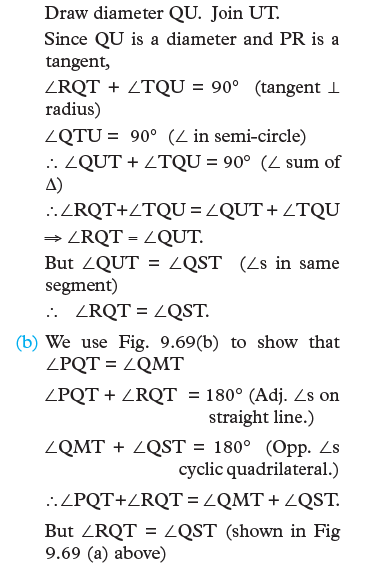
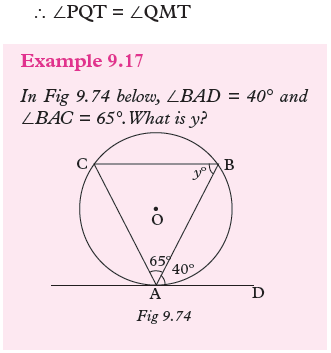
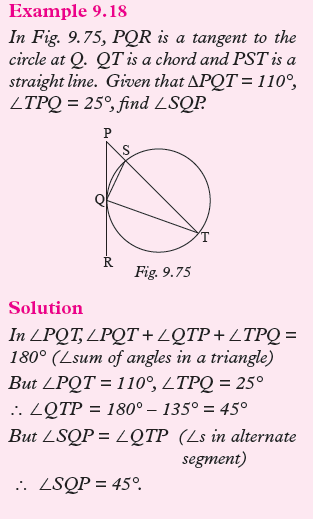

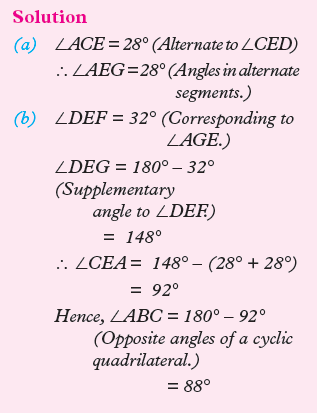
Exercise 9.7
1. If < BAD = 19°, find <ACB. in Fig 9.77.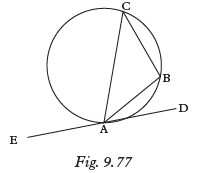
2. In Fig. 9.78, AC is a tangent to the circle and BE//CD.
(a) If ∠ABE = 42°, ∠BDC = 59°,find∠BED.
(b) If ∠DBE = 62°, ∠BCD = 56°, find ∠BED.
3. In Fig. 9.79, PR is a tangent to the circle.
(a) If ∠PQT = 66°, find ∠QST.
(b) If ∠QTS = 38° and ∠QRS =30°, find ∠QST.
(c) If ∠QTS = 35° and ∠TQS =58°, find ∠QRS.
(d) If ∠PQT = 50° and ∠PRS = 30°,find ∠SQT.
4. In Fig. 9.80, AB, BC and AC are tangents to the circle. If ∠BAC = 75° and
∠ABC = 44°, find ∠EDF, ∠DEF and ∠EFD.
5. In Fig. 9.81, KLM is a tangent to the
circle. If ∠LPN = 38° and ∠KLP = 85°, find ∠PQN.
6. In Fig. 9.82, DC is a tangent to the circle. Show that ∠CBD = ∠ADC.
7. In Fig. 9.83, AB and DE are tangents to the circle. ∠ABC = 40°
and ∠BCD = 38°. Find ∠CDE.
8. In Fig. 9.84, ABC is a tangent to the circle at B and ADE is a straight line.
If ∠BAD = ∠DBE, show that BE is a diameter.
9. In Fig. 9.85, AD is a tangent to the circle. BC is a diameter of the circle
and ∠BCD = 30°. Find ∠DAB.
10. In Fig. 9.86, AD is a tangent to the circle at D, ∠DAB = 28° and ∠ADC
= 112°. Find the angle subtended at the centre of the circle by the chord
BC.
11. Points A, B and C are on a circle such that ∠ABC = 108°. Find the angle
between the tangents at A and C.12. In Fig. 9.87, O is the centre of the circle. AB and CD are chords that
meet at X. XT is a tangent to the circle.
Show that (a) XT2 = XA . XB
(b) XT2 = XC . XD.9.2.7 Properties of chords Perpendicular bisector of a chord
Activity 9.13
1. Draw a circle of any radius r cm, centre O. Draw a chord AB (not
a diameter). From O draw a line perpendicular to AB, cutting
AB at N. Measure AN and NB. What do you notice?2. Draw a circle of any radius r
cm, centre O. Draw a chord CD (not a diameter). Construct a
perpendicular bisector of CD. What do you notice about the
bisector and centre of the circle?3. Repeat step 2 for any of the same circle.
Theorem 7
1. A perpendicular drawn from the centre of a circle to a chord bisects the chord.
2. A perpendicular bisector of a chord passes through the centre
of the circle.
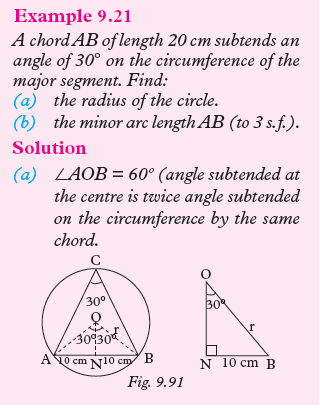
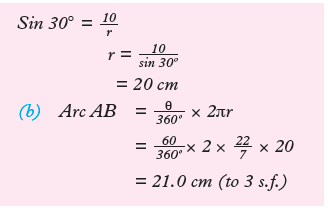
Using the properties noted above, we can calculate the length of a chord.
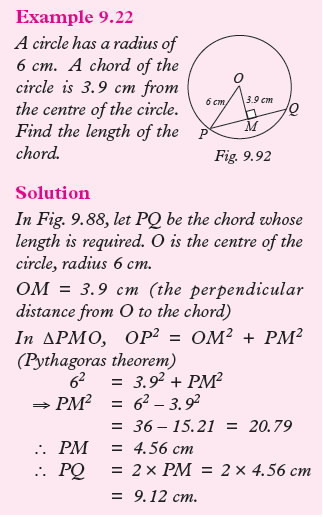
Exercise 9.8
1. A chord of a circle of radius 13 cm is at a distance of 5 cm from the centre.
Find the length of the chord.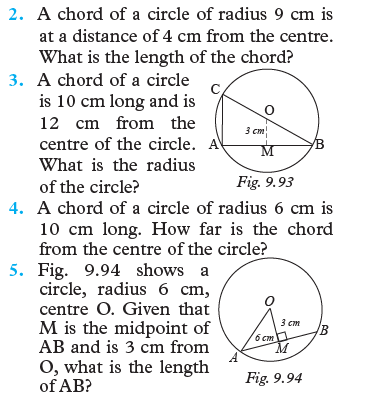
6. A circle has a chord whose length is 9 cm. The chord is 4 cm from the
centre of the circle. The same circle has a chord which is 3.5 cm from the
centre, what is its length?7. A chord of a circle is 12 cm long and 5 cm from the centre. What is the
length of a chord which is 3 cm from the centre?8. A chord of a circle of radius 5.5 cm subtends an angle of 42° at the
centre. Find the difference in length between the chord and the minor arc.9. P, Q and R are points on the circumference of a circle. If PQ =
12cm, PR = 12cm and QR = 8cm, what is the radius of the circle?
We can also extend the theorem of on perpendicular bisector of a chord to
parallel and equal chords.Activity 9.14
1. Draw a circle, centre O, radius 4 cm. Draw chords PQ and RS
such that PQ//RS. Construct a perpendicular bisector of PQ and
let it cut RS at point T. (Fig. 9.95).
In general:
1. If two chords of a circle are parallel, then the perpendicular bisector of
one is also perpendicular bisector of the other.2. The midpoints of parallel chords of a circle lie on a diameter.
3. If two chords of a circle are equal, then they are equidistant from the
centre.4. If two chords of a circle are equidistant from the centre, then
their lengths are equal5. If two chords of a circle are equal, then the angles they subtend at the
centre are equal.6. If two angles at the centre of a circle are equal, then they are subtended
by equal chords.Example 9.23
Two parallel chords of a circle are of lengths 8 cm and 12 cm respectively and
are 10 cm apart. What is the diameter of the circle?
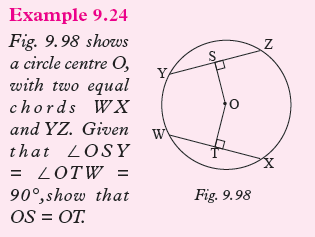
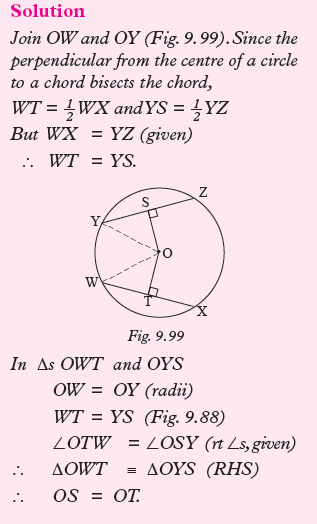
Note:
Equal chords of a circle are equidistant
from the centre of circle. Conversely, chords which are
equidistant from the centre of a circle are equal.Exercise 9.9
1. Two parallel chords of a circle are of
lengths 3 cm and 5 cm respectively. What is the radius of the circle if the
chords are;
(a) 1 cm apart (b) 8 cm apart.
(State your answers to 2 d.p.)
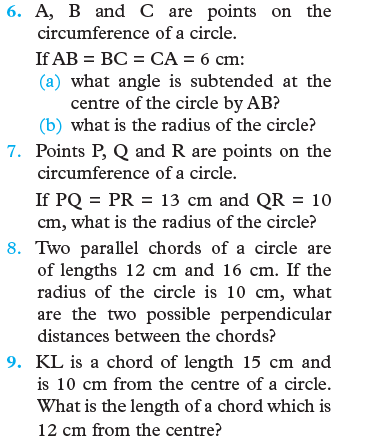
Unit Summary
• Angles in the same segment i.e. subtended by the same arc, are equal.
In Fig. 9.101, p = q. x = 2p = 2q
• The angle subtended at the centre of a circle by an arc is double that
subtended by the same arc on the remaining part of the circumference.
In Fig. 9.101, x = 2p or x = 2q.• The angle subtended by the diameter on the circumference (i.e. the angle
in a semicircle) is a right angle. In Fig. 9.102, x = y = 90°.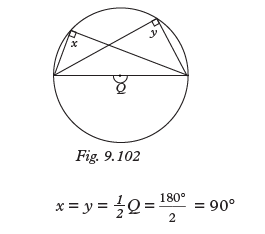
• Opposite angles of a cyclic quadrilateral (a quadrilateral with its four vertices
lying on the circumference of a circle) are supplementary (i.e. they add
up to 180°). If one side of a cyclic quadrilateral is produced, the exterior
angle thus formed equals the interior opposite angle (Fig. 9.103).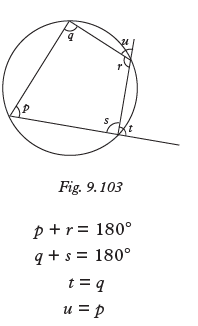
• The perpendicular bisector of a chord passes through the centre of
the circle. It also bisects the angle that the chord subtends at the centre.• Equal chords of a circle are equidistant from the centre of the circle.
• If two or more chords of a circle are parallel, then the perpendicular
bisector of one bisects the others.• The midpoints of parallel chords lie on a diameter.
• Equal chords subtend equal angles at the centre.
• The tangent to a circle at a point is perpendicular to the radius of the
circle at that point.• Two tangents to a circle, drawn from the same point, have the same length
(Fig. 9.104).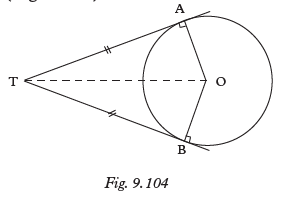
• The angle formed by a tangent ofa circle and a chord drawn from
the point of contact is equal to the angle that the chord subtends in the
alternate segment (Fig. 9.105).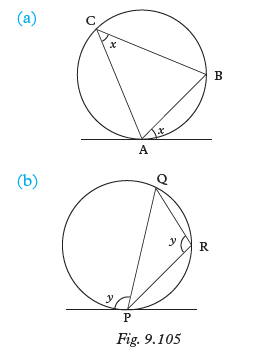
Unit 9 Test
1. In Fig. 9.106, find the angles marked with letters a, b, c, d and e.

2. In Fig. 9.107, find the angles marked by the letters a, b, c and d.
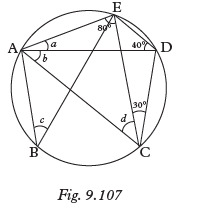
3. In Fig. 9.108, AB is a diameter. Find the sizes of the angles marked x and y.
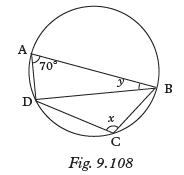
4. Fig 9.109 shows a rectangle ABCD which is inscribed in a circle, centre
O and radius 10 cm. Given that AB = 16 cm, calculate
(taking p = 3.142)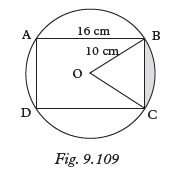
a) the width BC of the rectangle,
(b) the central angle BOC,
(c) the length of the minor arc BC,
(d) the shaded area.
5. In Fig. 9.110, PQ and PT are tangents to the circle. Given that ∠OQU = 28° and
OQS = 15°, find the sizes of angles PQU, QSU, QUS and QRS.
6. A chord of a circle of length 15 cmsubtends an angle of 120° at the
centre. Calculate the radius of the circle and the length of the minor arc.7. Find the marked angles in the quadrilaterals in
Fig. 9.111 (a) and (b).
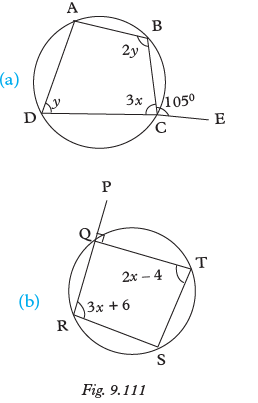
8. The angles of a cyclic quadrilateral are 6x, 3x, x +y and 3x + 4y in that
order. Determine the values of x and y, and hence the sizes of the angles of
the quadrilateral.9. Find the size of the angle marked x in Fig. 9.112.
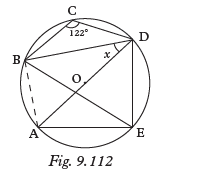
10. In Fig. 9.113, BOE is a diameter,
∠CAE = 45°, ∠BEA = 50°,
∠BEC = 25°, ∠DCE = 20° and
∠DEF = 130°. Find:
Unit 10:COLLINEAR POINTS AND ORTHOGONAL VECTORS
Key unit competence: By the end of this unit, learners should be able
to apply properties of collinearity and orthogonarity to solve problems involving
vectors.Unit outline
• Collinear points
• Orthogonal vectors
Introduction
Unit Focus Activity
1. Consider the points
(a) P(–1, 2) Q(1, 4) and R(3, 6)(b) L(3, –2) Q(1, 0) and N(0, 3)
(i) W i t h o u t p l o t t i n g determine whether the
three points in each are collinear (lie on the same straight line)(ii) State one advantage of three or more objects lying
on the same straight line.
2. Consider the column vectors.
Determine whether the two pairs of vectors are orthogonal in each case.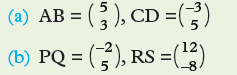
Determine whether the two pairs of vectors are orthogonal in each case.
10.1 Collinear points
10.1.1 Definition of colinearity
Activity 10.1
1. You are given three points A (2, 2), B (3, 3) and C (6, 6).
(a) Plot the points ABC on a Cartesian plane.
(b) Join the points A, B and C using a ruler.
2. Given the points P (–2, 3), Q (3, 3) and R (1, –5).
(a) Plot the points P, Q and R on a Cartesian plane
(b) Join the points P, Q and R using a ruler
3. What observation do you make in the plotted points A, B, C and P, Q, R?
4. How would you have determined what you observed in step 3 without
drawing?Three or more points are said to be collinear if they lie on a single straight line.
For example the points A, B and C in Fig. 10.1 are collinear because they lie on a
single straight line.
Points E, F and G in Fig.10.2 below are not collinear because they don’t lie on the
same straight line.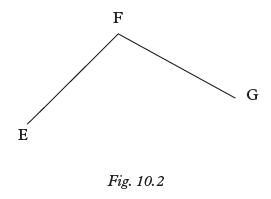
10.1.2 Verifying collinearlity of points using vector laws A B C
Activity 10.2
Observe the straight line PQR in graph 10.1 below.
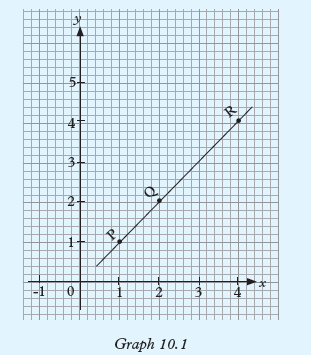
1. Determine the column vectors PQ and QR.
2. Express vector PQ in terms of QR.
3. Since points P, Q and R are collinear, state one condition
for collinearlity guided by relationship of vectors PQ and
QR that you obtained in step 3.Consider another straight line ABC in graph 10.2 below with point B located
between A and C as shown.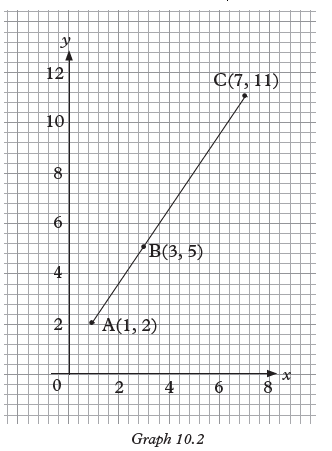
If AB = kBC where k is a scalar, then
AB is parallel to BC. Since B is a common point between
vectors AB and BC, then A, B and C lie
on a straight line, i.e. the points A, B and
C are collinear.Example 10.1
Show that the points A (0, -2), B (2, 4) and C (-1, -5) are collinear.

(i) 2 = 3k ⇒ k = –2/3
(ii) 6 = –9k ⇒ k = –6/9 = –2/3
Since the value of k is the same for the two cases (i) and (ii), i.e. AB= –2/3BC, and B
is a common point of two vectors AB and BC, then points A, B and C are collinear.Example 10.2
For what value of k are the following points collinear? A(1, 5), B(k, 1) and
C(11, 7)Solution:
Let the points be A, B and C. For the points to be collinear, B can be a common
point and therefore we get; AB = aBC where a is a scalar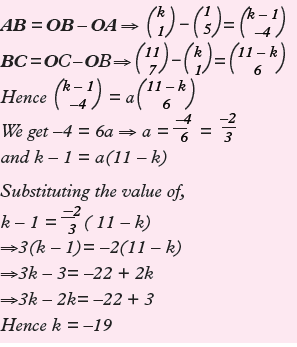
Exercise 10.1
1. Verify whether the following points are collinear.
(a) A(2, 3), B(9, 8) and (5, 4)
(b) P(–1, 1), Q(5, 1) and R(2, 0)
(c) X(–2, 3), Y(7, 0) and Z(1, 2)
(d) R(1, 2), S(4, 0) and T(–2, 4)
2. (a) The following points are collinear, find the values of
unknown in each case.
(i) (1, 0), (k, 3), (4, 5)(ii) (5, 1), (x, 2), (x, 7)
(iii) (2, 4), (1, k), (6, k)
(b) Plot all the points in (a) on a Cartesian plane. What do you
observe?10.1.3 Applications of collinearlity in proportional division of lines A B C
Activity 10.3
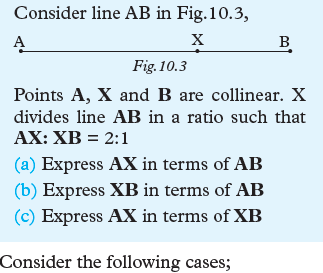
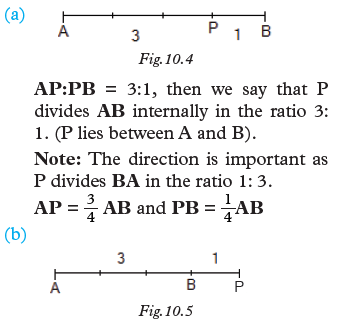
AP: PB = 4: –1.
The negative sign is required as PB is in the opposite direction to AB. We
say that P divides AB externally in the ratio 4: –1, or P divides BA in the
ratio –1 : 4Whenever P is outside AB (on either side), AP: PB will be negative, and
we say that P divides AB externally.
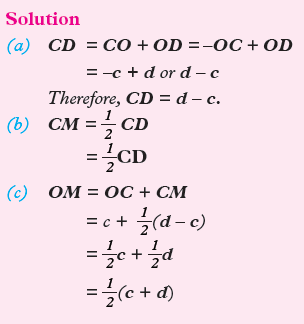
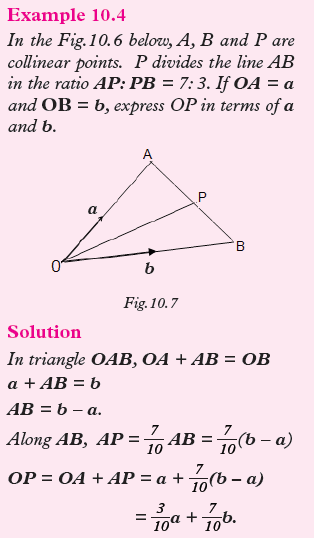
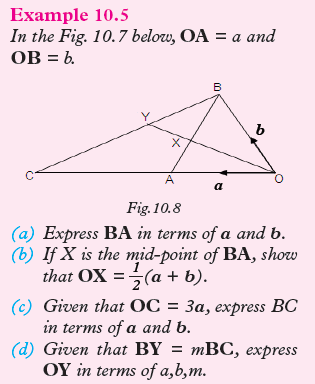
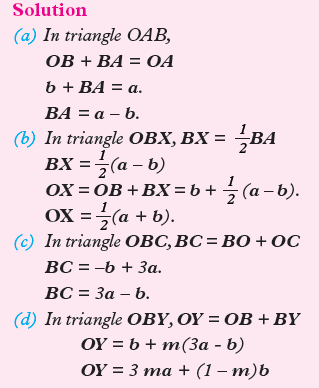
Exercise 10.2
1. In the diagram in Fig.10.9, OD = 2OA, OE = 4OB, OA = a
and OB = b. Points B, A and C are collinear.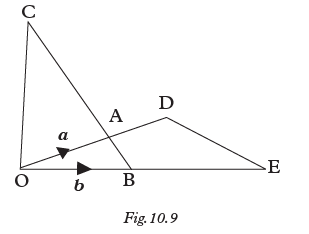
(a) Express the following vectors in terms of a and b. OD, OE, BA
and ED.(b) Given that BC = 3BA, express:
(i) OC
(ii) EC, in terms of a and b.
(c) Hence show that the points E, D and C lie on a straight line.
2. In the diagram in Fig 10.10, OA = a, OB = b and M is the mid-point of
AB. Points A, M and B are collinear.
Find OM in terms of a and b.
3. In Figure 10.11, OABC is a parallelogram, M is the mid-point of
OA and AX = 7AC, OA = a and OC = c. Points A, Y and B, M, X
and Y, A, X and C are collinear.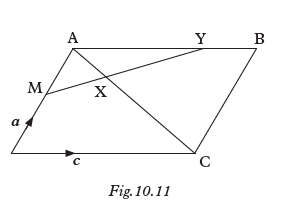
(a) Express the following in terms ofa and c.
(i) MA (ii) AB
(iii) AC (iv) AX
(b) Using triangle MAX, express
MX in terms of a and c.(c) If AY = pAB, use triangle MAY
to express MY in terms of a, c
and p.d) Also if MY = qMX, use the result in (b) to express MY in terms of
a, c and q.
(e) Hence find p and q and the ratio
AY: YB
4. ORST is a parallelogram and S, P and T are collinear in Fig.10.12.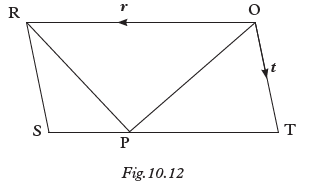
If ST = 4SP, express the following in
terms of r and or t.
(a) RS (b) ST (c) SP(d) RP (e) OP
5. In Fig. 10.13, PQR is a triangle,
PQ = a, PR = b and S is the midpointof RQ.
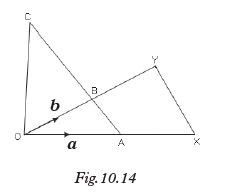
Express the following in terms of aand b.
(a) OY, OX, AB, and XY.(b) Given that AC = 6AB, express
OC and XC in terms of a and b.(c) Use the results for XY and XC to
show that points X, Y and C lie
on a straight line.7. In the diagram below OA = a and
OB = b, M is the mid-point of OA and
P lies on AB such that AP = 3 AB.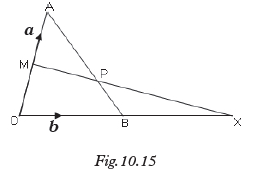
(a) Express the following in terms of a and b: AB, AP, MA and MP
(b) If X lies on OB produced such that B = BX, express MX in
terms of a and b.(c) Show that MPX is a straight line.
10.2 Orthogonal vectors
Activity 10.4
1. Research from reference books or internet how to determine the
product of two column vectors.2. You are given the vectors
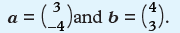
a) Find the product of a and b.
b) Plot the vectors in a Cartesian plane. What is the angle
between them?3. You are given the vectors
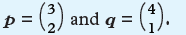
(a) Find the product of p and q.
(b) Plot the vectors on a Cartesian plane. What is the
angle between them?4. Based on your results in 2 and 3, what is the relationship between
two perpendicular vectors and the product of the vectors?Two vectors are said to be perpendicular if
the angle between them is 90° (i.e. if they form a right angle).The product of two vectors must be zero
for the angle between them to be 90º. Consider two vectorsand


Two vectors are said to be orthogonal if the sum of product of tops and the product
of bottoms is zero. If vectors a and b are orthogonal, then
x1x2 + y1y2 = 0.Note:
Example 10.7
(a) Show that the vectors
 and
and are orthogonal vectors
Solution
(a) Vectors a and b are orthogonal
vectors if x1x2 + y1y2 = 0
= (2 × – 1) + (1 × 2)
= –2 + 2 = 0.(b) These vectors are orthogonal.
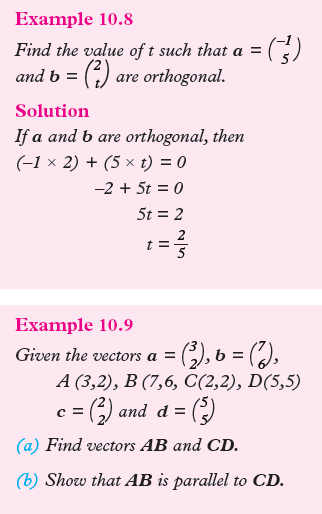
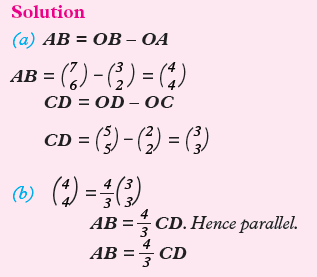
Exercise 10.3
1. Show whether the following vectors are orthogonal.

2. Consider points A(5, 3), B(2, –1) and C(7, –3,). Find:
(i) BA and BC
(ii) Show whether BA and BC are orthogonal. Give reasons.
3. Let
 and
and  be two
vectors. Find the values of k if; a and b are perpendicular4. Are the following given vectors perpendicular? Write true/false for
the result obtained.
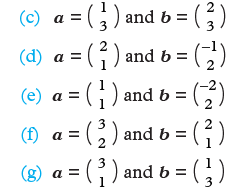
5. The co-ordinates of P, Q, R and S are (0, 1), (7, 8), (1, –1) and (9, 7).
(a) Find PQ and RS.
(b) What is the relationship between PQ and RS?
Unit Summary
• Collinearlity: Three or more points are said to be collinear if they lie on a
single straight line. For example if A, B and C are three
points on the same straight line ABC, then AB = kBC where B becomes a
common point.• Collinear points find their applications in proportional line
divisions. For example, consider the following cases;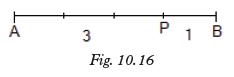
AP: PB = 3: l, then we say that P divides AB internally in the ratio 3: 1.
(P lies between A and B). Note: The direction is important as
P divides BA in the ratio 1: 3.
AP = 3/4 AB and PB = 1/4 AB• Orthogonal vectors: Two vectors are said to be perpendicular if the
angle between them is 90° (i.e. if they form a right angle).The product of two vectors must be zero for the angle between them to be
90º.
Consider two vectors and
and 
the sum of the product of tops and bottoms is defined by the
formula;
= x1x2 + y1y2
If vectors a and b are orthogonal,
then x1x2 + y1y2 = 0.Unit 10 Test
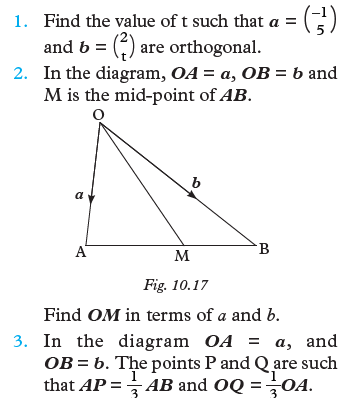

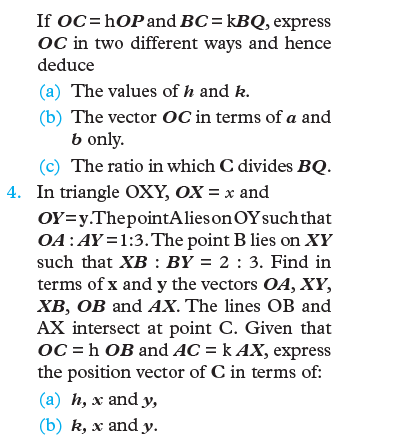
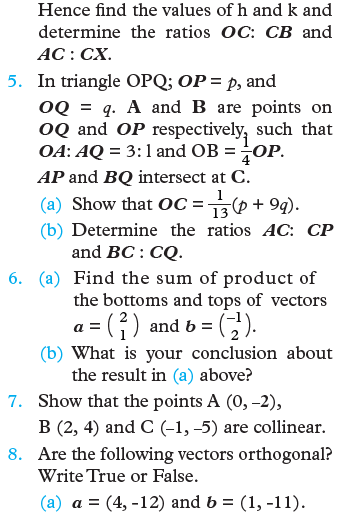
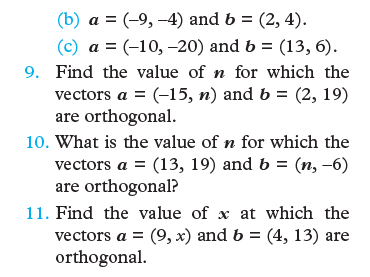
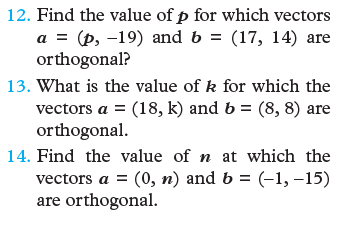
Unit11:ENLARGEMENT AND SIMILARITY IN 2D
Key unit competence
By the end of this unit, the learner should be able to solve shape problems about
enlargement and similarities in 2D.Unit Outline
• Definition and properties of similarity.
• Similar polygons
• Similar triangles
• Finding length of sides of shapes using similarity and Thales theorem
• Definition of enlargement
• Properties of similarity
• Determining linear scale factor of enlargement
• Determining the centre of enlargement
• Enlargement in the Cartesian plane
• Areas and volumes of similar shapes and objects respectively
• Composite and inverse enlargement
Introduction
Unit Focus Activity
One of the coffee processing and marketing companies in Rwanda
packages its coffee sachets in small cartons for domestic use and export.
Suppose that each carton measures24 cm long, 12 cm wide and 16 cm high.
The company is planning to make a very big model of the carton, 1.8 m long to
be mounted on the roadside of a busy highway for advertisement.
The company manager was told thatyou learn Mathematics in school. So, he has invited you to advice them on
all the dimensions (measurements) they should use in making the model, so that
it will have exactly the same shape as the carton.
1. Identify and state two concepts in Mathematics that will help you
determine the correct dimensions of the model.2. Use these concepts to determine the correct dimensions of the
model.3. Compare your dimensions with those obtained by other classmates
in class discussion.4. How can you advice the company on the disposal of used-up cartons.
Drink Rwanda grown coffee and use other Rwanda made products to grow
our economy and support our farmers and producers11.1 Similarity
11.1.1 Similar triangles
Activity 11.1
1. Use a mathematics dictionary, reference books or Internet
to find out the definition of similarity2. Draw a triangle with sides 4.6 cm, 3.0 cm and 3.4 cm,
measure its angles.3. Draw another triangle PQR whose lengths are 1 12
times as long as the first triangle of ABC.4. Measure the angles of the two triangles. What do you notice?
5. Compare the shapes of the two triangles. What do you notice.
Explain your observation.Activity 11.2
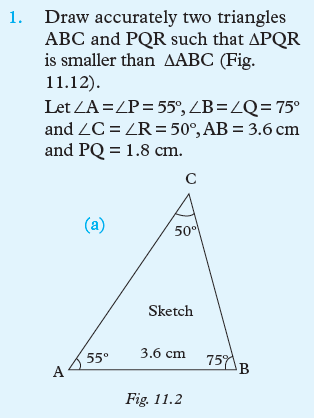
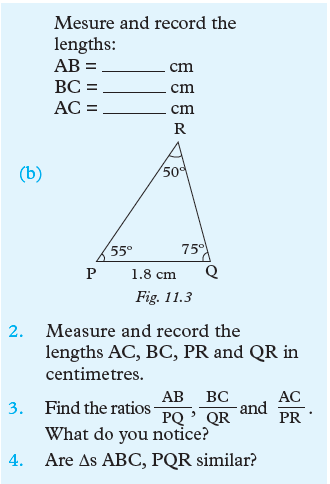
Activity 11.3
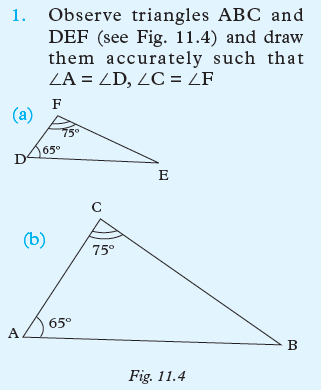
2. Measure the remaining one angle in each triangle and compare.
3. Prove whether ΔABC is similar to ΔDEF.
Activity 11.4
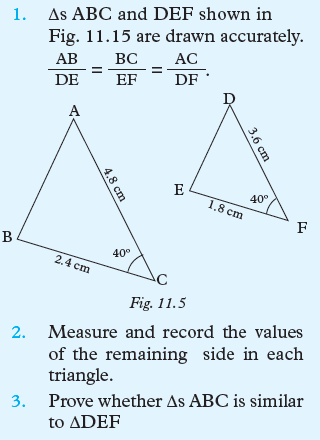
Let us consider two similar triangles DABC and DDEF. (Fig 11.6)

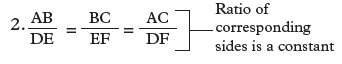
We say that triangles ABC and DEF are
similar.
Generally, two triangles are similar if:1. If two pairs of corresponding angles are equal, then the other remaining
pair of corresponding angles must also be equal.2. If the ratios of two pairs of corresponding sides is the same and
angles the between those considered sides in each triangle are equal,
then the ratio will also be the same one for the remaining two pairs of
corresponding sides.Similarity is denoted by the symbol “∼”.
So, for the above two similar triangles,we write: ABC∼DDEFMathematically, two triangles are said
to be similar, if one of the following three criteria hold:1. AAA or AA criterion: Two triangles are similar if either all the three
corresponding angles are equal or any two corresponding angles are
equal. AAA and AA criteria are same because if two corresponding
angles of two triangles are equal, then third corresponding angle will
definitely be equal.2. SSS criterion: Two triangles are said to be similar, if all the corresponding
sides are in the same proportion.3. SAS criterion: Two triangles are similar if their two corresponding
sides are in the same proportion and the corresponding angles between
these sides are equal. Similar figures have the same shape
irrespective of the size.
Note: Would the statement still be true if ‘triangles’ is replaced with ‘polygons’? The
answer is ‘No’: With all polygons other than triangles, the ‘or’ must be replaced
with ‘and’.

Exercise 11.1
1. State if, and why, the pairs of shapes in Fig. 11.9 are similar.
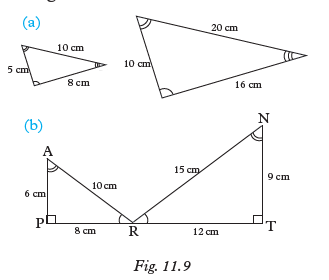
2. Construct two triangles ABC and PQR with sides 3 by 3 by 5 cm and 12 by
12 by 20 cm respectively. Measure all the angles. Are triangles ABC and
PQR similar? Are all isosceles triangles similar? Are all equilateral triangles
similar?3. The vertices of three right-angled triangles are given below:
A(3 , 3), B(4 , 5), C(3 , 5);
P(1 , 3), Q(1 , 5), R(2 , 4);
X(–2 , 3), Y(1 , –1), Z(–2 , –1).
Which two triangles are similar?4. In Fig. 11.10 ∠QFR = 90º and∠QER = 90º.
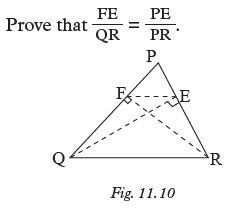
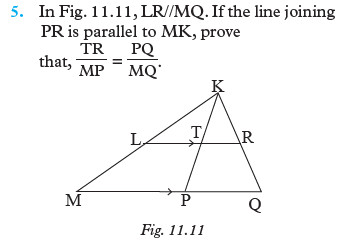
11.1.2 Similar polygons
Activity 11.5
1. (a) Draw a rectangle ABCDmeasuring 3 cm by 4 cm.
(b) Draw another rectangle EFGH measuring 4 cm by 6 cm.
(c) What do you notice about the two rectangles? Find the ratio
of the corresponding sides.(d) What do you notice?
2. (a) Draw a rectangle PQRSmeasuring 2 cm by 4 cm.
(b) Draw another rectangle UVWX measuring 5 cm by 10 cm.
(c) Find the ratio of corresponding sides of the rectangles.
(d) What do you notice? Two or more polygons are similar if the
ration of the corresponding sides is constant and the corresponding angle are equal.Example 11.2
Consider rectangle WXYZ of length 2 cm and width 3 cm and rectangle
QRST of the lengths 3 cm width 5 cm. Find the ratio of their corresponding
sides.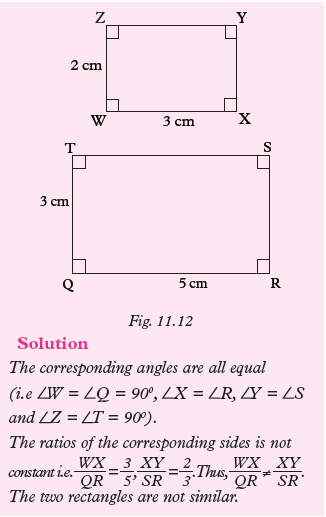
Activity 11.6

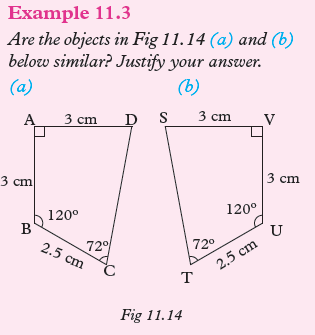

Example 11.4
Consider the shapes in Fig 11.15. Which among these shapes are similar
to Fig 11.15 (a).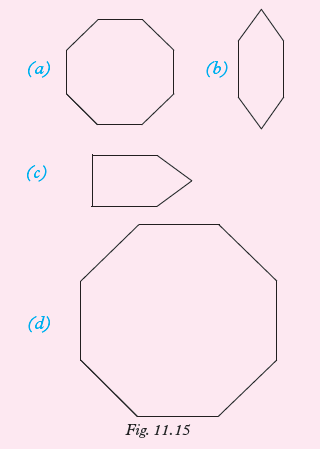
Solution
Fig 11.15 (d) is similar to Fig 11.15 (a).
The corresponding angles are equal and the ratio of the corresponding sides is
constant.Example 11.5
Determine whether the hexagons in Fig. 11.16 are similar. State your
reasons.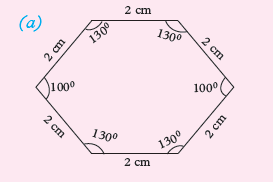
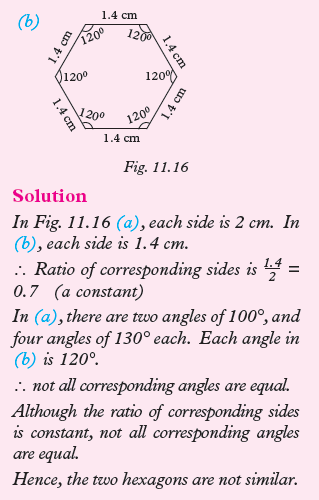
Remember that:
Two polygons are similar if:1. The ratio of corresponding sides is constant
2. The corresponding angles are equal.
Exercise 11.2
1. State if, and why, the pairs of shapes in Fig. 11.17 are similar.
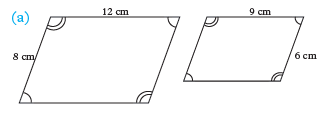
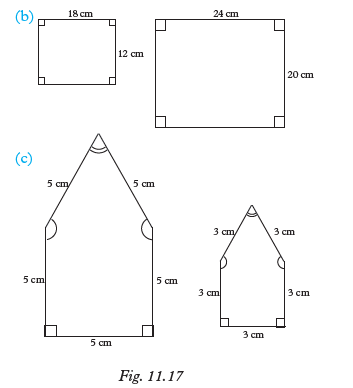
2. Measure the length and breadth of this text book. Measure also the length and
breadth of the top of your desk. Are the two shapes similar? If not, make a scale
drawing of a shape that is similar to the top of your desk.3. A photograph which measures 27 cm by 15 cm is mounted on a piece of card so
as to leave a border 2 cm wide all the way round. Is the shape of the card similar to
that of the photograph? Give reason for your answer.11.1.3 Calculating lengths of sides of similar shapes
using similarity and Thales theoremActivity 11.7
Consider the rectangles PQRS and WXYZ in Figure 11.18 below.

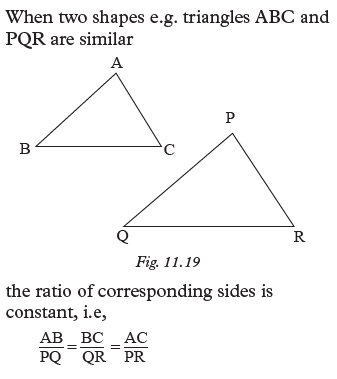
We can use this fact to calculate the lengths of sides of the triangles.
Remember that also, similar traingles and trapezia also obey Thales theorem which
states that:“If a line is drawn parallel to one side of a triangle intersecting the other two sides,
it divides the two sides in the same ratio. For example, in triangle PQR below, ST
is parallel to PQ.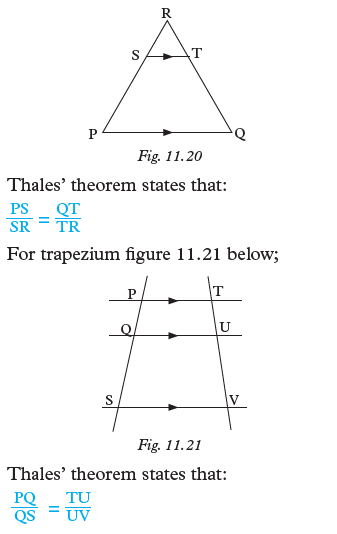
Example 11.6
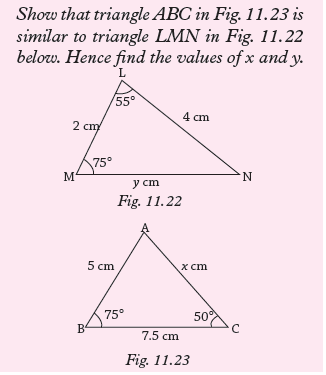
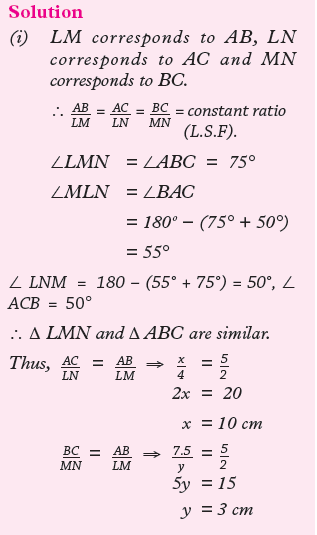
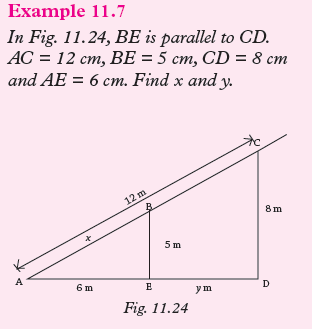
Solution
Separating the triangles
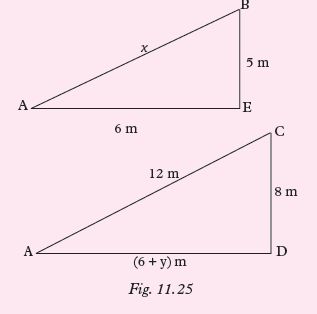

Example 11.8
Fig. 11.26 and Fig. 11.31 below are similar. Find the lengths of sides marked
with letters.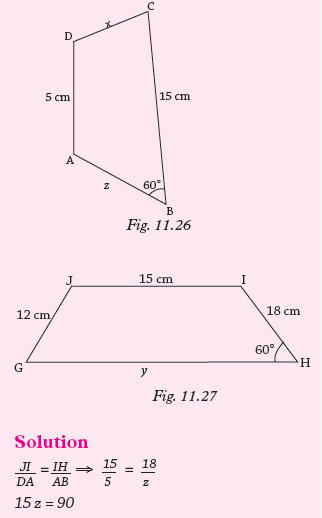
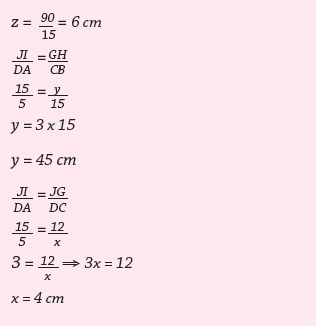
Example 11.9
Fig. 11.28 shows two triangles ABC and PQR. Calculate the lengths BC and PQ.
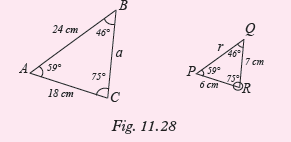
Solution
Since the corresponding angles are equal, Δs ABC and PQR are similar.
∴ the ratio of corresponding sides is constant.
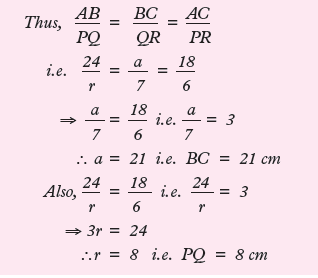
Example 11.10
In the figure below, DE is parallel to BC, find the value of x.
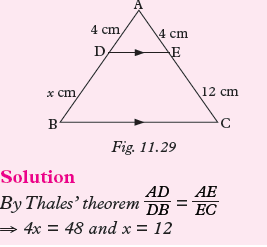
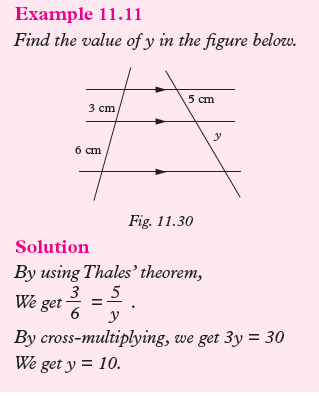
Exercise 11.3
1. The triangles in each pair in Fig. 11.31 are similar. Find x.
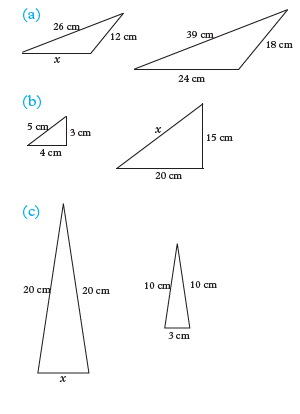
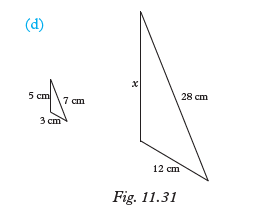
2. Show that the two triangles in Fig. 11.32 are similar. Hence calculate
AC and PQ.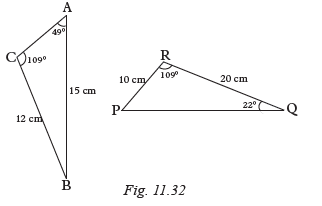
3. Find the values of x and y in Figure 11.33 (a) and (b).

4. Which two triangles in Fig. 11.34 are similar? State the reason. If
AB = 6 cm, BC = 4 cm and DE = 9 cm, calculate BD.
5. Find the value of x from the figures 11.35 and 11.36 below:

6. In Fig. 11.37, identify two similar triangles. Use the similar triangles to
calculate x and y.
7. A student used similar triangles to find the distance across a river. To construct
the triangles she made the measurements shown in Fig. 11.38. Find the distance
across the river.
11.1.4: Definition and properties of similar solids
Activity 11.8

3. What do you notice about the ratio of corresponding sides?
4. Measure the corresponding angles ∠A and ∠A′, ∠B and ∠B′,
∠C and ∠C′, etc. What do you notice?Consider a small cuboid measuring 8 cm × 12 cm × 6 cm and big cuboid
measuring 12 cm × 18 cm × 9 cm shown in Fig 11.40.
Lets compare the ratios of corresponding sides
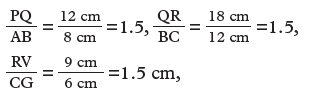
We notice that the ratio of corresponding
sides is a constant (same).
Lets compare the corresponding angles.
∠ABC = ∠PQR, ∠ABF = ∠PQV,∠BCG = ∠QRV
We notice that the all corresponding angles are equal.
We say that cuboid ABCDEFGH is similar to cuboid PQRSTUVW.
Note that even naming similar figures we
match the corresponding sides e.g. AB
corresponds to PQ, CD coresponds to RS and so on.
Two solids are similar if:1. The ratio of the lengths of their corresponding sides is constant.
2. The corresponding angles are equal.
Example 11.12
Determine whether the following pairs objects are similar or not.
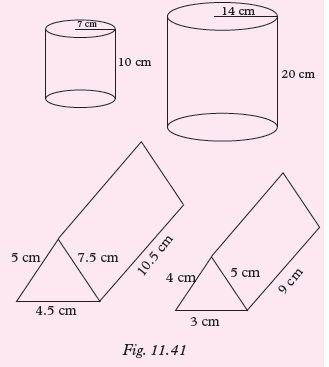
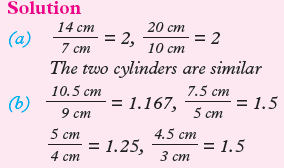
Not all ratios of corresponding sides are equal i.e the ratio of corresponding sides
is not a constant. Hence, the two prisms are not similar.Example 11.13
A jewel box, of length 30 cm, is similar to a matchbox. If the matchbox is 5 cm long,
3.5 cm wide and 1.5 cm high, find the breadth and height of the jewel box in Fig. 11.42.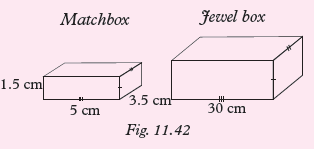
Solution
The ratio of the lengths of the jewel box and the matchbox is

This means that each edge of the jewel box is 6 times the length of the
corresponding edge of the matchbox. Width of jewel box = 6 × 3.5 cm = 21 cm,
and height of jewel box = 6 × 1.5 cm = 9 cm.Exercise 11.4
1. A scale model of a double-decker bus is 7.0 cm high and 15.4 cm long. If
the bus is 4.2 m high, how long is it?2. A cuboid has a height of 15 cm. It is similar to another cuboid which is 9
cm long, 5 cm wide and 10 cm high. Calculate the area of the base of the
larger cuboid.3. A water tank is in the shape of a cylinder radius 2 m and height 3 m. A similar
tank has a radius of 1.5 m. Calculate the height of the smaller tank.4. Write down the dimensions of any two cubes. Are the two cubes similar? Are all
cubes similar? Are all cuboids similar?5. A designer has two models of a particular car. The first model is 15
cm long, 7.5 cm wide and 5 cm high. The second model is 3.75 cm long,
1.70 cm wide and 1.25 cm high. He says that the two are ‘accurate scale
models’. Explain whether or not his claim could be true.11.2 Enlargement
11.2.1 Definition of enlargement
Activity 11.9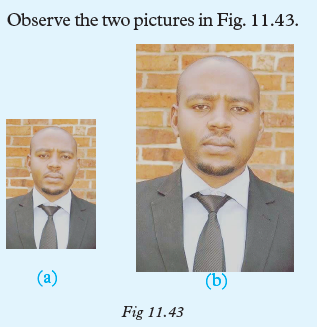
1. Compare the shapes and looks of the two pictures. What do you
notice?2. By measuring, determine how many times picture (b) is bigger
than picture (a)3. What is the name of the transformation that transforms
Fig. 11.43 (a) to (b)?4. Identify the requirements for the transformation to be performed?
Consider the Triangles in Fig.11.44.
The two triangles have exactly the same shape. However, triangle A′B′C′ is bigger
than triangle ABC. We say that the triangle ABC has been enlarged to triangle A′B′C′ .
Enlargement is the transformation that changes the size of an object but preserves
its shape i.e angles are preserved. Lines AA′, BB′ and CC′ produced meet
at a common point 0. The point is called the centre of enlargement. Triangle ABC
and A′B′C′ are similar. By measuring, determine the value of
OA′/OA
. This is called the scale factor of enlargement.The scale factor of enlargement is defined as the ratio.
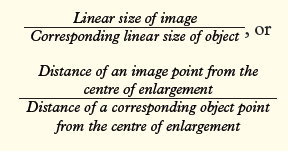
Note:
This particular scale factor is often called the linear scale factor because
it is the ratio of the lengths of two line segments.
Thus, the scale factor of enlargement (k) tells
us:
(a) How big or small the image is compared to the object.(b) How far and in which direction is the image in respect to the object.
Therefore, for an enlargement to be performed, the centre and scale factor of
enlargement must be known.11.2.2 Constructing objects and images under enlargement
11.2.2.1 Positive scale factor > 1
Activity 11.10
1. Draw any triangle ABC.
2. Taking a point O outside the triangle as the centre of
enlargement, and with a scale factor 3, construct the image
triangle A′B′C′.The following is the procedure of constructing the image of triangle XYZ
under enlargement scale factor.(a) Draw triangle XYZ and choose a point O outside the triangle.
(b) Draw construction lines OX, OY and OZ, and produce them (Fig. 11.45).
(c) Measure OX, OY and OZ. Calculate the corresponding lengths OX′,
OY′ and OZ′; and mark off the image points. From the definition
of scale factor, it follows that image distance = k × object distance,
where k is the scale factor. Thus, OX′ = 3OX, OY′ = 3OY and
OZ′ = 3OZ.(d) Join points X′, Y′, Z′ to obtain the image triangle.
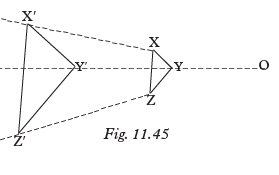
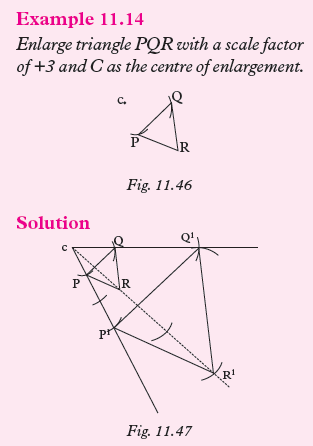
Example 11.15
Enlarge the triangle ABC given in the grid (Graph 11.1) by a scale factor 2
with centre of enlargement at (0,0).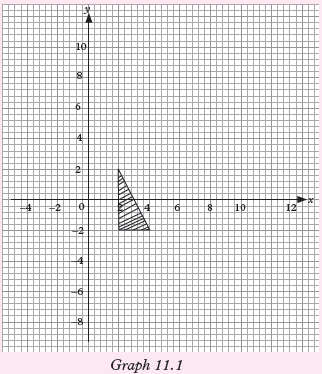
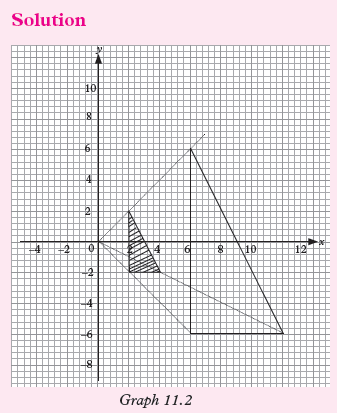
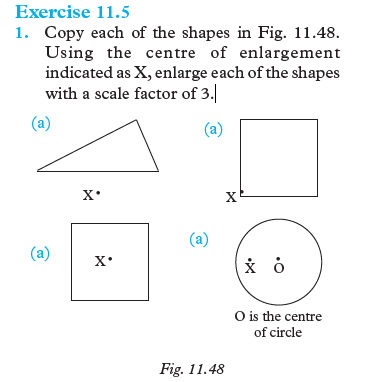
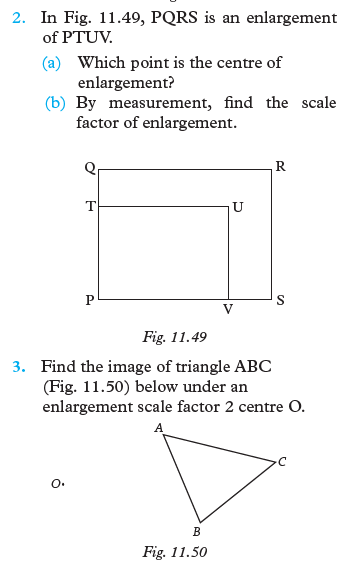
11.2.2.2 Fractional Scale factor
Activity 11.10
Construct the enlargement of triangle PQR shown in Fig. 11.51 with O as
the centre of enlargement and scalefactor 1/3.
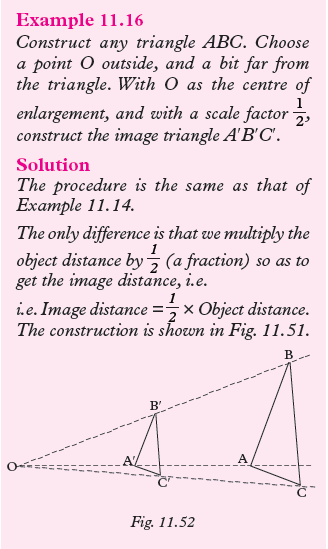
We notice that:
Under enlargement with a scale factor
that is a proper fraction:1. The object and the image are on the same side of the centre
of enlargement.2. The image is smaller than the object and lies between
the object and the centre of enlargement.3. Any line on the image is parallel to the corresponding line on the
object.Example 11. 17
Enlarge triangle ABC with a scale factor1/2
, centered about the origin.
OB′ =1/2OB
OC′ =1/2OC
Since the centre is the origin, we can in
this case multiply each coordinate by 1/2
to get the answers.A = (2, 2), so A′ will be (1, 1).
B = (2, 6), so B′ will be (1, 3).
C = (4, 2), so C′ will be (2, 1).
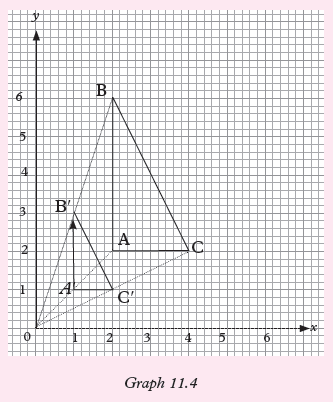


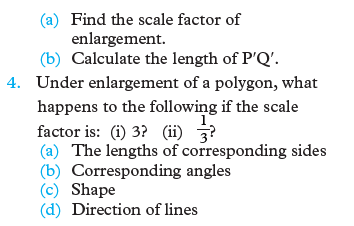
11.2.2.3 Negative scale factor
Activity 11.12In this activity, you will locate that ΔA′B′C′ as the image of ΔABC in
Fig. 11.55 under enlargement centre O, L.S.F –3, locate the image.
Procedure
(i) Join each vertex of ΔABC (object points) to centre O with straight lines.
(ii) Prolong each of these lines in the opposite side from centre O.
(iii) Measure the distance of each object point to centre O.
(iv) Multiply each of the object distance by 3 to get the
corresponding image distance.(v) Using the image distances obtained in (iv) above, locate the
image point of each object point on the opposite side from O on
the prolonged lines.(vi) Join the image points to form the required image triangle.
Fig. 11.56 shows the required image. (ΔA′B′C′).
Consider Fig. 11.57, in which the centre of enlargement is O and both images of flag
ABCD are 1.5 times as large as the object.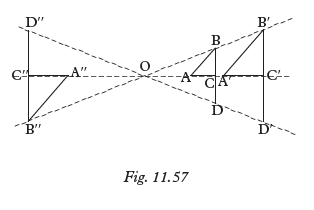
A′B′C′D′ is the image of ABCD under enlargement with centre O and scale
factor 1.5. A′′B′′C′′D′′ is also an image of ABCD
under enlargement with centre O. How is it different from A′B′C′D′?
OA = 1.2 cm and OA′′ = 1.8 cm. OA and OA′′ are on opposite sides of O. If
we mark A′′OA as a number line with O as zero and A as 1.2, then A′′ is –1.8(Fig. 11.58).

We say that the scale factor is –1.5 because
–1.5 × 1.2 = –1.8. We write OA′′ = –1.5 OA.
We notice that: Under enlargement with a negative
scale factor,1. the object and the image are on opposite sides of the centre of
enlargement,2. the image is larger or smaller than the object depending on whether
the scale factor is greater than 1 and negative or a negative proper fraction,3. any line on the image is parallel to the corresponding line on the
object, but the image is inverted relative to the object.Example 11.18
Enlarge the rectangle WXYZ (Fig 11.5) using a scale factor of - 2, centered about
the origin.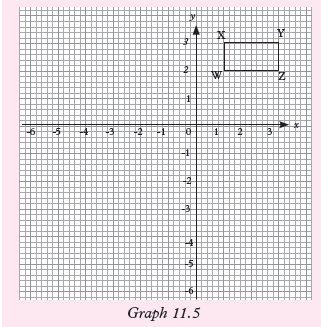
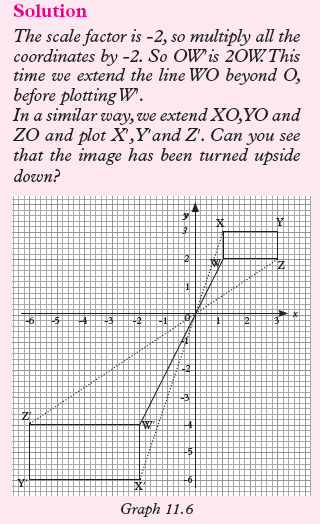


11.2.3 Locating the centre of enlargement and finding the
scale factorActivity 11.13
1. Fig. 11.61 show triangle ABC and its image triangle A′B′C′
under the enlargement.(a) Locate by construction the centre of enlargement
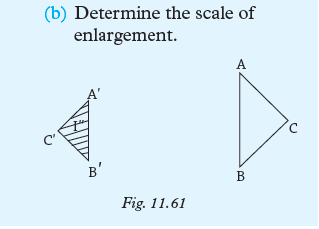
Example 11.19
Fig.11.62 shows a quadrilateral and its image under a certain enlargement.
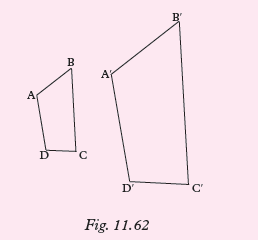
(a) Locate the centre of enlargement.
(b) Find the scale factor of enlargement.
(c) Given that a line measures 5 cm, find the length of its image under
the same enlargement.Solution
(a) To locate the centre of enlargement O, join A to A′, B to B′, C to C′
and D to D′ and produce the lines (Fig. 11.61). The point where
the lines meet is the centre of enlargement.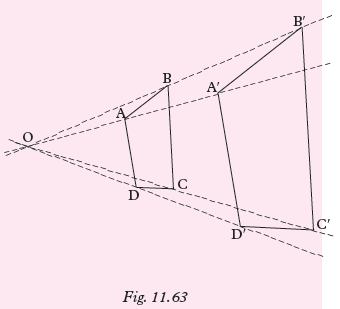
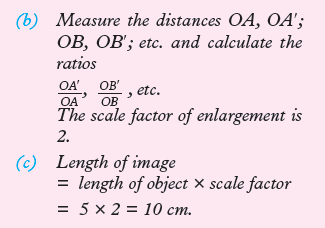
Note:
1. Given an object and its image, it is sufficient to construct only two
lines in order to obtain the centre of enlargement.2. An enlargement is fully described if the centre and scale factor of
enlargement are given.Exercise 11.8
1. In Fig. 11.64, ΔOA′B′ is the enlargement of ΔOAB.
(a) Which point is the centre of enlargement?
(b) Find the scale factor ofenlargement.
(c) Calculate the lengths A′B′ and AA′.
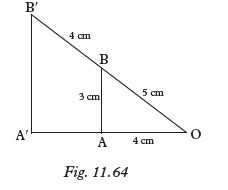
2. In Fig. 11.65, rectangle PQRS is an enlargement of rectangle ABCD with
centre O.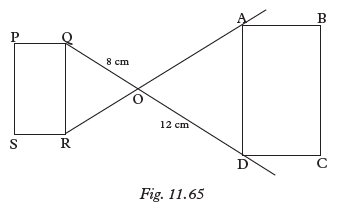
(a) Find the scale factor of enlargement.
(b) Which point is the image of point
(i) A; (ii) B; (iii) C?
(c) Find the length of the diagonal of rectangle PQRS given that the length
of the diagonal of rectangle ABCD is 15 cm.
3. Fig. 11.66 shows a triangle XYZ and image triangle X′Y′Z′. Copy the two
triangles and by construction find:(a) centre of enlargement
(b) scale factor of enlargement
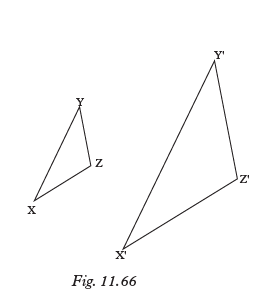
4. Fig. 11.67 shows triangle ABC and its image triangle ABC under an
enlargement.
Copy the two triangles and by construction find:
(a) centre of enlargement
(b) scale factor of enlargement.
5. In a scale model of a building, a door which is actually 2 m high is
represented as having a height of2 cm.(a) What is the scale of this model?
(b) Calculate the actual length of a wall which is represented as
being 5.2 cm long.6. When fully inflated, two balls have radii of 10.5 cm and 14 cm respectively. They
are deflated such that their diameters decrease in the same ratio. Calculate
the diameter of the smaller ball when the radius of the larger ball is 10 cm.7. A tree is 6 m high. In photographing it, a camera forms an inverted image
1.5 cm high on the film. The film is then processed and printed to form a
picture in which the tree is 6 cm high.
Calculate the scale factors for the two separate stages.8. Δ A′B′C′ is the image of Δ ABC (Fig. 11.68) after an enlargement.
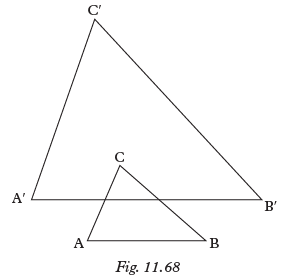
(a) Find by construction the centre of enlargement.
(b) Find the scale factor of the enlargement.
(c) Given that a line segment measures 8.5 cm, find the
length of its image under this enlargement.11.2.4 Properties of enlargement
Activity 11.14
1. Use reference materials, internet and other resources to research
on the properties of enlargement.2. State and explain the properties.
3. Where do you think the properties apply in real life?
Having learnt how to enalarge figures
using any scale factor, and to determinethe centre of enlargement, confirm the following properties of enlargement as a
transforming the activities we did.1. An object point, its image and the centre of enlargement are collinear.
2. For any point A on an object, OA = kOA , where k is the scale
factor.
(a) If k = 1, the object id mapped onto itself.(b) If k > 0, the object and its image lie on the same side of
the centre of enlargement.(c) If k < 0, the object and its image are on opposite sides of
the centre of enlargement.3. The centre of enlargement is the only point that remains fixed
irrespective of the scale factor.4. Both object and image are similar
5. If the linear scale factor of enlargement is k, the area scale
factor is k2. Where the enlargement is of a solid, the volume scale factor
is k3.11.2.5 Enlargement in the Cartesian plane
Activity 11.15
1. On a squared paper, draw a quadrilateral with vertices A(0, 3),
B(2, 3), C(3, 1) and D(3, –2).2. Copy and complete table 11.1 for the coordinates of A′B′C′D′
and P′, the images of points A, B, C, D and a general point P(a,b) under enlargement with centre the origin and the given scale
factors.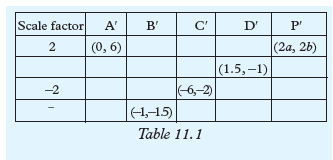
Note:
An enlargement with centre (0, 0) and scale factor k maps a point P(a, b) onto
P′(ka , kb).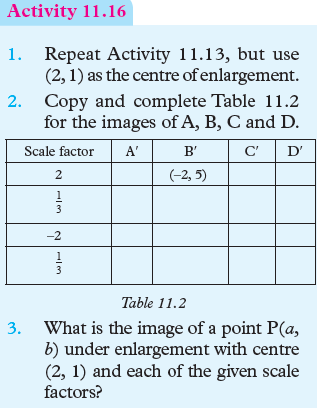
Note:
It is not possible to generalise for P (a , b) when the centre is not the origin. When
the centre of enlargement is not the origin, we must carry out complete constructionExample 11.20
In a cartesian plane plot traingle ABC whose coordinates are A(1, 0), B(3, 2) and
(2, 4). On the same cartesian plane locate and draw triangle A′B′C′ the
image of triangle ABC under enlargement scale factor 3 and centre origin.Solution
Using the steps we learnt earlier and also fact that an enlargment centre origin
scale factor K maps point P(a, b) tp P′(ka, kb) we obtain DA′B′C′ as shown in Fig. 11.7.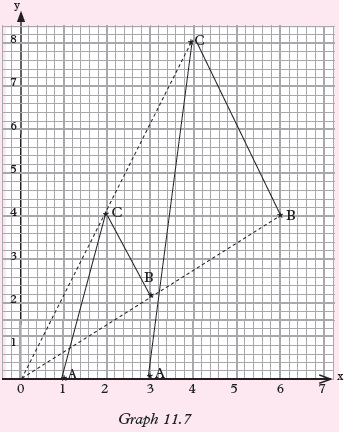
Example 11.21
The coordinates of a quadrilateral are Q(0, 1), R(2, 2) S(2, 4) and T(0, 3).
(a) plot the quadrilateral QRST on cartesian plane. Identify the
quadrilateral by name?(b) By construction, locate and draw the image of quadrilateral QRST
on the cartesian plane under enlargement scale factor -2 centre
(-2). Name the image as Q′R′S′T′.(c) Write down the co-ordinates of vertices of the image.
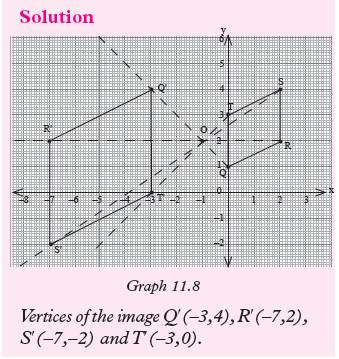
Exercise 11.9
1. Points A(–2, –1), B(1,–1), C(1, –4) and D(–2, –4) are vertices of a
square. Without drawing, state the coordinates of the vertices of the
image square under enlargement with centre origin and scale factor:
(a) –4 (b) –2 (c) –1 (d) 1/– 42. Triangle ABC with vertices A (9, 4), B
(9, 1) and C (15, 1) is mapped onto
Δ A′B′C′ vertices A′ (1, 2), B′ (1, 1)
and C′ (3, 1) by an enlargement.
Find:
(a) the scale factor of the enlargement.(b) the co–ordinates of the centre of enlargement.
3. Triangle ABC has vertices A(1, 2),B (3, 2), C (3, 4). Find the co–
ordinates of the image Δ A′B′C′ after
an enlargement, centre (0, 0) scale
factor –3.4. The points A (1, 1), B (3, 2),
C (3, 4) and D (1,3) are vertices of a quadrilateral.(a) Draw the quadilateral on the Cartesian plane.
(b) Taking O(4, 0) as the centre of enlargement, find the image
when the linear scale factor is:
(i) 1.5 (ii) –2.45. The vertices of an object and its image after an enlargement are
A (–1, 2), B (1, 4), C (2, 2) and A′ (–1, –2), B′(5, 4), C′(8, –2)
respectively.
Draw these shapes on squared paper.
Hence, find the centre and scale factor of enlargement.6. On squared paper, copy points A, B, C, D and F as they are in graph 11.9.
Given that ΔDEF is an enlargement of ΔABC, find the coordinates of E.
What is the centre of enlargement?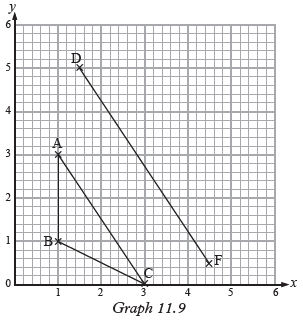
7. Points A(4, 0), B (0, 3) and C (4, 3)are the vertices of a triangle. Draw
the triangle on a squared paper. Copy and complete Table 11.3 for
the co–ordinates of A′, B′ and C′; the images of A, B and C under
enlargement with centre (0, 0).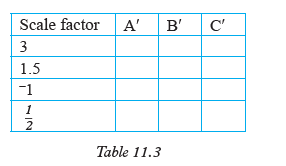
8. The vertices of Δ ABC are A (3, 2), B (1, 4) and C (4, 4). Find the image
of Δ ABC under enlargement, centre (0,0) and scale factor:
(i) –2 (ii) 1/2
.
9. The vertices of figure ABCD are A(1, 1), B(2, 4), C(1, 5) and D(5, 4).
Draw the figure and its image A′ B′ C′ D′ under enlargement scale factor +2
centre (–2, 3).10. The vertices of ΔABC are A(5, 2), B (7, 2) and C (6,1). Draw the
triangle and its image ΔA′B′C′ under enlargement scale factor –3 centre
(4, 1).11. The vertices of a triangle are X(1, 2), Y(3, 1) and Z(3, 3) and the vertices
of its image are X′(–4, 4), Y′(–8, 6) and Z′(–8, 2).(a) Find the centre of enlargement and the scale factor.
(b) Using the centre of enlargement in (a) above, locate the image
X′′Y′′Z′′ of XYZ using the scale factor of 2.5.11.2.6 Area scale factor
Activity 11.171. Draw a rectangle. Choose a point O anywhere outside the
rectangle.2. With O as the centre, enlarge the rectangle with scale factor 2.
3. What are the dimensions of the image rectangle?
4. Calculate the alinear scale factor (L.S.F) of the enlargement.
5. Calculate the areas of the two rectangles and the ratio
This ratio is called the area scale factor.
6. How does this ratio compare with the linear scale factor?
7. Repeat your enlargement but with scale factors 3, –2 and 1/2.
How do the new area scale factors compare with the corresponding
linear scale factors?Area scale factor (A.S.F) = (linearscale factor)2.
∴ L.S.F = A.S.F
Example 11.22
The ratio of the corresponding sides of two similar triangles is
3/2. If the area of the smaller triangle is 6 cm2, find the
area of the larger triangle.
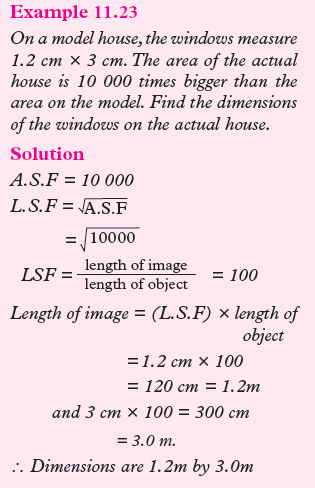
Exercise 11.10
1. A rectangle whose area is 18 cm2 is enlarged with linear scale factor 3.
What is the area of the image rectangle?2. A pair of corresponding sides of two similar triangles are 5 cm and 8 cm
long.
(a) What is the area scale factor?(b) If the larger triangle has an area of 256 cm2, what is the area of
the smaller triangle?3. The ratio of the areas of two circles is 16 : 25.
(a) What is the ratio of their radii?
(b) If the smaller circle has a diameter of 28 cm, find the diameter of the
larger circle.4. Two photographs are printed from the same negative. The area of one
is 36 times that of the other. If the smaller photograph measures 2.5 cm
by 2 cm, what are the dimensions of the larger one?5. A lady found that a carpet with an area of 13.5 m2 fitted exactly on the
floor of a room 4.5 m long. If she moved the carpet to a similar room
which is 1.5 m longer, how much floor area remained uncovered?6. An architect made a model of a building to a scale of 1 cm : 2 m. A
floor of the building is represented on the model with an area of 12 cm2.
What would be the corresponding area on another model of the same
building whose scale is 2 cm : 1 m?7. The scale of a map is 1:500 000. A section of sea has an area of 38.6
cm2. Find the actual area of the sea represented on the map in hectares.8. Small packets of tea leaves were packed in boxes measuring 30 cm by 42 cm
by 24 cm for dispatch. Given that each packet was similar to the container
and the ratio of sides of the box to the packet was 4 : 1, find the surface area
of each packet of tea leaves.11.2.7 Volume scale factor
Activity 11.18Fig. 11.69 shows a cuboid and its enlargement with scale factor 2.
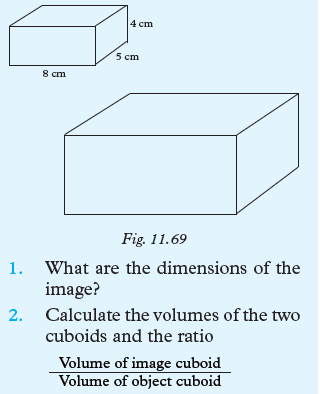
This ratio is called the volume scale factor (V.S.F).
3. How does this ratio compare with the linear scale factor?
4. If instead the scale factor of enlargement is 3, what are the
dimesions and volume of the image? How does the volume
scale factor compare with thelinear scale factor now? If the scale factor of enlargement is1/2,
what is the volume scale factor?5. Given area scale factor, how would one get volume scale
factor; and vice versa,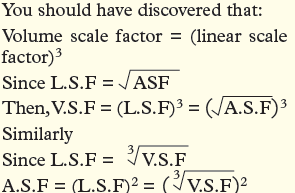
Note: For solids of the same material, the ratio of their masses is equal to the
ratio of their volumes.Example 11.24
A solid metal cone with a base radius 7 cm has a volume of 176 cm3. What
volume would a similar cone made of the same metal and with base radius
10.5 cm have?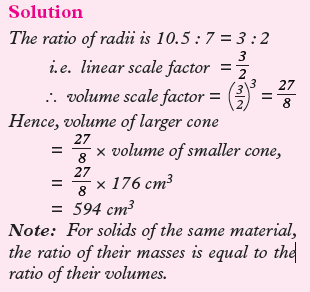
Example 11.25
Two similar cones A and B are such that the ratio of their volumes is 108:500. The
smaller cone has a curved surface area of 504 cm2. Find the area of the curved
surface of the bigger cone.
Example 11.26
The areas of two similar solids is 49 cm2 and 64 cm2.
(a) Find their volume scale factor.
(b) If the smaller one has a volume of 857.5 cm3,what is the volume of
the larger one?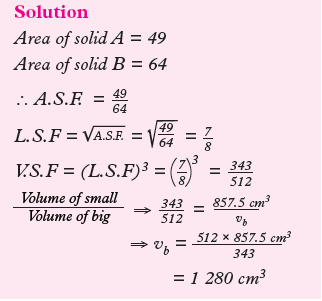
Exercise 11.11
1. The volume scale factor of two similarsolids is 27. What are their linear and
area scale factors?2. A cylinder with base radius r has a volume of 77 cm3. What is the volume
of a similar cylinder with base radius
(a) 2r (b) 3r ?3. Two similar jugs have capacities of 2 litres and 3 litres. If the height of the
larger jug is 30 cm, find the height of the smaller one.4. Two similar cones made of the same wood have masses 4 kg and 0.5 kg respectively.
If the base area of the smaller cone is 38.5 cm2, find the base area of the larger one?5. A concrete model of a commemoration monument is 50 cm high and has a mass
30 kg.
(a) What mass will the full size monument of height 9 m have if it is also made of concrete?(b) If the surface area of the model is 5000 cm2, what is the surface area of
the full size monument?6. Fig. 11.70 is a drawing of a model of a swimming pool. Find the capacity of the
actual pool, in litres, given that its length is 27 m.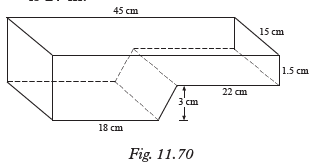
7. The volume of two similar cones are 960 cm3 and 405 cm3. If the area of the curved
surface of the bigger cone is 300 cm2, find the surface area of the smaller cone.8. The surface areas of two similar containers are 810 cm2 and 1 440 cm2. Find the
linear scale factor of the containers. Hence, find the capacity of the larger
container if the smaller one has a capacity of 108 litres.9. Two similar square based pyramids have base areas of 9 cm2 and 36 cm2
respectively. Calculate
(a) the height of the larger pyramid if the smaller pyramid is 9 cm high.(b) the ratio of the height to the width of the smaller pyramid if the ratio
for the larger pyramid is 3 : 1.(c) the inclination of a slant face of the larger pyramid if for the smaller one
is 76°.(d) the volume of the larger pyramid if the smaller one has a volume of 27 cm3.
Unit Summary
• Two triangles are similar if the corresponding sides are in proportion,
i.e. have a constant ratio or the corresponding angles are equal.
Congruent triangles are also similar.• For all shapes, other than triangles, both similarity conditions must be satisfied
for them to be similar.•. The ratio of the corresponding sides in similar figures is called a linear scale
factor.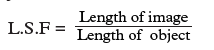
• For all solids, corresponding angles must be equal and the ratios of corresponding
lengths must be equal for the solids to be similar.• All cuboids are equiangular since all the faces are either rectangular or squares.
However, not all cuboids are similar but all cubes are.• If two figures are similar, the ratio of their corresponding areas equals the square of
their linear scale factor. A.S.F = (L.S.F)2• If two solids are similar, then the ratio of their corresponding volumes equals the
cube of their linear scale factor. V.S.F = (L.S.F)3• An enlargement is defined completely if the scale factor and the centre of
enlargement are known.• In an enlargement the object and its image are similar. If the scale factor is
±1, the object and its image are identical. Scale factor of enlargement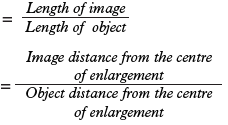
• To locate the centre of enlargement given an object and its image,
(a) join any two pairs of corresponding points.
(b) produce the lines until they meet at a point, that point is the centre of
enlargement.• An enlargement scale factor k centre origin (0, 0) maps a point P(a, b) onto
P′(ka , kb).Unit 11 test
1. In ΔABC (Fig. 11.71) identify two similar triangles in the figure and use them to
find the values of a and b
2. ΔABC has coordinates A(–3, 1), B(–3, 4), C(–1, 4). ΔA′B′C′ is such that A′(–1, –3),
B′(–1, 3) and C′(3, 3). Draw the two triangles on a graph paper. Find the
centre and the scale factor of enlargement that maps ΔABC onto ΔA′B′C′.3. Find the image of ΔABC A(2, 4), B(4, 2), C(5, 5), under enlargement centre (0, 0)
scale factor 2 and state the coordinatesof A′, B′ and C′, the images of points A, B and C.
4. The volumes of two similar cuboids are 500 cm3 and 108 cm3 respectively. Find
the ratio of their(a) volumes, (b) surface areas. If the larger cuboid has a total surface
area 400 cm2, find the surface area of the smaller cuboid.5. In ΔABC, BC = 5 cm, AC = 6 cm and ∠ACB = 49°. If ΔABC is enlarged to
ΔA′B′C′ using a linear scale factor 3/2 ,(a) write down the size of ∠A′C′B′ in relation to ΔABC
(b) calculate the length of the side A′C′.
(c) calculate the ratio of the area of ΔABC to the area of ΔA′B′C′ in
relation to DABC.(d) find the ratio A′C′ : B′C′.
6. In the Fig. 11.72, ABCD is a trapezium with AB parallel to DC. The diagonals
AC and BD intersect at E.(a) Giving reasons, show that ΔABE is similar to ΔCDE.
(b) Given that AB = 3DC find the ratio DB to EB.

7. A bowl in the shape of a hemisphere has a radius of length 10 cm. A similar bowl
has a radius of length 20 cm. Calculate:(a) the circumference of the larger bowl if that of the smaller one is 64 cm.
(b) the surface area of the larger bowl if that of smaller one is 629 cm2.
(c) the capacity of the larger bowl if that of the smaller one is 2.1 litres.
8. In Fig. 11.73, AB DE. Identify two similar triangles and use them to find the
values of x and y.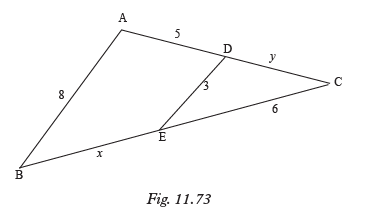
Unit12:INVERSE AND COMPOSITE TRANSFORMATIONS IN 2D
Key unit competence: By the end of this unit, learners should be able to solve
shape problems involving inverse and composite transformations.Unit outline
• Composite translations in two dimensions
• Composite reflections in two dimensions
• Composite rotations in two dimensions
• Mixed transformations in two dimensions
• Inverse transformations two dimensions.
Introduction
Unit Focus Activity
ABCD is a trapezium whose vertices are
A(1 , 2), B(7 , 2), C(5 , 4) and D(3 , 4).(a) On the same grid:
(i) Draw ABCD and its image A′B′C′D′ under a rotation of
90° clockwise about the origin.(ii) Draw the image A′′B′′C′′D′′ of A′B′C′D′ under a reflection
in the line y = x. State the co-ordinates of A′′B′′C′′D′′.(b) A′′′B′′′C′′′D′′′ is the image of A′′B′′C′′D′′ under the reflection
in the line y = 0. Draw the imageA′′′B′′′C′′′D′′′ and state its co-ordinates.
(c) Describe a transformation that maps A′′′B′′′C′′′D′′′ onto ABCD.
We have also learnt how to perform single transformations including reflection,
rotation and translation. In this unit, we will discover how to perform composite
transformation i.e one transformation followed by another and so on.12.1 Composite translations in two dimensions A B C
Activity 12.1
Given the vertices of a triangle ABC
as A (–4, 3), B (–1, 1) and C (–2, 5).(a) Plot the points ABC on a
Cartesian plane(b) Join the points A, B and C to form triangle ABC
(c) Move point A horizontally to the right by 6 units and then
vertically upwards by 2 units. Locate the final position of A as A′.(d) Repeat procedure (c) for points B and C.
(e) Join the points A′, B′ and C′
(f) What do you observe about the size and shape of ABC and A′B′C′?
(g) Move point A′ 4 units downwards along the grid. Then locate the
final position A′′. Repeat this procedure for both points B′and C′.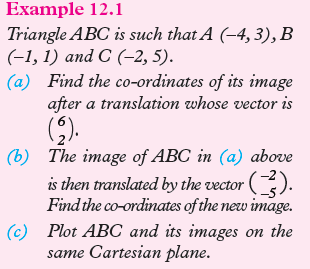
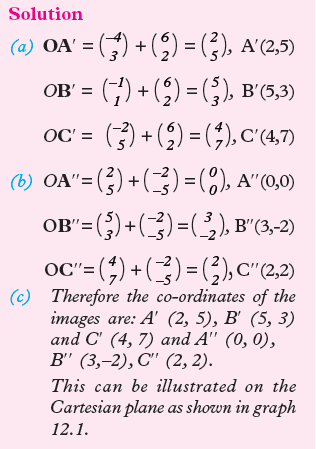
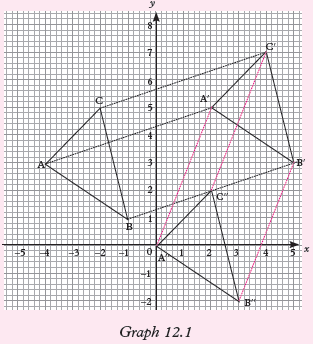
Composite transformation takes place when two or more transformations combine
to form a new transformation. Here, one transformation produces an image upon which
the other transformation is then performed. In a translation, all the points in the object
move through the same distance and in the same direction. In order to obtain the
image of a point under a translation, we add the translation vector to the position
vector of the point.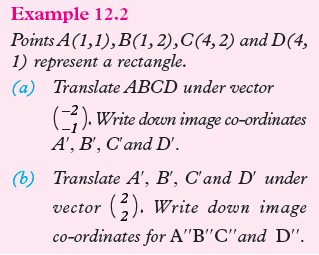
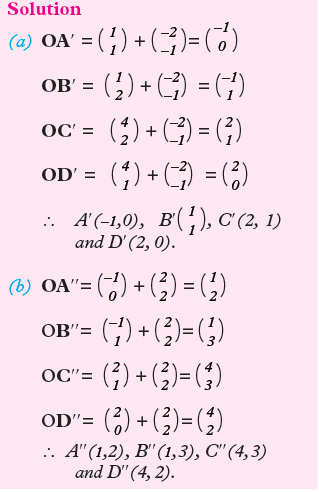
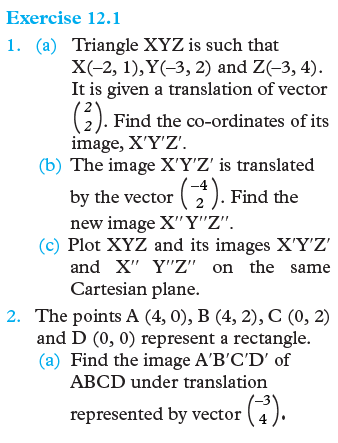


12.2 Composite reflections in two dimensions
Activity 12.21. Given the vertices of triangle ABC as A(-2, 1), B(-5,1) and C(-4,-3).
(a) Draw ABC, line x=0 and line
y=3 on the Cartesian plane.(b) Reflect triangle ABC into the
line x=0 to form the image A′B′C′. Write down the coordinates
of the image.(c) Reflect A′B′C′ into the line
y=3 to k form the image A′′B′′C′′. Write down the
co-ordinates of the image.A composite reflection is two or more reflection performed one after the other.
Some simple reflections can be performed easily in the co-ordinate plane using the
following general rules.(a) Reflection in x-axis Consider point P(2, 3) in the graph and
assume x-axis is the mirror. The image of P under the reflection is P′(2, –3). The
x-axis value does not change but the y-axis value changes the direction.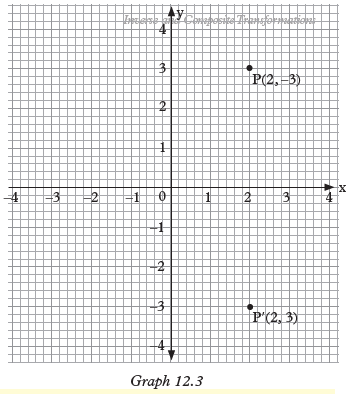
The rule for the reflection in the x-axis is P(x, y ) → (x, – y).
(b) Reflection in the y-axis Consider point in the graph 12.4 and
assume axis is the mirror. The image of P(–2, 3). The y-axis value does not change
but the y-axis value changes the direction.
The rule for the reflection in the y-axis is P′(x, y) → P′(–x, y).
(c) Reflection in line y = x Consider point P(–3, 2) in the graph12.5
below and y = x assume is the mirror. The image of P under the reflection is P′(2, –3)
the -axis value becomes -axis value whileaxis value becomes-axis value.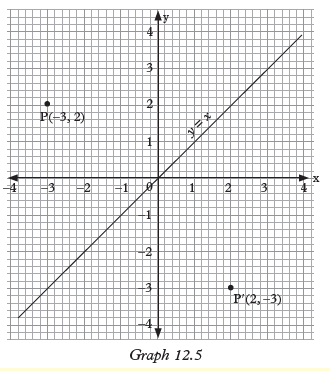
The rule for the reflection in the line is y = x is P(x, y) → P′(y, x).
(d) Reflection in the line y = –x Consider point P in the graph 12.6 and
assume line y = –x is the mirror. The image of P (3, 2) under the reflection is
the x-axis value becomes –y-axis value while y-axis value becomes –x-axis value
ie P′ (–2, –3).
The rule for a reflection in the line y = –x is P(x, y) → P′(–y, –x).
(e) Equation of the mirror line
Equation of the mirror line can be found by using the coordinates of the midpoints
of the image and the object lines.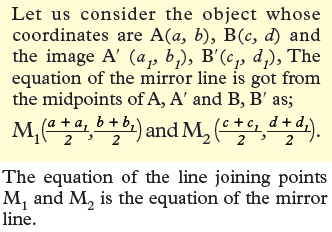
Example 12.3
The points A (1, 3), B (1, 6) and C (3, 6) are the vertices of triangle ABC.
(a) On a Cartesian plane, draw triangle ABC.
(b) Triangle ABC is reflected in the line y = x. Draw the image A’B’C’
on the same Cartesian plane and state its co-ordinates.(c) Triangles A′B′C′ is then reflected in the line y = 0 (x-axis). Draw
the image A′′B′′C′′ of A′B′C′ on the same Cartesian plane and state
its co-ordinates.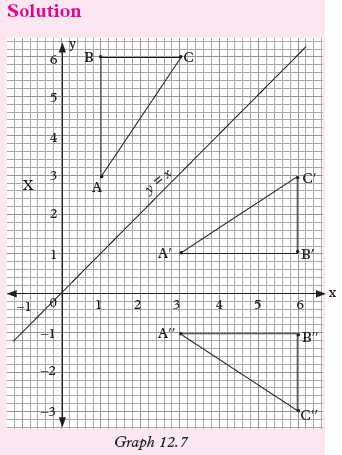
Co-ordinates of the images. A’ (3,1),B’ (6,1),C’ (6,3)
A′′(3,–1), B′′ (6,–1), C′′ (6, –3)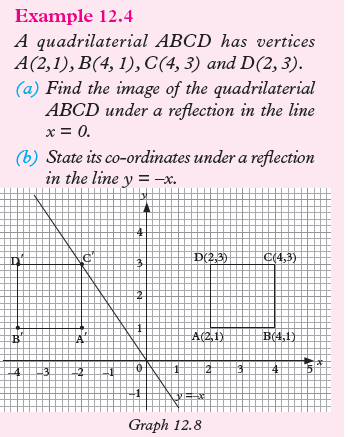
Example 12.5
The vertices of a quadrilateral are A(2, 0.5), B(2, 2), C(4, 3.5) and D(3.5,
1). Find the image of the quadrilateral
under reflection in line y=0 followed by reflection in line y = –x.Solution
‘Reflection in line y=0 followed by reflection in line y=–x means that we
first obtain the image under reflection in line y=0 and then reflect this image
in line y = –x.This is shown in graph 12.9. In the graph, A′B′C′D′ is the reflection of
ABCD in line y = 0. A′′B′′C′′D′′ is the reflection of A′B′C′D′ in line y = –x.
Thus the required image vertices are: A′(2, –0.5), B′(2, –2), C′(4, –3.5) and
D′(3.5, 1) A′′(0.5, –2), B′′(2, –2), C′′(3.5, –4) and D′′(1, 3.5)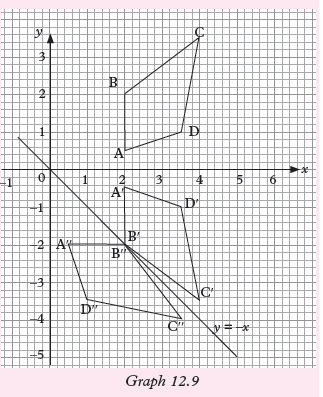
Example 12.6
In graph 12.10 triangle ABC has vertices A(–3,3), B(–3,1) and C(–2,2).
A′B′C′ and A′′B′′C′′ are its images after given reflections.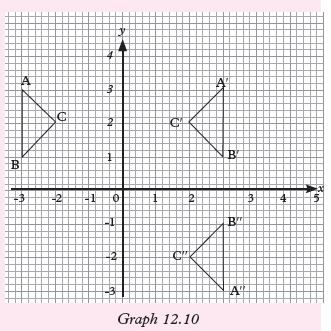
(a) Write down all image co-ordinates.
(b) Write down equations of the reflection lines.
Solution
(a) Image co-ordinates.
A′(3,3),B′ (3,1),C′(2,2)
A′′(3, –3) B′′(3, –1), C′′(2, –2)(b) Equations of refrection lines.
From triangle ABC to A′B′C′,
equation of the line x=0.
From triangle A′B′C′ to A′′B′′C′′,
equation of the line is y=0.Exercise 12.2
1. (a) Draw triangle ABC with vertices as
A (6, 8), B (2, 8), C (2, 6).
Draw the lines y = 2 and y = x.(b) Draw the image of triangle ABC after reflection in;
(i) The y-axis. Label it triangle A′B′C′.
(ii) The x-axis. Label it triangle A′′B′′C′′.
(iii) The line y=x. Label it triangle A′′′B′′′C′′′.
(c) Write down the co-ordinates of the image of point A in each case.
2. (a) Plot triangle 1 defined by (3,1), (7,1) (7,3).
(b) Reflect triangle 1 in the line y = x onto triangle 2.
(c) Reflect triangle 2 in the line y = 0 (x-axis) onto triangle 3.
(d) Reflect triangle 3 in the line
y = -x onto triangle 4.(e) Reflect triangle 4 in the line x = 2 onto triangle 5.
(f) Write down the co-ordinates of triangle 5.
3. (a) Construct triangle 1 at (2, 6), (2, 8), (6, 6).
(b) Reflect triangle 1 in the line
x + y = 6 onto triangle 2(c) Reflect triangle 2 in the line x = 3 onto triangle 3.
(d) Reflect triangle 3 in the line
x + y = 6 onto triangle 4(e) Reflect triangle 4 in the line
y = x - 8 onto triangle 5.(f) Write down the co-ordinates of triangle 5.
4. (a) Draw and label the following triangles.
Triangle 1: (3, 3), (3, 6), (1, 6)
Triangle 2: (3,–1), (3, –4), (1, –4)
Triangle 3: (3, 3), (6, 3), (6, 1)
Triangle 4: (–6, –1), (–6, –3),
(–3, –3)
Triangle 5: (–6, 5), (–6, 7), (–3, 7)(b) Find the equation of the mirror line for the reflection;
(i) Triangle 1 onto triangle 2
(ii) Triangle 1 onto triangle 3
(iii) Triangle 1 onto triangle 4
(iv) Triangle 4 onto triangle 5.
5. Rectangle ABCD has vertices
A(–1,0), B(–1,2), C(1,0) and D(1,2).
(a) Construct rectangle ABCD on a Cartesian plane.(b) Reflect rectangle ABCD in thex-axis.
(i) Write down the imagecoordinates.
(ii) Construct the image of ABCD on the same
Cartesian plane.12.3 Composite rotations in two dimensions
Activity 12.31. You are given a line segment with end points A (2, 2) and B (2, 5).
(a) Draw line AB on a Cartesian plane.
(b) Fix point A and rotate pointB through 60º in clockwise direction.
(c) Write down the co-ordinate B′ the image of B.
(d) Leaving A as a fixed point, rotate point B′ 90º in
anticlockwise direction.(e) Write down the co-ordinate B′′ the image of B′.
2. Fig.12.1 shows unmarked clock.
(a) Mark the clock with appropriate time values if
the minute and hour hands are moving in clockwise direction.(b) Mark the clock with appropriate time values if
the minute and hour hands are moving in anti-clockwise
direction.The three important factors of rotation are direction of rotation, Centre of
rotation and the angle of rotation. The angle of rotation is measured in
degrees. A rotation of 3600 is called arevolution. A rotation of 270° is the equator turn. A rotation of 180° is called
a half turn and a rotation of 90° is called a quarter turn. Figure 12.11 shows the
various turns. The dotted lines show the initial positions.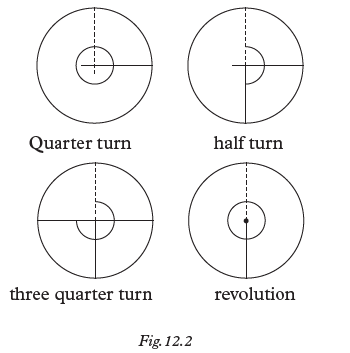
The direction in which the hands of a clock turn is called clockwise and the
rotation in the opposite direction is called anticlockwise.
The angle of rotation in an anticlockwise direction is positive and that in a
clockwise direction is negative. Thus, a rotation of 90º anticlockwise is
written as +90º and 90º clockwise as -90º.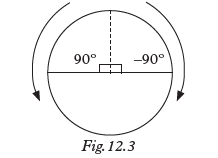
When an object is given a rotational transformation, the image is always
the same size as the object. Such a transformation is called an isometry.If M(h,k) is any point, its rotation follows the following rules.
1. M(h,k) has image M′(–k,h) after rotation at 90° in anticlockwise
direction.2. M(h,k) has the image M′(k,–h) after rotation at 90° in clockwise direction.
3. M(h,k) has the image M′(–h, –k) after rotation at 180° in either clockwise or
anticlockwise direction.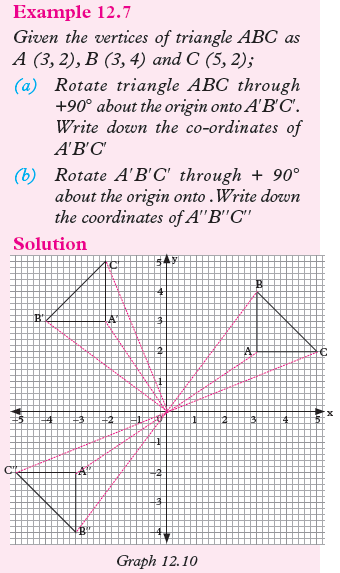
Co-ordinates of the Images.
A′(–2, 3), B′ (–4, 3), C′(–2, 5)
A′′(–3,–2), B′′ (–3,–4), C′′ (–5,–2)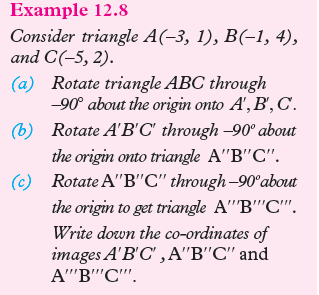
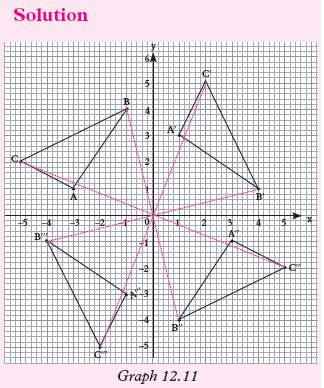
(d) A′(1, 3), B′(4, 1), C′(2, 5)
A′′(3, –1), B′′(1, –4) C′′(5, –2)
A′′′(–1, –3), B′′′(–4, –1),
A′′′(–1, –3) C′′′(–2, –5),Exercise 12.3
1. (a) Draw triangle one at A(1,2), B(1,6), C(3,5).
(b) Rotate triangle one 90o clockwise centre (1,2) onto triangle two.
(c) Rotate triangle two 180o centre (2,-1) onto triangle three.
(d) Rotate triangle three 90o clockwise, centre (2,3) onto triangle four
(e) Write down the co-ordinates of triangle four.
2. (a) Draw and label the following triangles on a Cartesian plane.
Triangle 1: (3, 1), (6, 1), (6, 3)
Triangle 2: (-1, 3), (-1, 6), (-3, 6)
Triangle 3: (1, 1), (-2, 1), (-2,-1)
Triangle 4: (-3, 1), (–3,4), (–5,4)
(b) Describe fully the following rotations.
(i) 1 onto 2 (ii) 1 onto 3
(iii) 1 onto 4 (iv) 3 onto 2
3. (a) Draw triangle 1 at (4,7), (8,5), (8,7).
(b) Rotate triangle 1, 90° clockwise centre (4, 3) onto triangle 2.
(c) Rotate triangle 2, 180° centre (5, –1) onto triangle 3.
(d) Rotate triangle 3, 90° anticlockwise, centre (0, –8) onto triangle 4.
(e) Describe fully the following rotations;
(i) Triangle 4 onto triangle 1
(ii) Triangle 4 onto triangle 2.
4. (a) Draw triangle LMN at L(3, 1), M(6, 1), N(3, 3) and its image
after half turn about the origin.
State the co-ordinates of the vertices L′, M′ and N′ of the image of a triangle.(b) Rotate L′M′N′ of (a) above through +90o about the origin. State the
co-ordinates of L′′, M′′, N′′.12.4 Mixed composite transformations in two dimensions
Activity 12.5
Given triangle ABC has vertices
A(0, 2), B(2, 2) and C(2, 5).(a) Plot triangle ABC on a Cartesian plane.
(b) Reflect triangle ABC in the line
x = 3 to get the image A′,B′,C′.
Write the co-ordinates of A′B′C′.(c) Translate triangle A′B′C′ bythe vector
 to get the image
A′′B′′C′′. Write down the co-ordinates of A′′, B′′, and C′′.An object can undergo several different transformations, one after the other.
This is done such that the image of the preceding transformation becomes the
object of the next transformation. When an object, A, undergoes a
transformation R followed by another transformation N, this is represented
as N[R (A)] or NR (A).
The first transformation is always indicated to the right of the second
transformation. RR (A) means ‘perform transformation
R on A and then perform R on the image’. It also written R2(A).Example 12.9
A is a triangle with vertices (2, 1), (2, 4)
and (4, 1). R is a rotation of 90º. Clockwise about the origin and N is a
reflection in the y-axis. Find the vertices of the image of A if it undergoes the
following transformations:
(a) NR (A) (b) RN (A)

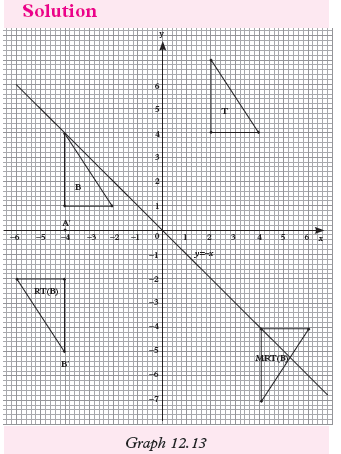
Vertices of MRT (B) are (4,-4) (6,-4)(4,-7).
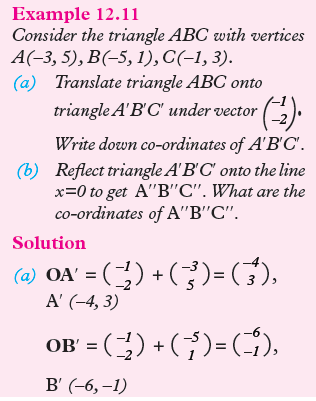


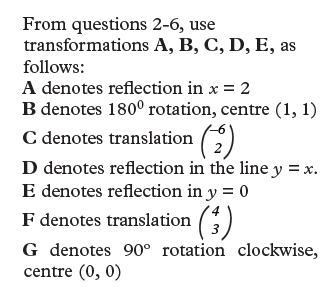

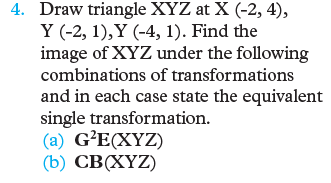

12.5 Inverse transformations in two dimensions
Activity 12.5
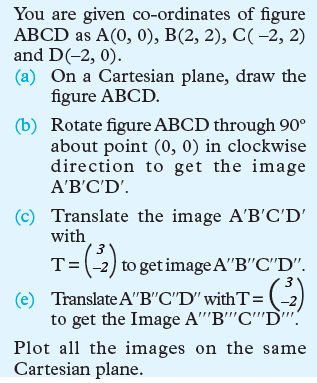
The inverse of a transformation reverses the transformation, i.e. it is the
transformation which maps the image back to the object.
The following are examples of inverse transformations are defined by the
following cases.1. If R denotes θº clockwise rotation, about (0, 0), then R-1 denotes θo
anticlockwise rotation about (0, 0).2. If translation T has vector, the translation which has the opposite
effect has vector. This is written as T-13. For all reflections, the inverse is the same reflection. For example
if X is reflection then X-1 is also reflection.
The symbol T-3 means (T-1)3 i.e. perform T-1 three times.Example 12.12
An image of a triangle with vertices A′(1, –2), B′(1,–4) and C′(6, –1) is
formed after an object ABC undergoes a clockwise rotation through 90º about the
origin. Find by construction the co-ordinates of its object, ABC.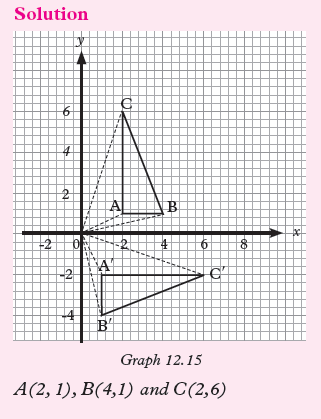
Example 12.13
P′Q′R′S′ is the image trapezium whose vertices are P′(1,3), Q′(4,3), R′(1,1)
and S′(6,1). P′Q′R′S′ is obtained after reflection in
the x=0.
(a) Obtain the co-ordinates of object trapezium PQRS.(b) Write down the co-ordinates of P′′Q′′R′′S′′ the image of PQRS
when reflected in the line y=0.Solution
All the co-ordinates can be obtained from graph 12.17 below.
• The line x=0 is y–axis.
• The line y=0 is x–axis.
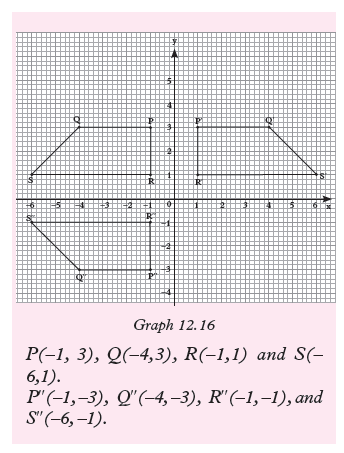
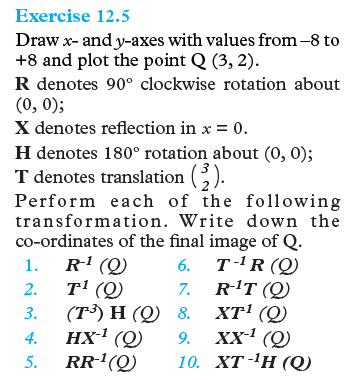
Unit Summary
• In composite translation, all the points in the object move through the same
distance and in the same direction• Composite reflection: A reflection is a trans-formation representing a
flip of a figure.
A reflection maps every point of a figure to an image across a fixed line.
The fixed line is called the line of reflection• Equation of a mirror line: Equation of the mirror line can be
found by using the co-ordinates of the midpoints of the image and the
object.
For example the object whose co-ordinates are A(a, b) and B(c, d),
and the image A’(a1,b1), B’(c1,d1), The equation of the mirror line is
got from the midpoints of A, A’ and B, B’ as; and
andThe equation of the line joining points M1 and M2 is the equation of
the mirror line.
• Composite rotation: The turning of an object about a fixed point or
axis is called rotation. The amount of turning is called the angle of rotation.• Mixed transformations: An object can undergo several transformations,
one after the other. This is done such that the image of the preceding
transformation becomes the object of the next transformation.• Inverse of a transformation: The inverse of a transformation reverses
the transformation, i.e. it is the transformation which takes the image
back to the object.Unit 12 Test
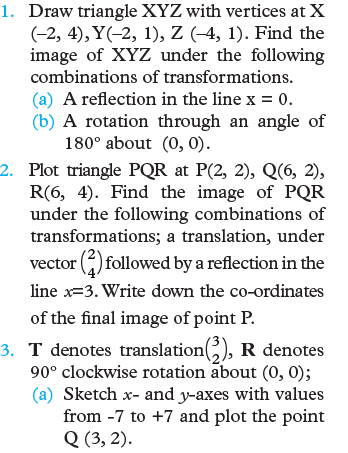
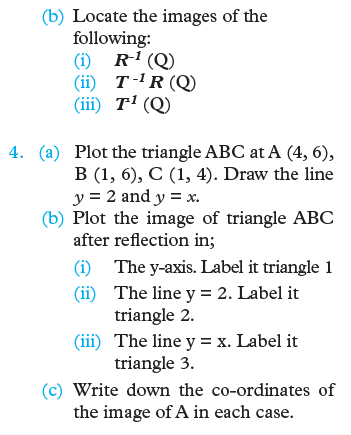
Unit13:STATISTICS (BIVARIATE DATA)
Key unit competence: By the end of this unit, the learner should be able to
collect, represent and interpret bivariate data.
Unit outline• Definition and examples bivariate data.
• Frequency distribution table of bivariate data.• Review of data representation using graphs.• Definition of scatter diagrams.• Correlation• Unit summary• Unit TestIntroductionUnit Focus ActivityIn a certain school, 15 boys took two examination papers in the same subject.
The percentage marks obtained by each boy is given in table 13.1 where each
boy’s marks are in the same column.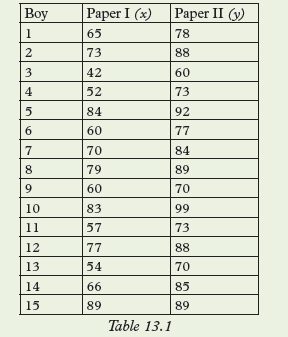 (a) Is the performance in the twopapers consistent? Which is the
better of the two performances?(b) Plot the corresponding points (x, y) on a Cartesian plane and
describe the resulting graph.(c) Can you obtain a rule relating x and y? Explain your answer.(d) Calculate the mean mark in each paper and represent the same
on your graph paper. Can you describe the performance in each
paper with reference to the mean mark.(e) Can you draw a line that roughly represents the points in your graph?(f) Calculate the median mark on each paper, denote the medians as
mx and my respectively.(g) Using the graph Table 13.1, divide the set into 3 regions each
containing 5 entries.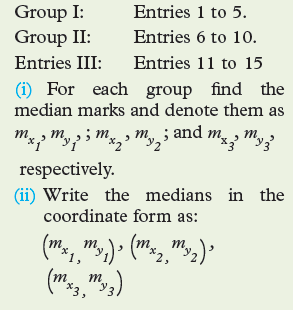 (iii) Plot the three points on the same graphs and join them
with the best line you can draw.Most of the statistical skills that we have developed in our earlier work were based
on one variate i.e one set of data only. Such variates included heights, mass,
age, marks etc. In everyday life situations, activities, circumstances etc may arise so
that there is need to compare two sets of data. In this unit we shall learn how
represent and analyse data that considers use of two variables for the same person
or activity.13.1 Definition and examples of bivariate dataActivity 13.11. Use reference books or internet to define bivariate data.2. Give examples of bivariate data that can be obtained.(i) From members of your class(ii) From any other source.Consider statistical data whose observations have exactly two measurement
or variables for the same group of persons, items or activities.
Such data is know as Bivariate data. Some examples of Bivariate data are• Age (x) years and masskg
• Height (x) cm and age• Height (x) cm and mass• Expenditure in a business (x) and profit
time etc.13.2 Frequency distribution table for bivariate data
Activity 13.2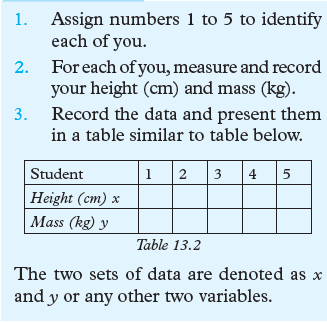 This data can be displayed in a frequency table using the information
for the whole class for later use. In a bivariate data, the x and y are
considered as an ordered part written as (x1, y1), (x2, y2),…..(xn, yn). Meaning
that both variables have equal number of elements, referring to the same entry.
Suppose a Mathematics examination consists of two distinct papers i.e. an
algebra paper and a geometry paper. The mark scored by a candidate in the
algebra paper is one variate, and that on the Geometry is another variate. In
order to assess the overall performance in mathematics the examiner must
consider the two corresponding marks together for each student.
Let x denote the algebra mark And y denote the geometry mark.
And the number of students in the class be 15.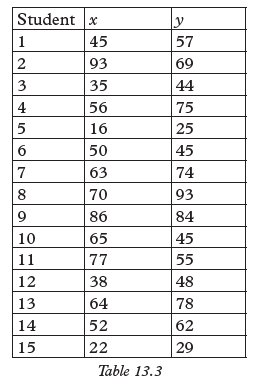 The set of marks (x, y) in table 13.3 above
is an example of bivariate data. Every set denotes the corresponding
marks for each student. For example student member 1 scored 45% in algebra
and 57% in geometry.13.3 Review of data presentation using graphs
Activity 13.3 4. What kind of graph do you obtain? Would it make sense to join these
points?To be able to represent any two variables graphically, one should first write the
given information in co-ordinate form.• For an accurate graph, an appropriate scale should be chosen and used.• In order to analyse a graph accurately, it must be accurately drawn and
points joined either using:i) A straight line orii) A curve oriii) A series of zigzag line segments.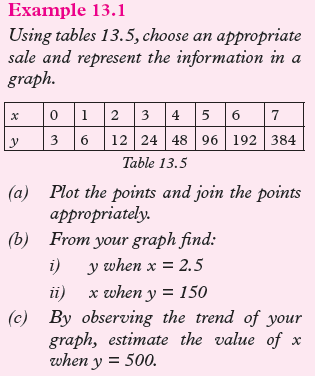

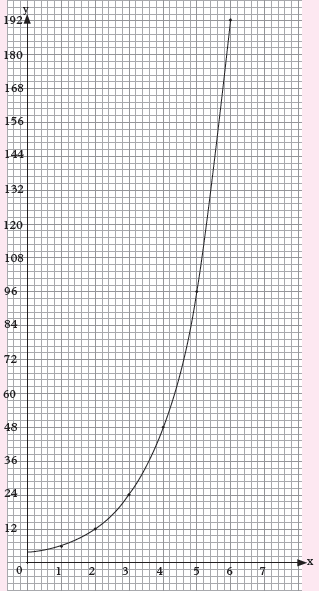 Graph. 13.1This graph represents a curve with an increasing upward trend.(a) Graph 13.1 shows the required graph of y against x.(b) (i) when x = 2.5, y = 30(ii) when y = 150, x = 4.6(c) When y = 500, x = 7.Note:
The graph in our example results in a curve.
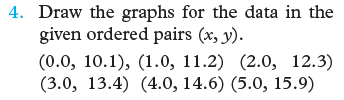 13.4 Representing bivariate using scatter diagrams13.4.1 Definition of scatter diagramsActivity 13.4In a certain county, data relating 18 to 25 year old drivers and fatal traffic
accidents was gathered and recorded over a period of 3 months. The data
was presented as in table 13.9.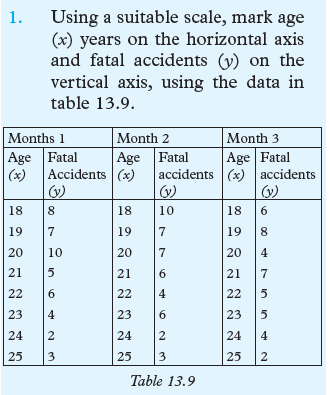 2. Plot the points (18, 8) (18,10) (18,6),………….(25, 2)3. What patterns do the points reveal that can help you draw
any conclusion?4. Do you think any group or groups of people would be
interested in the conclusion of this activity? Explain.Often graphs are in form of straight lines, or curves or continuous jagged line
segments.However, some graphs do not fit into any of these categories. Some graphs result in
a scatter of points rather than a collection of points falling on a well-defined line
or curve. Sometimes there may be an underlying linear relation between the
variables, but the points in the graph are scattered along it rather than fall on it.Such a graph is called a scatter graph orscatter diagram.13.4.2 The line of best fit in a scatter diagram
Activity 13.5Using the graph you obtained in activity 13.4, draw a line as follows.
1. Use a transparent ruler.2. Place the ruler on the scatter diagram in the direction of the
trend of the points so that you can see all the points.3. Adjust the ruler until it appears as though it passes through the
centre of the data (points). Then draw the line.Although the points in Fig 13.1 do not fall on a line, they seem to scatter in a specific
direction. Therefore, a line that closely approximates the data can be drawn and
used to analyse the data further. In a scatter diagram, it is not easy
to define a relation between the two variables involved. However, the points
may appear to point some direction which may be approximated by a line
known as the line of best fit.Using points on such a line, we can
analyse the given data as follows;i) Describe the relation between the two variables.ii) Find the equation of the line,iii) Interpret the data i.e. read values from the graph,.iv) Describe the trend of the graph. written R2(A).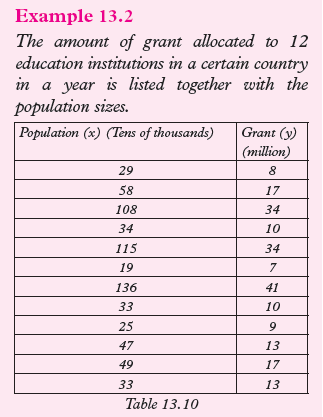 (a) Write the data in co-ordinate form.(b) Plot the points to obtain a scatter diagram.(c) Draw the line of best fit.(d) Identify three points on the line and use them to find the equation of the
line.(e) Describe the trend of the graph.(f) Use the graph to estimate: (i) x
when y = 42.0 ; (ii) y when x =85.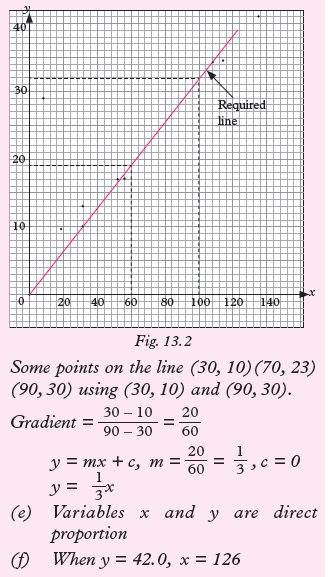
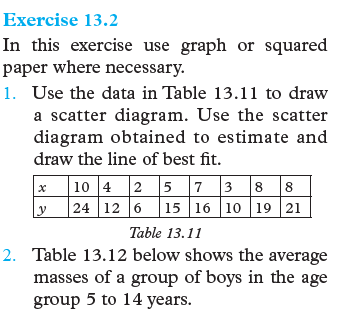
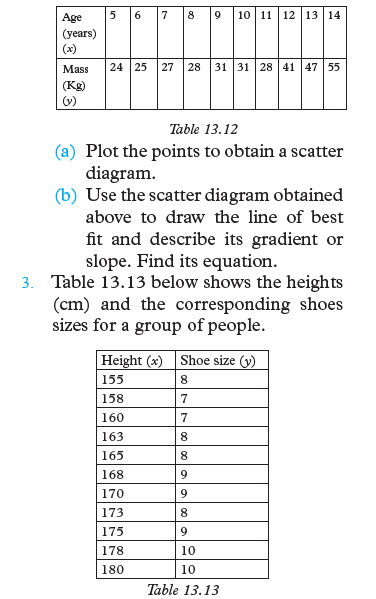 Use the data to draw a scattered diagram. Use the scatter diagram
obtained to draw the line of best fit. Use your graph to estimate the shoe
size you expect someone 171 cm tall to wear.4. From an experiment, different masses are attached at the end of a spring
wire and the length of the wire noted and recorded as in Table 13.14 below.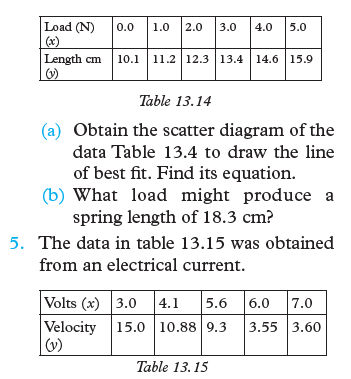 (a) Obtain the scatter diagram for the data in table 13.15 to estimate
the line of best fit.(b) What velocity corresponds to 8.0 volts?(c) What can you say about the gradient of the line?(d) Find the equation of the lineAlternative method of obtaining the line of best fit (The median fit line)Activity 13.6Table 13.16 shows the result of a survey done on nine supermarket
stores. It shows the amount of money spent on advertising
each day and the corresponding amount of money earned as
profit.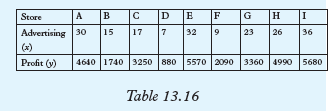 use Table 13.17 to draw a scatter diagram.Step 11. Divide the scatter diagram into three region. Each region should
have the same number of points.Step 21. For each region, using the table of values above,(i) find the median of the x co-ordinates (x - median)(ii) find the median of the y co-ordinates (y - median).(iii) Write the x- and y-medians for each region in the coordinate
form.(iv) On the scatter diagram, plot the three median points.(v) Place the edge of a ruler between the first and third median points. If
the middle point is not on the line formed, then slide
the ruler about a third of the way towards the second
points without changing the direction of the shape of the
line. Draw the median fit line.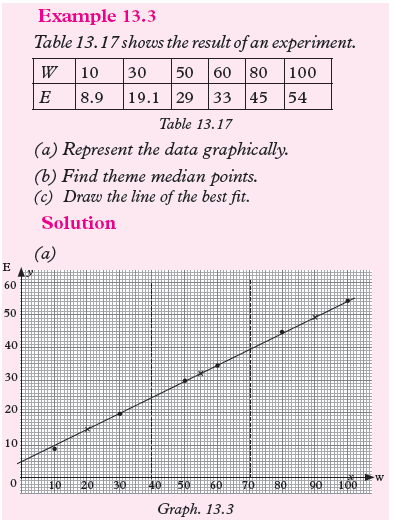 (b) The median points are (20, 14), (55, 31), and (90, 49.5). They are marked with
(x) crosses on the graph.


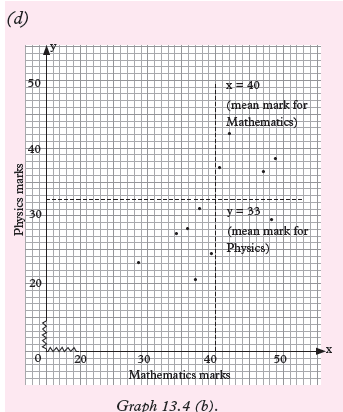 • The broken lines in Graph 13.4 (b) represent the mean marks for
the two subjects.• From this graph we can see that any Physics mark above 33 is
above average score. Similarly any Mathematics mark above 40 is
above average score.• We can see that the above-average scorers are same in the two
subjects.Also the below-average scorers are the same.From these observations, we can conclude that, for this sample, ability in
Mathematics is closely associated with ability in Physics.Exercise 13.31. The mass (kg) and the average daily food consumption for a group of 13
teenage boys was recorded as in Table 13.19.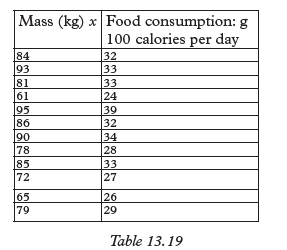 Use the table to:(a) Draw a scatter diagram.(b) Estimate the line of best fit.(c) Describe the slope of the line.2. Table 13.20 below shows marks scored by 25 students in two subjects,
Chemistry and Social studies. a) Use the data to draw a scatter diagram.(b) Use the method of mean marks to establish the type of relationship if
any between the Chemistry marks and the Social studies marks.13.5 CorrelationActivity 13.71. Use the dictionary or internet to find the meaning of the world
correlation.
Table 13.21 shows entrance test marks (x) and the corresponding
course grade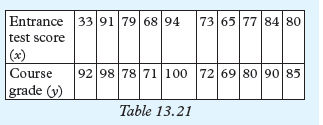 2. Draw a scatter diagram for the data in table 13.21 and draw a
line of best fit. Comment on the suitability of the entrance test to
the placement of the students in the respective courses the
co-ordinates of the image.By definition, correlation is a mutual relationship between two or more things.
Examples of correlation in real life include:• As students study time increases, the tests average increases too.• As the number of trees cut down increases, soil erosion increases too.• The more you exercise your muscles, the stronger they get.• As a child grows, so does the clothing size.• The more one smokes, the fewer years he will have to live.• A student who has many absences has a decrease in grades scored.Types of correlationActivity 13.8Identify positive and negative
correlation situation in the following cases:a) The more times people have unprotected sex with different
partners, the more the rates of HIV in a society.b) The more people save their incomes, the more financially
stable they become.c) As weather gets colder, air conditioning costs decrease.d) The more alcohol are consumes, the less the judgment one has.e) The more one cleans the house, the less likely are to be pests
problems.Correlation can be negative or positive depending on the situation:
In a situation where one variable positively affects another variable, we
say positive correlation has occurred. Also, when one variable affects another
variable negatively, we say negative correlation has occurred.
Correlation is a scatter diagram which can be determined whether it is positive
or negative by following the trend of the points and the gradient of the line of the
best fit.• If the gradient is positive, the positive correlation occurs.• If the gradient is negative, then negative correlation occurs• If gradient is zero, the there is no correlation between two variables.Example 13.5The amount of government bursaries allocated to certain administration
regions in the country in a certain year is listed together with their population sizes.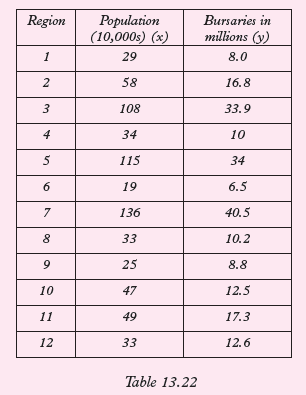 Use the data in table 13.22 to draw a scatter diagram and assess whether
there appears to be correlation between the two measurements labeled x and y.
Vs: 1 cm: 50 000
Hs: 1 cm: 10 mSolutionGraph 13.5 shows the scatter diagram and the line of bet fit of the sets of data.
The two measurements (x) and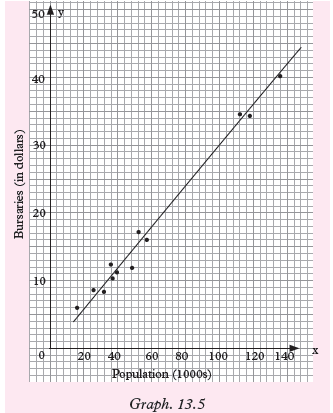 The best line of fit in this scatter diagram follows the general trend of the
points. This line has a positive gradient. Thus, the relation in this data is called
a positive correlation. image cordinator A′′B′′C′′and D′′Example 13.6The following measurements were made and the data recorded to the nearest cm.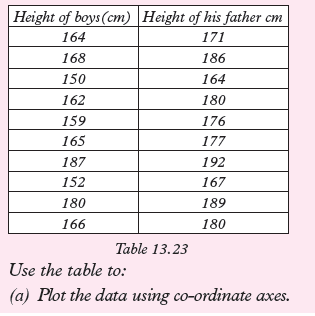 b) Draw the line of best fit for the data(c) Find the equation of the line in (b) above.(d) Describe the correlation.(e) Would it be reasonable to use your graph to estimate the height of a
father whose son is 158 cm tall?SolutionLet the height of the boy be x cm and that of the father y cm. Using a scale of
1cm – 5cm on both axes, mark x on the horizontal axis and y on the vertical axis.
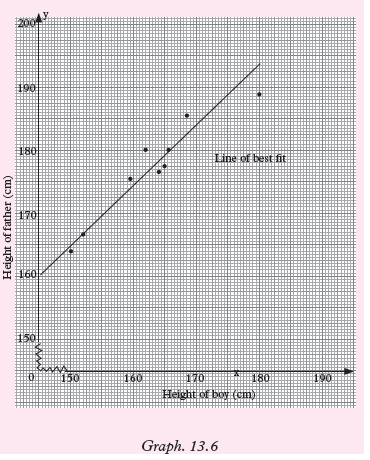
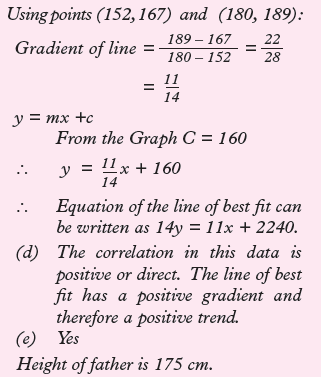 Exercise 13.41. The set of data in Table 13.24 shows number of vehicles and road deaths
in some 10 countries.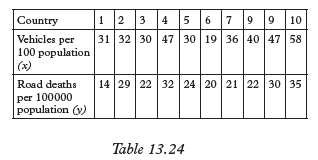 Use table 13.24 to draw a scatter
diagram and use it to determine whether there is a correlation
between x and y. If yes, describe the correlation.2. Data were collected on the mass of a rabbit in kilograms at various ages in
weeks. Table 13.25 Use the data in the table above to:
(a) Draw a scatter diagram for the data(b) Draw a line of best fit(c) Use your graph to predict the mass of the rabbit when it is 8 weeks.(d) How would you describe the correlation in this data?3. From a laboratory research, data were collected on mass of hen and mass of
the heart of hen and recorded table 13.26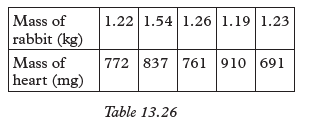 Use the table to:
(a) Construct a scatter diagram for the data.(b) Estimate a line of best fit.(c) Find the equation of the line.(d) How can you use the equation in c to make predictions?(e) Describe the correlation in this data.4. In a junior cross country race the masses (kg) of sample participants
were checked and recorded as they entered the race in Table 13.27. Their
finishing positions in the race were also noted. Use a scatter diagram
to determine whether there was any correlation between the sets of data.
Give reason(s) for your answer.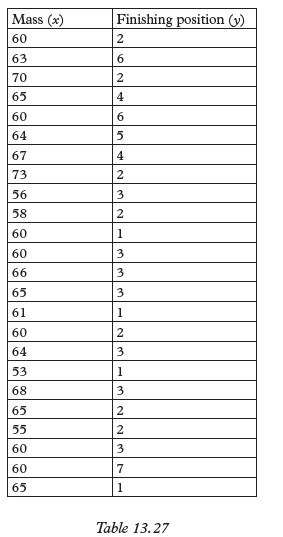 5. A basketball coach recorded the amount of time each player played
and the number of points the player scored. Table 13.28 shows the data.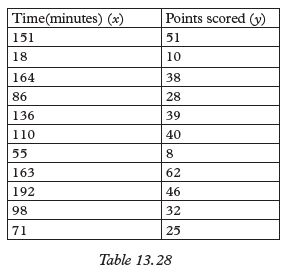 (a) Make a scatter diagram and estimate the line of best fit.(b) Describe the type of correlation if any.(c) Use your graph to estimate how much time a player who scored
67 points played.6. The production manager had 10 newly recruited workers under him.
For one week, he kept a record of the number of times that each employee
needed help with a task, table 13.29.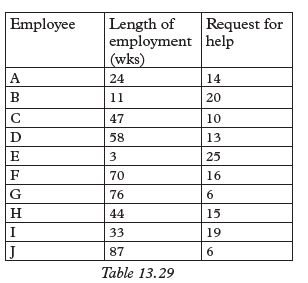 (a) Make a scatter diagram for the data and estimate the line of best fit.(b) What type of correlation is there?(c) What conclusion do you make from your graph? Justify your answer.Unit SummaryThe data in the Table 13.30 belows belong to the same sample.
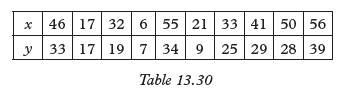 • Such data is called Bivariate data. This data has two variants x and y.
– The data has ten entries– Each entry has two variants x and y
– This data can be presented
graphically using co-ordinates.
(x, y) ie. (46, 33) (17, 17)………… (56, 39)• The graph below represents the given data. Such a graph is called a scatter
diagram. The point do not lie on a line or a curve, hence the name.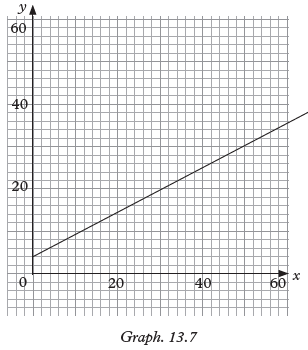 The line drawn through the points is an approximation. It is called the line
of best fit. It shows the general trend of the data or graph.• The equation of such a line can be found and used to analyse data
equation: 20y = 11x + 80.• The line of best fit shows that there is a relationship between the two data sets
though the line is an approximation. If it shows a positive trend i.e. the
line has a positive gradient thus we say the data has a correlation. Since
the line has a positive gradient, the correlation is positive.
If the line had a negative gradient, we would say the correlation is negative.• We can use the graph to estimate missing variants. For example, we
can find:(i) y when x = 29; Ans y = 20(ii) x when y = 3; Ans x = 60(iii) y when x = 44; Ans y = 28Unit 13 Test1. The table below shows the data collected and recorded on ten football
players in a season.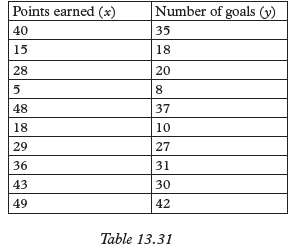 Use the given information to answer the following questions.(a) Make a scatter diagram for the data.(b) Estimate the line of best fit representing the data in (Table 13.31).(c) Use your graph to estimate:(i) The number of points earned by a player who scored 25 goals.(ii) The number of goals scored by a player who earned 45 points.(d) Explain how for any line, you know whether a slope (gradient)
is positive or negative.(e) Find the equation of the line you drew in question (b) above(f) Describe the correlation in the data in this question.(g) What conclusion can you draw from this graph?2. Data below was collected from a certain supermarket in Kigali City.
The price is in Francs:.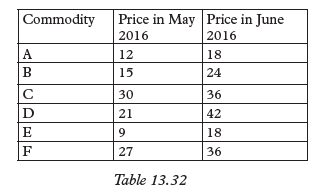 (a) Calculate the average price for all commodities.(i) May 2016(ii)June 2016(b) Plot a scatter diagram for the two prices for all the commodities.(c) Draw the line of best fit for thedata.(d) What conclusion can you draw from the scatter diagram plotted?3. (a) Calculate the x and y from the data given below:
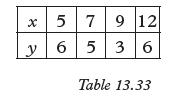 (b) Plot a scatter diagram for the data above.4. The table below shows the number of students (x) and the number of days
 (a) Make a scatter diagram for the data.(b) Explain how any line of best fit can be draw.(c) Describe the correlation of the data.