Unit 9 : Measures of dispersion
9.0 Introductory activity
1. During 6 consecutive days, a fruit-seller has recorded the number offruits sold per type.
a) Which type of fruits had the highest number of fruits sold?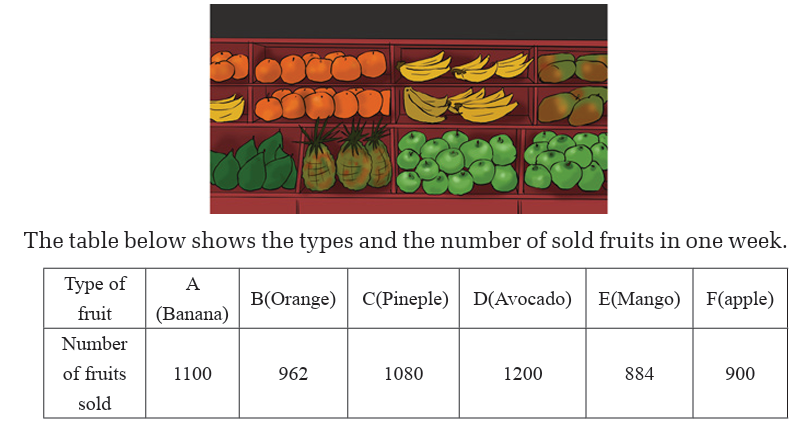
b) Which type of fruits had the least number of fruits sold?
c) What was the total number of fruits sold that week?
d) Find out the average number of fruits sold per day.
2. During the welcome test of Mathematics out of 10 , 10 student-teachers
of year one of Nursing scored the following marks: 3, 5,6,3,8,7,8,4,8 and 6.
a) Determine the mean mark of the class.
b) What is the mark that was obtained by many students?
c) Compare and discuss the difference between the mean mark of the
class and the mark for every student-teacher. What advice could you
give to the Mathematics teacher?
Objectives
After completing this unit, I will be able to:
» Determine the measures of dispersion of a given
statistical series.
» Apply and explain the standard deviation as the
more convenient measure of the variability in the
interpretation of data.
» Express the coefficient of variation as a measure of the
spread of a set of data as a proportion of its mean.
Statistics data show that even though you can observe equal means for
two different series, the spread, or variation from the mean, can be quite
different. If this variation is small, the data are more consistently spread
vis Avis the mean.
For the spread or variability of a data set observed in medicine, three
measures are commonly used: range, variance, and standard deviation.
In the ordinary level we have already defined the range R as the difference
between the largest value and the smallest value.
R = highest value - lowest value.The two last measures are going to be discussed in this unit.
distance each value is from the mean. A variance of zero indicates that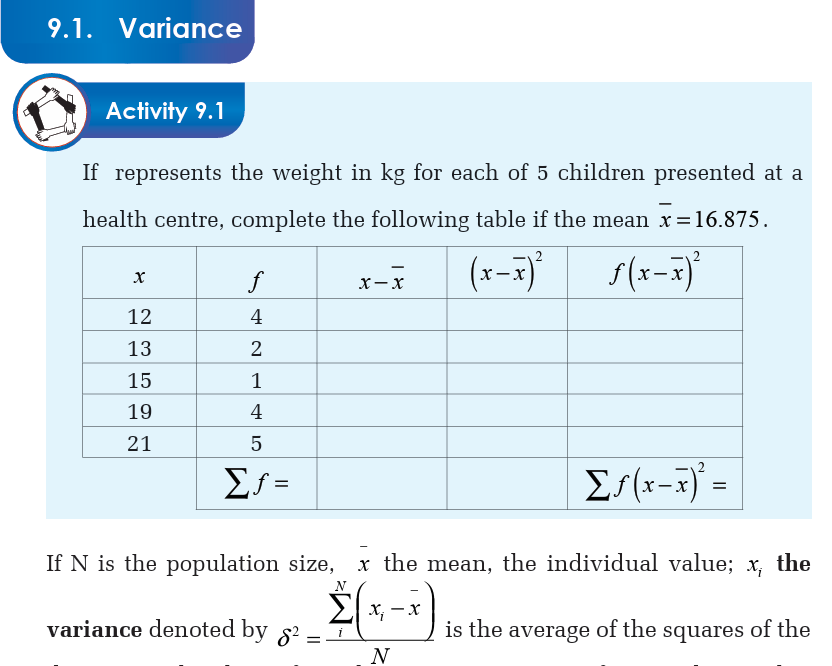
all the values are identical. Variance is always non-negative: a small
variance indicates that the data points tend to be very close to the mean
and hence to each other, while a high variance indicates that the data
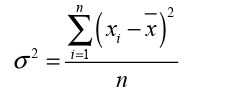
points are very spread out around the mean and from each other.The variance is denoted and defined by:
Sample Variance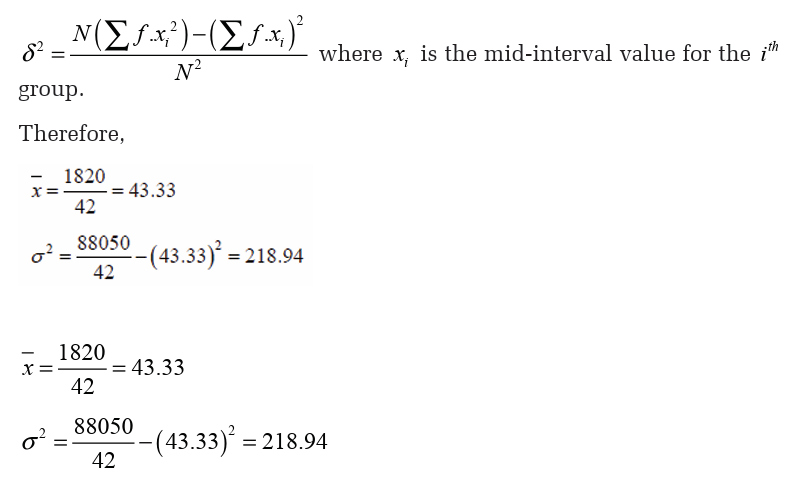
If the data used are a sample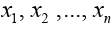 of the population, the sample
variance is defined as: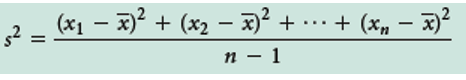
where n is the number of items in the sample and x the sample mean.
If the standard deviation of the set A is less than the standard deviation of
the set B, it indicates that the data of the set A are more clustered around
the mean than those of the set B.
Application Activity 9.1
Find the variance of the following set of data:
1. 1,3,2,1,2,5,4,0,2,6 2. 3,2,1,5,4,6,0,4,7,8
3. 1,5,6,7,6,4,2,6,3 4. 5,4,5,5,4,5,4,4,5,35. 8,7,6,8,6,5,6,4,1
The standard deviation has the same dimension as the data, and hence is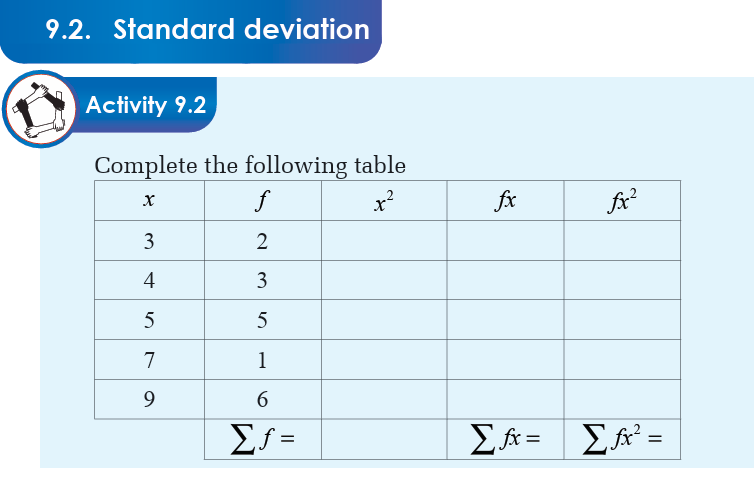
comparable to deviations from the mean. We define the standard deviation
to be the square root of the variance.Thus, the standard deviation is denoted and defined by;
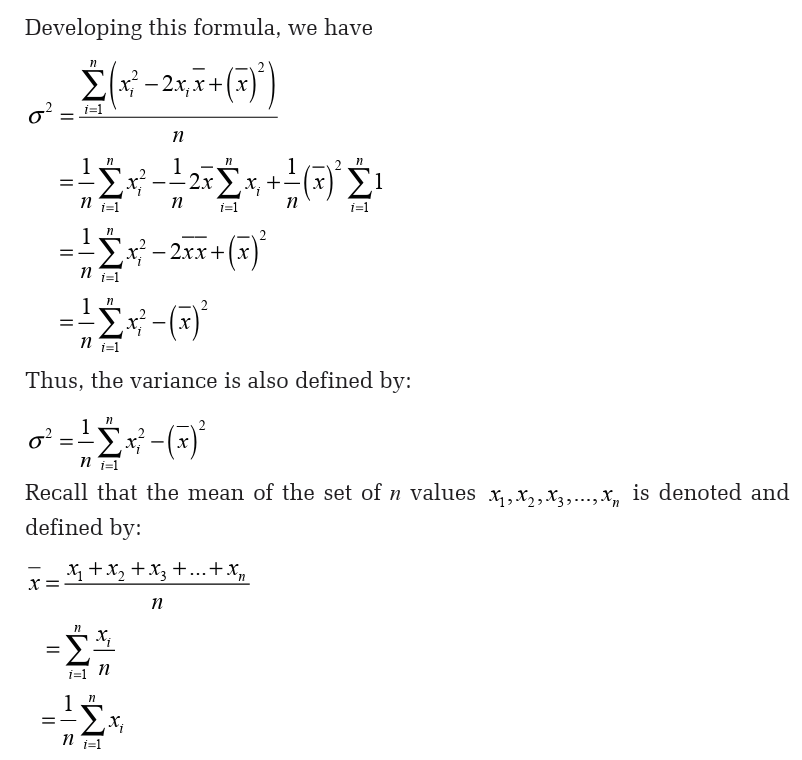
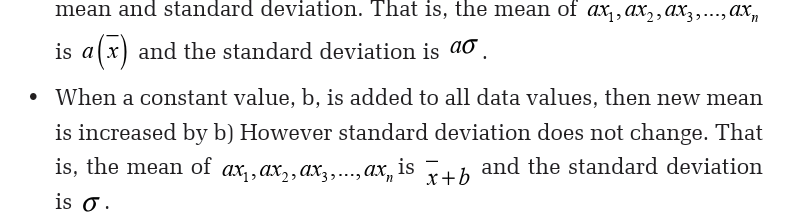
The following results follow directly from the definitions of mean and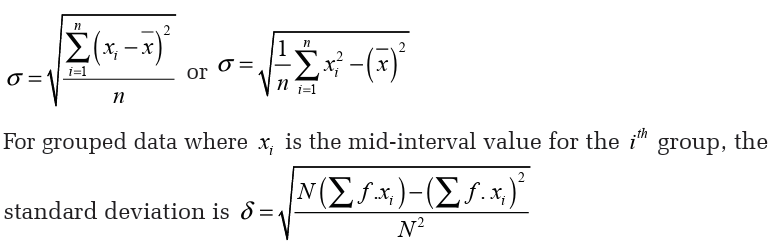
standard deviation:
• When all the data values are multiplied by a constant a, the newmean and new standard deviation are equal to a times the original
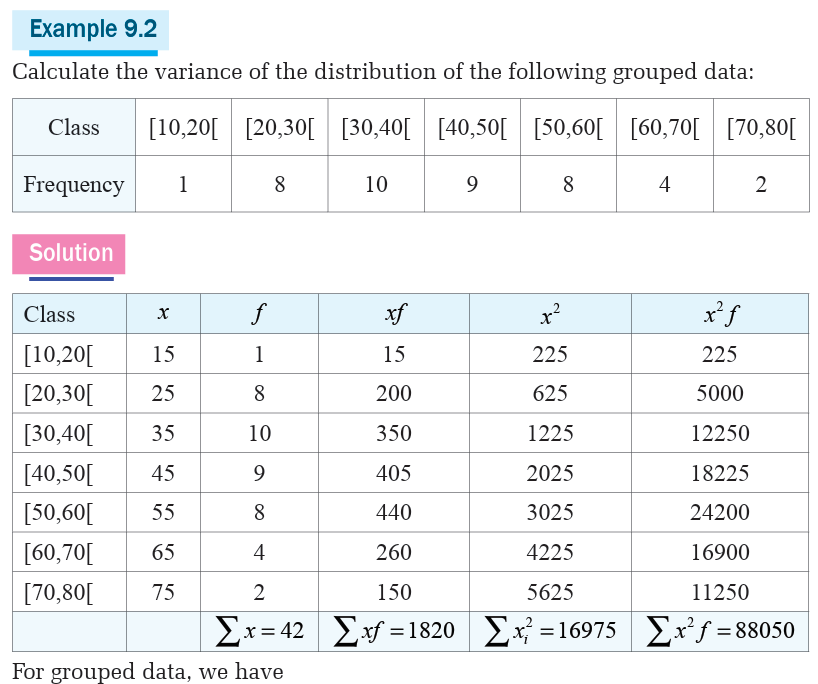
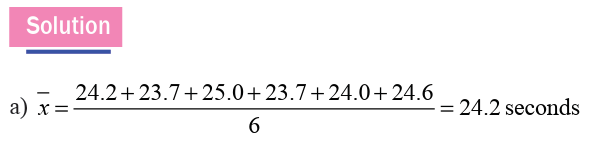
Example 9.3
The six runners in a 200 meter race clocked times (in seconds) of 24.2,
23.7, 25.0, 23.7, 24.0, 24.6
a) Find the mean and standard deviation of these times.
b) These readings were found to be 10% too low due to faultytimekeeping. Write down the new mean and standard deviation.
The method which uses the formula for the standard deviation is not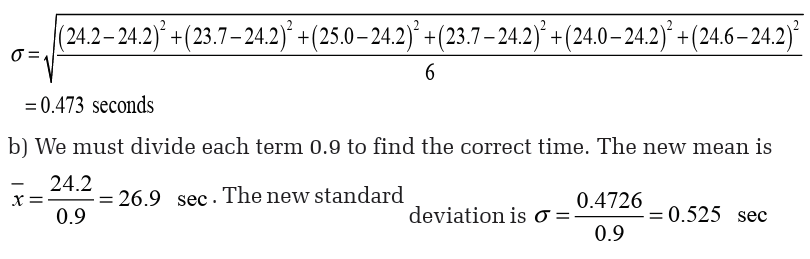
necessarily the most efficient. Consider the following:
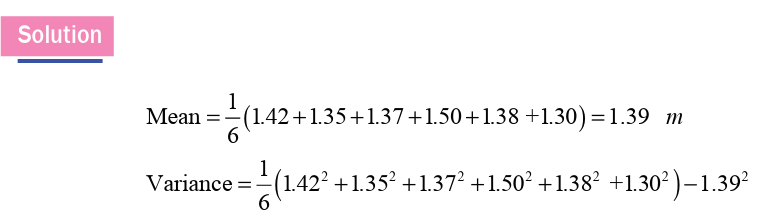
Example 9.4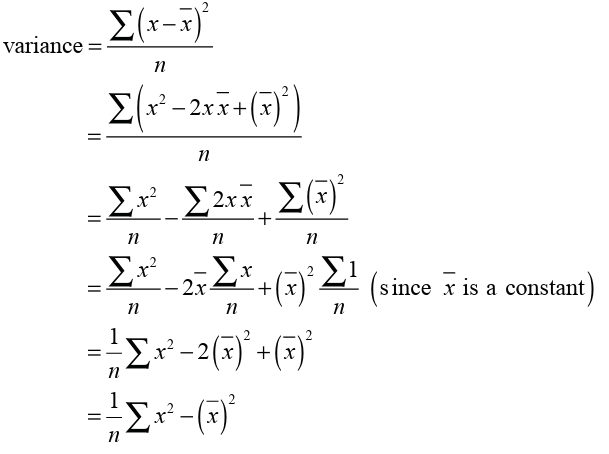
The heights (in meters) of six children are 1.42, 1.35, 1.37, 1.50, 1.38 and1.30. Calculate the mean height and the standard deviation of the heights.
Example 9.5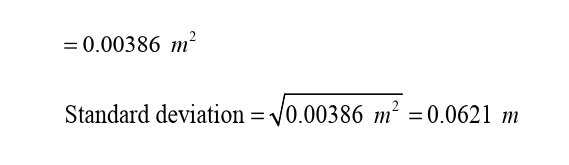
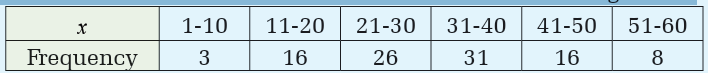
The number of customers served lunch in a restaurant over a period of 60days is as follows:
Find the mean and standard deviation of the number of customers served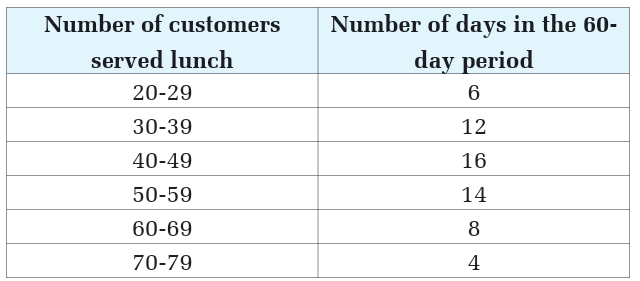
lunch using this grouped data.
Application Activity 9.3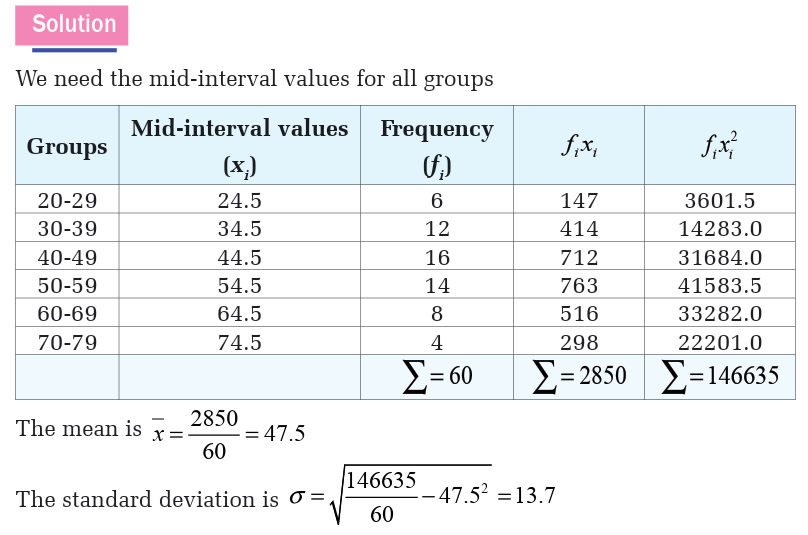
Find the standard deviation of the following set of data
1. 202,205,207,203,205,206,207,209
2. 1009,1011,1008,1007,1012,1010,106
3. 154,158,157,156,155,154,159
4. 7804,7806,7805,7807,78085. 56,54,55,59,58,57,55
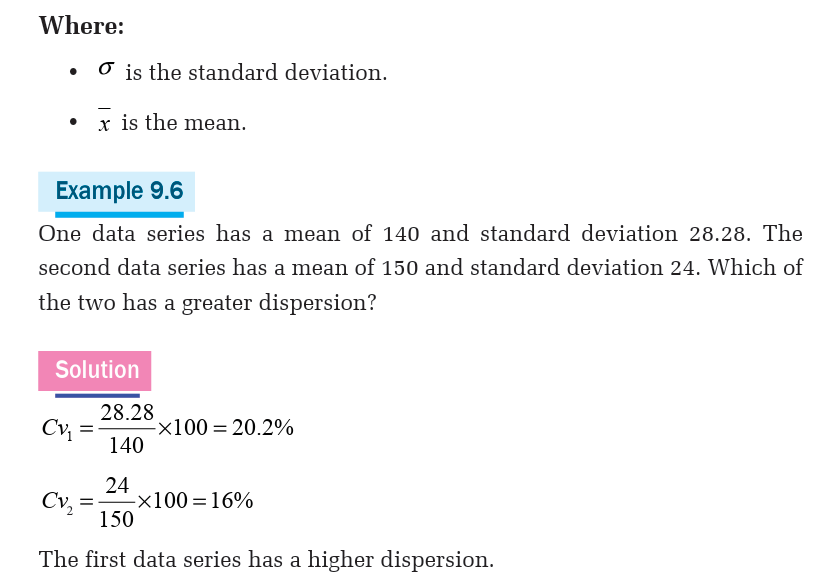
The coefficient of variation measures variability in relation to the mean (or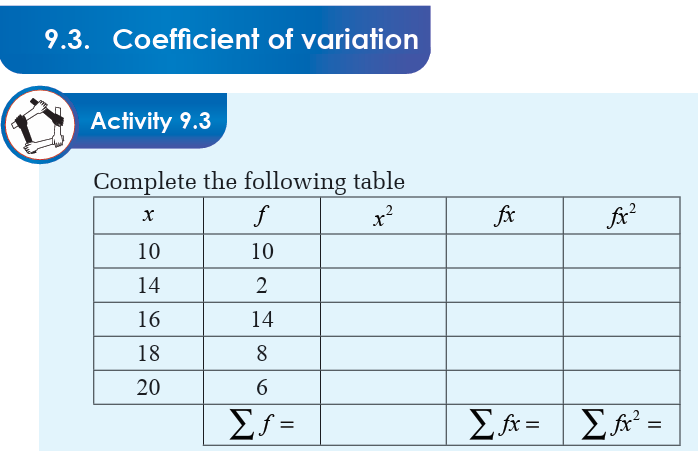
average) and is used to compare the relative dispersion in one type of data
with the relative dispersion in another type of data. It allows us to compare
the dispersions of two different distributions if their means are positive.
The greater dispersion corresponds to the value of the coefficient of greater
variation.
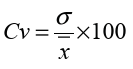
The coefficient of variation is a calculation built on other calculations: thestandard deviation and the mean as follows:
9.4. Applications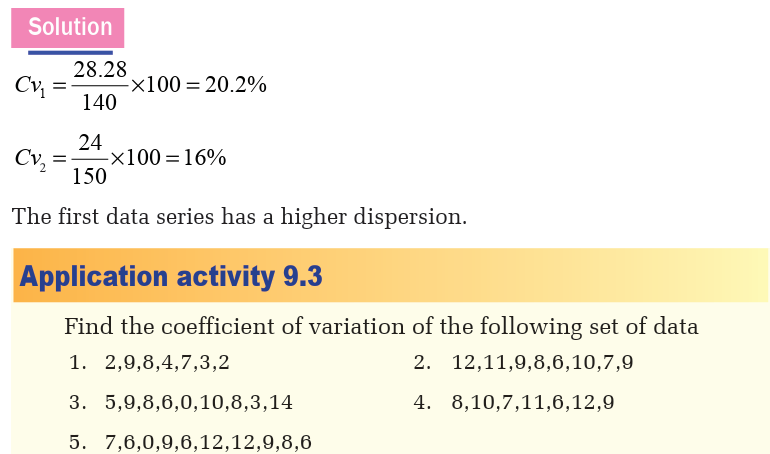
A large standard deviation indicates that the data points can spread far
from the mean and a small standard deviation indicates that they are
clustered closely around the mean.
Standard deviation is often used to compare real-world data against amodel to test the model.
Example 9.7
In industrial applications, the weight of products coming off a production
line may need to legally be some value. By weighing some fraction of the
products an average weight can be found, which will always be slightly
different from the long term average. By using standard deviations, a
minimum and maximum value can be calculated that the averaged weight
will be within some very high percentage of the time (99.9% or more).
If it falls outside the range then the production process may need to becorrected.
Example 9.8
Consider the average daily maximum temperatures for two cities, one
inland and one on the coast. It is helpful to understand that the range of
daily maximum temperatures for cities near the coast is smaller than for
cities inland. Thus, while these two cities may each have the same average
maximum temperature, the standard deviation of the daily maximum
temperature for the coastal city will be less than that of the inland city as
on any particular day, the actual maximum temperature is more likely to
be farther from the average maximum temperature for the inland city than
for the coastal one.
In finance, standard deviation is often used as a measure of the risk
associated with price-fluctuations of a given asset (stocks, bonds, property,
etc.), or the risk of a portfolio of assets, Standard deviation provides aquantified estimate of the uncertainty of future returns.
Unit summary
1. Variance measures how far a set of numbers is spread out. The varianceis denoted and defined by
2. The standard deviation has the same dimension as the data, and hence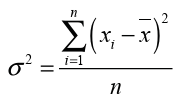
is comparable to deviations from the mean. We define the standard
deviation to be the square root of the variance. Thus, the standarddeviation is denoted and defined by
3. The coefficient of variation measures variability in relation to the mean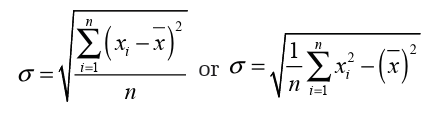
(or average) and is used to compare the relative dispersion in one type of
data with the relative dispersion in another type of data. The coefficientof variation is
4. Application
A large standard deviation indicates that the data points can spread far
from the mean and a small standard deviation indicates that they are
clustered closely around the mean. Standard deviation is often used to
compare real-world data against a model to test the model. Standard
deviation is often used as a measure of the risk associated with price
fluctuations of a given asset (stocks, bonds, property, etc.), or the risk of
a portfolio of assets. Standard deviation provides a quantified estimateof the uncertainty of future returns.
End Unit Assesment
1. The mean of 200 items was 50. Later on it was discovered that two
items were misread as 92 and 8 instead of 192 and 88. Find the
correct mean.2. Calculate the mean and standard deviation of the following series:
3. Find the mean of:
a) 6, 10, 4, 13, 11, 9, 1, 6, 12 b) 193, 195, 202, 190, 189, 195
4. Find the mean and standard deviation of 25.2, 22.8, 22.1, 25.3, 24.6,25.0, 24.3 and 22.7.