General
- Geograpy SSE Y2 SB File Uploaded 2/11/21, 16:08
- Geograpy SSE Y2 TG File Uploaded 2/11/21, 16:07
UNIT 3:MAP WORK INTERPRETATION
Key unit competence : The student-teacher should be able to explain
the relationship between the physical and humanactivities on maps.
Introductory activity
A map is a representation of all or part of existing things on the earth surface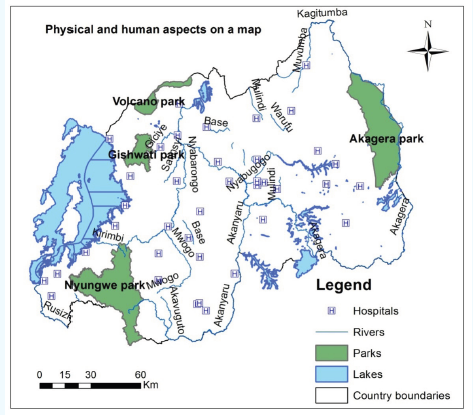
on a flat surface. A photograph is a picture of an object or environment taken
by a camera at a particular time in a given place. Maps and photographs
represent both physical and human features. The aspects represented on map/
photographs are shown using several types of signs and symbols. This helps
map /photograph users to extract the needed information from a given map /photograph.
Referring to the map above and the definition above;
a) Identify the main physical features represented on the map.
b) Identify the human features represented on the map.
c) Use the following map to represent approximately the same features asthose represented on the map above.
d) Take a photograph of the environment around your school and then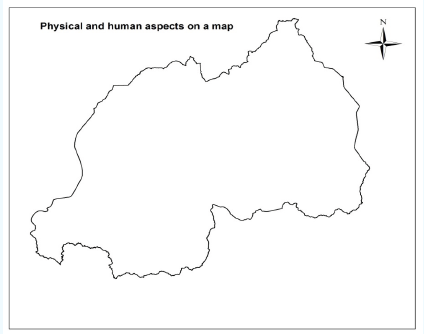
identify all physical and human aspects taken on that photograph.
3.1. Interpretation of physical aspects from maps/photographs
Activity 3.1
Make a research on:
a) The major physical aspects which may be represented on a map/
photograph.
b) The signs and symbols which may be used to represent physical
features on a map/photograph.
Physical features are also called natural features. They include the following:
• Relief which comprises rocks, slopes, soils, valleys, plains, plateau,
hills, and mountains.
• Drainage features like rivers, dams, lakes, seas and oceans.
• Vegetation cover like forests made of several types of trees, crops and
ground vegetation, wetland vegetation.
• Climate which is defined through various parameters like rainfall,
temperatures, relative humidity, cloud cover, wind speed and direction,
atmospheric pressure, sun shine.
3.1.1. Interpretation of geological features
The main geological features commonly represented on a map/photography
include rocks, cliffs and boulders.
── A rock is a solid matter which is found on the surface or in the interior
of the earth.
── A cliff is a vertical or nearly vertical rock face in mountainous and
hilly areas. Cliffs are found along the shores of lakes and seas. Cliffs
and rocks are shown on topographical maps using contours that are
close to each other. Boulders are large pieces of rocks that resisted
weathering.
── A crater is a bowl-shaped depression, or hollowed-out area, produced
by the impact of a meteorite, volcanic activity, or an explosion.
── A quarry is a place from which stones, rocks, construction aggregate,
riprap, sand, gravel, or slate are excavated from the ground. A quarryappears like a place where open cast mining is practiced.
3.1.2. Interpretation of slopes from a map/photograph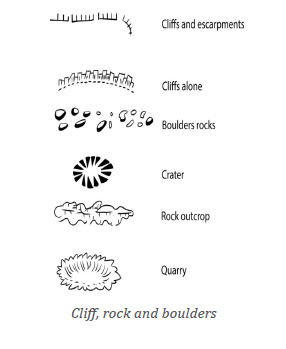
The slopes are classified according to their inclination, constancy or shape. The
slopes are represented on the map by help of contours. Contours are lines on
a map linking places of the same height above the sea level. They are drawn at
fixed intervals, known as vertical interval or VI.
Contours are labeled from the lowest to the highest. Where they are too close
to each other, the relief is steep. Where they are far apart, the land may be a
plain or a plateau. The main types of slopes are: gentle, steep, regular, irregular,
convex and concave slopes.
• Gentle slopes: Spaced contours are used to indicate gentle slopes. In
that case the land may be a plain or plateau which is a flat elevated
landform that rises sharply above the surrounding area.
• Steep slopes: Very close contours are used for steep slopes. The closer
the contours, the steeper the slope. In that case the landform may bea mountain.
• Regular slopes: Regular slopes are also called constant or even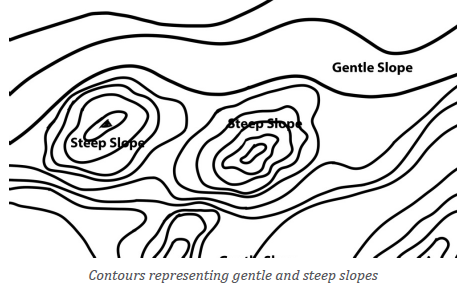
slopes. The contours have constant spaces. The slopes can be either
gentle or steep slopes.
• Irregular slopes: These are uneven or inconstant slopes. They are
represented by unequally spaced contours. They can be either gentle
or steep slopes. These slopes are found mostly in rugged, mountainousor hilly areas.
• Convex slopes: Convex slopes are gentle at the top and steep at the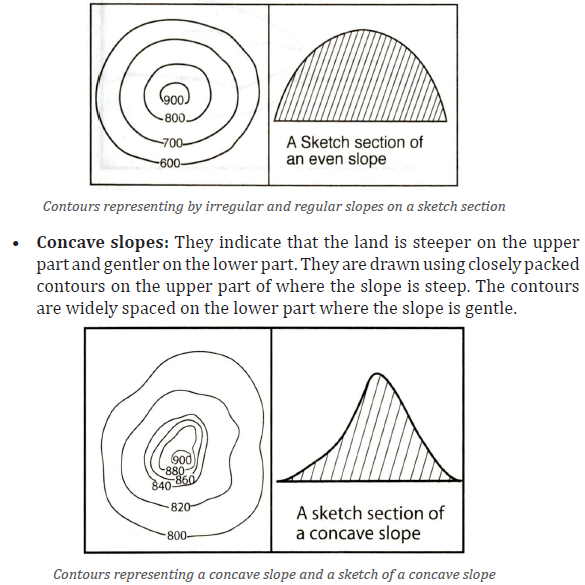
bottom of the hill or mountain. The contours are closely spaced at the
bottom section (steep slopes) and widely spaced at the top section(gentle slopes).
3.1.3. Interpretation of drainage and landforms from a map/photograph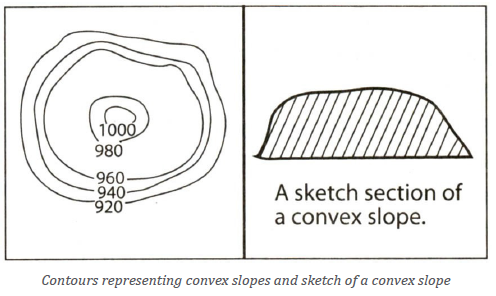
i. Interpretation of drainage features from a map/photograph
The lake, sea and ocean occupy a very large area. They are seen in blue color on
a color photograph and in dark color on black and white photograph. However
other conventional symbols may be applied on a map to represent a lake, seaand ocean; the most important thing is to put in legend/key the used symbols.
The rivers originate from mountains or hills and flows on steep slope to end in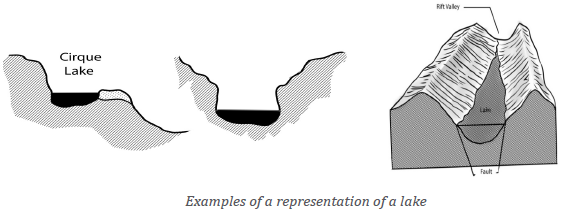
the depression that are usually found in valleys or low-lying areas. The streams
and rivers are seen on a coloured photograph/map as blue lines and they have
different patterns or arrangements which can be detected easily on a map orphotograph.
ii. Interpretation of landforms: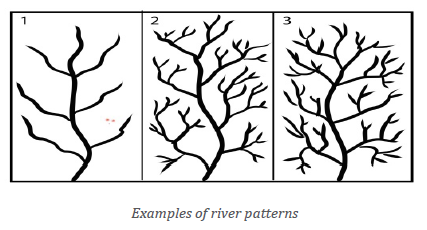
1. Valley: A valley is an elongated depression sloping towards a drainage
basin like a sea, lake or swamp and which may contain water or not.
The valley is normally represented on a topographic map by using thecontours having “V shape”.
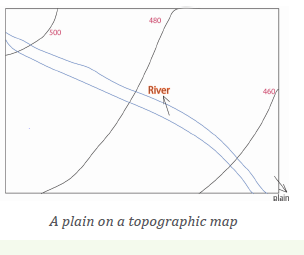
2. Plain: Most of the plains are in low-lying areas but some of them may be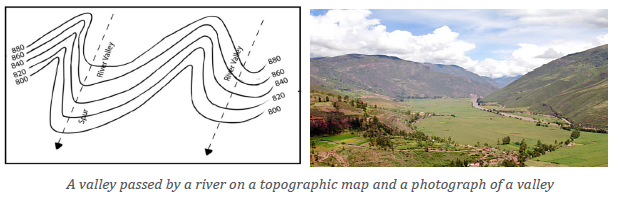
raised but the slopes remain gentle. On the topographical maps, a plain
is represented by widely spaced contours. The river passing in plainareas may also be shown on the map.
3. Plateau: A plateau is an extended landform which is bordered by steep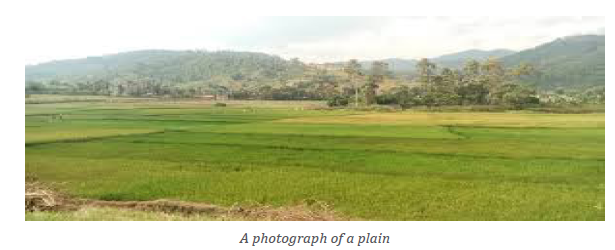
slopes. On the map, a plateau is shown as a wide area surrounded by oneor two contours having the same height on both sides.
4. Mountain: A mountain is an extended landform with steep slopes. On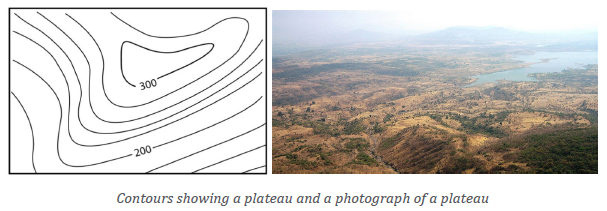
the map, a mountain is shown as a wide area with very close contours
surrounded by one or two wider contours showing the depression areassurrounding the mountain.
3.1.4. Interpretation of soils on the map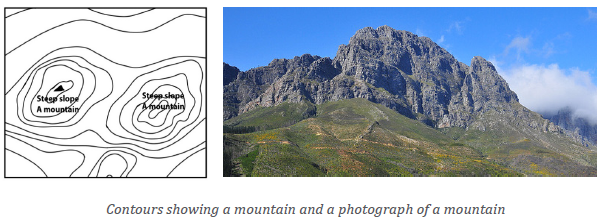
Assorted colors or symbols are used to show several types of soils on a
topographic map. Tiny brown dots called stipples are used to represent a
surface covered by sand or mud. The types of soil can be also shown by help of
dots having varied sizes according to the texture of the soil. The types of soils
can be differentiated on a photograph based on their texture (sizes) and color.Surfaces covered by lava flows are shown by symbols that look like inverted V’S.
Application Activity 3.1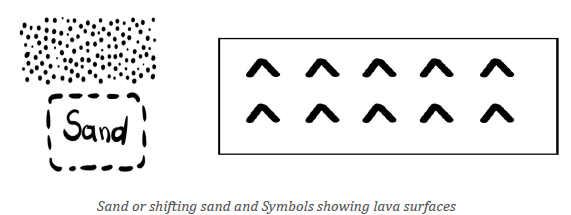
a) Identify the physical features in area where you live and describe
how they are represented on a topographic map.
b) Draw a sketch of your home area, on it, name and mark the physical
features identified in (a) above.
c) Suggest ways through which the above features can be protectedand conserved.
3.2. Interpretation of human aspects on maps
Activity 3.2
Make a research on:
a) The major human aspects which may be represented on a map/photograph.
b) The signs and symbols which may be used to represent human
features on a map/photograph
Human aspects on a map reflect human activities of a given area represented on
a map. These include agricultural development, mining, industry, settlement,
etc.
3.2.1. Agricultural activities
Crop plantations are drawn on a topographical map by using light-green
shading. A letter may be used over the shade to indicate the name of the cropgrowing in each area. For example, C for coffee, T for tea.
Several types of crops may be taken on a photograph and be identified based on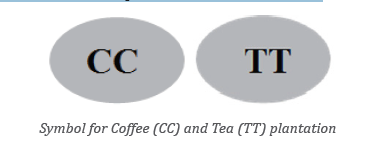
their shapes, sizes and colors.
3.2.2. Mining and quarrying activities from a map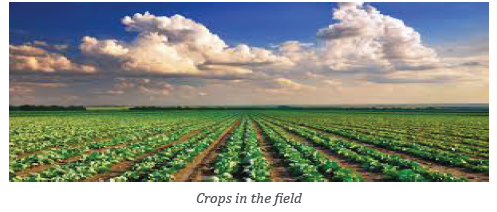
Mining refers to all the processes by which minerals are obtained from the
earth’s crust. Minerals may be in gaseous, liquid or solid form. Quarrying is the
digging of stones, sand or soil from the ground. Mining and quarrying activities
on a map are shown by symbols as represented on the figure below. The mining
activities may be taken on a photograph and different types of minerals/quarries may be differentiated based on their colors.
3.2.3. Industrial areas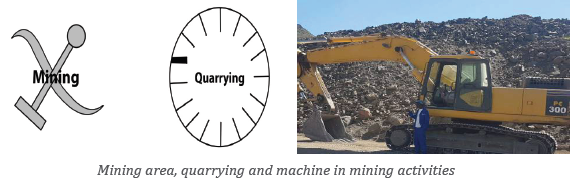
An industrial area is a geographically localized set of specific industries. Suchareas are subject to important production, marketing and other interrelationships.
3.2.4. Settlements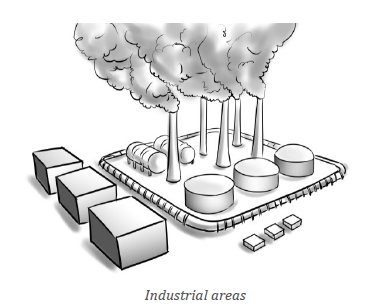
Settlement refers to a place where people live. It also means the process
of settling in such a place. Settlement on the map can be shown by dots or
rectangles which may be black or grey in colour. Dots indicate rural semipermanent
settlements while rectangles show permanent buildings like those
built of stone or bricks, with iron or tile roofing.
The dots or rectangles are spaced in relation to the concentration of settlement.
Nucleated settlements are represented by the dots and rectangles close to one
another while they are much spaced for scattered settlement.
The settlement is also represented according to its shape, for example ring or
linear. The shapes of settlement may be influenced by communication networks
like roads, railways, landforms like valley, plain, plateau, mountain amongothers.
Application Activity 3.2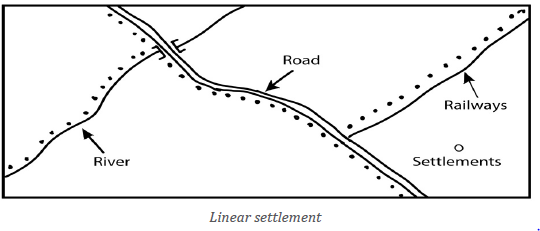
1. Use a photograph/map to identify and describe mining/quarrying areas.
2. Visit the nearest mining/quarrying areas and represent them onsketch map using appropriate signs and symbols.
3.3. Relationship between physical and human aspects on
maps/photographs
Learning activity 3.3
The following map represents both physical and human aspects which areinterrelated.
In reference to the map above from Kigali Suburbs and the knowledge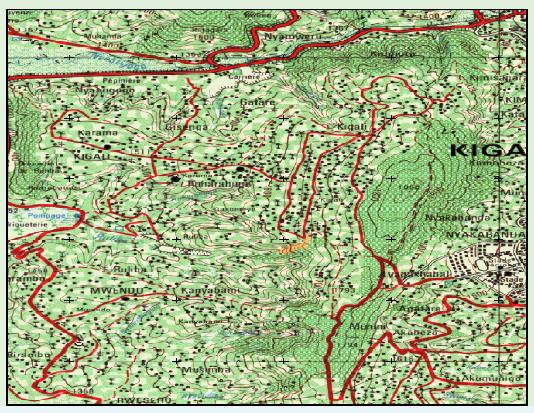
acquired from the influence of relief on the human activities; answer the
following questions:
a) Identify the existing relationships between main physical and
human features represented on the map.
b) Discuss the existing relationships between main physical and human
features available in the environment around your school and your village.
Physical aspect of an area plays a key role in the activities people do. It also has
an influence on the number of people who settle in an area. For instance, the
relief affects human activities in the following ways:
── Mountainous places are less populated because of steep slopes being
unfavorable for settlement and for mechanized agriculture. Such
landscape makes the establishment of social facilities (hospitals,
schools, shopping centers) in such places to be difficult.
── Places that are poorly drained like swamps and marshes are also
not suitable for settlement because they do not favour activities like
agriculture, transport etc. that most people rely on for survival.
── Some plains and plateaus have good soils. These allow growing of
crops and keeping of livestock. It is also possible to use machines
in farming. Therefore, more food is produced, and more people live
there.
── The depressions or valleys areas are also suitable for agriculture since
they contain fertility brought by depositions from the surrounding
high altitude areas.
── Fishing is developed in areas that have seas, oceans and lakes.
3.3.1. Drainage patterns
A drainage pattern is a network formed by rivers and their tributaries on the
landscape. The development of the drainage patterns is influenced by the
gradient of the slope, nature of the bedrock in terms of hardness, structure of
the basement rock. The drainage pattern can also result from human activities
which may change the original patterns.
The some examples of drainage patterns which can be seen on a topographic
map/photograph are as follows:
─ Trellised drainage pattern: Such patterns are developed in simple
folds characterized by parallel anticlinal ridges alternated by parallelsynclinal valleys.
─ Dendritic drainage pattern: The dendritic pattern is associated
with the areas of similar lithology, horizontal or very gently dipping
strata, and rolling extensive topographic surface having extremelylow reliefs.
3.3.2. Settlement patterns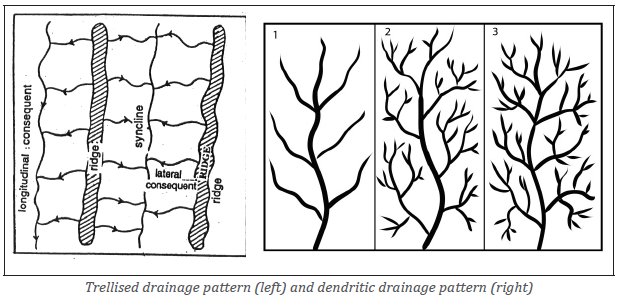
Settlement refers to a place where people live. It also means the process of
settling in such a place. The settlement patterns of a given area are influenced
by both physical and human factors like topography, road network, community
services, cultural and economic factors, etc. This results into several types of
settlement patterns as follows:
• Nucleated settlement: This refers to the grouping of many houses
around a center called nucleus; often around a central feature like
a church or a pub. Houses are built close to each other. This type of
settlement is mainly influenced by cultural and social factors. Forexample, the houses in “imidugudu” settlements may have such pattern.
• Linear settlement: This is where houses are well planned. They are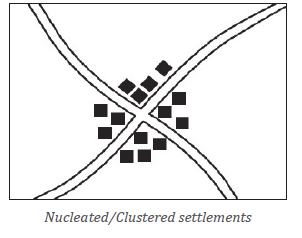
built along the road, railway and river or along the coast.
Linear settlement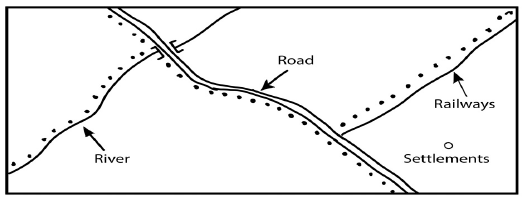
• Sparse or scattered or dispersed settlements: The settlement
associated with houses which spread out over a wide area (houses are
built far from each other). They are often the homes of farmers and canbe found in rural and mountainous areas.
Scattered settlements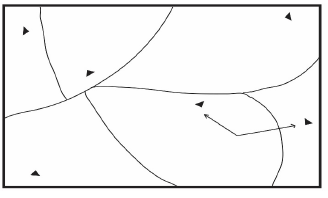
• Isolated settlement: This is where a few people live away from other
people. These people could be hunters in a forest.
• Ring settlement: In this type of settlement, houses make a circle.There is an open ground at the center.
• Planned settlement: This type of settlement is well organized and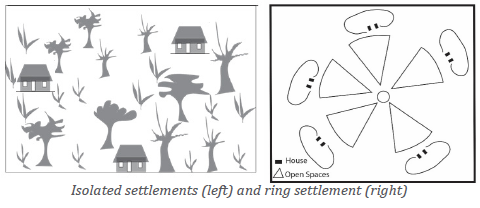
planned in specific ways as directed for instance by the government.
3.3.3. Vegetation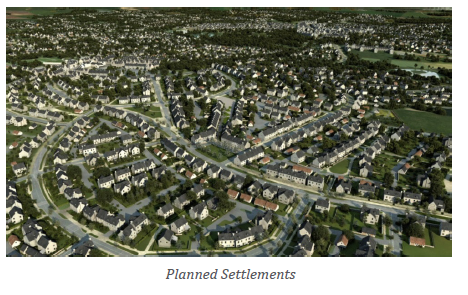
Human activities are related to vegetation. The distribution of vegetation on a
photograph/map in each area is linked with human activities taking place in that
part/dwelling. Below are some of the examples that show the interrelationship
between man and vegetation:
• In areas with dense forests: The main activities are timber harvesting.The timber is used to make furniture and paper.
• In savannah grasslands: The main activities are livestock keeping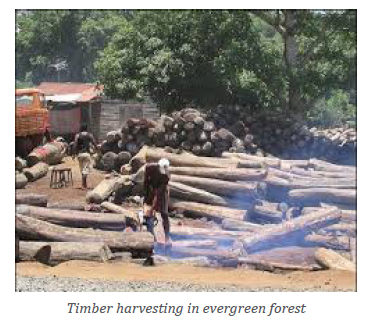
and agriculture. This is because in these areas soils are fertile.
• Desert vegetation: Agriculture is only possible in oases. Very few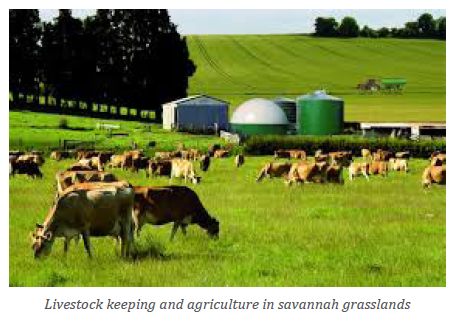
animals can survive in the dry areas like the camels, goats and sheepand reared under nomadic pastoralism.
• In tundra and taiga forests: The low rainfall and temperature affect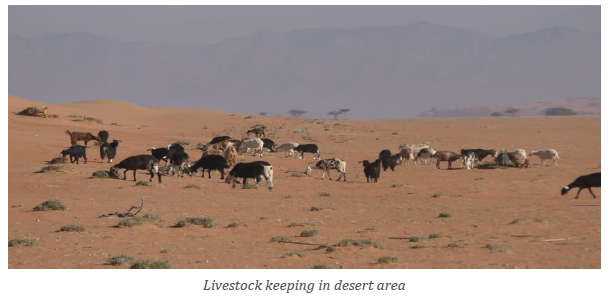
human activities. Only hunting, fishing and mining are the mainactivities done in these regions.
3.3.4. Communication networks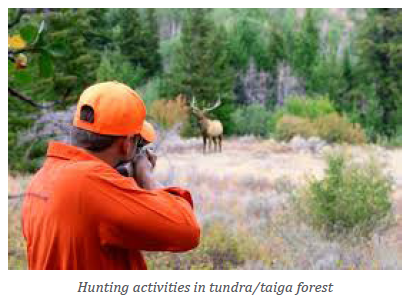
Communication networks facilitate the movement of people and commodities
from one place to another over a given distance. Communication networks may
also refer to the physical facilities which help the transmission of information
in the form of news and messages. The communication networks represented
on map/photograph are most of time influenced by both physical and human
factors. Some of them are discussed below:
• Relief: Steep slopes make the construction of roads and railway lines
expensive. On the other hand, valleys have swamps; they contain water
logged soils that are too soft to allow the movement of heavy objectslike trailers, lorries and trains.
• Climate: Too much rainfall results into floods and landslides and these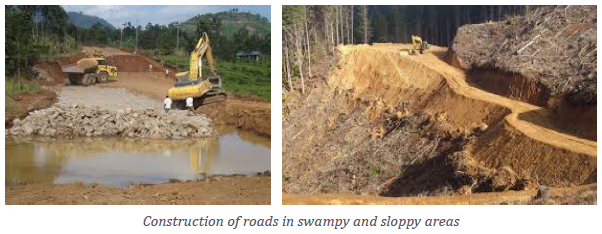
disturb land transport. On the other hand, accumulation of fog andclouds reduce visibility hence affecting air transport.
• Vegetation: Thick vegetation cover makes construction of road and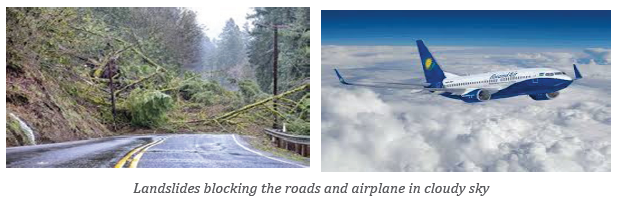
rail networks difficult because it requires uprooting big trunks of
trees. Areas with thick vegetation are invested with wild animals thatpose danger to the people.
• Drainage: Navigable rivers, lakes, seas and oceans provide natural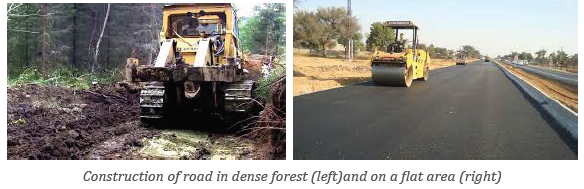
route-ways used for transportation.
• Topography: Mask towers for communication are usually placed on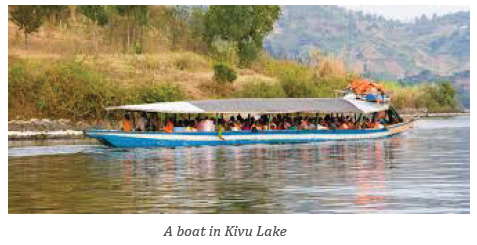
the top of mountain
• Economic activities: The economic activities (mining, agriculture,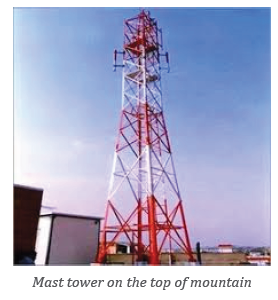
industries, etc) taking place in given areas influence the construct ofcommunication networks.
Application Activity 3.3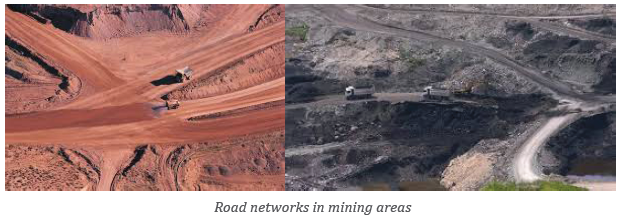
1. Identify several types of communication networks on any map/
photograph.
2. Explain how the identified communication networks are related to
physical and human features.
3. Move around your village and identify the existing communication
networks and explain their relationships with physical and humanfeatures.
Skills lab
Map interpretation is an important skill needed in different areas of life like
military, land mapping, tourism etc. Use the knowledge you have acquired in
this unit to draw a sketch map of your school, calculate its area and presentyour findings to the class.
End unit Assessment
1. “As it is difficult and costly to reach all parts of the world; the
photographs and maps help people most especially geographers to
explore different physical and human features of the earth.”a) Identify physical features on topographic map of Rwanda.2. Show different signs and symbols to be used in representing
b) Identify the human features on thematic maps of Rwanda.
physical and human features on maps/photography.
3. Examine the relationships existing between settlement patterns
and physical features in your district and present them on a sketch
map using signs and symbols.
4. Take photographs from different places in Rwanda, and prepare
a sketch map of captured physical and human features by usingconventional signs and symbols.