Topic outline
General
- Geograpy SSE Y2 SB File Uploaded 2/11/21, 16:08
- Geograpy SSE Y2 TG File Uploaded 2/11/21, 16:07
UNIT 1:STATISTICAL GRAPHS AND DIAGRAMS
Key unit competence: The student-teacher should be able to interpret
the statistical data, construct statistical graphsand diagrams.
Introductory activity
Read the extract below and use it to answer the questions that follow:
Rwanda exported over Rwf 250b Agricultural products in 2017. The National
Agriculture Exports Development Board (NAEB) says that the country’s
agricultural exports generated revenues amounting to Rwf 304.6 million from
January to September 2017 compared to 232.65 million earned in the same
period in 2016. In the first quarter of 2017/18, agricultural exports generated
Rwf 116 million against Rwf 82,809,581 in first quarter 2016/17. Agricultural
crops locally produced and exported like coffee, tea, and pyrethrum generated
frw 108 million from January to September of 2017, compared to 89 million
in the same period in 2016. The volume of exported vegetables was frw 18.98
million kilograms from January to September 2017, compared to over 15.61
million kilograms in the same period of 2016, meaning that the quantity of
exports increased by only 21.56%. The value of exported vegetables was frw
8 billion from January to September 2017, against frw4.2 billion in the same
period of 2016, implying an increase of 98.65 percent, and a rise in price per
unit of the vegetables.
Answer the following questions:
1) Name the data which are represented in the passage
2) Using the past studies in both ordinary level, senior four and personal
research,
i) Identify other methods to represent the data displayed in the passage.
ii) Discuss the importance of the geographical data identified in (i) above
and make a class presentation, if possible using ICT tools, or flip charts
or any other resource available.
iii) Comment on the Rwanda’s exports between January 2017 to Oct 2017and account for the variations in the trend of exports.
1.1. Introduction to the statistics in Geography
Activity 1.1
Read the story below and use it to answer the questions that follow:
Micomyiza Jeanne and Habinshuti Gilbert made their field study on ‘The
effects of human activities on the physical environment in Rulindo village.
They used various methods of data collection. Jeanne was interested in
writing down every observed aspect in a descriptive manner while Gilbert
filled his note book with tables and charts that he would interpret after
the field trip. Some other students who had also attended the field work,
used various methods of noting down data, such as line graphs, bar graphs
with description foot notes. They could look at the graphs and drawn
charts and easily understand the content contained therein. The collected
numerical data revealed that 12 farmers were using poor methods of
farming, 20 farmers had applied agro-forestry and tree planting, 2
farmers were engaged in charcoal burning, 7 people had large herds of
cattle whose impact on the environment was so evident. All data collected
were presented and recorded on a chart.
a) Explain why most of students were interested in using statistical
way of data recording.
b) Does the passage above represent statistics? Explain your answer.
c) Using the example of Habinshuti, examine the importance of statistical
graphs and diagrams in Geography.
1.1.1. Definition of statistical geography
Statistical geography is defined as the study and practice of collecting, analyzing
and presenting data that has a geographic dimension. The statistics in geography
is about social, economic, climatic, spatial or demographic characteristics. Data
used in statistical analyses comes from various variables such as, population
housing censuses, surveys, and administrative records.
In a broader sense, the term statistics refers to the science of collecting,
analyzing, interpreting and presenting various data. It is a science of how data
are collected, analyzed and interpreted.
Someone who collects, classifies, analyses, presents and interprets statisticaldata is called statistician.
1.1.2. Importance of statistical graphs and diagrams in geography
Statistical graphs and diagrams play a key role in geography for the following
reasons:
1) Statistical graphs and diagrams help students to process and summarize
huge data with accuracy.
2) The geographers can identify and interpret the relationship existing
between various variables (e.g. the relationship between the increase of
prices for commodities and increase in cost of fuel).
3) They clearly predict the trend and variations among others of production, trade.
4) Statistical diagrams and graphs enable make easy the presentation and
interpretation of geographical data.
5) Statistical graphs and diagrams provide a good and attractive visual
representation.
6) Statistical diagrams and graphs facilitate easier memory of the reader orstudents/geographers than data presented in a descriptive manner.
Application Activity 1.1
Using firsthand experiences and skills acquired in statistics explain how
statistics is important in your daily life and show how it would help tounderstand geography.
1.2. Line and curve graphs
Line graph and curve graph are types of charts which display information as a
series of data points called ‘markers’ connected by straight line segments.
The types of line and curve graphs the most used in statistical geography
described in this section include:
i) Simple line and curve graph
ii) Group or comparative line graph
iii) Compound line graphsiv) Divergence graphs
1.2.1. Simple line and curve graphs
Activity 1.2.1Land use in country X from 2015 to 2017
Using the knowledge and skills acquired from Mathematics and the data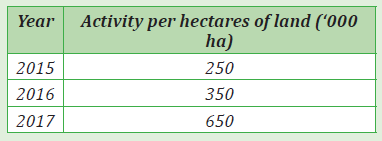
provided in the table above, answer the following questions:
a) Draw a simple line graph to represent the above information.
b) Use the same data indicated in the table above, to construct a simple
curve graph.
c) Using both the data and the graphs drawn, comment on the trend of
land use in country X from 2015 to 2017.
d) Discuss the advantages and disadvantages of simple line graph.
i. Simple line graph
A simple line graph is one which shows points plotted connected by a series of
short straight lines. This distinguishes it from the simple curve graph in which
points plotted are joined by a single smooth line.
Construction of a simple line graph
The following are steps to be followed while constructing a simple line graph
and curve graph.
1. The independent variables are indicated on horizontal axis.
(Independent variables are items that are not affected by the changes
in other values)
2. The dependent variables are represented on the vertical axis.
(Dependent variables are items that are reliant on the independent
variables. That is to say; are measurable responses from the reaction
caused by a change in the independent variables).
3. The vertical axis should start from zero. While the top part be slightly
greater than the maximum value to be indicated or recorded on it.
4. The length of the horizontal line is determined by the number of the
independent values in relation to the scale.
5. Draw two vertical lines on both sides and exact numbers of values of
constant relationship be recorded on the two axes. However, this is not a
must be done condition.
6. When plotting points in correspondence to both independent variables
and dependent variables, it is appropriate to put the dot in the middle of
the two vertical lines.
7. Join the points with smooth curve using free hand.
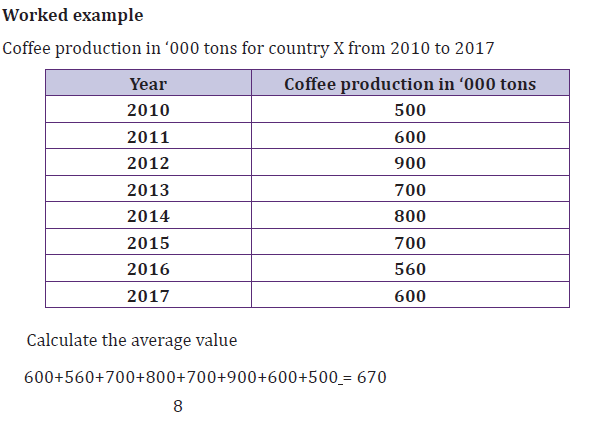
Worked example:
The following table presents mean temperature values recorded at weather
stationTemperature recorded at weather station B
Simple line graph of monthly mean temperature recorded at weather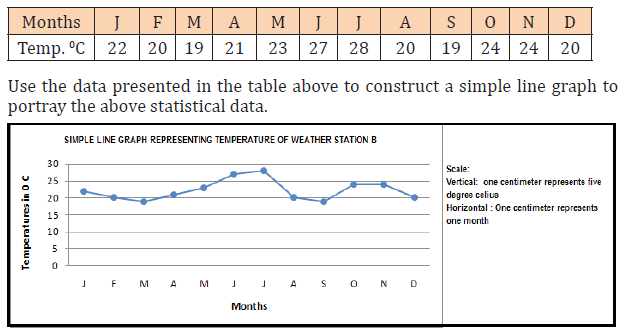
station B
When making a simple line graph, the following must be considered:
─ Choose a suitable scale to be used on vertical as well as horizontal
axes.
─ Write the scale as statement in the upper right corner of the graph.
─ Write suitable title in capital letters, balancing it above the graph as
appropriate.─ Do not attach the line to the vertical axes of the graph
ii. Simple curve line graph
The procedures for drawing a curve graph is similar to that of drawing a line
graph except that while in constructing curve graphs the dots are joined using
a straight line, in the case of simple line graphs; the dots are joined using a
smooth line with free hands.
The data recorded at weather station B are used to construct the followingsimple curve graph
Advantages and disadvantages of simple line and simple curve line graphs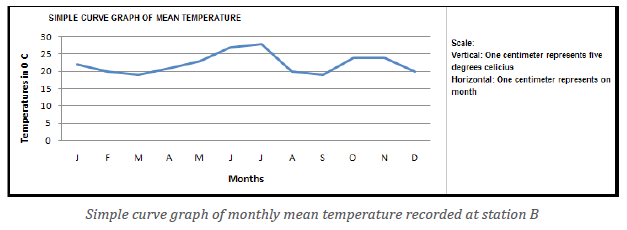
In the following paragraphs are described advantages and disadvantages of
both simple line graphs and simple curve graphs:
Advantages
1. They are simple to draw or construct.
2. When neatly drawn, they provide a good visual impression.
3. They are easy to interpret.
4. Less time is needed to construct them.
5. Simple errors or error free because of the simplicity nature of the
methods.
6. Simple calculations are involved.
7. They can be used together with other statistical methods and diagrams
such as dot maps, in a super-imposition manner.
8. They have a multi-purpose service. For example, they are used in
representing several geographical aspects such as the trend of cropproduction, variation in temperature, minerals, etc.
Disadvantages
1. There is no accurate interpretation because of some points are plotted
basing on estimation of values.
2. There are difficulties in determining the appropriate scale especially
when large figures or values are used.
3. The curve graphs are less accurate in comparison to simple line graphs.
4. It is not easy to use the simple line and curve graphs to compare various
categories of data.
5. Changing scale of either axes, can greatly change the visual impression
of the graph.6. They are only used while dealing with continuous data.
1.2.2. Group or comparative line graphsActivity 1.2.2
Group or comparative line graphs are also known as multiple line/curve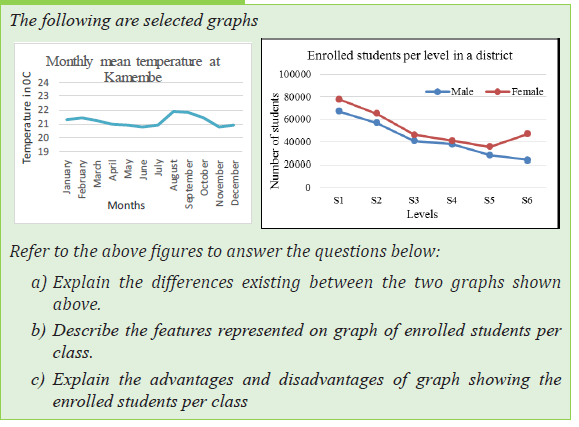
graphs. This form of displaying statistical data is used to portray more than
one dependent variable, whereby each line represents a given specific variableof individual item.
Construction of group or comparative line/curve graph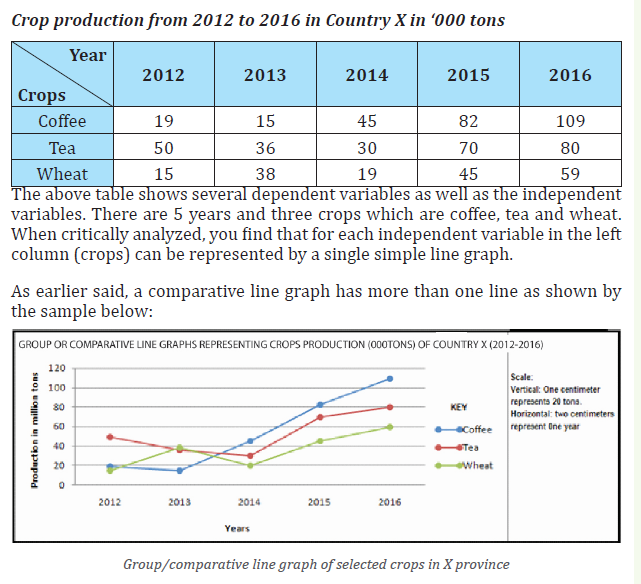
Below are steps or guidelines to be followed while drawing a group or
comparative/multiple line/curve graphs:
1. Several lines are constructed on the same graph.
2. The lines drawn representing individual variables or items should be
easily distinguishable from one another. It is advised to use varying colors.
3. Avoid congesting the graph with many lines. The recommendable
maximum number of lines is five.
4. The lines/curve should not cross each other unless the data given
requires it. If it happens therefore, strictly varying colors or shading
must be used.
5. Lines should not touch the vertical axis.
6. Names of variables being represented should be written directly on each line.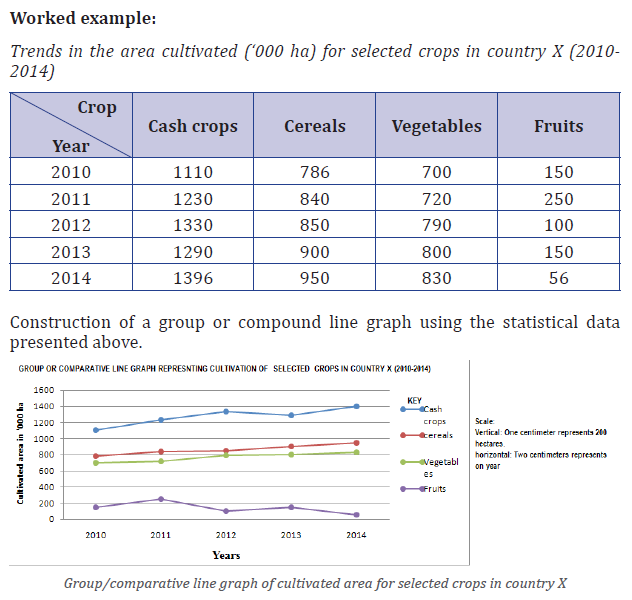
Advantages of group/comparative line graph
1. It is a simple method as it does not involve a lot of calculations.
2. It gives a clear impression of the different variables presented on one graph.3. It can be used to show comparison of different items.
Disadvantages of group/comparative line graph
1. The presence of many variables on the same graph makes their
interpretation more difficult.2. The values for each period are not easy to determine.
1.2.3. Compound line graphActivity 1.2.3
The table below shows the crop production from 2005 to 2010 in ‘000tons in country Y:
Using the previous knowledge and skills acquired in Mathematics and the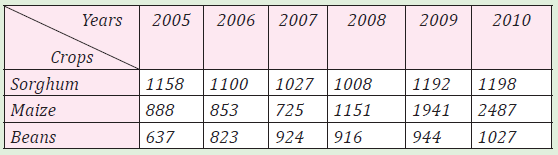
data presented in the table above, answer the following questions:
a) Calculate the cumulative totals.
b) Construct a compound line and shade every component.
c) Research on the advantages and disadvantages of compound line graphs.
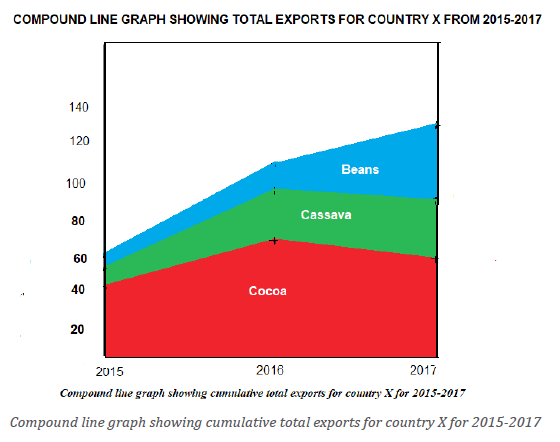
A compound line graph is also known as a cumulative line graph. It is the
type of graph where a variety of variables are presented as subsequent lines.
Therefore, a compound line graph displays cumulative totals. It is drawn in a
way that lines are super-imposed above each other; creating several segments
or components.
Construction of a compound line graph
The following steps must be followed while constructing a compound line
graph:
1) Make a cumulative table representing progressive or cumulative totals
of the provided variables.
2) Select the appropriate scale for both dependent and independent
variables.
3) Follow the steps used when a simple line graph is being drawn. It should
be the variables with large or biggest values to begin.
4) The lines constructed for each variable should connect onto the two
vertical lines on both sides.
5) Super-impose other lines on top of the first line beginning from each
segment or component. Indicate the name of the variable in each section
shaded.
6) The lines drawn must begin from or attached to the vertical axis as
earlier emphasized.
7) Since plotting of points is dependent on the calculated values in a
cumulative manner, lines therefore, must not cross each other.
8) If the statistical data is in large numbers, it is very advisable to convert
the value of each variable into percentage. Thereafter, calculate the
cumulative totals. Such calculations should be indicated.
Worked example:
Table of total exports in million tons for country X’s for 2015-2017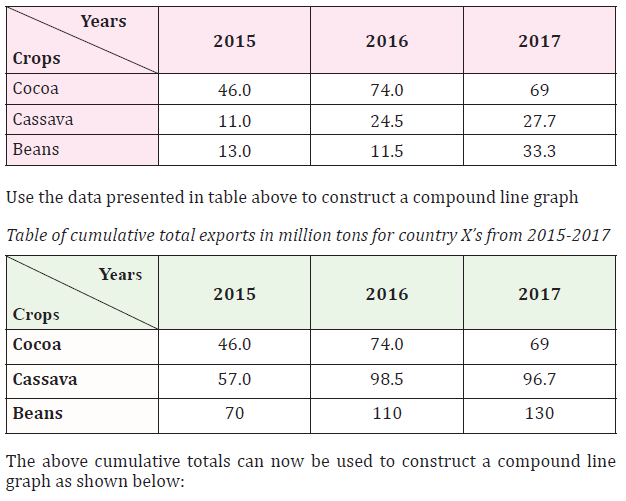
Advantages of compound line graph
1. They are easy to interpret.
2. They provide a good visual impression.
3. They are simple to draw.
4. Less space is used.
5. They can be used to present a variety of variables.
6. They are suitable for comparison purposes.
Disadvantages of compound line graph
1. When large numbers are used, selecting a suitable scale becomes more
challenging.
2. It or they involve calculations such as; converting the values into
percentages and then determining the cumulative totals.
3. The use of cumulative totals while constructing the compound line graphsmakes it difficult to find precisely the actual values of the variables.
1.2.4. Divergence line graphs
Activity 1.2.4Below are two statistical graphs representing different statistical data:
Use the diagrams above to answer the following questions: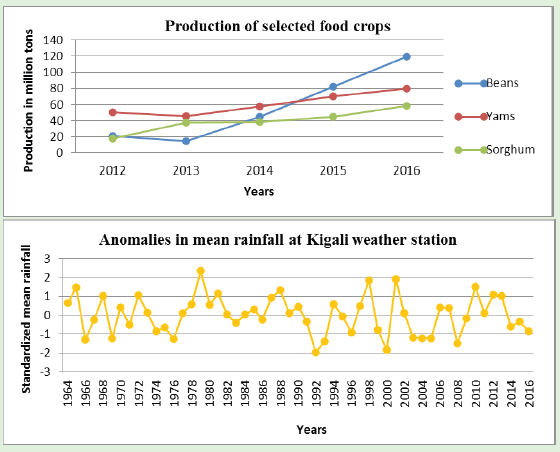
a) Identify the differences existing between the two graphs presented
above.
b) Research on advantages and disadvantages of the graph showingthe anomalies in mean rainfall at Kigali weather station.
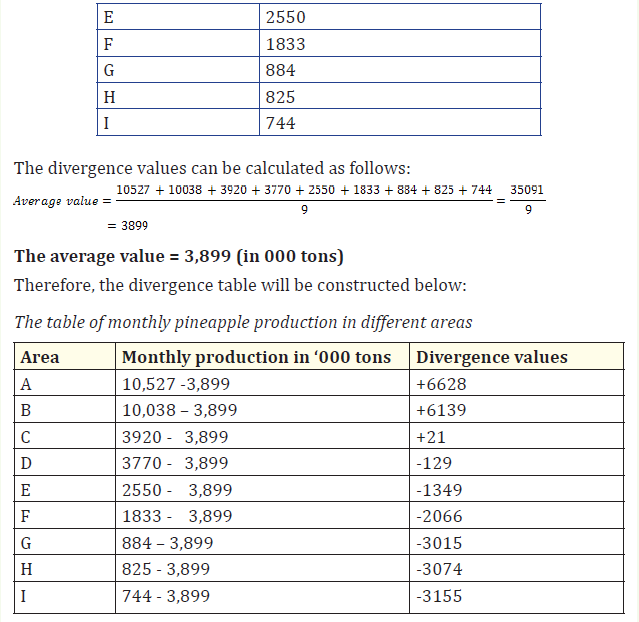
Divergence line graphs are statistical graphs that directly portray variations in
values. When there is an increase in values; a plus sign (+) is used in the figure
while a fall or decrease in values is portrayed using a negative sign (-). This type
of graph is used while dealing with variables whose values are highly changing
spatially and temporally.
Construction of a divergence line graph
The following steps must be considered when drawing a divergence line graph:
1. Draw two vertical lines (axis) and leave a reasonable space for the
baseline; on which the independent variables are to be indicated.
2. Draw the average line commonly known as the zero line. This should join
the center of the two-vertical axis.
3. Draw a basement line for independent variables; joining the bases of the
two vertical lines. The length of the horizontal line is determined by the
number of independent variables and the horizontal scale used.
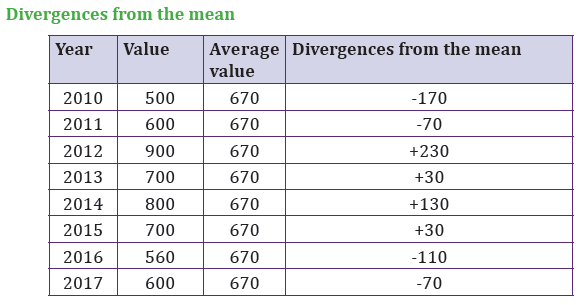
4. Determine the average values of all the values indicated in the table. Thisis obtained using the following formula:
1. Deduct the average value from each value. The positive and negative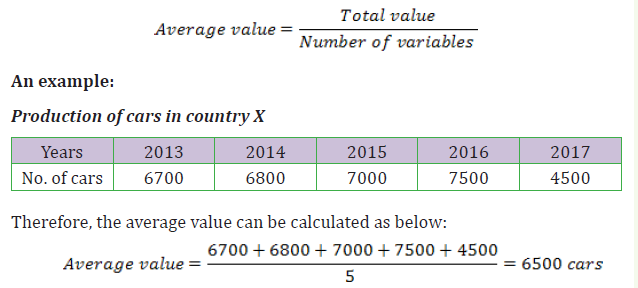
signs should be indicated or shown.
2. The figures or values with positive sign (+) are plotted above the Zero
line or average line. While the negative values are plotted below or
beneath the zero or average line.
3. While determining the scale, the vertical scale should be determined
basing on the calculated divergences. The horizontal scale is chosen
normally depending on the independent variables provided.4. Thicken or darken the zero line/average line.
Advantages of divergence line graph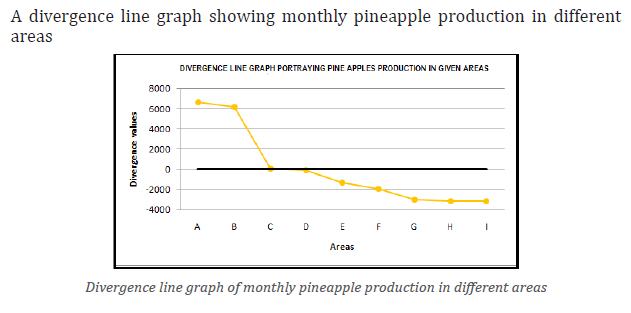
Below is an outline of the main advantages of divergence line graph:
1. It is easy to construct.
2. It provides a good visual impression.
3. It is easy to interpret.
4. It is an appropriate method of representing items that need comparative
analysis.
5. It requires limited space.
Disadvantages of divergence line graph
1. It involves several calculations for example the total value, getting
average and finding divergences.
2. The actual figures are not shown. Only divergences are indicated instead.
3. There are some difficulties while determining the scale mostly when the
divergences are composed of bigger values and very low ones.
4. Its construction is time consuming.
5. The method allows some inaccuracy while being drawn. This is because
if large values are used, decimal points are neglected.
6. To be used, it requires the reader to have the original raw data or a tableof values.
Application Activity 1.2
1. Collect data on the students’ performance in any subject of your
choice and use the scores to construct the following line graphs:
simple and curve line graph, comparative, compound and divergence
line graphs.
2. Comment on the distribution of statistical data displayed on the
constructed graphs.
1.3. Bar graphs
Bar graphs are statistical methods whereby rectangular bars are used to portray data.
Bar graphs differ from line graphs because the lines used under bar graphs join
to form single and individual rectangular bars.
Bar graphs described below include:
i) Simple bar graphs
ii) Compound bar graphs
iii) Divergence bar graphs
iv) Age-sex graphsv) Dispersion graphs
1.3.1. Simple bar graphs
Activity 1.3.1
Table showing population of selected countries of the world (‘000,000people) in 2016
Use the data presented in table above to answer the following questions: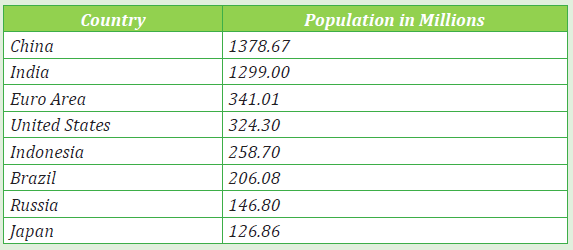
a) Draw a simple bar graph portraying the above data.
b) Describe the population distribution as portrayed on the graph and
the table above.
c) Explain the impact of population on the physical environment in
countries such as China and India.d) Research on advantages and disadvantages of bar graphs.
A simple bar graph is created following the same procedures as a simple line
graph. However, instead of using a line to represent the variables, parallel bars
are used. The independent variables are indicated on the horizontal axis anddependent variables shown on the y-axis or vertical line.
Construction of a simple bar graph
The following are the main steps followed to construct a simple bar graph:
1) Create a frame of both vertical and horizontal axes. That is, drawing the
X and Y axes. The length of these two lines will be determined by the
scales used and the figures to be plotted.
2) Indicate the independent variables on the X axis and dependent variables
on Y axis.
3) Select appropriate scale: Both vertical and horizontal scales. This is
determined as studied while dealing with line graphs.
4) The horizontal scale will automatically determine the size of the bars.
It is recommended that the size of each bar should not exceed 1 cm or
go below 1cm in width. Too small and huge bars make the graph lose its
primary appearance.
5) While plotting points, use tiny dots to mark the required points. This is
because with bar graphs dots are not supposed to be seen.
6) The volume, percentage or value of the dependent variable is represented
by the height of each independent bar.
7) A reasonable small space should be left to separate the bars from the
vertical axis.
8) There should be uniformity in terms of the size of bars, separating space
existing between bars.
9) The bars should be attached only when a single or similar dependent
variable is being dealt with. But this is not a golden ruling. For example,Rainfall, production of coffee or any other variable.
Worked example:Table of annual mean rainfall of X weather station in 2019
The data displayed in table above were used to construct the following simple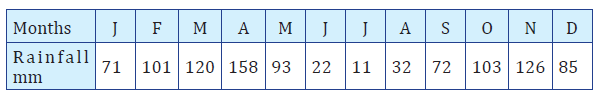
bar graph:
The data used to construct the above simple bar graph, deals with single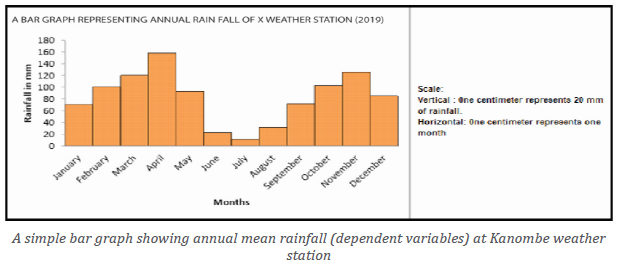
dependent variables like rainfall and that is why the bars are attached to each
other. However, the separated bars are used to represent independent variables
as shown on the figure below.
Table showing the profits made in a period of 5 years by company Umubanomwiza
Advantages of simple bar graphs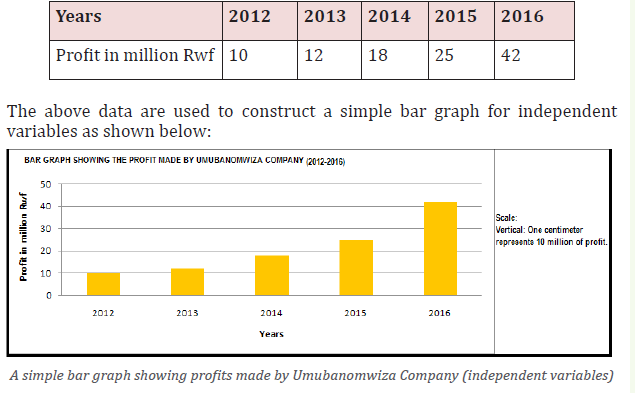
The following are advantages of simple bar graphs:
1) They are easy to interpret.
2) Summarizes a large amount of data in a visual form.
3) They display trends easier to highlight or notice than simple line graphs.
4) They can be super-imposed on other statistical diagrams. That is, they
can be used together with other methods.
5) They are easy to construct.
6) They do not involve complicated calculations.
7) They represent each data category in a frequency distribution.
8) The several bars constructed provide a chance of comparative analysis
and expression of differences existing between variables. For example,
rainfall received within 12 months.
9) They provide a compact way of presenting statistical data.
10) They are suitable for showing data with different units such as years,
months among many others.
Disadvantages of simple bar graphs
1) They can easily be manipulated to provide false impressions.
2) When large figures are used, determining a suitable scale is more
challenging.
3) Time consuming especially when several variables are dealt with.
4) They do not provide adequate explanation. Therefore, for them to be
rewardingly understandable, additional explanation is required.
5) Simple bar graphs do not show key assumptions, causes, impacts andpatterns.
Group bar graphs also known as multiple bar graphs. Group or multiple bar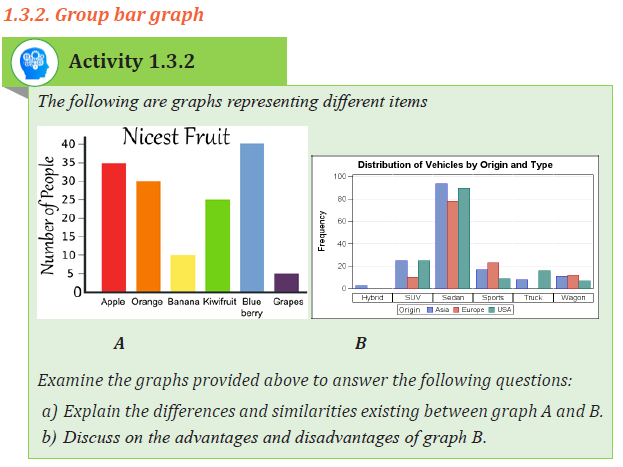
graph is a statistical technique used to represent data that is made up of several
dependent variables, that can hardly be shown using simple bar graph. A group
of bars is constructed following the steps involved in drawing of a simple bar
graph. The only difference is that group bar graph is constructed by attaching a
set of bars representing individual variables.
Construction of a group bar graph
The following are main steps involved in construction of a group bar graph:
1) The way of constructing a group bar graph is the same as that of simple bar graph.
2) The bars are drawn in form of a set and touching each other for each
independent variable. This implies that bars are grouped but separated
from another group by a space.
3) Draw the bars in a vertical manner.
4) The independent variable that has the largest values should be started
with and drawn on the left and continuing in a descending order towards the right.5) The arrangement of the first group should be maintained throughout.
Advantages of group bar graph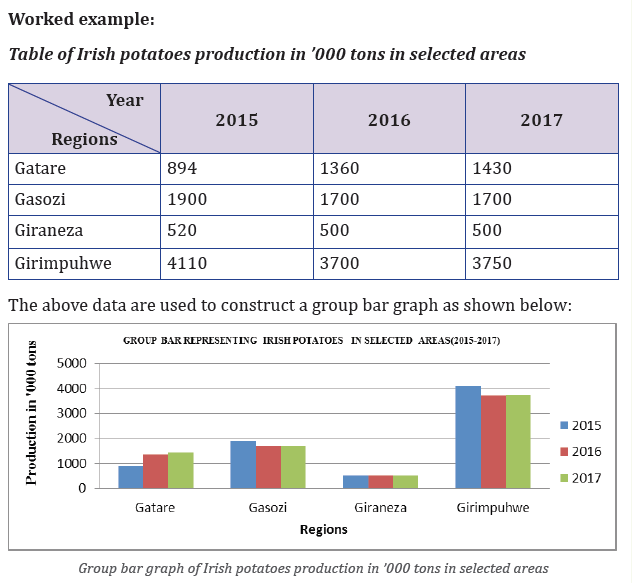
1) Group bar graph is easy to interpret;
2) It favors comparative analysis of the statistical data being dealt with;
3) It is simple to draw;
4) The calculations involved are simple and easy;
5) It provides a wonderful visual impression when it is coloured;
6) It can be used together with other diagrams in a super-imposed way;
7) It is suitable for a wide range of variables.
Disadvantages of group bar graph
1) It requires a large space;
2) It is challenging while determining the scale;3) It may be difficult to interpret it when it is congested.
1.3.3. Compound bar graph
Examine the graphs provided above to answer the following questions: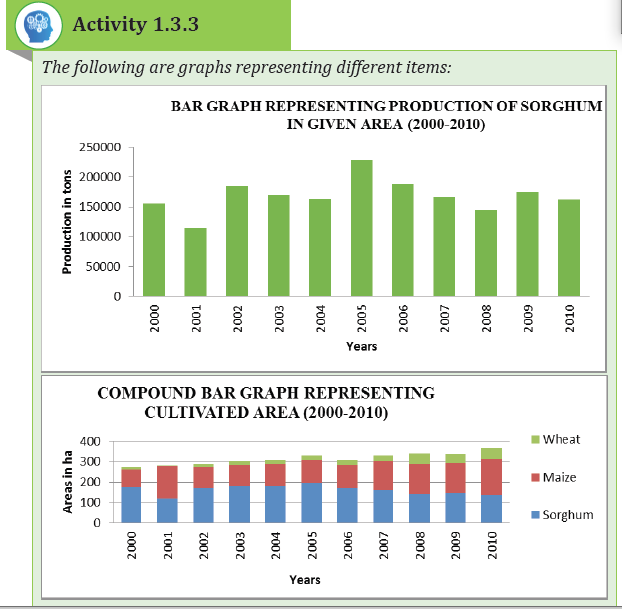
1. Explain the differences and similarities existing between graph showing
production of Sorghum and that of cultivated areas of selected food
crops in given area.
2. Research on the advantages and disadvantages of the graph showing
cultivated areas of selected food crops in given area.
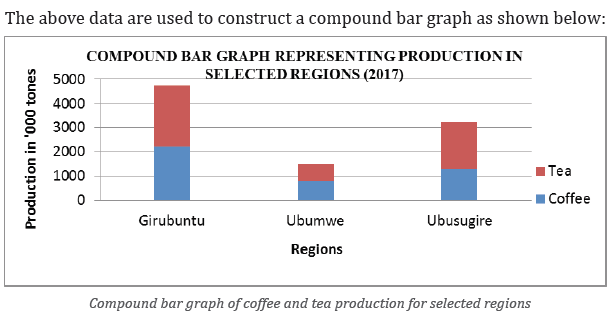
Compound bar graphs are also called cumulative or divided bar graphs. This
form of statistical graph is used to show how the total in any one bar is divided
up between several subtotals basing on the calculated cumulative totals.
A compound bar graph used when there is more than one variable and a variety
of the items are to be portrayed using one bar. Basing on cumulative totals as
calculated depending on the raw data on the table provided, a given bar can
be divided into segments. The size of each segment depends on the value of
variable being represented.
Construction of a compound bar graph
The following are the main steps followed to construct compound bar graph:
1) It is constructed by using cumulative progressive totals.
2) It requires selecting a suitable scale that enables the plotting of both big
and small values.
3) The plotted data are displayed in percentages starting with the greatest
value and ending with the smallest figure.
4) The width of each bar is determined basing on the scale used.
5) The number of bars will be determined by the number of variables to be
represented in each set of bars.
6) The varying sheds or colors are used for each individual segment or
component of every bar.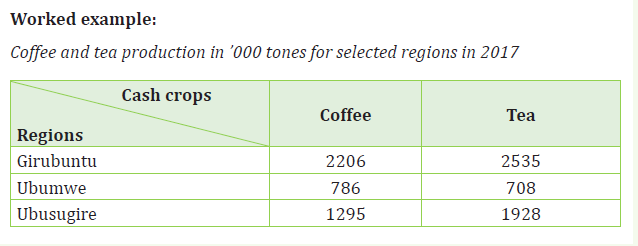
The primary purpose of the divergence bar graph is to represent the way values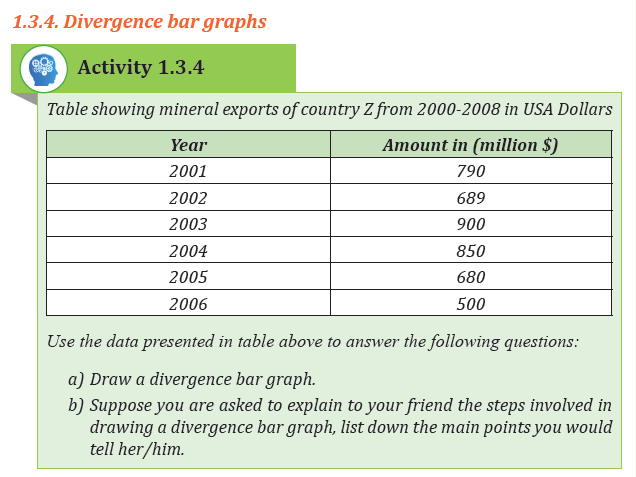
of various variables deviate from the average/mean value. Therefore, thisstatistical method shows the fluctuation of the variables.
Construction of divergence bar graphs
The steps to be followed while constructing divergence bar graph are:
1) Construct the two vertical axis lines.
2) Join the two vertical lines with the horizontal line at the base line.
3) Draw the average line which is known as a zero line at the center of the
two vertical lines. Write the average against this line at the end points
where “0” is indicated.
4) Find the total of all the value of the variables and divide it by the number
of the items to get the average. Subtract the average obtained from each
value, to get the divergences or deviations.
5) Select the suitable scale basing on the divergences calculated.
6) Plot the negative values below the average line and the positive onesabove the same line.
Advantages of divergence bar graphs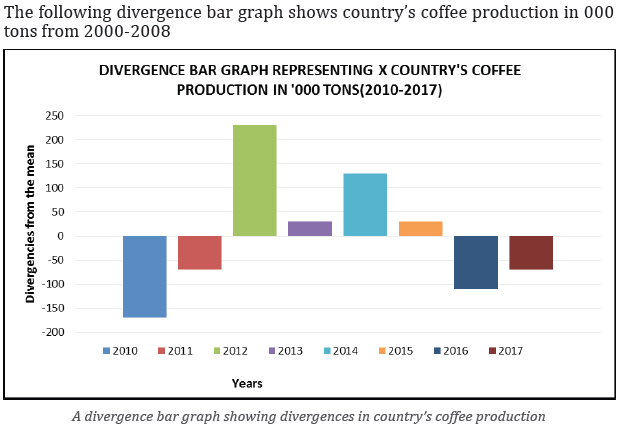
The following are advantages associated with divergence bar graphs:
1) They provide a good visual impression.
2) They are appropriate for comparison purposes.
3) They are easy to construct.
4) They are less complex therefore, easy to interpret.5) They use limited space.
Disadvantages of divergence bar graphs
1) There are several calculations involved.
2) The method is only limited to a single item or commodity.
3) Determining the scale especially when the values have a wider amplitude
is challenging.
4) The plotting of values is only based on divergences. Therefore, the actualvalues are not seen.
1.3.5. Age and sex graphs
Activity 1.3.5
Statistical diagrams showing population structure in two different countries: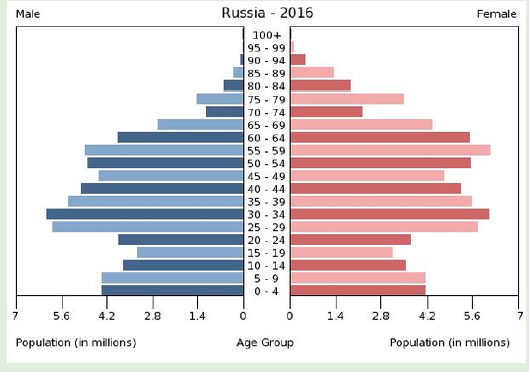
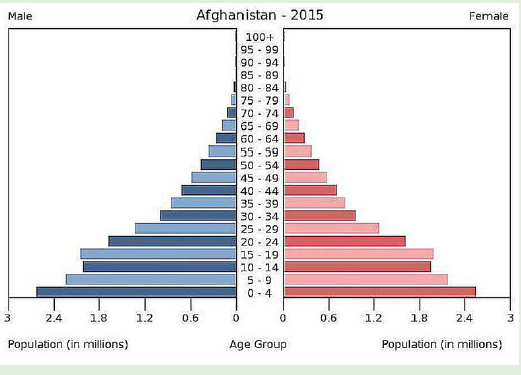
Refer to the figures presented above to answer the following questions:
a) Name the diagrams indicated above.
b) Differentiate the two diagrams represented above based on their
structure.c) Research on the advantages and disadvantages of such diagrams.
An age-sex graph is also known as a population pyramid. It is a type of bar graph
that represents the structure of the population of a country or area basing on
age and sex. An age-sex graph forms a structure of pyramid as the population grows.
It is a graphical drawing that displays the distribution of several age groups in
each population of a country or part of the world, which makes the shape of a
pyramid as the population grows. It is usually in age groups of five years for
example 0 - 4 years; 5 - 9 years; 10 - 14 years and so on. The age groups are
indicated or plotted in the middle.
The primary purpose of the population pyramid is to portray population
structure and age groups. The number may be in a raw form or converted intopercentages.
Construction of age-sex graph
When drawing an Age-sex pyramid, the following steps should be observed:
1) It is constructed on two X-axis; one to portray male and another for females.
2) Males are represented on the left and females on the right.
3) The bars representing each sex are separated by a space. It is in this
space that age groups are indicated in a progressive manner.
4) The data provided should be grouped using the interval of 5 years as
follows; 0 - 4; 5 – 9; 10 – 14; 15 – 19; 20 – 24; 25 – 29; 30 - 34 and so on.
5) After forming the age groups; the lowest group which forms the youngestis indicated on the base of the graph.
The following age-sex bar graph of country X is drawn using the data presented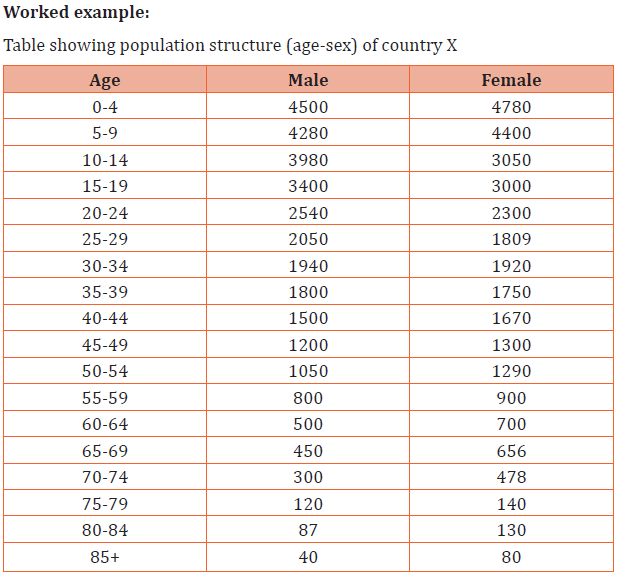
in table above.
Advantages of an age-sex graph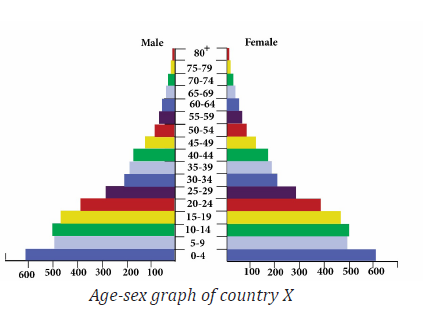
The following are the main advantages of an age-sex graph:
1) It provides instant display of the composition of female and male
population being portrayed and their corresponding age ranges;
2) It shows the general shape of population structure. The features
associated with the age-sex pyramid can indicate factors affecting a
represented area or region;
3) It gives a good visual impression that captures the attention of the reader
or interpreter;
4) It is easy to interpret;
5) It has limited or sometimes no calculations involved, therefore, it is easy to draw;
6) Age-sex pyramid is suitable for comparison purposes.
Disadvantages of an age-sex graph
1) It is only used to represent population structure;
2) There is loss of important information due to the use of figures that are
in age-cohorts;
3) It cannot show the population distribution (Do not describe or show the
trend of population growth);
4) The actual figures may not be seen since in most cases percentages are used;5) It is challenging to determine a suitable scale.
Referring to the figures above answer the questions that follow: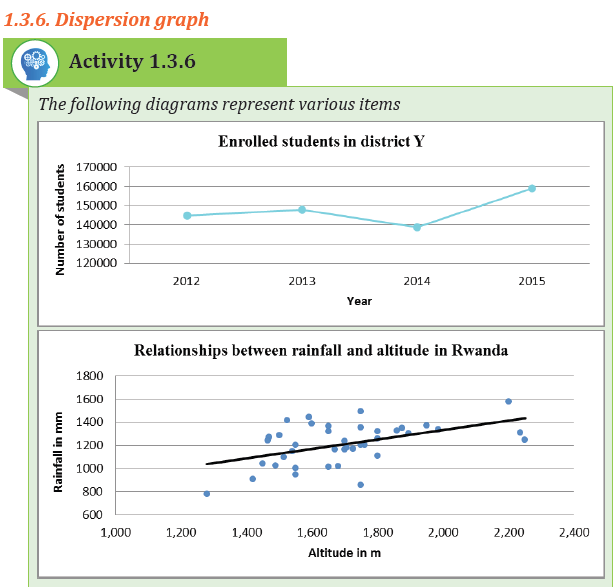
a) Name and describe the above presented diagrams.
b) Research on the advantages and disadvantages of dispersion graphsusing the internet and text books available.
The dispersion graphs are statistical representation method that displays the
tendency of data scattered over a range. It is also called scatter graph. It is
used to show the relationship existing between dependent and independent
variables.
Construction of dispersion graph
Below are the main steps followed while constructing a dispersion graph:
1) Draw the vertical axis and horizontal axis.
2) Select the suitable scale for both axes.
3) Determine the variable that qualifies to be independent variable and the
dependent variable.
4) Indicate the dependent variables along the vertical axis and the
independent variables on the horizontal axis.
5) Plot the points using visible dots that are thickened.
Dispersion graphs can display positive correlation (e.g. previous figure) and
negative correlation
Worked example:
The table below shows the examination scores in G.S Dihiro in Bugesera Districtin relation to the hours assigned.
The graph above shows a positive correlation between studying hours and
students’ examination scores because the students’ examination scores increase
with increase in hours of study. The following graph shows negative correlationbetween altitude and temperature.
The figure above depicts that there is a negative correlation between altitude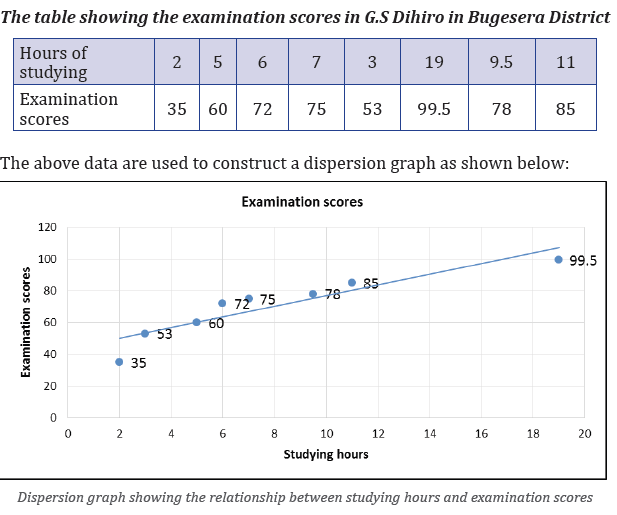
and temperature as far as the temperatures decrease with altitude.
Advantages of a dispersion graph
1) Dispersion graph displays the relationship between two variables;
2) It tests how reliable the data collected is;
3) It is easy to draw;
4) It provides a good visual impression;
5) It easily portrays the anomalies associated with data.
Disadvantages of a dispersion graph
1. Some information that may be important is not displayed.
2. It is more reliable when a wide data is used but when the data used is
small, the conclusion may not logically be reliable.
3. Much time is required when huge information is used.
4. It is easily constructed by using ICT (Excel) and hard to construct itmanually.
Skills lab
In your school, collect data of the number of students for the last five years and
construct the appropriate statistical graph to portray the population of your school.
End unit Assessment
Landslides and floods hit several parts of Rwanda between 7 and 8 May
2016 after a period of heavy rainfall. Government officials say that at least
49 deaths have been recorded so far. Some of the victims drowned in flood
water, others died after houses collapsed under the heavy rain and landslide.
The worst hit areas are the districts of Gakenke and Muhanga. As many
as 34 people have died in Gakenke, 8 in Muhanga, 4 in Rubavu and 3 in
Ngororero. Around 26 injuries have also been reported. Reports from the
Ministry for Disaster Management and Refugee Affairs reported that over
500 houses have been destroyed. Therefore, use the statistical information
presented above to do the following:
a) Extract statistical raw data mentioned in the story.
b) Use appropriate statistical diagrams and graphs to display the portrayed
data in (a) above.
c) Identify and describe the geographical phenomena that are highlighted
in the news print.
d) Explain how you would use the data collected and statistical diagrams,
graphs and charts constructed to advise the people and the
government on the environmental challenges to be addressed.
e) Assess the environmental challenges to be addressed in the area andshow measures of controlling them.
UNIT 2:BEARINGS, DIRECTIONS, DISTANCES AND AREAS ON A MAP
Key Unit competence : The student-teachers should be able to measure
the bearings and the directions, calculatedistances and areas on a map.
Introductory activity
Maps are very important in showing location of places. Study the topographicalmap of Rwanda provided below, and answer the questions that follow.
a) How do we locate places on maps using grid references?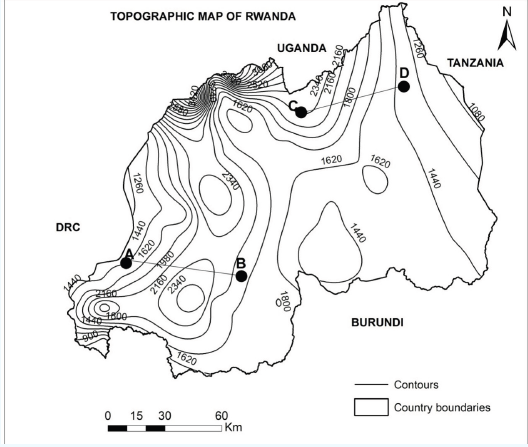
b) Determine the distance from point A to B and C to D?c) Identify the steps to be followed to determine the bearing of B from A.
2.1. Location of places using the grid references
Activity 2.1
Map
a) A map has several printed lines on it. Show the vertical and horizontal
lines printed on the map. Identify them.
b) What does grid reference mean?
A grid is a series of straight lines drawn vertically and horizontally on a
topographical map, where the lines cross each other and form squares of equal
sizes. The lines running from north to south (vertical lines) are called Eastings.
This is because their numbers increase towards the east from the south western
corner. This is known as the grid origin and it is from it that all readings start.
Lines drawn horizontally run from east to west and are called Northings. Theirnumbers increase towards the north.
The lines shown on the illustration above intersect forming grid squares. These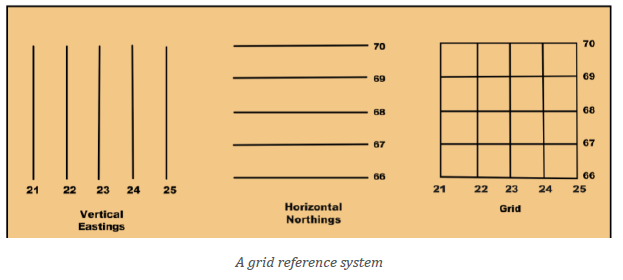
are formed by both vertical lines (Eastings) and horizontal lines (Northings).
These are called grid references or geographical coordinates. They are the
ones that are used to locate places and features indicated on the map. This isillustrated below:
The value of the easting (vertical gridline) is read first, followed by the value of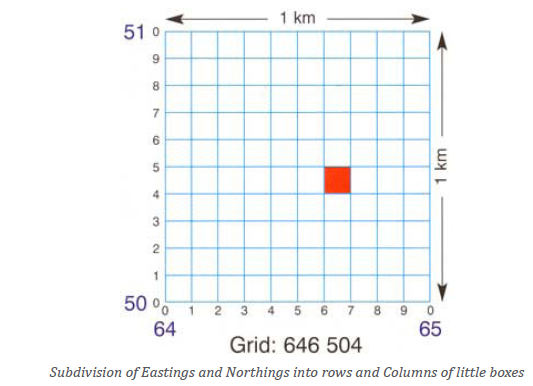
the northing (horizontal Gridline). The values of the Eastings and Northings are
known as coordinates. The coordinates are expressed as a single continuous
figure without decimal points or commas, for example, 646 504 and not
646,504. They are plain numbers, without units of measurements.
The coordinates are given in two ways:
─ Four-figure grid reference
─ Six-figure grid reference
2.1.1. The four-figure grid reference
The four-figure grid has four digits. It gives the grid reference in which a position
is found. The four-figure grid references of the yellow square, in figure below,
are found as follow:
• Read the easting first and record its value. In this case it is 11.
• Next read the northings and record its value. In this case it is 81.
• Put the two values together.• The four-figure grid reference for the square is 1181.
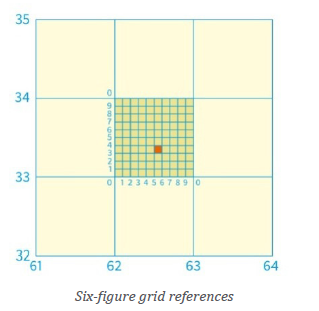
2.1.2. The six-figure grid reference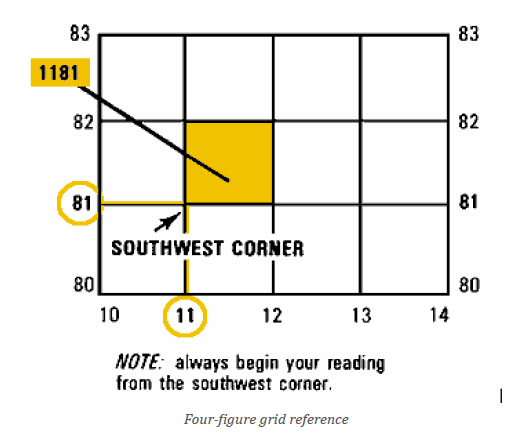
This reference has six digits. It is more exact than the four-figure grid reference.
To find the six-figure grid reference for the red square in figure below is done
in the following ways:
• Read the easting first and record its value. In this case it is 62;
• Subdivide the area between easting 62 and 63 into 10 equal parts;
• Record the value of red square out of 10 from easting 62. In this case,
it is 5. This forms the third digit of the easting;
• The value of the easting for red square is therefore 625;
• Read and record the northing. In this case, it is 33;
• Subdivide the area between northing 33and 34 into 10 equal parts;
• Record the value of red square out of 10 from northing 33. In this case,
it is 3. This forms the third digit of the northings;
• The value of the northing is therefore 333;• The six-figure grid reference for red square is therefore 625333.
Application Activity 2.1
Study the extracted map below and answer the questions that follow
1. Give the four-grid reference of the Geo farm.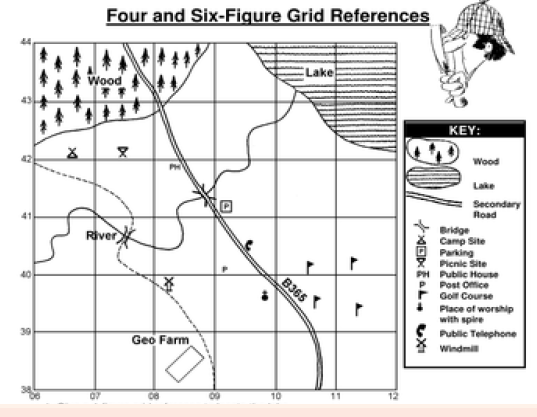
2. Identify the six-grid reference of two bridges shown on the map.
2.2. Starting directions and bearings on topographic maps
Activity 2.2Look at the picture below and answer the following questions
1. What do you understand by the term direction?
2. Explain the relationship between directions and bearing on the map.
2.2.1. Direction
Direction or orientation is important for finding the position of a place and its
relative. All directions are based on the cardinal points of the compass shownbelow:
Direction is the relative position of a place from another using the points of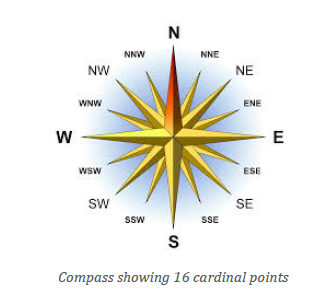
the compass. The main cardinal points of a compass are north, east, south and
west. The first letters of these directions are used in capital letter in place asthis. These are N-North, E-East, S-South, W-west.
2.2.2. Bearing
Bearing is a way of giving the direction of one place in relation to another. It
is more accurate than direction because it has 360 points compared to the16
points of a compass. Instead of saying, for example, that place A is located north
east of place B, we use degrees. So, we could say that place B is situated at 450
from place A
The bearing of a point is the number of degrees in the angle measured in a
clockwise direction, from the North line to the line joining the center of the
compass with the point. It is used to represent the direction of one-point
relative to another point.
For example, on the following diagram, the bearing of A from B is 2450, thebearing of B from A is 650.
Bearing is also the direction to something measured as an angle relative to the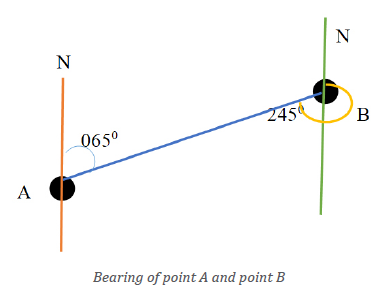
north. It increases towards the East, with North=0 degrees, East=90degrees,
South=180 degrees, and West=270 degrees.
2.2.3. Measuring true bearing
The true bearing (TB) is the bearing where the true-north line is taken as 00.
It is the measurement between the true-north line and the line joining the two
places concerned. It is measured by using a protractor from the true North, as
the example below:
• Draw a north-south line through the starting point.
• Use a straight line to join the two places given.
• Draw an arrow from the true North line to the line joining the two
places in a clockwise direction, and the angle is measured with aprotractor.
In this case, the bearing of B from A is therefore 1350.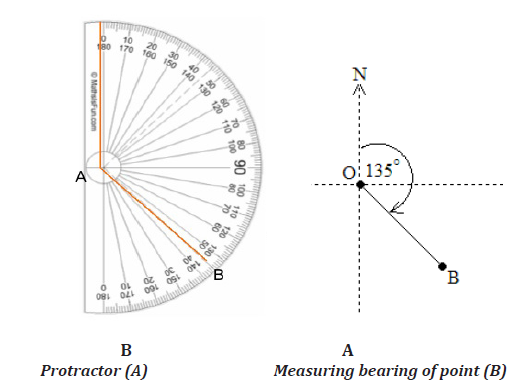
How to use a protractor?
• The centre of the protractor is over the starting point and orient
0 degree with the true north.
• Draw a line on the map from the starting point towards the destination,• Read the bearing where the line intersects the protractor.
Application Activity 2.2Study the illustration shown below and answer the questions that follow.
Determine the bearing of: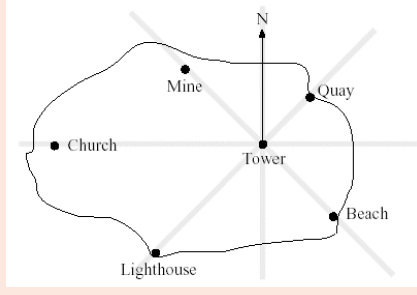
a) The Beach from the Tower.
b) The Tower from the Church.
c) The Mine from the Tower.d) What is the direction of the church from the Quay?
2.3. Measure the distance on the maps: Straight line and curved line
Activity 2.3
Read the conversation between Eric and Sophie, students in S1B, and
answer the questions:
Eric: I want to visit my uncle at Gasabo district.
Sophie: Can we walk from Kabuga market to Gasabo district?
Eric: I don’t know, let us look at our map. It has a ratio scale of 1:50 000.
On the map, it is 20cm from Kabuga to Gasabo district.
Using our map skills, that you have acquired in your previous studies:
─ Calculate the actual distance on the ground.
─ Can Eric and Sophie walk in two hours from Kabuga market toGasabo District? Support your answer.
A map is a representation of actual ground on the paper. It is usually drawn
using a scale.
Distance on the map is calculated between two points, and then it is converted
into the actual distance on the ground. The distance can be either a Straight line
or a curved line.
The most important is to know how to calculate the distance.
The following methods are used to measure the distance.
2.3.1. The Straight Line distance
The shortest distance between two points is sometimes known as “the crow
flies.”
── use the ruler and measure the distance between two points in
centimetres;
── convert the centimetre reading to kilometre by multiplying by 0.5km
if the map scale is (1:50 000) to obtain the kilometres on the ground.
Example, the distance of the crow flies from P and Q is 8.5cm on the
map, therefore 8.5cm x 0.5km =4.25 km on the ground.
1 cm
A map scale refers to the relationship (or ratio) between distance
on the map and the corresponding distance on the ground. The
map scale shows you the comparative size of features and distances
display on the map.
── check the scale of the map,
── and convert the distance between the two points into the real distance
on the ground.
The answer above should be converted to the unit for ground distances (km).
N.B. An alternative method is where a piece of string is used to measure the
curved or winding line. Make sure that the string is not elastic.
Formula:Actual distance = Map distance x Scale.
2.3.2. Curved distance
In map reading, there are sometimes curved or straight areas while determining
the distance.
Below, there are some steps to follow to calculate curved Distance.
── place the straight edge of the paper along the features to be measured
e.g. road, river;
── make a mark where the paper intersects the road;
── hold the paper steady with the point of a pencil;
── swivel paper;
── mark where paper intersect with the road;
── write down the reading after measuring the road or river;
── check the scale of the map,
── and convert the distance between the two points into the real distance
on the ground.
The answer above should be converted to the unit for ground distances (km).
N.B. An alternative method is where a piece of string is used to measure the
curved or winding line. Make sure that the string is not elastic.
Formula:Actual distance = Map distance x Scale.
2.4. Calculate the area on topographic map: regular and irregular shape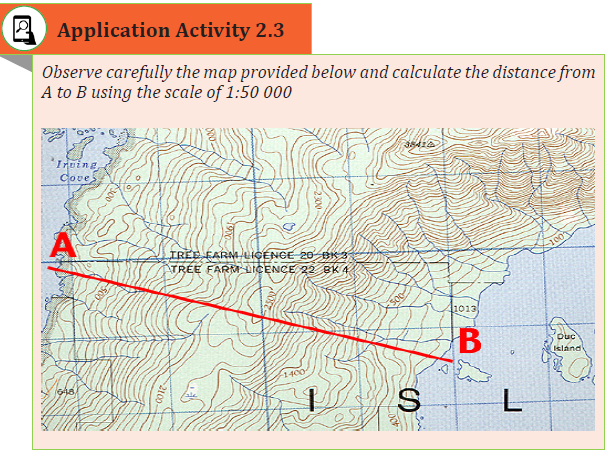
Activity 2.4
An area is calculated to determine the actual (size on the ground) of a feature/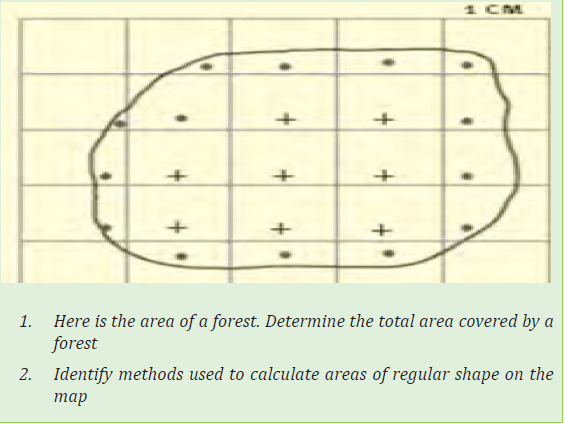
region/ demarcated area. The area of a feature can be regular or irregular in
shape.
2.4.1. Calculate areas of regular shapes
Getting the area of a regular body on the maps is simple. This is because the body
may be a square, rectangle, triangle, or a circle. Once the distances obtained, the
mathematical formula are used.
── Square and rectangle: multiply the length by the width
── Triangle: half base multiplied by height── Circle: Pi multiply by square of radius.
2.4.2. Calculate areas of irregular shapes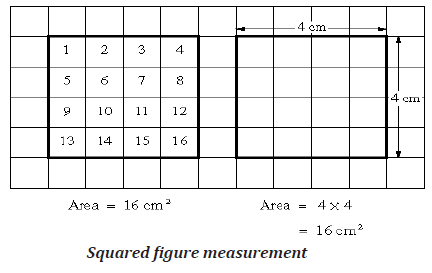
The following methods are used to calculate the area of irregular shapes:
1. The use of grid squares
On topographical maps of the scale 1:50,000, there are grid squares measuring2 cm by 2 cm.
On the ground, these measure 1 km by 1 km. It means that they have an area of 1 km2.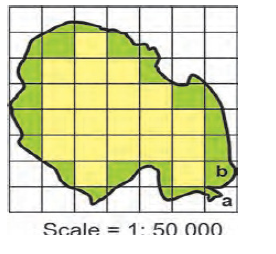
To calculate the area of irregular shapes, we need to perform the following
steps are performed:
• Count all the full squares inside the irregular body.
• Count all the half squares inside the irregular body and divide them
by two.• Add the total of the full squares and the half squares.
For example:
Formula:
Full squares= 20
Half Squares=26
Get 26 halves divide by 2 =13 full squares
20 +13=33 full squares X the area of one square
33 x1 square km
=33 km Squared.
2. The use of strip method
The strip of equal width is drawn on the irregular body. The length of the strips
differs from strip to strip.
Follow the method used to find the area of regular shapes. Calculate the area
of each strip. Add the areas of the various strips. This gives you the area of theirregular shape.
3. Use of rectangles and triangles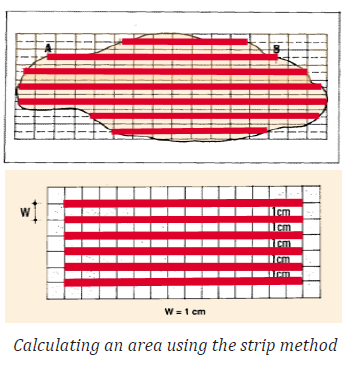
The irregular body is divided into a rectangle and triangles as shown below.
Their measurements are recorded. The formula for finding the area is used(known). Then get the totals of these areas.
Application Activity 2.4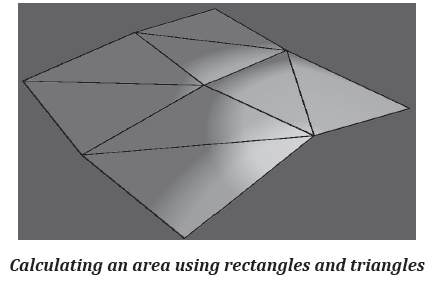
Using your knowledge, identify how you can calculate the area of a farm if
the measurement got are 45 m length, and 34 m width.
Skills lab
In your school environment, use the school plan to calculate the area of your
school compound and submit it to your school leader, then compare the resultobtained to the real area of the school.
End unit Assessment
1. Calculate the grid references for the points A, B and C on the figure:
2. Study the Topographical map below and calculate the actual distanceon the ground between the point A and B; X and Y on the Map.
3. Mugisha and Mucyo are traders in Kigali and they export goods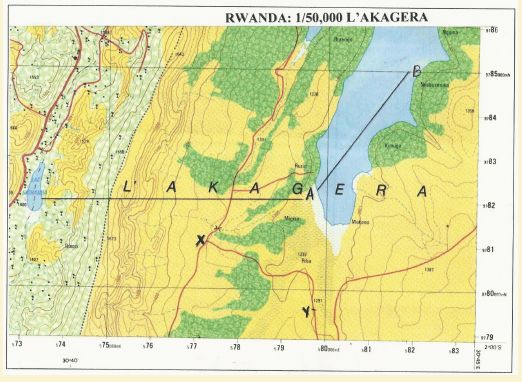
made in Rwanda and import some commodities that are not
locally produced. Sometimes goods delay as they are being
transported from Mombasa port. Suppose you want to travel
with these traders, explain how you would use a map to find out
the distance from Kigali to Mombasa.
4. Suppose someone comes from Europe to visit Rwanda, specifically
Muhoza sector, in Musanze District (see the map below). At Kigali
airport someone gives him a map with a scale of 1:50,000. He/ she
needs to know the bearing of Muhoza from Kigali.
── Show how you would find the bearing of Muhoza if this visitor
asked for guidance.── What is the relative position of Muhoza from Kigali?
UNIT 3:MAP WORK INTERPRETATION
Key unit competence : The student-teacher should be able to explain
the relationship between the physical and humanactivities on maps.
Introductory activity
A map is a representation of all or part of existing things on the earth surface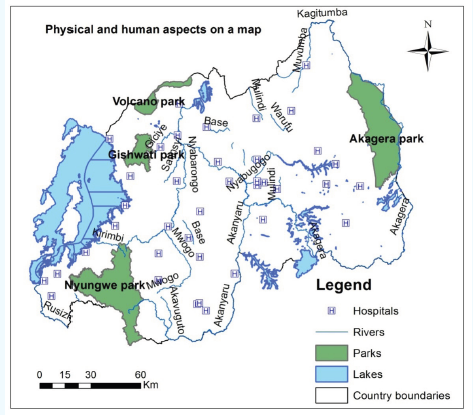
on a flat surface. A photograph is a picture of an object or environment taken
by a camera at a particular time in a given place. Maps and photographs
represent both physical and human features. The aspects represented on map/
photographs are shown using several types of signs and symbols. This helps
map /photograph users to extract the needed information from a given map /photograph.
Referring to the map above and the definition above;
a) Identify the main physical features represented on the map.
b) Identify the human features represented on the map.
c) Use the following map to represent approximately the same features asthose represented on the map above.
d) Take a photograph of the environment around your school and then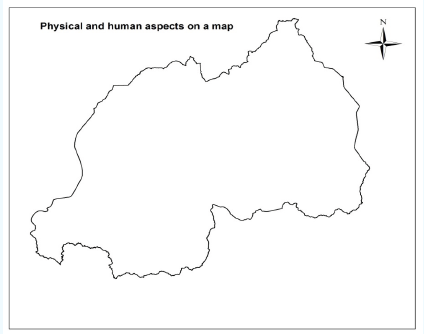
identify all physical and human aspects taken on that photograph.
3.1. Interpretation of physical aspects from maps/photographs
Activity 3.1
Make a research on:
a) The major physical aspects which may be represented on a map/
photograph.
b) The signs and symbols which may be used to represent physical
features on a map/photograph.
Physical features are also called natural features. They include the following:
• Relief which comprises rocks, slopes, soils, valleys, plains, plateau,
hills, and mountains.
• Drainage features like rivers, dams, lakes, seas and oceans.
• Vegetation cover like forests made of several types of trees, crops and
ground vegetation, wetland vegetation.
• Climate which is defined through various parameters like rainfall,
temperatures, relative humidity, cloud cover, wind speed and direction,
atmospheric pressure, sun shine.
3.1.1. Interpretation of geological features
The main geological features commonly represented on a map/photography
include rocks, cliffs and boulders.
── A rock is a solid matter which is found on the surface or in the interior
of the earth.
── A cliff is a vertical or nearly vertical rock face in mountainous and
hilly areas. Cliffs are found along the shores of lakes and seas. Cliffs
and rocks are shown on topographical maps using contours that are
close to each other. Boulders are large pieces of rocks that resisted
weathering.
── A crater is a bowl-shaped depression, or hollowed-out area, produced
by the impact of a meteorite, volcanic activity, or an explosion.
── A quarry is a place from which stones, rocks, construction aggregate,
riprap, sand, gravel, or slate are excavated from the ground. A quarryappears like a place where open cast mining is practiced.
3.1.2. Interpretation of slopes from a map/photograph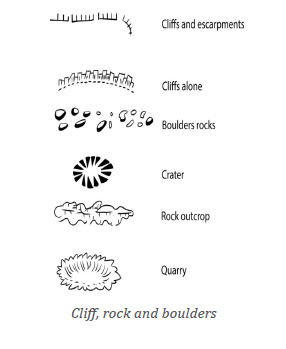
The slopes are classified according to their inclination, constancy or shape. The
slopes are represented on the map by help of contours. Contours are lines on
a map linking places of the same height above the sea level. They are drawn at
fixed intervals, known as vertical interval or VI.
Contours are labeled from the lowest to the highest. Where they are too close
to each other, the relief is steep. Where they are far apart, the land may be a
plain or a plateau. The main types of slopes are: gentle, steep, regular, irregular,
convex and concave slopes.
• Gentle slopes: Spaced contours are used to indicate gentle slopes. In
that case the land may be a plain or plateau which is a flat elevated
landform that rises sharply above the surrounding area.
• Steep slopes: Very close contours are used for steep slopes. The closer
the contours, the steeper the slope. In that case the landform may bea mountain.
• Regular slopes: Regular slopes are also called constant or even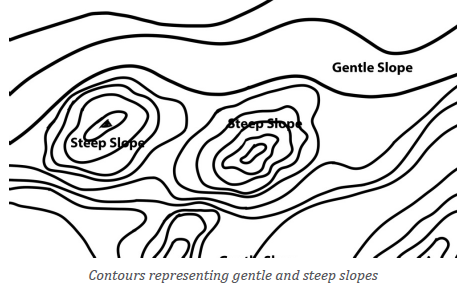
slopes. The contours have constant spaces. The slopes can be either
gentle or steep slopes.
• Irregular slopes: These are uneven or inconstant slopes. They are
represented by unequally spaced contours. They can be either gentle
or steep slopes. These slopes are found mostly in rugged, mountainousor hilly areas.
• Convex slopes: Convex slopes are gentle at the top and steep at the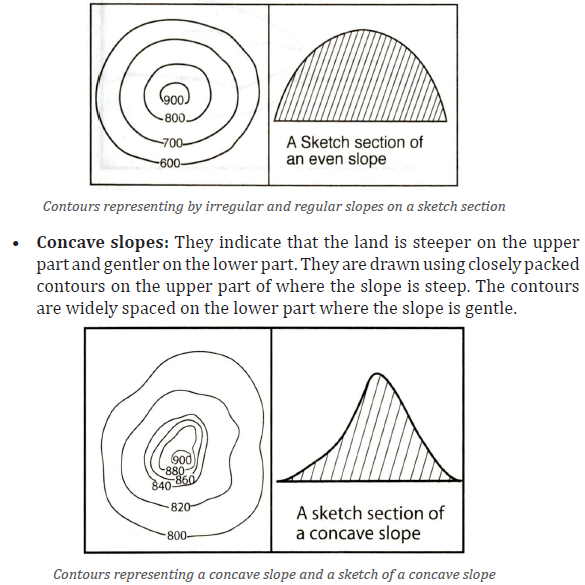
bottom of the hill or mountain. The contours are closely spaced at the
bottom section (steep slopes) and widely spaced at the top section(gentle slopes).
3.1.3. Interpretation of drainage and landforms from a map/photograph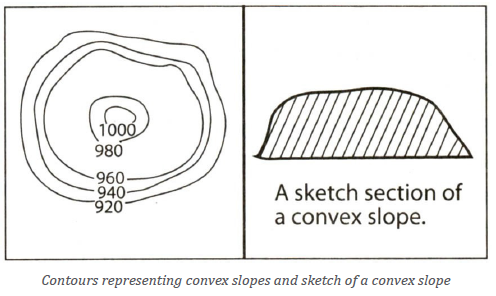
i. Interpretation of drainage features from a map/photograph
The lake, sea and ocean occupy a very large area. They are seen in blue color on
a color photograph and in dark color on black and white photograph. However
other conventional symbols may be applied on a map to represent a lake, seaand ocean; the most important thing is to put in legend/key the used symbols.
The rivers originate from mountains or hills and flows on steep slope to end in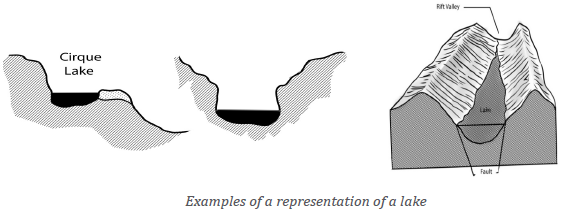
the depression that are usually found in valleys or low-lying areas. The streams
and rivers are seen on a coloured photograph/map as blue lines and they have
different patterns or arrangements which can be detected easily on a map orphotograph.
ii. Interpretation of landforms: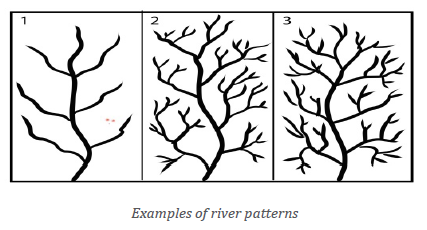
1. Valley: A valley is an elongated depression sloping towards a drainage
basin like a sea, lake or swamp and which may contain water or not.
The valley is normally represented on a topographic map by using thecontours having “V shape”.
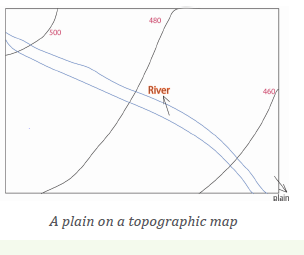
2. Plain: Most of the plains are in low-lying areas but some of them may be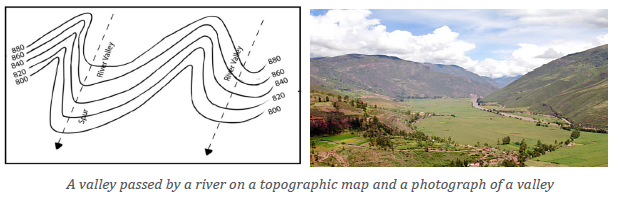
raised but the slopes remain gentle. On the topographical maps, a plain
is represented by widely spaced contours. The river passing in plainareas may also be shown on the map.
3. Plateau: A plateau is an extended landform which is bordered by steep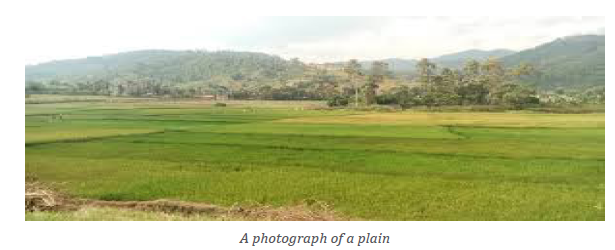
slopes. On the map, a plateau is shown as a wide area surrounded by oneor two contours having the same height on both sides.
4. Mountain: A mountain is an extended landform with steep slopes. On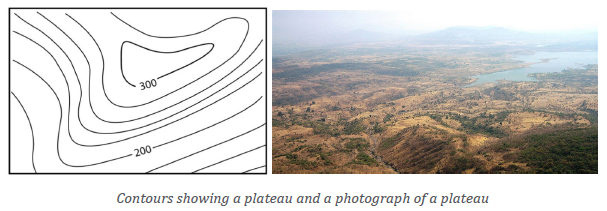
the map, a mountain is shown as a wide area with very close contours
surrounded by one or two wider contours showing the depression areassurrounding the mountain.
3.1.4. Interpretation of soils on the map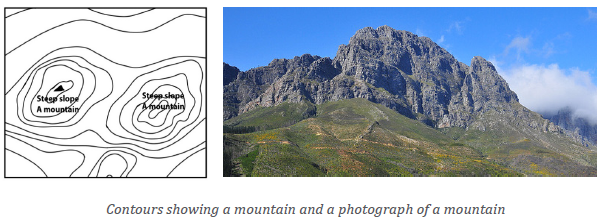
Assorted colors or symbols are used to show several types of soils on a
topographic map. Tiny brown dots called stipples are used to represent a
surface covered by sand or mud. The types of soil can be also shown by help of
dots having varied sizes according to the texture of the soil. The types of soils
can be differentiated on a photograph based on their texture (sizes) and color.Surfaces covered by lava flows are shown by symbols that look like inverted V’S.
Application Activity 3.1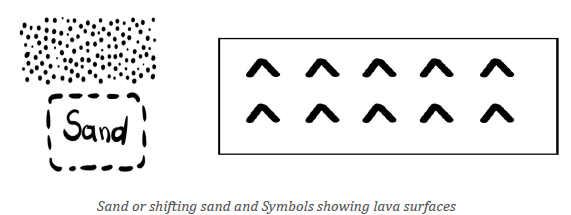
a) Identify the physical features in area where you live and describe
how they are represented on a topographic map.
b) Draw a sketch of your home area, on it, name and mark the physical
features identified in (a) above.
c) Suggest ways through which the above features can be protectedand conserved.
3.2. Interpretation of human aspects on maps
Activity 3.2
Make a research on:
a) The major human aspects which may be represented on a map/photograph.
b) The signs and symbols which may be used to represent human
features on a map/photograph
Human aspects on a map reflect human activities of a given area represented on
a map. These include agricultural development, mining, industry, settlement,
etc.
3.2.1. Agricultural activities
Crop plantations are drawn on a topographical map by using light-green
shading. A letter may be used over the shade to indicate the name of the cropgrowing in each area. For example, C for coffee, T for tea.
Several types of crops may be taken on a photograph and be identified based on
their shapes, sizes and colors.
3.2.2. Mining and quarrying activities from a map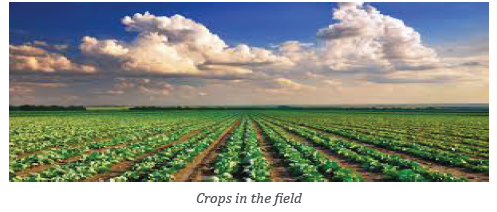
Mining refers to all the processes by which minerals are obtained from the
earth’s crust. Minerals may be in gaseous, liquid or solid form. Quarrying is the
digging of stones, sand or soil from the ground. Mining and quarrying activities
on a map are shown by symbols as represented on the figure below. The mining
activities may be taken on a photograph and different types of minerals/quarries may be differentiated based on their colors.
3.2.3. Industrial areas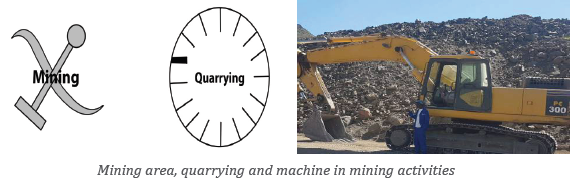
An industrial area is a geographically localized set of specific industries. Suchareas are subject to important production, marketing and other interrelationships.
3.2.4. Settlements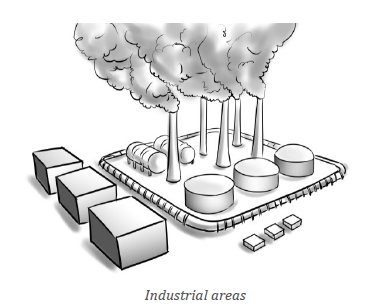
Settlement refers to a place where people live. It also means the process
of settling in such a place. Settlement on the map can be shown by dots or
rectangles which may be black or grey in colour. Dots indicate rural semipermanent
settlements while rectangles show permanent buildings like those
built of stone or bricks, with iron or tile roofing.
The dots or rectangles are spaced in relation to the concentration of settlement.
Nucleated settlements are represented by the dots and rectangles close to one
another while they are much spaced for scattered settlement.
The settlement is also represented according to its shape, for example ring or
linear. The shapes of settlement may be influenced by communication networks
like roads, railways, landforms like valley, plain, plateau, mountain amongothers.
Application Activity 3.2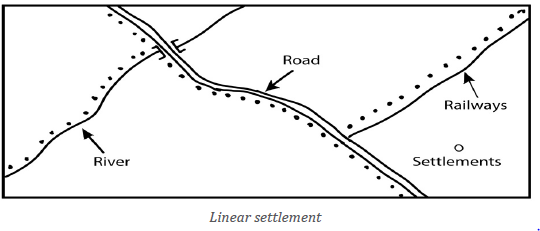
1. Use a photograph/map to identify and describe mining/quarrying areas.
2. Visit the nearest mining/quarrying areas and represent them onsketch map using appropriate signs and symbols.
3.3. Relationship between physical and human aspects on
maps/photographs
Learning activity 3.3
The following map represents both physical and human aspects which areinterrelated.
In reference to the map above from Kigali Suburbs and the knowledge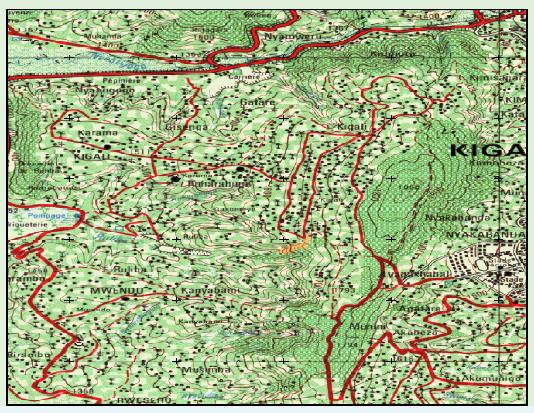
acquired from the influence of relief on the human activities; answer the
following questions:
a) Identify the existing relationships between main physical and
human features represented on the map.
b) Discuss the existing relationships between main physical and human
features available in the environment around your school and your village.
Physical aspect of an area plays a key role in the activities people do. It also has
an influence on the number of people who settle in an area. For instance, the
relief affects human activities in the following ways:
── Mountainous places are less populated because of steep slopes being
unfavorable for settlement and for mechanized agriculture. Such
landscape makes the establishment of social facilities (hospitals,
schools, shopping centers) in such places to be difficult.
── Places that are poorly drained like swamps and marshes are also
not suitable for settlement because they do not favour activities like
agriculture, transport etc. that most people rely on for survival.
── Some plains and plateaus have good soils. These allow growing of
crops and keeping of livestock. It is also possible to use machines
in farming. Therefore, more food is produced, and more people live
there.
── The depressions or valleys areas are also suitable for agriculture since
they contain fertility brought by depositions from the surrounding
high altitude areas.
── Fishing is developed in areas that have seas, oceans and lakes.
3.3.1. Drainage patterns
A drainage pattern is a network formed by rivers and their tributaries on the
landscape. The development of the drainage patterns is influenced by the
gradient of the slope, nature of the bedrock in terms of hardness, structure of
the basement rock. The drainage pattern can also result from human activities
which may change the original patterns.
The some examples of drainage patterns which can be seen on a topographic
map/photograph are as follows:
─ Trellised drainage pattern: Such patterns are developed in simple
folds characterized by parallel anticlinal ridges alternated by parallelsynclinal valleys.
─ Dendritic drainage pattern: The dendritic pattern is associated
with the areas of similar lithology, horizontal or very gently dipping
strata, and rolling extensive topographic surface having extremelylow reliefs.
3.3.2. Settlement patterns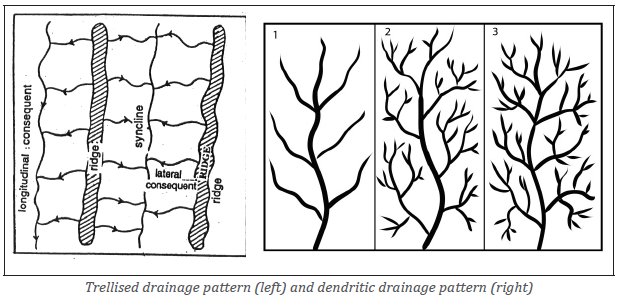
Settlement refers to a place where people live. It also means the process of
settling in such a place. The settlement patterns of a given area are influenced
by both physical and human factors like topography, road network, community
services, cultural and economic factors, etc. This results into several types of
settlement patterns as follows:
• Nucleated settlement: This refers to the grouping of many houses
around a center called nucleus; often around a central feature like
a church or a pub. Houses are built close to each other. This type of
settlement is mainly influenced by cultural and social factors. Forexample, the houses in “imidugudu” settlements may have such pattern.
• Linear settlement: This is where houses are well planned. They are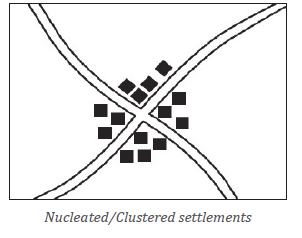
built along the road, railway and river or along the coast.
Linear settlement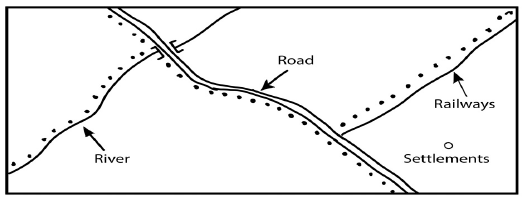
• Sparse or scattered or dispersed settlements: The settlement
associated with houses which spread out over a wide area (houses are
built far from each other). They are often the homes of farmers and canbe found in rural and mountainous areas.
Scattered settlements
• Isolated settlement: This is where a few people live away from other
people. These people could be hunters in a forest.
• Ring settlement: In this type of settlement, houses make a circle.There is an open ground at the center.
• Planned settlement: This type of settlement is well organized and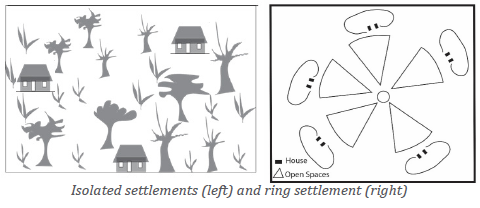
planned in specific ways as directed for instance by the government.
3.3.3. Vegetation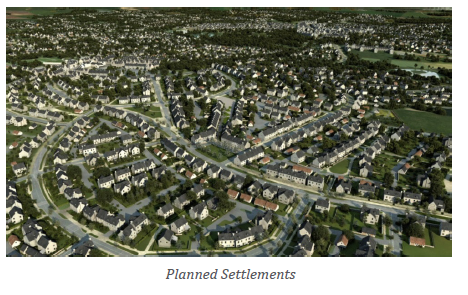
Human activities are related to vegetation. The distribution of vegetation on a
photograph/map in each area is linked with human activities taking place in that
part/dwelling. Below are some of the examples that show the interrelationship
between man and vegetation:
• In areas with dense forests: The main activities are timber harvesting.The timber is used to make furniture and paper.
• In savannah grasslands: The main activities are livestock keeping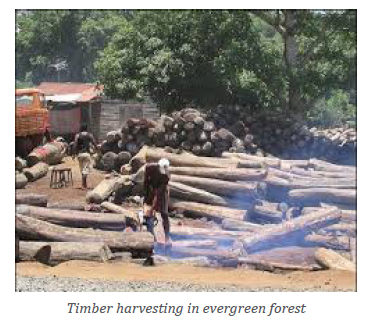
and agriculture. This is because in these areas soils are fertile.
• Desert vegetation: Agriculture is only possible in oases. Very few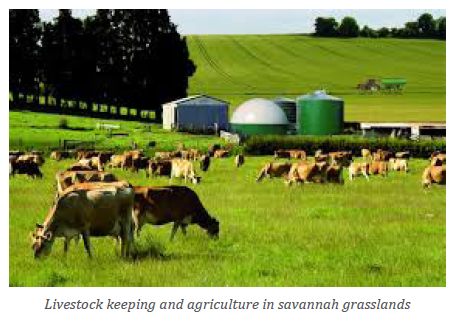
animals can survive in the dry areas like the camels, goats and sheepand reared under nomadic pastoralism.
• In tundra and taiga forests: The low rainfall and temperature affect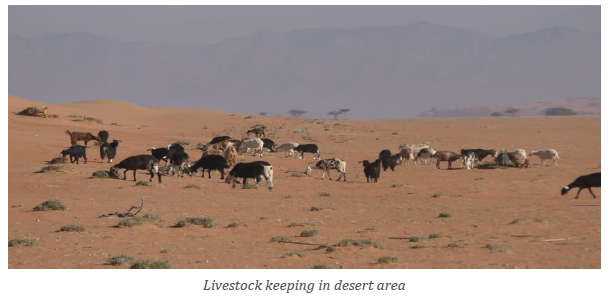
human activities. Only hunting, fishing and mining are the mainactivities done in these regions.
3.3.4. Communication networks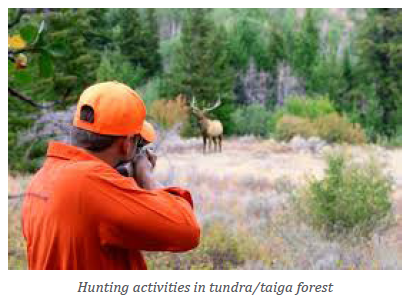
Communication networks facilitate the movement of people and commodities
from one place to another over a given distance. Communication networks may
also refer to the physical facilities which help the transmission of information
in the form of news and messages. The communication networks represented
on map/photograph are most of time influenced by both physical and human
factors. Some of them are discussed below:
• Relief: Steep slopes make the construction of roads and railway lines
expensive. On the other hand, valleys have swamps; they contain water
logged soils that are too soft to allow the movement of heavy objectslike trailers, lorries and trains.
• Climate: Too much rainfall results into floods and landslides and these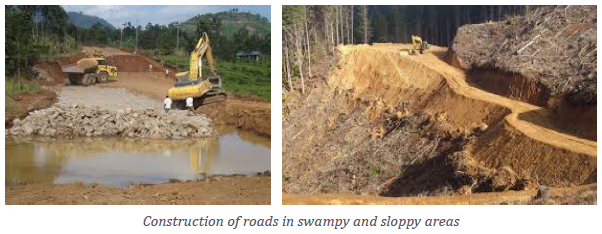
disturb land transport. On the other hand, accumulation of fog andclouds reduce visibility hence affecting air transport.
• Vegetation: Thick vegetation cover makes construction of road and
rail networks difficult because it requires uprooting big trunks of
trees. Areas with thick vegetation are invested with wild animals thatpose danger to the people.
• Drainage: Navigable rivers, lakes, seas and oceans provide natural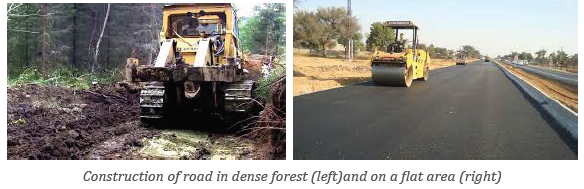
route-ways used for transportation.
• Topography: Mask towers for communication are usually placed on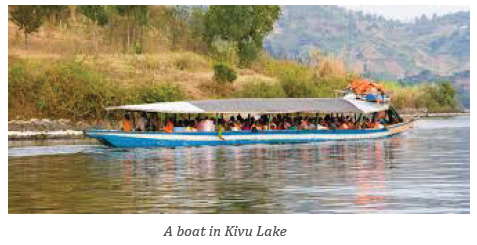
the top of mountain
• Economic activities: The economic activities (mining, agriculture,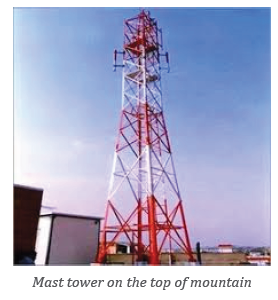
industries, etc) taking place in given areas influence the construct ofcommunication networks.
Application Activity 3.3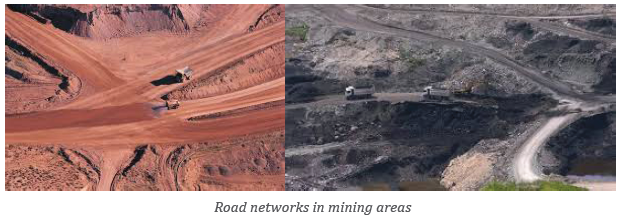
1. Identify several types of communication networks on any map/
photograph.
2. Explain how the identified communication networks are related to
physical and human features.
3. Move around your village and identify the existing communication
networks and explain their relationships with physical and humanfeatures.
Skills lab
Map interpretation is an important skill needed in different areas of life like
military, land mapping, tourism etc. Use the knowledge you have acquired in
this unit to draw a sketch map of your school, calculate its area and presentyour findings to the class.
End unit Assessment
1. “As it is difficult and costly to reach all parts of the world; the
photographs and maps help people most especially geographers to
explore different physical and human features of the earth.”a) Identify physical features on topographic map of Rwanda.2. Show different signs and symbols to be used in representing
b) Identify the human features on thematic maps of Rwanda.
physical and human features on maps/photography.
3. Examine the relationships existing between settlement patterns
and physical features in your district and present them on a sketch
map using signs and symbols.
4. Take photographs from different places in Rwanda, and prepare
a sketch map of captured physical and human features by usingconventional signs and symbols.
UNIT 4:THE UNIVERSE AND THE SOLAR SYSTEM
Key unit competency: The student-teacher should be able to establish
the difference between the universe and the solarsystem and their respective components.
Introductory activity
One of the students in senior one moved outside one evening and all of sudden
saw a running star that disappeared. The moon was fading, being covered by
dark clouds. He wondered whether there are moons elsewhere and went back to
bed. In the morning, the sunrise with golden rays replaced the dark and starry night.a) Identify the heavenly bodies mentioned in the passage.4.1. Definition and components of the Universe
b) Using your experience and the passage above, identify other componentsof the universe not mentioned in (a) above.
4.1.1. Definition
Activity 4.1
Study the photograph provided below and use it to answer the questionsthat follow:
a) Explain what the above photograph represents.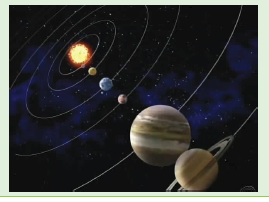
b) Using the above photograph, explain the meaning of Universe.
c) Identify the components of the universe.
The universe refers to all space and everything in it. It contains everything that
exists, from the smallest particles to the largest structures known. The exact
size of the universe is not known. Astronomers estimate that it contains about
100 billion galaxies. Astronomers are people who study bodies in the sky or
outer space and their behaviours.
4.1.2. The components of the Universe
The Universe contains many heavenly bodies, which vary considerably in size
from the smallest particles like dust to the largest particles like rocks, comets,
asteroids, moons, dwarf planets, planets, solar systems, stars and galaxies.
Galaxy: a galaxy is a group of billions of stars, with gas and dust held together
by the same gravitational force. The name of the galaxy in which our planet is
found is Milk way.
Cluster: This is a group of stars which are bound together due to gravitation.
A star: A star is luminous (gives out light) heavenly body that emits its own
light. Stars have high temperature. The sun is also a star.
A planet: a planet is a heavenly body that revolves around a star with a constantspeed and a specific time. E.g. Earth
Application Activity 4.1
Study the simple illustration provided below and use it to answer thequestions that follow:
a) Explain why we should love our universe.
b) Suppose you are asked by your friend, to describe and relate the aboveillustration with the earth, explain what your answers would be.
4.2. Solar system: sun and planets
Activity 4.1
1. Using the knowledge that you have in Geography, explain the
meaning of solar system and identify the elements or components
that form it, and share your finding in class.
2. Using internet, text books and other sources of geographicalinformation, research on the characteristics of sun and planets.
The term solar system is defined as the gravitational bound of the sun and
the objects that revolve around it. The solar system is therefore made up of
the following: the sun, planets and their satellites and other heavenly bodies
such as asteroids, comets, meteorites, meteors, etc.as it can be observed on thefigure below
4.2. Characteristics of different planets and their positions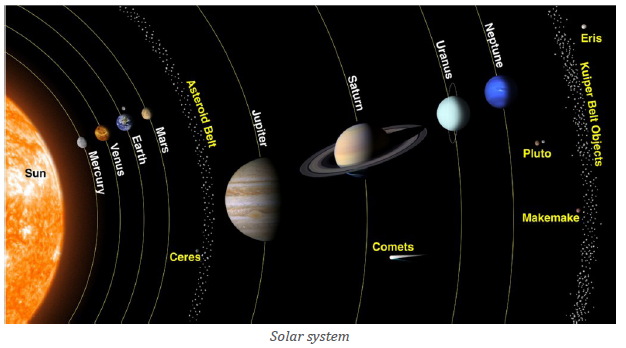
The term planet comes from Greek word ”planets” which means “wanderer”
and it refers to a round celestial (heavenly) body that revolves around the sun.
Planets are grouped into categories as discussed below:
Inner (terrestrial) planets of the solar system share the common
characteristics with the planet Earth, They are rocky and nearer to the sun. Theinner planets of the solar system are therefore Mercury, Venus, Earth and Mars.
Outer (Jovian) planets of the solar system have similar characteristic with
Jupiter, they contain small amount of rocky materials but much of their mass
is occupied by gases. The outer planets of the solar system are thus, Jupiter,
Saturn, Uranus and Neptune.
Pluto was also known as the ninth planet, but it was demoted to a dwarf planet
in 2006 and removed from the list of planets because it never developed fully.
The following are reasons why Pluto was disqualified:
i) Its size is too small to be classified as a planet.
ii) It has no uniform revolution around the sun.
iii) Its revolution is not circular but spherical in nature.
iv) Its movement is too slow when compared with the rest of the planets of
our solar system.
Application Activity 4.2
1. You are asked to address the geography students from other schools,
explain what you would tell them about characteristics of the planets
found in our solar system.
2. “The earth is the only planet that supports life” Explain why it is so
and show how you would ensure that it continues supporting floraand fauna.
4.3. Earth: Peculiar elements of the earth
Activity 4.3
Examine the illustration below and use it to answer the questions that follow: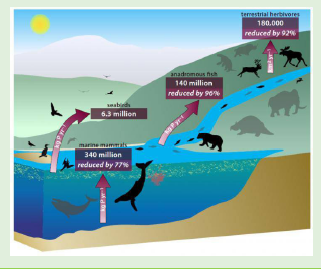
a) Using the illustration shown above, explain to your friend the
meaning of Peculiar elements of the earth.
b) Identify the componets of the earth that form its exterior part shown
in the illustration.
c) Discuss ways through which man can protect and conserve thepeculiar elements of our planet earth.
The peculiar elements of the earth are outer parts of the earth. They include
the following:
1) Hydrosphere or water bodies
2) Lithosphere or Land and rocks
3) Atmosphere or Gases4) Biosphere or flora and fauna
Peculiar elements of the earth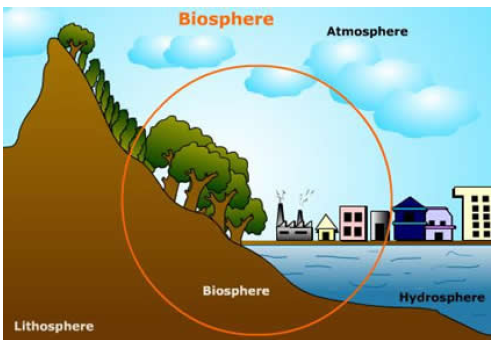
• Hydrosphere: This stands for all the waters found on the earth surface.
It covers 71% of the earth’s surface.
• Biosphere: This is a part of the earth that includes the totality of life
on the earth (Animals,Plants and Man).
• Lithosphere: This is the rocky part of the earth.
• Atmosphere: It is the gaseous part of the earth. It comprises all gasesthat can be found on the earth.
4.4. Earth’s movements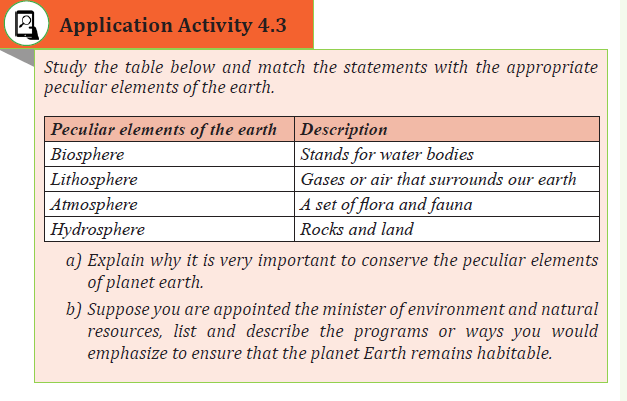
Activity 4.4
Read the following passage and answer the questions provided.
Every day the sun rises in the east and sets in the west. This process led
many people in the past to think that the sun is moving, and the earth
is fixed. The sun moves around the earth. But with the advancement of
science and technology, it has been proved that the sun itself is moving
and the earth is in a continuous motion. Later it has been revealed that
the sun does not move around the earth, rather the earth moves around
the sun.
Using the knowledge and skills acquired in previous studies answer the
following questions?
a) How many movements does the earth make?
b) Identify proof for the earth rotation and revolution.c) Describe effects caused by the above movements.
4.4.1. Rotation of the Earth and Associated Effects
Rotation of the Earth is defined as the movement of the Earth spinning on its
own axis. This movement of the Earth on its own axis is in an anticlockwisedirection. The earth takes 24 hours to complete its rotation.
The effects of rotation of the earth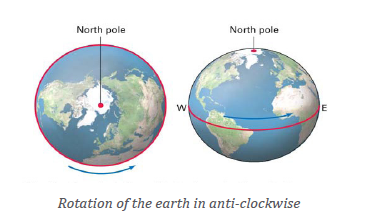
As the Earth turns around its axis, it affects some processes on the earth’s
surface. Some effects of the earth rotation are:
i) Rotation causes day and night.
Earth’s rotation on its axis creates day and night. The one half of the Earth that
faces the sun has day time, while the opposite half facing away from the Sunhas night time.
ii) Rising and falling of ocean water (tides)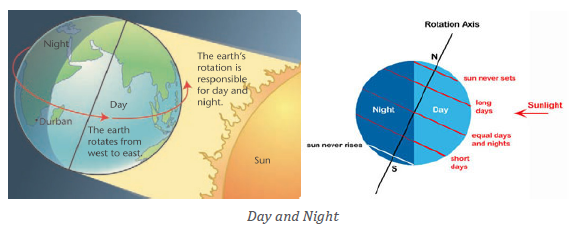
During the rotation of the earth, gravitational force of the sun and the moon
acts on the ocean water to produce tides which may be high or low tides.
iii) Deflection of wind and ocean current (Coriolis Effect)
Rotation causes winds to be deflected to the right in the Northern or to the
left in southern whenever they cross the Equator. This deflection is called theCoriolis Effect.
iv) Time difference between longitudes
One round of the Earth is completed after turning 360°.
This implies that, the earth takes 24 hours to complete its rotation.Therefore, in one hour the earth covers 150. This is calculated by:
12:00+2hours=14:00. The time at Kigali is: 14:00 PM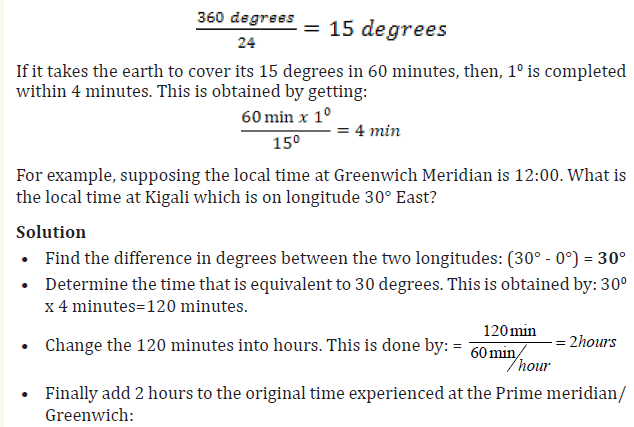
To find the local time of an area which is positioned in the west of the
given longitude, subtraction is used while when the local time to be
found is positioned east of the given longitude addition is used.
v) Temperature difference
Due to the spherical shape of the earth and the position of the sun, the parts of
the Earth located in the tropical areas between 23.5˚ North and South of Equator,
get direct sunlight all the year round. Regions located in higher latitudes get
less rays during the year.
4.4.2. Revolution of the Earth and Associated Effects
The revolution is the movement of the earth around the sun. Earth revolves
around the Sun along an oval-shaped path called an orbit. The earth takes 365days and 6 hours to complete one revolution.
The Leap year is the year with 366 days which comes every after four years.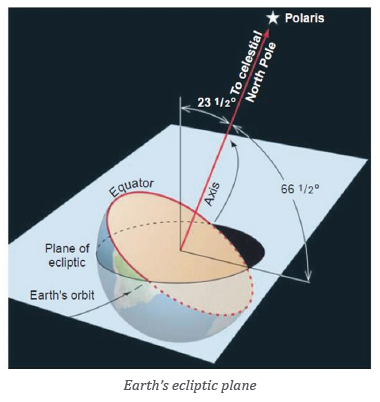
This results from adding 6 hours rotation of each year to make one day after 4
ordinary years.
The consequences of the revolution
i) Determination of seasonal variation
The earth’s revolution around the sun causes difference in seasons because
different parts experience differences in temperatures which lead to difference
in rainfall distribution. Summer is usually associated with much heat and
brightness and winter with coldness and rain.
ii) Varying length of day and night at different times of the year
The revolution of the earth around the sun causes variations in the length day and
night time over different latitudes. On 21st June when the sun is overhead at the
tropic of cancer, day time is longer than night time in the northern hemisphere
and the reverse takes place in the southern hemisphere. On 22ndDecember
when the sun is overhead at the tropic of Capricorn night time is shorter than
day time in the southern hemisphere and in the northern hemisphere nighttime is longer than day time.
iii) The beginning and end of the year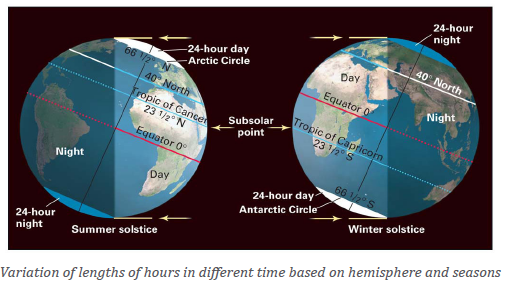
The earth revolves around the sun in a continuous way. When the earth
completes one revolution, it is referred to as one year. And the end of one
revolution marks the beginning of another revolution; hence the beginning andend of the year.
iv) Changes in altitude of the midday sun
Earth’s revolution exposes different parts of the earth to the overhead sun
differently because of the inclination of the earth’s axis. For instance parts
of the earth beyond the tropics never experience the overhead sun while the
equator and the tropics experience the overhead sun alternatively during theequinoxes and solstices.
4.5. Other heavenly bodies
Apart from the celestial bodies discussed above, other bodies include Asteroids,
Meteorites, Meteoroids, Meteors, Constellations, Comets and UFOs (unidentifiedflying objects).
Application Activity 4.4
1. Rusizi is 28 E and the time is 6:00 am. What is the time in a place
which is located at 60˚W?
2. What is the longitude of a place X whose local time is 11:00 a.m.
if the local time at longitude 30 E is 2:00 pm?
3. Explain why some parts of the earth’s surface are getting hotterthan others while others are becoming cool and cold.
End unit Assessment
1. Study the two photographs shown below.
a) Identify the heavenly bodies shown in the two photographs.
b) Mention and describe the heavenly bodies found in the universe that
are not shown in the two photographs.
c) Explain why the areas shown in the two photographs are all found
on planet earth yet having different habitable conditions.
d) Draw a program that can enable man to live in harmony with the
universe and the earth.
2. Read the story below and use it to answer the questions that follow:
Recently John and Mary went to visit their uncle in Rubavu. In the
afternoon of their second day, they were taken by their cousins to visit
the lake shores. Evening came, and the moonlight was so intense that
one could pick the smallest thing at that time. Suddenly, they saw water
extending in a rhythmic manner to the place they had made a camp fire.”
a) How could you use your knowledge to convince John and her sister
Mary that what happened was connected to the moon, sun and
earth’s rotation.
b) Suppose you want to build near the coastline, explain how the
knowledge and the skills acquired from the lesson on tides can guide you.UNIT 5:THE ORIGIN OF THE EARTH
Key unit competence: The student teacher should be able to discuss thetheories of the origin of the Earth.
Introductory activity
Using previous knowledge gained in Geography and other disciplines:
a) Explain how the Earth came into existence.
b) Identify the major characteristics of the earth.
c) Describe the internal structure of the Earth.
d) Find out and describe the various geological eras and periods recorded in history.
5.1. Theories of the origin of the earth: Big bang theory
and creation theory
Activity 5.1
Do the exercise shown below:
a) Collect the balloons provided and blow air in each of them.
b) Make sure the balloons are inflated to their maximum sizes.
c) Tie the ends of the balloons containing air to prevent it from escaping.
d) Press hard on the balloons to make sure that they burst.
e) Discuss most generally accepted hypothesis for the formation of theuniverse related to the practical exercise performed in (a-d) above.
In order to understand how the earth came into existence, we need to first
be aware of how the entire universe was formed since the earth is part of the
universe.
Scientists have tried to explain the origin of the earth. It is believed that the
earth and the universe were formed about 15 billion years ago. Some believe
that the earth was formed in a massive explosion known as the big bang and
others believe that the earth and the entire universe were created by God.
There are several theories advanced to explain the origin of the earth. However,
only two theories are going to be discussed: Big Bang theory and Creation
theory because they seem to be the most accepted.
5.1.1. The Big Bang Theory
According to this theory, the entire universe was at one time confined to a
heavy, hot, massive ball that disastrously exploded about 15 billion years ago.
The explosion propelled the materials in all directions away from the centre of
the explosion. This explosion was called the big bang and marked the beginning
of the universe.
The masses of gas from the explosion cooled and condensed to form the stellar
systems like galaxies that are always moving away from the centre of theexplosion in a centrifugal motion.
5.1.2. The Biblical or creation theory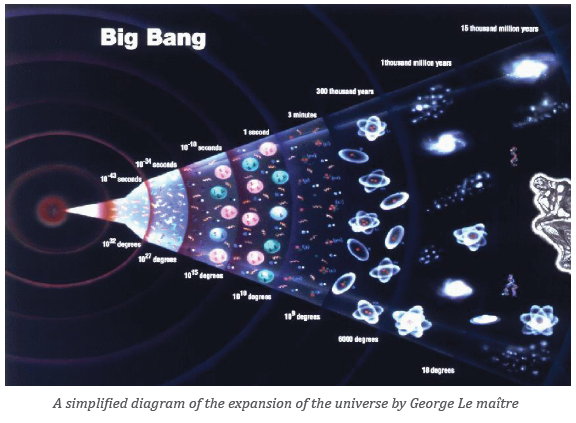
The biblical theory is based on the God’s creation story that is found in the first
chapter of the bible (Genesis). This chapter states that the earth was created by
God and draws the calendar of the whole creation process. The creation process
took place in six days.
On the first day, God created the day and the night.
• On the second day, He created the sky.
• On the third day, He created the land, water and the plants.
• On the fourth day, He created the sun, moon and stars.
• On the fifth day, He created the sea creatures and the birds.
• On the sixth day, He created animals of all kinds and human beings.
Therefore, according to this theory, the Earth and universe were all togethercreated by God.
Application Activity 5.1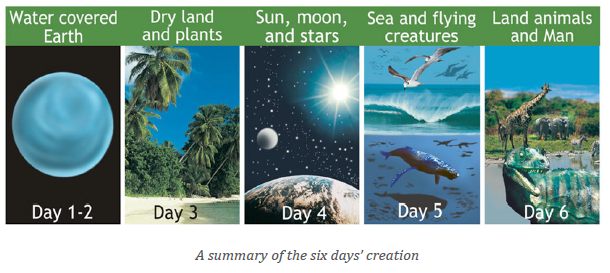
From the theories that you have learnt above;
a) Explain the difference between the Big bang theory and the Biblical
theory about the origin of the earth.b) Make a research on other theories of the origin of the earth.
5.2. Characteristics of the EarthActivity 5.2
Read the passage below and answer the questions asked
Far back in ancient times, everybody thought the earth was flat. If you are
in a boat way out in the middle of the ocean, the top of the water looks flat
in every direction and the sky seems to fit over it like an upside-down bowl.
The line where the sky and water meet is called the “horizon”. The horizon
looks like a circle with yourself at the center. If you are on land, the land
stretches out to a horizon also. The horizon on land, however, is not even.
It goes up and down because of houses, trees, hills, and other things. Some
ancient people suspected that the earth went on forever. They thought it
might be a huge flat piece of land and sea with no end at all.
a) What does the story above talk about?
b) How do you find the shape of the earth?
c) Find out the evidences advanced to support the most agreed shape of our planet.d) How big is the planet Earth?
5.2.1. The shape of the earth is spherical
1) The shape of the earth
Studies based on modern technology have proved that though the earth is a
sphere, it is not a perfect sphere but a geoid. This is because the observation
of the polar areas reveals that they have a flat landscape, at the same point theequatorial areas have a bulging appearance as shown below:
2) Evidences showing that the earth is spherical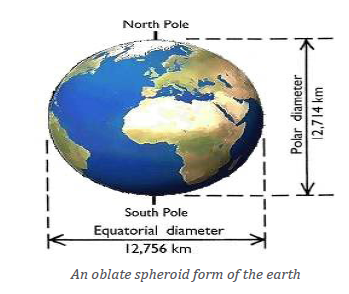
There are several evidences to prove the spherical form of the earth:
─ The circumnavigation: If one travelled across the world along the
straight path without stopping would come back to the point of origin
where the journey started from.
─ Images from the space: Photographs taken from space by satellites
show that the earth’s surface is curved (spherical shape).
─ The view of other planets: All observations from telescopes reveal that
the planetary bodies are spherical from whichever angle. Therefore,
since the earth is one of them, its shape is also spherical in nature.
─ The shadow of the earth during eclipses: The shadow resulting from
the eclipse of the moon (Lunar eclipse) shows that the earth is round
and only spherical objects can cast a round image.
─ Day-night and seasonal change: The earth’s tilted axis produces
seasonal climatic conditions and gives days and nights of varying length.
If the earth was at right angles to the sun, the day and the night would
always be of equal length, and there would only be one season throughout
the year.
─ The size and diameter of the earth: The earth’s equatorial diameter
and circumference are much bigger than those of the polar areas.
─ The sun rise and sun set: If the earth was flat, the sun would rise and set
at the same time in all countries. But, the sun rises and sets at different
times in different places.
─ The ship sailing away from the coast: The lower parts of a ship that
is moving away from the coast disappears before the upper parts. Thefigure below helps to understand this evidence:
─ The view of circular horizon: The distant horizon viewed from the top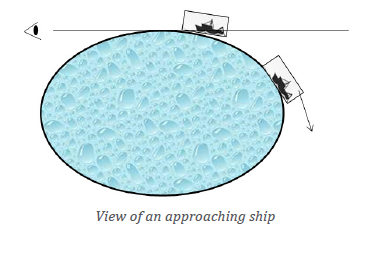
of a hill or deck of a ship at a sea is always circular in shape.
5.2.2. The Earth’s size: radius, diameter, circumference, volume and mass
• The average radius of the earth is 6,371 km.
• The Earth’s equatorial diameter is 12,756 km while the polar diameter
is 12,714 km.
• The Earth’s circumference at the equator is 40,075 km. From pole topole, its circumference is 40,008 km.
The size of the Earth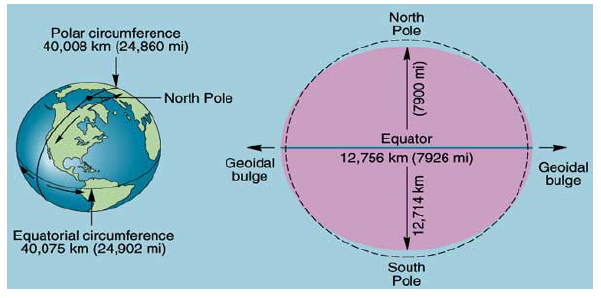
• The Earth’s volume is 1.08321×10¹² km3
• The Earth’s mass is 5.9736 x 1024 kg.
• The Earth’s density is 5.52 g/cm3.
• Gravity of the earth is approximately 9.8 m/s2
Application Activity 5.2
Study the illustration provided below and use it to answer the questions
that follow:
─ Use an egg, a piece of thread, a ruler and markers.─ Mark that egg following the marks in the illustration below.
a) With reference to the divisional lines drawn on the illustration above,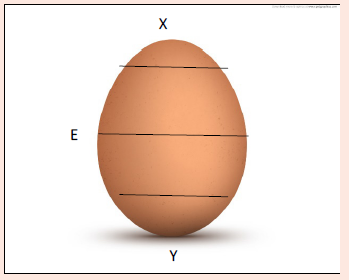
use the egg provided to measure the diameter and the circumference.
b) From your findings above, describe the shape of the earth.
c) Assume the above illustration stands for our planet earth, name X, E
and Y, and indicate the size of E:
i) X: …………………………………………………………
ii) E: ……………………………………………………………...iii) Y: …………………………………………………………….
5.3. The internal structure and mineral composition of the earth
Activity 5.3
1. The study of the earth’s environment cannot be complete without
understanding the nature of the earth’s interior structure. What do
you know about the interior of the earth?
2. Using the knowledge acquired so far, study the illustration given belowand give names of layers represented by figures.
a) Name the parts of the earth corresponding to numbers, 1,2, 3a,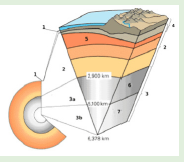
3b,4,5,6 and 7.
b) Describe the characteristics of the parts you have named.
3. Carry out a research to find the main mineralogical composition of
the earth.
5.3.1. The internal structure of the earth
The layers of the Earth’s interior include the crust, mantle, liquid outer core,
and solid inner core. The interior structure of the earth is layered in concentric
shells:
i) An outer silicate solid crust,
ii) A highly viscous mantle,
iii) A viscous outer core,
iv) A solid inner core.
The figure below depicts the main layers of the Earth’s interior part and theirrespective properties.
1) The crust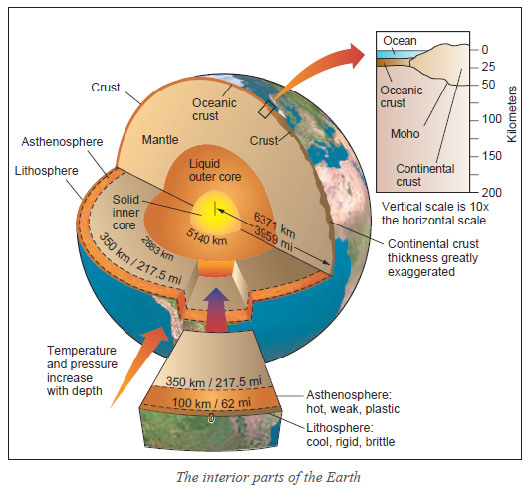
The crust is the outermost layer of the Earth. It is also referred to as the
lithosphere. The crust is divided into two types, the oceanic crust and the
continental crust:
• Oceanic crust (SIMA) is a layer consisting mainly of basalt, averaging
6-10 km. in thickness.
• Continental crust (SIAL) is layer consisting mainly of granite; it can
be up to 70 km thick. The crust is separated from the mantle by the
Mohorovicic discontinuity.
2) The Mantle
The mantle is composed mainly of silicate rocks, rich in iron and magnesium.
The mantle is under the crust. It is composed of rocks that are in a semi-molten
state. They are mainly composed of Ferro magnesium silicate (iron, magnesium)
minerals.
The mantle is divided into two main parts, namely the upper mantle and the
lower mantle:
• The upper mantle: It is a layer of less rigid and more plastic rocks. It
extends from Repeti discontinuity to the depth of 1,000 km.
• The lower mantle: It goes from 1,000 km to 2,900 km in depth. At this
depth the lower mantle is separated from the outer core by Gutenberg
discontinuity.
3) The core
The core is composed of outer core and inner core.
• The outer core is liquid and kept in a semi-molten state
• The inner core is solid and made mostly of nickel iron and with some (NIFE).
The figure below shows the relative depth of different internal layers of the
earth. Inner core and outer core are separated by Lehman discontinuity.
In geology, the term “discontinuity” is used for a surface at which seismicwaves change velocity in interior of the earth.
5.3.2. Chemical composition of the Earth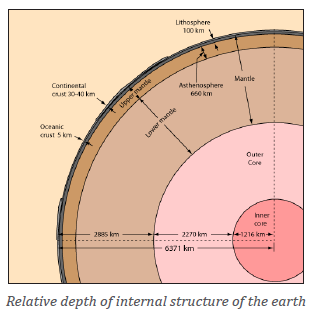
Earth’s crust
The most common chemical elements in the crust are oxygen (gas) (46.6%),
with mineral such as silicon (27.7 %), aluminum (8.1 %), iron (5.0 %),
calcium (3.6 %), potassium (2.8 %), sodium (2.6 %), and magnesium (2.1%).
Continental crust is dominated by Silicon and Aluminum minerals (SIAL),
whereas the oceanic crust has Silicon and Magnesium is large proportion.
Earth’s mantle
In terms of its constituent elements, the mantle is made up of 44.8% oxygen,
21.5% silicon, and 22.8% magnesium. There’s also iron, aluminum, calcium,
sodium, and potassium. These elements are all bound together in the form of
silicate rocks, all of which take the form of oxides.
Earth’s core
The Inner core has 20 % Nickel and 80 % Iron whereas proportions ofminerals in the outer core amount, for Nickel: 2 %, Iron: 86 %, Sulfur: 12 %
Application Activity 5.3
Apply the knowledge you have acquired in this lesson to answer the
following questions:
1) Suppose you are asked to describe how Mount Muhabura is related to
the internal structure of the earth, what would be your response?
2) The earth’s crust is composed of many minerals. Indicate its mostcommon chemical elements.
Skills lab
Visit one of the neighbouring schools in your area and discuss with the studentsaround about the shape of the earth using the knowledge gained from this unit.
End unit Assessment
1. Read the following discussion between two students and answer
the questions asked:
Two students Mugisha and Uwamahoro were discussing about the origin
of the earth. Mugisha said that the earth and other celestial bodies came
into existence in different ways: some were formed due to the collision
of stars, others by explosion. With confidence, Uwamahoro said that
everything in the universe was created by God.a) Who is right, who is wrong?2. The physical features of the earth are changing day by day due to
b) Explain the biblical theory of the origin of the earth.
natural reasons and human activities. Suggest ways which people
can use to conserve the nature for its sustainability.
3. Geologists and archaeologist are directly involved in carrying
out excavations (digging) that make their research successful in
discovering new fossils in different places on the Earth. Suggest the
ways in which humans should protect the environment for the sakeof promoting such archaeological research.
UNIT 6:INTERNAL LANDFORM PROCESSES
Key unit Competence: The student-teachers should be able to examine
the internal processes responsible for theevolution of different relief landforms.
Introductory activity
In reference to the diagrams above showing the internal landforms’ processes;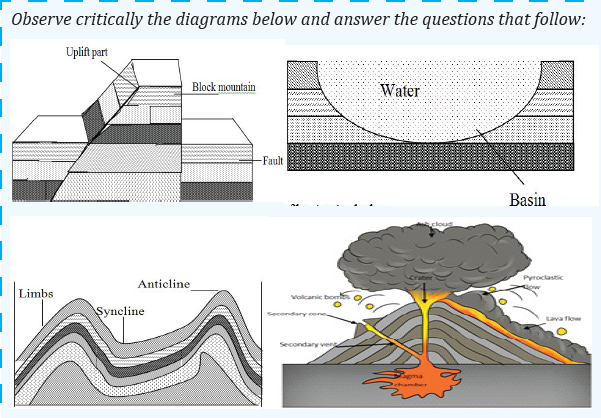
answer the following questions:
a) Identify the internal processes associated with each diagram illustrated
above.
b) Describe how the internal processes lead to the formation of various
relief features.
c) Identify the effects of the features resulting from internal processes onhuman activities.
6.1. Faulting
6.1.1. Faulted landforms and forming processes
Activity 6.1
Using textbooks, internet, and other resources of geographical information
research on:
1. Meaning of the faulting and fault
2. The processes responsible for the formation of different faulted
landforms
(i) Meaning of faulting and fault
• Faulting is the process through which the rocks of the earth’s crust
crack or fracture due to tectonic forces as accompanied by displacement
of blocks. The direct effects of faulting include the formation of rift
valley, block mountains, fault scarps,
• A fault is a fracture in the crustal rocks where the rocks are displaced
along a plane called a fault plane. A fault is also considered as a rupture
or fracture of rock strata due to strain, in which displacement isobservable.
ii) Forces causing faulting
Faulting is the fracturing of the crustal rocks due to the influence of endogenic
forces or processes. Endogenic forces are responsible for various types of vertical
irregularities that give birth to numerous relief features including mountains,
plateaus, plains, lakes, faults and folds. The endogenic forces include faulting,
folding, warping, vulcanicity and earthquake.
iii) Main parts of a fault
The process of faulting is caused by tensional and compressional forces. When
these forces act on crustal rocks of the earth’s crust, they develop stress in them
and break along the zone of maximum tension. The rocks are then removed
from their original position either upwards, downwards or horizontally.
When a rock is displaced upward it is called up throw, and the downwarddisplacement is called down throw.
The main parts of a fault are (1) the fault plane, (2) the fault trace, (3) the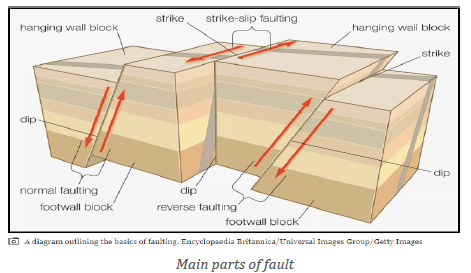
hanging wall, and (4) the footwall. The fault plane is where the action is taking
place. It is a flat surface that may be vertical or sloping. The line it makes on
the earth›s surface is the fault trace. Where the fault plane is sloping, as with
normal and reverse faults, the upper side is the hanging wall and the lower side
is the footwall. A strike is the direction of the fault trace on the earth›s surface.The dip is the measurement of how steeply the fault plane slopes.
Application Activity 6.1
Basing on the knowledge and skills acquired from the above lesson,describe the area where the faulting process occurred.
6.1.2. Types of faults
Activity 6.2
Observe the diagrams below and use other geographical resources toanswer the questions that follow:
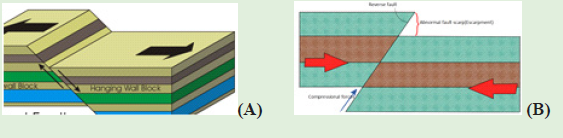
Faulting results into numerous types of faults briefly described in the following: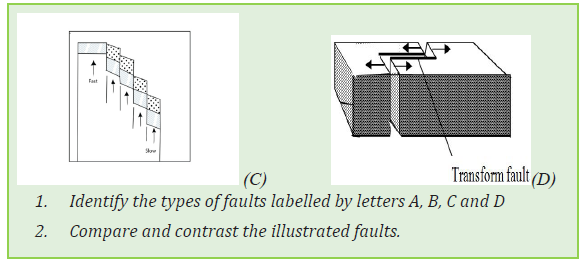
i) Normal faults/consequent fault lines are formed due to the tensional
forces that lead to opposite displacement of the rock blocks. The steepscarp resulting from normal faults is called fault-scarp or fault-line scarp.
ii) Reverse faults/ obsequent fault lines are formed due to compression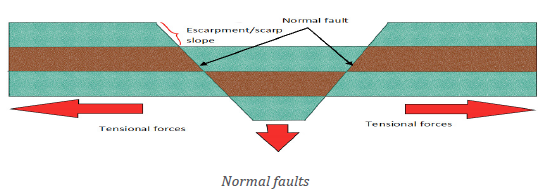
forces that lead to the movement of the fracture rock blocks towardseach other. The fault plane in a reverse fault is usually inclined.
iii) Lateral or strike-slip faults are formed when the rock blocks are
displaced horizontally along the fault plane. They are called left-lateral or
sinistral faults when the displacement of the rock blocks occurs to the lefton the other side of the fault, they are called right-lateral or dextral faults.
iv) Step faults are formed when a series of parallel faults occurring in an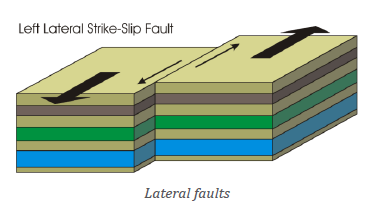
area in such a way that the slope of the entire fault planes of the faults arein the same direction.
v) A thrust fault refers to a reverse fault in which the dip of the fault plane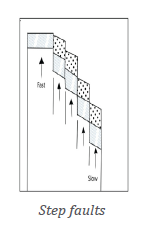
is at a small angle to the horizontal and it is caused by strong crustalcompressional forces.
Application Activity 6.2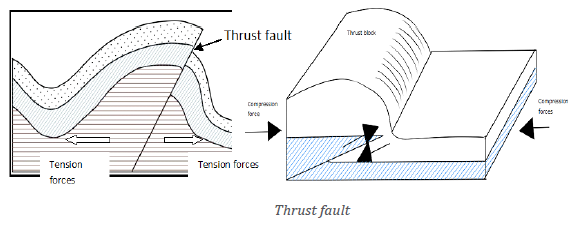
Basing on the knowledge and skills acquired from the above lesson,describe the area where the faulting process has occurred in Rwanda.
6.1.3. Influence of faulting on landscape and drainage
Activity 6.3
Kwigira and Mahoro are students from GS Terambere. They visited Lake
Kivu and its surrounding area in western part of Rwanda. Back to school
they were told to make description of the area visited. In the description
they included: Lake Kivu and other different relief features around. They
said that their teacher called Bumwe who accompanied them explained
how Lake Kivu was formed. He said that Lake Kivu was formed in the
same way as Lake Tanganyika, Eduard, George, Manyara and Turkana
in East Africa. Furthermore, the teacher told them that there are other
landforms which resulted from faulting in Africa and the World. Based on
this story to answer the following questions:1. Describe the impact of faulting on landscape of the area visited by
Kwigira and Mahoro.
2. Examine other landforms produced because of faulting not
mentioned in the passage above.
3. Assess the impact of faulting on drainage system.
i. Influence of faulting on landscape
There are several landforms produced by faulting. They include rift valleys,
fault scarp, escarpments, block or Horst Mountains, fault guided valleys, titled
block/landscape and Grabens which host rift valley lakes.
Rift Valley
Rift valley is a trough or hollow/depression (Graben) which may result from
both tensional and compressional forces. It is formed when two faults aredeveloped parallel to each other.
Various theories have been put forward to explain the formation of a rift valley.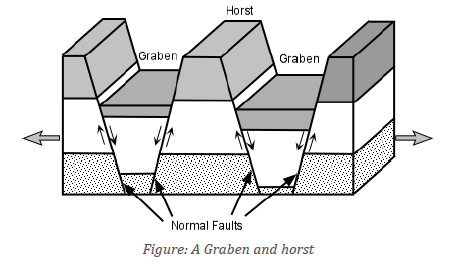
They include tensional theory, compressional theory and differential up-lift
theory. They description is briefly described in the following
Formation of the rift valley by tensional forces (Tensional theory by J. W.Gregory)
Rift valley is formed when tensional forces move away from each other. These
tensional forces produce faults and the block (part of the crustal block) between
two parallel faults subsides to form a rift valley, while the outer blocks remainstanding to form escarpments.
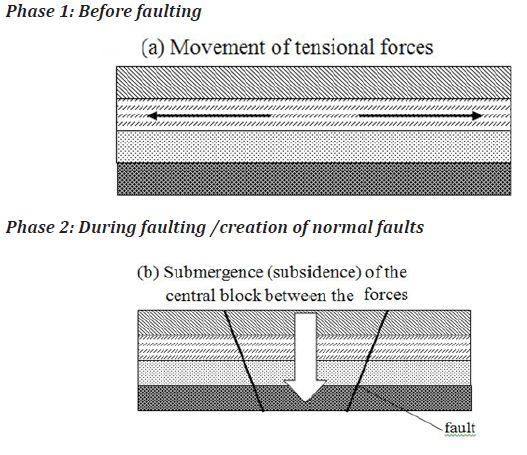
Formation of the rift valley by compressional forces (Compressional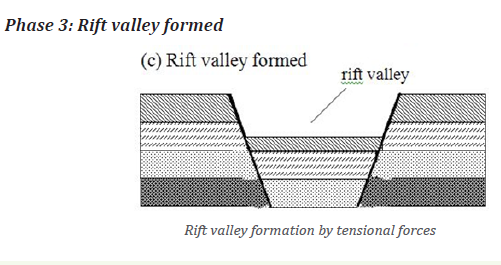
theory by E.J. Wayland)
Rift valley is formed when horizontal forces act towards each other. These
forces push the crustal rocks or layers towards the center from all sides.
These forces of compression produce two parallel faults and the pieces of land
on either side are lifted above the general level of the ground to form a rift
valley. How the affected rocks respond to compressional forces depends on
how brittle (breakable) the rocks are and the speed with which the forces are
applied. Brittle (rigid) rocks will break down and result in formation of faults.
This process is known as faulting. Folding, which is a bending or wrinkling
of rock layers, occurs when compressional forces are applied to rocks that are
ductile (bendable), as opposed to brittle.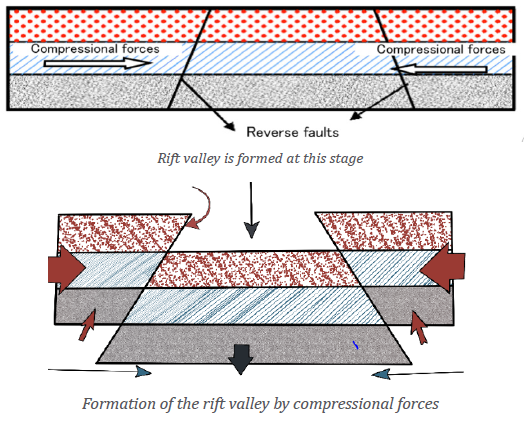
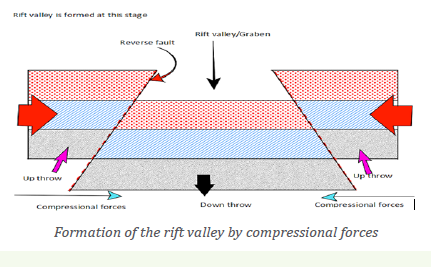
Theory of differential uplift (by Dixey and Troup)
Rift valley is formed when normal faulting produces several normal fault lines
followed by gradual up lift of the faulted area with several step faults. Typical
example is Kedong in the part of Nairobi.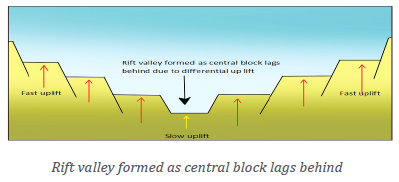
Theory of crustal separation/Plate tectonics theory
This is formed in manner of sea-floor spreading or tectonic movement, where
convectional currents within the mantle rise vertically and then divert from each
other horizontally. This results to the dragging of oceanic or continental plates.
Such results into breaking of crustal layers that are dragged apart together
with continental rafts. As movement continued the central block was forced to
subside. For example, the separation of Arabian block from East African block
show the closeness of continental drifting that seems to be taking place in East
African Rift valley.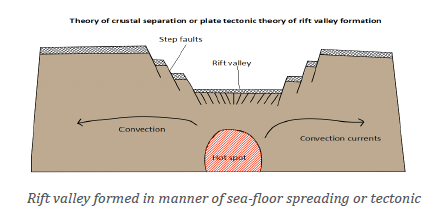
ii. Influence of faulting on drainage
The following is the influence of faulting on drainage system:
• There is development of specific types of drainage patterns in a
given area. These include rectangular, parallel and trellised drainage
patterns.
• Formation of fault guided valleys. In this case, rivers flow following
the layout of the fault guided valley. A good example is River Rusizi in
western Rwanda.
• River reversal (change of direction). Example is River Katonga and
Kafu in western Uganda that were joining the Congo River basin and
reversed towards Victoria basin.
• Rift valley lakes are formed when graben or rift valleys are filled by
water. Typical examples include: Lake Kivu, Eduard, Albert, George,
Tanganyika in western arm/branch of East African rift valley, Turkana,
Manyara, Nyasa, Magadi in Eastern arm/branch of East African rift valley.
• Waterfalls in faulted areas such as Rusizi, Mururu in Rwanda and
Mubuku water falls in South Western part of Uganda.
• Rising of the underground water table along fault planes. Typical
examples are Mwiyanike, Nyamyumba in Rwanda.
Application Activity 6.3
Explain the influence of faulting on landscape and drainage system in the
context of Rwanda.
6.2. Folding and warping
Activity 6.4
Read the passage below and provide answers to the question that follow:
The relief of Rwanda is characterized by six topograhic units that include
Bugarama plain and Lake Kivu Banks, Congo-Nile crest, Central plateaus,
Eastern low lands, Buberuka region and the Volcanic region. Some of these
topographic units were formed through faulting process as it was explained
in the previous lesson. Those topographic units formed as result of faulting
include Bugarama plain and Kivu banks. On the other hand volcanicity
has been responsible for formation of volcanic relief in Northern, while the
Eastern lowlands resulted from warping. Some landforms of Rwanda were
formed through folding process.
1. Refer to the above presented passage to answer the following questions:
a) Explain the folding processes
b) Differentiate the folding processes from other internal processes in the passage.
2. Suggest the impact of folding process on any landscape you have
observed.
6.2.1. Folding and its process
(i) Meaning of folding and folds
Folding is a process by which crustal rocks bend due to compression forces. This
results from horizontal movement caused by the endogenic forces originating
deep within the earth.
Folds are the wave-like bends resulting from folding processes. The up-folded
rock strata in arch-like forms are called anticlines while the down folded
structure forming trough-like feature is called syncline. The sides of a fold are
called limbs of the fold.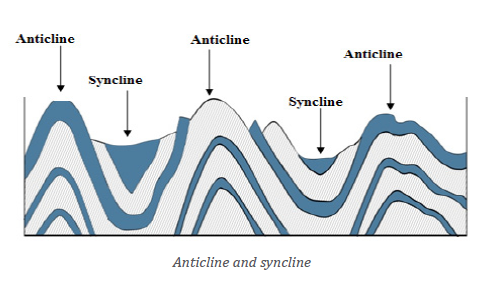
(ii) Processes of folding
The processes of folding are mainly engineered by the presence of compressional
forces that push intensely the crustal layers towards a common centre. It occurs
in areas with soft and young rocks and instead of fracturing due to internal
forces or convectional currents that lead to formation of compressional forces
the crustal layers start to bend.
(iii) Types of folds
Based on the inclination of the limbs, folds are divided into the following
categories:
a) Symmetrical folds are formed when compressional forces work
regularly but with moderate equal intensity. Symmetrical folds are very rare.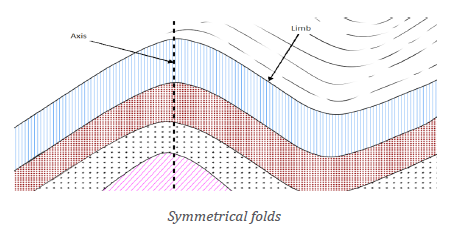
b) Anticlinal fold: This is a fold that has the convex appearance and has its
oldest beds at its core.
c) A syncline fold: This is a fold with younger layers closer to the center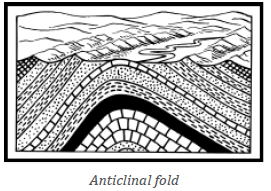
of the folded structure. Synclines are typically a downward fold, termed
as syncline (i.e. a trough) but synclines that point upwards can be foundwhen strata have been overturned and folded.
d) Asymmetrical folds: These are formed when there the compressional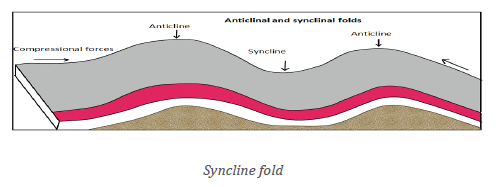
forces acting upon the crustal young layers are unequal. One side isintensely pushed while the other is moderately compressed.
e) Over fold: This is a type of fold formed where the compressional forces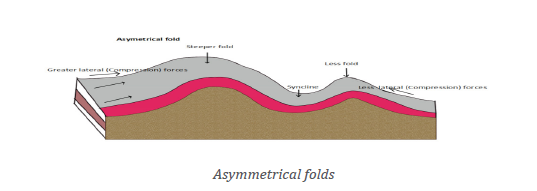
push with great intensity one limb to the extent of the land folding so muchthat the anticlinal part or crest is pushed over the would-be syncline.
(iv) Influence of folding on drainage and landscape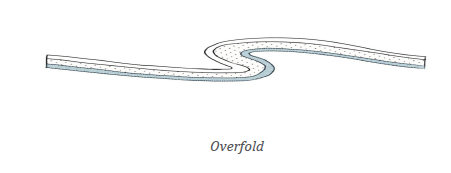
a) Influence of folding on drainage
The following are ways through which folding has influenced drainage:
• Formation of various water falls in Rwanda and elsewhere in the
World. Some of the waterfalls are located on the upward folded areas.
A good example is Rusumo water fall.
• Fold Mountains are good catchment areas. A typical example in Rwanda
is in Gicumbi District.
b) Impact of folding on landscape
There are various landforms resulting from folding. These include the following:
i) Rolling plains: These types of landforms result from down warping
movement caused by the folding processes. They have gently sloping
anticlines with very wide synclines.
ii) Ridge and valley landscape: The strong compressional forces create
a series of asymmetrical folds. The anticlines form the uplands (ridges)
while the synclines form the valleys.
iii) Fold Mountains: The mountains rise to different heights depending onthe velocity and intensity of compressional forces.
6.2.2. Warping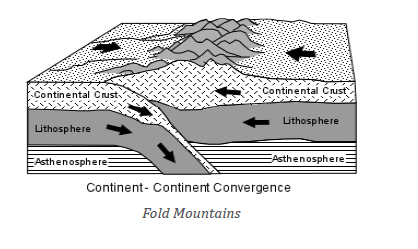
i) Meaning of warping
Warping is the downward movement of crustal rocks caused by sinking
convectional currents within the interior part of the earth. This results into
formation of a saucer-shaped basin. A typical example where warping took
place in East Africa is Lake Victoria basin.
ii) Types of warping
There are two types of warping:
a) Down warping: This is formed when the sinking convectional currents
drag down wards the lower part of the crust. Therefore, the crustal layers
bend inwardly to form basins. This created East African major basins i.e.
the depressions occupied by Lake Victoria, lake Kyoga in Uganda and Lake
Muhazi in Rwanda are good examples.
b) Up warping: During the down warping the outer parts of the crustal layers
tend to move upwards. This is commonly caused by isostatic movement
associated with upward movement. This produced up land regions likeEast African plateaus and other uplands elsewhere in the world.
c) Broad warping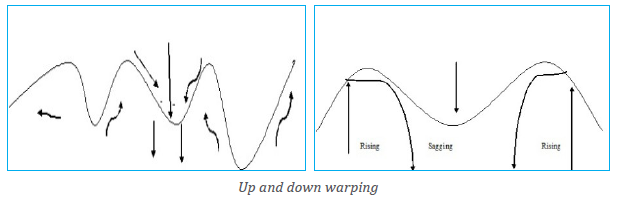
When the process of up warping and down warping affects larger areas, the
resultant mechanism is called broad warping.
iii) Causes of warping
Warping is mainly caused by convectional currents that result into lateral
compressional forces of low intensity. Typical examples are common in East
Africa where few areas escaped the down warping and up warping process.
The resultant impact on the landscape of Africa is evidenced by: African Basins,
crustal warped lakes, extensive swamps around the lakes, extensive plateaus,
reversal of some rivers, etc.
(iv) Landforms associated with warping
The process of warping led to formation of numerous landforms which include
the following:
a) Plateau: It is a large, extensive uplifted part of the earth’s crust
which is almost flat at the top. The top of the plateau is mostly plain.
Examples include: Eastern plateaus of Rwanda, Guinea highlands,
Jos plateau (Nigeria), Ahaggar (north centre of Sahara), etc.
b) Basin: It is a large and extensive depression on the earth’s surface.
Most basins are formed due to vertical downward movement of theearth’s crust.
Examples of basins include: Congo basin, Chad basin, and Amazon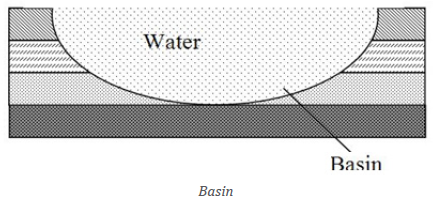
basin. When a basin is filled by water; it forms basin lakes like Lake
Muhazi and Mugesera in Rwanda, Lake Victoria, etc.
c) Plains: These are flat areas that are in lowland areas. Typical
examples are generally in coastal regions that were greatly affectedby warping process.
(v) Influence of warping on drainage
The following is the influence of warping on drainage:
• Some rivers change their courses due to warping in a given area. A
good example is the case of hydrography of East Africa where some
rivers changed direction and other filled depressions to form lakes.
• Formation of many lakes in East Africa. Good examples include: Lake
Victoria and Lake Kyoga in Uganda, Lake Muhazi and Mugesera in
Rwanda.
• Presence of waterfalls which are located on the upward warped areas.
• The drainage of Rwanda flows from west to east from the up warpedfeatures of Rwanda.
Application Activity 6.4
1. “Some parts of East Africa have been affected by up warping and
down warping.” With relevant examples support this statement.
2. Draw a sketch map of Rwanda, on it label and name the majorlandforms which resulted from warping.
6. 3. Vulcanicity and earthquakes
6.3.1. Vulcanicity
(i) Processes of vulcanicity and volcanicity and associated materialsActivity 6.5
1. Identify and explain the process illustrated in the above figure.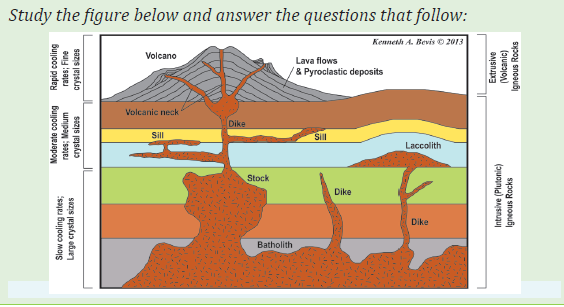
2. Suggest the materials which are ejected out associated with the process
identified in (1) above.
Terms used in vulcanicity
The following are the key terms used in vulcanicity studies:
• Vulcanicity refers to the processes from which the molten materials
are either ejected on the surface of the earth or remain in the earth’s crust.
• Volcanicity refers to the process by which lava through volcanic
eruption is ejected to the earth’s crust.
• A volcano is a mountain that opens downward to a reservoir of molten
rock below the surface of the earth.
(ii) Materials of vulcanicity
Volcanic materials of various types are ejected through the volcanic pipe known
as a vent. This is situated in the part of fault line that assisted the escape of
magma. Volcanic materials include the following:
• Vapour and gases: Stream and vapour include phreatic vapour and
magmatic vapour. Volcanic gases include carbon dioxide, nitrogen
oxides, sulphur dioxide, hydrogen and carbon monoxide.
• Magma and lava: Molten rock materials are called magma when they
are still below the earth’s surface. When they reach the earth’s surface,
they are known as lava. Lava and magma are grouped into two classes.
These include the following:
i. Based on silica percentage; lava and magma are divided into two
groups: acidic magma (high percentage of silica) and basic lava
(low percentage of silica).
ii. Based on light and dark coloured minerals; lava and magma are
also classified into Felsic and Mafic lava.
iii. Based on size of pyroclastic materials: These are grouped into four
kinds:
─ Volcanic dust (finest particles)
─ Volcanic ash (2 mm in size)
─ Lapilli (of the size of peas), and─ Volcanic bombs (6 cm or more in size).
Application Activity 6.5
1. Describe the main materials derived from vulcanicity.2. Name and locate the volcanoes available in Rwanda.
(iii) Intrusive and extrusive features
Activity 6.6
Critically observe the photograph shown below and use it to find answersto the questions that follow:
Basing on your observation of the above photograph and the previous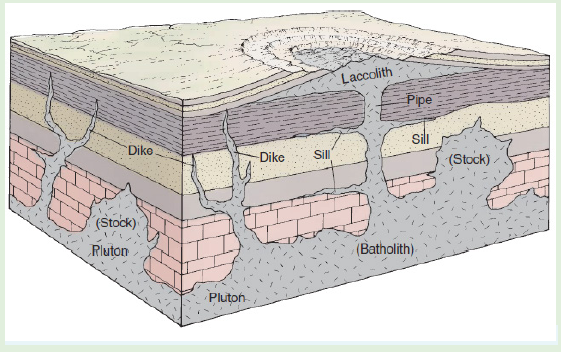
lessons on relief features of Rwanda studied in year one, describe the
landforms of volcanic region of Rwanda.
Magma found inside the crust may sometimes reach the surface of the crust
through fracture, fissures and consolidate from there. In this case the features
formed are extrusive features. But when magma fails to reach the earth’s
surface and consolidate inside the crust before reaching the surface; thefeatures formed will be called intrusive features.
i. Extrusive volcanic features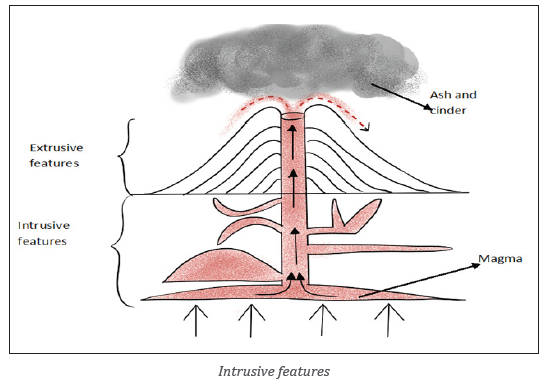
These features include the following:
a) Volcano: This is a mountain that opens downward to a reservoir of
molten rock below the surface of the earth. Unlike most mountains which
are pushed up from below, volcanoes are formed when molten rock
escapes to the earth›s surface. This solidifies to form highland known as
volcanoes.
b) Acidic lava cone: This refers to a cone made of viscous lava normally
that is ejected out of the earth’s crust and solidifying faster as soon as it
reaches the Earth’s surface. It always cools faster than basic lava becauseit is viscous in nature.
c) Basic lava cone: This is a cone of basic fluid/lava spread over a long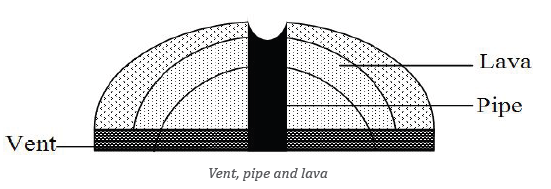
distance. Basic lava cone is characterized by gentle slope. Basic lava cone
is also known as shield or basalt volcanoes. Typical examples includeNyamuragira in DRC and Muhabura volcanoes in Rwanda.
d) Crater: This is a volcanic depression on top of the volcano. When a crater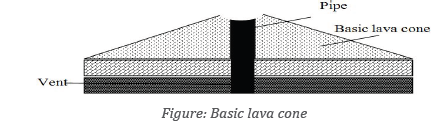
is filled by water, it forms Crater Lake. Examples of crater lakes in Rwandaare found on Kalisimbi, Muhabura and Bisoke volcanoes.
e) A caldera: This is a wide depression that forms on top of a volcanic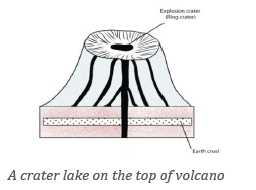
mountain due to explosive eruption or secondary eruption. When a
caldera is filled with water, a Caldera Lake is formed. Typical example of
dry caldera is Ngorongoro Caldera in Tanzania.
f) Ash and cinder cone: These are formed when lava is ejected into the air
violently, breaks into small particles known as Ash and cinder. These fall
back and pile up to form alternating layers of ash and cinder. These haveslopes that are importantly concave and asymmetrical in nature.
g) Volcanic plateaus: These are formed when there are various fissures or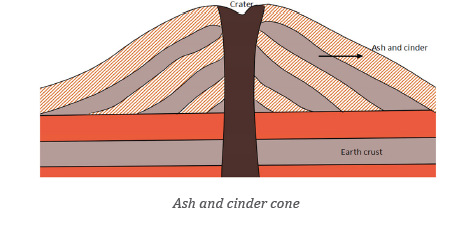
vents and basic lava flows out spreading to a wide area. This results into
the formation of a flat-topped highland known as volcanic plateau. Typical
examples of lava plateaus are found in Musanze, Nyabihu, Rubavu, Burera
(North Western part of Rwanda), Ethiopian highlands, Deccan plateau in
India and Bui plateau in Nigeria, Shirasu-Daichi in Japan and the NorthIsland Volcanic plateau in New Zealand.
h) Volcanic plug: This is also called a volcanic neck or lava neck, is a volcanic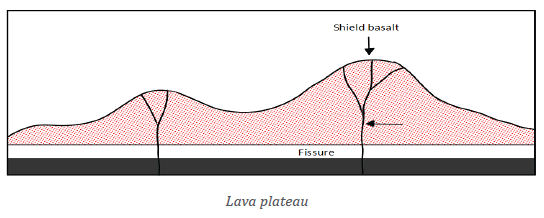
feature created when magma solidifies within a vent and later the softlayers of rocks surrounding it are eroded away.
(ii) Intrusive vulcanic features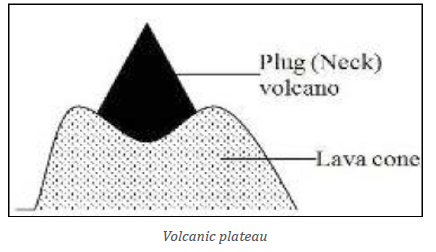
This is a type of vulcanicity where magma does not reach the earth’s surface
but cools and solidifies within the crustal rocks.They include the following, Lava flow, laccolith, Volcano, Dyke, Lapolith, sill, etc.
a) Batholith: This refers to large dome-shaped intrusion of magma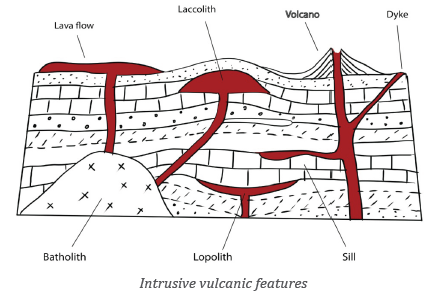
extending to great depth within the earth’s crust. Batholiths are formed
deep below the surface when large masses of magma cool and solidify.These may later be exposed because of erosion to form in inselbergs.
i) Laccolith: It is a dome-shaped intrusion of magma formed when the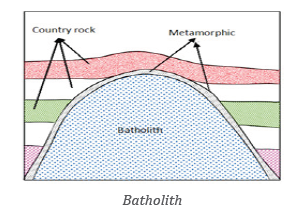
magma cools and solidifies in anticline bedding plane.
ii) Phacolith: This islens-shaped mass of igneous rock formed when magma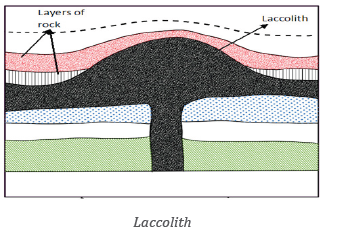
cools and solidifies at anticline and syncline in folded rocks. Phacolith ismuch shallower.
iii) Lapolith: It is a large saucer-shaped intrusion formed when magma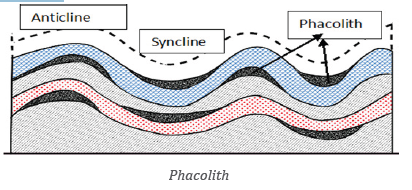
(molten rocks) cools and solidifies in a syncline bedding plane. Lapolithsform shallow basins along the rock bedding plane.
iv) Sills are horizontal intrusions of magma which have solidified along the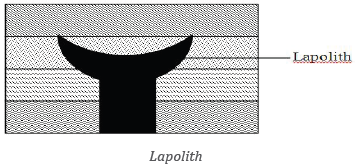
lines of bedding planes.
v) Dykes: These are vertical intrusions formed when magma solidifies in a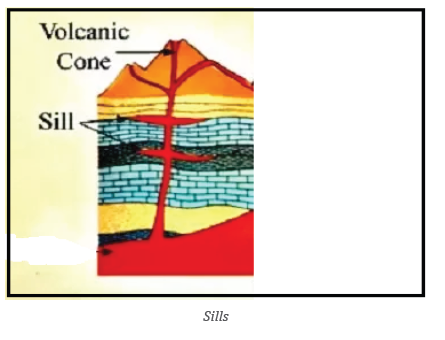
vertical manner or within the vent and subsidiary vents.They cut across
the bedding planes of the crustal rocks into which they have been intruded.
Dykes often occur in groups where they are known as dyke swarms.
Application Activity 6.6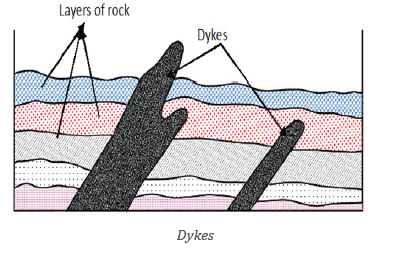
With the help of diagrams, differentiate intrusive and extrusive volcanic
landforms.
i. Types of volcanoes and their characteristics
Activity 6.7
In the previous lesson you learnt that vulcanicity leads to formation of
various landforms including volcanoes.
a) Describe volcanoes according to their period of activity.
b) Make a classification of the volcanoes according to their nature of
volcanic eruptions.
(a) Classification based on periodicity/activity of eruptions
The following are types of volcanoes based on periodicity or activity of
eruptions:
• Active volcanoes: These are volcanoes which constantly eject volcanic
lavas, gases, ashes and fragmental materials. These are erupted very
recently or are engaged in eruption. Examples are Nyiragongo and
Nyamuragira in DRC, Ol Doinyo in Tanzania, Lengai and Etna, Stromboli
(in Mediterranean Sea).
• Dormant volcanoes: These are volcanoes which have taken long
without erupting but still show signs of eruption. That is, theyare
quiet after their eruption for sometime. However, they suddenly erupt
violently and cause huge damage to human, animal and plant life
around them. An example is Muhabura, Karisimbi, Gahinga andBisoke
in Rwanda, Vesuvious near Naples in Italy.
• Extinct volcanoes: These are volcanoes that have taken a long time
without erupting and show no signs of erupting in future. A good
example is Mount Sabyinyo in Rwanda.
(b) Classification of volcanoes basing on the nature of eruptions
Based on the nature of eruptions volcanoes are classified into the following:
i) Explosive volcanoes: These are volcanic eruptions whereby the magma
is violently ejected out of the Earth’s crust through a central pipe (vent).
Explosive type of volcanoes are classified into the following:
• Hawain type of volcanoes: Such volcanoes erupt quietly due to less
viscous lava and non-violent gas. A good example is Nyiragongo of DRC,Mihara in Japan, Etna of Italy, Kilauea of the southern Hawaii island.
• Strombolian type: Such volcanoes erupt with moderate intensity.
Besides lava, other volcanic materials like pumice, scoria and bombsare also ejected into the sky. e.g: Stromboli in Italy.
• Vulcanian type of volcanoes: Such volcanoes erupt with great force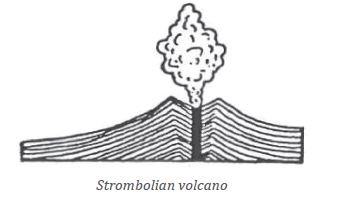
and intensity. The lava is so viscous and pasty that quickly solidifies
and hardens. E.g:Lipari in the Mediterranean Sea, Sakurajima in Japan etc.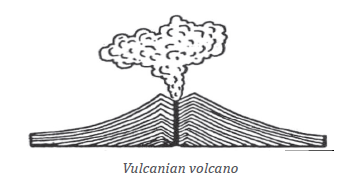
• Peleean type of volcanoes: They are the most violent and explosive
types of volcanoes. The ejected lava is extremely viscous (a large amount
of gas, dust, ash,and lava fragments are blown out of the volcano crater.e.g: Pellee Volcano of Martinique Island in the Caribbean Sea.
• Visuvious type of volcanoes: There is a violent expulsion of magma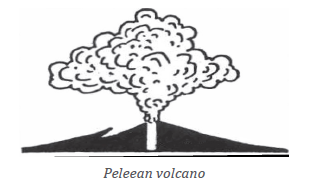
due to enormous volume of explosive gases. A good example is thePlini volcano in Italy.
ii) Fissure eruption type or quit eruption type: These occur along fracture,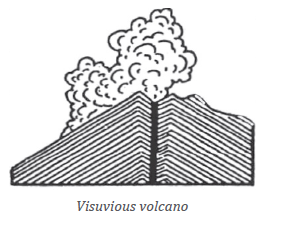
fault and fissure and there is slow upwelling of magma from below and
the resultant lavas spread over the ground surface. An example is Lakifissure eruption in Iceland.
Application Activity 6.7
With specific examples from East Africa,
a) Identify and describe the extrusive volcanic landforms.b) Categorize the volcanoes according to their period of activity.
ii. Influence of volcanicity
Activity 6.8
Observe the photograph of Bisoke crater provided below and answer thequestions that follow:
1. How did the volcanicity influence the formation of the mentioned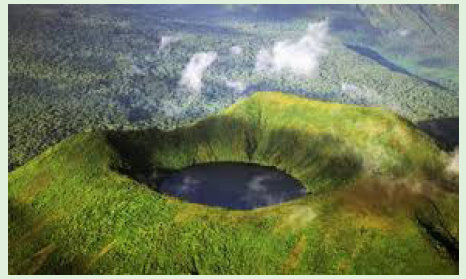
drainage feature?
2. Using your own experience, textbooks and internet, research on
the impact of volcanicity to the social economic development of a country.3. Locate the volcanic regions on the east Africa map.
In this section, we highlight some of impacts produced by volcanicity on
drainage systems, and humans, and we briefly describe the distribution of
volcanoes in the world.
(a) Influence of volcanicity on drainage
The volcanicity influences the drainage system in a given area in different waysas follows:
• Some seasonal rivers originate from the crater lakes and flow down
slope. The good example includes Susa River in Rwanda.
• Crater or caldera of volcanoes may be filled with water to form lakes.
Good examples in Rwanda are the lakes located on Bisoke, Muhaburaand Kalisimbi.
• Some rivers may change their courses due to volcanicity. For example,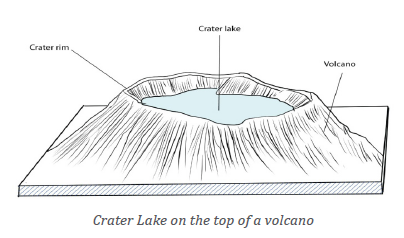
before the Rwandan volcanoes came into existence, Nyabarongo River
was flowing northward and then when volcanoes came in place, the
river changed its course which is southward.
• It leads to formation of lava dammed lakes. E.g. Burera and Ruhondo.
(b) Impact of volcanicity to the human
Volcanicity has both negative and positive impacts to human life, as briefly
described in the following paragraphs:
Positive impacts
The following are some examples of positive impacts of volcanicity:
• Volcanicity is associated with rich (fertile) volcanic soils that stimulate
agriculture;
• It leads to production of geothermal heat and geothermal energy;
• It stimulates mining of metal ore deposits (including gold, silver,
copper, tin, iron, lead, wolfram and zinc);
• Volcanicity is associated with the formation of crater and lava dammed
lakes that stimulate fishing and water transport. A typical example is
in Burera and Ruhondo lakes in Northern Rwanda;
• Industrial materials like building stone, pumice and clay are provided
by volcanic features;
• Volcanicity leads to formation of waterfalls that facilitate the generation
of electricity (HEP). A good example is at Ntaruka and Mukungwa
Hydro-power plants in Northern Rwanda.
• Volcanoes play a great role in modification of climate which supports
various human activities such as agriculture.
The hot springs are used for medicinal purposes, for example therapeutic water.
Negative impacts
The following are some examples of negative impacts of volcanicity:
• Volcanic eruptions cause heavy damage to human lives and property
through outpouring of lava, fallout of volcanic materials; speeding lava
flows.
• Too much volcanic materials also lead to diversion and blocking of
drainage systems and floods.
• The poisonous gases produced during the eruptions cause acid rain.
• Sometimes volcanic eruptions are followed by heavy rainfall. The heavy
rain mixes with falling volcanic dusts and gases to cause mudflows or lahar;
• Volcanic eruptions may generate tsunamis and seismic waves causingdeath to human beings.
(c) World distribution of volcanoes
There are three major belts or zones of volcanoes in the world. These are:
• Circum-Pacific belt: volcanic zones of the convergent oceanic plate
margins, including the volcanoes of the Eastern and Western coastal
areas of the Pacific Ocean. This includes island arcs and festoons off
the East coast of Asia and of the volcanic islands scattered over the
Pacific Ocean. This volcanic belt is also called “The fire girdle of the
Pacific or the Fire ring of the Pacific”.
• Mid-continental belt, also known as ‘the volcanic zones of convergent
continental plate margins’. This belt includes the volcanoes of Alpine
mountain chains and the Mediterranean Sea, and the volcanoes of the
faulted zone of Eastern Africa.
• Mid-Atlantic belt: This includes the volcanoes along the Mid-Atlantic
ridge which represents the splitting zone of plates. In other words,
two plates diverge in opposite directions from the mid-oceanic ridge.
Thus, volcanoes of fissure eruption type occur along the constructiveor divergent plate margins.
Application Activity 6.8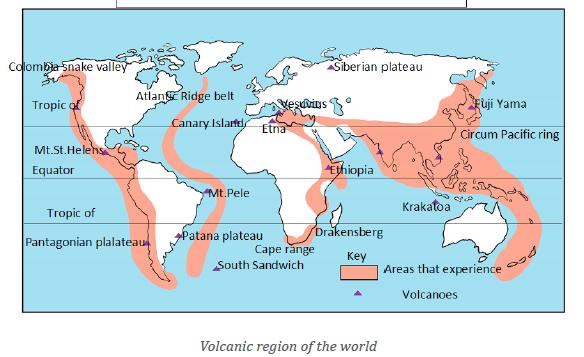
1. Examine the significance of volcanicity to the economic development
of the areas found in volcanic regions.
2. Assess the role played by volcanicity in the development of the
following economic activities in Rwanda:
a) Tourism industry
b) Agriculture
c) Power and energy
3. Locate and describe the major volcanoes of the world on world sketch map.
6.3.2. Earthquake
i. Meaning and causes of earthquakes
Activity 6.9
Read the passage about earthquakes occurrence and provide
answers to the questions that follow.
Earthquakes occur when masses of rock in Earth’s crust slip and slide
against one another. This kind of movement is most common along a fault,
a break in a body of crustal rocks that can extend for kilometers or even
hundreds of kilometers. When pieces of crustal rock suddenly slip and
move, they release enormous amounts of energy, which then propagates
through the crust as seismic waves.
At the Earth’s surface, these waves cause the ground to shake and vibrate,
sometimes violently.
Geologists classify seismic waves into two broad categories: body and
surface waves.
Body waves, which include Primary and Secondary waves, travel through
the Earth’s interior.
Primary waves resemble sound waves which mean they compress and
expand material as they pass. Secondary waves resemble water waves
which mean they move material up and down. Primary waves travel
through both solids and liquids, while Secondary waves only travel
through solids.
1. Identify the internal process explained in the above passage
2. Explain how that process occurs.
3. Conduct a research and find the meaning of the following
terminologies:
i. Hypocentre
ii. Epicentre
iii. Focusiv. Tremor
a) Meaning of earthquake and associated terminologies
An earthquake is a sudden tremble or shaking of the ground caused by abrupt
release of energy from crustal rocks; a motion of the ground surface, ranging
from a faint tremor to a wild motion capable of shaking buildings and causinggaping fissures in the ground.
• Focus or hypocentre: It is the place of origin of the earthquake and is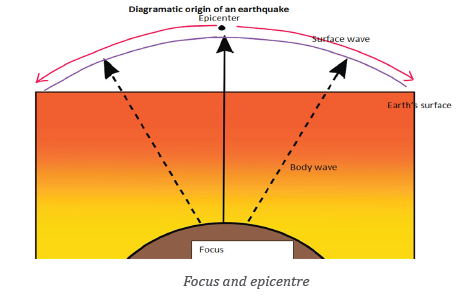
always hidden inside the earth. It is also considered as the place of the
occurrence of earthquake.
• Epicentre: It is a place on the ground surface which is perpendicular
to the focus. That place is the first to experience seismic event.
• Magnitude: It is a measure of the amount of energy released during
an earthquake.
• Tremors or temblor is the perceptible shaking of the surface of the
Earth, resulting from the sudden release of energy in the earth’s crust
that creates seismic waves.
b) Causes of earthquakes
Earthquakes are caused by both natural and human factors as follows:
Natural causes of earthquakes
Natural causes of Earthquakes are associated with endogenic forces resulting
from convectional currents.
• Volcanic eruptions of explosive and fissure types. Generally, volcanic
earthquakes are confined to volcanic areas.
• Dislocation of crustal rock blocks during faulting. Such earthquakes
are severe and disastrous.
• Disturbance in the isostatic balance at regional level due to imbalance
in geological processes. Generally, earthquakes occurring in the active
zones of mountains fall in this category.
Human causes of earthquakes
The earthquakes may also result from human activities such as:
• Pumping of water from underground aquifers, oil reserves; deep
underground mining;
• Blasting of rocks by dynamites for purposes of construction (of dams
and reservoirs, roads);
• Nuclear explosions;• Storage of huge volumes of water in big reservoirs.
Application Activity 6.9
Through internet, journals, textbooks and magazines search on the
earthquakes which affected Western Rwanda in past years. Then answer
the following:
1. Name the epicentre of earthquake which took place in Rwanda in
February, 2007 and August, 2015.
2. Suggest why the western part of Rwanda experiences high level ofearthquake.
Activity 6.10
1. Describe what you observe on the picture above.
2. Propose measures that can be taken to curb the effects of thehazard/disaster presented in the picture above.
ii. Consequences and measures to alleviate earthquake effects
a) Consequences of earthquakes
The following are consequences earthquakes:
• Loss of life and destruction of property happens when violent shaking
of the land causes cracks on walls and making the buildings to collapse.
• Outbreaks of fires occur where the earthquake destroys oil and gas pipelines.
• Occurrence of Tsunamis which are huge sea waves and are very destructive
• Landslides occur when; sudden movements of large masses of rock
and soil downhill.
• Displacement of crustal rocks. This is takes place vertically and
laterally, leading to damaged transport and communication lines such
as roads and railways.
b) Measures to alleviate earthquake effects
The measures for alleviating the earthquakes include the following:
• Building houses in a way that they are more resistant to earthquakes.
• When one is outside, should stay move away from buildings and
streetlights.
• If trapped under a collapsed structure tap on a pipe or wall so that
rescuers are able to locate you.
• When the shaking stops, look around to make sure it is safe to move.
Then leave the building.
Application Activity 6.10
It has been noticed that Western part of Rwanda experiences earthquakes
at great extent compared to other regions of Rwanda.
a) Suggest why that part of Rwanda experiences such phenomenon.
b) What do you think are the effects of such catastrophe/disaster in
any region where it occurs?
c) Assume that you are in charge of disasters management; proposemeasures that should be taken to control earthquakes.
Skills lab
The landform evolution and processes have a great impact on landform.
Examine the internal landform susceptible to change the surface of your local area.
End unit Assessment
1. Discuss the impact of faulted landforms on the East African
landscape and drainage
2. Explain the significance of folded relief features in the socioeconomic
development of East Africa.
3. With specific examples, explain the importance of warping on
drainage system of Africa.
4. Critically examine the effects of either Tsunami in Japan or
earthquake in Haiti on the World economic development.
5. Assume that you are appointed as Director General of Rwanda
Environmental Management Authority (REMA), what are
measures that you should reinforce for conserving the basin lakesand wetlands found in Eastern province.
UNIT 7 :SOILS
Key Unit Competence: The student-teachers should be able to investigate
the different constituents and morphologicalproperties of the soil.
Introductory activity
i. Identify the major components of the soil.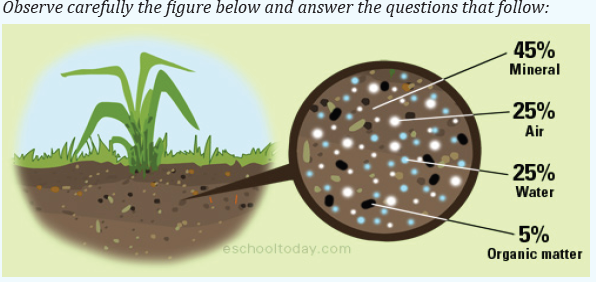
ii. Using the experiences gathered from previous classes on soils, explain the
contents of each components of the soil.
iii. Describe the morphological properties of soil.iv. Explain what makes soil to be more productive.
7.1. Soil constituents
Activity 7.1
Using previous knowledge learnt in Geography textbooks and other
sources of geographical information;
a) Define soil.b) Differentiate the constituents/components of soil.
7.1.1. Definition of the soil
Soil is a dynamic natural material composed of fine particles in which plants
grow. It is defined as a natural body consisting of layers (soil horizons) that
are composed of mineral materials, organic material, air and water. Mineral
materials originate from weathered rocks whereas organic materials are
products of decayed plants and animals.
7.1.2. Soil constituents
The figure below shows the five major constituents of the soil with theirproportions, as described in the following paragraphs:
Soil is not merely a group of mineral particles. It also has a biological system of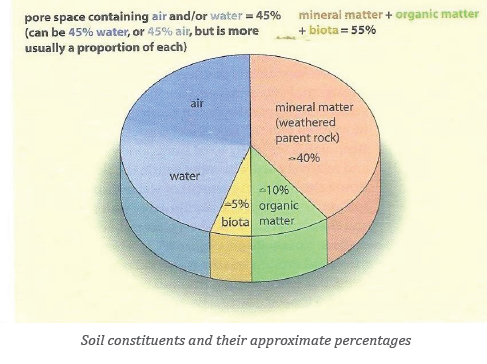
living organisms and some other components.
A brief description of each of the five constituents of the soil is given in the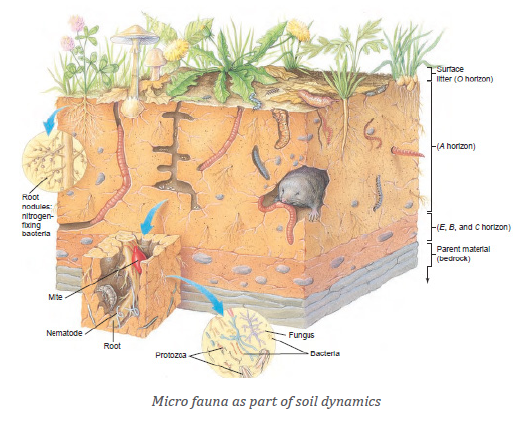
following paragraphs:
i) Inorganic materials, also called mineral matter is matrix of mineral
particles derived from varying degrees of breakdown of the parent-rocks
through weathering. These particles vary in shape and size. Sand, silt
and clay are the three major contents of mineral matter. They include the
following. Oxides which are products of metal rust and mineral oxidation
(e.g. iron oxides), are also important constituents of the soil.
Inorganic matter provides important plant nutrients; determine soil
aeration, soil texture and drainage. It also gives support to the plants.
Inorganic matter makes up 45% of the soil.
ii) Organic matter is made up of decayed plants and decomposed animal
products. Some living animals and plants are also important part of the soil.
The decayed remains of plant and animal materials, partially transformed
by bacterial action, are collectively called humus, which provides the soil
with brown or dark color. Organic matter makes up 5% of the soil.
Organic matter has among other the following benefits:
-Humus helps in soil aeration, enhances the soil’s ability to hold and
store water and improves the soil structure- It helps plants to extract soil nutrients.
─ Humus reduces eluviation of soluble minerals from the top soil and
supplies nutrients and minerals to the soil.
─ Soils that contain humus are quite workable and have a good
capacity to retain water. Humus is also an important source of food
for microscopic soil organisms.
iii) Soil water and moisture refers to all the water contained in the soil
together with its dissolved solids, liquids and gases. Soil water is a dilute
solution of many organic and inorganic compounds, which is the source
of plant nutrients. The water in the soil moves by gravity (downward)
or by capillarity (upward) movement. Gravitational water is the water
that passes through the soil under the influence of gravitation, whereas
capillary water is soil water that clings to soil particles as a result of
surface tension. Capillary water moves in all directions through the soil
from areas of surplus water to areas of water deficit. The movement of
water and dissolved minerals is called leaching, and the water is called
gravity water. The soil water makes up 25% of the soil and it occupies the
pore spaces in the soil.
Soil water has among others the following benefit:
• It dissolves various minerals and organic substances that derive from
plant or animal remains forming solutions;
• The soil water helps plant to absorb minerals from the soils;
• The soil water removes highly soluble minerals from the upper layers
to the lower layers, and this process is known as leaching;
• The soil water brings soluble minerals from the lower to the upper
horizons of soil through capillarity;
• The soil water is very important in the sense that it provides a medium
within which most of the chemical processes of the soil formation take
place;
• The soil water provides a medium through which living organisms and
soil bacteria operate during the decomposition of organic matter.
iv) The soil air occupies the pore space between soil particles which is
not filled with water. The soil is normally lower in oxygen and higher in
carbon dioxide content. The soil air includes gases from biological activity
and chemical reactions. The air or gases make up 25% of the soil. The air
in the soil is important in the following ways:
• It facilitates plant growth by supplying oxygen to the root hairs;
• It supports micro-organisms which are found in the soil;
• It helps in the process of weathering known as oxidation which is
responsible for breaking down rocks to form soils.
v) Biological system or living organisms and bacteria: The living
organisms and bacteria help to decompose the organic matter into humus.This is sometimes classified together with organic matter/humus.
Application Activity 7.1
Carry out a tour around your school. Observe critically the nature of thesoil constituents and make a their description
7.2. Morphological properties, profile and catena and fertility of the soil
Activity 7.2
Observe the illustration provided below and answer the questions that follow: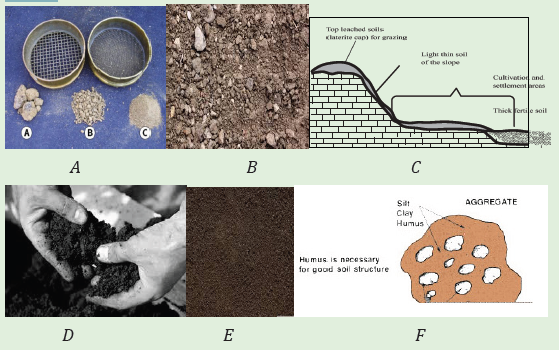
1. From your observation of the above illustrations, which picture
represents: (i) Soil structure, (ii) Soil texture (iii) Soil colour (iv) Soil
profile (v) Soil catena (vi) Soil porosity.
2. Differentiate soil structure from soil texture.
Soil properties refer to the chemical and physical characteristics of the soil and
these include mainly: structure, texture, colour, porosity, pH and consistency.
7.2.1. Soil properties
The main properties of the soil include the following:
i. Soil structure
The soil structure is the arrangement of the individual soil particles. Soil
structure varies in size and shape. Based on the shape, the following types of
soil structure exist: granular, prismatic, platy, columnar and blocky.
• Granular and crumb: They are individual particles of sand, silt
and clay grouped together in small, nearly spherical grains. Water
circulates very easily through such soils. They are commonly found in
the A-horizon of the soil profile.
• Platy: It is made up of soil particles aggregated in thin plates or sheets
piled horizontally on one another. It is commonly found in forest soils,
in part of the A- horizon.
• Prismatic: The soil particles are formed into vertical prism-like
particles. Water circulates with greater difficulty and drainage is poor.
They are commonly found in the B-horizon where clay has accumulated.
• Columnar: It is similar to prismatic, but the particles are rounded at
the top.
• Blocky: These are soil particles that bound together in irregular
square or angular blocks having more or less sharp edges. Relatively
large blocks indicate that the soil resists penetration and movement
of water. They are commonly found in the B-horizon where clay hasaccumulated.
Structure is important because it controls drainage, rooting of plants, and how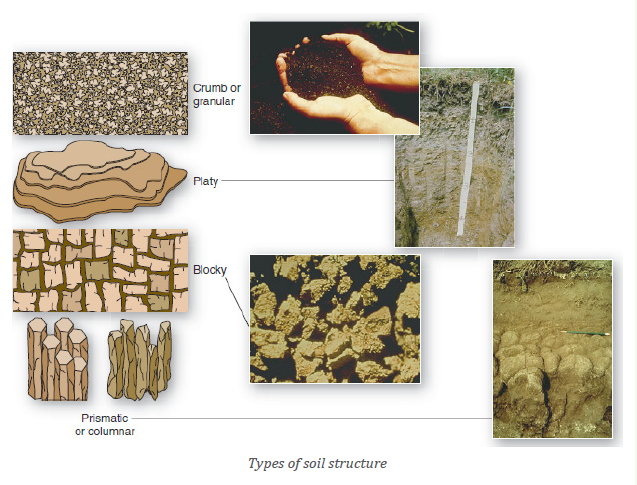
well the soil delivers nutrients to plants. The shape of individual peds, shown
here, controls a soil’s structure.
ii. Soil texture
Soil texture refers to the mixture of sizes of its particles and the proportion of
different sizes, namely sand, silt and clay within a soil. Particles that are larger
than sand are grouped as stones.
Soil texture is important due to the following reasons:
• It influences the amount of air and water available within the soil. Silt
and clay soils have a high water holding capacity. Sandy soils have a
low water holding capacity.
• It also influences the amount of water and the ability of the roots to
pass through it.
• It determines the plant roots penetration and growth in the soil.
• It determines the soil’s ability to retain humus from being washed away.• It influences the aeration of the soil.
Measures of the ratio of clay, silt, and sand determine soil texture. As an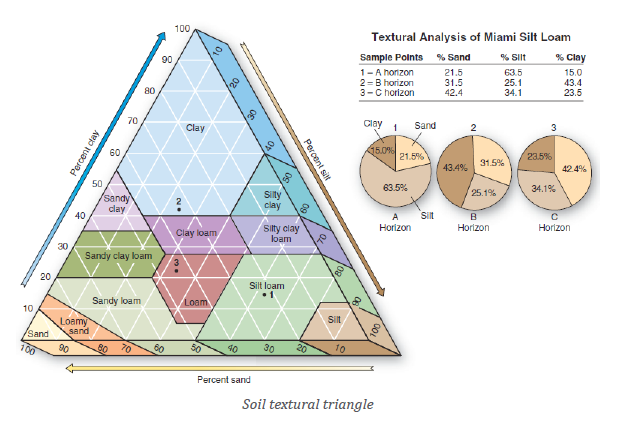
example, points 1 (horizon A), 2 (horizon B), and 3 (horizon C) (see figure
above) designate samples taken at three different horizons in the Miami silt
loam in Indiana. Note the ratio of sand to silt to clay shown in the three pie
diagrams and table.
iii. Soil colour
Soil color is important, because it sometimes suggests its composition and
chemical makeup. It is influenced by the parent rock, organic matter, moisture
content and minerals. Soils have a variety of colours. They include red, yellow,
black, grey, white and brown. A soil that is dark brown has high organic matter
content. Soils that are reddish brown are well drained whereas grey soils are
infertile.
iv. Soil porosity/permeability
This refers to the number of pore spaces in the soil. The pore spaces relate to
the portion of the soil space occupied by air and water. This is determined by
the arrangement of the soil particles.
Soils vary in porosity. Soils with large pores, for example sand are porous whileclay is non–porous.
v. Soil pH (potential for Hydrogen)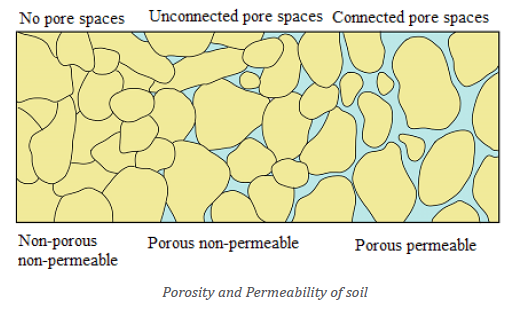
Soil pH is an indicator of the acidity or alkalinity of soil. It is also known as soil
reaction. The pH scale measures acidity (lower pH) and alkalinity (higher pH).
The complete pH scale ranges between 0 and 14. Numbers from 1 to 6.9 indicateacidity; number 7 indicates neutral state, while 8 to 14 indicate alkalinity.
The pH scale measures acidity (lower pH) and alkalinity (higher pH). The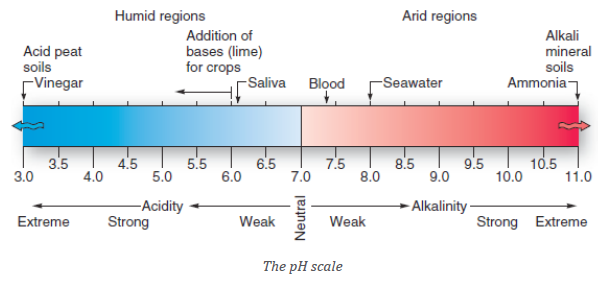
complete pH scale ranges between 0 and 14.
vi. Soil consistency
Soil consistency is the strength with which soil materials are held together or
the resistance of soils to deformation and rupture. It also refers to the ability
with which individual soil particles of soil can be eroded. The consistency of
the soil can be tested on the field using cultivation tool or fingers, or throughlaboratory tests.
7.2.2. Soil profile and catena
i. Soil profile
Soil profile refers to the vertical arrangement of the soil in layers from the
ground/surface to the parent rock/bedrock or mother rock. It can be as little
as 10 cm thick in some places or as deep as several meters in others. The layersare known as soil horizons. They are marked using letters A, B, C and D.
i) Surface horizon O: This layer is also known as the superficial layer. This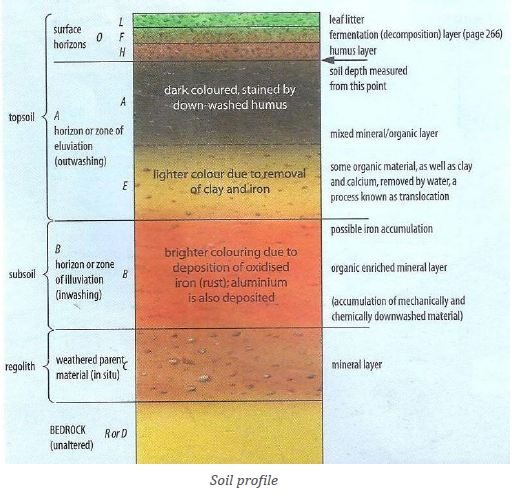
layer includes organic litter, such as fallen leaves and twigs. These are
fresh or partially decomposed organic matter. This zone has two sublayers:
OL: This is the uppermost layer consisting of freshly fallen dead
organic matter such as leaves, branches, flowers, fruits and dead
parts of animals.
OF : Called fermentation layer, it lies just below the OL layer. Here,
organic matter is found under different stages of decomposition.OH : Lies beneath OF layer and is made mostly by humus
ii) Horizon A: This layer is also known as the top soil horizon. It refers to the
upper layer of soil, nearest the surface (Horizon O). In this layer biological
activities and humus content are at their maximum. Called eluvial or
outwash horizon, the zone is the the most affected by the leaching of
soluble mineral and removal of finest solid material downwards. This
horizon is divided into two sub-layers:
AA : Is dark and rich in organic matter ‘humus’. It is characterized
by abundant proportion of organic matter compared to other subhorizons,
mixed with mineral matter.
AE : Layer is of light colour, with more sand particles and little organic
matter. In regions of heavy rainfall, the mineral elements are rapidly
washed downwards in this region. This is also known as podzolic or
eluvial (E); referred to as zone of leaching.
iii) Horizon B, also called the sub-soil horizon, or zone of illuviation is the
layer below the top soil, characterized by clay and oxides iron deposits,
which is why it is also called zone of inwashing, or illuvial horizon.
iv) Horizon C: This is the mineral layer made of recently weathered parent
materials, with little organic matter content.
v) Horizon D is the half-weathered or unaltered parent rock.
ii. Soil catena
A soil catena is a series of distinct but co-evolving soils arrayed down a slope. It
shows the changes that take place in the soil from the top to the bottom of the
slope, but the term is also used to describe the lateral variation in soils over a
hillslope.
The development of soil catena is influenced by climate and angle of slope.
Along the slopes, the soil horizons are thin as the slope angle increases, butthey become thicker in gentle sloping topographies.
A soil catena consists of three main divisions called complexes namely: Elluvial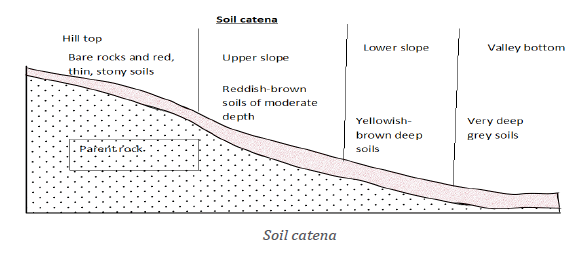
complex, the colluvial complex and the illuvial complex.
• The elluvial complex: This is the upper convex slope where weathered
materials are washed out downwards. It includes the summit and free
face of the hill. Erosion predominates the free face hence; the soils are
skeletal and with shallow soil profile.
• The colluvial complex: This is the lower concave slope where there
is gradual deposition of eroded material at footslope areas or in their
nearby. The soil of the colluvial complex is thus moderately drained
and retains certain moisture hence, supports agriculture and grazing.
• The illuvial complex: This occupies the valley bottoms where fine
materials are inwashed through seepage.
Soil catena is important in the following ways:
• The soil catena (elluvial complex) is used for settlement;
• The soil catena is used for rock quarrying for construction especially
on free face which has no vegetation;
• The valley bottoms are used for brick lying (e.g. Ruliba Clay Works
along River Nyabarongo in Rwanda);
• The illuvial complex is used for agriculture due to the deep soil profile
derived from deposition;
• The valley bottoms are used for rice growing and growth of vegetables
and yams, etc.
7.2.3. Soil fertility
Soil fertility is the ability of the soil to support plant growth. Fertile soil is the
soil that is rich in nutrients needed for the growth of plants: the most important
nutrients include: Nitrogen, Phosphorus and Potassium and Magnesium.
Factors affecting soil fertility
The following are the major factors affecting soil fertility:
• Mineral matter: A matrix of mineral particles derived from varying
levels of breakdown of the parent-rocks.
• Organic matter or humus: a fertility of soil depends on the amount
of organic matter or humus available in soil. The higher amount of
organic matter reflects the higher level of soil fertility.
• Soil water or soil solution: The required optimum amount of water
depends on the type of crops to be grown in specific area. Some crops
such as rice require much water while the crops like sweet potatoes,
cassava required low quantity of water.
• Soil nutrients are chemical elements found in the soil. They help in
plant growth and ensure the soil remains fertile.
• Thickness (depth): Thick soils (above 1 m of depth) are good for
agriculture whereas thin soils are not good, because they don’t allow
the development of root system.
• Soil permeability: This is the ability of the soil to allow water to pass
through it. Permeable soils are much more fertile than non-permeable soils.
• Soil texture refers to the size of soil particles. Clay loam soil are much
fertile than other soil.
• Soil acidity and alkalinity: The basic soils are much more fertile thanacidic soils.
Application Activity 7.2
1. Basing on the knowledge and skills acquired from the above lesson,
differentiate soil porosity in Eastern Rwanda from soil porosity of
volcanic soils in the Northern Rwanda.
2. With the help of diagrams differentiate soil profile from soil catena.3. Identify the factors influencing soil fertility.
Skills lab
Make a field study on your local area, and select the best type of soil suitable for
increasing production in agriculture.
End unit Assessment
1. Conduct a field trip around your school, collect soil samples and
study them to identify their constituents.
2. Explain the importance of soil catena
3. Establish the difference between:The soil structure and the soiltexture, the soil colour and the soil pH
UNIT 8 :WEATHER AND CLIMATE OF THE WORLD
Key unit competence: The student-teacher should be able to appreciate
the importance of the atmosphere, weather and
the impact of climate on the environment andhuman activities in the world.
Introductory activity
Read the following passage and answer the questions that follow:
The climate is defined as the average weather conditions of an area in terms of
temperature, atmospheric pressure, wind direction and wind speed, moisture,
cloudiness, precipitation, and sunshine for a standard period of 30 years.
Due to its high altitude, Rwanda enjoys a tropical temperate climate. The
average annual temperature ranges between 16 and 20° C, without significant
variations. Rainfall is abundant although it has some irregularities. Winds
are blowing with a speed of 1-3 m/s. With an economy that is dominantly
supported by agriculture.1. Referring to the passage above, establish the difference between the8.1. The atmosphere: definition and structure of the atmosphere
climate and the weather.
2. Establish the relationship between weather, climate and atmosphere on
Earth’s surface.
3. Examine the influence of climate on the environment and socio-economicdevelopment of Rwanda.
Activity 8.1
Observe the figure provided below and give answers to the questionsthat follow:
1. Identify on the illustration the major atmospheric structures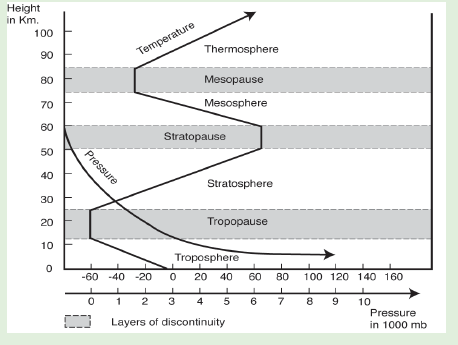
2. Describe different layers shown in the figure above.3. Examine the relevance of atmosphere to human?
8.1.1. Meaning of the atmosphere
The atmosphere is the envelope of gases surrounding the earth. It contains all
gases including those that support all forms of life on earth. This envelope of air
is dense at the sea level and becomes thin with the increase in altitude.
8.1.2. The structure of the atmosphere
The atmosphere is made up of four vertical layers namely the troposphere, thestratosphere, the mesosphere and the thermosphere.
(i) Thermal characteristics of the atmosphere
Based on temperature variation, the four layers of the atmosphere (troposphere,
stratosphere, mesosphere and thermosphere) represented on the followinggraph, are briefly described in the next paragraphs.
(i) Troposphere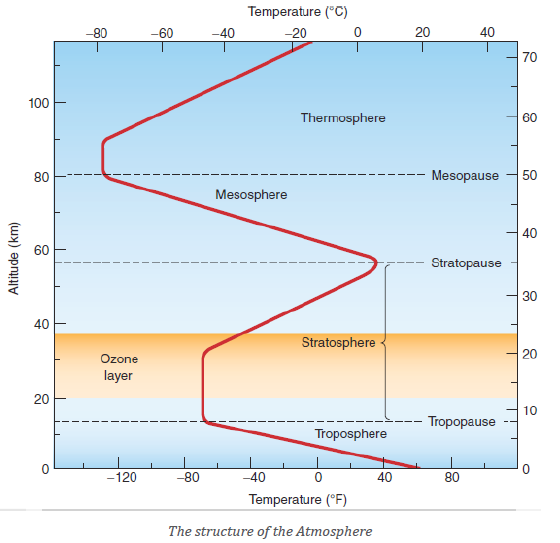
The troposphere is the lowest layer of the atmosphere; it lies between 10 and
20 kilometres above the sea level. The upper limit of the troposphere is the
Tropopause. The temperature decreases with increased altitude at a rate of
6.50c per 1000 m. Most of weather phenomena occur in this layer, which makesthe troposphere vital to the survival of both fauna and flora.
(ii) Stratosphere
The stratosphere extends from 16 to 50 km above the sea level. There is
an increase of temperature in this layer due to absorption of ultraviolet
solar radiation by the ozone layer. There is nearly the absence of weather
phenomena because of dry air and rare occurrence of clouds. The upper limitof the stratosphere is called Stratopause.
(iii) Mesosphere
The mesosphere extends between 50 km and 80 km above the sea level.
Temperature decreases with increased altitude reaching nearly - 1000 C at the
upper limit of this layer; the Mesopause.
(iv) Thermosphere
This atmospheric layer extends from 80 km to 640 km. It is composed of
Ionosphere and Exosphere.
a) The ionosphere is moistless and dustless. It consists of several ionized
layers which transmit radio and television waves.
b) The exosphere represents the uppermost layer of the atmosphere. The
density of the air becomes extremely low. The temperature reaches more
than 1700° C at its outer limit. The atmosphere above the ionosphere
is called the outer atmosphere and it is made of exosphere and the
magnetosphere.
8.1.3. Composition of atmosphere
Basically, the atmosphere is composed of Nitrogen which is the most abundant
gas with 78.1% of the totality of the Atmosphere followed by Oxygen 20.9%,
Argon 0.93%, Carbon dioxide 0.03% and others occupy the remaining portion
of the atmosphere.
8.1.4. Importance of the atmosphere
The atmosphere is important for the following reasons:
• It protects living things from harmful ultraviolet rays of the sun. This
role is played by the ozone layer.
• It helps to regulate the heat during the day and night. On earth,
however, molecules in the atmosphere absorb the sun’s energy as it
arrives, spreading that warmth across the planet.
• The atmosphere protects and sustains the Earth planet’s inhabitants
by providing warmth and absorbing harmful solar rays.
• It provides the various gases that are useful to living things, such as
among others, oxygen carbon dioxide.
• It provides precipitation that helps to sustain life on earth.
• The atmosphere is a crucial part of the water cycle and is an important
reservoir for water and the source of precipitation.
• The atmosphere moderates Earth’s temperature because greenhousegases absorb heat.
Application Activity 8.1
1. (a) Explain why the atmosphere should be conserved.(b) Describe how atmosphere should be conserved.
8.2. Elements of weather and climateActivity 8.2
Definition of weather and climate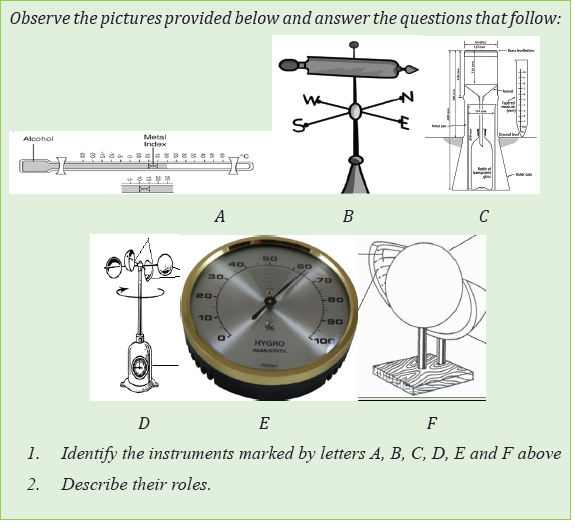
Weather is defined as the state of the atmosphere at any given time. Weather
keeps changing all the time. The change is from hour to hour and day to day.
Climate is an average weather conditions of atmosphere of a given place over
long period of time (about 30 years).
The elements of weather and climate: Weather and climate are observed
from their elements. The main elements are temperature, precipitation, wind,atmospheric humidity, clouds, sunshine and atmospheric pressure.
8.2.1. Temperature
Activity 8.2.1
Read the context below and answer the questions that follow:
When people migrate from Bugesera to Musanze they are required to
change clothing style. Some of them say that it is necessary to put on
jackets due to climatic conditions of that area.1. Why is there constant change of clothing style from Bugesera toTemperature is the degree of heating and cooling of the atmosphere at a given
Musanze?
2. Identify the weather condition that lead people to put on jackets in
Musanze while in Bugesera they put on T-shirts.
3. What may be the possible causes or factors responsible for thatconstant change of the weather?
area and time.
(i) Factors influencing temperature variation
Temperatures change from place to place. These changes are caused by different
factors which include the following:
1) Latitude: The amount of sunshine received decreases as one moves
away from the Equator since the equator and the nearby places receive
the overhead sun whereas areas beyond tropics never experience the
overhead sun.
2) Altitude: Temperatures decrease with increasing altitude from the
earth’s surface towards troposphere, at the normal rate of 6.5°C per
1000 metres ascent.
3) Distance from the sea: Places nearby large water bodies usually receive
cooler temperatures than places far away from the coast due to the effect
of land and sea breezes.
4) Prevailing winds: Winds blowing from low latitudes to high latitudes
raise the temperature of the regions where they reach. Winds blowing
from high latitudes to low latitudes lower the temperature.
5) Nature of land and water: Land becomes warm and cold more quickly
than the water body; this is because water has the capacity of absorbing
and storing sun energy which is transformed into heat.
6) Nature of ground surface: The nature of ground surface in terms of
colour, vegetation, and land use practices determines the reflection or
absorption of sun energy and affects distribution of temperature. Areas
under vegetation absorb more heat from the sun than those without
vegetation.
7) Nature of ground slope: The slopes facing the sun receive more heat
from the sun because its rays reach the surface more or less straight.
8) Cloud cover: Cloudy nights and days are warmer than cloudless
nights and days because cloud does not allow heat to escape from the
atmosphere.
9) Ocean currents: The warm Ocean currents flowing from tropical areas
to temperate and cold zones raise the average temperature in the affected
areas.
(ii) Measurement and recording of temperature
The instrument used for recording temperature is called a thermometer.
Temperature is measured in degrees Celsius (°C). The line on the map joining
places with the same temperature is called isotherm.
The three common types of thermometers the most include:
• Maximum thermometer (records the highest temperature of the day)
• Minimum thermometer (records the lowest temperature of the day).
• Six’s thermometer (records both maximum and minimum temperatureof the day).
(iii) Terms related to temperature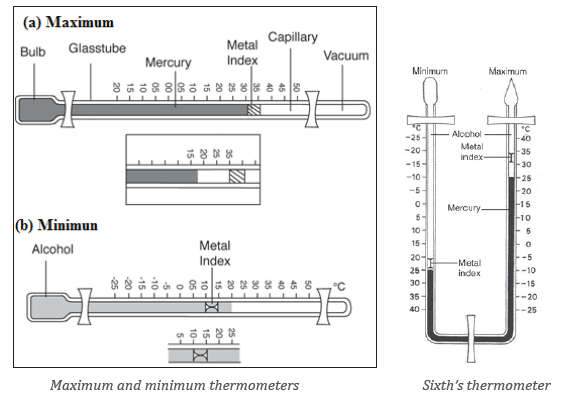
• Mean temperature
The following are types of average temperature:
Diurnal average temperature represents the average temperature within
24 hours of the day.
It is obtained by adding the hourly temperatures and dividing the total by
24 (hours).
The highest temperature recorded within 24 hours is called the daily
maximum temperature.
The lowest temperature recorded within 24 hours is called the daily
minimum temperature.
• Monthly mean temperature: This is the sum of mean daily temperatures
for a given month divided by the number of days of that month.
• Annual mean temperature: This is the sum of the monthly mean
temperatures divide by 12.
• Temperature range
── The difference between the maximum and minimum temperatures of
the day is called diurnal temperature range (DTR).
DTR= maximum T0- minimum T0.
── The difference between maximum and minimum temperatures of the
year is called annual range of temperature (ATR).
ATR= maximum monthly T0- minimum monthly T0
(iv) Impact of temperature on the environment
The following are the major impacts of temperature on the environment:
• A rise in global temperatures leads to an increase of evapo-transpiration.
This could eventually lead to the rise in amount of rainfall which impact
on environment.
• A rise of temperature leads to melting of glaciers in polar and
mountainous regions or ice-capped highlands.
• An increase in temperature leads to global warming which impacts
negatively on the environment.
• As the earth gets warmer, plants and animals that need to live in cold
places like on mountain tops or in the Arctic, might not have a suitable
place to live.
• The sea level has been rising more quickly over the last century as a
result of temperature change.
• Precipitation (rain and snowfall) has increased across the globe; onaverage as a result of temperature change.
8.2.2. Precipitation
Activity 8.2.2Observe the illustration provided below and answer the following questions:
1. Identify the types of precipitation shown on the above picture.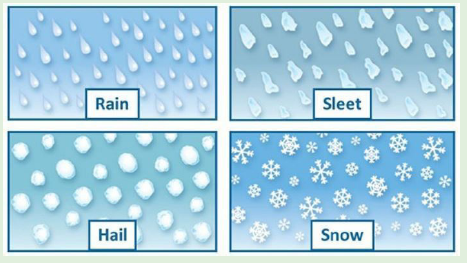
2. Distinguish the formation of rain from that of snow.
i) Meaning and forms of precipitation
Precipitation is any form of liquid or solid water particles that fall from the
atmosphere and reach the earth surface. The following are main forms of
precipitations:
• Rainfall is the most widespread and important form of precipitation.
Rain refers to liquid water droplets falling from the atmosphere under
the influence of gravity.
• Hail: It consists of large pellets or spheres (balls) of ice falling from the
atmosphere.
• Sleet: It refers to mixture of snow and rain.
• Snow: snow appears as very small crystals of ice suspended in the
earth’s atmosphere. Snow occurs when condensation occur below 00C.
• Fog: This is a cloud layer lying in contact and very close to the surface of
the earth or sea.
• Frost: It is defined as transformation of water vapour directly into
solid form at the ground surface due to condensation occurring below
freezing point.
• Dew: These are droplets of water that are deposited on the ground.
They are mostly present on plant’s leaves in the morning.
• Rime: It is an opaque thin, white layer of ice that forms when the air
temperature is below the freezing point of water, especially outside at night.
(iii) Types of rainfall
Rainfall is precipitation in form of droplets. The following are the major forms
of rainfall.
1. Convectional rainfall: It occurs when the earth’s surface is heated by
the sun. The warm air rises, and it is replaced by the cold air. As the air
rises, the pressure on it decreases, expands and cools. Further cooling
makes the moisture in it to condense and form clouds. It later falls as rain.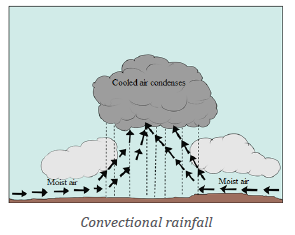
2. Orographic rainfall
This type of rainfall occurs when a water body is heated by the sun. The heating
causes evaporation. Moist air from the sea blows over a hill or mountain side.
The rising causes it to expand and cool. It condenses and forms clouds. Rainfall
occurs on the wind ward side of the mountain. This is the side facing the moistwind. The opposite side known as leeward side is dry.
3. Cyclonic or frontal rainfall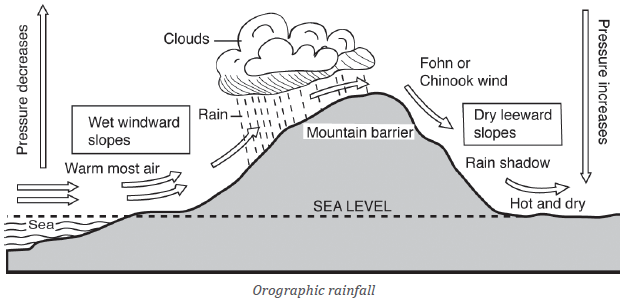
Cyclonic or frontal rainfall occurs when air masses of different temperatures
meet. One is warm and the other is cold. The warm air is forced over the cool
air. As the warm air rises, the moisture in it is cooled. It condenses and falls as rain.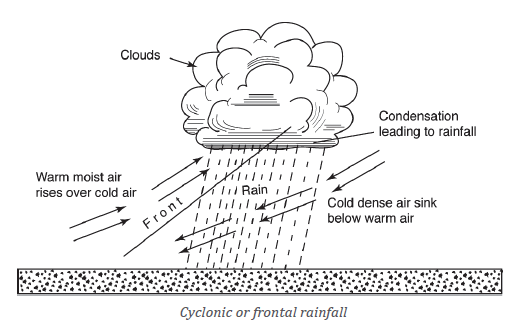
i) Factors influencing rainfall formation
Precipitation of different areas of the globe is influenced by different factors
which include the following:
• Moisture content of the air: The atmospheric moisture depends on
evaporation of water, regions having high temperature and abundance
of surface water, and wide-open Oceanic surfaces for evaporation,
receive higher amount of annual rainfall.
• The convergent or divergent air circulation: The convergence
of two contrasting air masses creates frontal activity and result into
cyclonic rainfall.
• Topographic conditions: Topographic conditions present favourable
conditions for precipitation. Moist air is forced by mountains to ascend
and condense hence yielding precipitation.
• Distance from the sea: Distance from the source of moisture
determines the amount of rainfall in different areas. Places near the
water bodies receive increased precipitation compared to areas far
away from the sources.
ii) Measurement and recording of rainfall
Rainfall is measured using a rain gauge. Most consist of a circular collector and
a funnel that channels the collected rain into a measuring mechanism or into
a cylinder where it may be measured later. The entrance to the gauge through
the funnel is narrow to avoid debris clogging the mechanism and undesirable
evaporation in hot weather. To make the rainfall measurement, the observer
empties the collected rain into a graduated glass rain measure. Lines on the
map joining areas with the same precipitation are called isohyets.
iii) Terms related to rainfall
The data obtained from the weather station can be used to calculate the
following:
• Monthly rainfall total: This is the total amount of rainfall received in
a month. It is obtained by calculating the sum of daily rainfall totals in
the month.
• The annual rainfall total: This is the total amount of rainfall received
in a year. It is obtained by finding the sum of all the monthly rainfall
totals for 12 months.• Mean annual rainfall: it is calculated by adding the monthly totals.
8.2.3. WindsActivity 8.2.3
Observe carefully the picture provided below:
1. Explain the phenomenon occurring on the above picture.
2. Describe the factors causing the mentioned phenomenon in (1).
3. Suggest the instrument used to record the direction and speed of wind.
(i) Meaning of wind
Wind is air in motion above the surface of the earth. It is caused by differences
in atmospheric pressure. Air moves from areas of high atmospheric pressure to
areas of low pressure.
(ii) Measurement and recoding of wind direction and speed
The wind direction is measured with help of a wind vane and wind sock, while
the anemometer serves to measure the speed of the wind. These instruments
are represented in Figure
Wind vane: It consists of a horizontal rotating arm pivoted on a vertical shaft.
The rotating arm has a tail at one end and a pointer at the other. When the wind
blows, the arm swings and points to the direction the wind is blowing from. Thewind is named after this direction.
Wind sock: It is common in airstrips. It consists of a cylindrical cloth bag tied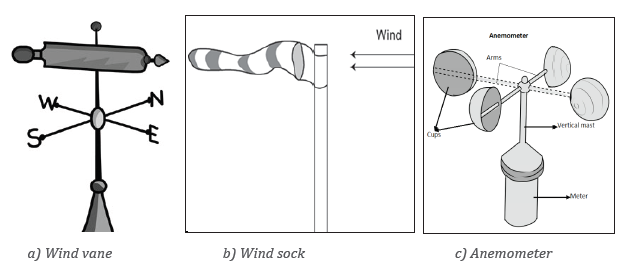
to a mast. It always points towards the direction at which the wind is blowing.
Anemometer is used to measure the speed of wind. This instrument consists
of three or four metal cups fixed to metal arms that rotate freely on a vertical
shaft. When there is wind, the cups rotate. The stronger the wind, the faster
the rotation will be. The speed of rotation is recorded on a meter. Wind speed
is measured in kilometres per hour (km/hr). The regions with the same wind
speed are called isotaches.
(iii) Types of winds
Winds are classified into 3 major categories namely local winds, prevailing
wind and air masses.
a) Local winds are winds that blow over a small geographical area and
normally for a short period of time. The examples of these include land and
sea breezes, valley and mountain breezes and etc.
• Sea breezes: Land heats up faster than the sea during the day. Air over
the land, therefore, becomes warmer than over the sea. The lighter and
warmer air rises. The cooler and heavier air from the sea moves over the
land to replace the rising air. This movement of air causes a sea breeze.
• Land breezes: At night, the land cools faster than the sea. The air over
the land becomes cooler and heavier than the air above the sea. The
warmer air over the sea is lighter. It rises while the cooler heavier air
over the land moves to replace it. This creates an air current called aland breeze.
• Valley breezes: The slopes and floors of valleys are heated more at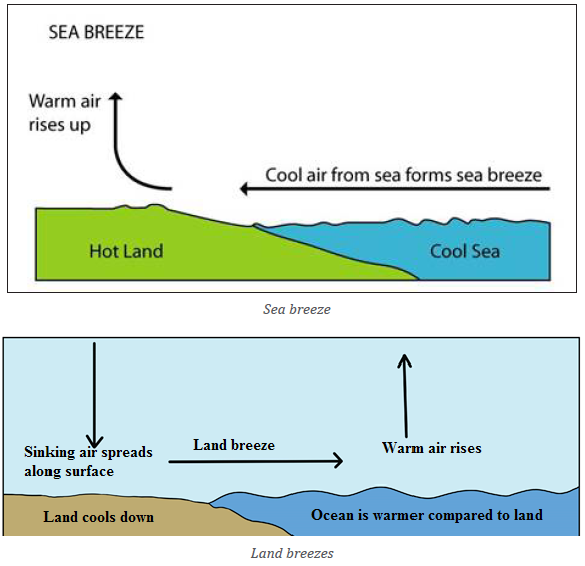
daytime. The warm air moves up the slope or upwards. This movement
creates what is called a valley breeze or anabatic wind.
• Mountain breezes: During the night, the hill slopes lose heat faster. The
valleys remain warmer. A low-pressure gradient is created in the valley.
Air current moves down the valley to form what is known as a mountainbreeze. It is also called katabatic wind.
There are many other examples of local winds like Chinook, Sirocco, Harmattanwhich affect different parts of the world.
b) Permanent winds, also called prevailing or planetary winds are those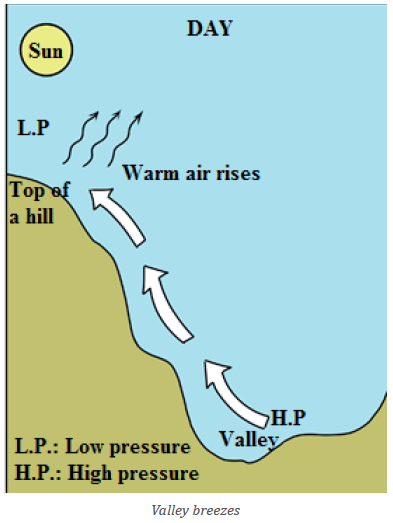
that flow from a known high pressure area to low pressure area throughout
the year. Prevailing winds are large masses of air having fairly uniform
humidity and temperature.
Permanent winds include:
─ Easterlies: There are winds which blow from East to West. These are
found in both inter-tropical zone and polar zone. The winds blowing
in inter-tropical zone are also called trade winds.
─ Westerlies: These types of winds blow from West to East. They are
found in the temperate zone between tropics and sub-polar zone.The locations of planetary winds are illustrated on the following figure:
c) Air masses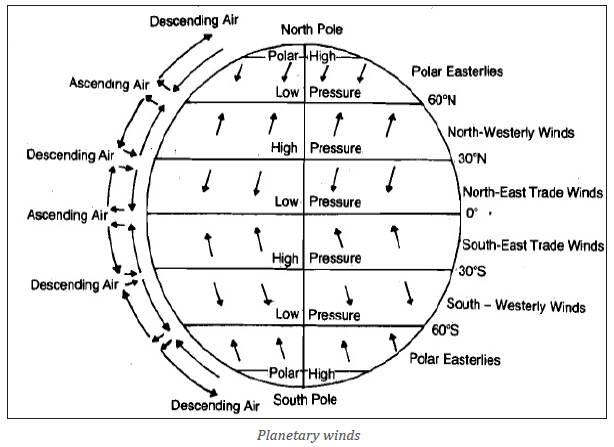
Air mass may be defined as a large body of air whose physical properties,
especially temperature and moisture content are uniform horizontally for
hundreds of kilometres. Air masses originate mainly from large areas with
uniform properties like desert, seas and oceans. There are therefore two broad
categories of air masses which are continental air masses and maritime air
masses.
iv) Influence of winds on weather conditions and human activities
Influence of winds on weather conditions
• The movements of the air affect the weather of surrounding zones.
Winds transfer heat and cold temperatures from one place to another
• Wind and ocean currents are the vehicles of water vapour which lead to
cloud formation which yield rainfall.
• The wind direction will have an important influence on the expected
weather. Wind direction changes often accompany changes in the weather.
• The wind speed and direction can give the clues to the expected weatherconditions.
Influence of winds on human activities
• The winds with high speed cause the destructions of physical and
human-made environment (e.g. Hurricanes, tornadoes, typhoon, etc.).
• Trees are bent under the wind effects and, sometimes this causes
accidents on the neighboring buildings and electric poles.
• Exposure of growing plants to warm wind results in dwarfing due to
dryness of plant tissue
• Wind increases evapotranspiration due to removal of accumulated
humid air near the leaves crop water requirements by.
• Moderate wind aids effective pollination. Strong wind during flowering
reduces pollination causes flower shed, increases sterility and reduces
fruit set in all crops.
• Wind speed more than 50 km per hour leads to destruction of crops
leading to heavy loss.
• Soil and sand particles blown by wind strike the leaves making punctures,
abrasions, scratches and tear the leaves into pieces and strips.
• The coastal area affected by strong winds faces the challenge of high
salinity due to salt particles drawn and deposited on the mainland. This
makes the soil unsuitable for growing plants.
• The crops on the windward slopes yield more because the constantsupply of moisture by warm winds from water bodies.
8.2.4. Atmospheric humidity
Activity 8.2.4Observe the diagram below and give answer to the questions that follow:
1. With reference to the knowledge and skills acquired from previous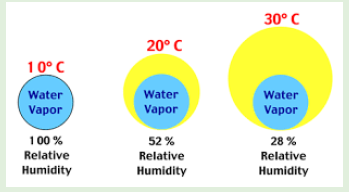
lessons; differentiate the above types of atmospheric humidity.2. Explain the significance of atmospheric humidity to the environment.
(i) Meaning of atmospheric humidity
Atmospheric humidity is the amount of water vapour in the atmosphere. The
water comes as a result of hydrological cycle.
(ii) Measurement and recording of humidity
Atmospheric humidity is measured using a hygrometer. This instrument
consists of a system of levers connected to a pen and record chart or graph
paper. Within the hygrometer system there are threads of human hair. When
humidity rises, the threads stretch and absorb moisture, whereas whenhumidity falls, threads dry and thin.
(iii) Types of atmospheric humidity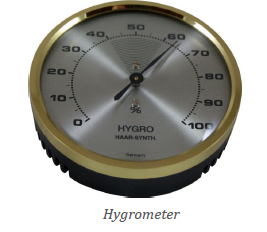
The following are the main types of the atmospheric humidity:
• Absolute humidity is defined as amount of water vapour per unit
volume of air at a given temperature. It changes with changing
temperature, and is expressed in gram per cubic meter volume of air
(gr/m3).
• Relative humidity refers to a ratio of the air’s actual water vapour
content and the total amount of water vapour air can hold at that
temperature and pressure. Relative humidity is generally expressed aspercentage. Relative humidity is calculated as follows:
(iv) Factors influencing atmospheric humidity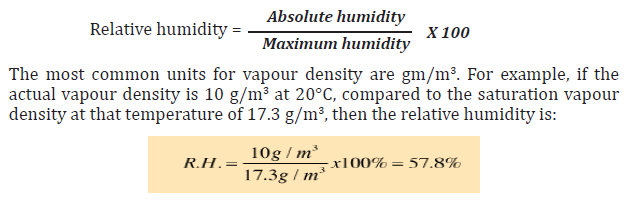
The following factors affect humidity:
• Temperature: An increase in the temperature of the air increases its
ability to hold moisture.
• Amount of water available: There is more evaporation over the Ocean
than the land. Therefore, there is more moisture over the Ocean than
the land.
• Wind-speed: Evaporation depends on the speed of wind. When the
winds are light, a thin layer of air just above the surface gets almost
full of moisture. When the wind speed is high, the air has less moisture.
• Area of the evaporating surface: Larger areas where evaporation
occurs increase the rate of evaporation.
• Mineral composition of water: The rate of evaporation is always
greater over fresh water than over salty water.
(v) The importance of humidity to environment
• It facilitates the weather fore casting. It is not possible to forecast
the weather exactly without precise knowledge of humidity in all the
layers of the atmosphere.
• Correct relative humidity is important for our well-being and health.
• It enables the hydrological cycle to operate normally. It enables much
water in form of vapour to be kept or stored in the atmosphere. Such is
condensed later to form precipitation.
• Water vapour is a key agent in both weather and climate, and it is an
important atmospheric greenhouse gas. This plays part in regulating
the Earth’s temperature.
• Humidity measurements contribute both to achieving correct
environmental conditions that sustain various ecosystems.
• Humidity drives most of the observable weather phenomena starting
with clouds, fog, rain, storms and finally to such dramatic weatherconditions such as hurricanes.
8.2.5. Cloud cover
Activity 8.2.5
Read critically the text below and answer the questions that follow:
Daniella always wakes up and observes the horizon of the sky. One day,
she observed the sky and found out that it was clear with white colour.
She continues to take note of the daily occurrences of the nature of the sky.
The next day she observed black colour in the sky, another day she found
sky approaching the tops of hills and the last day of her last observation;
she observed the sky being dark and reaching the ground. Now Daniella is
asking herself what is happening in the sky.
Help Daniella to be satisfied with clear explanations to her question
through answering the following questions:1. Explain what causes the different colours that arise in the horizon(i) Meaning of cloud
of the sky.
2. Describe the effects of the last observation of Daniella to theenvironment.
A cloud is an aggregation or grouping of moisture droplets and ice crystals that
are suspended in the air.
(ii) Types of clouds and their characteristics
Clouds are classified according to altitude and form. With regard to form, there are:
• Stratus clouds: These are layered clouds. They look like blankets and
cover large areas. They can give large amounts of rain or snow.
• Cumulus clouds: These have bubble-like bodies. They give rain over a
small area.
• Cirrus clouds: these are composed of small ice crystal which are white,
fibrous and feather like.
With regard to altitude, clouds are classified as:
• High clouds (form 6,000 m above the sea level). They look like feathers
and appear in separate groups in fair weather. In bad weather, they are
concentrated. Examples include:
─ Cirrus
─ Cirrostratus─ Cirro-cumulus
• Middle clouds (between 4,000 and 6,000 metres of altitude). They are
thick clouds. Examples include:
─ Alto-stratus
─ Alto-cumulus
They are mostly distributed over the whole sky. They appear white or grey.
• Low clouds (Below 2,000 metres). They are usually shallow. Examples
include:─ Stratus: They are dense, low-lying fog-like clouds of dark grey• Clouds with great vertical extent: They are found between 2,000 and
colour. They are composed of several uniform layers.
─ Strato-cumulus: They are generally associated with fair or clear
weather but occasional rain or snow.
─ Nimbo-stratus (Ns): They are middle and low clouds of dark colour.
They are associated with rain.
10,000 metres. They are white but may appear grey or black. They give
heavy rainfall. The following are examples:
─ Cumulus (Cu) which are very dense, widespread and dome-shaped
clouds. They also have flat bases and are associated with fair
weather. These sometimes are characterised by thunder.
─ Cumulo-nimbus (Cb) are thunder-storm clouds and produce heavy
rain, snow or hailstorm accompanied by lightning, thunder and
gusty winds. They exhibit a well-developed vertical extent. Theyappear like mountains or huge towers.
(iii) Factors influencing the formation and the shape of clouds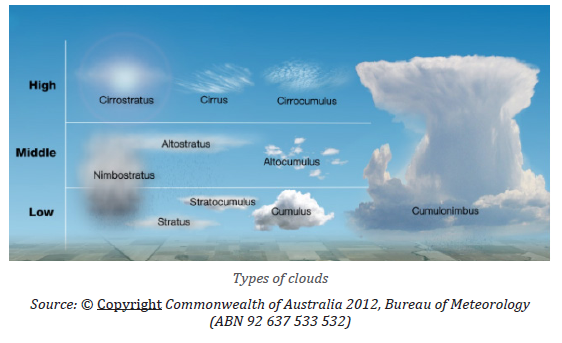
The sun plays a major role in formation of clouds. The first step of cloud
formation is related to the rising of the air into the atmosphere. Such air must
be moist or carrying water vapour that is later condensed to form clouds. The
following are the major factors influencing the rise of air into the atmosphere:• Sun: The sun heats the earth and thus the air rises, expands, and cools.
• Topography: Clouds are also formed when air encounters mountains
or other raised topography. The air rises and cools, condensing to form
clouds.
• Clouds can be formed when air rises along the slope of a mountain.
This aids the moist air to reach the atmosphere where it cools down,
condensing and as a result, clouds are formed.
• Warm and cold fronts: Weather fronts cause the rise of the air.
Specifically, warm fronts make the air to condense because the warmair rises above the cold air. This results into the formation of clouds.
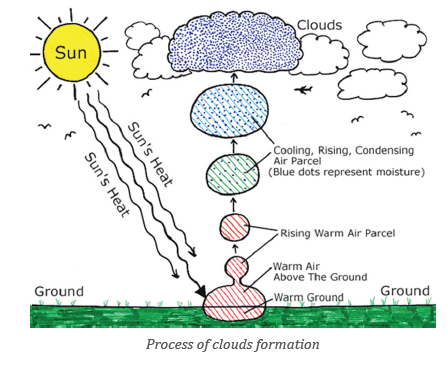
(iv) Effects of clouds on weather
The clouds are much important on weather conditions prevailing in a given
area as it is explained below:
─ During the day, the earth is heated by the sun. If skies are clear, more
heat reaches the earth’s surface. This leads to warmer temperatures.
─ If sky is cloudy, some of the sun’s rays are reflected back into space.
Little sun’s energy manages reaches the earth’s surface which causes
the earth to heat up more slowly.
─ The clear sky during day, leads to increase in temperature. At night,
cloud cover has the opposite effect. If skies are clear, heat emitted
from the earth’s surface freely escapes into space, resulting in colder
temperatures.
During a cloudy time, some of the heat emitted from the earth’s surface is
trapped by the clouds. This heat is reemitted back towards the earth. As a result,temperatures decrease more slowly than if the skies were clear.
8.2.6. SunshineActivity 8.2.6
Observe the following illustration and give answers to the questions thatfollow:
1. Describe what is presented on the above illustration?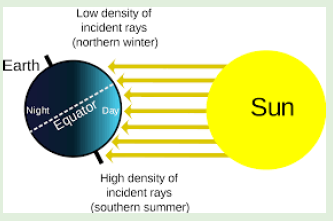
2. Arrows on the illustration show solar radiation reaching the earth
surface, explain the factors influencing the amount of solar radiation
in an area.3. Explain the negative effects of solar radiation on the environment.
(i) Meaning of sunshine
Sunshine refers to the energy emitted by the sun in form of rays. The sunshine
is observed and recorded during the day time.
(ii) Measurement and recording of sunshine
This is done using a Campbell-stokes sunshine recorder. The instrument
records the duration and intensity of sunshine. A line on the map joining placeswith equal sunshine is called isohel.
(iii) Factors influencing the amount of solar radiation
Solar radiation is not equal distributed all over the zones of the Earth due to the
following factors:
• Angle of the sun’s rays: The angle of the sun’s rays decreases as one
moves towards the poles, and vertical rays are associated with more
solar radiation,
• Length of the day: The shorter the duration of sunshine, longer the
period of night. This results into lesser amount of solar radiation
received at the earth’s surface and vice versa.
• Distance between the Earth and the Sun: The distance between the
sun and the earth changes during the course of a year. This is because
the Earth revolves around the sun in an elliptical orbit. At the time of
perihelion (on January 3) the earth is nearest to the sun while at the
time of aphelion it is farthest from the sun. At the time of perihelion,
the earth should receive maximum insolation while at the time ofaphelion it should receive minimum insolation.
─ Effects of the atmosphere: As solar radiation travels a long distance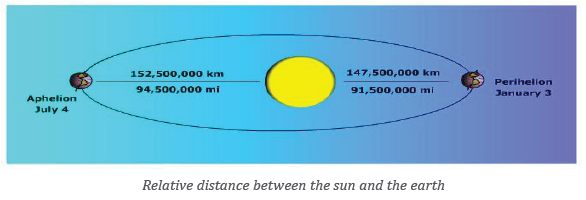
from the sun to the earth’s surface; there are some portions of the
solar energy which are lost through the processes of reflection,
diffusion, absorption and scattering.
(iv) Influence of sunshine on the environment
The sunshine has both positive and negative effects on the environment, as
briefly described in the following paragraphs:
Positive effects
─ Health benefits: Humans require between 1,000 and 2,000 units
of vitamin D daily for optimum health. The skin creates vitamin D
naturally when exposed to solar radiation.
─ Needed for photosynthesis: Sunshine is needed in photosynthesis
processes for autotrophic green plants and algae to produce the
compounds necessary for their survival.
─ Disinfection: Exposing bottled water to sunlight for six hours or
more can kill many harmful pathogens.
─ Production of energy: Sunshine can produce the energy which may
be used for different purposes.
Negative effects
─ Skin Cancer: The ultraviolet radiation present in sunlight can also
cause damage to the human and animal skins.
─ Eye Damage: Solar radiation can also prove harmful to the human
and animal eyes.
─ Damaging the crops and other vegetation: The excess of daily
sunshine without rain for long-term, becomes harmful to crops and
other vegetation because all water which would support the crops/vegetation evaporates.
8.2.4. Atmospheric pressureActivity 8.2.7
Critically observe the following picture and answer the questions thatfollow:
1. With your observation what is taking place in experiment above?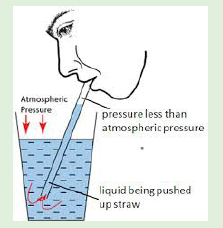
2. Compare and contrast the pressure from the straw and pressure
from atmosphere.
3. Explain the factors that can influence the distribution ofatmospheric pressure at a given surface.
i) Meaning of atmospheric pressure
Atmospheric pressure is the force per unit area that is exerted against the
Earth’s surface by the weight of air above it.
ii) Measurement and recording of atmospheric pressure
The barometer is the instrument used to measure atmospheric pressure. There
are two types of barometers: Mercury barometer and Aneroid barometer. The
line on the map joining places with the same atmospheric pressure is called
isobar.
iii) Factors influencing the distribution of atmospheric pressure
The following factors influence atmospheric pressure:
• Altitude: The pressure at the ground level is higher than that at the
top of high mountains. This is because air at the ground level has to
support the weight of the air above it.
• Temperature: When air is heated, it expands. When this happens,
the outward pressure of its molecules is spread over a large area.
This means the pressure of the air decreases. The pressure of the air
therefore rises when its temperature falls.
• Latitude: The earth is not a perfect sphere and therefore force of
gravity varies according to latitude. This is at maximum at the poles
and a minimum at the equator. Atmospheric pressure is therefore
lower at the equator and higher at the poles.
• Season of the year: Atmospheric pressure changes with seasons of
the year being high over the cold continental interiors in winter and
conversely low over the heated continents in summer.
• The nature of earth’s surface: During the day, land heats up morethan the water and hence air pressure is lower over land than the sea.
Application Activity 8.2
Observe carefully the table below showing rainfall and temperature dataof Weather Station K in country R.
Answer the following questions: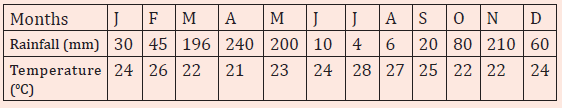
1. i) What is the driest month of the year?
ii) What is the wettest month of the year?
iii) Calculate the total annual rainfall.
iv) Calculate the mean annual temperature.
v) Draw the graph portraying the data in the above table.
2. Briefly explain the factors that influence weather and climate.
3. Walk around the school and observe the way the wind is blowing by
movement of tree branches. Then describe the direction in which thewind is blowing.
8.3. Factors that influence world climate
Activity 8.3
Explain how the following influence climate of any region:(a)Latitude; (b) Altitude; (c) Water bodies
The following are the main factors influencing world climates:
i) Latitude: The equatorial zone experiences high temperature and
precipitation, while they are low at the polar zone. This is due to the effect
of convergence of tropical trade winds that converges at equatorial
region. Their convergence causes the ascendance of air masses and the
formation clouds which generate much rainfall.
ii) Altitude: Temperature decreases with increasing altitudes from the
earth’s surface. Precipitation, called orographic precipitation, on the
other hand increases with the altitude.
iii) Presence or absence of water bodies: the temperature of regions near
lakes or seas are influenced by the proximity of these large water bodies.
When the continent is cool it can be warmed by the heat emanating from
water bodies.
iv) Vegetation: Vegetation influences precipitation and moderate
temperatures. Through transpiration, clouds form near the forests and
precipitation occurs.
v) Human activities: Pollution from industries affects the climate. Chemicals
and gases that are released into the atmosphere cause acid rain.
vi) Ocean currents: The warm ocean currents from tropical areas to cold
zones raise the temperature in these areas. For example, the Gulf Stream
increases the temperature of the coastal areas of North-Western Europe.
While Kuroshio warm currents raise the temperature of the coasts of Japan.
vii) Monsoons winds: These are seasonal winds which reverse their
direction at least twice a year. This results in the air blowing from the land
to the Ocean in winter and from Ocean (water) to the land in summer.
This situation makes the summer to be hot and wet and winter to be coldand dry in the affected areas.
Application Activity 8.3
Read the following context and give feedback to the questions that follow:
Generally, climate of any region or area is influenced by both physical
factors (Latitude, altitude, water bodies, vegetation, ocean currents
and aspect in relation to location) and human factors (pollution from
industries, Chemicals released into the atmosphere, cutting down of
forests /deforestation, over cultivation, overgrazing, land reclamation
and construction).Illustrate these geographical factors in Rwandan context.
8.4. Types of climate and their characteristics
Activity 8.4Observe the maps provided below and answer the questions that follow:
Identify the types of climate shown by the maps Q, P and X and identify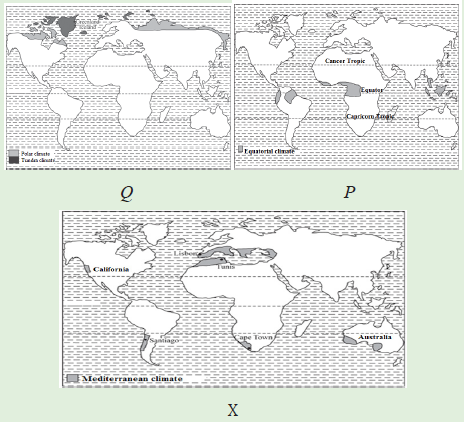
their characteristics
The classification of climatic zones is based on temperature and rainfall. There
are three world climatic zones. These are: Tropical, Temperate and Cold zones.
8.4.1. Tropical zones
i) Equatorial climate and characteristics of equatorial region
Equatorial climate is also called tropical wet climate or tropical rainforest
climate. It is found along the equator extending from 5° to 10° South and North
latitudes. Along the Eastern margin of continents, it spreads to 15° - 25° of
latitudes. This type of climate is found specifically in the amazon basin in South
America, the Congo basin in Africa, Malaysia, Indonesia in the south East Asia
and etc.
The following are the major characteristics of equatorial region:
• This climatic region is located within 5° to 10° south and north of the
Equator.
• The average monthly temperatures are over 18°c. However, many
places record average monthly temperatures of 24° to 27°c.
• The Equatorial regions lie in a belt where the winds are light. It is a
low-pressure belt.
• The annual range of temperature varies from 5°to 8°c.
• The annual average rainfall in the equatorial climate is nearly 2500
mm.
• There is a large amount of cloud.
• Conventional rainfall is received, and it is usually accompanied by
thunderstorms.
• High temperatures and heavy rainfall encourage growth of natural
vegetation. There are evergreen dense forests.Below is an example of Singapore weather station in x year:
(ii) Tropical marine climate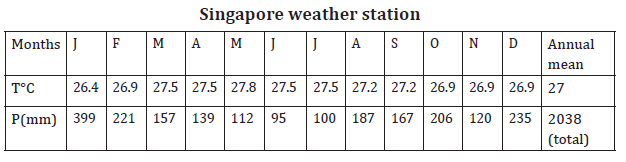
It is found on the East coasts of regions lying between 10° N and 25° N and
10° S and 25° S of the equator. These areas come under the influence of onshore
Trade Winds. Examples are East coast of Brazil, the Eastern coastlands of
Madagascar, Mexico, Nicaragua, Guatemala, Venezuela, the lowlands of Central
America, West Indies, the coast of Queensland (Australia) and the southern
islands of the Philippines.
Climatic characteristics of Tropical maritime/maritime climate
• The annual temperature range is about 8°c.
• Temperatures reach 29°c during the hot season while it is about 21°c
during the cold season,
• Annual rainfall varies from 1000 mm to 2000 mm.
• Rainfall received is both convection and orographic brought by onshore
Trade Winds.
• Humidity is high throughout the year.
• Sea breezes lessen the effects of the heat.
• Tropical maritime climate is good for tree growth. The lowlands havetall and evergreen trees.
(iii) Tropical continental climate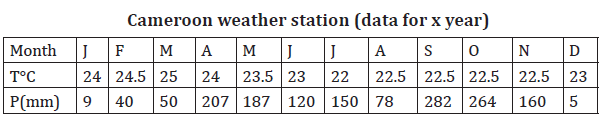
This climate occurs between 5° N and 15° N and 5° S and 15° S. It is in West,
East and Central Africa, South America, parts of the Deccan plateau (India) and
the areas to the north and east of the Australian Desert.
Climatic characteristics of Tropical continental climate
• Heavy convectional rainfall is mainly in the summer.
• Annual rainfall is about 765 mm.
• In some regions, the offshore winds are strong and hot. An example is
the Harmattan of West Africa.
• Humidity is high during the hot, wet season.
• Summers are hot (32° C) and winters are cool (21° C).
• The annual temperature range is about 11°C. The highest temperatures
occur just before the rainy season begins. This is in April in the northern
hemisphere and October in the southern hemisphere.
iv) Savannah climate (Tropical wet-and-dry climate)
This is located between 5° and 20° latitudes on either side of the Equator. It is
found in Latin America. These are the Llanos of the Orinoco Valley including
Colombia and Venezuela, the Guyana Highlands and the Campos of Brazil.
In Africa, it is found in the South of the Congo basin, the Southern part of
Democratic of Republic of Congo, Angola, Zambia, Mozambique, Tanzania,
Uganda, Botswana, South-Western Madagascar, Central Nigeria, Southern
Kenya, Togo, Ghana and Ivory Coast.
Climatic characteristics of Savannah Tropical climate
• High temperature of around 20°c.
• The annual range of temperature is greater than in the equatorial
regions. It is over 3° but not more than 8°c.
• Total annual average precipitation varies from 1000 mm to 1500 mm.
Much of the rain falls during the summer.
• The vegetation is grasslands with scattered trees and bushes.
(v) Tropical desert climate
Most of these deserts lie between 15° to 35° N and S of the equator. The hot
desert climate is found in the following deserts: Atacama (the coastal deserts
of Peru and Chile in South America), the Namib and Kalahari deserts of coastal
Angola and South West Africa, interior part of Botswana and South Africa, the
great Australian desert, the Sahara and the Arabian deserts, the Iranian desert,
the Thar desert of Pakistan and India, California (USA) and the deserts of
Northern Mexico.
Climatic characteristics of Tropical desert climate
• Hot deserts have the high temperatures throughout the year.
• They have cloudless skies and little or no humidity.
• The daily ranges of temperature vary between 22° to 28° C. In rare
cases, the diurnal range may be as high as 41.7° C.
• The annual average precipitation is less than 250 mm.
• Relative humidity is high.
• There is little plant cover.Below is an example of Khartoum (Sudan) weather station:
vi) Tropical Monsoon Climate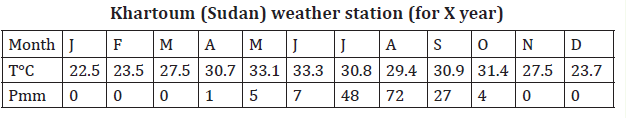
This is found in areas with seasonal land and sea winds. On-shore summer winds
blowing from over tropical warm Oceans bring about heavy precipitation. Offshore
winds from over the land make the weather dry during winter.
Monsoon climate is found in the coastal areas of Eastern and Southern Asia.
These places include India, Burma, Bangladesh, Indo-china, Southern China,
and Philippines, Taiwan, Japan and Korea.
In tropical Africa, it is found along the South-West coast of West Africa. These
areas include the coasts of Guinea, Sierra Leone, Liberia, and Ivory Coast.
Other areas are the Northeast coast of Latin America from the mouth of Orinoco
River in Eastern Venezuela through Guyana, Surinam and French Guyana to the
North-Eastern part of Brazil. The North coasts of Puerto Rico and the Dominican
Republic in the Caribbean Islands which have a mild monsoon climate.
Characteristics of Tropical monsoon climate
• High temperatures (32°c) in the hot season (summer) and low
temperatures (15°c) in the cold season (winter).
• High annual range of temperatures of about 17°c.
• Summers receive high rainfall of up to 2500 mm.
• The winters are dry.
• There is a reversal of winds. In one season they blow from sea to land
(onshore). These bring heavy rainfall. In the other season, they blowaway from the sea (offshore), such come along with little rain.
8.4.2. Temperate zone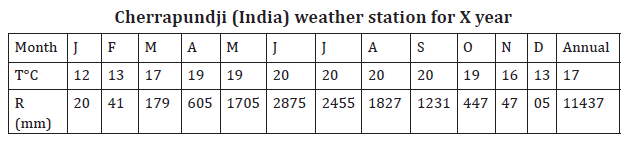
i) Mediterranean Climate
Mediterranean climate is found between 30°and 40°N and S of the equator. This
is on the western sides of the continents. This climate is found in five regions
of the world:• North of the Mediterranean Sea from Portugal to Turkey and beyond• The central and Southern California coast in the United States of America.
in the Iranian Highlands, Morocco, Northern Algeria, and Tunisia, andNorth of Bengasi in Libya.
• Central Chile.
• The Cape Town area of South Africa, and
• Southern Western coasts of Australia.
Characteristics of Mediterranean climate
• The average temperature of the coldest month is between 4.4°C and
10°c. That of the hottest month is between 21° C and 27°c.
• The mean annual temperature ranges are between 11°and 17°c.
• The average annual precipitation is between 350 and 750 mm.
• There is rain in winter while the summers are dry.Below is an example of Algiers (Algeria) weather station:
ii) Temperate Maritime Climate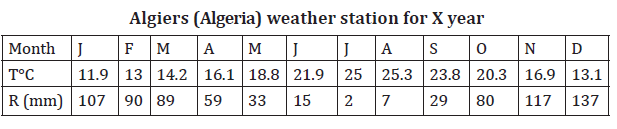
This type of climate is found between 40° and 65° N and S of the equator. These
are regions to the West of continents.
It is mainly found in Western Europe including Great Britain, North Western
France, Germany, Denmark, Holland, Belgium and Norway.
In North America, it is found along the West coast up to 60° N of the equator.
It borders the Sub-Arctic climate of Canada and Alaska. In Europe, it extends
along the west coast of Norway to 68° N.
In the Southern Hemisphere, it is found to the Southwest coast of Chile,
Southeast coast of Australia, the islands of Tasmania and New Zealand.Below is an example of Brest (France) weather station:
Characteristics of Temperate Maritime climate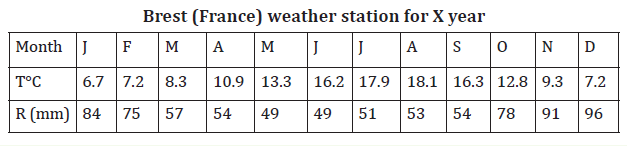
• Temperatures are influenced by the warm Ocean currents.
• This climate has cool summers and mild winters.
• The annual range of temperature is about 7° C.
• Average temperatures in summer are between 15° C and 18° C. Winter
temperatures range between 11° and 17° C.
• In Europe, the lowlands receive an average precipitation of 500 mm to
850 mm. On the windward side, it is between 2500 mm and 3750 mm.
iii) Continental Temperate climate
This type of climate occupies a large part of the United States of America. In
Europe, it is found in Romania and Bulgaria. It occupies the lower Danube Valley.
In Eastern Asia, it is found in North China bordering the yellow Sea, North and
South Korea, and Northern Honshu in Japan.
Characteristics of continental temperate climate
• Temperate continental climates are found on continents in the
Northern Hemisphere between 40o-70o
• Climate in these areas is controlled by the fact that they are not located
near Oceans where temperatures are moderate.
• Temperate continental climates are also called micro thermal climates,
because they are located away from the Oceans. These climatic zones
experience the extremes of temperatures.
• Summers are warm and can be very humid while winters are cold with
snowstorms and blustery winds.
• The annual average temperatures are around 100 C.
8.4.3. Cold zone
i) Polar and Tundra climate
The Tundra climate is found in the northern hemisphere beyond 60° N of the
equator. These are areas to the North of Asia and Canada. It also occurs on the
coast lands of Greenland. Polar climate is found in Greenland, interior of Iceland
and in the Antarctica.
Characteristics of Tundra climate
• The average annual rainfall is 250 mm.
• Precipitation is in the form of snow in winter and rainfall in summer.
• Humidity is low because of low temperatures.
• Winter temperatures are low. They range from - 29°c to 4°c. Summer
temperatures average about 10°c.
• Vegetation consists of mosses, lichens and dwarf trees and shrubs. It is
called tundra vegetation.
Characteristics of Polar climate
• Temperatures are always low. They are below 0°c, which leads to snow.
• Precipitation mainly occurs in summer. It averages between 100 mm
and 250 mm.
• Winters are associated with one continuous night. Summers are one
continuous day.
• Blizzards are common. These are snowstorms with high winds.
Visibility is low.
• There is hardly any vegetation. This is because of snow and ice cover.Below is an example of ours weather station for X year:
ii) Mountain climate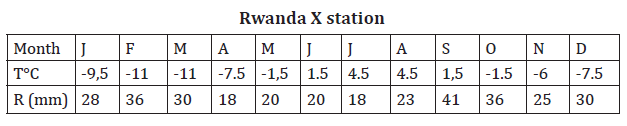
This type of climate is found in the mountain ranges of the world. These include
Mt. Kenya, the Ethiopian Highlands and the Alpine ranges of Europe. Others are
the North Western part of Rwanda, especially over volcanic region, the Andes
of South America and the Rockies of North America.
Characteristics of Mountain climate
• High rainfall on the windward slopes. It is less on the leeward slopes.
• Orographic rainfall is received.
• Pressure and temperature decrease with altitude.
• But if the mountains are high enough, there is a height at which
maximum precipitation occurs and above which it decreases.
• It is also characterized by strong local winds (mountain and valleybreezes).
Application Activity 8.4
a) Draw a world sketch map and on it mark and label the world climatic zones.
b) Describe the characteristics of each climatic zone shown on thatworld sketched map.
8.5. Influence of climate on human activities
Activity 8.5
“People in North Western part of Rwanda grow Irish potatoes, while
people in Southern Rwanda grow cassava and those of Eastern Rwanda
grow bananas. Again, in some regions of Rwanda tea is grown as a cash
crop while other does not”.
Hence explain how those crops grown are influenced by climatic conditions
in each part.
Climate influences the distribution of population. This is because of temperature
conditions, amount of precipitation and length of crop growing season.
The relationship between climate and human activities is summarized below:
i) Human activities in equatorial regions: Heavy rainfall and high
temperatures support growth of forests. The main human activities are
lumbering and agriculture. Crops such as coffee do well in this type of
climate.
ii) Human activities in savanna climate: This type of climate is good for
agriculture and dairy farming. There is enough grass for the animals.
Growing of vegetables is done in this type of climate.
iii) Human activities in desert climate: The high temperatures and low
rainfall are not supportive for agriculture. Animal keeping is also not well
developed only camels, goats and sheep are kept in such type of climate.
Furthermore, it is only around the oases that some farming is done.
iv) Human activities in temperate climate: This type of climate is suitable
for agriculture and livestock keeping. Most developed countries are in
this type of climate. These zones have high population.
v) Human activities in polar climate: The main activities in this zone arethe fishing and hunting. Few people are found here.
Application Activity 8.5
“Most of entrepreneurs look for climatologists and meteorologists toadvise them when locating their firms”, Discuss the statement.
Skills lab
Good and favourable climate is a key factor to the development of all human
activities. With the help of your local leaders organise a seminar on how
conservation of the natural environment can lead to a good climate and hence
leading to the economic growth of the country.
End unit Assessment
1. With aid of diagram describe the structure of atmosphere.
2. To what extent atmosphere plays a considerable role in regulating/
control negative effects of solar radiation?
3. Visit a weather station near your school to identify instruments
used to measure and record weather conditions.
4. (a) Briefly describe the characteristics of Rwandan climate,
(b) Explain the factors influencing the climate of Rwanda.
5. “Human activities depend upon climate and weather conditions ofan area” with relevant examples in Africa, support this statement.
UNIT 9: NATURAL VEGETATION OF THE WORLD
Key unit competence: The student-teachers should be able to appreciate
the distribution of different types of vegetation inthe world.
Introductory activity
Vegetation is important to man in various ways and it acts as habitat place for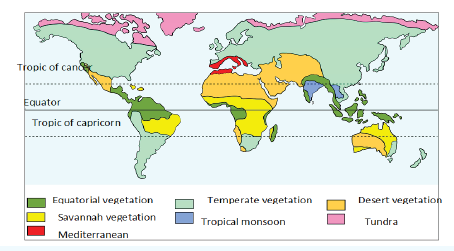
wild animals. There is need to conserve it due to its significance. The different
countries have come up with environmental campaigns aimed at protecting
natural vegetation for environment and sustainability.1. Identify the different types of natural vegetation shown on the mapVegetation refers to a community of plants which grow in an area and which
provided above.
2. Describe the factors influencing the distribution of world vegetation.
3. Why is it important to conserve natural vegetation and how can wepreserve our natural vegetation?
gives it distinct character. Vegetation in biological terms is known as “flora”,
that is, all vegetation types growing on land and in water.
The world vegetation communities are into categories: forests and grasslands.
They are distributed according to the vegetation zones and they include
tropical, temperate, tundra, desert, mountain and aquatic/marsh or mangrovevegetation.
9.1. Tropical forests and their characteristics
Activity 9.1
Observe the photograph provided below and answer the questions that follow: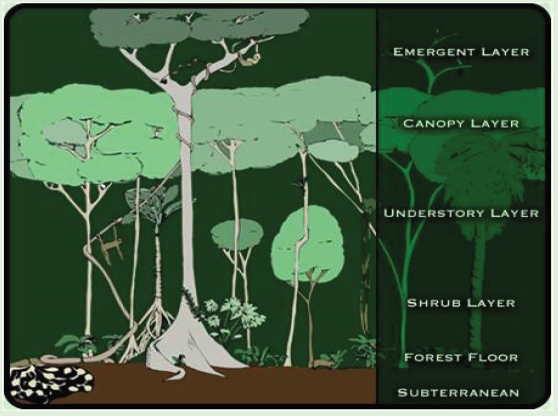
1. Describe the characteristics of the vegetation presented in the
illustration above.
2. What type of vegetation shown in the illustration above basing on
the characteristics described in (1) above?3. Identify and describe different types of tropical forests.
Tropical vegetation develops within the tropics. Tropical vegetation can be
sub-divided into three but related groups. These include equatorial rainforests,
tropical monsoon forests and tropical mountain forests.
9.1.1. Equatorial forests
The equatorial rainforests grow within the tropics between 10 °N and 10 °S
of the equator. Equatorial rainforests are sometimes called “rainforests”.
Equatorial rain forests cover only a small part of the earth’s surface, which is
about 6% of the earth’s surface. They are situated in Amazon basin in South
and Central America, Congo basin in Central Africa, Malaysia, Burma, and West
African coastal belt (Nigeria, Ghana, Ivory Coast, Liberia and Central AfricaRepublic).
The conditions necessary for the growth of equatorial rainforests: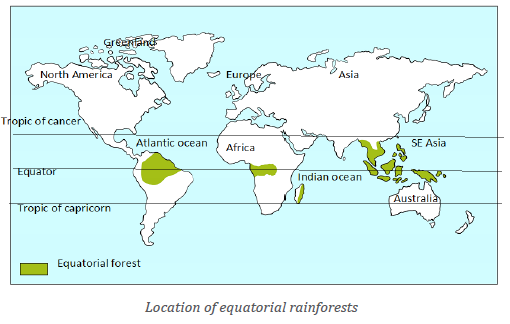
• Equatorial rainforests receive rainfall throughout the year about 2000
mm per year.
• The equatorial rainforests grow in areas with good fertile soils and
well-drained soil.
• The equatorial rainforests require much sunshine to support their
dense growth.
• The equatorial rainforests require temperature about 23-240c.
Equatorial rainforests are characterized by the following:
• Equatorial rainforests are evergreen, since the forests receive heavy
rainfall throughout the year with no clear distinct seasons.
• Equatorial rainforests grow buttress roots in order to support their
enormous sizes.
• The major tree species in equatorial are characterized by a long
gestation period.
• The Equatorial rainforests receive rainfall throughout the year with no
distinctive seasons.
• Vegetation in equatorial regions is comprised of four vertical layers
starting from the canopy of tree to the ferns on ground.
• Equatorial rainforests are dominated with valuable tree species such
as mahogany, ebony, green heart and redwood.
• The forest floor receives low quantity of the sunlight. This has led to
the existence of little undergrowth.
• The trees are very tall (35 m - 40 m) with a very dense and thick
canopy. The result is that the canopy blocks most of the sunlight falling
on them depriving the plants under them of sunlight Most of the trees
in Equatorial rainforests become tall in search of light.
• There are broad-leaved evergreen forests of dense and prolific growth
of flora as well as fauna.
• The major tree species do not grow in pure stands. Trees of pure stands
are scattered all over the forest.
• Beneath the tree canopy exists a well-developed layering of understory
vegetation, which is so dense and this limits light to reach the floor of
the forested area.
The Equatorial rainforests are associated with various economic activities.
These include lumbering as a major activity, provision of local materials which
are used in craft industry, provision of fuel, research and study, provide herbal
medicine, support agriculture, etc.
9.1.2. Tropical Monsoon forests
The Tropical Monsoon Forests found beyond the equatorial region between 100 and 250
Northand South of the equator. This type of vegetation is found in
areas such as; Burma, Thailand, the Indo-China region, parts of India, East Java,
parts of Northern Australia, small parts along the South Western coastal areasof West Africa.
The conditions necessary for the growth of tropical monsoon forests: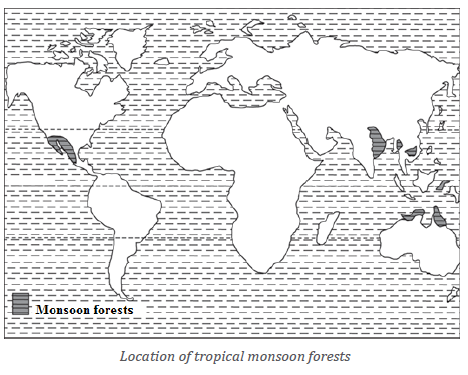
• The tropical monsoon forests receive heavy rainfall, which is around
2000 mm per year. This is received mostly in summer.
• In cooler seasons such as winter, very little rainfall is received. This is
because these regions lie under the offshore trade winds.
• The tropical monsoon forest requires temperatures of about 270c.
This temperature is moderately enough to support the growth of
various plants.
Tropical monsoon forests are characterized by the following:
• The trees possess trunks that they use to store water during the dry
seasons.
• The tropical monsoon forests can grow up to 30 meters in height.
• Trees possess long tap roots that penetrate into the ground to access
groundwater. In order to sustain plants growth, especially during the
dry winter season when there is unreliable rainfall.
• Tropical monsoon forests shade off their leaves during the dry seasons
in order to minimize water loss.
• Trees have broad leaves due to sufficient rainfall (2000 mm) received
during wet season.
• Tropical Monsoon forests experience temperatures that reach 280c
especially in Summer.
• Tropical monsoon forests contain valuable hard wood tree species
such as the teak and sandalwood.
The tropical monsoon forests are associated with various economic activities
such as lumbering on the wider area, agriculture, craft industry, settlement
pattern and provide herbal medicine.
9.1.3. Mountain tropical forests
The tropical mountain forests are mainly located at a high altitude in the
mountains. These usually vary largely along the slopes of Himalayas Mountain
ranges and East African Mountain peaks of Rwenzori, Mt. Kenya and other good
examples include; Cameroon Mountains, and Ethiopia Highlands. The trees
grow in plenty between the altitude 1,500 meters to 3,500 meters. This explains
why such areas are dominated by mountain forests. These have evergreen trees
like Teak, Bamboo, and other tree species such as Pine, Fir, Oak, Maple, Deodar,
Laurel Spruce, Cedar, cedar pod carp and camphor. All these grow abundantlyand dominate the natural vegetation in the area.
The conditions necessary for the growth of mountain forests: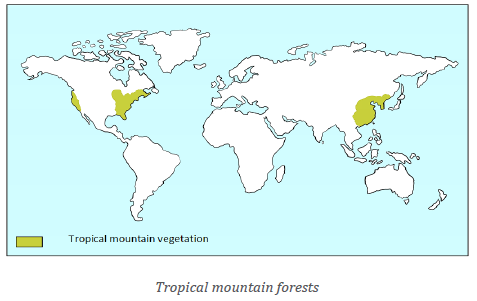
• Mountain forests require much and reliable rainfall;
• Mountain forests require adequate temperature for the growth of tress;
• Mountain forests need deep fertile soil for the growth of forests;
Mountain forests have the following characteristics:
• Mountain forests grow broad leaves and they are evergreen;
• Mountain forests grow thick under growth;
• The forests contain giant evergreen trees that grow on the windward
slopes of the mountain;
• The main tree species are characterized by long gestation period;
The mountain forests are associated with various economic activities such as
lumbering on the wider area, provision of local materials, hunting of animalsand provide herbal medicine.
Application Activity 9.1
1. Briefly explain the geographical conditions that determine the
location of equatorial forests.
2. It has been noted that environment is composed of varieties of
natural resources that support socio-economic development of
any country. Forests fall under such natural resources. Explain
the influence of different categories of tropical forests to thedevelopment of Africa.
9.2. Temperate forests and their characteristics
Activity 9.2
Read the passage provided below and give feedback to the questions that follow:
Temperate forests occur in Eastern North America, North Eastern
Asia, Western and central Europe. Temperate forests are those, which
grow outside the tropics. They are divided into three categories namely
deciduous forests, Mediterranean forests and coniferous forests.
Temperate forests are located between 300 and 700 North and 30 0 and 70o
South of the equator.
1. Identify the types of forests mentioned in the passage above.
2. Compare and contrast the types of forest indicated in the passage
above.
The temperate forests are categorized into 3 categories that include: deciduousforests, Mediterranean forests and coniferous forests.
The conditions necessary for the growth of temperate forests: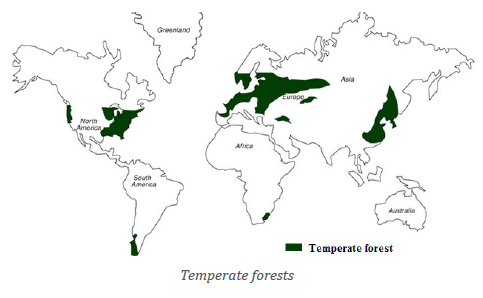
• Temperate forests need little supply of sunshine for the successful
growth.
• Temperate forests require enough fertile soil and availability of water
for growth.
• Temperate forests require amount of rainfall about to 750 mm in dry
period.
The characteristics of temperate forests
• With high levels of precipitation, humidity, temperate forests have a
variety of deciduous trees.
• Trees shed their leaves in fall in winter and bud new leaves in spring
when warmer temperatures and longer hours of daylight return.
• Temperate forests have tall evergreen trees dominating the regions.
• They have Redwood trees which are the tallest in the world, the most
prominent tree type in temperate forest is Douglas.
• Temperate forests have epiphytes species such as mosses and ferns
that live on the branches and trunks of trees, especially the broadleafed maples.
The temperate forests are associated with various economic activities. These
include tourism which is supported by the presence of many different species
of birds such as like broad-winged hawks, cardinals, snowy owls, and pileated
wood peckers that attract very many people from different parts of the world.
There is also hunting due to different types of animals such as white-tailed deer,raccoons, opossums, porcupines and red foxes.
9.2.1. Mediterranean forests
The Mediterranean forests are located mainly in South West America, Spain, Italy,
France, Australia, Algeria, Morocco, Tunisia, and Central Chile. Mediterraneanforests grow also well in South Africa near Cape Town.
• Mediterranean vegetation is characterized by open and evergreen woodlands.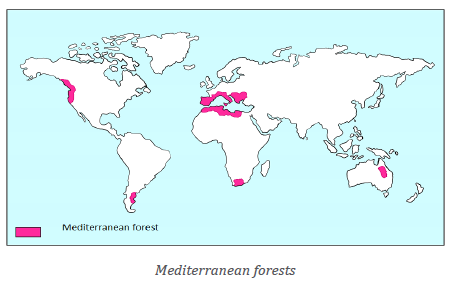
• Mediterranean vegetation has deciduous tree species with long
gestation period and thicket with thin and waxy leaves.
• They are composed of broadleaf trees, such as the oak and mixed
sclerophyllforests.
• Mediterranean vegetation has dense foliage composed of broadleaved
evergreen shrubs, bushes, and small trees. There is inadequate undergrowth.
Tall trees grow in regions lying between 30° and 40° North and South latitudes
• There are woody, evergreen shrubs or small trees that have developed
various strategies of growth and usage of available water during the dry period.
• Mediterranean plants have long taproots to reach underground water,
called “Xerophytic Plants”.
• Mediterranean trees adapt themselves to dry summers with the help
of their thick barks and wax coated leaves. These reduce the rate of transpiration.
The Mediterranean forests are associated with various economic activities
such as mining of oil, tourism, and very limited population settlement. There is
also rearing of sheep and growing of crops such as wheat, oats and cultivationof chestnuts.
9.2.2. Coniferous forests / Taiga Forest
The coniferous forests are located across North America, Europe, and Asia.
These forests are found within the extent of 50˚ to 60˚N. The coniferous forest
is the largest terrestrial vegetation covering about 17% of Earth’s land area.
Countries such as Canada, Russia, and Scandinavia are almost entirely covered
by these coniferous forests. The vegetation is identified by its climate, whichoccurs almost exclusively in the high latitudes of the Northern hemisphere.
Coniferous forests are favoured by the following environmental conditions: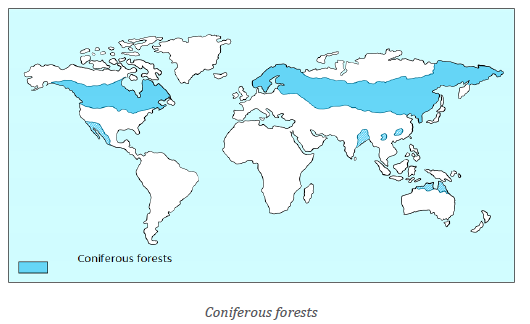
• The coniferous forests require inadequate supply of sunlight.
• The coniferous forests need medium fertile soil with availability of water.
• The coniferous forests grow well with an average temperature of
below 430 F during the winter season.
The characteristics of coniferous forests are:
• The coniferous forests consist of tall, straight and softwood evergreen
trees with few branches.
• There are limited species of trees. The existing trees are evergreen and grow apart.
• The type of trees in these coniferous forests grow in pure stands, to a
height of over 30m.
• Trees are conical shaped with needle-like leaves. These include firs,
pine and cedar which are important variety of trees in these forest.
• Coniferous tree species grow shallow roots and can collect enough
water from top soil;
• They have shallow roots used to absorb the nutrients and water from
the top soil;
• The coniferous vegetation has adapted to harsh conditions associated
with winter season.
• Leaves are small, narrow with the capacity of reducing transpiration.
The coniferous forests are associated with various economic activities
which include lumbering, tourism, apiculture (bee keeping), hunting, herbal
medicines, fruit gathering and Research and study.
9.2.3. Deciduous forests
Deciduous forests grow well within the latitude of 40° N and 60°N and 30° S and
50oS of the equator. Deciduous forests can be found in the Eastern half of North
America, and the middle of Europe. There are many deciduous forests in Asia.
Some of the major areas having deciduous forests include, Southwest Russia,
Japan, and Eastern China. South America has two big areas of deciduous forests
in Southern Chile and Middle East coast of Paraguay. These are also located inNew Zealand and South Eastern Australia also.
The conditions necessary for growth of deciduous forests: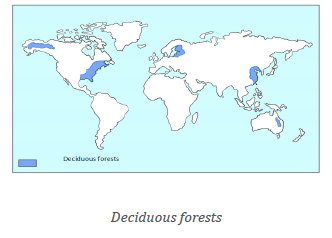
• Deciduous forests require moderately distributed rainfall.
• Deciduous forests need low sunshine supply.
The characteristics of deciduous forests:
• Trees shed their leaves in the dry season to conserve water.
• Deciduous forests are characterized by existence of epiphytes, which
include mosses.
• They contain hard wood trees like sandalwood, maple, oak, beech,
teak, ebony, bamboo, etc. which are the common trees found here.
They require low sunshine supply.
• Deciduous forests grow in pure stands, have a short growing gestation.
The deciduous forests are associated with various economic activities which
include lumbering, tourism activity, hunting, herbal medicines and fruit gathering.
Application Activity 6.2
Identify the characteristics of Mediterranean forests.
9.3. Grasslands in tropical zone and their characteristics
Activity 9.3
Observe the photograph provided below and answer the questions that follow:
1. Referring to your observation, describe the characteristics of the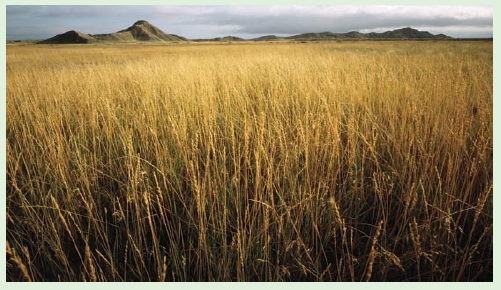
grassland shown above.
2. Suggest two world areas where such presented vegetation is found.3. Distinguish savannah humid from savannah dry grasslands.
Tropical grasslands are commonly known as savannah vegetation. Tropical
grasslands grow well within altitude of 50 N and 15o N and 50 S and 15o S of
the equator. Tropical grasslands grow well in Africa, South America specifically
in Campos in Brazil”. They can also be found in Guyana, Australia, Eastern
Madagascar and India. Tropical grassland is divided into two groups: Savannahand steppe.
9.3.1. Savannah humid vegetation
Savannah humid forests grow well in regions experiencing the average total
rainfall of 1000 mm per year. Miambo woodlands of central Tanzania is one
of the examples of savannah woodlands in East Africa. Other examples of
savannah humid are found in Madagascar, Indian subcontinent, South East Asiaand New Guinea.
The conditions necessary for the growth of Savannah humid vegetation: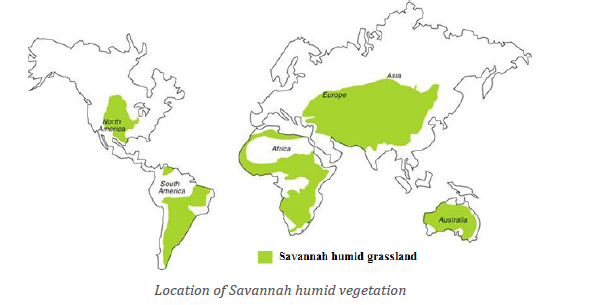
• The savannah humid can grow well in regions experiencing
temperatures ranging between 250C to 320C.
• Savannah humid vegetation grows well in areas which experience
rainfall about 750 mm to 1000 mm per annual.
• Savannah humid needs maximum sunshine and light necessary for the
plants to make chlorophyll.
The characteristics include the following:
• The tree species are deciduous, and shade leaves during the dry periods.
• The Savannah vegetation is mostly characterized by undergrowth
dominated by shrub and short grasses.
• The species of trees such as baobab and acacia are mostly common in area.
• The grass can grow very tall, about 3 to 4 meters in height. The common
type of grass is known as “elephant Grass.
• Most tree species in the savannah woodlands form small umbrella.
• The non-thorny trees such as baobab, candelabra, and the Jackal berry
are found in savannah grasslands
The Savannah humid vegetation is associated with various economic activities
such as; hunting, herbal medicine collection, fruit gathering, rearing of animals
and subsistence farming, settlement, mining and gazetting of national park and
game reserves.
9.3.2. Steppe/ Savannah dry vegetation
Savannah dry covers almost half the surface of Africa (central Africa) and large
areas of Australia, South America, and India. Climate is the most important
factor in creating a savannah dry vegetation. Savannahs are always found in
warm or hot climates where the annual rainfall is from about 508 to 1270 mm
per year. These regions receive rainfall for about 6 to 8 months. This is followedby prolonged dry period that is usually affected by fire out-breaks.
The conditions necessary for growth of Savannah dry/steppe vegetation: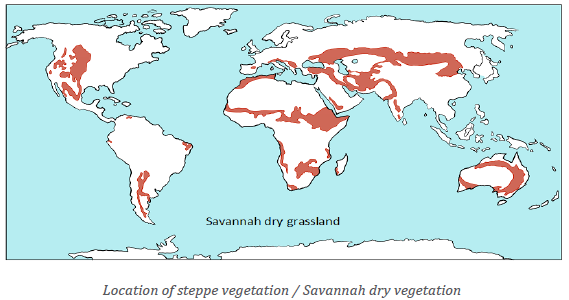
• The soil which is dry and porous, with rapid infiltration of water.
• Dry climatic conditions that support the growth of different grasses
due to disparities in rainfall and soil conditions.
• Availability of average annual rainfall of 762-1016 mm.
• Presence of soils that are too thin. Trees require the existence of
termite mounds where they grow.
The main characteristics of Savannah dry vegetation are:
• The trees and grass grow through direct competition for water, light and nutrients.
• The open canopy allows sufficient light to reach the ground to support
an unbroken herbaceous layer consisting primarily of grasses.
• Annual herbaceous plants die completely at the end of the growing
season or when they have flowered and fruited. These grow again
from seed when the wet season sets in.
• The vegetation consists of tall grasses of two high or more and scattered
trees.
• The trees lose their leaves in dry season and are mainly found near
watercourses. The main types of tree species are acacia.
• Some plants have thick barks and thorny leaves to reduce water loss.
The Savannah dry /steppe vegetation is associated with various economic
activities including hunting, fruit gathering, rearing of animals, settlement,agriculture and gazetting of national park and game reserves.
Application Activity 9.3
1. Describe savannah grasslands with reference to South Africa.
2. With reference to Rwandan context, explain the importance ofsavannah grasslands in the economic development.
9.4. Temperate grasslands and their characteristics
Activity 9.4
Study the picture provided below and answer the questions that follow: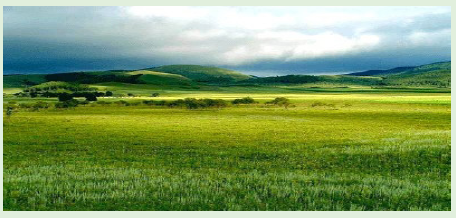
1. Observe the picture provided and explain the conditions necessary for
the growth of the vegetation shown above.
2. Suggest any two-world areas where the vegetation presented above is found.
Temperate grasslands are known by different names in various regions.
“Prairies” in North America; “Pampas” in South America (Argentina), “Downs”
in Australia “Velds” in South Africa and “Steppes” in Europe. These are found
in the mid- latitudinal zones and in the interior part of the continents. The
Temperate grasslands are found in Central Asia from Black Sea to Central Russia,
North Central USA and Southern Canada, South-East Australia, Southern Africaand Argentina.
The conditions necessary for growth of temperate grasslands: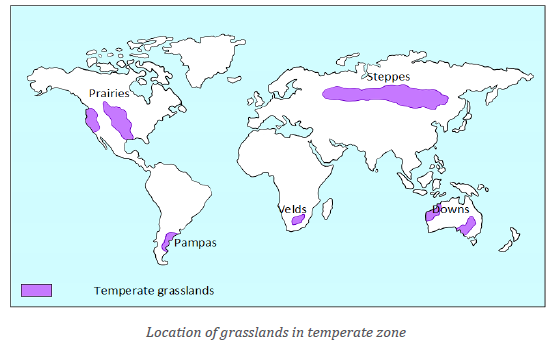
• Temperate grasslands require minimum light for the plants to make their own food.
• The temperate grasslands require moderate fertile, fine drained and humid soil.
• Temperate grasslands need average sunshine in dry and cool winter time.
• Temperate grasslands require moderate rainfall of about 500 mm -
750 mm for best growth of grasslands.
The characteristics of temperate grasslands are:
• Grasslands found here are short and juicy which is suitable for cattle feed.
• The region is known of growth of maize and wheat in large amount.
This explains why, the area is known as “bread basket” of the world.
• The perennial temperate grasses mostly belong to the family of “Gramineae.”
• The steppes form the largest segment of the temperate grassland
biome. Steppes are divided into: Forest steppes, Meadow steppes and grasses.
The temperate grasslands are associated with various economic activities which
include: hunting, fruit gathering, rearing of animals, settlement, agriculture andgazetting of national park and game reserves.
Application Activity 9.4
Assess the contribution of Temperate grasslands to the economy of thecountries where they are found.
9.5. Desert vegetation and its characteristics
Activity 9.5
Observe critically the photographs provided below and answer thequestions that follow:
1. Identify the nature of the types of vegetation in these two figures above.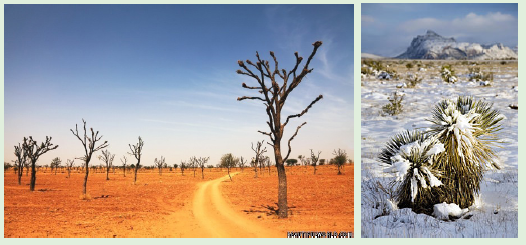
2. Compare and contrast the geographical conditions shown on both figures.
Desert vegetation grows in the Western margins of the continents between 15°
– 30° North and South of Equator. Biggest deserts are: Sahara and Kalahari in
Africa, Thar in India, Arabia desert covering the countries of Saudi Arabia, Iraq,
Iran, Syria and Israel, Atacama Desert (Peru and Chile), Southern California in
USA, Sonora in Mexico and Victoria in Australia. Desert Vegetation is dividedinto two types, namely hot desert and cold desert vegetation or Tundra.
9.5.1. Hot desert vegetation
Hot deserts are located between the latitudinal belts of 15°-30° North and South
of the equator. These deserts can be found in North America, South Asia, South
and Central America, Africa and Australia. Hot desert vegetation experiences
hot climatic conditions throughout the year. The rainfall is unreliable. This is
caused by the dry winds that blow over the area, leading to arid conditions.Such conditions leave behind very poor vegetation in the desert region.
The conditions necessary for growth of hot desert vegetation: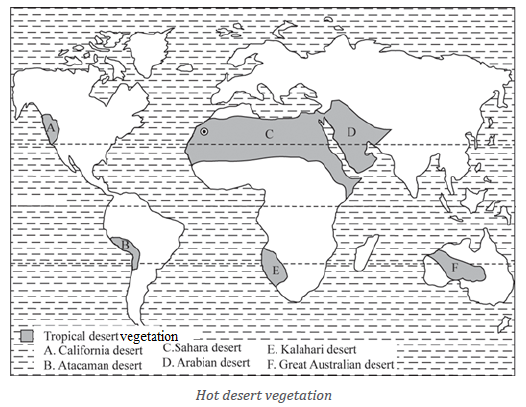
• The presence of poor quality and infertile soils.
• Availability of rainfall total of about 250mm or less per year.
• The prevailing of high temperatures ranging between 290c and 310c to
support the growth of plants associated with arid areas like deserts.
Hot desert vegetation is characterized by the following:
• There are a few plants with succulent stems, long roots and leaves.
• The desert trees shed off their leaves occasionally primarily to
minimize on water loss from the excessive temperature.
• Desert vegetation types especially the tree species grow long tap roots
to have access to water that is found deep in the underground water table.
• The main vegetation growing here is mainly thorny acacia, bushes,
euphorbia and turfed coarse grasses.
• Some desert vegetation types grow no leaves in order to avoid excessivewater loss through evapotranspiration.
9.5.2. Cold desert vegetation
The cold vegetation is located in high flat areas called plateaus. It is also common
in mountainous areas in temperate regions of the world. Temperate regions lie
between the Polar Regions and the tropics. Like other types of deserts, cold
deserts get very little rain or snow and are mainly in the Northern part ofCanada, North Russia, North Sweden and Finland islands in Arctic Ocean.
The conditions necessary for growth of cold desert vegetation: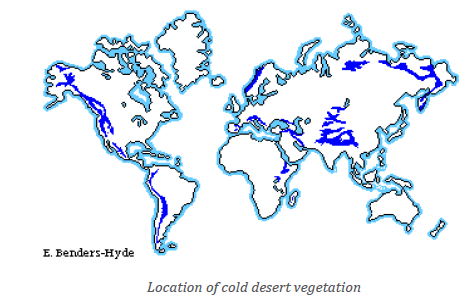
• Cold desert vegetation needs low sunshine for its successful growth.
• It requires a combination of freezing temperatures, poor soil quality,
lack of moisture and sunlight.
• This vegetation requires soils associated with relatively high soil salinity.
• Cold desert vegetation needs very little rain fall of about 250 mm
during the summer season and snowfall during the winter.
• It requires areas characterized by frost conditions.
The major characteristics of cold desert vegetation include the following.
• The main plants are deciduous widely scattered and most having spiny leaves.
• The cold desert vegetation grows in areas with large amount of
snowfall in winter (and sometimes in summer).
• The cold desert vegetation experiences short and wet moderately
warm summers.
• This vegetation receives a mean annual precipitation that ranges from
90 mm to 260 mm, and the mean average winter temperature ranges
from -2 to 4 degrees.
• The cold desert vegetation does well in areas with good drainage that
facilitates leaching of most of the salts.
The cold desert vegetation is associated with various economic activities that
include tourism, mining and agriculture on small scale and establishment ofnational park and game reserves.
Application Activity 9.5
Referring to Sahara Desert, describe the impact of desert vegetation andclimatic conditions on the population settlement in any country around it.
9.6. Tundra vegetation
Activity 9.6Observe the provided picture below and answer the following questions
1. Identify the type of vegetation shown on the photograph above.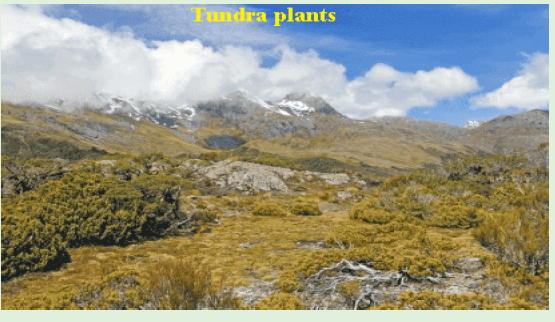
2. Explain the characteristics of the vegetation identified in (1) above
Tundra vegetation is found in coldest regions of the world. The term tundra is
derived from the word “tunturi” (from Finnish language) which means “treeless
plain.” This vegetation is found in the arctic region on top of mountains where
climate is cold, windy and with limited rainfall. The tundra vegetation is found
in regions that cover the areas of Alaska, parts of Russia, Northern Scandinaviancountries and some parts of Canada.
The following are conditions necessary for the growth of tundra vegetation: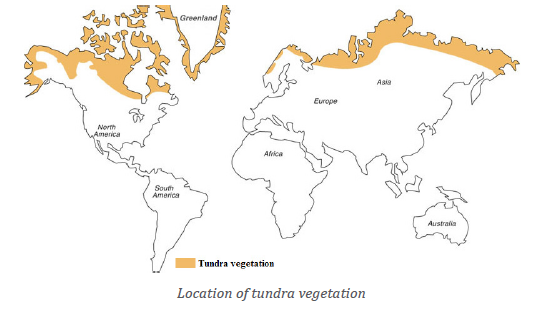
• The Tundra vegetation requires winters that are cold, long and dark.
• It does well in regions that experience about 6 to 10 months with
monthly temperatures below 32° F or 0° c.
• This vegetation needs limited precipitation and existence of strong and dry winds.
• It requires snowfall conditions that support the survival of plants and
animal life. At the sometimes, acts as a protection layer on the surface of the ground.
The characteristics of tundra vegetation are the following.
• The vegetation arrangement is simple and there is limited variety of trees.
• The season of growth and reproduction is short.
• The drainage system is nearly limited.
• The nutrients and energy here is in form of dead and organic material.
The tundra vegetation is associated with various economic activities that
include tourism which is associated with the following tourist attractions: Birds
like ravens, falcons, snowy owls and snow geese and animals such as foxes,
wolves and some smaller mammals like the lemmings and snowshoe rabbits.These areas also, support hunting, oil exploitation and research and study.
Application Activity 9.6
For either Russia or Canada, describe the necessary geographicalconditions for the growth of tundra vegetation in that country.
9.7. Mountain vegetation and its characteristics
Activity 9.7
Using your previous knowledge and geographical sources, answer the
following questions:
1. Describe mountain vegetation in tropical zone.
2. Describe the characteristics of mountainous vegetation with
reference to East Africa.
Mountain vegetation is categorized into two types; namely, tropical mountain
vegetation and temperate mountain vegetation.
9.7.1. Tropical Mountain vegetation
Mountain vegetation has a variety of vegetation ranging from tropical to
temperate types. On typical Mountain slope, various vegetation types show
clear demarcation zones. The savannah vegetation grows from the foothills,
followed by the layer of tropical rainforests, bamboo forests, mountain heath
and moorland. The rest is bare rock. This type of vegetation is traced in areas
such as: Mt. Kenya, Mt. Aberdares, Mt. Kilimanjaro, Mt. Meru, Mt. Elgon, Mt.Cameroon, Mt. Ruwenzori, Mt. Virunga, Mt. Simien and Mt. Bale.
The conditions necessary for growth of mountain vegetation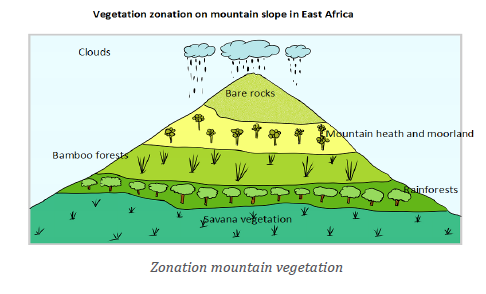
• This type of vegetation requires the steep gradient.
• It needs well distributed rainfall characterized by humid conditions.
• It grows well in areas which generally are associated with strong
seasonal differences.
• It requires temperature ranges of about 20° C at 900 m and 4°c in the
summit region.
• It requires the annual precipitation of around 900 mm on the foothills,
around 2000 mm at 1500 m and well above 3000 mm between 2000
and 2300 m on a windward side.
• It requires fertile soils that are well-developed with moderately acidic
soil pH values, such as Andisol.
The characteristics of mountain vegetation
• The vegetation on the mountain slope grows in clearly demarcated
zones from the foothills to the summit.
• Mountain vegetation is dominated by tussock grasses and stands of
giant rosette.
• The mountain heath and moorlands grow between the bamboo forests
and the snow-line or bare rocks.
• The tree species, mainly of the lower canopy are the wild olive.
• Soils in the mountains are mostly young and fertile which favours the
growth of trees.
• Above snow-line, plant life is always impossible. This is attributed to
low temperature and the presence of eroded bare rocks that makes it
hard for plant growth.
• In mountainous areas, the decrease in temperature with increasing
altitude leads to the corresponding change in natural vegetation.
• The wet temperate forests are suitable between 1000 and 2000 mm.
• Temperate forests containing coniferous trees like pine, deodar, silver
fir, spruce and cedar are found between 1500 and 3000 mm.
The mountain vegetation is associated with various economic activities. These
include gazetting of national park and game reserves, tourism etc.
9.7.2 Temperate mountain vegetation
Temperate mountain vegetation grows well in High Mountain of temperateregions. This grows best between 350 N and 600 N of the equator.
Temperate mountain vegetation is in the Alps, in Western Europe, in Norway,
Sweden and Finland. Other traces of temperate mountain vegetation can be
found in California on the Rocky Mountain slopes, British Columbia and Andesin South America.
The characteristics of temperate mountain vegetation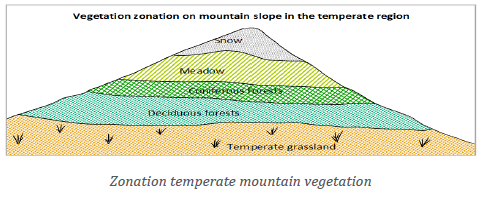
• Temperate mountain vegetation contains both deciduous and
coniferous plant species such as poplar, birch, oak and elm.
• Some trees species grow a thick bark in order to store enough water to
be used in winter season.
• Tree species shed-off their leaves in winter when temperature drops below 6° c.
• Tree species especially the coniferous forests adapt themselves to the
climatic conditions by growing tiny needle-like leaves.
Application Activity 9.7
1. Explain the use of mountainous vegetation with reference to Northern Rwanda.
2. Critically examine the role of temperate mountain vegetation to theeconomy of Switzerland
9.8. Aquatic, marsh and swamp vegetation and their characteristicsActivity 9.8
Make a critical analysis of the photo below to answer the questions that follow: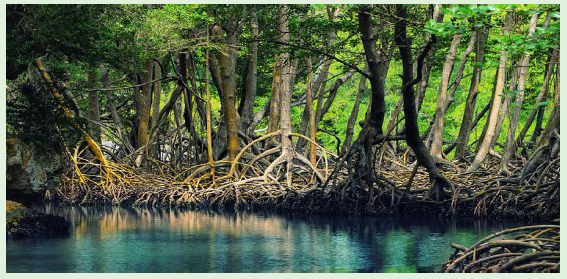
1. Identify the type of vegetation shown on the photograph above.
2. From your own observation describe the environmental conditions
that influence the location and growth of the identified vegetation above.
1) Mangrove vegetation
This is the type of vegetation that grows in marshy and swampy areas along the
coast of West Africa and East Africa. The Mangrove vegetation is evergreen and
grows along the coastal margins between 5o N and 5oS of the equator.
The conditions necessary for growth of mangrove forests:
• They need average temperatures of the coldest month higher than
20°C. The seasonal temperature range should not exceed 5°C. They
can tolerate temperatures of 5°C, but the development will be affected.
This is because they are not resistant to freezing.
• They need a large tidal range. This causes limited erosion and
deposition of sediments.
• They need a fine-grained substrate. However, there could be some
exceptions. This is the case in Papua New Guinea and Kenya, where
the mangroves grow on corals.
• The shores must be free of strong wave action and tidal current.
• Mangrove vegetation requires swampy and marshy areas with deep
soils which must be salty in nature.
• Mangrove vegetation requires high temperature necessary for
chlorophyll making.
The characteristics of mangrove forests:
• Mangrove vegetation has broad branches and leaves and they are
evergreen, dominated by trees.
• They are associated with saline soils with poor drainage.
• The mangrove vegetation grows butters root.
• This type of vegetation has a long gestation period.
• They exist in areas with poor drainage and sufficient water supply. Such
areas are waterlogged that are hypoxic (oxygen deficient) waterlogged soil strata.
• Mangrove forest species, survive under temperatures above 66°
F (19°C). They do not tolerate temperatures below 18° F (10° C).
However, temperatures below freezing should not occur for a long time.
2) Aquatic plants:
The aquatic plant vegetation is referred to as hydrophytes or macrophytes.
These plants require special adaptations for living submerged in water, or at
the water’s surface. Aquatic plants can only grow in water or in soil that is
saturated with water.
The following are Characteristics of aquatic plants:
• These have reduced and shallow roots. The primary function of these
roots is to anchor the plant to the ground.
• Plants that normally are submersed typically form their flowers raised
above the water surface.
• Some of the aquatic plants float on the surface of water with no
attachment to the mud or bottom. These have inflated portions of
leaves, stems, or special hairs that enable the plant to remain floating.
• Plants rooted in the mud have immersed leaves with photosynthetic
stems. They also have relatively small leaves similar to those of typicalleaves of terrestrial plants living nearby?
Marsh vegetation:
A marsh is a wetland that is dominated by herbaceous rather than woody plant
species. Marshes can often be found at the edges of lakes and streams. In such
places they form a transition between the aquatic and terrestrial ecosystems.
Marsh vegetation is dominated by grasses, rushes or reeds. Familiar examples
of marsh vegetation include cattails, sedges, papyrus and sawgrass.
The following are characteristics of a marsh
• The marsh vegetation is a common characteristic of wetlands areas
and grows in poorly drained water.
• The marsh vegetation grows in both fresh and salty waters.
• The marsh vegetation is found along the rivers and lakes.
Swamp Vegetation
Swamp vegetation occurs along large rivers where they are critically dependent
upon natural water level fluctuations. When a swamp vegetation is dominated
by forest, it is called a wetland. Some swamps have hammocks, or dry-land
protrusions, covered by aquatic vegetation, or vegetation that tolerates periodic
inondation.
Characteristics of swamp vegetation are:
• They are characterized by poorly drained soils and different plant life
dominated by trees.
• The later characteristic distinguishes a swamp from a marsh, in which
plant life consists largely of grasses.
• They grow in waterlogged areas where there is sufficient supply of
water, that allows or stimulate decay of organisms and prevent the
accumulation of organic materials.
• They are often found in lowlands associated with rivers that supply
the water to some lakes.
• The number of plant species in swamps is less. While the one found
in areas associated with well-watered conditions and no waterlogged
land, has more plant species.
All the swamp vegetation such as mangrove, marsh, wetlands and aquatic
forests, are associated with various economic activities. These include tourism,
hunting and fishing of crayfish and mudfish. They are also used for researchand study purposes. These support art and craft making.
Application Activity 9.8
1. Explain the conditions that favour the growing of mangrove
vegetation in West Africa.2. Examine the economic importance of mangrove vegetation to man.
9.9. Factors influencing natural vegetation
Activity 9.9
Make a field trip in your home area and observe types of vegetation. Use
the results of your observation to explain the factors influencing their
distribution.
There are various factors that influence the growth and distribution of natural
vegetation. There is no single factor that plays a key role alone, but rather a
combination of two or more factors. These factors include the following:
• Rainfall: Growth of vegetation depends on amount of rainfall. For
example, Equatorial rainforests have evergreen and dense vegetation.
On the other hand, places with low rainfall have scattered vegetation.
This explains why there is little vegetation in deserts.
• Temperature: Forests found in cool areas have fewer tree species.
Those in hot areas have more species. The cold mountain tops have
heath and moorland.
• Relief and altitude: It has been noticed that with a rise in the altitude,
the plants in the region show a stunted growth. Trees such as pine,
silver fir, birch, and juniper fall in this category of vegetation. These
contribute to variation in vegetative zonation along the slope.
• Slopes: Areas on the opposite sides of mountains have different
vegetation. Steep slopes have more runoff. Gentle slopes allow water
to sink into the soil. Plants use this water.
• Soil types: This factor provides basis for different types of vegetation.
The sandy soils in the desert support cactus and thorny bushes. Wet,
marshy or delta soils support mangroves and other deltaic vegetation.
• Human activities: These include settlement, mining, farming and
livestock keeping. For example, vegetation is cleared to create space
for building houses. Trees are cut for firewood and timber. New orartificial vegetation is planted.
• Drainage: It determines the vegetation of a place. There are plants
that grow best in areas of good drainage while others grow well in
swampy conditions for example papyrus which only grows in swampy area.
Application Activity 9.9
Describe the influence of human activities on vegetation distribution in Rwanda.
9.10. Importance of the natural vegetation
Activity 9.10
Make a field trip in your home area, observe nature of vegetation and explain
the significance of it to man.
The following are the significance / importance of vegetation to man:
• Plants that form vegetation are the main source of food for humans.
These foods are in form of vegetables, fruits, grains, cereals, leaves,
seeds and they comprise of carbohydrates, oils, proteins, vitamins and
minerals. Vegetation also provide foods for domestic and wild animals.
• Provide construction materials for example, trees are used for the
construction of houses, bridges and poles.
• Vegetation helps to regulate the flow of numerous biogeochemical cycles
in the atmosphere. Most critically those of water, carbon, and nitrogen. It
also contributes in the local and global energy balances.
• Vegetation plays an important role in our ecosystem. Whereby, plants
are known as the primary producers since they can manufacture their
own food through the process of photosynthesis using sunlight.
• The natural vegetation provides man with a variety of products which
include flowers, stems, roots, oil and many others. These are used to
meet man’s needs such as in making of perfumes, cosmetics and aesthetic purposes.
• Vegetation has contributed hugely to the world economy, particularly in
the use of fossil fuels as an energy source. It provides biomass and some
vegetation residuals are used to produce biogas.
• Vegetation provides timber for furniture. Items as beds, chairs and tables
are made from timber. Timber is also used in construction activities.
• Vegetation plays a key role in the formation of soils. Their roots facilitate weathering.
• Dead vegetation becomes humus, which makes the soil fertile.
• Vegetation is also a natural resource, which provides number of uses to
man. That is to say, products such as ropes, rubber, gum, papers, and wood
are obtained. These are used in manufacturing of materials like books, rope,
tyres, and seats.
• Some plants have medicinal content. These herbs are used in treatment of
various diseases that threaten human lives as well as those of domesticated animals.
• Vegetation is source of materials such as cotton. This is used in textiles and
fabric materials used in making of clothing for human use.
• Vegetation such as forests and grasslands attract tourists. These pay
(money) when they visit to see the animals and a variety of flora. The money
is used to develop the social facilities such as schools, hospitals etc.
• Vegetation helps to clean or purify air through harvesting carbon dioxide
from the atmosphere. Again, trees produce oxygen that human beings and
animals use for survival.
• Places with forests receive more rainfall. This is through the process of transpiration.
• Areas with forests act as sources of rivers. These are called water catchment areas.
• Many people get jobs. They are employed as researchers, forest guards and
forest officers.
• Vegetation makes the landscape beautiful.
• Tree and plant roots hold the soil together. Therefore, forests protect the
ground (soils) against soil erosion, mass wasting and the general impact of
heavy rainfall.
Vegetation has also negative influences to man which are the following:
• Vegetation is associated with some pests such as tsetse flies and ticks
which put the lives of people and animals at great risk, since they cause diseases.
• Some plants are thorny-leaved and they are harmful to human beings
and animals.
• Vegetation is a habitant place for dangerous animals which may attack
or harm human being.
• Some plants are poisonous and may kill human being and animals when eaten.
Application Activity 9.10
Examine the value of natural vegetation for sustainable development ofthe country.
Skills lab
Vegetation plays a great role in daily life. Identify any type of vegetation andlink it with the appropriate economic activity in the local community.
End unit Assessment
1. Discuss the distribution of natural vegetation in the world.
2. Describe the relationship between vegetation and land use.
3. Draw a map of the world and on it, show the following vegetation types:
• Savannah humid
• Mediterranean vegetation
• Desert vegetation
• Mountain vegetation
4. How do the following factors influence the distribution of vegetation in Africa?
• Variation in temperature.• Variation in relief
UNIT 10: POPULATION GROWTH IN THE WORLD
Key unit competence: The student-teacher should be able to discuss the
problem of the population growth and the ways ofcontrolling the population growth in the world.
Introductory activity
Population is one of the main complex issues in geography, its study is essential
for proper national planning in relation to the provision of social services to
the people. Today there is fear generally that the rate at which population is
increasing presents great challenge to the world resources.
1. Explain the term “population” and its related concepts.
2. Discuss the factors influencing population distribution in any area.3. Compare and contrast the population problems in developed countries
and developing countries.
4. Describe the population policies that should be taken by countries tocontrol their rapid growth.
10.1. Human diversities
Activity 10.1
The world population is composed of billions of people from different
countries, speaking different languages, praying from different churches
and having different cultures. This makes what geographers call “human
diversity” in the World.
1. Referring to the paragraph above explain the following concepts:
i) Human diversity
ii) Race
iii) Languages
iv) Religionv) Culture
Population is the number of people living in an area at a given period. The
study of population growth, density, distribution and movement is referred toas demography.
Human diversity means understanding that each individual is unique, and
recognizing our individual differences. These can be along the dimension ofrace, religion, languages and states.
10.1.1. Race
The term race refers to similarities of genetic patterns among aggregates of
individuals of human populations. The varying genetic patterns find their
expressions in the physical traits of human species. Races can be differentiated
based on the following aspects:
• Hair types: People’s hairs also differ. Some have black hair such as
the Africans, others long, reddish hair such as the Europeans and yetothers have white, short or brown hair.
• Skin colour: People of the world have different skin colours. For
instance, in Africa though all people are black, some are brown. In othercontinents, people are white and others are red like the red Indians.
• Climatic factors: Races are also differenced by climatic location. For
example, most people of the tropics are black and others though brownhave black hairs like those of black Americans.
Generally, two types of classification of races have been identified;
a) Phenotypes, in which human population is classified into various groups
based on their physical features.b) Genotypes, in which population is classified into groups based on genetic
origin of their physical traits.10.1.2. Religion
It is a unifying factor for the people with the same religious beliefs. For
instance, some religions encourage conversion of non-believers of different
races or societies such as Christianity, Islamic, Hinduism and Buddhism may
bring people from all parts of the world and from all occupations together. Thefollowing figure shows the portions of the main religions in the world.
10.1.3. Languages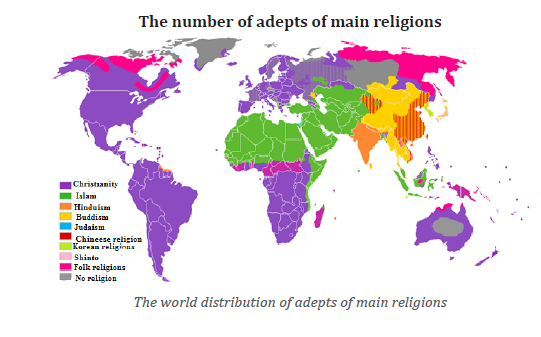
Various groups of people speak different languages. For instance, people in
Rwanda speak Kinyarwanda, those of Burundi speak Kirundi, Kenyans speak
Swahili, etc. There are local languages spoken by a group of people within a
country as well as national and international languages. Some people speak
more than one language. The language acts as unifying factor that plays an
important role in solidarity among the people.
The languages can be classified according to the number of speakers as it ispresented below:
10.1.4. States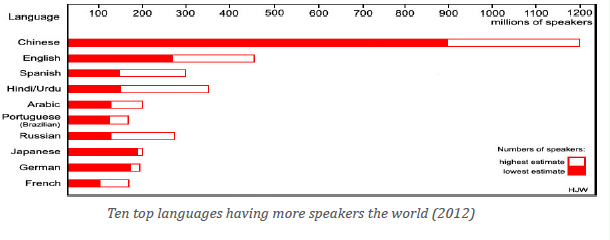
A state refers to a nation or territory considered as an organized political
community under one government. In this case, a state is taken as a country.
Nevertheless, in some cases a state is different from a country. A good example
is the United States of America where a country is made of the union of 50 states.
State expresses merely the actual organization of the legislative or judicial
powers; thus, the actual government of the state is designated by the name of
the state. In that case, people permanently occupying a fixed territory bound
together by common habits and custom into one body politic exercising, through
the medium of an organized government, independent sovereignty and control
over all persons and things within its boundaries, capable of making war andpeace and of entering into international relations with other states.
Application Activity 10.1
1. With typical examples from Africa, identify and describe the
religions operating on the continent.2. Examine the main aspects considered in differentiating the types of races.
10.2. Population concepts and their related effects
Activity 10.2
World wide areas with favourable climatic conditions, abundant natural
and water sources, fertile soils, social amenities, security and political
stability tend to pull people settlement and therefore, being world over
crowded areas. On the other hand, areas with unfavourable climatic
conditions, infertile soils, abundant natural and water sources and
limited social facilities tend to limit population settlement hence being
less populated areas.
1. Why is under population undesirable in a country?
2. Referring to above passage, explain the following population concepts:
i) Optimum Population
ii) Under population
iii) Overpopulation
10.2.1. Optimum population
It takes place where the population and resources are equal and the human
population is able to balance and maintaining a maximum population size with
optimal standards of living for all people.
The following are the major characteristics of optimum population:
• The population has the highest quality of life.
• Each inhabitant receives adequate amount of food, energy, water, and
air of high quality.
• Adequate raw material to permit him/her to make all the things and
devices he/she needs.
• Adequate medical care, recreational facilities and cultural outlets, etc.
• Optimum population is the one that enjoys full employment, a
satisfactory level of life.
• The optimum population can be regarded as that state of equilibrium
between the population and the resources, which satisfies the welldefined
needs of all the members of a community.
10.2.2. Under population
It is a situation where the size of the population is below the available resources,
hence they under-utilize the available resources.
i) Positive effects of under population
The following are positive effects of under population:
• No Congestion: A country with less population experiences little or no
congestion
• Employment opportunities, as a result of small size of the population,
there will be enough job opportunity for the people
• Increase in social and infrastructural facilities: An under populated
country experiences a higher per capita in terms of social and
infrastructural facilities available to the people in the country.
• Availability of idle resources: The resources available in that country is
higher than the number of people, hence, many idle resources would
abound everywhere.
• Low pressure on social amenities: Owing to low population, there is
also low pressure on social amenities in the area.
ii) Negative effects of under population
The following are negative effects of under population:
• Underutilization of resources: Resources are highly underutilized in a
country with low population.
• Shortage of enough people to defend the country: At times of war and
emergency, a country might find it difficult to mobilize enough people
to defend it.
• Shortage of labour force: The available natural resources capital stock
and technology cannot be utilized properly.
• Impossibility of specialization: As the supply of labouris limited,
specialization and rationalization schemes cannot be undertaken.
• Low per capita income: The underutilization of resources in the under
populated countries, leads to a low per capita income.
10.2.3. Overpopulation
This refers to a situation where the number of existing human population
exceeds the carrying capacity of the country.
The following are effects of under population:
• Food shortage: Food production cannot be rise in proportion to the
increase in population. Food production lags behind the increase in
population due to the influence of law of diminishing returns.
• Unemployment: The excessive population leads to massive
unemployment. As the country’s natural resources, capital stock
and technology are limited. It is not possible to provide employment
opportunities for all the people.
• Fall in efficiency of labour: When population increases after a particular
stage, the number of labour also increases. As a result, each labour
gets fewer amounts of capital and machinery and this leads to a fall in
the efficiency of labour.
• Increase in dependents: The size of working population becomes less
when compared to the size of children and old-aged persons. As the
children and old aged-persons come under the category of dependents,
their nourishment becomes a problem.
• Pressure on the land increases: The excessive population brings
pressure on land where land remains less.
• Decline in standards of living: Shortage of foodstuffs, scarcity of
houses, unfair distribution of national income lead to the decline of
the standards of living of the people.
• Limited transport facilities: Some government in developing countries,
due to inadequate financial resources, cannot construct and develop
means of communication and transport to all parts of their countries.
• Limited educational facilities: Governments in developing countries,
lack financial resources to invest in education due to the ever-growing
population.
• Over exploitation of natural resources, as well as growth in energy
production from coal, oil and natural gas is having a negative impact
on the earth surface
• Shortage in housing facilities: The overcrowding results into the
development of slums areas and their associated evils such as
immorality and drug use.
• Diseases: The overpopulation leads to congestion and easy spread ofdisease such as dysentery, cough, cholera and others.
Application Activity 10.2
1. Based on examples of Rwanda; discuss the effects of over population
to the economic development of a country.2. With clear examples, identify negative effects of under population.
10.3. World population distribution
10.3.1. Population density
Activity 10.3
Critically observe the provided population map and answer the questionsthat follow:
With your own observation from the map above, identify the densely,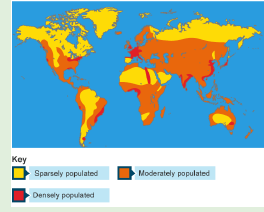
sparely and moderately populated regions of the World.
Population distribution is the spread of the people across the world. It
describes the pattern of where people live. There are places which are sparsely,moderately and densely populated.
Population density is a measurement of the number of people in an area.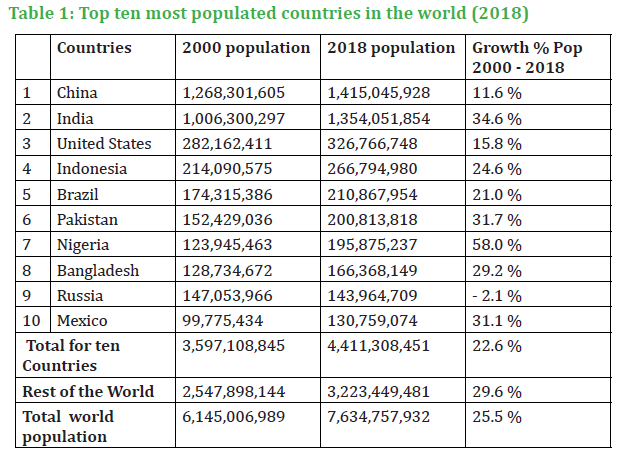
Population density is calculated by dividing the number of people by area.
Population density is usually shown as the number of people per square
kilometer. The World population distribution includes the following categories:
(i) The densely populated areas:
These are regions with more than 100 people per square kilometer:
• East and south East Asia including countries like Singapore, China,
India, Bangladesh, Japan, South Korea, the Philippines and Taiwan.
• Central and Western Europe including countries like Germany, the
United Kingdom, France, Italy, Belgium and the Netherlands.
• The Caribbean countries including Jamaica, Trinidad and Tobago,
Cuba, West Indies and El -Salvador, Eastern USA and south eastern
Canada.
• Nile valley and delta about 39 million people live in the Nile-Deltaregion.
(ii) The moderately populated areas: these are regions with between 25 and
100 persons per square km. These areas are usually dominated by agricultural
occupations and typical examples include Australia, Brazil, USA, Argentina and
Chile etc.
(iii) The sparsely populated areas: are regions with few people per square
kilometer. They include Sahara Desert, the Atacama, Kalahari Desert and
Australian deserts. The high mountain ranges: Himalayas, the Rockies, the
Andes, the Alps and dense forests of equatorial regions in the Amazon, Congo
and outlying islands of Indonesia.
10.3.2. Factors responsible for the distribution of population in the World
The following are factors influencing the distribution of population in the world:
• Amount of rainfall: Areas that receive high and reliable rainfall over
1500 mm attract high population densities because they are suitable
for agriculture.
• Soils: fertile soils encourage growth of a variety of crops; hence food
and employment attract people.
• Pests and diseases: Diseases carriers like tsetse flies and ticks carry
diseases such as trypanasomiasis and east coast fever that discourage
farming and settlement in some areas hence a low population density.
• Altitude: Altitude has an influence on population distribution, for
example from2700 m above sea level, temperatures are extremely cold
and severe soil erosion discourage settlements.
• Vegetation: The natural vegetation of an area is also an important
influence on population distribution. Dense forests, bush land, deserts
and swamps are unfavourable areas for settlement.
• Relief: The rugged mountains discourage settlement. For instance, the
rift valley and lowlands especially along rivers are unfavourable for
human settlement while some gentle slope are easy to work and build
and hence attract more people.
• Slavetrade: This led to depopulation from areas of origin and led to
increased population to the areas where they were taken.
• Migrations: the internal migration such as rural-urban migration leads
to an increase in population in urban areas and rural-rural migration
may influence population distribution from one rural area to another.
• Civil wars: These have reduced population in some regions like
southern Sudan, Somalia, Democratic Republic of Congo and tribal
clashes in some parts of Kenya Rift valley numbers causing emigration.
• Government policies: This may reduce population where land has been
set aside for establishment of national parks or construction of dams,
whereas some policies such as establishment of irrigation schemes in
dry lands or settlement schemes lead to population increase.
• Industrialization: Industrial towns like Nairobi, Kigali, Kampala and
Kinshasa have large industrial establishments producing chemicals,
foodstuff, plastics and textiles which attract people for paid employment
hence a high population.
• Energy resources and minerals: Energy resources and mineral attract
people to settle in a given area. Minerals like coal in their prime age
have greatly influenced the pattern of population distribution in
countries like Great Britain, France, and Germany etc.
• Historical factors: Areas that were occupied by kingdoms especially
near the King’s palaces attracted a high population due to security.
• Economic factors. The economic viability of an area lies in its carrying
capacity and its ability to provide employment opportunities. A specific
economic system tends to arrange people in a specific distributionalnpattern.
• Transport and communication: The establishment of roads, railways
and communication lines attracts dense population due to accessibility of the area.
• Political factors: Countries that are politically stable attract a high
population, whereas political instability in some countries can cause
population displacement and migrations.
• Demographic factors: The changes in the distribution and density of
population in the world take place through variations in the rate of
natural increase (fertility and mortality rates).
• Natural hazards and disasters: For instance, earthquakes, landslides,
volcanic eruptions, floods, glacial advances, storms, epidemics, fire,
and severe droughts constitute the physical disasters. These factors
have discouraged population distribution in areas where they occur.
Application Activity 10.3
1. With the aid of a drawn sketch population map of the world,
identify the densely and sparsely populated areas.2. Explain factors controlling population distribution in Rwanda.
10.4. Rapid population growthActivity 10.4
The above is a line graph indicating the population growth of U.S. Observe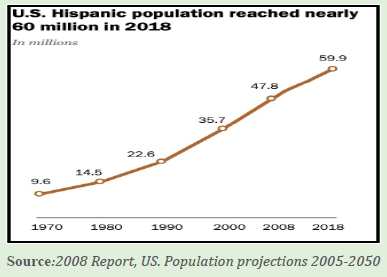
it careful and answer the questions that follow:
i. Compare the population growth in 1970-1980s and 1990-2018s
ii. What are the causes of the rapid population growth?
iii. What measures should be taken to control the rapid population growth?
10.4.1. Causes of rapid population growth
The following are causes of rapid the rapid population growth rate:
• Improved health care has reduced mortality rates by diagnosing health
problems in a timely manner. Use of vaccines has helped to prevent
illnesses that used to kill many people in the past.
• Introduction of better farming techniques has boosted the production
of food. Areas where people die because of drought and famine get
enough food supply thus saving lives.
• Increase in the fight against poverty has also contributed to population increase.
• Immigration has also contributed in population growth in developed
countries and urban centers. This has led to an increase of population
in many developed countries.
• Poor family planning in many families is one of the major contributors
to population growth.
• Children are regarded to be a religious duty: Many people have the
religious belief that having children is regarded to be the holy and
religious duty of the married couple.
• Malnutrition due to which many people die every day. Parents are not
sure that all of the children can be alive. Therefore, they want to give
birth to the many children.
• Polygamy where a man gets married to multiple women, and these
women give birth to more babies.
• Cultural factors where many people do not want to apply measures
of family planning. They think it is unholy to use family planning
measures and prevent conception.
• The social and religious values and customs are mainly based on the
traditional attitudes of people. It is the conservative belief that the son
is necessary to inherit parental property, continue the family line and
perform the funeral rites.
• Artificial population increases, this arises from incoming migration
of refugees and a natural phenomena such as war, flooding, famine
landslides massively displaces people, forcing them into new lands
there by rapidly increasing population in the receiving country.
• Level of education: When you take long at school and come out, you
have a lower reproductive than a person who dropped out of school
and married at young years.
10.4.2. Effects associated with rapid population growth
The following are some of the effects of rapid population growth:
• Available facilities become insufficient for the growing population. It
leads to the falling of living standard.
• It is difficult to provide suitable employment opportunities for all.
The result is large-scale unemployment which also causes the living
standard to decline.
• Natural resources are over-utilized and their quality degrades.
• The environment is polluted and environmental problems occur.
• Crimes such as robbery, theft, murder and abduction increase and
this leads to killing of people with property and money and stealing
commercial banks for better looking of life.
• There are difficulties in finding basic needs such as food, shelter,
clothing, education and health services.
• There is deforestation for agriculture and settlement.
• Land shortage, which results into land fragmentation, conflicts, food
shortage and famine.
• Heavy strain on government expenditure in the provision of social
services and others such as importation of drug and food to sustain the population.
• It results into a high dependency burden, this leads to low saving capital
and low capital accumulation, low investments and slow economicdevelopment of a country.
10.4.3. Ways of controlling population growth
The following are some ways of controlling population growth:
• Family planning: It is to ensure that a woman gets a child when she
actually wants one. It reduces accidental pregnancies and ensures a
controlled family size.
• Raising the level of education: Education particularly that of women
is very important in population control. Education changes cultural
beliefs and attitudes.
• Increasing employment opportunities for women: As more women
join career jobs, they tend to be occupied by work and produce fewer children.
• Increasing income: Increased incomes result in an increased demand
for durable goods such as electronic goods, houses, furniture and
leisure activities such as holiday outings, films and theatre shows,
sports, and music instead of children.
• Increased security in old age: In some communities where children
regarded as security in old age, introduction of pension schemes,
insurance schemes and incomes for old people can substitute as
security for old age. Efforts should be made to ensure that more people
are within the National Social Security Fund.
• Enacting child labour laws: Where children regarded as suppliers of
labour, strict laws are enforced to restrict the minimum age for child
employment. For instance, laws might be enacted to make it illegal foranybody to employ a child below the age of 16.
Application Activity 10.4
1. What are the causes of rapid population growth in developing countries?
2. What are the effects of rapid population growth in Africa?
3. Explain the appropriate population control measures to be used in Rwanda.
10.5. Migration
Activity 10.5
When the husband left her alone with four children, Amina decided to
leave her home country of Nigeria to seek a better life for her family.
Unfortunately, Amina and her children felt victim to one of the smuggling
networks that operate between the Horn of Africa and the Arabian Gulf.
They were held captive for three months by a gang who tried to extort
money from Amina’s family. Eventually, after a dramatic rescue, Amina
and her children were referred to IOM (International organization for
migration) Yemen’s Migrant Assistance and Protection team. They are
now receiving food, water and shelter thanks to IOM’s assistance.
1. Identify the type of migration explained from the above passage.
2. With reference to the passage above, explain the causes of migration.
Migration is the movement of people from one place to another with the
intentions of settling permanently or temporarily in a new location.
10.5.1. Types of migration
There are various types of migration. It is very important to note that migration
has often classified into various categories or types. Below is a detailed
description of main types of migrations:
Internal migration: This is the movement of people within the country. It is
further subdivided into rural-urban, urban-rural, rural-rural, urban-urban
migrations.
International migration: This is the movement of people from one country to
another. For example, if a person lives Rwanda and settles in USA, this type ofmigration will be called international migration or external migration.
Permanent migration: This is the type of migration that involves movement
of people from one place to another without the intentions of coming back to
the source area.
Temporary migration: This type of migration involves the movement of
people or person from one place to another but with hope of returning back to
the source area.
Voluntary migration: This where people move from one place to another out
of their own will without being forced. It is their choice to move.
Involuntary migration: This is when people are forced to move from the areas of origin.
10.5.2. Causes of migration
The following are some important causes of migration:
• Technology factors: The people with more sophisticated technology
may invade and conquer new areas and this attracts less developed
societies to migrate.
• Economic reason: People are forced to migrate, and to settle in the area
where the conditions reflecting the economic prosperity and offer
greater employment potential.
• Underemployment and unemployment: This forces people mostly youth
to leave their home to the places and countries where the employment
opportunities are abundant.
• Overpopulation: an excess of population in area in relation to the
resources available and technology is known as overpopulation and it
can force the people to migrate to another area.
• Social and religious causes: The human desire to stay, work and enjoy
life with the people of his ethnic, social, religious groups is also an
important cause of migration.
• Political policies: The forced and compulsory emigration is always
found with tragic highlights in human history.
• Demographic causes: It is obvious that the young groups migrate than
other age group. They constitute the major force of work force. The
young energy and skilled, therefore, at present the youth migration is
more other age group.
• Diffusion of information: The information network and cultural contact
widens the horizons for job opportunities hence migration.
• Rise in the aspiration: Everybody is tempted to enjoy a better standard
of living. Many present generations with trainings and skills aspire for
leisure life. Thus, they migrate to other areas in search for jobs with
high salaries.
• Wars: War has been an important cause of human migration. For
instance, the two world wars I, II. The World War I (1914-1919)
displaced six million people The II World war (1939-1945) displaced
16 million people
• Love for adventure: For instance Europeans coming to Africa (Rwandaand East Africa).
10.5.2. The effects of migration in the world
There are both positive and negative to areas of origin and destination of
migrants and these are follows:
Positive effects to areas of destination
The following are positive effects of migration to the areas of destination/recipient:
• Simplifies easy exchange of ideas among people of different countries origins.
• Provision of low-priced labour, thus adding to growth of industries,
agriculture and the service sector.
• Migrants provide security services such as banks, shopping centers,
suburban areas and in National security services to defend the country’s interests.
• Migrants are a source of revenue to central governments through Visa
fees, entry fees and work permits.
• Ready market for produced goods such as electronics, textiles leading
to growth of the industrial and agricultural sectors.
Negative effects to areas of destination/ recipient area
The following are negative effects of migration in destination/ recipient area:
• Has led to spread of diseases from the origin place.
• High crime rate for instance robbery, terrorism in Nigeria, Somalia and
southern Sudan, which have compromised the standard of living and loss of lives.
• Development of Slum areas, with undesirable results boosts poor
sanitation conditions which compromise the people standard of living.
• Congestion on roads leading to delay of service delivery, markets in
Kampala, Nairobi and Kigali.
• High unemployment level, for instance Kigali, Bujumbura and Kampala
led to loss of an income for people to increase their way of living.
Positive effects on the areas of origin/ donor area
The following are the positive effects of migration in the areas of origin/ donor area:
• Reduced conflicts, for instance political migrants from Iraq, Southern
Sudan Syria, Nigeria and Burundi to have resulted into political stability.
• Decreases pressure on land for example in China and Indian, this
generating areas to carry out agriculture, business and development
of industries at large.
• Reduction of criminal rate, for instance thieves, thus boosting the
people’s standard of living.
Negative effects on the areas of origin
The following are negative effects of migration in the areas of origin:
• Insufficient of market for goods, hereafter affecting industrial sector
and agricultural sectors, and therefore led to under development of rural areas.
• There are limited investments established in rural areas. For instance,
lack of standard hospitals, advanced research centers and modern market.
• Low agricultural productivity in rural due to active youth who run
way to from rural -urban in search of employment opportunities and
therefore old people at work with less output causes of shortage of food.
10.5.3. Control measures of migrations
The following are some of measures to be taken to control migration:
• Governments should encourage urban-rural migration in order to
developed rural areas.
• Setting up resettlement schemes in rural areas to accommodate the
landless and less privileged people.
• Improving of security in rural areas to control high crime rate and this
enhance rural investments.
• Provision of employment in rural areas by establishing dairy farming
to process agricultural products.
• Setting up rural electrification to develop industries, improve the
standard of living in rural areas by having access to television, milling
maize industries, and appropriate light during the night.
• Improvement of clean water and sanitation facilities in rural areas
through development of piped water to minimized hygienic diseases.
• Improvement of communication and transport services in rural areas
to boost transportation of agriculture commodities and animal’s
products to urban centers for sale.
• Setting up micro-finance projects in rural areas to provide loans to
farmers, business, improved trader capacity, and small-scale industries
to boost on the standard of living of rural population.
Application Activity 10.5
1. With reference to examples, discuss the reasons and the results of
international migration
2. Migration has occurred in Rwanda in past years; briefly discuss thecauses and consequences of migration to Rwandans.
Skills lab
Rapid population growth resulted into many problems across the world.
Identify the problems of population in your local areas.
End unit Assessment
1) Describe and suggest reasons for the rapid increase in the world’s
population in the recent times.
2) Explain why problems may result in areas of overpopulation and under population.
3) Describe the relationship between population growth and resources in your country.
4) With reference to Rwanda, suggest what can be done to control migration.UNIT 11:SETTLEMENT AND URBANIZATION IN THE WORLD
Key unit competency: The student-teachers should be able to discuss
the impact of settlement and urbanization on the
sustainable development of different countries.
Introductory activity
Most cities, including your home town or city, have in common a land use
pattern that stretches from the center to the rural-urban fringe and to the
rural area.
1. Compare and contrast the areas presented, what are common on the three pictures?
2. Which of the following photographs best explains a village? Support
your answer with evidence.
3. Identify the main activities found in urban areas.
4. What are the environmental impacts of both rural and urban settlements?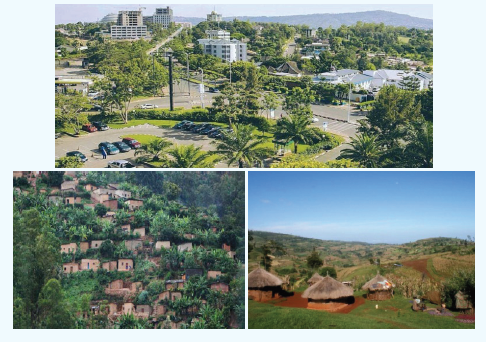
The concept of urbanization is well defined from the concept of settlement.
A settlement refers to a place where people live. It can be large or small,
permanent or temporary. A settlement also means the process of settling in such
a place. Settlement is associated with the concepts of shelter, infrastructure and
community services like health, culture and education. There are two types of
settlements: rural settlement and urban settlement.
The term ‘urban’, is opposed to rural which can refer to isolated building,
hamlet, village, small market town while urban is related to towns or cities.
Urban settlement is large nucleated settlement in which the majority of the
employed inhabitants are engaged in non-agricultural activities. Urban areas
may be defined by national governments according to different criteria; for
example, size population density, occupation of the people, and type of local
government. However, the United Nation defines an urban place as a permanent
settlement with not less than 20,000 inhabitants.
Urbanisation is defined as the process by which an increasing proportion of
the total population, usually that of a country, lives in towns and cities. For
example, according to 2012 national census, 16.5 % of Rwandans live in urban
areas. Urbanization refers also to the physical expansion of urban areas, or theincrease in number of urban areas or towns.
11.1. Rural settlement
Activity 11.1
With reference to your own observation and the knowledge acquired from past studies
1. From your experience, what do you understand by the term rural settlement?
2. Describe the different types of rural settlement.
3. What are the factors that would influence someone to create a
settlement somewhere?
Rural settlement is sparsely populated community that exists in a given area.
The population density in rural areas is very low compared to the urban areas
and the houses are scattered. The largest land use is agriculture. This means that
most people are engaged in agricultural activities and other related activities
such as livestock farming, fishing, mining, hunting etc. Sometimes, there are
larger agricultural agglomerations but cannot be considered as urban centersdue to the primary activity common in that region.
11.1.1. Types of rural settlement
The following are the various types of rural settlements:
i) Nucleated settlements pattern: it is also known as clustered or grouped
settlements. Houses are concentrated in one place without proper
arrangement. Nucleated or clustered settlements often form at crossroads
or route centres. These types of settlements are known as “Imidugudu” inRwanda. Socially, the people are closely knit.
ii) Linear settlement pattern: this is where houses are well planned and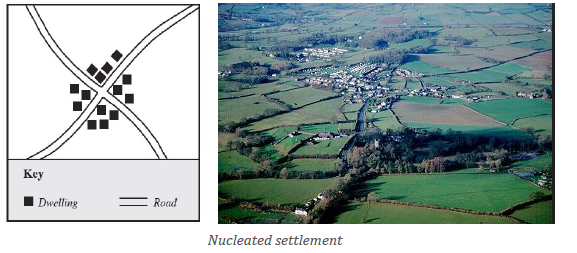
concentrated along the communication lines like roads, railway stations
or along the coast. The fields extend behind the buildings in long, narrow
strips. These are mainly influenced by economic factors. Linear settlementpatterns are also known as ribbon settlement.
iii) Dispersed/ scattered settlement pattern: this is where houses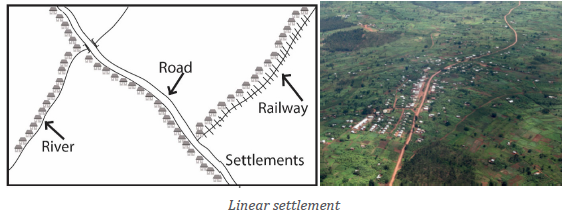
are scattered all over the area. The settlements are located at distance
apart from each other. This type of settlement dominates in area whereagricultural and livestock activities are dominant.
iv) Isolated settlement pattern: this is a type of settlement which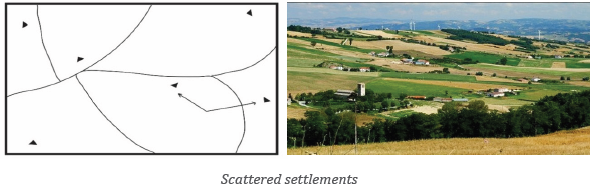
characterizes people who are hunters, shifting cultivators and food
gathers or other specific activity. That is people who are socially isolatedby other people.
v) Ring settlement pattern: in this type of settlement, houses make a circle.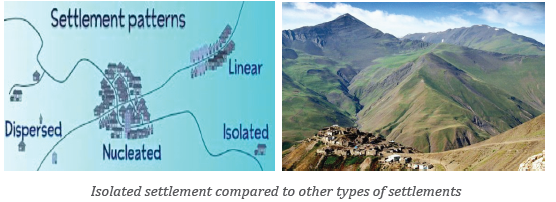
There is an open ground at the centre.
vi) Planned settlement pattern: These are settlements which are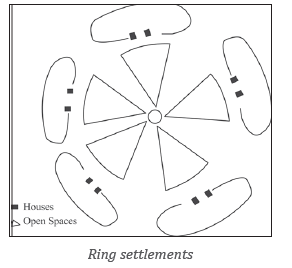
deliberately designed to assume a certain shape and pattern. They may
develop due to planning from the government. The emergence of thevarious patterns of settlement is influenced by the following factors.
11.1.2. Factors influencing rural settlement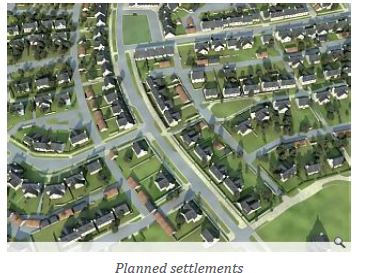
A place where a settlement starts is called a site of a settlement. Any settlement
site is chosen because it has lots of good reasons for locating a settlement there.
The following are the main factors influencing rural settlement:
• Water supply: Water is an important human need. It helps in deciding
where a settlement might be located. Thus most settlements are
located near water sources such as rivers and lakes.
• Soil fertility: Farmers often choose to settle at points where the land
is suitable for crops growing as agriculture and livestock are the key
activities in rural areas.
• Security: More people settle in areas where there is peace. They are
able to live without fear of anything.
• Building materials liketimber and stone attract people to settle
where they are easily available.
• Absence of natural hazards: Very few people live in places likely to
be hit by natural hazards.
• Climate: People are much more attracted to settle in temperate climate
areas. Few people live in very hot or very cold areas.
• Means of transport and services: The presence of roads, schools and
hospitals attract many people for settling around them.
• Presence of minerals: People like to settle where mining activities
are taking places as jobs are available in those areas. In those areas, the
markets, schools and hospital are built to serve them.
• Government policy: The government decides where people should
and should not settle. This is done as part of planning.
• Cultural and social factors: For example, a father dividing his land
among his children. The children settle in the same area.
• Relief: Few people live on the steep slopes of mountains. On the other
hand, Flat land is easier to build on and it is good for growing crops
that is why many people live in plateaus and the plains.
11.1.3. Effects of rural settlement
The concentration of people in rural areas has both negative and positive effects:
Positive effects
• The development of rural settlement, especially grouped and planned
settlement facilitates the establishment of community services like
schools, shops, hospital, electricity, water points and other basic
infrastructure at the center of settlement.
• Rural settlement leads to the development of trading activities with
surrounding settlements and urban centers.
• Rural settlement produce food stuffs to the urban areas.
Negative effects
• Rural settlements, especially dispersed settlements, experience
shortage/lack of basic infrastructures such as water, electricity, roads,etc.
• They are exposed to pollution resulting from uncollected garbage and
contaminated water.
• Rural settlement experience shortage of social services such as
hospitals, schools and markets. People make a long distance to access
such services.
• In rural settlement people fight for land for settlement and agriculture.
• There is high spread of disease like dysentery, cholera, and malaria
due to poor hygiene and compaction of individuals.
• There is environmental degradation due to high demand for building
materials, firewood, charcoal which further result into soil erosion
reduction in rainfall and landslides.
• The family plots are fragmented and which makes them to be too smallfor commercial mechanized farming.
11.1.4. Solutions to the problems affecting rural settlement
• To avail the basic infrastructures such as water, electricity, roads, etc.
in the areas to be settled.
• Construction of social facilities and services such as hospitals, schools, market.
• Regular registration of land to reduce the conflicts related to the land
ownership and use.
• Preparation of master plan and land use guide for all country to avoid
unplanned settlement.
• Making environment management policies to avoid environment degradation.
• Establish good governance to avoid any kind of division, insecurity in population, etc.
• Sensitizing the rural settlers on the most effective way of managing the environment.
Application Activity 11.1
Make an excursion in rural areas not far from your school and
a) Examine the predominant activities.
b) Basing on what you have learnt in this lesson, associate the belowdiagrams with their corresponding names/ types.
11.2. Urbanization in the world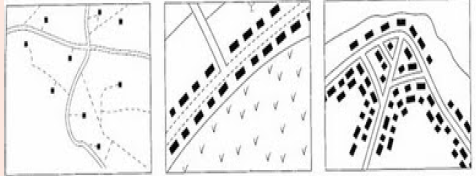
Activity 11.2
1. Read this map above and show the most urbanized regions in the world.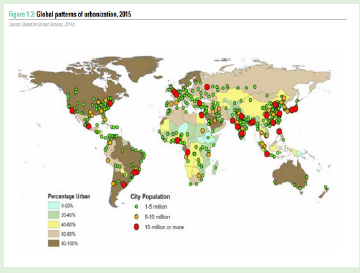
2. Discuss the major factors influencing urban development in the world.
3. From your understanding, what are the socio-economic benefits ofthe big cities compared to small cities?
11.2.1. Definition of basic terms
Different terms are used to express urban centers according to their size or
their characteristics. The following are the commonly used terms.
• Trading center: A trading is a given settlement whose major occupation
is associated with trading activities. It may be an area within a city or
located away from the main city.
• Town is the smallest unit of urban settlement. Here urban functions
are well marked although the possibility of some rural activities is not ruled out.
• Town board is the legislative body that governs a town/city.
• Municipality refers to a political subdivision of a state for a specific
population concentration in a defined area. The municipality is bigger
than a town in terms of covered area and number of population settled in that area.
• City: The term derived from the Latin word ‘civitas’ which means
community/city/town or state. It is a full-fledged urban agglomeration
depicting predominance of urban occupations and complex internal
structure. Any town with a population of one 100,000 or above is
termed as city.
• Agglomeration is an extended city or town area comprising the builtup
area of a central place (usually a municipality) and any suburbs
linked by continuous urban area.
• Megalopolis denotes a large urban region formed by the out-growth
of many metropolises. A megalopolis (sometimes called a megapolis;
also megaregion, or super city) is typically defined as a chain of roughly
adjacent metropolitan areas, which may be somewhat separated or
may merge into a continuous urban region. Megalopolis also expresses
the full mature stage of urban growth.
• Conurbation is a large continuous built-up area formed by the joining
together of several urban settlements or town. It is an urban region
consisting of a large metropolis and a number of small towns huddled
together.
• Suburb is a mixed-use or residential area, existing either as part of
a city or urban area or as a separate residential community within
commuting distance of a city. Some suburbs have a degree of political
autonomy, and most have lower population density than inner city
neighborhoods.
• Green city refers to a broader metropolitan area. For example,
“Chicago” represents the greater metropolitan area surrounding
the city of Chicago. It aims to inform and stimulate the interest with
authorities, organizations and companies which are professionally
involved in planning and developing the urban area, ensuring green
will be applied appropriately.
• Slum is defined as a highly populated urban residential area consisting
mostly of closely packed, decrepit housing units in a situation of
deteriorated or incomplete infrastructure, inhabited primarily byimpoverished persons.
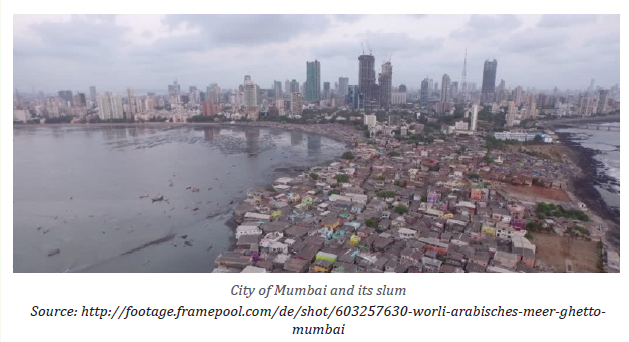
11.2.2. Factors influencing urban development in the world
Urbanization is the function of socio-economic changes that take place through
time. The following are its determinants, which are mainly economic, social and demographic.
• The economic determinants are the type of economy, degree of
commercialization of agriculture, the extent of diversification of
economy, the changing size of agricultural landholdings, the stage of
economic advancement and the degree of development of means of
transportation and communication.
• The social factors that determine the nature and magnitude of
urbanization are the degree of socio-economic awakening, the social
value system, the stage of technological advancement, the public
policies and the government decisions.
• Among the demographic factors, the rate of population growth,
magnitude of migration and pressure of population are significant.
• Improvement of transportation can bring raw materials to any point quite cheaply.
• Improvement of information and technology which raised the
population awareness about the available opportunities in other urban centers.
11.2.3. Impact of the world urbanization on the environment.
Urbanization might cause the following problems:
• Urbanization results into pollution of land, air, water and noise: This
is because of poor disposal of garbage from the domestic remaining.
• Urbanization results into noise pollution from industry machineries,
vehicles, and other means of transport,
• High energy consumption increases the release of CO2 in the
atmosphere. This leads to global warming.
• Most of people do not have access to safe drinking water especially
in developing countries. Thus, poor sanitation and poor quality of
drinking water result into water-borne diseases like Cholera, Typhoid,
tuberculosis, dysentery and gastro-enteritis.
• Sewage also provides nutrition to a vast array of microbes, bacteria and
fungus adding to the eutrophication of surface water bodies, seriously
affecting the human environment and the entire food web in the eco
system. Even the ground contaminated by the industrial effluents in
the atmosphere, brought down by precipitation.• Waste disposal is a major problem in large cities.
Application Activity 11.2
Assess the effects that urban centers have on the environment
1. With reference to the below pyramid, arrange the settlement fromthe lowest to the highest level
2. Describe the effects of urbanization on the world and suggest some solutions.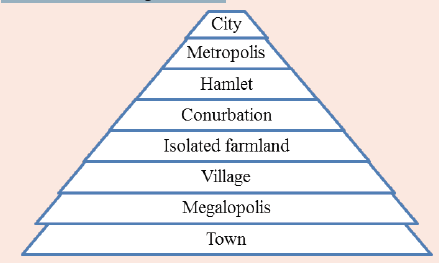
Skills lab
Suggest ways for improving infrastructure and social amenities in rural area forsustainable development of the country like Rwanda.
End unit Assessment
1. With reference to Kigali city explain why towns are constantly
growing both in population and area.
2. Suppose you are one of the urban planners, design a program that
would address the problems caused by urbanization.
3. Describe the impact of expansion of Kigali City on the environment in Rwanda.
4. Kigali is currently experiencing rapid urban development in our
region. From the knowledge acquired in this unit, identify themajor factors which are contributing to that urban development.
UNIT 12:AGRICULTURE IN THE WORLD
Key unit competency: The student-teachers should be able to explain the
impact of agricultural activities on the sustainabledevelopment of different countries in the world.
Introductory activity
Look at the photographs above and answer the following questions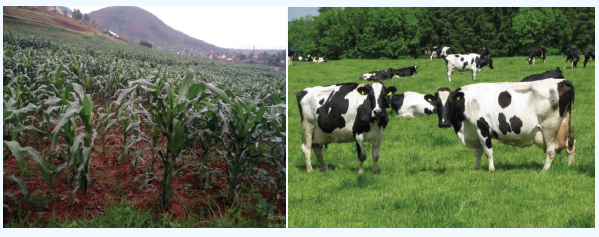
1. How can you associate the above photographs with the word “agriculture”
2. Identify the contribution of agriculture in socio-economic development of Rwanda.
3. Describe different types of crop cultivation.4. Discuss the main challenges facing agriculture?
Agriculture refers to the growing of crops and rearing of animals either forsubsistence or commercial purposes.
12.1. Crop cultivation
Agriculture is practiced in different parts of the world. It is categorized as a
primary activity since it involves the production of raw materials that can be
used by other industries. The following are the main types of crop cultivation.
The common types of crop production with their characteristics are briefly
described in the following pages.
12.1.1. Subsistence farming
Learning activity 12.1
1. Identify different crop cultivation methods used in farming
2. How does small subsistence farming differ from large scale farming?
Subsistence farming is an advanced form of primitive agriculture. This type of
farming refers to the growing of crops for domestic consumption. It is defined
as a self-sufficiency farming system in which the farmer focus on growing
enough food to feed themselves and their families.
Subsistence farming is commonly practiced in developing countries in Africa,
Asia and amazon basin in South America.
Characteristics of subsistence farming
The following are the main characteristics of subsistence farming:
• It involves the use of members of the family as labour force.
• Subsistence farming implies rudimentary tools like hoes, pangas to
cultivate and sometimes use of animals.
• Multi-cropping (growing many crops in the same field) is practiced. .
• The cultivated land is most of the time small.
• The production is mainly used for family consumption.
• There is limited or no use of technology in form of seeds, manure and tools.
• Organic manure and mulching are sometime applied on the land to
improve its fertility ,
• The common crops grown in Africa (African staple food) are: maize,cassava, millet, beans, sunflower, fruits and vegetables.
Advantages and disadvantages of subsistence farming
The following are the main types of subsistence farming toe considered :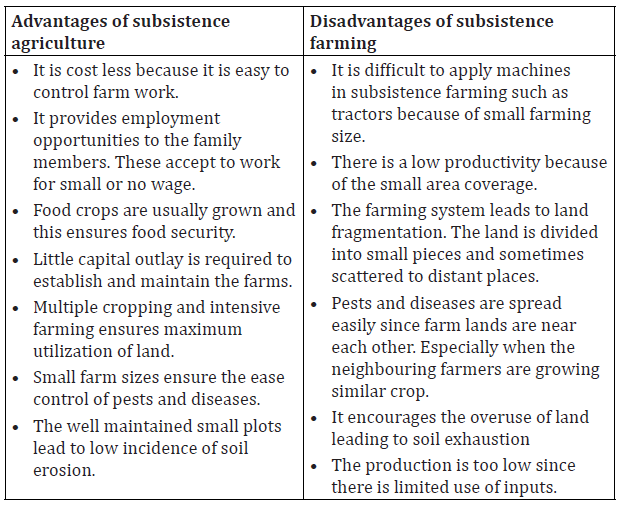
(i) Shifting cultivation
Shifting cultivation, known as non-sedentary cultivation, is an agricultural
system in which plots of land are cultivated temporarily, then abandoned and
allowed to revert to their natural vegetation while the cultivator moves on toanother plot.
Shifting cultivation is practiced especially in tropical region of Africa (example: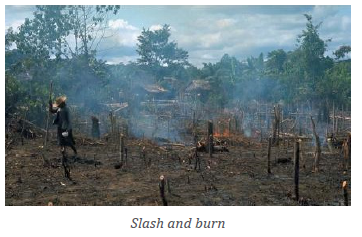
Chipanga in Zimbabwe, Chitemene in Zambia and Masole in DRC), Central
America (Milpa) in Mexico and South East Asia (Ladang in Malaysia).
The main crops planted under shifting cultivation are mainly starchy foods
such as cassava, sweet potatoes, maize, millet, yams, etc.
Characteristics of shifting cultivation
• The farmers grow enough food to feed themselves and their family
• Practiced by remote tribal people residing in forests.
• The land to be cultivated usually is cleared from virgin forests.
• The farmer use fire in the process of clearing of land for cultivation.
• The pieces of land cultivated are usually very small. They rarely reach
beyond 1-2 hectares.
• The plots of land cultivated are isolated from each other. Such are
separated from one another by patches of forests.
• Traditional tools are used. These include digging sticks, pangas, and
simple hoes.
• The farmer usually uses family members as labour force.
• The farmer abandons the piece of land when the crop yields decline
and goes to a new part of forest to cultivate.
• The yields produced hardly support the food demands of the family.
This calls for supplementing the crop yields with fruit gathering and
bush meant from hunting.
(ii) Bush fallowing
Bush fallowing is a system of farming whereby the farmer cultivates one piece
of land for some years and leave it thereafter with the aim of restoring naturally
its fertility. Meanwhile, the farmer will be cultivating another piece of land since
the farm is divided into clear plots.
Bush fallow farming practically occurs mainly in the humid tropics of Africa,
South and Central America, Southeast Asia, and parts of Oceania.
Characteristics of bush fallowing
• It is mainly practiced by peasant farmers due to lack of agricultural inputs.
• Simple tools are used.
• The family is the main source of labour.
• Farmers are settled but the farms are the ones which are rotating.
• Bush fallowing is practiced where population density is very low.
• Farmlands are left to fallow after one or two years of cultivation.
• Farming is based on permanent and semi-permanent settlements.
• Farming depends on natural conditions for example rainfall,
temperature and soil.
(iii) Small holder farming
This is a type of farming that is practiced in densely populated areas of the
tropics. It is a more advanced form of subsistence farming where the lands are
frequently cultivated and the community stays permanently in one spot. Croprotation, melding, inter cropping, application of fertilizers etc. are applied.
Characteristics of small holder farming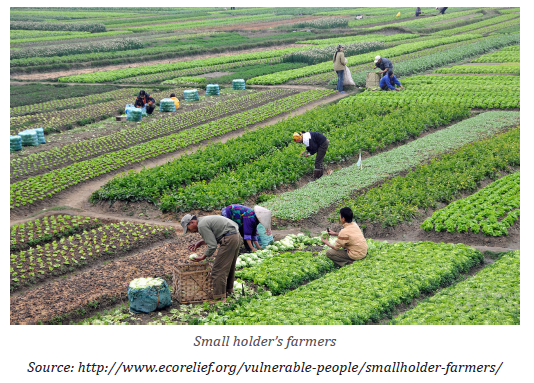
• It is practiced in densely populated areas of the tropics
• Both food crops and cash crops are grown intensively on the same
piece of land as well as rearing of very few animals.
• Farm plots are very small and fragmented
• As the land is small, crop rotation is practiced to preserve soil fertility
as well as mulching techniques.
• Use of better farming techniques like irrigation farming on small scale,
pesticides and herbicides. Manure as well as artificial fertilizers is
applied on the plot.• Available land is subdivided into small uneconomical plots to cultivate.
12.1.2. Cooperative farming and Plantation farming
Learning activity 12.2
1. Using your own words, what does cooperative farming means?
2. Describe the advantages and disadvantages of cooperative farming
3. Examine the main features of plantation farming.
a. Cooperative farming
This is a system of farming where farmers with similar interests pull their
resources together to increase production and benefits. Individual farms
remain intact and farming is a matter of cooperative initiative. The object of
this organization is to help each other in agriculture for their common interests.
There is collective ownership of land. The farmers are also registered and
governed by laws.
Characteristics of cooperative farming
• There is collective ownership of resources such as factories, stores,
and means of transport.
• Labour is provided by the members themselves.
• Profits and losses are shared equally by members.
• Credits facilities are available to the members from the funds collected.
• The members are educated and informed about new developments
from time to time.
• The farms are either scattered or consolidated into one big unit.
• Land ownership may be on collective basis.
• Marketing of the produce is done collectively.
• Cooperatives are officially registered and governed by laws and regulations.
• There is quality control of the products.
• There is easy access to credits facilities to the members from thecollected funds.
Advantages and disadvantages of cooperative farming
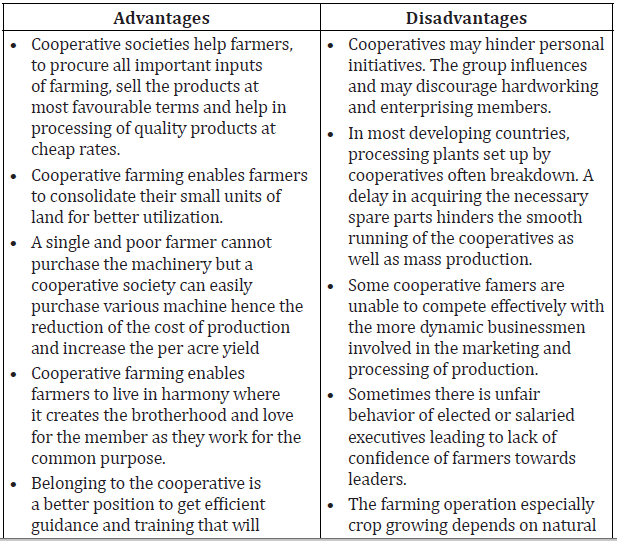
b. Plantation farming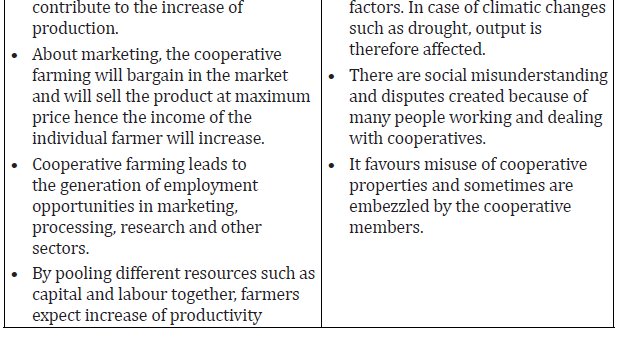
Plantation farming is a form of commercial agriculture where a single crop is
grown on a large area for profit. Countries that have plantation farming are
those usually experiencing high annual temperatures and receive high annual
rainfall. It is very distinctive type of agriculture which is practiced within thetropics especially in Africa, Asia and Latin America.
Among the most important crops found on plantations are coffee, tea, rubber,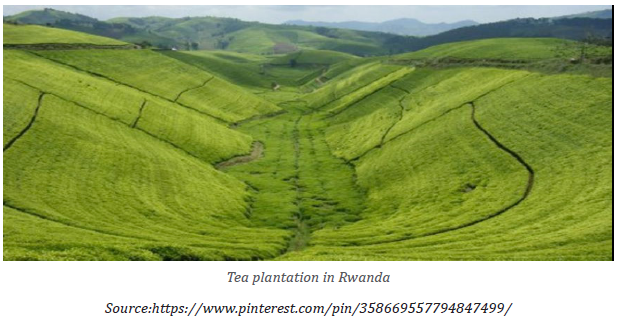
oil palm, cocoa, sugarcane and wheat. Besides, fruits such as pineapples and
bananas as well as fibers like cotton, hemp, jute and sisal are examples of
plantation agriculture.
Characteristics of plantation farming
• A huge labour force is required comprising of skilled, semi-skilled and
unskilled workers.
• A selected crop is grown on large estates covering thousands of
hectares and run by a large company or under government.
• Plantation farming requires heavy capital investment to purchase
machinery and establish infrastructure.
• Production is mainly for the market and not for the farmers’ consumption.
• There is specialization of labour.
• Plantations are scientifically managed. They use machineries, selected
improved seeds, weed control, application of fertilizers etc. which
results in high yields.
• Plantations are mainly owned by foreigners, large companies, the
government or cooperatives which have the capital required to inject
in the business.
• The crop is processed where it is grown for example sugarcane grown in Kabuye.
• There is less wastage of crop, e.g. from sugarcane we get sugar, sweets,
animal feeds, cardboards, fertilizers, etc.
• Plantations cover large scale of land/area at least over ten hectares
• The plantation farms have well developed networks of transport
connecting plantation areas, processing industries and markets.• Plantations are normally established in sparsely populated areas.
Advantages and disadvantages of plantation farming
The following are advantages and disadvantages of plantation farming:
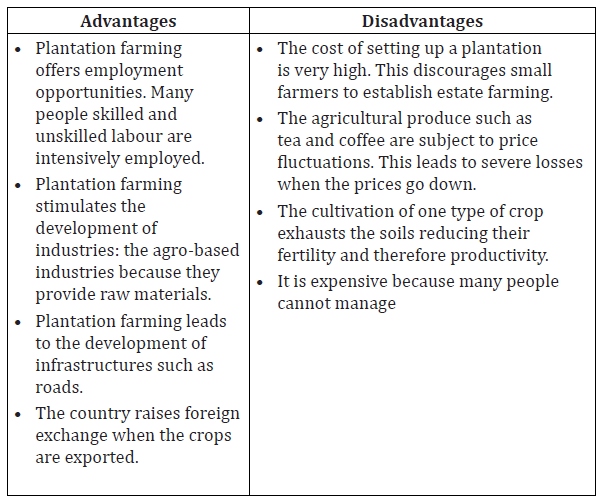
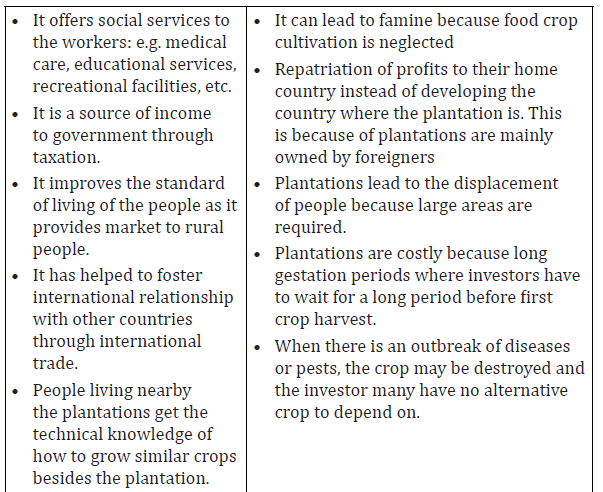
12.1.3. Market gardening, Horticulture and Truck farming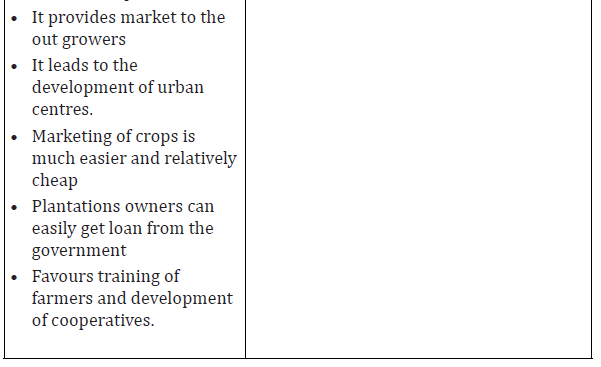
Learning activity 12.3
1. How does Market gardening differ from horticulture?
2. Describe the main features of truck farming.
a) Market gardening
A market garden is a form of farming that is relatively small-scale specializing
in cultivation of fruits, vegetables and flowers as cash crops, frequently sold
directly to consumers and restaurants. This form of farming is an example of
intensive commercial farming as far as it involves growing of crops on small
plots of land which are scientifically managed.
Most of market gardens are located near the cities or outside the city suburb
areas. This practice is best developed in in densely populated industrial and
urbanized countries such as the Netherlands, U.S.A, Germany, Denmark,Belgium, Canada etc.
Characteristics of market gardening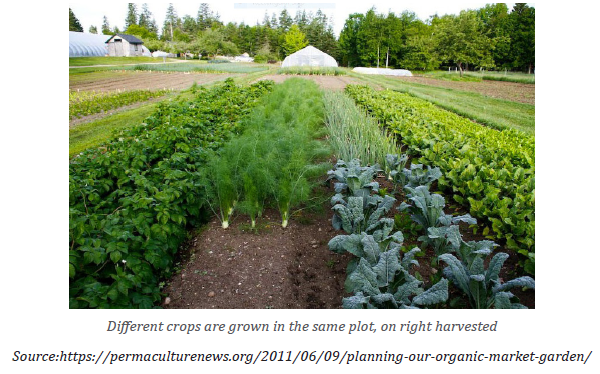
• Farms are generally small.
• The land is intensively farmed, i.e., getting maximum yield from limited land
• Vegetation may be grown in field or under glass
• Fertilizers and manures are applied to improve on the fertility of the soil.
• It is carried out mostly in urban and semi urban areas.
• The products are sold while still fresh to avoid risk of perishability.
• The products have high demand especially in urban centres.
• A lot of capital is invested and used in the farming activities.
• Much attention is given to the crop and most of the work is done by
hand labour. it is therefore labour intensive.• Irrigation is always practiced.
Advantages and disadvantages of market gardeningThe following are advantages and disadvantages of market gardening:
b) Horticulture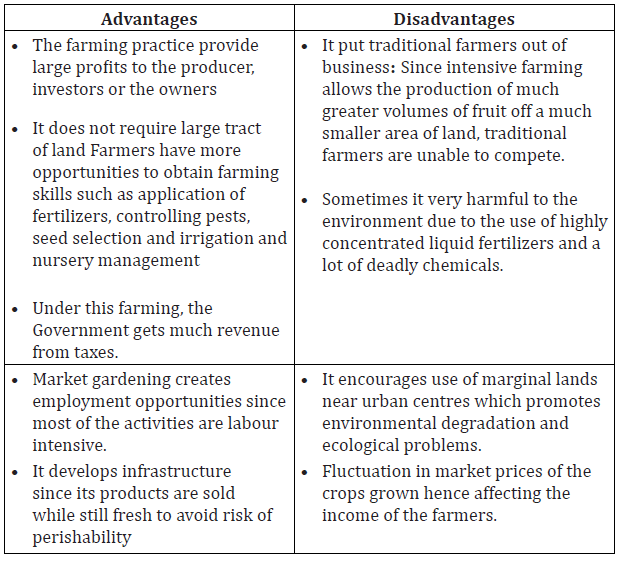
Horticulture may be broadly defined as the science and art of growing fruits,
vegetables and flowers and crops like spices condiments and other plantation
crops. The word Horticulture is derived from the Latin word “Hortus” meaning
enclosure (garden) and culture meaning cultivation. Thus Horticulture means
culture or cultivation of garden crops. The horticultural activity involvesplanting and tending of domesticated ornamental and food plants.
This type of agriculture is well developed in densely populated industrial
districts of North West Europe, north eastern United States of America and the
Mediterranean regions. The Netherlands specializes in growing of flowers and
horticultural crops especially tulip.
Characteristics of horticulture
• Most of the work on the farm is done manually while machines are
used in some case where farms are fairly large.
• Modern tools of crop production are used to ensure high yield.
• The farms are relatively small in terms of size and are located where
there are good transportation links with the urban centre where high
income group of consumers is located.
• The land is intensively used in order to reap maximum produce.
• Irrigation is highly recommended in this farming.• There is use of greenhouse and artificial heating in colder regions.
Advantages and disadvantages of horticulture
The following are advantages and disadvantages of horticulture:
c) Truck farming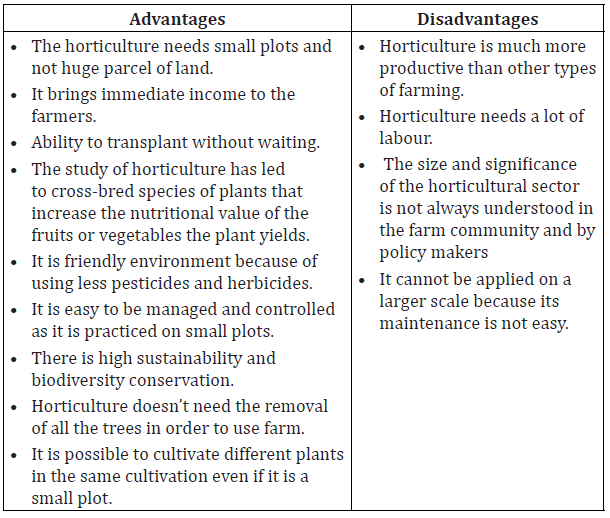
Truck farming is a horticultural practice of growing one or more vegetable
crops on a large scale for shipment to distant markets. It is usually less intensive
and diversified than market gardening. At first this type of farming depended
entirely on local or regional markets. The common crops grown include apples,
asparagus, cabbages, Irish potatoes, string beans, cherries, and lettuce. Truck
farming is another term for market gardening. So it has nothing whatsoever to
do with trucks, although farmer may need a truck to carry his/her produce to the market.
Advantages and disadvantages of truck farming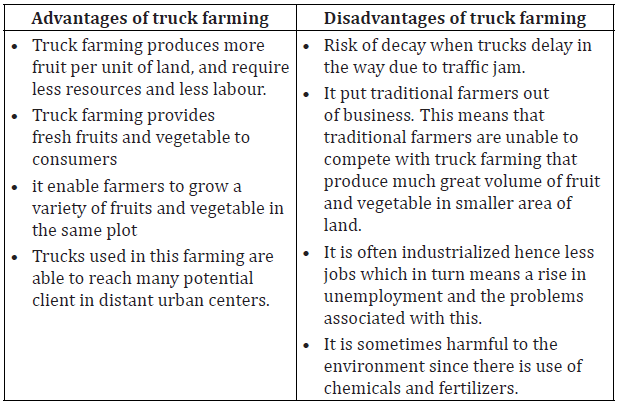
12.1.4. Collective agriculture and Commune farming
Activity 12.4
1. In your own words, explain what collective agriculture is
2. Agriculture is the best motor of growth for many countries especially
developing ones
i) State two forms of farming adopted by Russia and China respectively
ii) Analyze the main features of commune farming system
a) Collective agriculture
Collective farming is cooperative organization in which farmers joined together
to collectively raise crops on land worked in common. This form of farming
Characteristics of collective farming
• Farms are merged to form a larger farm unit either voluntarily or
compulsorily;
• The types of crops grown are specified;
• On the farms, there is a use of machines;
• Farms are managed communally or selected committees;
• The proceeds from the sale of farm produce are shared among the members;
• The marketing of the produce is under control of the state;
• Farmers are allowed some limited are for their own crops and livestock.
is practiced in communist countries such as Russia, Poland and Bulgaria. It
involves the voluntary or compulsory grouping of land into large units with thepurpose of increasing and modernizing agriculture.
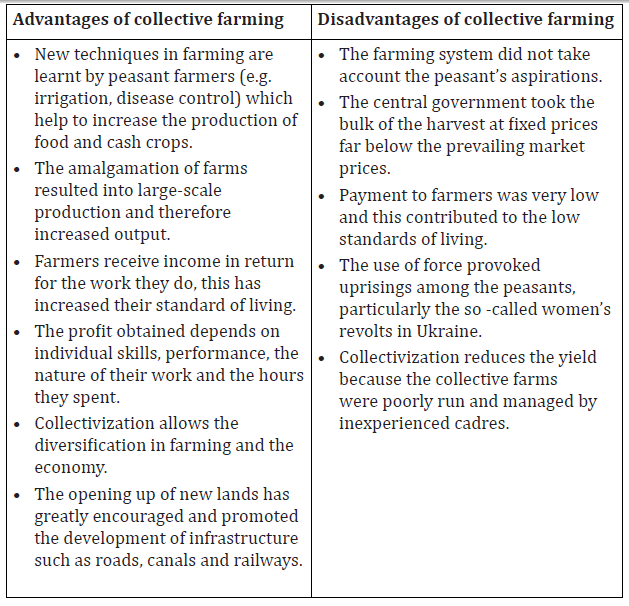
b) Commune farming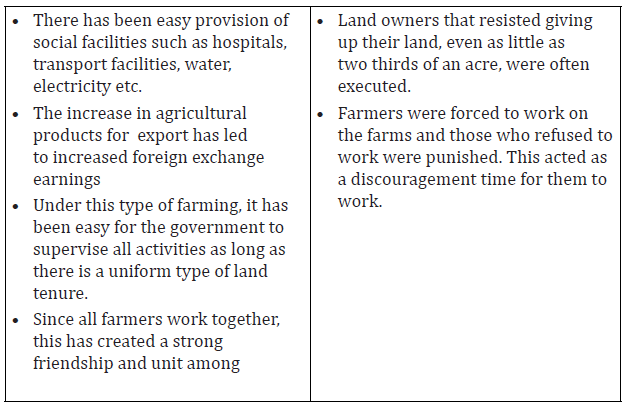
A commune word literally means a large gathering of people sharing common
life. Communes were formed in the late 1950s as Chinese president named Mao
tried to force rural people to live a more communist way of life. The Chinese
commune is not merely an agricultural commune. Instead it standards for
“unified management and deployment of labour power and means of production
on a larger scale”
The structure of the commune was such that households were organized into
teams, then teams formed brigades, and brigades formed the commune. Each
level of organization was responsible for certain activities.
Characteristics of commune
• Land was collectively owned by the members of the commune.
• Work on the land was done collectively. All members worked together
to plough the land, plant, weed and harvest.
• Preparation of meals for the members of work-team was done in one
place and serving was by cafeteria method, kitchen utensils were
owned collectively.• Returns from the farm were shared equally by all members of the team.
Advantages and disadvantages of communes in China
Application Activity 12.1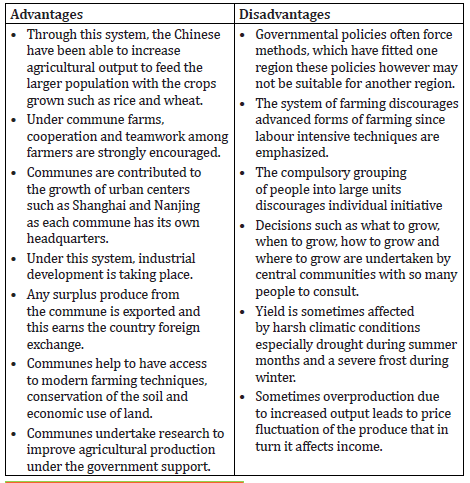
Using your knowledge and skills acquired in the previous lessons,
1. Examine the effects of rapid population growth on small scale agriculture.
2. Using geographical document and internet, discuss on the use of
cocoa and rubber.
3. Collectivization in Russia was set as possible solution to the foodcrisis. In your view, did this system resolve the problem?
12.2. Factors for increasing the agricultural production
and associated problems in the developing countries
Activity 12.5
1. Discuss on factors that contribute to the increase of agricultural
production.
2. Explain the major challenges facing agriculture in developing
countries.
12.2.1. Factors for increasing the agricultural production
Many factors act together to influence the productivity and profitable income
from the agriculture.
• Relief: The farming system adopted depends on the relief of the area. So
relief may influences the increase of agricultural production in different
way:
─ Lowlands, such as flood plains, are more productive agriculturally.
─ Steep slopes are obstacles to the machinery use and have thinner
soils; on the other hand gentle slopes are less prone to soil erosion.
─ For some crops like Tea and coffee crops do well in the well-drained
soil on hill slopes
• Soil: The type and characteristics of soil in a certain area determines the
type of farming to be practiced. Areas with fertile soils encourage crops
farming, while places with poor, thin soils discourage crop growing and
favour rearing of animals.
• Drainage: Market gardening and horticulture prefer swampy areas just
because of the presence of permanent water.
• Climate: A prolonged drought season leads to drying of crops and pasture
for animal leading to poor yield. On another hand, a reliable rainfall in an
area is a vital for crop growing.
• Capital: Capital is the money the farmer has to invest in agricultural
activities; it is useful to increase the amount of different inputs into the
farm which have a direct effect on the production.
• Technology: Advance in technology development play a big role in
agriculture. Proper use of technology helps in extending the area of optimal
conditions and maximizes the expectations of farmers.
• Market: The wish of any farmer is to grow crops which are in demand and
change to meet new demands.
• The Government policy: The government may influence a particular
agricultural practice, it may also influence the crops grow through
regulations, subsidies and quotas.
12.2.2. Problems affecting the agriculture in the developing countries
Here are some problems facing farmers in developing countries:
• Harsh climate: Despite the great advances that have been achieved
in technological development, people do not have any control over
climate. Example, they cannot increase rainfall in the deserts nor they
cannot prevent the rivers of the temperate regions from freezing. So
agriculture is affected by the seasonal nature of rainfall which makes
agricultural planning more difficult.
• Infertile soil: Soil is a medium in which plant grow. Large areas of the
tropical region have infertile soils. This reduces crop productivity.
• Relief: It refers to the general appearance of the landscape. Very
high mountainous areas hinder agricultural activities because of the
extreme low temperature, thin soils and steep slope which limit the
agricultural mechanization.
• Lack of information: Most of small scale farmers in Africa miss out on
new and improved methods of farming. Even in cases where there is
some access to information, most poor farmers are unable to discern
due to illiteracy which is high in rural Africa.
• Limited capital: Most farmers in Africa are poor financially making it
almost impossible for them to adopt new farming practices. Financial
support enable farmers to grow, expand, and maintain their yields by
purchasing farm machinery, agro-chemicals, fertilizers, better seed
varieties and to open up irrigation system and other agricultural inputs.
• Poor transport system: This is a major challenge facing not just
agriculture but the economy in general throughout Africa. Most of the
farm produce in Africa just go to waste in the remote areas and it is
mostly because farmers find it very difficult to transport their farm
produce to the market to sell.
• Poor market: Lack of market facilities and poor government
regulations make it almost impossible for farmers especially small
scale farmers to market their farm produce. Another issue is low
prices paid to farmer for their harvest which sometime discourage
some farmers.
• Poor technology: Farmers in developing countries are still using
simple tools like hoes, axes, pangas and digging sticks which results
into low yielding per unit area.
• Limited research: research is a key to develop high-yielding crop
varieties. In many developing countries, carrying out research in
agriculture is limited due to insufficient financial support and scarcity
of technical personnel to conduct the research.
• Rapid population growth: Population pressure on land results into
land scarcity, fragmentation and overexploitation of land leading to soil
exhaustion, which ultimately results, into environmental degradation
and poor crop yields.
• Natural hazards: Many risk and uncertainties are involved in
agriculture such as flood, landslides, drought, and heavy rainfall
destroying crop yields. Ultimately, poor harvests led to famine.
• Political instability: Some countries in Africa and Asia do not
experience enough security due to alternate and continuous conflict
in their region. This results in abandonment of farms as people are
constantly fleeing wars. The wars destroy farm machinery and does
not allow a long term planning necessary to develop and improve the
agricultural sector.
Application Activity 12.2
1. The African land can provide all that people need to survive.
Unfortunately, much of this land is untapped. What can people do
to improve agricultural productivity?
2. Reference to Rwanda, discuss factors affecting the agriculture inthe developing countries.
12.3. Livestock farming
Activity 12.6
Using knowledge, skills and internet or other geographical documents
answer the following questions:
1. Give the meaning of livestock farming?
2. Identify the major characteristics of nomadic pastoralism
3. Describe challenges facing nomadic pastoralism in Africa
Livestock farming refers to the keeping/rearing of domestic animals such
as cows, goats, sheep and poultry (birds, donkeys). It is practiced for either
commercial or subsistence purposes and it takes a number of forms. The
following are the major types of livestock farming: nomadism, free range,
transhumance, ranching, dairy farming, zero-grazing, tethering, aquaculture,
poultry farming, and apiculture. Some of these are explained below in details:
12.3.1. Pastoralism
Pastoralism is a system of farming where farmers set free their livestock
especially cattle, goats and sheep to graze on natural pasture. The movement
of both people and animals is dictated by the shortage of grass and water in a
given area.
i) Pure nomadism
This is extensive form of animal grazing on natural pasturage, involving constant
or seasonal migration of the nomads and their animals. Nomadic herding is
confined to sparsely populated parts of the world where the natural vegetation
is mainly grass.
It is practiced in West Africa among the Fulani, East Africa among the Maasai
and Karamojong, Ethiopia among Nuba, the Touareg of Sahara and the Hottentos
of Botswana, Mozambique and the Republic of South Africa. It is also found in
Saudi Arabia among the Bedouins, and Central Asia among the Mongols.
Characteristics of nomadic pastoralism
• Nomadism depends primarily on animal rearing rather than crop
growing for survive. Nomads take milk from the animals for food and
skins and hairs for clothing and tent.
• There is seasonal pattern of movement for searching grasses and
water for reared animals. These movements depend on the availability
or lack of grasses and water for animals in a given climatic season.
• Extensive keeping herds of livestock all year round on a system of freerange
grazing.
• It is practiced in the areas of low and unreliable rainfall which typical
dry season.
• Animal are kept for family subsistence and not for sale.
• The ownership of livestock is individual but the land belongs to the
tribe or community as a whole.
• Nomadic pastoralist does not value education.
• Nomadic pastoralist finds prestige and proud in keeping large herds of
cattle with taking into account of the amount of products because the
animals kept are of poor quality and low value.• It takes place where the population is low and scarce.
ii) Free Range farming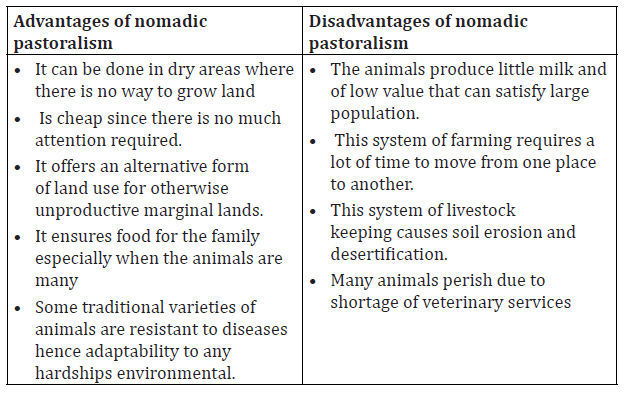
Free range denotes a method of farming husbandry where the animal, for at
least part of the day, can roam freely outdoors, rather than being confined in an
enclosure for 24 hours each day.
The purpose of this form of livestock farming is to reduce feed cost, produce a
higher-quality product, and as a method of raising animals on a relatively largepiece of land.
Characteristics of free range farming
• Free-range poultry farming allows chickens to roam freely for a period
of the day, although they are usually confined in sheds at night to protectthem from predators or kept indoors if the weather is particularly bad.
iii) Transhumance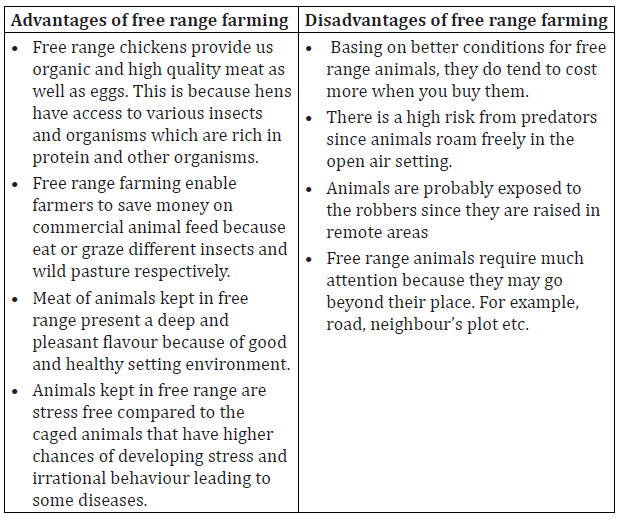
Transhumance is the practice of moving livestock from one grazing ground
to another in a seasonal cycle. Most of people who practice transhumance
also involve in some form of crop cultivation hence some kind of permanent
settlement. Such type of livestock farming is practiced for instance, in Kenya
and Tanzania by the Massai who are semi-nomadic people.
Characteristics of transhumance
• Transhumance involves constant/ seasonal migration of the nomads
and their livestock in search of pasture and water.
• Livestock are moved between mountain pastures in summer and lower
areas for the rest of the year.
• Herders have a permanent home: this means that only the herds and
the people necessary to tend them travel, the whole family lives in
tents all the year round, moving with the herd.
• Nomads mainly rely on natural vegetation for their pasture.• Large number of herds is kept as a sign of peace.
12.3.2. Factory farming, dairy farming and ranching farming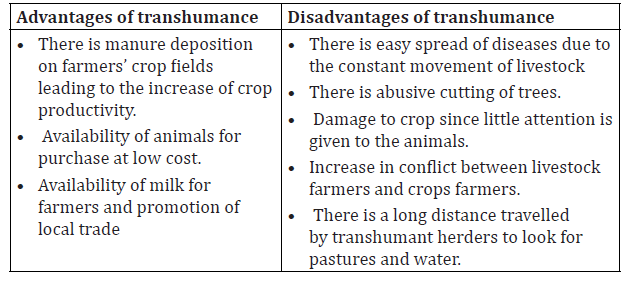
Activity 12.7
1. Describe the major features of factory farming
2. Discuss on factors favouring dairy and ranching farming
a. Factory farming
The factory farming refers to the type of farming business which keeps animals
at high stocking densities and uses modern technology to facilitate faster animal
growth, lower illness and death rates, and higher production outputs.
The idea of factory farming started because as the population continued to
rapidly increase, food production wasn’t happening fast enough. Therefore,
in order to feed everyone food production need to happen faster. This means
without factory farming in densely populated countries, meat and dairy
products would be rare and extremely more expensive than it would be today.
Its primary objective is to produce the most products and to gain as much profit
as possible. The main products of this industry are meat, milk and eggs forhuman consumption.
Characteristics of factory farming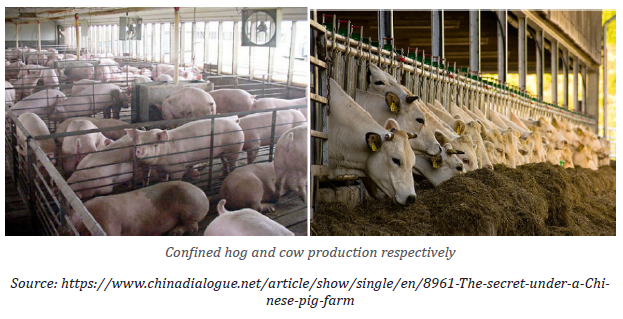
1. Large numbers of animals are usually held together indoors in closed
confined pens and shed, and often with physical restraints to control
unnecessary movement
2. Under factory farming, huge amount of antibiotics and pesticides are
used to fight the spreading of diseases and bacteria.
3. Factor farms are highly standardized for efficiency. Monocultures
of animals and feed crops are created highly unified through genemanipulation to help yielding consistent production every year.
Factory farms provide many benefits, but they can also lead to several drawbacks:
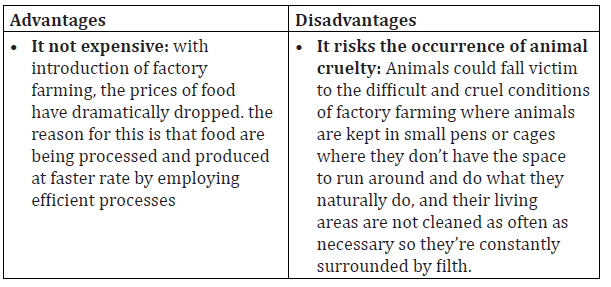
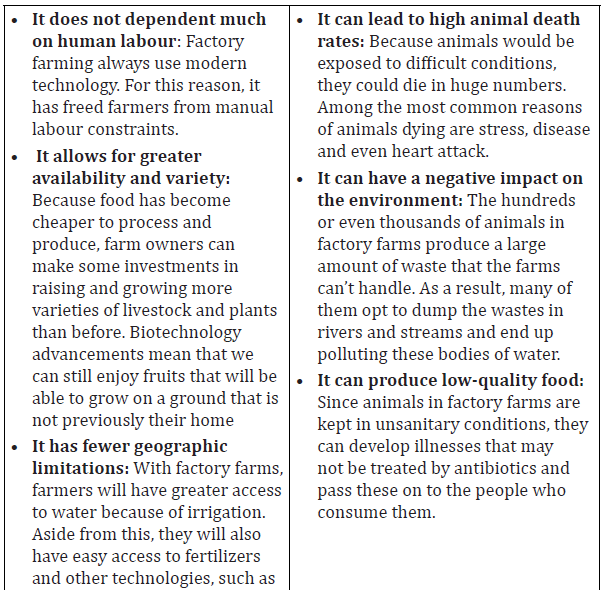

b. Ranching
Ranching is a modern form of pastoralism aiming of rearing of animals for beef
production on a large scale for commercial purpose. It is an enclosed system of
extensive livestock production. Under ranching, a piece of land called a ranch is allocated.
Ranching is more developed in United States of America, New Zealand, Western
Australia, Argentina, South Africa, Botswana, Zimbabwe, Zambia, Kenya,
Tanzania and Uganda.
Characteristics of cattle ranching
• Livestock ranching is the commercial grazing of livestock over an
extensive area which is associated with a very large land requirement,
capital and human resources.
• Ranches have a continuous vegetation cover such as alfalfa, Lucerne
and clovers.
• One type of animals is kept either for beef production. Therefore the
choice of the animals is done very judiciously.
• There is little or no movement from one area to another since animals
are confined in paddocks
• Ranches are scientifically managed through selective breeding, use of
hybrid species, research and control of animal diseases.
• The animals are reared for sale (they are kept for commercial purposes).
• It is carried out in sparsely populated areas and far from urban area
• Ranches are managed run on scientific methods. The animal kept
is guarded by from various disease by its regular vaccination,
crossbreeding and regular attendance of veterinary surgeons to the animals.
• It is practiced in areas where rainfall is low and unreliable to give place
to the crop cultivation.
• The animals in the ranches are kept for highly organized markets thushigh revenue from sale of beef, hides, and dairy products.
Advantages and disadvantages of ranching
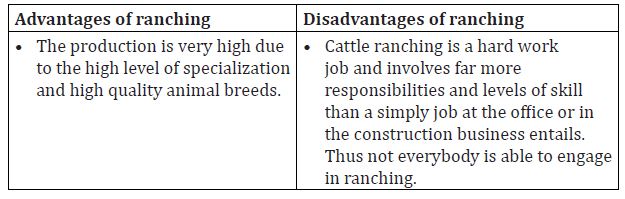
c. Dairy farming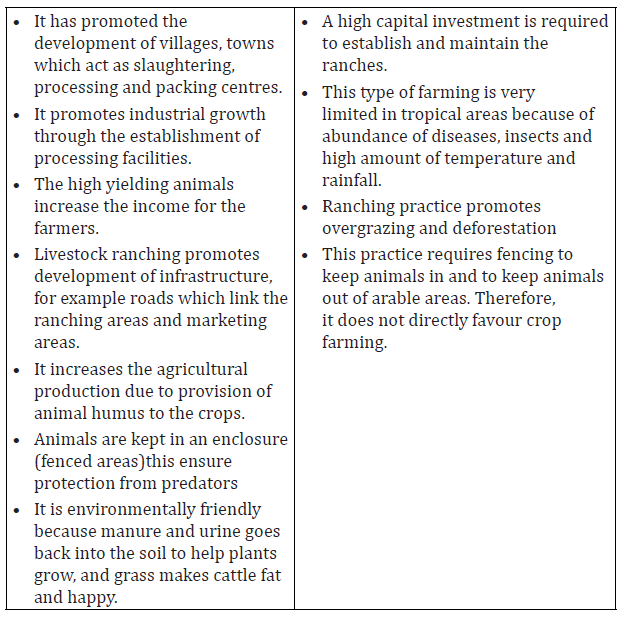
Dairying farming is the specialized rearing of cattle to produce milk and other
products like cheese, butter and cream mainly for commercial purposes.
Characteristics of dairy farming
• Dairy farming aims at raising cattle to produce milk
• Dairying on commercial basis has developed in humid temperate regions,
because cool temperate climate is ideal for cow-rearing.
• Capital intensive techniques of production are used
• Selected cattle breeds which yield a lot of milk are raised. Example, Jersey,
Ayrshire, Alderney and the Friesian breeds.
• Rich and nutritious grasses are sawn to supplement the natural pastures to
feed the animals.
• The farms are scientifically managed and any pests and diseases are controlled
• Benefits are very high due to the input and capital injection.• Many farms own their processing plants or dairies.
Application Activity 12.4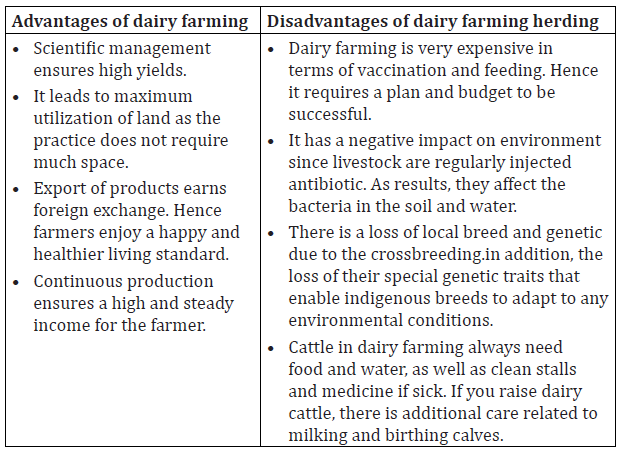
1. Explain why it is necessary to improve livestock farming in your community.
2. Discuss how industrial food impact people’s health.
3. Explain the advantages and disadvantages of technology in agriculture.4. Analyse the economic and social benefits of pastoralism.
12.4. Factors and problems affecting the livestock farming
and ways of improving it
Activity 12.8
1. Describe factors influencing livestock farming
2. Analyse problems facing livestock farming
3. Identify different ways of improving livestock farming
12.4.1. Factors affecting livestock farming
There are many factors that influence livestock farming, but the most
documented are the following:
• Topography: The areas having gentle and undulating terrains
consisting of relatively flat plains and plateaus are favourable for
Livestock farming. This makes it easy for animals to move freely from
one place to another.
• Climate: the main determinant elements of climate are the following:
─ The temperature, its duration and the intensity of sun radiation,
all affect the welfare of animals to a certain extent. The moderate
temperature is favourable for livestock farming.
─ The moisture, whether moderate or high mean annual rainfall is
essential for livestock farming. It ensures an abundant supply of
drinking water and pastures for the animals.
• Soil: The soil, which is composed of a variety of minerals and organic
substances, forms the physical support of plants to be fed the animals.
• Land tenancy: It includes all forms of tenancy and also ownership in
any form. Land tenancy and land tenure affect the livestock farming.
The land in pastoral areas is communally owned. This facilitates
communal grazing and free movement of their livestock.
• Size of Holdings: The large tracts of land in sparsely populated areas
are needed for a pasture. The size of holding and the size of farm decide
the number of animals to be kept in farm.
• System of ownership: The collective ownership is preferable for
having a very large paste and terrain for livestock.
• Labour: The availability of labour, its quantity and quality is
determined by the technology used in livestock farming. Traditional
farming methods require a big number of labourers while advanced
technology requires a few numbers of skilled people.
• Capital: Capital defines limitations to the size and type of livestock
farming to be practiced. All livestock inputs like insecticides, pesticides,
feeding stuffs, purchase of land, machinery, vehicles, buildings, and
veterinary services require capital. All the farmers make their decisions
on the basis of capital to invest.
• Mechanization and Equipment: The levels of technological tools to
be used play a vital role in the selection of livestock to be farmed and
decision making at the farm level.
• Market: Availability of market for the products from livestock farming
is a very important factor influencing livestock farming activities.
• Availability of transport means: A well-developed means of
transport with appropriate equipment to quarry balky products in
very necessary for transportation of animal’s products to the market.
• Pastes and of diseases: Animals farmed may be hampered by diseases,
insect-pests and wild animals. It is better to choose the areas free from
those harmful animals.
• Culture belief: Some types of animals are not grazed by a given society
due to beliefs, customs or personal convictions. For example, Muslims
cannot keep the pigs.
• Government policies: The government policies affect livestock
farming in different ways:
─ Government policies can encourage or discourage modernization
of livestock. Some countries, such as Rwanda and Britain
encourage the productivity and efficiency of farming by a system
of donation and subsidies to farmers.
─ The government determines the ways in which farmers develop
their farming and this may be a help or hindrance to animal
production.
12.5.2. Problems facing livestock farming
The following are some of problems affecting livestock farming:
• Limited rainfall: Unreliable rainfall limits the growth of grasses and
affects the growth rate of animals and the production.
• Population pressure: the world population is increasing incredibly.
This reduces the availability of livestock farming and natural resources.
• Shortage of water: the facts that the surface of water for livestock is
limited; this is a serious problem leading to death of animals in some
parts of Africa and poor quality products.
• Disease and pest infection: Shortage of supply of skilled labour that
• Capital: Capital defines limitations to the size and type of livestock
farming to be practiced. All livestock inputs like insecticides, pesticides,
feeding stuffs, purchase of land, machinery, vehicles, buildings, and
veterinary services require capital. All the farmers make their decisions
on the basis of capital to invest.
• Mechanization and Equipment: The levels of technological tools to
be used play a vital role in the selection of livestock to be farmed and
decision making at the farm level.
• Market: Availability of market for the products from livestock farming
is a very important factor influencing livestock farming activities.
• Availability of transport means: A well-developed means of
transport with appropriate equipment to quarry balky products in
very necessary for transportation of animal’s products to the market.
• Pastes and of diseases: Animals farmed may be hampered by diseases,
insect-pests and wild animals. It is better to choose the areas free from
those harmful animals.
• Culture belief: Some types of animals are not grazed by a given society
due to beliefs, customs or personal convictions. For example, Muslims
cannot keep the pigs.
• Government policies: The government policies affect livestock
farming in different ways:
─ Government policies can encourage or discourage modernization
of livestock. Some countries, such as Rwanda and Britain
encourage the productivity and efficiency of farming by a system
of donation and subsidies to farmers.
─ The government determines the ways in which farmers develop
their farming and this may be a help or hindrance to animal
production.
12.5.3. Ways to improve livestock farming
Livestock can be improved through the following ways:
• Settling the nomads: In many African countries and the rest of the
world, nomads hold a large number of cattle, the government should
make an effort and encourage settling nomads so that they can get
essential veterinary services to keep their cattle healthy.
• Empowering animal keepers through education: Efforts should be
put in place and enlighten livestock farmers on new innovations and
technology that will bring a high quality animal productivity.
• Government support: Government should be an initiator for livestock
farming support by establishing adequate infrastructure, easy access
to the loan to boost the livestock farming. this will benefit the country
and farmers in general
• Adoption of modern livestock farming methods: Through
motivation and other government support, efforts needs to be put in
place to convince rural farmers to switch from traditional livestock
farming to modern livestock farming which is more profitable.
• Provision of livestock healthcare: Extending veterinary services to
all the areas where the livestock keeping is practiced is a good step to
improve livestock farming. This will help to reduce the incidence of
pest and diseases.
• Encouraging tree planting on pasture land: This minimizes the
dangers of environmental deterioration in addition to provision of
shelter to animals. This will also help in improvement of grazing and
watering management.
• Adequate livestock feeds and nutrition: The provision of feed that
is adequateboth in quality and quantity is an extremely y good for
livestock farming
• Introduction of crossbreeding: To achieve this is by replacing the
local breeds of animals with the exotic to increase the output andenhance the off springs’ economic value.
Application Activity 12.5
1. Examine the impact of livestock farming on environment.
2. Discuss the importance of livestock farming3. Suggest ways problems of livestock farming can be solved
Skills lab
Move around your village and make a research on the types of agricultural
practices in the village and suggest ways in which agriculture can benefitindividuals and the village as a whole.
End unit Assessment
Read the passage below and answer the questions that follow.
The university of Lincoln is physically located in the centre of the United
Kingdom’s agri-business industry. Recently, 25 students had an internship
and farm experience in different African countries. In Gabon, They found
farmers burning forests as a way of preparing land for crops growing,
in Kenya farmers grow tea for sale and livestock farmers in the North
of Kenya keep large number of local cattle in an open land where they
always move with while in Rwanda, most cows remain inside the stall.
1. Describe the type of crop farming practiced in Gabon.
2. How the above practice affects the environment?
3. Analyse the economic importance of crop cultivation cited in Kenya.
4. The above livestock farming mentioned in Kenya faces many
problems. Suggest possible solutions.
5. Pastoralism affects the environment in different ways. Suggest
measures to prevent overstocking and overgrazing in areas of pastoralism.UNIT 13: MINING IN THE WORLD
Key unit competence: The student-teacher should be able to explain the
impact of mining on sustainable development ofdifferent countries in the world
Introductory activity
The underground is very rich in natural resources, but they have to be utilized in a
sustainable manner in order to support socio-economic development of different
countries owning those natural resources. However, if they are not exploited well,the physical environment can be degraded.
1) Identify the economic activity taking place in the areas shown on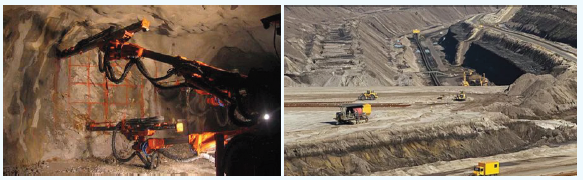
photographs above.
2) Name the major minerals of the world and mention the countries which
are exploiting them.
3) Examine the factors that have favoured mining activities in USA or South Africa,
4) Analyse the effects of exploitation of minerals to the economic developmentof any country like Rwanda.
13.1. World distribution of major minerals
Activity 13.1
1. Identify the major world minerals and state where they are found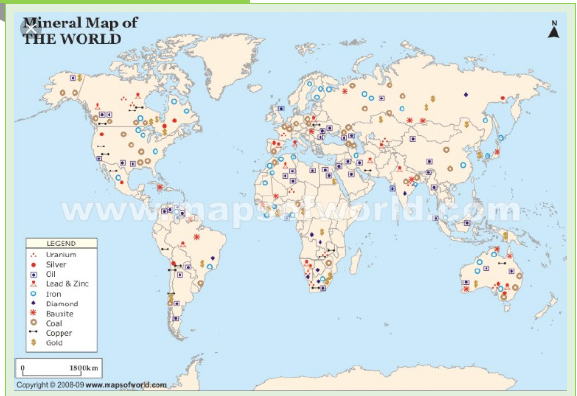
using the above map.
2. Using the legend presented in map above, state the countries where
the following minerals are exploited: Gold, copper, oil and natural gas, lead.
3. Explain how the natural resources in specific minerals can beexploited without affecting the environment.
Mining refers to all the processes by which minerals are obtained from the
earth’s lithosphere. Minerals may be in gaseous, liquid or solid form. The
processes involved depend upon the mode of occurrence of the mineral.
Three major mining areas may be distinguished on the basis of variety of
mineral resources, amount of exploited minerals, and their production. These are:
• North America: From central Alaska and north-central Canada to
southern Mexico. The central plains from the Gulf of Mexico to the
Laurentian shield contribute more than half of the total value ofminerals mined in the USA and about one-fourth that of Canada.
• Africa: African regions are also endowed with minerals such as
petroleum, natural gas, coal, Sulphur, potash, lead, zinc, gold etc.
• Eurasia: From United Kingdom and the Iberian Peninsula to east
central Siberia. West Europe is rich in coal, iron ore, bauxite, salt,
potash etc., but it lacks in copper, lead, zinc, tin and alloys etc.
• South-east Asia: Includes India, China, Japan, Malaysia, and Indonesia.
This region has sufficient output of earth material to cater to the
domestic needs of a large population. India and China have sufficient
coal, iron ore and a variety of alloys. Malaysia and Indonesia have surplus tin.
The table below shows the minerals, their uses and where they are found. Thecountries shown are just some among the many other ones.
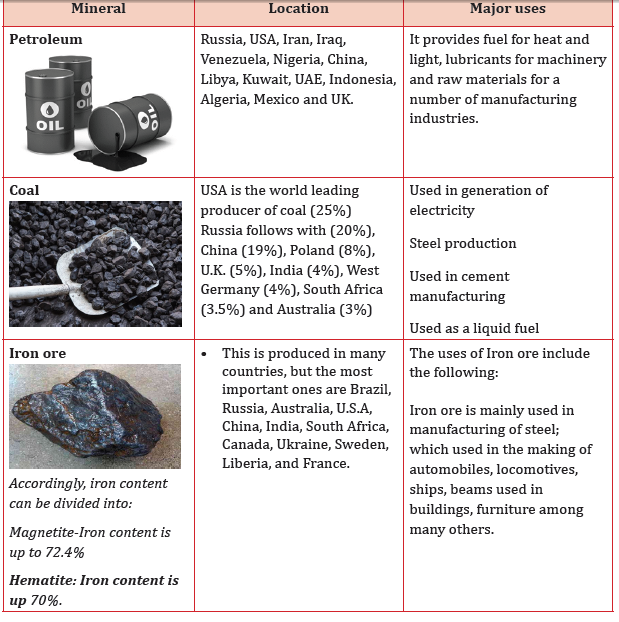
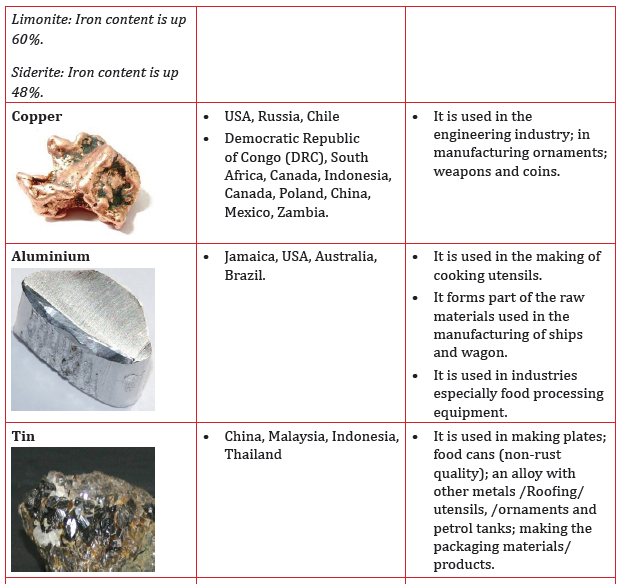
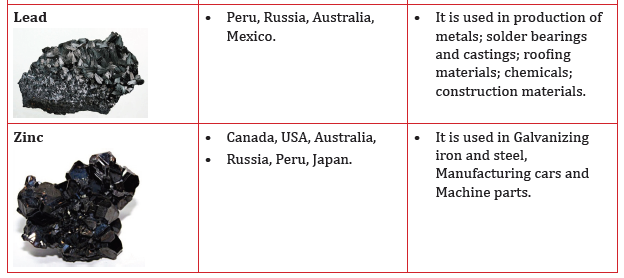
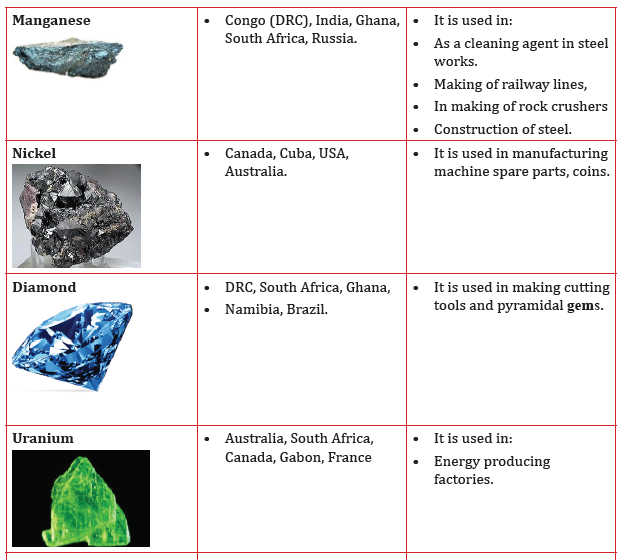
Application Activity 13.1
1. Identify two areas outside Rwanda where tin and coltan are
extracted in large quantities.
2. Apart from Tin and Coltan, state other major world minerals.
3. Draw a sketch of Rwanda and show the major areas where minerals
are exploited or extracted.4. Using the world map locate the major mining areas of the world.
13.2. Methods of mining
Activity 13.2
Read the passage provided below and answer the following questions:
Mahoro is one of the prosperous investor who is interested in mining. She
recently visited DRC and the research findings included the following: (i)
Some mineral ores are near the surface; (ii) Some minerals are deeply
located below the surface area.
1. Using the past studies, describe the mining method that can be
used by Miss Mahoro in the exploitation of the mineral ores near
the surface and mineral ores occurring deep into the crust.
2. Identify and explain the effects of different mining methods on the
physical environment and suggest the appropriate ways to deal
with the negative effects of those mining methods.
When extracting mineral from underground/ground deposits, there are
various methods that can be used. These methods depend greatly on the mode
of occurrence of the mineral, of the value of the mineral, and the size of deposit.
The most common mining methods include the following:
13.2.1. Opencast or open pit mining
This is the easiest and the cheapest way of mining minerals that occur close to
surface. This simply involves the removal of the overburden that is the earth or
other rock bands lying above the mineral-bearing strata.
This is the simplest and cheapest method of mining. It is used where mineralsare very close to the surface of the earth.
13.2.2. Underground mining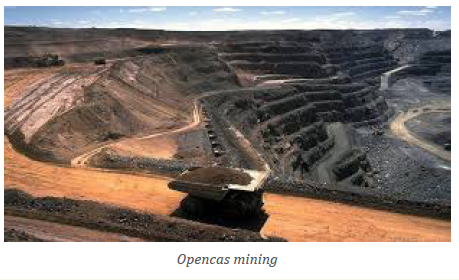
When the minerals lie deep below the surface, the overburden is too thick to
be removed by mechanical shovels and underground mining methods have to
be used. This mining method involves creation of network of both vertical and
horizontal tunnels. These follow the mineral bearing rocks. The vertical tunnels
are called shafts. The mined minerals are transported along the shafts using
conveyor belts on which lifts, or cages are affixed. The cages move up and down
the shaft.
There are circumstances where the mineral ore bearing rocks occur in a
horizontal manner. In this case horizontal tunnels are created to have access
to the mineral ore extraction. Such tunnels are called Adit or crosscut opening.
There must be proper ventilation to allow the miners have clean and safe air,
the roofs of the tunnels must be supported with strong pillars and strong wire
mesh. This method is used in extraction of mineral ores in countries such as
gold mining in South Africa, copper and cobalt in DRC and Zambia.
The following are different underground mining methods:
i) Drift or Adit method: This is whereby the minerals are extracted from
the sides of a hill or a valley. The mineral bearing veins or seams are found
protruding on the side of the valley or hills.
ii) Shaft method: this is used to extract minerals found in deep or very
steep inclined seams. Vertical shafts are sunk underground. From these,horizontal tunnels or galleries are dug to reach the mineral bearing rock.
iii) Hill slope boring: This is used in the extraction of minerals such as coal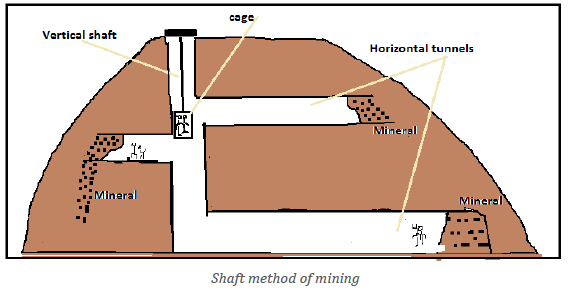
which may outcrop from the hill side. A gently sloping shaft is dug into thehillside to reach the mineral.
iv) Solution method: This is done from the surface of the earth. Shafts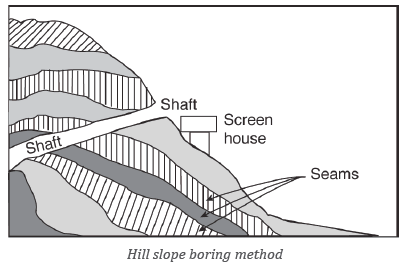
are sunk down into the mineral deposits. Pipes are installed to link the deposits.
v) Drilling method: This method is used in the extraction of non-solid
minerals such as oil and natural gas from the ground. It involves the
creation of drill and after the drill reaches the mineral, pumps are insertedto transport the oil or gas to the collecting and refinery centres.
13.2.3. Alluvial mining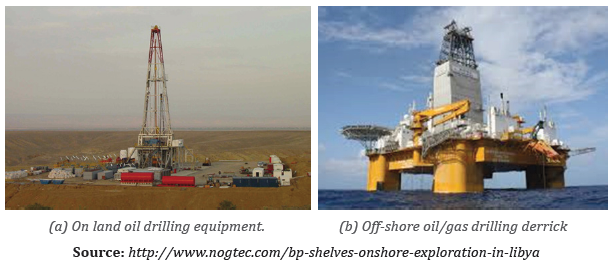
Alluvial mining refers to the situation where minerals are got from alluvial
deposit from water bodies mainly rivers. The following methods are used to
extract them:
Placer mining method: this is done by mixing the alluviums with water and
tilting or rotating the gravels until the light particles (sand, mud, dust, stones)
are washed off, leaving behind those with higher specific gravity like gold, tin,platinum etc.
Panning: This method is used by small scale miners. This involves mixing of
water with mineral bearing deposits scooped from riverbeds. The mixture is
then lifted into a pan. The pan then is rotated vigorously and later tilted to
incline on one side. The lighter material of sand, mud, dust and stone debris are
left behind stuck on the wet drier side of the heavier material consisting of themineral is found at the bottom of the water.
i) Hydraulic mining: This is use of water sprayed from powerful pumps on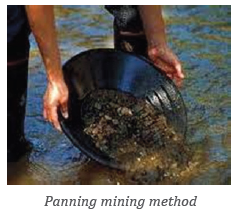
the sides of valleys or slopes to bring down the alluvial deposits once thealluvial deposits have landed on the floor of the valleys, they are collected.
Application Activity 13.2
Analyse the photographs below and use them to answer the questionsthat follow:
1) Name the economic activities that are taking places at the areas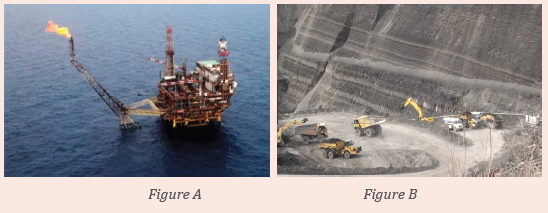
represented by figure A and figure B.
2) Describe other methods of mining used in the world.
3) Analyse the impact of the two methods mentioned represented byfigure A and B on the physical environment.
13.3. Factors affecting mineral exploitation
Activity 13.3
Read the passage shown below, and use it to answer the following
questions:
Several countries of the world have a variety of mineral. Some countries are
enjoying the successful economy due the mining activities while others arestill lagging behind economically despite having large deposits of minerals.
1. Explain the factors that have contributed to the differences associated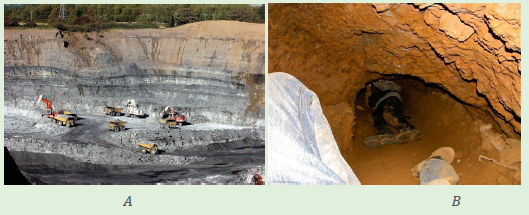
with mining represented in the passage above.
2. Evaluate the effects of the activity being carried out in Figure A onthe physical environment.
The factors that influence or affect mineral exploitation include the following:
• The value of the mineral: Minerals of high value such as diamond are
exploited at any cost. They can be mined without incurring losses.
• Size of deposits: This factor influences the nature and type of
equipment to be used. The bigger mineral deposit attracts more
investors since they do not fear the loss.
• Transport costs: when transport facilities are well developed and
the transport costs are affordable mineral deposits around attract the investors
• Mode of occurrence of minerals: Minerals that are near the surface
of the earth are more profitable to exploit since less expensive mining
methods and equipment are involve. This means that, if the mineral is
deep underground, it becomes costlier to exploit it.
• Labour: Mining requires both skilled and semi-skilled labour. In
developed countries, it is easy to get the required labour unlike in
developing countries.
• Capital: The presence of adequate capital will encourage the
exploitation of minerals. This because mining requires heavy
equipment that is expensive to purchase. When capital is not enough it
means that the mineral deposits can hardly be mined.
• Market: Mining is majorly conducted for commercial reasons.
Therefore, its success depends entirely on the presence or availability
of enough market. If there is a high demand for a given mineral, such
mineral will be exploited.
• Technology: Mining requires appropriate technology. Countries
with advanced levels of technology exploit their deposits better than
developing countries with low levels of technological advancements.
• Political climate: When the country is secure in terms of security
and political stability, minerals will be exploited. This is so, because
both foreign and local investors will be interested in making business
ventures in the sector of mining.
• Government policy: Minerals can only be exploited when there are
favourable and friendly governmental policies. Such as tax holidays,
quick and on-line registration of companies and affordable licensing procedures.
• Power: Mining requires adequate supply of power and energy. This
because of the heavy equipment used in the exploitation of minerals.
Therefore, in areas where power is unreliable it is very hard to exploitminerals that are deep in the underground.
Application Activity 13.3
1. Account for the low levels of mineral exploitation in the developing world.
2. To what extant is the mode of occurrence of mineral ore responsiblefor its exploitation in DRC.
13.4. The effects of mining to the economies of the world
Activity 13.4
Use the Internet, Geography textbooks, previous knowledge acquired in
Geography to;
1. Evaluate the effects of mining to the socio-economic development
of the countries.
2. Analyse the effects of mining operations on the physical environment
in Rwanda.
The mining sector contributes a lot to the socio-economic development of
countries. Some of the contributions are positive while others are negative.
Below is a detailed explanation of the effects of mining to the economies of the
world:
13.4.1. Positive effects of mining to the economies of the world
The mining industry has had an influence on the economy in a number of ways,
which may be summarized as follows:
• Employment opportunities: There are thousands of people employed
by the sector of mining either directly or indirectly. These people have
their lives improved because of the salaries they earn.
• Development of transport and communication facilities: Mining
has influenced the establishment of varying forms of transport and
communication infrastructures. There are feeder roads and all whether
roads radiating from mining centers to ports and urban centers. For
example, the Tazara railway line was constructed because of copper
mining in Zambian.
• Source of revenue: The companies that are involved in mining sector,
pay taxes to the government. They must attain license and such calls
for payment of a given fee. The revenue collected is thereafter used to
development the country.
• Source of foreign exchange: Mining sector contributes a lot to the
earning of foreign exchange to the countries. Minerals are exported
to other countries and such has enabled them to have huge sums of
foreign currencies.
• Urbanization of many areas: Mining operations have encouraged the
growth and development of the urban centres. That is, many people
move to mining areas and such increasing population numbers attract
other infrastructural development to the area and eventually, towns
and cities develop. The good examples are: Lubumbashi, Belfast,
Johannesburg, and Lagos.
• Growth and development of industries: Mining has led to the
development of large manufacturing industries. There are industries
engaged in smelting of mineral ores, others processing minerals to both
semi-finished and finished goods. On the other hand, there are other
industries that are dealing with manufacturing of mining equipment.
• Diversification of the economy: Mining has assisted the countries
to have another alternative economic activity. This implies that the
countries are able not to depend on few economic activities such as
agriculture, fishing, industrialization and tourism, the country can
utilize the mining sector too.
• Improved international relations: The exporting and importing
countries always tend to have a friendly relationship. This means
that as one provides mineral ores another provides market. This
interdependence results into having political allies that can support
one another times of crisis.
• Improved standards of living: People earn income in form of wages
and salaries which is used to better and improve their way of living,
such as sleeping well, dressing, good shelter, acquisition of education
for their children and meeting the domestic demands such as food,
medical treatment among others.
• Acquisition of skills: The people employed by the mining sector,
learn a lot of skills through the staff development trainings. These
skills acquired can be later utilized by individual to start up their own
business projects.
• Exploitation of other resources such as generation of HEP: Mining
has influenced the tapping of other resources such as using of water
falls in power generation such as Hydro-electric power. This so because
of the high need for power in running of the heavy machines.
• Tourist attraction: The mining operations and installations attract
many people from various parts of world. These people pay a fee to
the concerned countries and companies in concern. Such therefore,
develops tourism which is one of the sources of foreign exchange.
13.4.2. The negative effects of mining to economic development of countries
Mining industry has played a positive role in the economic development of the
world’s countries. However, this sector is known to have contributed negatively
to the economic development in various ways. The following are some reported
negative effects of mining on the economic development:
• Mining has become the chief cause of pollution in many countries of
the world. Waste soils, impurities, fumes from the equipment used
and by products associated with mining operations have resulted
in pollution of rivers and environment. This has also contributed to
serious global warming as a result of environmental degradation.
• The mining sector has also contributed to depletion of natural
resources in and around mining areas. The exhaustion of minerals
causes unemployment of miners, which becomes a challenge to the
governments and increases overdependence ratio.
• There are sometimes great losses incurred by the mining companies.
This because some minerals are of low demand. Such reduces the
investment base of the people.
• The shortage of mineral and the fluctuation of prices make it hard for
the economic planners to have a reliable policy designing system that
is workable and functional. Such leaves a great gap within economic
development. To worsen the situation, some companies fail because of
registering losses.
• Mining has become one of the attractive sectors that employ thousands
of people. This has however, left other economic sectors with reduced
productivity.
• Soil exhaustion land suitable for agriculture is wasted or removed
when mining is taking place using Open cast. This has left some areas
faced with shortage of food.
• There is increased environmental degradation caused by the high
demand for timber which is used in the mining sector. At the same
time, large chucks of forested areas are cleared as minerals are being
searched leading to deforestation.
• There is increased government expenditure as it tries to address
the challenges caused by the mining sector. Such as rehabilitating
depleted areas and filling up the deep pits left behind by the mining
companies. The money spent would otherwise be used to develop
other sectors that directly benefit the citizens.
• Displacement of people, many homesteads is involuntarily displaced
when mining operations are to take place from a specific area. This
breaks the social ties that families share. Resettling them in other parts
of country too is costly.
• Profit repatriation, most of the mining sectors are owned and
managed by foreign companies. These have always repatriated theprofits and leaving little for reinvestment in the country.
• Urbanization associated effects, has partly come into existence
because of mining operations in some areas. This has come along with
slum developed, organized crime, and other ill-effects. All these puttogether affect the development of the economy.
Application Activity 13.4
1. Assess the contribution of mining on the economic development of Rwanda.
2. Discuss negative effects of mining to the physical environment of Rwanda.
13.5. Case studies of mining in selected countries
Activity 13.5
Using the geographical documents, text books and internet:
1. Describe mining activities taking place in Russia, China and South Africa.
2. Examine the factors that have favoured the development and
growth of mining sector in China.
3. Assess the contribution of mining sector to the socio-economic
development of South Africa.
13.5.1. Mining in Russia
The mining industry in Russia is among the highly developed sectors in the
country and the world at large. Russia is known for having almost all known
minerals resources in the world. Russia has the world’s largest proven iron
ore reserves and the world’s second largest coal reserves (20%). The mining
industry of Russia is one of the leading mining industries in the world. Russia
having been naturally endowed with a wide range of mineral resources, the
country put them to better use and became the world’s leading mineral resources
producer. It contributes up 14% of the world’s total mineral extraction, Russia
possesses the following minerals reserve: Iron ore, Manganese, Chromium,
Nickel, Platinum, Titanium, Copper, Tin, Lead, Tungsten, Diamonds, Gold, Oil,Natural gas, Coal.
There are four major mining regions in Russia. These are:
• Southern region of Russia which is known for coal mining and oil drilling.
• West Siberia also known for coal and oil.
• Urals region which is important in copper, manganese, platinum and
tungsten mining.
• Murmansk region which is known for exploitation of copper and lead.
Factors that favour mining in Russia
• The presence of a wide variety of mineral reserves, the country is
blessed naturally with a variety of minerals that have enabled a steady
supply of the minerals on the international market.
• The availability of capital from the state and from the international
mining companies that exploit minerals in the area. This explains why
they are able to use modern equipment as well as hiring the experts.
• Supportive government policies, these have favoured the
establishment of mining companies since they are offered tax holidays
and subsidization in times of economic hardships.
• The availability of both skilled and unskilled labour from the locals
and immigrants in the country. The mining sector requires enough
labour force. Having it at a hand’s reach provides the opportune
moments of prosperity.
• Presence of advanced technology that is required in the mining
sector. The Russian mining companies have managed to exploit the
deeply concealed minerals and drilling of oil from off-shore oil deposits.
This is all attributed to the availability of technology that s advanced.
• Adequate power supply that is required to power the sector. The
nuclear power production as well as other forms of power and energy
in large levels, has enabled the mining companies to operate at all time.
• The presence of a well-developed transport and communications
system needed for the transportation of minerals and their products.
The Russia is one of the countries of the world with well-developed
means of transport.
The challenges faced by the mining sector in Russia
• Depletion of mineral reserves. The prolonged period of exploiting
minerals in Russia has left most of the mineral ore deposits exhausted.
• There is a low discovery rate of new reserves. This has put the mining
sector of Russia at a significant risk of having some minerals beingexpensive to get.
• The mining sector of Russia is still devoted to the traditional
machinery used in the reasonable years gone by.
• High death rates, in the mining sites of Russia are very high. This is
because the soils of Russia in places where mining is conducted are
less consolidated such as in coalfields.
• There is stiff competition from other countries engaged in mining sector.
• The mining sector is challenged with prominent levels of pollution of all kinds.
• In some places mining has led to the displacement of people from
their homes. In areas where mineral resources are found, in most case
people are displaced and resettled in other places. This is costly and socially challenging.
• Land degradation, Mining scars of exhausted areas that are completely
of less or no importance in terms of production.
13.5.2. Mining in China
China is one of countries with a variety of mineral resources. In terms of
scale and magnitude, China’s mining industry ranks third in the world. The
mining sector in Chinese is greatly supported by high levels of technology and
supportive government policies. The country has several minerals such as:
gold, cobalt, iron and steel, nickel, vanadium, molybdenum and manganese.
There are several mining centers in china, but the most dominant and majorones include the following:
Mining regions and mineral produced in China
Other mining centers include Tayeh, Bayan Obo, Anshan, Shantung, Kiuchuan,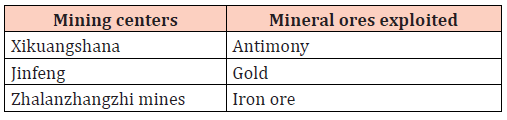
Xinjiang and Guangzhou. An increasing demand for mineral resources has
made the Chinese industries to supplement the locally mined minerals with the
imported ones. The country has oil fields in Beijing, Lanzhou and Chongqing
among other regions.
The factors that influence the development of mining sector in China are similar
to the ones discussed on a general perspective earlier. At the same time, refer tothe factors that favour the development of mining sector in Russia.
13.5.3. Mining in South Africa
In South Africa, mining has been the main driving force behind the history and
development of this African’s most advanced and richest economy, after Nigeria.
Large scale mining started with the discovery of diamond on the banks of the
Orange River in 1867 by Erasmus Jacobs and the subsequent discovery and
exploitation of the Kimberley pipes a few years later. This has been followed
by the discovery of Gold in Kaapvaal Craton, chrome, platinum, vanadium,
vermiculite, manganese are also produced in South Africa. This country is also
a huge producer of iron ore. In 2012, it overtook India to become the world
third biggest iron ore supplier to China.
Diamond and gold production may now be well down from their peaks, but
South Africa remains a cornucopia of mineral riches.
The country is endowed with a variety of natural resources. It has large mineral
reserves. The Republic of South Africa is the world’s largest producer of
manganese ore, platinum group metals and gold.
Other minerals found in South Africa include; diamond, coal, copper, uranium,iron ore, asbestos and silver.
The factors that have contributed to the development of mining in South Africa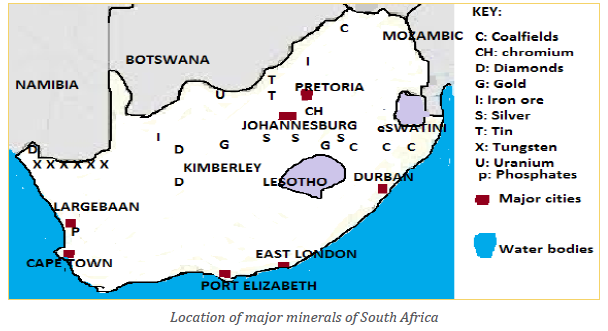
and the effects of mining in South Africa are not different from those discussedon general perspective of mining. You can refer to them.
Application Activity 13.5
1. For either Russia or China, account for the successful mining sector.
2. Note down the lessons you have learnt from the study on mining in
Russia and show how you can use them to improve mining sectorin your country.
End unit Assessment
Study the photograph provided below and use it to answer the questionsthat follow:
The above photograph shows the pollution of water as result of mining.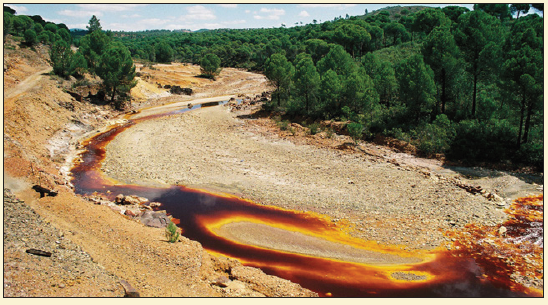
This polluted water flows to the bigger water bodies and their outlets
further redistribute the water to other parts.
1. Assess the impact of mining on the environment.
2. Suppose you were living in the area where this photograph was
taken, explain the challenges you are more likely to face.
3. Create a program which aims at addressing the negative impact of
mining on the physical environment.
4. Identify and explain the environmental concerns associated with miningUNIT 14:POWER AND ENERGY PRODUCTION IN THE WORLD
Key unit competence: The student-teacher should be able to evaluate
the success of sustainable development projects
in the power and energy production in different
parts of the world.
Introductory activity
1. Observe pictures provided below and answer the following questions: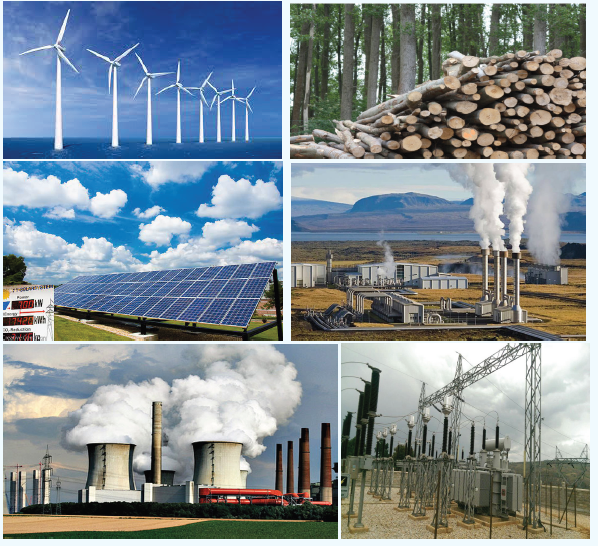
i) Identify the types of power and energy shown above.
ii) Which ones are renewable among them?
iii) Explain how each type of power and energy works.
iv) Indicate the types of power and energy used in Rwanda within those
shown on the pictures above.
2. Describe the problems that some countries face in power and energy production.
3. 3. How can power and energy contribute to the sustainable development of our planet?
14.1. Sources and forms of energy used in the world
Activity 14.1
1. Make a short tour in the school and the surrounding environment
and answer the following questions:
i) Identify the activities that require power and energy at your school.
ii) Describe the forms of power and energy needed for each activity
identified above.
2. Discuss the sources of power and energy exploited and not exploited in Rwanda.
14.1.1 Classification of energy resources
There are two main categories of energy resources:
• Non-renewable resources: These are resources of energy without the
capacity of replenishing themselves after being used. When used they
get exhausted and cannot be re-used. They include minerals, natural
gas, oil and coal.
• Renewable resources: They are inexhaustible. These are resources of
energy with the capacity of replenishing themselves after being used.
They include water, wind, solar, plants (biomass) and animals (biogas).
A. Non-renewable energy sources
Non-renewable energy resources are available in limited supplies. This is
usually due to the long time it takes for them to be replenished. They includenuclear energy and fossil fuels energy resources like coal, oil and natural gas.
i) Nuclear energy (Uranium)
Nuclear energy is energy obtained from uranium through a chain reaction. When
it was realized that when the nucleus of an atom is bombarded by electron it
disintegrates and release enormous quantity of energy
Generation of electricity involves a lot of technical know-how and so far, only
highly developed countries have been able to master it.
ii) Coal
Coal is a sedimentary deposit formed by the slow action of heat and pressure
on plant remain buried in the long past. It is a mechanical mixture of carbon,
hydrogen, nitrogen, sulphur, etc.
The coal can be used in the following:
─ In thermal generators to produce thermal electricity.
─ As a domestic fuel for heating and indirectly in the form of a gas and electricity.
─ In iron smelting e.g. through use of metallurgical coke in blast furnaces.
─ To provide a number of raw materials for the chemical industries like
coal gas, coal tar, benzene and ammonium sulfate
iii) Petroleum (oil)
Petroleum is an inflammable mixture of oil hydrocarbons with very complex
properties. Petroleum literally means ‘rock oil.’ It exists underground in solid,
liquid and gaseous form.
The following are uses petroleum:
─ for heating homes
─ as industrial power to drive/move engines and for heating furnaces
and producing thermal electricity;
─ as transport power for driving railways, motorcars, ships and aeroplanes;
─ as lubricants of machines especially high-speed machines;
─ as a raw material in various petro-chemicals industries, such assynthetic rubber, synthetic fibres, fertilizers and medicines.
iv) Natural gas
Natural gas is a naturally occurring hydrocarbon gas mixture consisting
primarily of methane, but commonly including varying amounts of other
higher alkanes, and sometimes a small percentage of carbon dioxide, nitrogen,
hydrogen sulfide, or helium.
Natural gas (Methane) as a fuel may be used for cooking, heating and even to
generate electricity. It has the advantage that it can be pumped through pipes
from wells to consumption sites. It is also a “clean fuel”. This means that it causes
less air pollution. Natural gas can be shipped in liquid form, called liquefied
natural gas.
B. Renewable energy sources
These are resources of energy with the capacity of replenishing themselves
after being used.
They include the following:
i) Wind energy
Wind energy or wind power is the use of wind to provide the mechanical power
through wind turbines to turn electric generators. Wind is an almost unlimited,
free, renewable, clean and safe source of energy. It has a moderate net useful
energy yield and is based on fairly well developed technology.
ii. Water energy
This is the energy produced from running water. Usually, a dam is constructed
along a river to store water. The water is then made to fall over a steep gradient.
It then passes through a turbine hence spinning the blades of the turbine. Rotation
of the blades causes the turbine to turn an electric generator that produces electricity.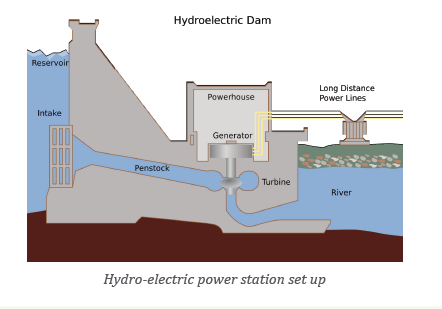
iii. Solar energy
Solar power is the conversion of energy from sunlight into electricity, either
directly using photovoltaics, indirectly using concentrated solar power, or a combination.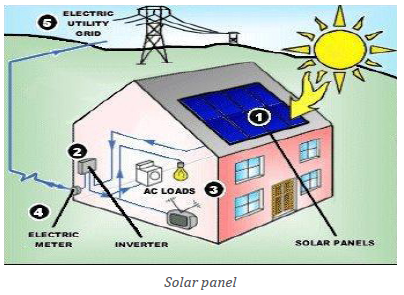
iv. Biomass
Biomass is organic material that comes from plants and animals, and it is a
renewable source of energy. Biomass is a renewable energy source for the two
reasons: first the energy in it comes from the sun, second, biomass can re-grow
over a relatively short period of time compared with the hundreds of millions
of years that it took for fossil fuels to form.
Biomass energy includes: wood fuel, Bio-gas and Gasohol.
- Wood fuel: This is a very important source of energy in third world
countries. The wood obtained from forests is either used directly or converted
to charcoal.
- Waste products (Bio-gas): This is a flammable gas produced by micro-
organisms, when organic matter is fermented under specific temperatures,
moisture content and acidity. It is mainly composed of methane
which burns with a blue flame.
- Gasohol: Plant material may be converted to alcohol which is a fuel.
Wood, wood wastes and garbage can be heated to produce methanol.
Most plants containing starch and sugar like sugarcane and cassava can
be converted to ethanol. Corn, corn stalks, manure and sewerage can be
fermented and distilled to give ethanol. Both methanol and ethanol aredirectly burned as a fuel.
v. Geothermal
Geothermal energy is produced when rocks lying deep below the earth’s surface
are heated to high temperatures by energy from the decay of the radioactive
elements in the earth and from magma. Geothermal energy can be considered
as renewable source of energy if deep underground heat flows can be tapped.
Geothermal energy can either be used for heating water, directly and space
heating needs in agriculture and for domestic purposes or it can be convertedinto electricity.
Application Activity 14.1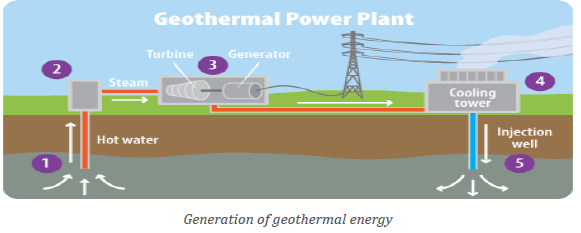
1. Describe the sources of power and energy exploited in Rwanda.
2. Indicate the main hydro-electric power stations in Rwanda.
3. Suggest other alternative sources of power and energy that can be
used in the world.4. What types of energy sources promote environmental sustainability?
14.2. Factors and importance of power and energy
production in the world
Activity 14.2
1. Describe the areas of power and energy production in Rwanda,
showing the reasons of their geographical location.
2. What are the challenges that Rwandans would be facing if thoseareas identified above were not there?
14.2.1. Factors favouring power and energy production in the world
The following are the major factors influencing power and energy production
in the world:
• Availability of market to consume the electricity produced. For
example, densely populated areas, industrially and commercially
advanced, have a great demand for electricity.
• Availability of capital to invest in power and energy production.
Production of energy/power, setting up power houses, and transmitting
electricity through wires to the areas of consumption require a lot of
capital in terms of money.
• A high degree of technical knowledge and skills.
• The potentiality of power and energy generator, the amount of hydroelectrical
power to be produced depends on the quantity of water and
velocity of stream.
• The natural environment of the area where the power and energy
will be produced and transported such as the topography (e.g. nature
of terrain and slope), climate (e.g. amount of rainfall, sunshine),
hydrology (e.g. quantity and quality of water), affect the production ofpower and energy.
14.2.2. Importance of power and energy in the development of the world
Power plays a role in the development of a country in different ways such as:
• Earns foreign exchange: Energy can be exported in neighboring
country and in that way, it is contributing to the earning of foreign exchange.
• Development of industrial sector: Most industries use petroleum
and its by-products to run the machines. Electricity is also used to run
machines while wood fuel is used in various processing industries
such as tea processing.
• Development of transport sector: Petroleum is used in road
transport, water transport and air transport meaning that it the basic
element in transport.
• Creation of employment opportunities: The generation of electricity
is offering employment to a good number of people.
• Development of agricultural sector: Solar energy is used to dry
grains and other produce such as tobacco, cocoa and coffee. Petroleum
and its by products are used to run water pumps and other agricultural
machinery. Wind power is used in dry regions to pump water for irrigation.
• Improvement of welfare of people in general: Various forms of
energy is used for various purposes such as cooking, lighting and heating.
Application Activity 14.2
1. Describe requirements for Rwanda to fully exploit its available
power and energy resources.
2. Visit your local industrial areas and identify the role of power and
energy in an industry.
14.3. Problems and possible solutions for power and energy
Activity 10.3
Visit a power station in your environment and do the following:
i. Identify the problems of power production
ii. Suggest the possible solutions to the identified problems.
14.3.1. Problems hindering the development of power and energy in the world
The energy crisis is still experienced in different parts of the world. This is due
to the following reasons:
• Overdependence on oil and its products. Many countries rely on
petroleum and petroleum products in industrial, transport and
agricultural sectors. It therefore becomes quite difficult to switch to
other sources when there is a problem with the supply of oil.
• Economic and political embargoes fixed by the rich countries. For
example, in 1973 the oil producing countries in the Middle East
imposed oil embargo on USA because of its interference in the Israel
and Palestine war.
• Increase in oil prices imposed by the Oil Producing and Exporting
Countries (OPEC).
• Depletion of wood fuel due to overexploitation of forests.
• Exhaustion and deepening of coal mines. Coal is a non-renewable
source of energy. Its continuous use leads to the deepening of the mines
hence its exhaustion. Consequently, the cost of extraction increases
leading to high prices of coal in the world market.
• Environmental pollution: Some sources of energy like coal and
petroleum emitted Carbon dioxide in atmosphere. The increase of
carbon dioxide in atmosphere leads to ozone layer depletion and
climate change with their consequences.
14.3.2. Possible solutions for power and energy in the world
The following are the solutions to the problems of power and energy in the
world:
• Move towards renewable resources: Reduce the world’s dependence
on non-renewable resources and to improve overall conservation efforts.
• Buy energy efficient products: Replace traditional bulbs with
fluorescent tube lights CFL’s and light emitting diode (LED’s). They use
less watts of electricity and last longer.
• Energy Simulation: Energy simulation software can be used by big
corporates and corporations to redesign building unit and reduce
running business energy cost. Engineers, architects and designers
could use this design to come with most energy efficient building and
reduce carbon footprint.
• Government may come in and improve on public transport efficiency
so as to reduce the need to use personal vehicles to reduce the use of petroleum.
• On the domestic front, energy conservation can be achieved by making
electrical appliances like refrigerators, television, electric cookers
more energy efficient. This can be supplemented by switching of
electricity gadgets when not in use.
• Educating the public about the importance, the conservation and the
sustainable use of energy resources.
Application Activity 10.3
This is an extract of an interview with Wilson Karegeya, a firm’s director
for commercial services, Rwanda Energy Group held with iPAD Rwanda
Power & Infrastructure Investment Forum in Kigali.
This interview was conducted two months before splitting EWSA intoWASAC and REG. Read it carefully and answer the questions related to it.
Let’s start with an update on the reform of the energy and water
organisations in Rwanda.
Rwanda Energy Group today was still EWSA two months ago. EWSA was
the Energy, Water and Sanitation Authority, a government parastatal,
which they thought splitting the organisation would ensure more
efficiency, better and quick service delivery. So it was split two months
ago, forming two corporations: one for water, the Water and Sanitation
Corporation, headed by a Managing Director.
It was a department in EWSA and is now a standalone company and still
100% owned by government. There is also the Rwanda Energy Group
(REG), which will specifically deal with energy projects. REG also has
two subsidiaries, the Energy Development Corporation Ltd and the
Utility Corporation. The Energy Development Corporation will mainly
address generation and new investments.
What do you hope to achieve in the next 12 months?
We have now embarked on asset separation; EWSA had a lot of assets
that need to be shared between the water company and the electricity
company. There are issues of accounts and fixed assets like land and
buildings that need to be split and shared. That is what the new companies
are doing right now. We are being assisted by Price Waterhouse and
some other specialised companies to make sure the reform is done well
for better service delivery.
And we expect, of course, more specialisation for these companies. The
water company will now specialise in making sure that they deliver clean
water to the population. They will be less distracted because they will
be mainly focused on providing clean water. And the electricity company
will now not be overstretched, looking into water and electricity but
looking specifically into electricity projects, so I expect more focus for
these companies that will lead to better service delivery.
The energy projects that you will invest in, can you highlight specific
challenges and how you will overcome them?
One challenge is that we were used to government investments where
government invests in energy projects. We have now adopted an
approach to involve the private sector more in the generation phase
of it: where we identify projects that need to be developed, advertise
them, attract private investors, (IPPs) and negotiate the power purchase
agreements with them, once we agree and sign the contract, the project
is up and running. Where I see challenges is in the contract management.
It is an issue that we are not used to working with IPPs. Although you
a PPA with an independent power producer, it is more about
managing the contract from day one up to the last day of the contract. So
that is a challenge there but we hope to overcome it by training our staff
to make sure they know how to deal with IPPs, know what to expect and
when and what the IPP has to deliver. That is very important.
In terms of generation capacity in Rwanda, what is currently
available and how much are you projecting?
Currently we are at 110 megawatts capacity and we expect to generate
up to 563 megawatts by 2017. That is the target we have. There are
on-going projects that will enable us achieve this targeted megawatts
and some are nearing completion. We have also taken the direction of
using the regional interconnectors in order to share power with the
neighbouring countries. We are currently negotiating a PPA with Kenya
aiming at purchasing power from Kenya through Uganda.
Power generation goes hand in hand with other infrastructure
development such as roads; rail etc. what are the plans there?
In the transmission sector we have also started using private developers.
We recently advertised a tender to attract investors to come and do the
transmission lines and improve the networks as we expand the capacity.
Of course, there is a need to improve the network, so we are doing that
concurrently.
What is a day like in Rwanda in terms of electricity supply?
Until recently there weren’t many power outages in Rwanda. But now
industry is growing and the demand for energy is growing and we are
striving every day to increase the capacity to serve all our customers,
be it investors, industrial or domestic. Of course, you get investors who
come to us saying “I want 5 megawatts, I want 15 megawatts, I want up
to 10 megawatts”, so you have to work hard to make sure you use all the
resources available to provide such electricity.
A recent example is a new cement factory that has asked for up 15
megawatts, and we have a total capacity of 110 megawatts for the whole
country. So you can imagine how hard we have to work. The good news
is that we have secured the power the factory requires.
Who looks at tariffs and the regulation around tariffs?
It is RURA (the Rwanda Utility Regulatory Agency). But if we are
attracting investors for projects above 5MW, we negotiate a tariff. For
projects below 5 megawatts, there is a feed in tariff set by RURA. For
big projects, Rwanda Energy Group negotiates with the developer andagrees a tariff at which it will supply electricity.
What is the situation with residential access to power?
For now, the residential users are connected and satisfied. The challenge
we are facing is the new industries that are emerging. Otherwise the
domestic customers had no issues sofar. Perhaps they might have to
start competing for the insufficient power that we have – to share this
among the commercial and domestic clients that we have. But we are
working very hard to bridge the demand gap that is growing day by day.
What do you see happening in the East African region in the next five years?
My personal view is that if the current trend of cooperation among the
East African member States continues, I see success. When I look at the
engagement between member countries, sharing power, that is success.
When I see the opening of borders for trade, that is success, and opening
of borders for human capital, that is success. If this trend is maintained
I see a powerful East African Community.Extracted from: ESRI AFRICA: AFRICA’S POWER JOURNAL, Published on
Questions:
September 10, 2014
1. Account for the energy status of Rwanda and its importance to
national development.
2. Describe the problems highlighted in the interview.
3. Basing onexperience from the East African Community countries,explain the importance of power distribution.
Skills lab
They are many sources and forms of energy across the world. Evaluate anyform of energy which is successful to the sustainable development.
End unit Assessment
1. Assess your district infrastructures and suggest the potential
power and energy sources to be exploited
2. If you were the chairperson of African Union propose appropriate
strategies for sustainable power and energy development in Africa.
3. Account for the status of power and energy production in the world.
4. Basing on relevant examples or case studies, explain how energy
resources contribute to the development of some countries. What
about Rwanda in that regard?
5. Analyze the figure below and discuss the trend of the use of energyin the world and the challenges that it is likely to cause in the future.
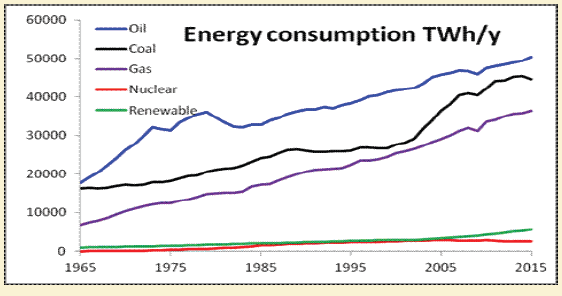
UNIT 15:INDUSTRIALIZATION IN THE WORLD
Key unit competence: The student-teachers should be able to evaluate
the success of the sustainable development
projects in the industry in different parts of theworld.
Introductory activity
Mr. Gatete is a farmer, he grows crops like coffee, cotton, bananas and fruits
and rears cows and goats. He sells both crops and animal products to Amahoro
Cooperative Society which transforms these products into Juice, Packed milk,Cheese, Clothes etc
1. According to you, in which category of industry does Mr. Gatete belong to?
2. Explain the factors on which Amahoro Cooperative Society base on to
establish the factory which transforms Gatete’s products and the problems
that may be associated with the factory.
3. Make research on internet / geographical documents and find out five
examples of more industrialized countries in the world and describe thefactors for their industrial development.
15.1. Definition, classification of industries, factors influencing
location of industries and major industrial regions of the world
Learning activity 15.1
Use experience from your local environment and answer the following questions:
1. Identify the categories of industries observed.2. Describe the factors that influenced their location.
15.1.1. Definition of industry
An industry is an establishment that involves production of goods and offering
of services. It also refers to the processing of raw materials into finished goods.
Industrialization refers to the concentration or to the development of
industries in an area, country or region.
15.1.2. Classification of industries
There are three categories of industries which are closely interrelated.
(i) Primary/ Extractive industries
These are industries which produce raw materials. They are concerned with
the extraction of natural resources. They involve agriculture, forestry, mining
and fishing.
(ii) Secondary/ Manufacturing industries
These are industries that transform raw materials into finished products
suitable for consumption. They include food, beverages, chemical products, etc.
They are subdivided into two categories:
• Heavy industries: Such as engineering, metal goods, chemical, ship
building industries, etc.
• Light industries: Such as food processing, plastics, textiles, electrical
equipment, cosmetics and toilet articles etc.
(iii) The tertiary/ Service industries
These are industries involved in the provision of services. The tertiary industries
do not produce goods but provide backup services to the industrial sector. The
services provided include transport and communication, trade and commerce,
financial insurance, printing and publishing, education, health, banking, etc.
15.1.3. Factors influencing the location of industries and industrial
development
There are several factors that influence the location of industries and which
contribute to industrial development. They are briefly described in the following
paragraphs:
• Efficient labor force: An adequate or skilled labor force is essential
in the initiation and continuance of an industry. It gives the company amaximum output with lowest possible costs.
• Power and energy: Any industrial establishment must be located in
the areas with enough fuel or other sources of energy.
• Land: The location of any industry requires extensive land for set up
and future extension.
• Government policy: Government’s policies which encourage
industrial development and job creation are also an important factor.
This can be done through tax reduction, provision of land to investors
to establish industries and availability of energy in the area.
• Raw materials: various types and availability of local raw materials are
important in the location of industries. The availability, affordability,
size, quantity, quality and weight of the raw materials among others
are essential requirements for industrial location.
• Transport and communication: Modern industries require constant
supplies of raw materials, often in great bulk from various sources.
Finished goods have to be distributed to many places as well. Thus
the availability of a good network of transport facilities is another
important factor in the location of industries.
• Market: There is a very strong justification for industries to be located
near the markets which consume their finished products. Some types
of industries are more likely to be located near markets than others;
e.g. perishable goods, fragile goods, bulky goods etc.
• Capital: No industry can be developed unless it has financial support.
Many for purchasing the land and machines, constructing factories,
acquisition of the required raw materials, and transportation of both
raw materials and finished goods and for the payment of workers, or
in every phase of industrial development need to be available.
• Water supply: Certain industries, especially iron and steel, aluminum
smelting, thermal power generation, pulping of timber, synthetic fibre
manufacture and chemicals, consume enormous quantities of water
either in processing the raw materials or for cooling purposes.
• Industrial inertia: This is when an industry remains in its original
location even if the initial advantage that led to its location is no longer
available. This is due to three main factors:
The presence of a good transportation network of roads, railways,
canals and so on. An industry moving to a new site might face
transportation difficulties.
─ Influence of skilled labor and experienced workers built up in
that area.
─ The cost of building and equipping a factory is extremely high.
Industrial establishments do not readily undertake a complete
move with the new building and tooling-up costs that this entails.
• Sites: Some industrial plants have to be sited on leveled ground instead
of hilly regions. Others require vast acreage of land and the cheapness
of the available land is a primary consideration.
• Climate: Climatic factors sometimes have to be taken into account
especially in countries with extremes of climate. Costs of heating, air
conditioning factories or offices may be prohibitive. Hot climate may
create problems of storage. Climatic factors such as severe winters or
annual floods may affect transportation adversely.
• Political stability: encourages long term investment necessary for
industrial development. This is why countries with little political
instability like Western Europe are advanced in industrial developmentthan developing countries of Africa and Asia.
Application Activity 15.1
1. Describe the categories of industries common in Rwanda.
2. Identify two industries of Rwanda and describe the factors that ledto their location.
15.2. Major industrial regions in the world
Activity 15.2
1. Make research and identify the major world industrial regions.
2. Explain the factors that are responsible for the location of industries
in USA, RUSSIA, China, Egypt and South Africa.
There are major industrial areas in both developed and developing countries.
USA, and Russia are the example of industrialized countries in developedcountries, Egypt, South Africa, China in developing countries.
15.2.1. Major industrial regions in developed countries
A. Industrialization in USA
i. Factors for the high level of industrialization in USA
USA is the world’s leading industrial nation. About four-fifth of the industrial
output of North America is contributed by the United States alone. The factors,
which helped in the industrial development of USA, are:
• A wide range of raw materials such as agricultural raw materials and
mineral raw materials.
• The population of USA was made up of immigrant from many advanced
European countries especially from U.K, France, Germany, Holland and
others. These immigrants brought with them the experience skills and
technical knowhow of their mother countries. This encouraged rapid
industrial development.
• USA is located on the opposite side of Atlantic from Europe. This
has stimulated trade and growing world markets. It has also led to
industrial expansion.
• USA has extended water transport from St. Lawrence Seaway to
the heart of the continent via the Great Lakes. This has stimulated
industrial development by providing cheap means of transport for raw
materials and finished goods.
• USA has a high level of technology. This has been maintained by
adequate educational and training facilities and a technological
system. This system attracts skilled scientists and technologists. This
brain drain helps to give the USA a lead in scientific modern industries
such as electronics computers and so on.
• USA has abundant petroleum, natural gas, local and hydro-electric
power. The availability of various sources of power in economic
quantities has stimulated the development of large manufacturing industries.
• Availability of capital generated from international trade (from
exports) encouraged industrialization.
• The government of USA also encourages rapid industrialization. It
encourages export promotion.
• There is internal competition among the industries and this has
stimulated industrial development.• Availability of extensive land for industrial development.
ii. Industrial regions of USA
There are six industrial regions in USA:
1. Southern New England: It is centered in Boston with two types of
industries; shipbuilding and textile,
2. Mid-Atlantic States: This region includes cities of New York, Philadelphia
and Baltimore. The industries here include iron and steel, engineering,
printing, electrical goods, foot wear and consumer goods.
3. Pittsburgh – Lake Erie region: this is the core of heavy industries,
engineering, glass, pottery, chemicals, synthetic, rubber, tyre making,
generating hydroelectric power from Niagara Falls, flour milling etc.
4. Detroit industrial region: this is the greatest automobile manufacturing
region of the USA. Other industries include electrical wires, glass,
batteries, paints, alloyed steel etc…
5. South Appalachian region: It is centered in Birmingham. Industries
include steel making, Hydro Electric Power generation, cotton textiles,
metal works, machinery manufacture etc.
6. Eastern Texas: It has major cities like Dallas, Fort Worth and Houston.This region is the major USA source of oil and gas.
B. Industrialization in Russia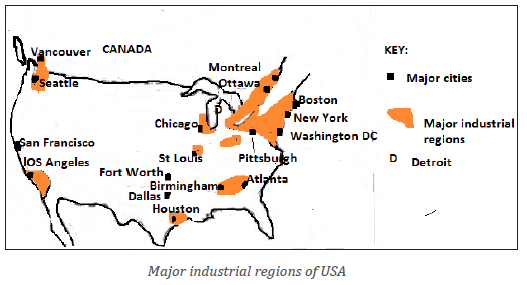
i. Factors for high level of industrialization in Russia
• Presence of a variety of minerals such as Iron, copper, gold, diamond, coal etc.
• Improved transport network of railways, aircrafts and developed road network.
• Existence of agricultural raw materials such as cotton for textiles, milk
for dairies, hides and skins for leather and footwear industries.
• Availability of capital from financial institutions to promote industrial
development.
• Improved research to develop cheap and highly efficient methods of
production. This has led to technology and industrial development.
• Government policy of promoting self-sufficiency in most of the
manufactured goods consumed in the country.
• Attraction of foreign investors from Europe, Japan and USA has greatly
contributed to industrial development.
• Presence of a large population which provide a large domestic market
and cheap labor force.
• Skilled labor in form of electrical, mechanical, chemical engineers,
laboratory assistance.
ii. Industrial regions of RUSSIA
The Russian industries are concentrated in the four major areas:
1. The Moscow – Gorki region: this region has diverse industries including
heavy engineering, steel industries, railways, equipment, automobiles,
aircraft and food processing.
2. The Ukraine industrial region: This region has developed during the
period of USSR (Union of Soviet Socialist Republics) the main industries
are iron and steel, making machinery, chemicals, etc.
3. The Urals industrial region: engineering (heavy) and metallurgical
industries dominate all other activities,
4. The Kuzbas region: This area has large thermal plants, extensive coal
deposits, engineering, hydro-electric power plants, metallurgical plants,chemicals including petrochemicals.
15.2.2. Major industrial regions in developing countries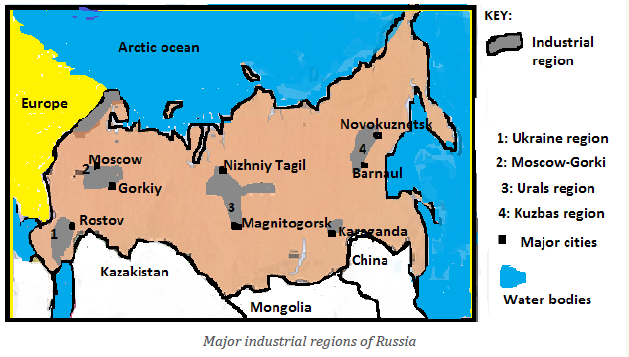
(i) Industrial development in China
Industrial development in China began after the beginning of Communist rule
in 1949, and now China is an art industrial power of Asia and of the world.
There has been a complete transformation of the industrial system during the
last 60 years.
Under the new system and policy, China is developing its industrial system
in a planned manner. Rapid development has made China a leading producer
of iron and steel, textiles, and cheap consumer goods such as toys, household
goods and light metal goods.
a. Factors for industrial development in China
Large quantities of natural resources: They constitute the raw materials for
industries such as coal, copper, zinc, lead, and manganese. This has given rise
to industries dealing in copper processing, steel products, electrical equipment etc.
Deposits of coal and petroleum: They act as a source of energy for the
industries. Coal is the single most important energy source.
Large population: With over 1.3 billion people, China has large domestic
market for its industrial goods. Chinese manufactured goods have a readymarket even in other countries like USA, Japan, UK, and the European Union.
Location of China: On the Asian main land and the most populated continent
provides the market for manufactured goods, the promotion of trade and
procurement of raw materials.
Government policies: Communist system has great influence on the
development of industries where each commune was encouraged to have its
own industries.
Education: Chinese system provides the basic skills on practical knowledge
required in industries and workshops.
Cheap labor force: With a large population, China has a big labor force which is
cheap, skilled and unskilled. China has a largest labor force in the whole world.
Transport and communication systems: Aircraft is developed to communicate
with the entire world and railway transport is improved for acquisition of
raw materials and distribution of manufactured goods. Also the country has
navigable inland water ways but has been improved by construction of canals.
b. Industrial regions of China
• Manchurian Industrial Region: This is the most important industrial
area of China with centers at Anshan (steel industry), Penki (steel
industry), Fushun (coal, lubricating oil, and chemicals), Mukden or
Shenyang (machinery and tools) and Dairen (mills and shipyards). All
of them are nearby coal and iron ore deposits.
• Tientsin and Beijing Region: This is a second industrial area located
at the northern end of the North China Plain, near the Kailan coal
reserves, with Tientsin, Peking or Beijing and Tangshan as its main
centers. The presence of coal-fields in Shansi and Hopei has contributed
to the rise of the metallurgical and engineering industries here.
• Lower Yangtze Industrial Region: This is China’s oldest industrial
region. It existed since the middle of 19th century. Shanghai is the
main industrial town and port of this industrial region. The main
goods produced are cotton, silk, textile, food, leather, radio, television
sets, utensils, leather, etc.
• The Middle Yangtze Industrial Region: It is located on the middle
Yangtze plain around the former tree towns of Hankow-Hanyang-
Wuhan. There iron and steel works there that are based on Peninsiang
coal and Tayeh iron ore. Shipbuilding, metallurgical and heavy
industries, railway equipment and chemicals are important items ofproduction.
• Sichuan (Szechwan) Industrial Region: Sichuan (Szechwan) province
above the Chang Jian (Yangtze Kiang) gorge has many important
industries around Chongqing (Chungking) and Chengdu (Chengtu).
The rich deposits of coal, iron, Ferro-alloys and abundant agricultural
raw materials have all encouraged industrial development. Iron and
steel, textiles, paper and pulp, machinery, cement, and chemicals are
made here.
• Si Kiang Delta Region: The port of Canton is the main industrial centre
at the mouth of the Xi Jiang (Si Kiang). Canton lacks local raw materials
and once was known largely for commerce. Modern industries are
centered on silk production; there are silk mills, jute and cotton goods
are manufactured, rubber is processed, and there are food-canning
and match factories. Iron works and machine factories occupy sites
near the docks.
In China, many cities are considered to be the industrial cities. Some towns
such as Anning, Kiuchuan (iron and steel); Yumen and Hangzhou or Hangchow
(oil refining); Lanzhou or Lanchow (chemicals, textiles, mining equipment) andKunming (chemicals, machinery,textiles) have industrial development.
(ii) Industrial development in Egypt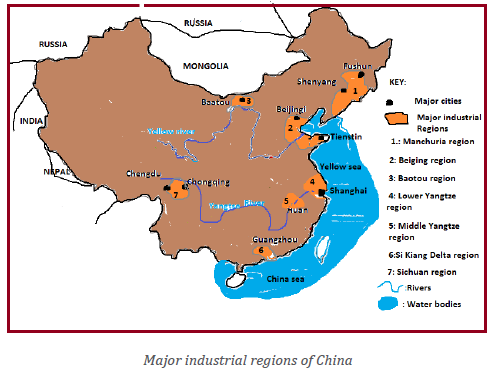
In the 1920’s, the Egyptian economy was characterized an agricultural economy.
Three quarters of the Egyptian exports was raw cotton. As a result, industrial
output was mainly cotton spinning and weaving, followed by preserved food,cigarettes, soap and handcrafts.
a. Factors for industrial development in Egypt
Factors for industrial development in Egypt include:
─ Availability of raw materials: Egypt has agricultural raw materials
to feed the industries like cotton for textile and sugar for agro-based
industries.
─ Availability of minerals: Egypt has various mineral resources such
as oil, Iron, Zinc, Copper, Lead, phosphate that lead to the development
of industries.
─ Availability of power and energy: Egypt has the cheapest source of
fuel (HEP) due to Aswan High Dam which allowed the connection of
most Egyptian villages to use electricity.
─ Internal market: Egypt as one of the most densely populated countries
in Africa, its population is the ready market for manufactured goods.
─ Availability of water: Despite that Egypt is a desert country; it has
high strategies to use available water from the Nile River. Water is
used as a raw material in food processing, construction, cooling
machines and other industrial activities.
─ Improved transport: Water, canals, roads, and railway, provide the
cheapest water transport cost of raw materials and finished goods.
─ Relief: The gentle relief of Egypt enables the construction of
industries and transport routes which facilitate the development of
industries.
─ Government policy: The government is currently adopting an
industrial policy that entails large-scale privatization of state owned
enterprises as well as the gradual removal of subsidies and price
controls in the remaining public sector companies.
b. Major industrial regions of Egypt
• Cairo: It is the industrial centre of Egypt with textile industries, food
processing, motor vehicle assembling and chemical industries. There
are also Iron and steel industries located at Hulwan near Cairo city.
• Alexandria: It is the main industrial centre in Egypt as well as the
country’s largest sea port. It has agricultural, textile and chemical industries etc.
• Helwan industrial area: It is found on the bank of river Nile with
several industries mainly the agricultural industries, sugar, gases andsteel industries.
(iii) Industrial development in South Africa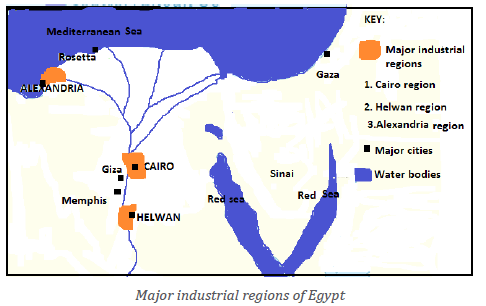
South Africa is the most industrialized country in Africa. Today South Africa
exports a large amount from manufacturing sector. Two thirds of South Africa’s
national outputs are derived from manufacturing industries.
a. Factors for industrial development in South Africa
• Large quantity of mineral resources: South Africa is endowed with
a wide range of mineral resources which constitute raw materials
for industries. The exploitation of minerals has stimulated industrial
development.
• Presence of energy: The most important of this is coal. There are also
numerous rivers, which produce hydro-electric power. Such rivers
include orange, the Transvaal River and others.
• Climate: Ranging from the temperate climate, Mediterranean, desert
and tropical climate. The variety of climate contributes to a wide
range of agricultural products, which form the raw materials for many
industries.
• Forest resources: contribute to the development of sawmills, furniture
making and manufacture of paper industries.
• Fish resources: South Africa has one of the most developed fishing
industries on the Africa continent. This has given rise to fish canning,
freezing, fishmeal and fertilizers industries.
• Labour: Abundant labor supply.
• Market: Large market for its finished manufactured products.
• Capital: Enough capital to invest in Industries.
• Transport and communication: Good transport and communication
networks.
• Government policy: Encouragement from the government.
• Land: Availability of land for industrial location and extension.
b. Major industrial regions of South Africa
• Johannesburg: The main industries found here are textile industries,
chemical industries, paper and printing, engineering, electrical
equipment, saw milling etc.
• Springs: The major industries in this town include manufacturing
of mining machinery, electric goods, printing machinery, sheet glass,
paper and food canning industries.
• Durban: Industries in this region include ship repairing, oil refining,
soap manufacture, textile, light engineering etc.
• Cape Town: It has food processing, textile, chemical, paper and
printing etc.
• Pretoria: industrial establishment include glass, cement, metal
working, manufacturing railway wagons etc.
• Eastern Cape Industrial Zone: Is formed by East London and Port
Elizabeth. It is the important port for international trade. It produces
building material, soft drinks, furniture, clothes, local agriculturalproducts etc.
Application Activity 15.2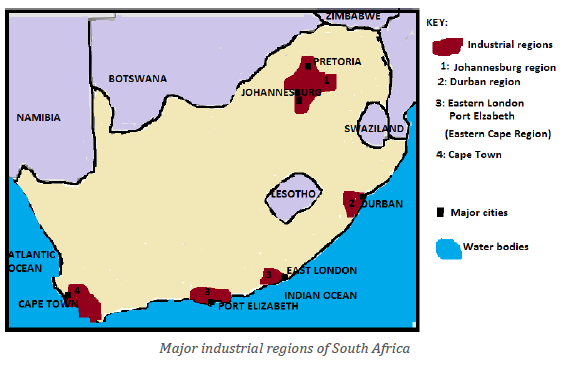
1. Explain how the following factors have contributed to the
development of industry in RUSSIA
i) High level of technology
ii) Improved transport
iii) A wide range of raw materials.
2. Explain the factors that have contributed to the development of
industries in the following countries:
i) China
ii) Egyptiii) South Africa
15.3. Importance of industries and problems affecting industrial development
Activity 15.3
According to you, why is it important for a country to have industries?
15.3.1. Importance of industries
Industries have the following advantages:
• Industries provide self-sufficiency in essential goods rather than the
need for imports and dependency on foreign aid. In other words, it
causes import substitution and export promotion, which encourages
development.
• Self-sufficiency gives greater political and economic strength. It
makes a country more independent of foreign political or economic
domination.
• It creates employment. It employs both skilled and unskilled labor.
• Industrialization earns the country foreign exchange. If the products
are manufactured for export, the value of the commodities is increased
and so the revenue obtained from their sale also increases.
• Industrialization raises living standards of the population as they
contribute to increase their income.
• It contributes to the diversification of the economy and reduces
reliance on agricultural products which may fluctuate in prices.
• Industrial growth is cumulative and can stimulate growth in other
sectors of the economy.
• It provides infrastructure particularly electricity, transport and
communication.
• Industries also improve social amenities like schools and hospitals.
• It contributes to the development of research and technology and the
regular training of skilled man power.
15.3.2. Problems affecting industrial development
There are several problems that affect many industries. Below are the main and
common ones:
• Inaccessibility to the distant world markets which results into low
demand for the manufactured goods especially in landlocked countries.
• Lack of real capital investment. Many countries have a problem of
inadequate funds to set up industries.
• Shortage of unskilled, semi-skilled and skilled labor. Inadequate
managerial and entrepreneurship skills have also affected industrial growth.
• Lack of adequate supporting infrastructure. This is critical for the
development of industrial activity.
• Developed countries face the twin challenges of reduced demand and
increased unemployment levels in older industries as well as finding
new market for their industrial output.
• Competition for markets has led to blocks of countries grouping to
reduce trade barriers and to increase integration of supply and demand.
Such trade agreements allow individual countries to take advantage
of agglomeration economies and cheap labor among themselves.
However, for countries outside the trading block, they act as barriers
to trade and tariffs.
• The infrastructural facilities in the developing countries are not at the
level necessary to produce and support industrialization.
• The shortage of valuable minerals in some countries, such as iron ore
which form a basis for the establishment of industries. These countries
have to import raw materials at high costs.
• In developing countries, poverty lead to a low demand for industrial
goods resulting into a limited market, thus affecting the process of
industrialization.
Application Activity 15.3
1. Explain why the industries in developed countries are highly
developed than the ones in developing countries.
2. Explain the importance of industry in RUSSIA, China and Egypt.
15.4. Problems resulting from industrial development and
ways to mitigate them
Activity 15.4
Why is it not advisable to live near industrial areas?
Industrial development has both positive and negative effects on a given country.
• Pollution of the environment: In the areas of heavy industrial
concentration, land, air and water are contaminated by industrial wastes.
• Wildlife extinction: Industrial pollution affects habitats of wildlife
and destroys its species; it is hard to recover them in the environment.
For instance, major industrial accidents like oil spills, fires, leak of
radioactive materials cause great damages.
• Global warming: With the rise in industrial pollution, global warming
has been increasing at a steady pace. Smoke and greenhouse gases are
being released by industries into the air and this contributes to global
warming. Melting of glaciers, existence of floods, tsunamis, hurricanes
are some of the effects of global warming.
• The accidents caused by the machines used in industries: The
machines used in industries for various purposes may cause the
accidents from the misuses by the employees or from other external
causes; e.g. Lightening, tsunami, electricity, collapses of mining tunnels, etc.
• Leaching of resources from the environment: Industries do require
large amount of raw materials to process into finished products. This
requires extraction of minerals from beneath the earth. The extracted
minerals can cause the environment destruction in different ways.
Ways to mitigate the problems caused by industries
• Isolation of industries from settlements and sources of water to reduce
the effects of pollution.
• Reducing of greenhouse effects through neutralizing industrial fumes
before they are disposed into either air or water.
• Efforts should be made to control pollution. These can take the form
of industries treating their wastes before disposing them as well as
recycling some of those waste products and the use of biodegradable materials.
• Promotion of training skilled manpower and use of appropriate
technology to reduce accidents in industries.
• Creation of special areas/ zones where industrial wastes are channeled or poured.
Application Activity 15.4
1. Analyse the problems resulting from industrialization in USA.
2. Examine the ways of reducing problems caused by industries in
developing countries.
15.5. Case studies
(i) Developed Countries and Developing Countries
Activity 15.5
1. Draw a sketch map of Japan and South Korea and on it, indicate
the major industrial regions.
2. 2. Examine the factors that lead to the development of industry in
developed and developing countries.
a. Developed countries: Japan
i. Factors for high level of industrialization in Japan
Japan is the most highly industrialized country of Asia and ranks among the main
industrial nations of the world. Despite its shortage of industrial raw materials,
Japan has been able to develop her industries because of the following reasons:
• Development of hydro – electric power resources to provide enough
power to support rapid industrial development because of little
quantity of coal.
• Efficient use of its limited raw materials such as copper, manganese,
iron ore, sulphur and timber.
• The coastline and many large ports facilitate the importation of large
quantities of raw materials from all over the world. This is because of
the geographical location of Japan.
• The population that provides a large supply of labor and the
development of industries since it has small land for agriculture.
• The government that encourages industrial development. It has
formulated a technically based education system. This has improved
the country’s technological development.
• A high and expanding market potential. It is located near Asian
countries which are mainly agricultural dependent. These provide
market for Japanese goods.
• Aid from USA: after the Second World War, Japanese industrial
establishments were destroyed. It got financial assistance from rich
countries specifically the USA. These loans were used to replace and
rebuild the ruined industries.
• Advanced technology: Japan adapted latest techniques from Western
industries and have been able to improve upon them.
• Improved transport network: water transport, modern ports were
build, roads and railways were improved.
ii. The Major industrial regions of Japan
Japan is the most industrialized country in Asia and ranks among the industrial
nations of the world. There are four main industrial zones in Japan:
• The Keihin Region: This is the most industrial region in Japan
located on the Kwanto plain to the East of HONSHU. It is formed by
the conurbation of three important towns; Tokyo, Kawasaki, and
Yokohama. This region has 20 % of the Japan’s population and account
for 33 % of the country’s output.
The major industries found in this region are Chemicals, machinery,
textiles, food processing, furniture.
• The Hanshin Region: this stretches across a great industrial
conurbation of three major cities formed by Osaka, Kobe and Kyoto.
It accounts for about 20 % of Japan’s industrial output. It is important
for the manufacture of textile, iron, and steel products, handcrafts, andshipbuilding.
• The Ise Bay Region: this is the third industrial region dominated
by NAGOYA industrial Region on the Nobi Plain with a wide range of
manufacturing industries including textile mills that process local
silk, imported cotton , wood and also synthetic fibres ; engineering
industries including all kinds of machinery , automobiles ,locomotives
and aircraft .
• The Kitakyushu Region: in the northern Kyushu area, the Chikugo
coalfield and good accessibility gave rise to a conurbation, called
Kitakyushu. This one, embraces several towns, including Yawata,
Kokura and Moji. The industrial area extends southwards to Fukuoka
and Nagasaki. It makes steel, ships, machine parts, chemicals andtextiles.
ii) Developing countries: South Korea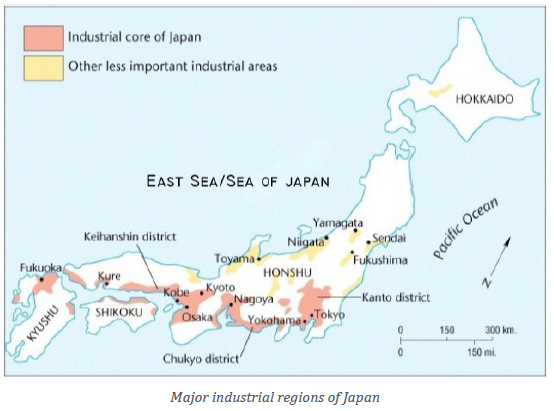
a. Industrial development in South Korea
South Korea is located in Eastern Asia between the Yellow sea and the East sea/
Sea of Japan.
i) Factors for industrial growth in south Korea
Highly skilled labor force: The education system provides basic skills required
in industries and workshops. There is highly trained labor force in managerialand marketing which help the country to compete with other countries.
High technology: In industries, microelectronics and computers which keep in
touch with scientific advancement.
Government support: Policies aiming at export-oriented industries, rather
than to supply the local market.
Agricultural development: The country is self-sufficient in rice growing with
large schemes of irrigated land this has made the rural economy more efficient.
Many business people: Companies or businessmen from Europe, USA, Japan
who had the capital and skills to build industries have been attracted by low
wage rates in South Korea.
Infrastructural development: Well developed transport and communication
network which makes the exportation of goods very easy.
Research: This is highly emphasized especially in electronic industry, so as to
improve all the existing products and develop new products to meet the market
demands.
ii) Major industrial regions of South Korea
• The major industrial regions of South Korea are: Seoul, Yeosu, Chongju,
Gwangju, Masan (Changwon), Ulsan, Pohang, Taejon, Busan, Yongdimpo.
• Industries the most developed in these regions are Iron and steel,
petrochemicals, ship building, agricultural equipment, machinery,electronics, textiles and light industries.
Application Activity 15.5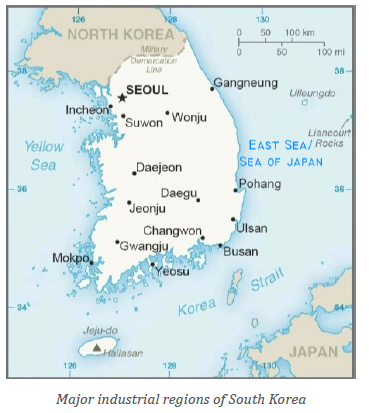
1. Discuss how human factors have influenced the growth of industries
in South Korea and Japan.
2. Assess the factors that are responsible for the development ofindustries in Japan and South Korea
Skills lab:
Industrialization is one way of developing the country. Carry out a field visit in
your local community, and propose the type of industry that can be establishing
in your local area.
End unit Assessment
Make a field trip in any industrialized area around and answer the
following questions:
1. Discuss the physical and human factors that have influenced the
location of industries in this area.
2. Describe how industrialization contributes to sustainable
development.
3. Analyse the ways of improving the level of industrialization indeveloping countries.
UNIT 16 :TRANSPORT AND COMMUNICATION IN THE WORLD
Key unit competence: The student-teachers should be able to analyze the
impact of transport and communication projects
on the sustainable development of different
countries in the world.
Introductory activity
Read the passage below and answer the following questions.
In Eastern province of Rwanda there is a high production of banana. Mr.
Gatabazi imported a lorry to help the people to carry their harvests to the
market instead of using their heads. Gatabazi extended his businesses and
became a businessman in the city of Kigali. He started to import his products
from China. Sometimes he goes there to purchase goods or calls his partners
using his mobile phone, then orders his goods, and pays using his BK Visa card,
and finally gets his goods without moving from Rwanda to China.
1. What types of transport mentioned are above?
2. Explain the economic importance of the transport that Gatabazi introduced in that area.
3. Describe the types of transport that he uses to import goods from China.
4. What form of communication that he uses to get his products?5. Mention other types of communication he can use to order for his goods.
16.1. Transport
Activity 16.1
1. Observe the above photographs and identify the types of transport shown.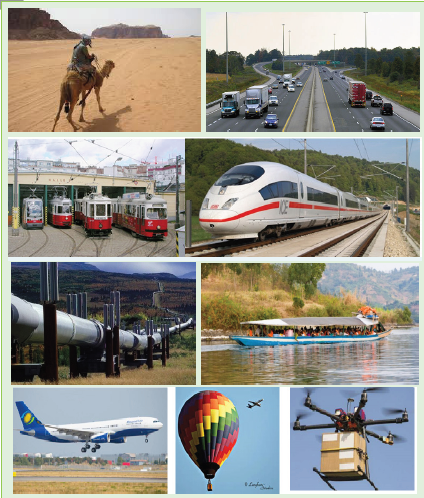
2. Which type of transport is common in your area and why?
This unit is about transport and communication. Transport is the medium
to carry people goods from one place to another. It includes roadways, water
transport, airways etc. Communication is a process of expressing one’s idea
thought between two or more people. It includes direct talk, radio, television,
internet, telephone, WhatsApp, etc.
16.1.1. Meaning and types of transport
(i) Meaning of transport
The term transport refers to the movement of passengers and goods from one
place to another. All means of transport need places where journeys start and
end. These are called terminals.
Terminals for land transport are called Bus station or Train station. Those for
air transport are Airports while terminals for water transport are called ports.
(ii) Types of transport
There are three main types of transport as described below with their
advantages and disadvantages:
─ Land transport which includes human portage, water transport,
animal transport, road transport, railway transport and pipeline
transport.
─ Water transport.
─ Air transport.
i. Land transport
Land transport is the type of transport that takes place on land. It can be
subdivided into: Human portage, Animal transport, Road transport, Railway
transport and Pipeline transport.
a. Human portage
This is when people carry their load on their heads, on their backs or in theirhands. It is the most used transport by most people in various parts of the world.
Advantages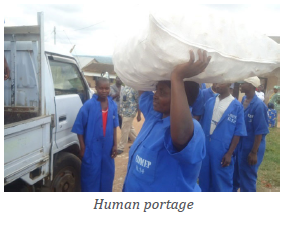
─ It helps in inaccessible areas.
─ It is cheap compared to other forms of transport.
Disadvantages
─ It is very slow compared to other forms of transport.
─ It requires a lot of human energy and it is time consuming.
b. Animal transport
This form of transport is commonly used in areas where it is not easy to develop
other means of transport especially in arid (desert) areas. Animals used include:Camels, cows, Horses, Donkeys etc.
Advantages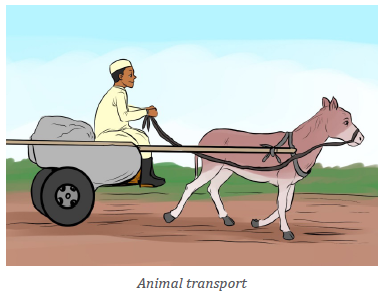
─ It is used in wild areas where other means are not possible.
─ It is quicker than the human portage.
─ It is suitable in areas where human labour is limited.
Disadvantages
─ It is slow compared to road transport.
─ Some animals cannot move in hilly areas.
─ Some animals cannot withstand certain climatic conditions.
c. Road transport
This involves the movement of goods and passengers mainly by vehicles,bicycles and motorcycles.
Advantages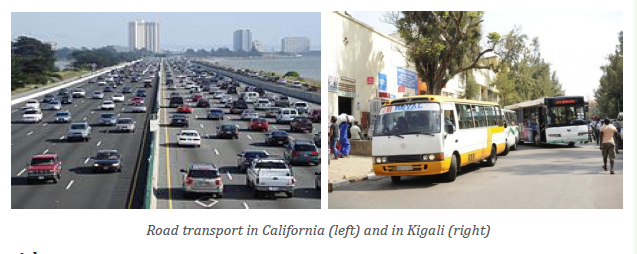
─ Roads can be constructed in areas which are accessible to other
forms of transport.
─ Because of being flexible goods can be sold on route or can be
delivered any time.
─ It is cheaper and faster for short distances.
─ In some cases, it does not require large capital, except road
construction.
─ It is easier for people to own and purchase vehicles, bicycles and
motor cycles than airplanes, motor boats and ships.
─ It provides door to door services.
Disadvantages
─ Heavy loaded Lorries are too slow.
─ Weather conditions affect road transport especially during rainy
season.
─ There are expensive to construct and maintain especially in towns.
── Roads are affected by congestion and traffic jams in heavily populated
urban areas.
─ Unsuitable for heavy and bulky goods compared to water transport
─ Vehicles at times run empty because of not having a scheduled
timetable.
d. Railway transport
This involves the carrying of passengers and goods by train or tram alongdesignated routes.
Advantages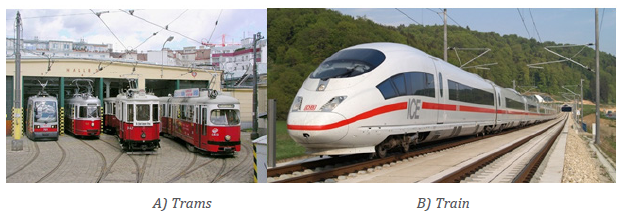
─ It is cheaper for transporting bulky goods.
─ It is less affected by weather conditions.
─ It uses known routes and known timetable.
─ It carries more loads and a big number of people.
─ It is safe since the chance of accidents or breakdowns are minimal.
Disadvantages
─ The use of railway lines does not allow trains to reach remote areas.
─ It is very expensive for short distances.
─ It is not suitable for carrying perishable commodities.
─ It is time consuming/ slow.
─ It is costly in terms of maintenance. Currently trams are being
replaced by buses in modern cities.
e. Pipeline transport
This involves the movement of liquids and gases through a pipe from one point to another.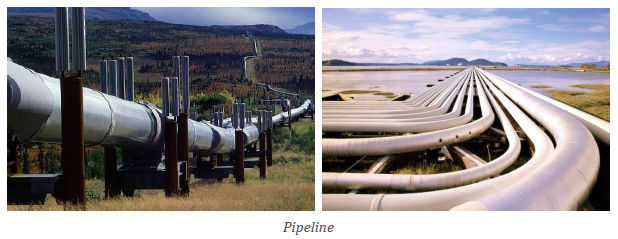
Advantages
─ It is cheap and easy to maintain.
─ It is relatively fast.
─ It can be used to transport large quantities of liquids at a single time.
─ It is not affected by weather conditions.
─ It does not pollute the environment.
─ It is free from traffic congestions.
─ It is convenient in transporting highly inflammable commodities
such as petroleum.
Disadvantages
─ It cannot be used to transport other commodities, apart from gas and liquid only.
─ It may be damaged leading to heavy losses.
─ It does not provide door to door services.
─ It is expensive to construct.
ii. Water transport
This is the movement of goods and passengers on water by use of ships, ferries,canoes and boats. It involves both in-land and marine water ways.
Advantages of water transport.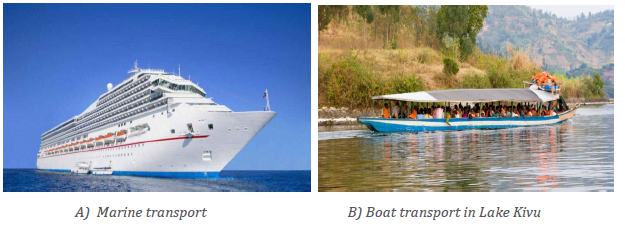
─ It does not require any route construction.
─ It is the cheapest for bulky goods.
── Bulky commodities can be transported over a long distance.
── It experiences less traffic congestion compared to road transport.── It is suitable for carrying fragile goods because there is no shaking.
Disadvantages of water transport.
─ Construction of sea port is too expensive to be afforded by most
countries.
─ It is used by areas with navigable water bodies i.e. limited in use by
landlocked countries.
─ It can be affected by sea pirates.
─ It is very slow in movement compared to air and road transport.
─ Obstacles on rivers such as rapids, waterfalls, floating vegetation,
sand bars, aquatic animals, make them un navigable hence affecting
movement of water going vessels.
─ Canals are affected by seasonal changes.
─ Storms and winds sometimes interfere with the ship schedule.
iii. Air transport
This is the form of transport that uses flying objects in the air such as airplanes,drones and balloons.
Advantages of air transport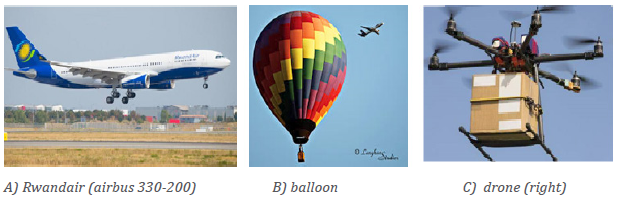
─ It is the fastest and most comfortable method of transport.
─ It is suitable for transporting perishable commodities.
─ It is suitable for carrying urgently needed goods.
─ It can go to any place with an airport.
─ It is secure, not subjected to robbers.
─ It is less affected by relief features.
─ It does not need any route construction compared to road and railway
transport.─ Its time saving since it follows a specific time schedule.
Disadvantages of air transport
─ It causes air and noise pollution.
─ It has limited storage space.
─ Usually weather conditions such as fog interfere with its schedule.
─ It is very expensive in terms of movement costs.
─ Long time is taken in air traffic control at airfields. e.g. checking and booking.
─ It requires large capital in airport construction and aircraft purchase.
─ It requires highly skilled man power to operate.─ It is a target for terrorist attacks.
Application Activity 16.1
1. Explain why land transport is the most used type of transport in
Rwanda compared to air and water transport.
2. Describe the challenges associated with road transport.
16.1.2. Factors influencing the development of transport and importance of transport
Activity 16.2
1. Rwandair is improving its business worldwide. Explain the importance
of that improvement?
2. Make research and analyze the physical and human factors that influence
the development of transport in your district.
(i) Factors influencing the development of transport
The factors affecting transport are physical, political and socio- economic. They
are discussed below:
• Relief: Steep slopes make the construction of roads and railway lines
expensive. On the other hand, valleys have swamps, which contain
water logged soils that are too soft to allow heavy objects like trailers,
Lorries and trains to move on them.
• Climate: Too much rainfall results into floods and landslides, hinderingtransport on the ground. On the other hand, accumulation of fog and
clouds reduce visibility hence affecting transport.
• Vegetation: Thick vegetation cover makes construction of road
and rail networks difficult because it requires uprooting big trunks
of trees. Furthermore, thick vegetation modifies climate through
evapotranspiration hence affecting air transport.
• Capital: The construction of roads, railway lines and airports is
expensive. At the same time, a lot of money is required to buy ships,
trucks as well as airplanes.
• Political instabilities: Wars lead to massive destruction of transport
means and infrastructure such as roads, wagons, airports and ports,
making transport extremely difficult.
• International restrictions based on international boundaries:
These affect transport in that they restrict amount of freight. The same
applies to road transport.
• Economic factor: The structure and nature of transport costs are
examined, together with service quality and methods of pricing and
charging.
• Government policy: Supportive government programs towards the
investments in transport and regulation of transport prices lead to
development of transport.
(ii) Importance of transport to the development of countries
Efficient transport is an important factor for economic development on both
global and national scales. It can be a boost or a barrier to economic growth.
Transports can contribute to economic development in the following ways:
• Transport promotes trade and industrialization through the
transportation of necessary raw materials to factory for production of
goods and finished goods to consumers
• Transport systems offer employment opportunities to many people.
• Transport promotes urban development as many urban centers have
developed where transport networks converge.
• Promotion of international relations since transport brings leaders
together for face-to-face talks.
• Promotion of tourism industry, tourists move by use of means of
transport.
• Stimulation of the development of other sectors such as, agriculture,
fishing and mining.
• Transport increases revenue through taxes to the government andincome to local transporters.
Application Activity 16.2
Visit the nearest taxi park and note what you observe in terms of economicimpact of the transport
16.1.3. Problems/challenges affecting transport
Activity 16.3
Analyse the photograph below taken in Nyabugogo and explain thephenomena that occurred in relation to the problems affecting transport.
(i) Problems/challenges affecting transport
These are major problems affecting transport activities:
• Inadequate capital: Transport requires enough capital investment.
That is why it becomes difficult for developing countries that have
weak economies to construct and maintain transport facilities such as
roads, airports, ports, and railway lines.
• Natural barriers: Hostile environment such as deserts, forests, rugged
and mountainous terrain hinders the establishment of transport facilities.
• Political instability: Some countries have undergone periods of
political instability. With long periods of fighting in these countries,
transport facilities were targeted for destruction while new lines were
not established.
• Climate: Heavy rainfall and floods make roads muddy and slippery.
Bad climate disturb air transport also.
• Mass wasting like landslides and mudflows affect roads in mountain
areas and block roads for some times.
• Low technology causes over dependence on imported expertise and
technology which are expensive. This is associated with limitedness of
skilled man power to construct infrastructure.
• Presence of water falls and rapids along river courses and their
tributaries make water transport difficult.
(ii) Ways of improving transport
• Ensuring political stability and avoid wars that destroy transport facilities.
• Containerization of the ports and harbors for effective handling of
goods and reduce delays.
• Government policies. Governments have to develop and implement
international transport projects like building international highways
or railways as the project understudy between Rwanda and Tanzania.
Such policies boost transport development.
• Bridges are constructed across rivers to connect different areas across
rivers and streams.
• Draining swamps for road construction.
• Improve engineering technology and use of national resources and
materials to construct transport infrastructures. There is also need to
train skilled manpower.
• To develop air transport for both domestic and international
connections in big countries like it is the case in USA, in areas with large
impenetrable rainforests like Equatorial forests in DRC or Amazonianforest in South America and large water bodies (oceans).
Application Activity 16.3
1. Using examples, explain the challenges affecting transport in Rwanda.
2. Suggest different ways Rwanda as a landlocked country can use toimprove its international transport.
16.1.4. Case study on transport
Activity 16.4
Make research, and find where the St. Lawrence sea way is located on the
world map.
St. Lawrence Sea way (USA-CANADA)
St. Lawrence Seaway stretches from Port Duluth on Lake Superior to port
St. Lawrence on the Atlantic Ocean. It covers a distance of 3,800 Km. It is the
longest inland waterway in the world with the largest volume of traffic. It serves
Canada and the USA. It allows passage of ocean going vessels. Before the sea
way was constructed, large ships could only sail on the great lakes up to St.
Lawrence town as far as Montreal. The construction of St. Lawrence Seaway
was a joint project venture between the governments of Canada and USA. The
construction works began in 1954 and ended in 1959.
-- The main aim was to create deep water for navigation between Lake
Ontario and Montreal. This would allow ocean going vessels to sail from
the mouth of the St. Lawrence River onto the western shores of LakeSuperior.
(i) Economic benefits of St. Lawrence seaway for the USA and Canada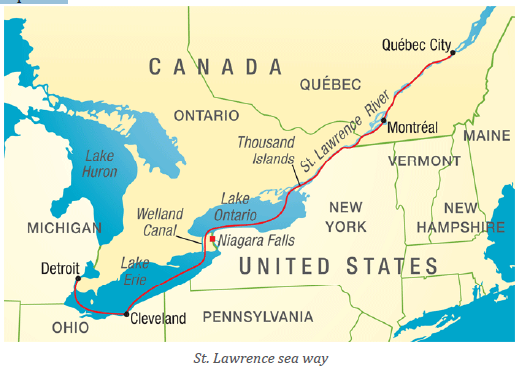
Economic benefits of St. Lawrence seaway for the USA and Canada include:
• Cheap transport: The seaway has offered a cheap means of transport
from the interior of North America to the Atlantic Ocean. This has
enhanced the movement of people and goods.
• Creation of employment: Through transportation of raw material
and finished products along the seaway, there has been an increased
volume of traffic. This has created job opportunities.
• Generation of hydroelectric power: The construction of dams along
the seaway like Saunders and Beauharnous on Niagara Falls has led to
the generation of abundant power which is cheap and reliable.
• Growth of Towns: St. Lawrence Sea Way has encouraged urbanization
along its shores. This is because the ports have attracted settlement
along. Examples of such towns are Quebec, Duluth and Hamilton.
• Increased volume of trade: St Lawrence Seaway has led to the
increase of the volume of trade between the USA, Canada and the rest
of the world. This has been due to the ease of transporting of goods
such as iron ore, copper, wheat and manufactured goods.
• Development of tourism: The seaway with the spectacular Niagara
Falls is a great tourist attraction. This has earned foreign exchange to
the two countries.
• Development of industries: The seaway has contributed to the
development of industries in the USA and Canada. The power generated
from the dams is directly used in the industries. Likewise, water from
the dams is used in cooling industrial plants.
(ii) Problems of St Lawrence sea way
• Congestion, unemployment, high crime rate due to the growth of urban centers.
• High cost of maintaining the seaway like dredging to solve the problem of silting.
• Decline in fishing activities due to destruction of wetlands and fish
habitant as a result of dredging and blasting as well as pollution of water.
• Many rocks used to adjust the level of water to improve navigation
delay the movements.
• Increase of pollution due to oil and chemical spills as a result ofenormous increase of cargo size as well as industrialization.
Application Activity 16.4
1. Explain the problems hindering the development of St Lawrence
Sea way and the problems it caused to the neighbouring countries.
2. Briefly describe how St Lawrence seaway has contributed to
development of both the USA and Canada. .
16.2. Communication
16.2.1. Meaning and types of communication
(i) Meaning of communication
Communication is a medium of sending and receiving information through
various means. It is a very vital aspect of the society. Without communication,
spatial interaction between people and communities would not be possible.
People communicate to get needed things such as information, money, adviceor just emotional support.
Activity 16.5
Observe the following images and explain how these devices are used forcommunication purposes
(ii) Types of communication
There are different links, instruments and devices used in the transmission of
information from one point to another. Early modes of communication included
sending runners with verbal messages, fire and smoke signals, and later drums
and horn blowing. The invention of writing led to improved communication as
letters could be delivered to various destinations.
Those methods of communication were found to be slow and inaccurate in
some instances and limited in terms of the distances they could cover. The
rise in electrical technology led to a new concept in communication known as
telecommunication, which is communication over long distances.
The current modes of communication include telegraph, telephone, fax, e-mail,courier, handwritten, television, radio, social networking.
Application Activity 16.5
Explain the most forms of communication used in Rwanda and why.
16.2.2. Importance of communication, problems affecting
communication and their solutions
Activity 16.6
Many business people in the city of Kigali no longer need to travel to
purchase their goods in the foreign countries. They use different types of
communication to order for the goods and get them in few days in Kigali.
1. What do you think can be the consequences of such form of
communication?
2. Explain the importance of communication.
A. Importance of communication
The following are the main positive effects of communication:
• Communication system facilitates economic development by sending
information to various locations of the world. Communication system
connects industries and business communities to take right decisions
at the right time by providing them with information and news related
with business and financial matter.
• Communication is the basis of organizational functioning: good
communication is an essential tool in achieving productivity and
maintaining strong working relationships at all levels of an organisation.
• Communication sector has led to the creation of employment
opportunities to a variety of categories of people such as journalists,
media managers and users.
• Investors in the sector of communication such as radio, television
and social media (e.g. Facebook, WhatsApp, YouTube, etc.) get more
revenue and many of them belong now in the world’s richest class.
• Communication facilitates easy dissemination of information to
remote areas.
• Communication helps in building good public relations: good public
relations comprise relations of the enterprise with outside agencies,
particularly consumers and the public at large.
B. Problems affecting communication
The following are the problems affecting communication:
• Inadequate capital: Many developing countries experience a problem
of weak economies and few industries. They thus have insufficient
funds needed to construct and maintain communication facilities.
• High taxes: There are high taxes attached to the importation of
communication equipment as well as high operation charges.
• Inadequate technical know-how: This has hindered the growth of
telecommunication since most countries have to rely on expatriates
whose payments are very high.
• Natural barriers: Desert, forest, rugged and mountainous terrains
have hindered the establishment of communication facilities like
telephone boosters.
• Competition: There is competition between the local companies
involved in the sector and free online communication systems.
• Lack of skills: There is general lack of knowledge and skills to use
telecommunication devices such as computers, radios, newspaper, etc.
C. Possible solutions to the problems affecting communication
Drawing from the problems facing communication discussed above, it is evident
that most of them can be overcome by way of reversing them.
• Political stability: There should be dialogue between countries and
the use of peace talks should be emphasized.
• Investing in communication and where capital is not available,
looking for ways of getting it through loans or aid.
• Training of personnel: Countries should invest more on training their
people so as to equip them with knowledge to hand the ever-changing
technology. It is cheaper to train home-grown personnel than to hire expatriates.
• Increase the knowledge in technology: Use the recent technology
radio, telephones, television, and internet to improve the standards of
communication.
• Communication is the link between knowledge and information.
Therefore, there is need to provide knowledge of the people to be able
to communicate properly.
D. Interrelationship between Transportation, Communication and
Economic Development
1. Both transportation and communication play some major roles in the
economic uplift of a country as they promote internal and external trade.
2. Transportation and communication systems help to promote the use
of natural resources, mobility of skilled labour-force, diversification
of markets, provision of fuel, increase in agricultural and industrial
production.
3. Efficient transport and communication systems help to establish
relationships among people in different parts of the world; these have
also strengthened the feeling of unity among people in different cultural
backgrounds.
4. Transport and communication systems help to create job opportunity
for people living in the rural areas by connecting labourers and creating
employment for them in the industries; however these have also solved
the needs of industries and reduce unemployment.
5. The development of transport system also leads to development of
industries because transport system utilizes the product of industries
and both complement each other in different ways.
6. Efficient means of transport and communication have indeed shortened
time, distance, and cost that would have been used to move and to deliver
goods and information from one person to another.
7. Transportation and communication help to increase the size of the
market of your products by helping you to transport your products
across different countries which will help you to increase your sales in
those countries that is, by penetrating new markets.
8. Through the effective transport and communication systems one will
know how to strategies in terms of war and also curtail crisis from taking
place at any point in time.
9. Government can swiftly evacuate or inform her people against any
occurrence of natural disaster, outbreak of diseases and other social
problems through the means of transportation and communication system.
10. Transportation revolution has significantly improved accessibility of
places and therefore bringing more developments and growth. This is
because transportation is the main vein through which developmentalfacilities and services are channelled.
Application Activity 16.6
1. Explain factors hindering effective communication in your area.
2. What is being done by Rwandan government to improve communication?
End unit Assessment
1. Examine the relationship between communication and transport.
2. Explain the role of the government in ensuring effective
communication in Rwanda.
3. Referring to MTN and AIRTEL –TIGO explain the importance of
telecommunication companies in the development of the country.
4. Explain the factors that have contributed to the development of
transport in developed countries than developing countries.
5. Analyze the level of transport and the improvement of technology
in communication in Rwanda and describe how this process cansupport the sustainable development of the country.
UNIT 17 :TRADE AND COMMERCE IN THE WORLD
Key unit competence: The student-teacher should be able to evaluate the
impact of trade and commerce on the sustainabledevelopment of different countries in the world.
Introductory activity
For different reasons, many countries come together and create regional
bloc such as European Union or East African Community. Conduct your own
research and answer the following questions:
1. Identify different regional integrations operating with Rwanda.
2. What advantages does a country benefit from being a member of atrading bloc?
17.1. Definition, types of trade and factors influencing international trade
Activity 17.1
Madame Kayitesi buys goods in large quantities from Inyange Industry.
She owns one of the biggest shops in her village. Her products are bought
by the local people and she takes some to the nearest markets in her
district. Some of Inyange industry products are exported overseas.
1. Identify the major imports of Rwanda
2. Mention the types of trade indicated in the passage.
3. Explain the factors influencing trade between Inyange industryand overseas countries.
17.1.1. Definition of key terms
Trade is the activity of buying and selling or exchange of goods and services at
many levels. within a country or between countries. It also occurs between two
individuals through the exchange. Trade is part of commerce.
Commerce is the activity of buying and selling goods and services, especially
on large scale or huge quantities.
The earliest form of trade was probably “barter trade” in which one type of
commodity was exchanged for another of equal value. The present trade is
based on the exchange of goods and services for money.
The present trade includes:
a. Internal trade: This is the exchange of commodities within a country. It
is also known as domestic trade. Traders normally need to exchange what
they have with what they don’t have.
b. Whole sale: This occurs when traders buy goods in bulky from both the
manufacturers and importers.
• Retail trade: This is where traders buy goods from the wholesalers
and sell them in detail to the individual customers. Goods are sold into
smaller units to kiosk owners, hawkers, shopkeepers and supermarket.
c. International trade: This type of trade occurs between different nations
of the world, on a global scale. Its rationale lies in the fact that no country
can produce everything that it needs. It involves:
• Bilateral trade: it is a trade between two countries.
• Multilateral trade: it is a trade between many countries, through the
exchanging imports where goods and services bought and brought into
the country, and exports where goods and services are transferred toanother country for sale.
17.1.2. Factors influencing international trade
The type and volume of trade that takes place at any level in any place is
influenced by a number of factors. The most important factors are:
• Capital: This is the greatest single factor influencing trade. Money is
the engine that runs trade. Traders require capital to establish their
businesses, purchase their wares and transport the commodities.
Where capital is inadequate the volume of trade will also be low.
• Demand and supply: For trade to take place there must be sufficient
demand and good chain of supply of the items.
• Transport and communication: Traders and goods need to move
from one place to another to effect various trade related transactions.
• Trade barriers: This includes the quota system for international
trade, where a country may impose limits on imports and exports.
• Government policy: This is where the government influences trade in
certain commodities through taxation. For example, the government
levies heavy taxes on certain goods such as cigarettes and alcohol.
• Creation of trading blocs: The creation of regional common trading
markets enhances trade due to increased cooperation between the
member countries.
• Political climate of a country: Political problems such as wars affect
both internal and external trade because wars discourage foreign
investors and at times destroy industries; whereas good diplomatic
relationship between countries encourages foreign investments.
• Population size and structure: This offers ready market for
consumption of commodities and labor in trading activities.
Application Activity 17.1
Discuss how the following factors influence international trade in Rwanda:
─ Regional integration
─ Government policy
─ Population
17.2. Causes of low levels of international trade in developing countries and importance
of international trade in the development
Learning activity 17.2
Learning activity 17.2
Most of the industrial products used in developing countries are imported
from Europe, USA, ASIA etc. African countries also export agricultural
products to the rest of the world but the gap between imports and exports
in less developed countries still remains big.
1. Identify the products exported by European countries in Africa.
2. Outline the major exports of Rwanda to the developed countries.
3. Explain the causes of this inequality between exports and imports.
17.2.1. Causes of low levels of international trade in Developing
Countries
The following are the major factors causing the low levels of international trade
in developing countries:
• Difficulty to access the foreign markets: The foreign markets are
dominated by the goods and services from developed countries
because they have better quality and produce more quantity of goods.
• Inadequate and insufficient domestic supply on the international
market: This causes the increase in prices and this affect the final
consumers.
• Exportation of unprocessed products: Most of the developing countries
export unprocessed products due shortage of industries or low level of
technology.
• Exportation of bulk and perishable products: Bulky and perishable
goods such as horticulture products, fruits, vegetables and animal
products, etc. present high risks to be damaged in transport process,
or conservation.
• Anti-competitive practices: Most of the developing countries are
under anti-competitive practices by private enterprises in restricting
the market access of developing countries to industrialized countries.
• Capital inflows: The growing constraints on foreign aid and the
difficulties in attracting increased foreign private financing and
investment are affecting the growth prospects of countries lagging
behind in global integration.
17.2.2. Importance of international trade in development
International trade helps in development as follows:
• Foreign trade and economic development: Foreign trade plays an
important role in the economic development of any country.
• Foreign exchange earnings: Foreign trade provides foreign exchange
which can be used to reduce poverty. The foreign earnings for
developing countries are obtained through exportation of products
especially agricultural products and raw materials.
• Market expansion: The demand factor plays very important role in
increasing the production of any country. The foreign trade contributes
to expand the market and encourages producers.
• Foreign investment: Besides the local investment, foreign trade
encourages investors to invest in those countries where there is a
shortage of investment.
• Increase in national income: Foreign trade increases the scale of
production and national income of a country. To meet the foreign
demand, we increase the production on large scale so Gross National
Product (GNP) also increases.
• Price stability: Foreign trade helps to bring stability in price level. All
those goods which are short and prices are increasing can be imported
and those goods which are surplus can be exported. There by stopping
fluctuation in prices.
• Specialization: this refers to the quality and quantity of products by a
given country. Each country adopts the specialization in the production
of specific commodities, in which it has comparative advantage. So all
trading countries enjoy profit through international trade.
• To improve quality of local products: Foreign trade helps to improve
the quality of local products and extends market through changes in
demand and supply as foreign trade can create competition with the
rest of the world, and reduces the cost of importing production.
• Import of capital, goods and technology: The inflow of capital, goods
and technology in some less developed countries has improved their
economies, due to foreign trade. Foreign trade is also responsible for
spreading or acquisition of knowledge and how-to-do from developed
countries to under developed countries.
• Cooperation: Foreign trade provides an opportunity to the people
of different countries to meet, discuss, and exchange views and ideas
related to their social, economic and political problems.
Application Activity 17.2
1. Assess the role of international trade in the economic development of Rwanda.
2. Suggest ways of reducing the gap between low exports and highimports in developing countries.
17.3. Major financial centers and trading blocs of the world
Learning activity 17.3
1. Make research and explain the objectives of International Monetary
Fund (IMF).
2. Using specific examples, explain how the trading blocs improve the
economic development of member countries.
17.3.1. Major financial institutions and centres in the world
(1) Major financial institutions in the world
A financial institution exists to provide a wide variety of deposit, lending and
investment products to individuals, businesses or both. While some financial
institutions focus on providing services and accounts for the general public,
others are more likely to serve only certain consumers with more specialized
offerings.The major financial centers include:
a. The International Monetary Fund
The International Monetary Fund (IMF) was created in1945 and has Washington
D.C. as the Headquarters. It began with 45 members.
The aims of IMF are to promote international economic cooperation and
international trade, strives to help stabilize exchange rates among member
countries. IMF takes a lead in advising member countries and ultimately helps
to avoid financial crises. The IMF also provides loans to help its members tackle
balance of payment problems, stabilize their economies and restore sustainableeconomic growth.
b. The World Bank
The World Bank or the International Bank for Reconstruction and Development
(IBRD) was founded in 1944. Its headquarters is in Washington D.C.
It was set up with the aim of reconstructing the war-affected economies of
Europe (during the Second World War) and assisting in the development of the
less developed countries of the world.
Today, the World Bank is more concerned with the development of member
countries especially the developing ones. It provides loans for the purchase
of capital goods necessary for development. In so doing, the World Bank
concentrates on loans for projects that are clearly profitable. The World Bank’scurrent focus is on achievement of the Millennium Development Goals (MDGs).
(2) The major financial centres in the world
A financial centre is a location that is home to a cluster of nationally or
internationally significant financial services providers such as banks, investment
managers, or stock exchanges.
The major global financial centres include:
• Amsterdam: (in Netherlands) is well known for the size of its pension
fund market. It is also a centre for banking and trading activities.
• Chicago: The Illinois city has the “world’s largest exchange-traded
derivatives market.”
• Dubai: In the United Arab Emirates, Dubai is a growing centre for
finance in the Middle East, including for Islamic finance.
• Dublin: In Ireland, is well known because of its International Financial
Services Centre, “IFSC”. It is a specialized financial services centre with
a focus on fund administration and fund domiciling. It also conducts
activities such as securitization and aircraft leasing.
• Frankfurt: (In Germany) Frankfurt attracts many foreign banks which
maintain offices in the city.
• Hong Kong: (China) as a financial centre, Hong Kong has strong links
with London and New York City. It developed its financial services
industry. Most of the world’s 100 largest banks have a presence in
the city. Hong Kong is a leading location for initial public offerings,
competing with New York City.
• London: (England) London has been a leading international financial
centre since the 19thcentury. And is the largest centre for derivatives
markets, foreign exchange markets, money markets, issuance of
international debt securities, international insurance, trading in gold,
silver and base metals and international bank lending. London benefits
from its position between the Asia and U.S.A
• Madrid: (Spain) Madrid is the headquarters to the Spanish company
Bolsas y Mercados Españoles, which owns the four stock exchanges
in Spain, the largest being the Bolsa de Madrid. As a financial centre,
Madrid has extensive links with Latin America and acts as a gateway
for many Latin American financial firms to access the EU banking and
financial markets.
• New York City: (USA) Since the middle of the 20th century, New York
City, has been described as a leading financial centre. New York City
remains the largest centre for trading in public equity and debt capital
markets, driven in part by the size and financial development of the
U.S. economy.
• Paris: (France). It is home to the Banque de France and the European
Securities and Markets Authority. Paris has been a major financial
centre since the 19th century. The European Banking Authority (EBA)
has a headquarters in Paris fromMarch 2019.
• Seoul: (South Korea) It is the capital that has developed significantly
as a financial centre since the late 2000. Seoul has continued to
build office space with the completion of the International Financial
Center in 2013.
• Shanghai: (China)This is one of Chinese and world financial centre. It
competes with New York and London. China is generating tremendous
new cap ital and state-owned companies in places like Shanghai.
• Singapore: Singapore has developed into the Asia region’s largest
centre for foreign exchange and commodity trading, as well as a
growing wealth management hub. It is one of the main centres forfixed income trading in Asia.
17.3.2. World trading blocs and regional integration(i) Definition
A trade bloc is a type of inter-governmental agreement, often part of a regional
inter-governmental organization, where regional barriers to trade, (tariffs and
non-tariffs barriers) are reduced or eliminated among the member states
Regional integration is a process in which neighboring states enter into an
agreement in order to upgrade cooperation through common institutions and rules.
(ii) Advantages of trading blocs and regional integration
The following are the advantages of trading blocs and regional integration:
• Foreign direct investment: An increase in foreign direct investment
results from trade blocs and benefits the economies of participating
nations. Larger markets are created, resulting in lower costs to
manufacture products locally.
• Economies of scale: The larger markets created via trading blocs
permit economies of scale. The average cost of production is decreased
because mass production is allowed.
• Competition: Trade blocs bring manufacturers in numerous countries
closer together, resulting in greater competition. Accordingly, the
increased competition promotes greater efficiency within firms.
• Trade effects: Trade blocs eliminate tariffs, thus driving the cost
of imports down. As a result, demand changes and consumers make
purchases based on the lowest prices, allowing firms with a competitive
advantage in production to thrive.
• Market efficiency: The increased consumption experienced with
changes in demand combines with a greater amount of products being
manufactured to result in an efficient market.
(iii) Disadvantages of trading blocs and regional integration
The following are the disadvantages of trading blocs and regional integration:
• Limited fiscal capabilities: Some regional integration agreements
that involve the creation of a common currency most notably the
European Union’s lead to fiscal crises.
• Cultural centralization: Strong integration like the European Union
can lead to the loss of unique minority cultures within a region. The
European Union has a series of languages that it deems to be the
official languages of the EU government. These do not include minority
languages spoken by remote communities in Europe.
• Loss of sovereignty: A trading bloc, particularly when it is coupled with
a political union, is likely to lead to at least partial loss of sovereignty
for its participants.
• Concessions: No country wants to let foreign firms gain domestic
market share at the expense of local companies without getting
something in return. Any country that wants to join a trading bloc
must be prepared to make concessions.
(iv) Factors affecting regional integration
The factors affecting regional integration are the following:
• Homogeneity of the goods produced among the member states can
hinder trade. If countries produce the same goods, there is no need to
trade amongst each other. This situation is seen among East African
countries which produce almost the same agricultural products such
as maize, sugar etc. this undermines trade among them.
• Shortage in foreign exchange. Some countries may not have enough
foreign money to trade and buy from other countries. This may be
because they do not earn enough from their exports.
• Countries may have different ideologies. They may not be comfortable
with their cultures or opinions. This makes it difficult to synchronize /
harmonize their economic strategies.
• In the trading blocs, trade is undermined by poor transport and
communication. This is experienced mainly in developing countries.
This makes it difficult to trade and move from one country to another.
• For business to flourish there must be a peaceful environment.
Therefore, if a member state is experiencing political instability, it
will affect trading relations in the whole bloc. This undermines trade
among the member states.
• Some countries have trading partners who are not in the trading bloc.
They prefer to trade with them rather than the member states of the bloc.
• Member states could experience lack of funds or capital. They are
unable to pay for goods ordered. This interferes with the functionality
of the trading bloc.
• Member states may not use the same language. There will be a language
barrier among them making it difficult to communicate. This will make
trading in the bloc more difficult and hinder economic integration.
• Countries in the bloc may have different levels of development.
Countries that are more developed will benefit more from the common
market. The less developed countries will feel unfair trading practices
against them.
• In trading blocs, especially Africa, the member countries sell
unprocessed primary goods. This limits trade because there are
limited manufactured goods in the market.
• There is interference from developed countries that are not in the
trading bloc. They impose conditions that limit trade among the
member states. This will undermine the union.
(v) Problems affecting international trade
Trade, like other human activities is facing some problems at regional and
international level. They could be economic, social, political, environmental
and cultural in nature. Problems of international trade include:
• Protectionisms: There are ways of implementing a protectionist
policy, and every country in the world protects some of its goods.
• Tariffs: The effect of high tariffs is to make imported goods equally or
more expensive than home produced articles.
• Quotas: If tariffs are ineffective in halting the inflow of cheap foreign
goods, countries may resort to imposition of quotas. By a quota system
a country refuses to import more than a specified quantity of a certain
commodity.
• Subsidies: The government of a country may pay subsidies or give
tax relief, in order to keep home prices down. This operates in much
the same way as tariff but involves assistance to home industry rather
than penalization of foreign producers.
• Trading blocs: In recent times trade has been modified by the
formation of economic unions such as EEC (European Economic
Community). Though tariffs are broken down between the member
nations and there is greater flow of the trade amongst them.
(vi) Possible solutions to problems of international trade
The following are the solutions to the problems of international trade:
• Joining and enforcing trading blocs like EAC, EEC.
• Common market or grouping which not only reduces tariffs and other
restrictions within the group but at the same time raises tariff barriers
against outsiders.
• Construction and rehabilitation of infrastructure among member
countries
• Political negotiations and discussions to reduce and final end political
instability and insecurity so that a favorable trading atmosphere is
created.
• Improving the quality of manufactured goods so that they are attractive
and competitive on the international market.
• Foreign investment to diversify domestic economy within countries.
This may overcome the problem of similarity of goods on the market.
Application Activity 17.3
Answer the following questions:
1. Discuss why Rwanda should make trade with other countries.
2. Analyse the challenges faced by Rwanda in carrying out trade with
other countries.
3. Discuss how “gains from international trade are mostly beneficial
to rich countries”
4. Suggest what the city of Kigali can do to become an international
financial center
17.4. Case studies
17.4.1. Regional integration
Learning activity 17.4
1. Describe the major objectives of EAC.
2. Analyse the challenges faced by ECOWAS member states in
implementing its objectives as a regional block.
(i) The East African Community
The East African Community (EAC) is an intergovernmental organization
composed of six countries in the African Great Lakes Region of Eastern Africa.
The country members are: Burundi, Kenya, Rwanda, South Sudan, Tanzania,
and Uganda. The headquarters of EAC is at Arusha in Tanzania.
The organization was founded in 1967, collapsed in 1977, and was revived on
7 July 2000. In 2008, after negotiations with the Southern Africa Development
Community (SADC) and the Common Market for Eastern and Southern Africa
(COMESA), the EAC agreed to an expanded free trade area including the
member states of all three organizations. The EAC is an integral part of the
African Economic Community.
In 2010, the EAC launched its own common market for goods, labour and capital
within the region, with the aim of creating a common currency and eventually a
full political federation. In 2013, a protocol was signed outlining their plans forlaunching a monetary union within 10 years.
Aims of EAC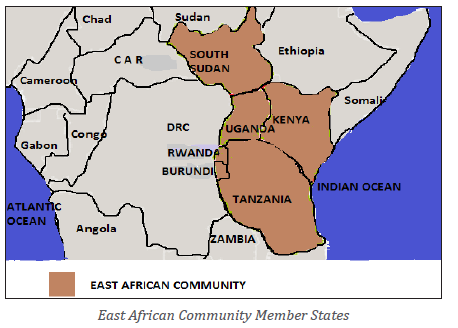
The following are the aims of EAC:
• To revive free movement of people, goods, money, and services.
• To create common (tax) tariff.
• To create large market for goods and services.
• To promote regional cooperation.
• To improve communication.
• To share electricity.
• To promote industrialization in the region
(ii) Economic Community of West African States
The Economic Community of West African States (ECOWAS) was created in May
28,1975 via the treaty of Lagos. ECOWAS is a regional grouping with a mandate
of promoting economic integration in all fields of activity of the constituting countries.
Member countries of ECOWAS include Benin, Burkina Faso, Cape Verde, Cote
d’ Ivoire, Gambia, Ghana, Guinea, Guinea Bissau, Liberia, Mali, Niger, Nigeria,Sierra Leone, Senegal and Togo.
Objectives of ECOWAS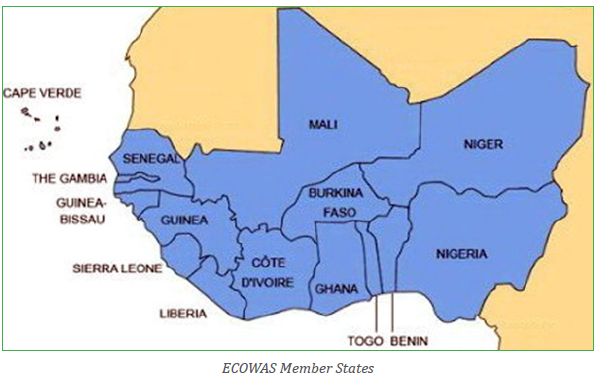
The following are the objectives of ECOWAS:
• To promote economic cooperation
• To uplift living standards of member states
• To achieve and maintain economic stability of member countries
• To enhance free movement in member states without immigration
formalities.
This regional organization has achieved the following:
• ECOWAS has frozen all customs and tariffs on goods originating within
West African and this has led to industrial growth.
• It has decreased prices among the member states of some products
like petroleum.
• It has increased technological exchange among the member states.
• There has been an improvement of communication in the region.
17.4.2. Trading blocs
(i) Organization of Petroleum Exporting Countries
The Organization of Petroleum Exporting Countries (OPEC) is an organization
of oil-producing countries. It controls 61 percent of the world’s oil exports and
holds 80 percent of the world’s proven oil reserves. OPEC’s decisions have a
huge impact on prices. The country members are: Algeria, Angola, Ecuador,
Gabon, Indonesia, Iran, Iraq, Kuwait, Libya, Nigeria, Qatar, Saudi Arabia, United
Arab Emirates and Venezuela.
OPEC’s three goals
• To keep prices stable. It wants to make sure its members get what a
good price for their oil.
• To adjust the world’s oil supply in response to shortages.
• To coordinate and unify the petroleum policies of its membercountries and ensure the stabilization of oil markets.
(ii) The European Union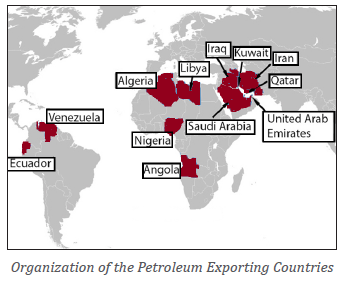
The European Union (EU) is a union of 28 independent states based in Europe.
It is the largest single common market in the world. The European Union has a
common currency, the euro, which is acceptable in all member states. EU helps
in promoting trade, agriculture and creation of employment.
Member states of the EU are Austria, Netherlands, Hungary, Belgium, Portugal,
Latvia, Denmark, Spain, Lithuania, Finland, Sweden, Malta, France, Poland,
Slovakia, Germany, Slovenia, The United Kingdom, Greece, Ireland, Italy, TheCzech Republic, Estonia, Luxembourg and Cyprus.
Application Activity 17.4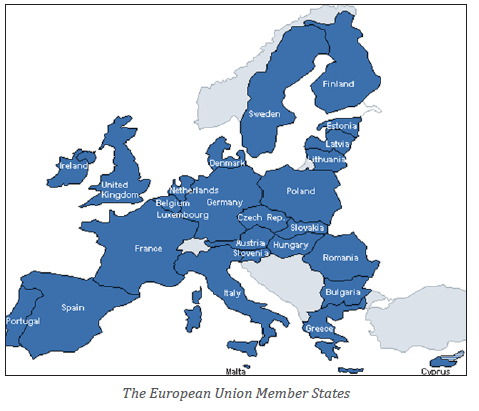
1. Describe the major aims of OPEC.
2. Explain how ECOWAS member states have benefited from thisintegration.
Skills lab
Trade and commerce has a great impact on the sustainable development of
different countries in the world. Evaluate the impact of EAC to the sustainabledevelopment of Africa.
End unit Assessment
1. Draw the map showing the member countries of E.A.C.
2. Conduct your own research to identify different regional
integrations operating with Rwanda and show their main objectives.
3. Examine the role of regional integration in the social, economic
development of Rwanda.
4. Analyse the reasons for low level of international trade indeveloping countries.
GLOSSARY
Acid lava: A molten material flowing from a volcanic vent. Acid lavais high in silicates, viscous,
and does not flow far. It creates a steep sided dome
Adit: Horizontal tunnels that have access to the mineral extraction.
Aquaculture: Refers to breeding, rearing and harvesting of plants and animals in all types of
water environments.
Ashes: The solid remains of fires. Specifically, it refers to all non- aqueous, non-gaseous residues
that remain after something is burned
Bedding: An arrangement of rock strata in bonds of various thickness and characters.
Brine: It is water that contains salt.
Buffer zone: It is an area of land designated for environmental protection.
Cinder cones: These are the simplest type of volcano. They are built from particles and blobs
of congealed lava ejected from a single vent.
Circumnavigation: Originally meant going around something, by ship. Usually it means people
going around the world.
Colluvial complex: This is the lower concave slope where there is gradual deposition of eroded
material
Condensation: This refers to the process by which water vapour in the air is changed into liquid
water. Condensation is crucial to the water cycle because it is responsible for the formation of
clouds. These clouds may produce precipitation, which is the primary route for water to return
to the Earth’s surface within the water cycle.
Continental shelf: The submerged, gently sloping margins of a continent.
Contour: It is a line drawn on a map joining all the places with the same altitude above sea
level.
Deciduous forests: Forests or shrubs which shade all their leaves at certain season of the year
as opposed to evergreen forests.
Drill: It is a hydraulic method of mining and conveying coal in substantially vertical seams.
Escarpment: Fault scarp or the wall of a rift valley.
Extensive farming / agriculture: Is an agricultural production system that uses limited inputs
of labour, fertilizers, and capital, in comparison to the land under cultivation.
Family planning: The practice of controlling the number of children one has and the intervals
between their births, particularly by means of contraception or voluntary sterilization.
Foot: It is an a measure of length used in some systems, 1 foot = 0.3048 metres.
Fossil: Is any preserved remains, impression, or trace of any once-living thing from a past
geological age.
Gem: A precious stone that has been cut and polished and is used in jewellery.
Gravity: The force which attracts objects towards one another, especially the force that makes
things falls to the ground.
Inch: It is a measure of length used in some systems, 1 inch = 0.0254 metres; there are 12
inches in one foot.
Independent variable: These are variables being tested. Whereby its change directly results
into a change in dependent variables.
Inland water bodies: Sources of water that are found within a country. They include rivers,
lakes, and swamps.
Jewellery: Decorative objects worm on your clothes or body which are usually made from
valuable metals such as gold and silver and precious metal.
Leap year: A year that happens every four years and has an extra day on 29 February.
Light year: The distance that light travels in one year (about 9,500,000,000,000 km).
Metropolitan: It refers to a large city, its surrounding suburbs, and other neighbouring
communities.
Mile: It is an English unit of length, 1 mile = 1,609 metres.
Mineral deposit: Is an aggregate of a mineral in an unusually high concentration. About half of
the known chemical elements possess some metallic properties.
Mineral ore: A naturally occurring solid material, from which a metal or valuable mineral can
be extracted profitably.
Open-pit, open-cast or open cut mining: Is a surface mining technique of extracting rock or
minerals from the earth by their removal from an open pit or borrow.
Plankton: The food for fish either in form of tiny sea organisms or plants that grow in water
bodies.
Population policy: A population policy is a set of measures taken by a State to modify the way
its population is changing, either by promoting large families or immigration to increase its
size, or by encouraging limitation of births to decrease it.
Sewage: Used water and waste substances that are produced by human bodies, that are carried
away from houses and factories through special pipes (= sewers).
Shaft: A long narrow, usually vertical passage in an underground mining, used especially for a
lift/elevator or as a way of allowing air in our out.
Sluice: A sliding gate or other device for controlling the flow of water out or into a canal to
wash something with stream of water.
Subduction: A geological process that takes place at convergent boundaries of tectonic plates
where one plate moves under another and is forced or sinks due to gravity into the mantle.
Regions where this process occurs are known as subduction zones.
Tsunami: The waves caused by sudden movement of the ocean due to earthquakes, landslides,
large volcanic eruptions or meteorite impact in the ocean.
Vulcanicity: The process through which gases and molten rock are either extruded on the
earth’s surface or intruded into the earth’s crust.
Wood fuel pellets: Pellet fuels (or pellets) are biofuels made from compressed organic matter
or biomass. Pellets can be made from any one of five general categories of biomass: industrial
waste and co-products, food waste, agricultural residues, energy crops, and virgin lumber.
Xerophyte: This is a species of plant that has adaptations to survive on an environment with
little liquid water such as a desert or an ice or snow covered region.
REFERENCES
A.G, B. (2004). A step by step approach . Boston : Mc. Grawhill.
A.S, S. (2011). statistics and Geography of the World: World problems and development
. Kampala: 419 p.
B. Chandrasekran and etal. (2010). A testbook of Agronomy. New Delhi: New
Age international (P) LTD, Publishers.
B., e. S. (2017). what causes forest fires:. httpa://www.worldatlas.com/articles/
what-cause-fires.html.
Bamusananire E, and etal. (2013). geography for Rwanda secondary schools
Advanced level Senior 4. Kigali: Fountain Publishers Rwanda LTD.
Barekye Richard , et al. (2016). Achievers Geography and Environment for
Rwandan Schools Book 1. Nairobi: East African Educational Publishers
LTD.
Barry R.G. , R.J . (1976). Atmosphere, climate and weather .
Bunnett, R. B. (2010). Physical Geography in Diagrams. England: lonman Group
limited 1984.
Bwebare, B. (2010). Focus on the world geography , . kampala : Kabs publishers
ltd.
BYAMUGISHA BWEEBARE C. (2000). Physical Geography A Systematic Study in
Geomorphology and Climatology for Advanced Level Students. Kampala:
KABS: Simplified and Low Priced Text Book Centre.
Byamugisha Bweebare C. (2000). Pysical Geography,A systematic Study in
Geomorphology and Climatology for Advanced Level Students. Kampala:
Simplified and Low Priced Text Book Centre, Kampala. A.
Clarke G.M and Cooke D. . (1998). A basic course in statistics . New york: Oxford
university press Inc.
D.Macmaasta, Jiclarke etal. (n.d.). geography of Africa.
Department of Agriculture, f. a. (2014). production Guideline-Sugarcane.
Pretoria.
FAO. (1999). Environment and forest utilization . www.fao.org/forestry.
Felbab, V. (2013). Brown . www.brookings.educ.
Goh Cheng Leong. (1983). Certificate Pysical and Human Geography. China:
Oxford University Press.
Goh Cheng Leong. (1999). Certificate Physical and Human Geography. China:
Oxford University Press.
Henri M.Kichodo. (2009). Principles of Physical Geography,Paper one(250/1).
Kampala: Comp Solutions.
HENRIE M.KICHODO. (2009). PRINCIPLES OF PHYSICAL GEOGRAPHY (ADVANCED
LEVEL GEOGRAPHY PAPER ONE (250/1). Kampala: CompSolutions.
Hess, D. (2011). Physical geography: A landscape Appreciation, 10th Ed. . New
Jersey: Pearson Education.
J Brett, A Gelling, K Marimuthu, S Mclntyre, C Vlok. (2012). Solutions for all
Geography. Northlandss Gauteng: Mackmillan South Africa (pty) ltd.
J.S, K. (1973). Cartography design and production. John Wiley and Sons: New
York.
Jaegbu. (1991). Approach to practical work in Geography. Ibandan: 238 p.
M.K., H. (2012). Practical Geograph for Advanced level. Map Work, photographic
interpretation and statistics /Field work. Kampala: Comp Solutions.
Monkhouse, F. (2008). Principles of Physical Geography. London: Hodder
Education.
N, A. (1984). cartography for students and Technicians. Vol1. London and New
York: EASP.
Nzobona A, atel. (2010). Geography for Rwanda secondary schools Africa Year 2.
Kigali: Fountain Publishers Rwanda LTD.
Oer, U. (2017-2018). Earth Science. Utah State: CK-12 Foundation .
Paul K Kibuuka and Robert Karuggah. (2003). Certificate Geography,Form 1.
Nairobi: Oxford University Press,East Africa Ltd.
Paul K Kibuuka et ali. (2003). Cerificate Geography Form 1. Kenya: Oxford
University.
Paul kibuka and etal. (2004). certificate Geography Form 3 students Book.
Nairobi: Oexford University Press, East Africa LTD.
R B Bunnett. (2010). Physical Geography in Diagrams for Africa. Malaysia, KHL:
Longman.
R B Bunnett. (2008). General Geography in Diagrams. Singapore: Longman.
Rankovic, D. (2018). Forest exploitation . ELGRAD, Bosinia .
RB Bunnett. (2010). Physical Geography in Diagrams for Africa. Malaysia,KHL:
Longman Group Limited.
REB. (2015). GEOGRAPHY SLLABUS ADVANCED LEVEL S4-S6. Kigali: Rwanda
Education Board (REB) .
REB. (2015). Geography Syllabus for Advanced Level S4-S6. Kigali: REB.
Safari Sibo et ali. (2012). MK Senior Secondary Geography Student’s Book 4.
Kampala: MK.
SAFARI SIBO et Ali. (2012). MK Senior Secondary Geography Student’s Book 4.
Kampala: MK Publishers Ltd.
Safari Sibo, etal. (2013). Mk Senior secondary Geography book 5. kigali: MK
Publishers LTD.
Samson, G. S. (2017). Agri-environmental policies and Dutch Diary Farmers’
responses (Thesis submitted in fulkfilment of the requirement for a degree
of Doctor). Wageningen : Wageningen University.
Shiva, D. (1999). Inventory of forest resources for sustainable management and
Biodiversity conservation, . Indus Publishing Company .
Verite. (2011). Rubber production in Rubber in liberia: Exploratory assessment
of living and working conditions, with special attention to forced Labour.
China: Verite.Wikipedia, t. f. (n.d.).