General
- Biology SME Y3 SB File Uploaded 1/11/21, 16:56
UNIT 1: POPULATION AND NATURAL RESOURCES
Key unit competence
Describe the factors affecting population size and the importance of natural
resourcesIntroductory activity 1
Living organisms in their natural habitat are different in number where by some are
still represented by a significant number (figure A) While others can disappear when
they are not protected (Figure B). The change in number of organisms does not
happen abruptly without any reasons behind. Refer to the figures and do activity
below :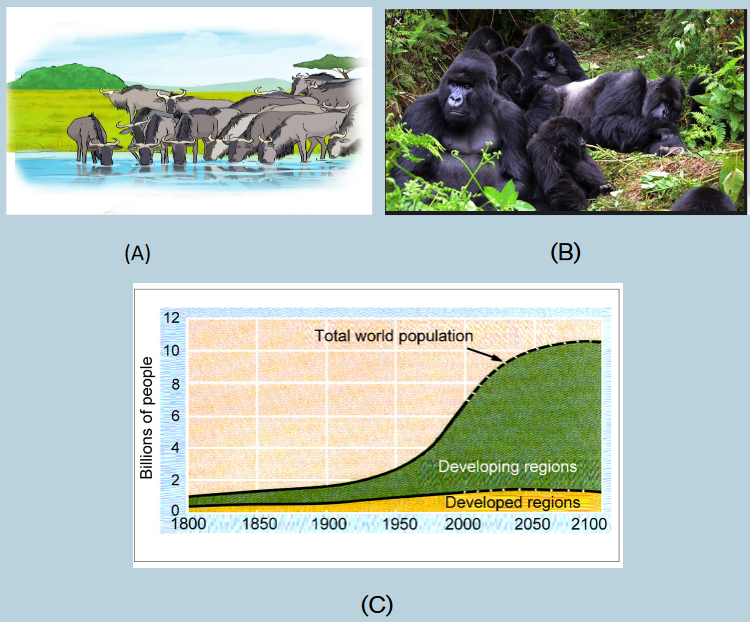
a) Referring to figure B above, identify the reasons that were behind
their decrease?
b) Referring to figure A, why does others species still represented by a
significant number?
c) Observe the graph C and identify what it indicates in terms of population
growth, especially in developing countries. What do you think would be
the effect on the nature and what measures would be taken to maintain
the nature?1.1 Population characteristics
Activity 1.1
The human population size in some areas increases yet their habitat does
not increase. The pyramid of age structure in that area shows there are
more young people than adults.The growth pattern below shows that there is an increase in population
of these areas which is a result of high birth rate compared to death rate.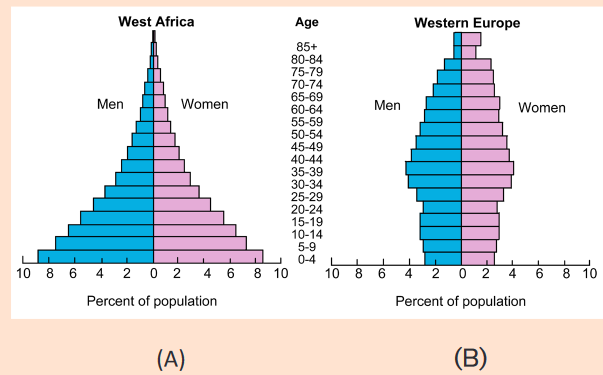
d) Among bolded terms (human population size, pyramid of age
structure, growth pattern, birth rate and death rate), one of them
is better applied to the above figures. Find out the corresponding term
based on the parameters presented on both figure A and B.
e) Based on the shapes of figure A and B. Find out the figure that
corresponds to the description done in above text. Explain how you
have arrived to your choice.
f) Using the school library and additional information from the internet,
Explain bolded terms found in the text at the start of this activity.Populations are dynamic, constantly changing components of ecosystem. They
are commonly described using the following characteristics:1.1.1 Population density
Population density is defined as the numbers of individuals per unit area or per
unit volume of environment. Larger organisms as trees may be expressed as
100 trees per square kilometer. For example, the number of Acacia tree species
per square kilometer in the Akagera National park, whereas smaller ones like
phytoplanktons (as algae) as 1 million cells per cubic meter of water. In terms of
weight it may be 50 kilograms of fish per hectare of water surface.1.1.2 Population age structure
One important demographic variable in present and future growth trends is a
country’s age structure, the relative number of individuals of each age in the
population. The age structure of a population is the distribution of people
of various ages. Age structure is commonly graphed as “pyramids” like those
in figure below.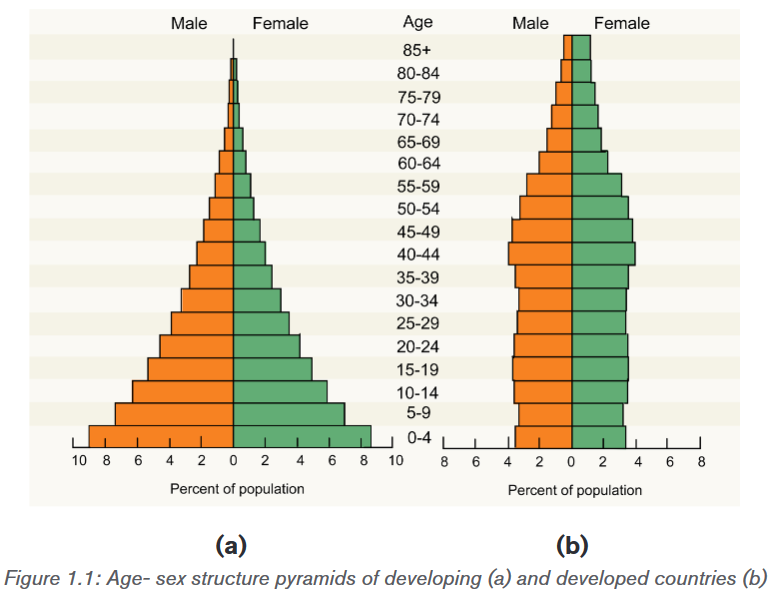
The shapes of the age-sex structure pyramids shown above show the age
sex-structure of a developing and developed country. The main characteristics
of developing countries including some of the African countries in terms of
population growth include high death rate; high birth rate and low life expectancy,
while the main characteristics of developed countries such as most Europeancountries in terms of population growth have low death rate, low birth rate and
longer life expectancy. The age structure of a population affects a nation’s key
socioeconomic issues. For example, countries with young populations (high
percentage under age 15) need to invest more in schools while countries with
older populations (high percentage ages 65 and over) need to invest more in
the health sector.1.1.3 Population explosion
The human population increased relatively slowly until about 1950, at which
time approximately 500 million people inhabited Earth. Our population doubled
to 1 billion within the next two centuries, doubled again to 2 billion between
1850 and 1930, and doubled still again by 1975 to more than 4 billion. The
global population is now more than 6.6 billion people and is increasing by about
75 million each year. Population ecologists predict a population of 7.8-10.8
billion people on Earth by the year 2050.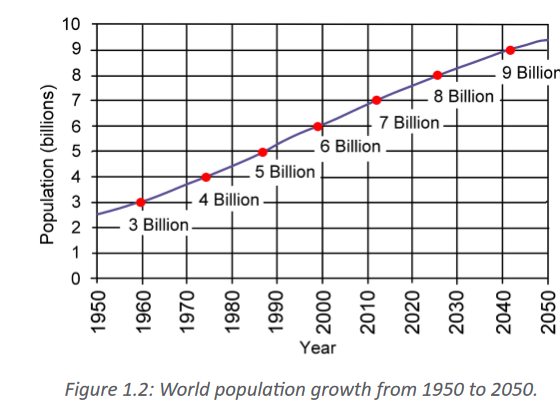
Such human population increase impacts negatively the environment. For
instance, human population explosion contributes to pollution leading to;
ozone depletion, eutrophication, acid rain, global deforestation, soil
erosion and desertification. A population explosion is a sudden increase in
the number of individuals in a particular species. Human population explosions
is sometimes cited as a cause of resource scarcity and a lack of opportunity for
individuals.One of the best way of regulating human population increase in different
countries including Rwanda is practicing the family planning. Family planning
is the practice of controlling the number of children in a family and the intervals
between their births. If married couples are sexually active, they have to adopt
at least one family planning technique such as contraception and timing of
reproduction. Other techniques commonly used include; sexuality education,prevention and management of sexually transmitted infections, pre-conception
counselling and management, and infertility management.1.1.4 Birth and death rates
Birth rate is the ratio of live births in a specified area to the adults in population
of that area. It is usually expressed per one thousand individuals per year. It is
estimated from this calculation: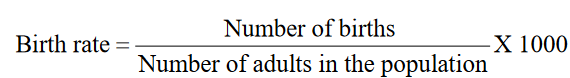
Death rate is the ratio of deaths to the adults in population of a particular area
during a particular period of time. It is usually calculated as the number of deaths
per one thousand individuals per year and it is estimated from this calculation: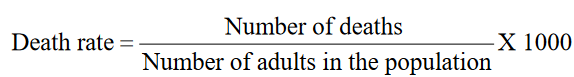
1.1.5 Population growth patterns
Population growth patterns are graphs (population growth curves) in which
increases in size are plotted per unit time. When a population size increases,
the growth rate also increases. The factors that contribute to the population
growth are immigration of new species as well as the birth rate. Population
growth is also influenced negatively by emigration and death rate.Application activity 1.1
1) In a habitat, there are 200 adult lions. Each year, 20 lions are produced
while 5 lions die.
a) Calculate the birth rate of this population.
b) Calculate the death rate of that population
2) A population of 820 insects occupies a surface area of 1.2 km2.
These insects gather nectar from a population of 560 flowering plants
which occupy a surface area of 0.2km2. Which population has greater
density?1.2 Factors affecting population density
Activity 1.2
Observe the figures below and respond to the following questions:
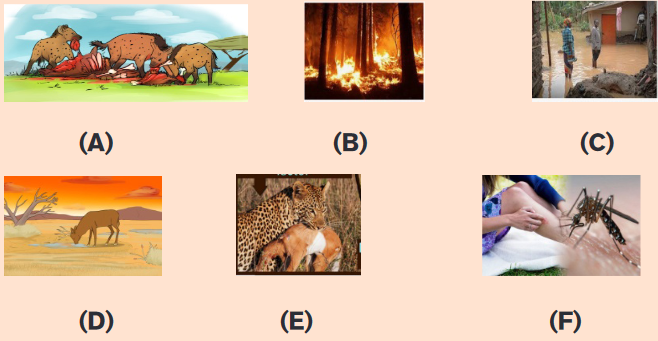
a) Observe the figures above and identify what is taking place in each
figure.
b) Based on what is happening as a result of interaction between organisms
or not, make two Groups from the above figures and find the names that
correspond to those two groups.
c) By use of books or search engine describe how identified factors in (a)
affect the population density.Populations are differently distributed. The distribution and the density are
controlled by environmental factors, which can either increase or decrease the
population size by affecting birthrate, death rate, immigration and emigration.
These factors are grouped into two major categories: Density -dependent
factors and Density- independent factors.1.2.1 Density-dependent factors
Without some type of negative feedback between population density and the
vital rates of birth and death, a population would never stop growing. Density
dependent factors are factors whose effects on the size or growth of the
population vary with the population density. The density dependent factors
include the following: availability of food or resources, predation, disease and
migration.a) Competition for resources
In a crowded population, increasing population density intensifies competition
for declining nutrients and other resources, resulting in a lower birth rate.
Crowding can reduce reproduction by plants and many animal populations also
experience internal competition for food and other resources.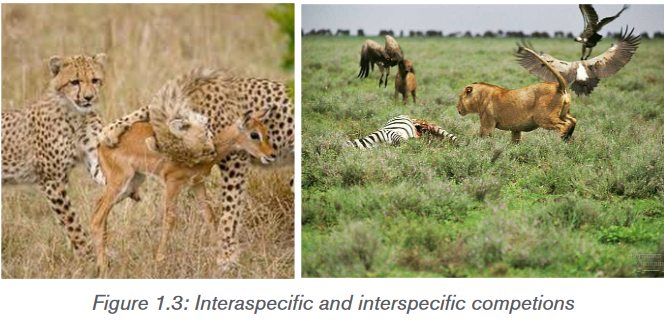
b) Diseases
Population density can also influence the health and thus the survival of
organisms. If the transmission rate of a particular disease depends on a certain
level of crowding in a population, the disease would impact more the population
with high density. Among plants, the severity of infection by fungal pathogens
is often greater in locations where the density of the host plant population is
higher. Animals, too, can experience an increased rate of infection by pathogens
at high population densities.c) Predation
Predation is also an important cause of density-dependent mortality if a predator
encounters and captures more food as the population density of the prey
increases. As a prey population builds up, predators may feed preferentially
on that species, consuming a higher percentage of them which affects directly
population density.1.2.2 Density-independent factors
Density independent factors can affect the population regardless of their density.Most density independent factors are abiotic factors, such as volcanic eruptions,
temperature, storms, floods, draught, chemical pesticides and major habitat
disruption. Even if all population can be affected by these factors, the most
vulnerable appear to be on small organisms with large population such as
insects.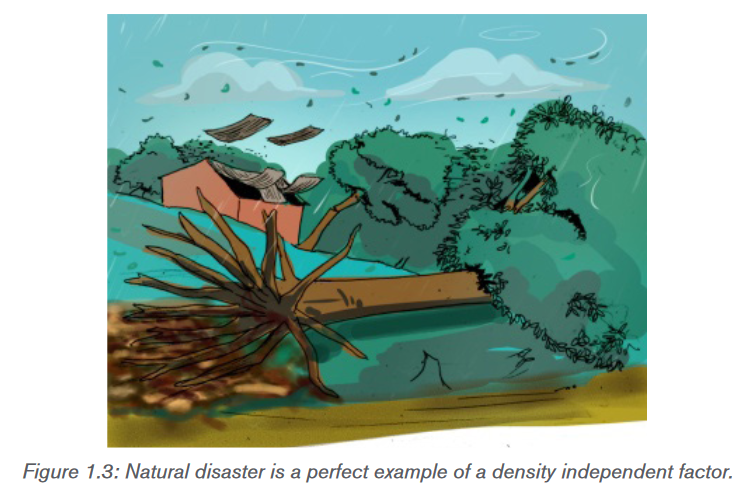
Application activity 1.2
1) A population of field mice increases after a farmer leaves his field
unharvest for a season. Which of the following categories does this
factor fall into? Explain your choice.
a) Density Independent Factors,
b) Density Dependent Factors,
c) Increased death rate
2) Compare the density -dependent and density independent factors. In
your comparison highlight examples of those factors.1.3 Methods or techniques of measuring and estimating
population densityActivity 1.3
Using strings/ropes, a decameter and quadrats in your school garden, carry
out the following field work:
a) Move in the school garden and make a line transect of 15 meters by the
use of a decameter and rope or a string.
b) Count all plants species found at each five meters across transect.
c) On the ground, apply five different quadrats of one square meter
separated by 2.5 meters and count different plants species within each
quadrat. The sketch that show the disposition of quadrats upon 15
meters is as follow: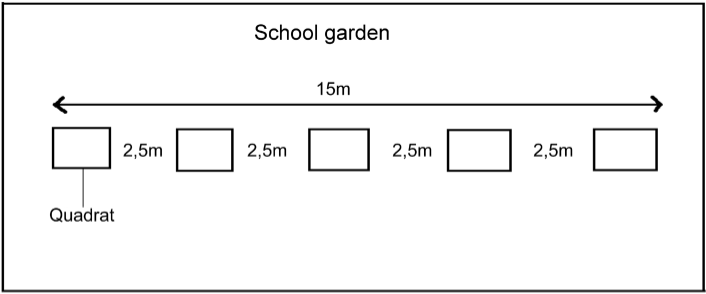
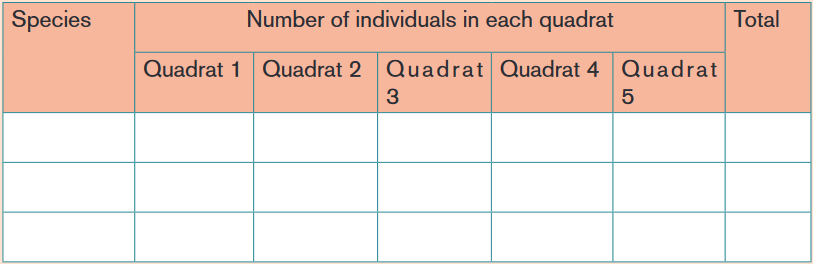
Record your samples in the following table with respect to each quadrat:
a) Calculate the population density and species frequency for each studied
quadrat.
b) Compare the results of different quadrats.1.3.1 Quadrat method
A quadrat is a square frame that marks off an area of ground, or water, where
you can identify different species present and/or take a measurement of their
abundance. Before any experiment, the decision on a suitable size for the
quadrat and the number of samples to use is taken. Samples must be selected
randomly to avoid any bias, such as choosing to take all of samples from the
place with fewest species simply because it is the easiest to do. This would
not represent the whole area you are surveying. A quadrat method enables the
calculations of 3 aspects of species distribution including; species frequency,
species density and species percentage cover.1.3.2 Species frequency
Species frequency is a measure of the chance (probability) of a particular species
being found within any one of the quadrat, and it is found simply by recording
whether the species was present in each analyzed quadrat. For example, if a
quadrat is placed 40 times, and a given plant was identified in 20 samples, then
the species frequency for this plants equals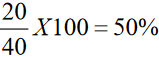
1.3.3 Species density
Species density is a quantity of how many individuals there are per unit area, it
can also be the number of species in a sampled area for example, per square
meter. To achieve this, one takes the total number of counted individuals and
then divide it by the number of quadrats done. An example is:
Total number of individuals= 250
Total area of quadrats =500m2
Species density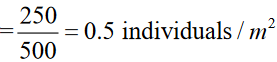
1.3.4 Species cover
Species cover is a measure of the proportion of ground occupied by the species
and gives an estimate of the area covered by the species as the percentage of
the total area. For example, if there are 100 small squares in one quadrat, then
the squares in which the plant species are present are counted. If plants are
found in 25 squares within that quadrat, the conclusion is that the plant covers
25% of the area1.3.5 Line transect method
Line transect is a tape or string laid along the ground in a straight line between
two poles as a guide to a sampling method used to measure the distribution
of organisms. For example, the investigation on change at the edge of a field
where it becomes very marshy is done by randomly selecting a starting point
in the field and lay out a measuring tape in a straight line to the marshy area,
and then sample the organisms that are present along the line, which is called
a transect. The simplest way to do this is to record the identity of the organisms
that touch the line at set distances for example, every two meters.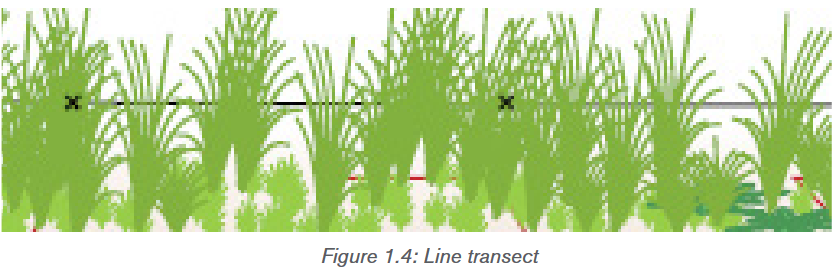
1.3.6 Capture-recapture method
Capture-recapture method involves capturing the organism, marking it without
any harm, and release it in the same area so that it can resume a normal role in
the population. For example, fish can be netted and their opercula is netted with
aluminium discs, birds can be netted and rings can be attached to their legs,
small animals may be tagged by dyes, or by clipping the fur in distinctive pattern,
while arthropods can be marked with paint. In all cases, some form of coding
may be adopted so that individual organisms are identified. Having trapped,
counted and marked are representative sample of the population.At a later stage, the population is trapped again and counted, and the population
size is estimated using the Lincoln index as follows:Estimated total population
=

Where:
N1: the number of organisms in initial sample,
N2: the number of organism in a second sample,
N: the number of marked organisms recaptured.Application activity 1.3
1) Conduct a survey using a quadrat of 0.5m2 and found the following
statistics for a couch grass by quadrat:
a) Calculate the species frequency, and the species density of couch
grass from the results of this survey.
b) Given that the total surface area of the school ground is 200 m2 and
couch grasses were found on 50 m2. Calculate the percentage cover
occupied by couch grasses.A fish farmer wanted to know the total population in her fish pond. She netted
240 fish and tagged (marked) their opercula with aluminium discs. She
released those fish into the pond. After one week, she netted again 250 fish
among which 15 had the aluminium discs. Calculate the estimated population
from marked individuals.1.4 Population growth patterns and Environmental
resistanceActivity 1.4The following graphs are of insect’s growth in separate conditions, study it
and answer the following questions: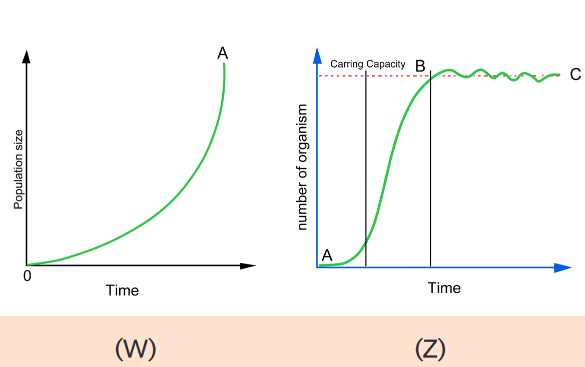 a) What does these graphs represent based on parameters presented
on horizontal and vertical axis?
b) Based on the shape of the graphW from 0 to A and the shape of Z from
A up to C findout their similarities and their differences.
c) Explain how does food supply brings fluctuation which is the result of
the shape B to C on graph Z.1.4.1 Population growth patterns
Population growth patterns are graphs also called population growth curves in
which the increases in size are plotted per unit time. Two types of population
growth patterns may occur depending on specific environmental conditions:a) Exponential growth pattern / J-shaped curve
Exponential growth is a pattern of population growth in which a population
starts out growing slowly but grows faster as population size increases. An
exponential growth pattern also called J shapes curve occurs in an ideal,
and unlimited environmental resources. In such an environment there will be
no competition. Initially population growth is slow as there is a shortage of
reproducing individuals that may be widely dispersed. As population numbers
increase, the rate of growth similarly increases, resulting in an exponential
J-shaped curve. Exponential population growth can be seen in populations that
are very small or in regions that are newly colonized by a species.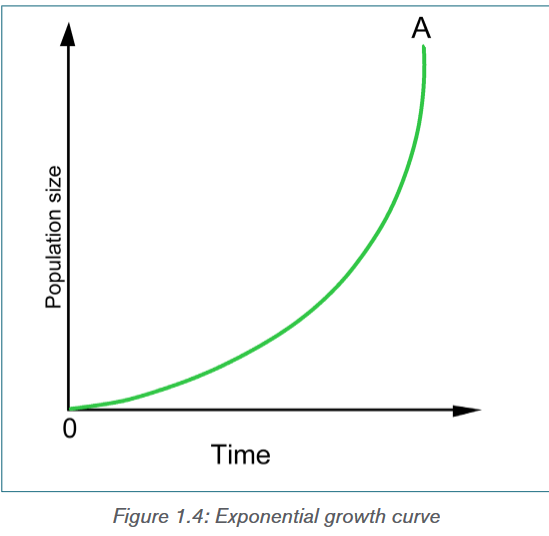 b. Logistic growth pattern / sigmoid growth curve
Logistic growth is a pattern of population growth in which growth slows and
population size levels off as the population approaches the carrying capacity. A
logistic growth pattern also called S-shaped curve occurs when environmental
factors slow the rate of growth.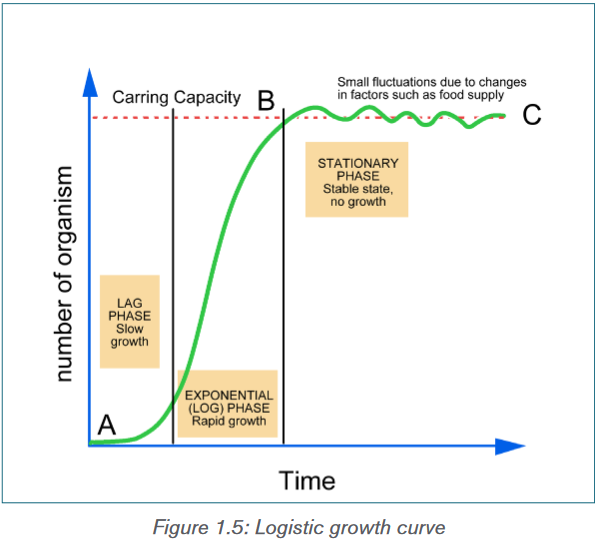 The sigmoid or S- shaped curve represented by the figure 1.8 shows three main
stages in population growth: The lag phase where there is a slow growth, the
log phase or exponential growth phase, also called logarithmic phase,
in which the number of individuals increases at a faster rate and the plateau
phase or stationary phase, in which the number of individuals are stabilized.Causes of the exponential phase are various and include the plentiful of resources
such as; food, space or light, little or no competition from other organisms,
and favourable abiotic factors such as; temperature or oxygen and reduced of
lack of predation or diseases. The stationary phase, however is caused by a
balanced number of; births plus the number of immigrations and the number of
deaths plus the number of emigration. Other causes may include; the increase of
mortality caused by predators and diseases, excess of wastes and competition
for available resources such as food, space, shelter and minerals. Some of these
causes may include the carrying capacity explained as is the maximum number
of individuals that a particular habitat can support.1.4.2 Environmental resistance
Environmental resistance is the total sum of limiting factors, both biotic and
abiotic, which act together to prevent the maximum reproductive potential also
called biotic potential from being realized. It includes external factors such as
predation, food supply, heat, light and space, and internal regulatory mechanisms
such as intraspecific competition and behavioral adaptations.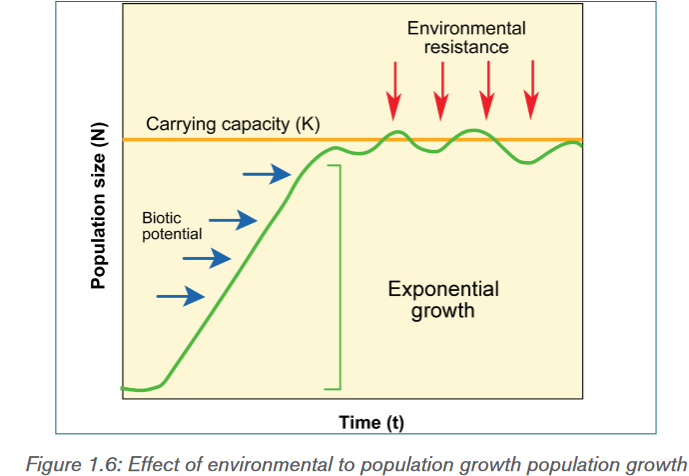 1.4.3 Environmental balance
A balance of nature is the stable state in which natural communities of animals and
plants exist, and are maintained by competition, adaptation and other interactions
between members of the communities and their non-living environment. Every
biotic factor, affects or causes a change in the natural environment. For
example, when a living organism interacts with the environment, this causes a
change in the environment. The following are some of the examples of biotic
factors are include animals, plants, fungi, bacteria, and protists and their effects
on balance of nature can be seen through the following phenomena:
– Respiration: when animals are respiring, they take in oxygen and give
out carbon dioxide (CO2) from respiration. The CO2 can be taken in
by plant leaves and be used in the process of photosynthesis to make
food and give out oxygen.
– Predation: when animals, for example, predate on other animals, this
reduces the numbers of prey, which in turn affects the ecosystem.
– Parasitism: cause diseases that may slow down the growth rate of a
population and/or reduces the number of organisms.
– Competition: when organisms compete over nutritional resources,
this could reduce the growth of a populationApplication activity 1.4A small group of mice invaded a new habitat with unlimited resources and
their population grew rapidly. A flood then swept through the habitat and three
quarters of the mice died. Two months later, the population was increasing
again.
a) What role did the flood play for the mouse population?
b) Draw a graph depicting the population history of this mouse.1.5 Renewable natural resourcesActivity 1.5Observe the figures below carefully and respond to the following
questions: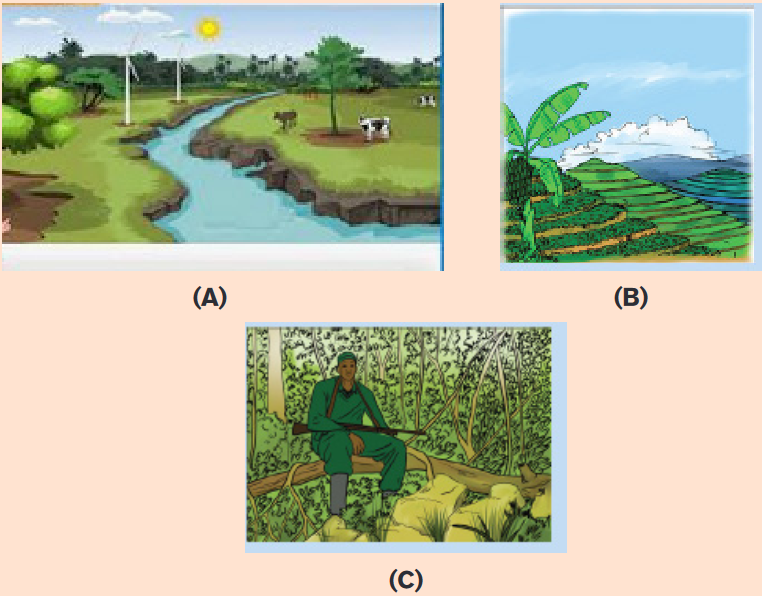 Natural resources refer to materials or substances occurring in environment
and which can be exploited for economic gain. They are also resources that
exist without actions of humankind Natural resources such as; solar energy,wind, air, water, soil and biomass (plants and animals) are renewable natural
resources. Below are the examples of renewable natural resource: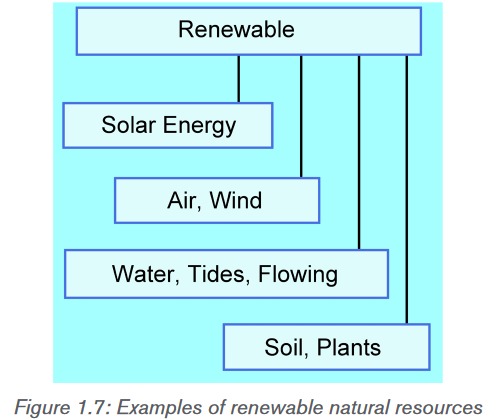 1.5.1 Importance of renewable natural resources in
economic growth of Rwanda
• Water is used for irrigation, domestic activities, industrial use, and mining.
• Lakes and rivers are source of food (fish) for humans and contribute for
recreation (tourism).
• Land serves as the storehouse of water, minerals, livestock, and home for
wild animals which generate an income in different ways.
• Soil contributes to agricultural crop production, and supports forest and
food crops.
• Trees are the major sources of timber, construction materials and firewood
and contribute to fight against erosion, water and air purification and wind
protection.
• Some plants are source of food and money for humans and other animals.
• National Parks contribute to economic development of the country through
tourism.1.5.2 Methods of conserving renewable natural resources
They are various methods used for conservation of renewable natural resources
and they include:• Planting trees to prevent soil erosion. The vegetation prevents soil erosion
but also is a home for most insects, birds and some symbiotic plants. This
creates a habitat for wildlife hence conserving wild organisms• Practicing of judicious ways to conserve water in our homes: This
entails simple practices like ensuring that taps are closed when they are not
in use. Using less water during domestic activities aids to conserve lots of
water in our homes.• Growing vegetation in catchment areas: Catchment areas act as a
source of water that flows in; streams, rivers and oceans. Vegetation in the
catchment areas allows sufficient infiltration of water into deeper soil layers
thus leading to formation of ground water• Prior treatment of human sewage and Industrial wastes: Water flowing
from industries comes with many toxic wastes that must be treated before
getting to the natural water bodies. This reduces harm inform of pollutants
e.g. chemical and thermal forms.• Practice of in-situ and ex-situ conservation of wild plants which
involves conservation of flora in their natural habitats and outside the natural
habitats respectively. This requires setting up measures that protect areas
such as national parks and game reserves. The ex-situ conservation of plants
uses the areas such as; pollen banks, DNA banks, seed banks, botanical
gardens, tissue culture banks among others.• Ensure the recycling of wastes: These wastes include; plastics, paper bags
that have resulted to tones of garbage. Recycling entails re-manufacturing of
already used materials. This reduces the amount of waste available reducing
soil and water pollution.• Practice crop rotation: Planting the same crops for a long period of time
reduces soil fertility. The practice of crop rotation will restore and maintain
soil fertility thus conserving the soil.• Construction of terraces in sloping land: This will prevent soil erosion as
water tends to run downhill.Application activity 1.51. You live in place which is dominated by sloping lands and bare soil then
your parents complain about their soil that is washed away by the rainfall.
What can you do to help your parent to prevent that sloping land?2. The water bill at your home is always high and you are given a responsibility
to reduce it as some who attended secondary school. Implement the measures
that will reduce that water bill at your home.1.6 Non-renewable natural resourcesActivity 1.6Observe the figures and respond to the following questions: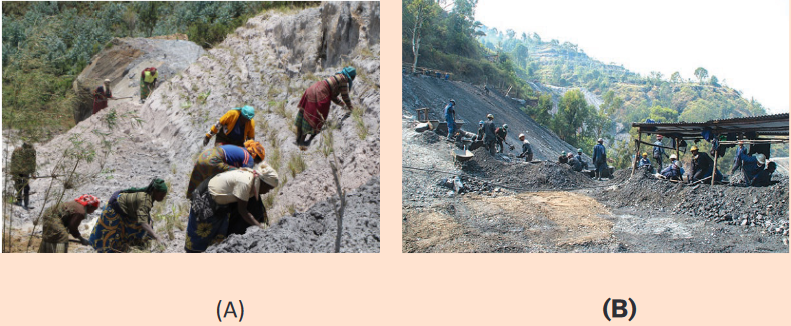 a) Based on the on figures above identify the activities that are taking place
on both A and B.
b) Identify the effects of activity taking place on figure B.
c) Find out the purpose of activity taking place on figure A.Non-renewable natural resource are resources of economic value that cannot
be readily replaced by natural means on a level equal to its consumption.
They include fossil fuels, oil, coal natural gas cited among many others as it is
indicated below: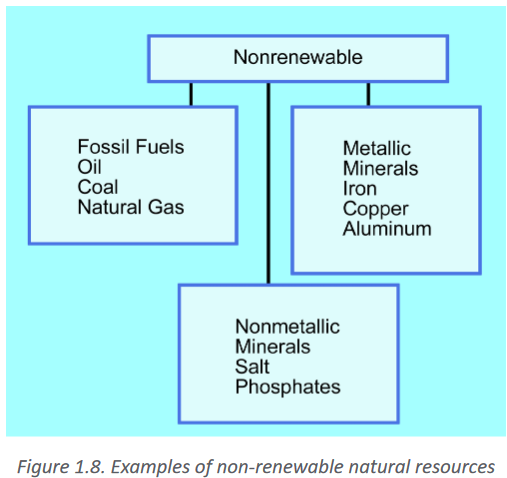 1.6.1 Importance of nonrenewable natural resources in
economic growth of Rwanda• Minerals including gravel, metals, sand, and stones are used for construction
and for income generation for the country.
• Imported fossil fuels derivatives such as gas oil and asphalts are used
as source of energy and construction of asphaltic roads to easy the
transportation.
• Natural gas e.g. gas methane from Kivu is used as source energy.
• Some animals including; mountain gorillas in Volcanoes National Park,
lions in Akagera National Park and many other wild animals contribute to
economic development of the country through tourism.1.6.2 Methods of conserving nonrenewable natural
resourcesThere are various a methods used for conservation of nonrenewable natural
resources and they include:
• The use of alternative sources of energy such as solar and wind energy because
they do not produce harmful gases that damage the ozone layer compared to
the burning of fossils fuels such as coal and charcoal.
• Use pipelines to transport oil: During oil transportation on ships, spills can
happen which will negatively affect both plant and animal life. Therefore, use of
pipelines is more recommended
• Putting in place of policies and regulations to prevent poaching
because poachers continue to kill many animals such as; elephants and rhinos,
for their tusks and skins which are sold off in the black market. Poachers are a
major threat to our biodiversity as they are slowly making some species extinct.
• Use of bio-fuels and biogas: For more than a century, fossil fuels have
been a major source of energy. However, they are depleting rapidly, this calls
for alternative sources of fuel such as bio-fuels and biogas which mainly reduce
the occurrence of air pollution.
• Establish special schemes to preserve endangered plant and animal
species: This includes; botanical gardens, sanctuaries that may be established
to protect the endangered species so that they can be available for future
generationApplication activity 1.61) Different industries are making cars and motorcycles that use electricity
instead of fuel. What is the contribution of that method compared to
the one that uses fuel?2) Why does mining companies that extract minerals legally, are obliged
to restore the mining site after the completion of extraction of minerals
at that mining company.Skills lab 1Biogas is a type of biofuel that is naturally produced from the decomposition
of organic waste. When organic matter, such as food scraps and animal
waste, break down in an anaerobic environment (an environment absent of
oxygen) they release a blend of gases, primarily methane and carbon dioxide.
People are encouraged to use biogas in their home as alternative source
of energy. This can reduce the rate of deforestation which can result in
maintenance of plant and animal species as well as soil protection against
erosion. Sensitization can be a tool to help people to have these alternative
sources of energy in large number.Procedure
– Select 10 families at your village.
– Record the families that have biogas.
– Select other ten families which use woods in cooking.
– Record the money spent by each family while cooking either using
biogas or woods
– Compare the money spent by each family
– Prepare action of sensitizing people on using biogas based on
recorded data.Evaluation sheet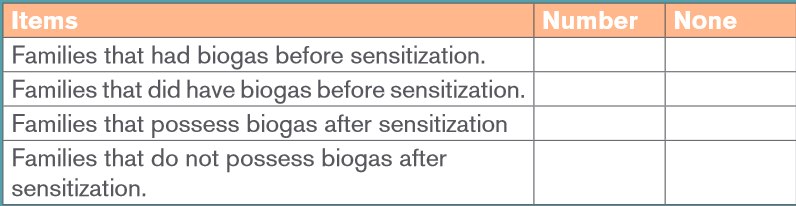 End unit assessment 1I. Choose the letter of the answer that best complete each statement
1. During population growth
a) Birth rate increases
b) Death rate increases
c) Birth rate decreases.
d) Birth rate and death rate decreases.2. Population that reaches the carrying capacity of its environment is
said to have reached
a) logistic growth
b) exponential growth
c) density dependence
d) a steady state3. On a logistic growth curve, the portion of the curve in which the
population grows rapidly is called
a) logistic growth
b) a steady state
c) exponential growth
d) carrying capacity4. Which of the following is a characteristic of developing countries?
a) A fast population growth due to a high death rate but higher birth rate.
b) A fast population growth due to a high birth rate but falling death rate.
c) A slow population growth due to a low birth rate and falling death
rate.
d) A slow population growth due to a low birth rate and low death rate.5. Which of the following would be an example of population density?
a) 100 caterpillars
b) 100 caterpillars per mango tree
c) 100 caterpillars clumped into 5 specific areasII. Open questions
1. How can a density dependent factor, such as a food supply affect the
carrying capacity of a habitat?
2. Describe how density dependent and density dependent factors regulate
population growth.
3. Suggest the reasons why the luck of available clean water could be a
limiting factor for a country’s population.
4. a) Distinguish between carrying capacity and biotic potential.
b) Explain how environmental resistance affects the population growth.
5. Students made a survey of blackjack (Bidens pilosa) growing their school
environment. Ten quadrats of 1.0 m2 were placed randomly in the garden
and the number of blackjack plants in each quadrat was counted.
The results are summarized in the following table: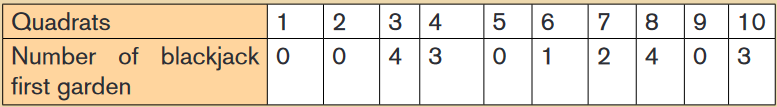 Calculate: a. the species frequency of blackjack in this gardens.
b. The species density of blackjack plants in that area.
c. Explain why it is important to use randomly placed quadrats.6. Describe how has the growth of Earth’s human population has changed
in 2 recent centuries? Give your answer in terms of growth rate and the
number of people added each year?7. Construct a bar graph showing the age structure of a given country
using the following data: Pre-reproductive years (0-14) are 42 percent;
reproductive years (15-44) are 39 percent; post-reproductive years (45-
85+) are 19 percent. Interpret obtained graph.8. Explain the relationship between a growing population and the environment9. Observe the pictures below and respond to the following questions.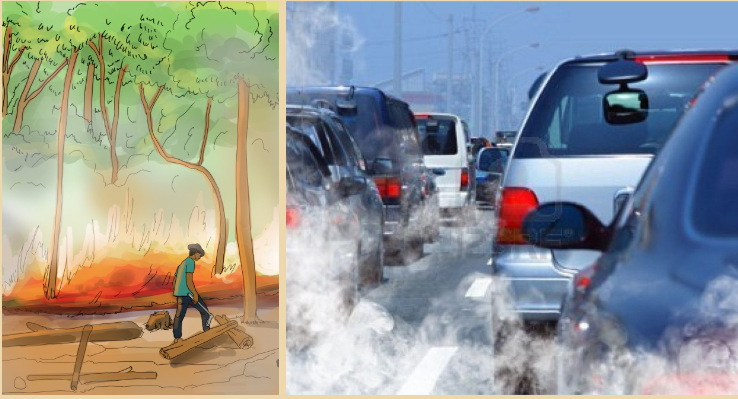 a) Identify the human activities shown above that harm the natural
resources.
b) Describe all effects of the identified activities on the environment.
c) Suggest the possible measures to solve the above problems.