General
- Y1: Integrated Science SME File Uploaded 17/08/22, 09:33
- Y1: Integrated Science SME TG File Uploaded 17/08/22, 09:35
UNIT 2: INTRODUCTION TO BIODIVERSITY
Key Unit competence: Explain how biodiversity is threatened by
climate change and human activities.Introductory Activity 2
Study the figure below and answer the asked questions: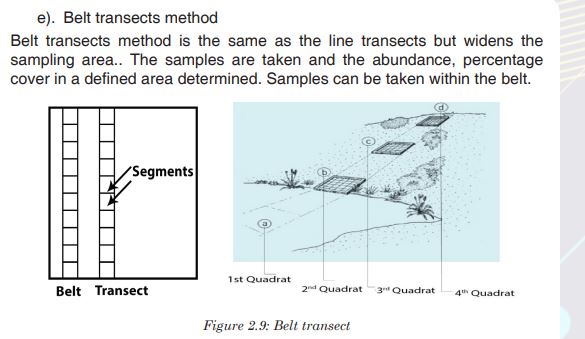
a). List all living things that are available in figure 2.1.
b). Explain how each organism in the figure can be affected by
another.
c). Talk on how organisms in the figure can be affected by the
physical environment in which they live.
d). What would you suggest to study in this unit?2.1. Ecological terms: Species, Ecosystem, Niche,
Population, Community and Biodiversity
Activity 2.1
Based on other biological concepts learnt in previous studies, give the
meaning of the following ecological terms:
a) Species b) Ecosystem c) Niche d) Population e) Community
f) Biodiversity?Species is a group of closely related organisms which are capable of
interbreeding to produce fertile offspring. Occasionally two organisms which
are genetically closely related but not of the same species can interbreed
to produce infertile offspring. For example, a cross between a donkey and
a horse, produces a mule, which is infertile. Hence, a donkey and a horse
do not belong in the same species. Another example includes lions and
tigers belonging in different species. However, when a male tiger mates
with a female lion they can have fertile offspring called tiglons, although the
offspring of female tigers and male lions called ligers are not fertile. Note that
normally tigers are forest dwellers and lions are plains dwellers and they are
ecologically isolated. Breeding has only been observed in captivity.Ecological population is a group of individuals of the same species which live in a particular area at any given time.
Ecological community consists of populations of different species which live in the same place at the same time, and interact with each other.
A Habitat is a specific area or place in which an individual organism lives. When a habitat is very small it is regarded as a microhabitat.
Within the habitat, an ecological niche is the status or the role of an
organism in its habitat or the mode of life of an organism within its habitats.
For example, insects are pollinating agents and preys of insectivores.Two
important aspects of a species’ niche are the food it eats and how the food is obtainedThe picture below is of birds that occupy different niches. Each species eats a different type of food and obtains the food in a different way.Example: Each of these species of birds has a beak that suits it for its niche. For example, the long slender beak of the nectarivore allows it to sip liquid nectar from flowers. The short sturdy beak of the granivore allows it to crush hard, tough grains.
In an environment, communities are influenced either by abiotic components, also called abiotic factors. These are the non-living physical aspects of the environment such as the sunlight, soil, temperature, wind, water, and air.
Communities are also influenced by biotic components, or biotic factors.
These are the living organisms in the environment.An ecosystem is a collection of all the organisms that live together in a
particular place, together with their nonliving, or physical environment.
A biome is a group of ecosystems that have the same climate and similar
dominant communities.The biosphere is the whole of the earth’s surface, the sea and the air that is inhabited by living organisms. The highest level of organization is the entire biosphere.
Biodiversity is defined as the full range of variety and variability within and among living organisms and the ecological complexes in which they occur. In other words, biodiversity is the variety of life. It refers to the totality of the species including the genetic variation represented in the species populations, across the full range of terrestrial organisms, including vertebrates and invertebrates, Protista, Bacteria and plants
Importance of biodiversity
Biodiversity contributes to ecosystem goods and services. The ecosystem goods and services include:
• Provision of food, air, fire wood, medicines, energy, fresh water.
• Nutrient cycling such carbon, water and nitrogen cycles by
microorganisms and primary production by photosynthesis.
• Cultural or aesthetic service recreation, ecotourism, cultural and
religious inspiration.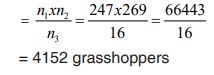

Threats of biodiversity
The main causes of biodiversity loss can be attributed to the influence of
human activities on ecosystems. Threats to biodiversity may include:a). Habitat loss and the degradation of the environment
The habitat loss and the degradation of the environment occur in different ways.The most occurring, are tree cutting, agriculture and fires. These human
activities lead to the alteration and loss of suitable habitats for biodiversity. As a consequence, there is a loss of plant species as well as the decrease in the animal species associated to this plant diversity.b). Introduction of invasive species and genetically modified organisms
Species originating from a particular area are harmful to native species
also called endemic species when they are introduced into new natural
environments. They can lead to different forms of imbalance in the ecological equilibrium, so that endemic species may fail to compete with introduced species, and they may affect the abundance and distribution in natural habitat.c). Pollution
Human activities such as excessive use of fertilizers, and increased pollutants from industries and domestic sewage affect biodiversity. They contribute to the alteration of the flow of energy, chemicals and physical constituents of the environment and hence species may die as a result of toxic accumulation.d). Overexploitation of natural resources
Increased hunting, fishing, and farming in particular areas lead to the decrease and loss of biodiversity due to excessive and continuous harvesting without leaving enough time for the organisms to reproduce and stabilize in their natural habitat.e). Climate change
This is a change in the pattern of weather, related changes in oceans, land surfaces and ice sheets due to global warming resulting from man’s activities. Increasing global temperatures have resulted into melting of icebergs raising sea levels and so flooding coastal areas eventually affecting the niche, and these may take the lives on many living things.Consequences of loss of biodiversity
They are various consequences of loss of biodiversity that include:
• Desertification, is thought by scientists to be a consequence of climate
change, has been considered to be related to deforestation. Disrupting
water cycles and soil structure results into less rainfall in an area.
• Floods as a result of rising sea levels.
• Habitat destruction for extensive farming, timber harvesting and
infrastructure and settlement.
• Decrease in food production as result of change in pattern of weather
that affects productivity
• Large scale deforestation has a negative effect on nutrient recycling
and can accelerates soil erosion.
• Diseases that come as effects of floods and malnutrition due to famineIdentification of biodiversity
Biodiversity can be categorized into three groups:
• Genetic diversity: The combination of different genes found within
a population of a single species, and the patterns of variation found
within different populations of the same species. These variations are
caused by the gene mutations or chromosomal mutations which create
differences in individuals of the same species.• Species diversity:This is concerned with variation in number of
species and their relative abundance in an area in which they inhabit.
All species are different from each other. These could be structural
differences, such as the difference between a mango tree and a cow.
They could also be functional differences, such as the differences
between bacteria that cause decay and those that help us to digest
food. The variation in the relative abundance of species within a habitat
may be caused by different factors, mainly environmental factors which
can affect their rate of reproduction.• Ecosystem diversity: This is concerned with variations in ecosystems
or habitats that occur within a region. Environmental factors like climate
change may cause diversity of habitats or systems within a region.Application activity 2.1
What do you understand by:
a). Genetic diversity
b). Species diversity
c). Ecosystem diversity
2.2. Determination of the distribution and abundance of
organisms in an areaActivity 2.2
Observe the figures below, and relate the sampling technique with figure
and discuss on methods used to determine distribution and abundance
of organism in an area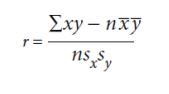
Biologists use different sampling techniques when they want to determine the distribution and abundance of organisms in area. The commonly used techniques are:
a). Random sampling method
A random sampling method is a sampling method where samples are taken from different positions within a habitat and those positions are chosen randomly. Random sampling in important to avoid the bias.b). Quadrat sampling method
A quadrat is a square area that is marked using a pre-made square of
plastic, or stakes and string and it can range in size. Different species and
their numbers within the quadrat are counted. Counting is repeated many times in different places in the habitat to get an accurate representation of biodiversity.c). Frame quadrats
Frame quadrats are small plot used to isolate a standard unit of area for
the study of the distribution of an item over a large area. While originally


g). Capture -recapture technique
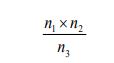
This method is useful for sampling non-fixed population and is suitable for animal such as fishes, birds, lizards and insects. A sample of the population to be studied is first captured and each individual is marked with a spot for identification. These are then released and given enough time to mix up with the rest of the members in the habitat. After a certain period of time, another sample is taken. During the mark-release-recapture technique, the total population can be estimated by the use of the formula: n1xn2/n3
where n1 is a number caught and marked in first sample, n2
is a number caught in second sample n3 is a number in the second sample that had been marked.
To understand this application, let us use the following example:
A team of students used a sweep net to sample brown grasshoppers
and each collect insect was marked with a very small spot of non-toxic
waterproof paint and then they were released in the field. The next
day, a second large sample was conducted and data were recorded
as follows: number of caught and marked in first sample (n1
) = 247, number of caught in second sample (n2) = 269, and the number in the second sample that had been marked (n3) = 16. What is the number of estimated population? Solution: The estimated number:
Application activity 2.2
1. Explain the advantages of the random sampling techniques.
2. Use suitable methods, such as frame quadrats, line transects, and
belt transects, to assess the distribution and abundance of insect
species in a school garden. Record your data and use the Simpson
index of diversity (D) to calculate the diversity of collected insects.
3. Suggest the benefits of using the following sampling techniques:
a) Quadrats
b) Transect
c) Mark-capture-recapture
4. State the conditions in which quadrats, transect and mark recapture
are suitable sampling methods2.3. Spearman’s rank, Pearson’s linear correlation and Simpson’s Index of Diversity
2.3.1. Spearman’s rank, Pearson’s linear correlation
Activity 2.3.1
A student reads a questionnaire and one question was difficult for him to answer. The question asked to explain the process of Spearman’s ranking and Pearson’s linear correlation. As the one who is learning biology, assist him to answer correctly such question by doing research in different necessary resources and prepare complete related information in your exercise.
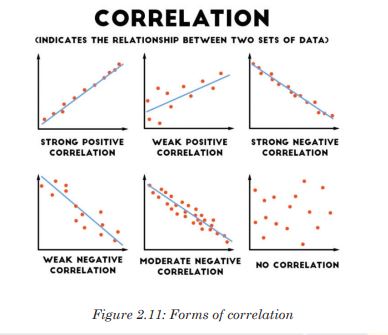
To decide if there is an association between collected data, a correlation coefficient is calculated and plot scatter graph drawn in order to make a judgment. The strongest correlation is present for studied items when all the points lie on a straight line. In this case, there is linear correlation, and the correlation coefficient equals 1.
If a given variable X increases so does another variable Y, the relationship is a positive correlation. If a variable X increases while the variable Y decreases, then the relationship is a negative correlation. A correlation coefficient of 0 means that there is no correlation at all. These correlation coefficients are ways to test a relationship observed and recorded to see if the variables are correlated and, if so, to find the strength of that correlation.
a). Spearman’s rank correlation coefficient
When collected data are not quantitative, but used an abundance scale or when the researcher is not sure if quantitative data are normally distributed. It might also be possible that a graph of results shows that the data are correlated, but not in a linear fashion. In this case, the Spearman’s rank correlation coefficient is used. It involves ranking the data recorded for each variable and assessing the difference between the ranks. You should always remember that correlation does not mean that changes in one variable cause changes in the other variable.b). Pearson’s correlation coefficient
Pearson’s correlation coefficient can only be used where there might be
a linear correlation and when there are collected quantitative data as
measurements (for example, length, height, depth, and light intensity, mass) or counts (for example number of plant species in quadrats). The data must be normally distributed.
Where:
r is the correlation coefficient
x is the number of species in a quadrat
y is the number of species in the same quadrat
n is the number of readings (From1 to n)
x is the mean number of species
ȳ is the mean number of species
sx is the standard deviation for x
sy is the standard deviation for y2.3.2. Simpson’s Index of Diversity (D)
Activity 2.3.2Visit your smart classroom and download and analyze the videos that
explains
a). The purpose of calculating the Simpson diversity index.
b). How to calculate Simpson index D, Simpson index of diversity
and Simpson reciprocal index.The Simpson diversity index is among indices used to measure diversity. It is expressed in three related indices namely Simpson index, Simpson index of diversity and Simpson reciprocal index.
a). Simpson index D
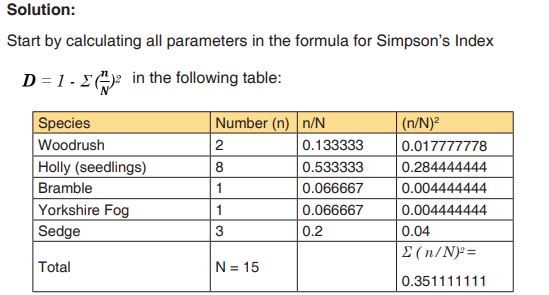
Simpson index D can be expressed in two ways and takes into consideration the total number of organisms of a particular species and the total number of organisms of all species. It is calculated as follows:
D =1-∑ (n/N) 2 with n: the total number of organisms of a particular species and N: the total number of organisms of all species. When the index equals or is nearby 0 there is an infinite diversity of considered species. When it equals or is nearby 1, this means that there is no diversity. The bigger the value of D, the lower the diversity and small is D, bigger is the diversity.b). Simpson index of diversity 1 - D
The value of this index also ranges between 0 and 1, but now, the greater the value, the greater the sample diversity. This makes more sense. In this case, the index represents the probability that two individuals randomly selected from a sample will belong to different species.c). Simpson reciprocal index 1 / D
Another way of overcoming the problem of the counter-intuitive nature of Simpson’s index is to take the Simpson’s reciprocal index 1/D. The value of this index starts with 1 as the lowest possible figure. This figure would represent a community containing only one species. The higher the value, the greater the diversity.Example:
1. In a woodland, a quadrat was sampled for ground vegetation. Data
collected were recorded in the table 1.3.2. Find out the value of
the Simpson index and draw the conclusion about the biological
diversity of the sampled area.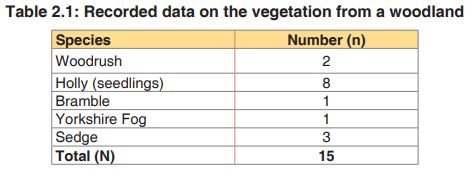

Putting the figures into the formula for Simpson’s Index and replace each
letter by its respective value, the Simpson index shall be: D = 1 – 0.3511111= 0.648888889
Based on the theory above, the quadrat presents a higher diversity because the value of D is nearby zeroApplication activity 2.3
1. In which conditions results can you conclude that there is:
a) A positive correlation?
b) A negative correlation?
c) Non-correlation.
2. Explain the difference between species richness and species
evenness
3. Suggest what precautions you may need to take when measuring
populations of aquatic animals or plants.
4. explain why a habitat with high diversity tends to be more stable than
one with lower diversity.
5. In a survey of trees in a tropical forest, students identified five tree
species (A to E). They counted the numbers of trees in an area
100m×100m and found these results: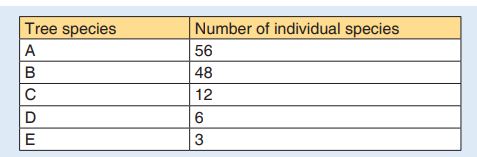
Calculate the Simpson’s Index diversity for identified species
and explain the advantage of using data on species diversity and
abundance when calculating an index of diversity.6. The Simpson’s Index of diversity for vegetation in an open area
inhabited by grasslands was 0.8. For a similar sized area of vegetation
beneath some conifer trees it was 0.2. What do you conclude from
these results?Skills lab 2
Visit your school garden and sample into two areas A and B each with 25
cm2 by using one of the sampling technics. Calculate the Simpson’s diversity index for the two samples, and indicate which one is more diverse than another. For each sample, consider 5 more abundant species only.End unit assessment 2
1. Explain what is meant by a habitat.
2. Make a list of all the habitats you can see in your school compound.
3. Explain why we share so many of our genes with plants.
4. Discuss the contribution of ecosystems to cultural traditions in
Rwanda.
5. Pollution is one of the causes of aquatic biodiversity loss:
a) What do you understand by water pollution?
b) Outline human activities that contribute to water pollution
c) Discuss how polluted water affects aquatic living organisms?
6. Relate desertification with biodiversity loss.
7. Discuss on importances of biodiversity.
8. Distinguish between:
a) Community and population
b) Ecological niche and habitat
9. Describe the two main components of an ecosystem.
10. Calculate the value of Simpson’s Diversity Index (D) for a single
quadrate sample of ground vegetation in woodland from which
the following sampling date was obtained, and conclude about the
diversity of plants in the woodland: