General
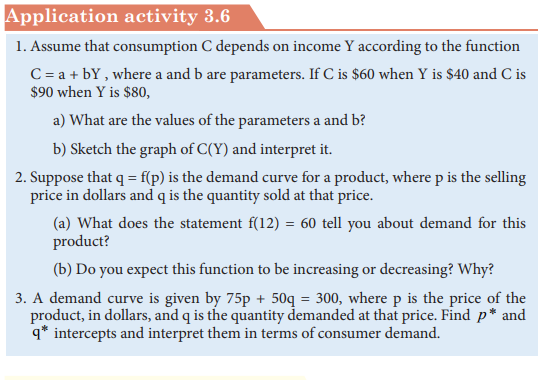
- Y1: Mathematics SSE SB File Uploaded 17/08/22, 10:06
- Y1: Mathematics SSE TG File Uploaded 17/08/22, 10:10
UNIT 3:GRAPHS AND FUNCTION
Key unit Competence: Apply graphical representation of
function in economics models
3.0. Introductory Activity 3
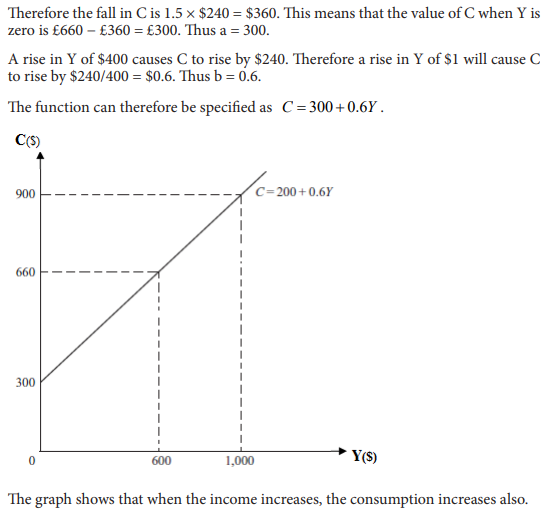
Suppose that average weekly household expenditure on food C depends on average
net household weekly income Y according to the relationshipC Y = + 12 0.3 .
a) Can you find a value of Y for which C is not a real number?
b) Complete a table of value from Y= 0 to Y= 10 and use it to draw the graph of
C Y = + 12 0.3
c) If Y=90, what is the value of C?
3.1 Generalities on numerical functions
Activity 3.1
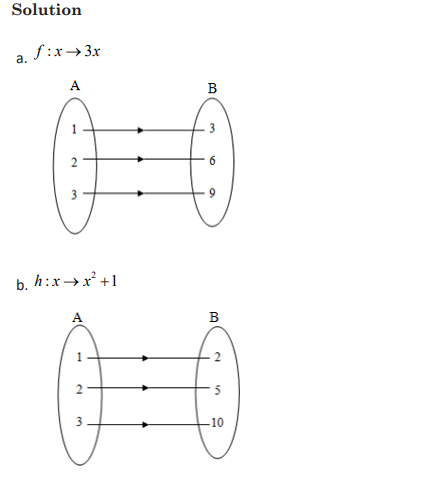
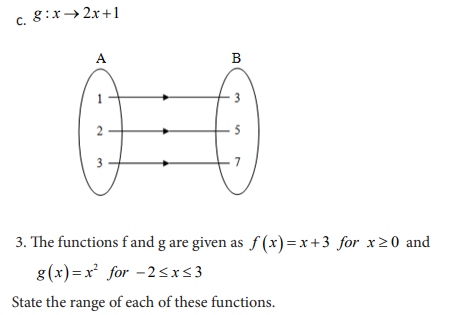
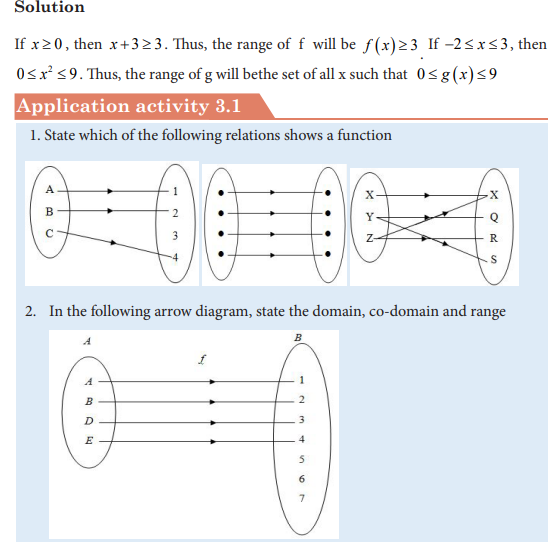
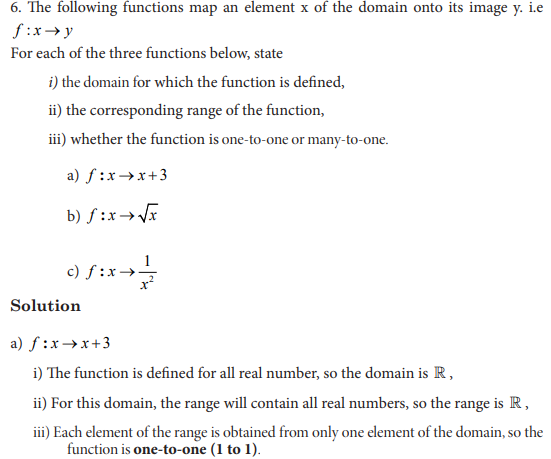
In following arrow diagram, for each element of set A state which element of B
is mapped to it.
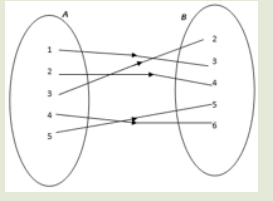
a) What is the set of elements of A which have images in B?
b) Determine the set of elements in B which have antecedent in A.
c) Is there any element of A which has more than one image?
A function is a rule that assigns to each element in a set A one and only one element
in set B. We can even define a function as any relationship which takes one element
of one set and assigns to it one and only one element of second set.
If x is an element in the domain of a function f, then the element that f associates with
x is denoted by the symbol f x
(read f of x) and is called the image of x under f or
the value of f at x.
The set of all possible values of f x
of f and it is denoted R f
The set of all values of A which have images in B is called Domain of f and denoted
Domf .
We shall write f x
commonly used for this purpose are f, g and h.
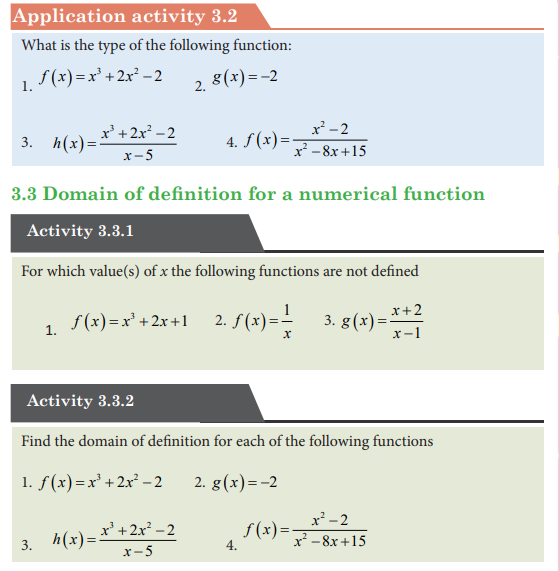
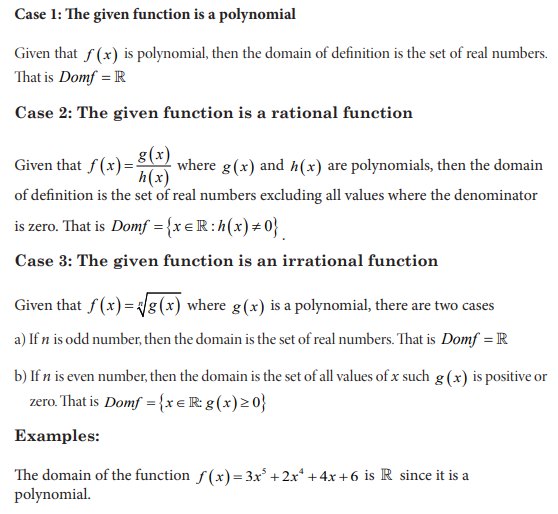
3.2 Types of functions
Activity 3.2
Differentiate rational from irrational numbers. Guess which of the following
functions is a polynomial, rational or irrational function


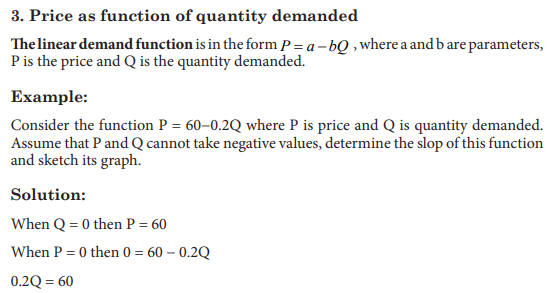
1. Price as function of quantity supplied
The quantity Q of an item that is manufactured and sold depends on its price P. As
the price increases, manufacturers are usually willing to supply more of the product,
whereas the quantity demanded by consumers falls.
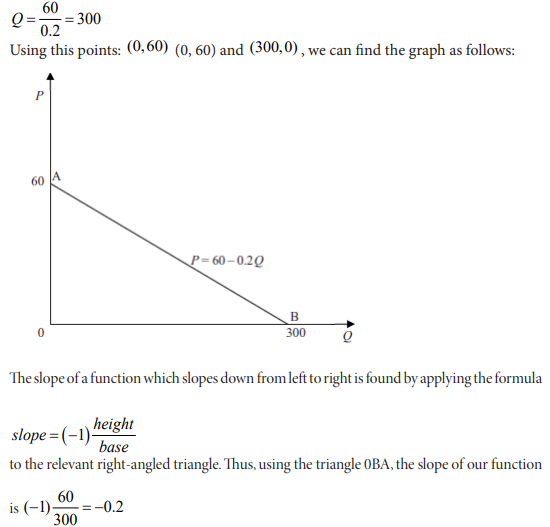
The supply curve, for a given item, relates the quantity Q of the item that manufacturers
are willing to make per unit time to the price P for which the item can be sold.
The demand curve relates the quantity, q, of an item demanded by consumers per
unit time to the price P of the item.
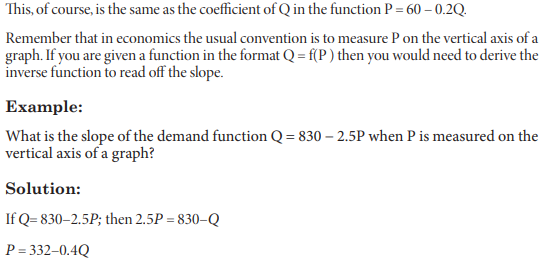
Economists often think of the quantities supplied and demanded Q as functions of
price P. However, for historical reasons, the economists put price (the independent
variable) on the vertical axis and quantity (the dependent variable) on the horizontal
axis. (The reason for this state of affairs is that economists originally took price to be
the dependent variable and put it on the vertical axis.
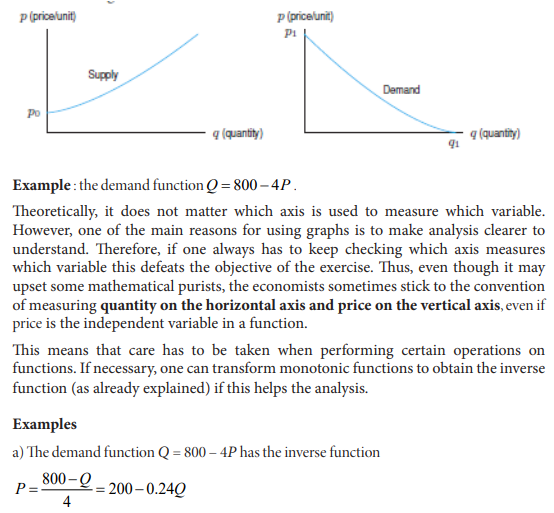
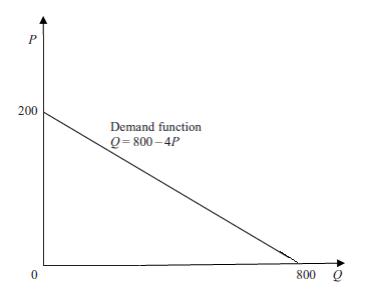
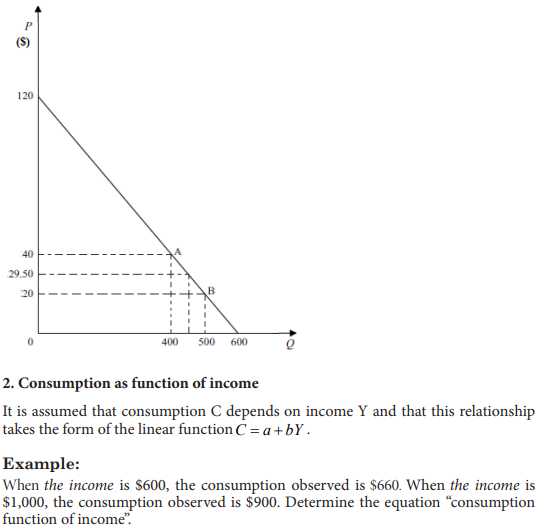
This figure shows that when the quantity Q is increasing, the price P reduces
progressively. This can be caused by the fact that every consumer has sufficient
quantity of goods and does not want to by any more.
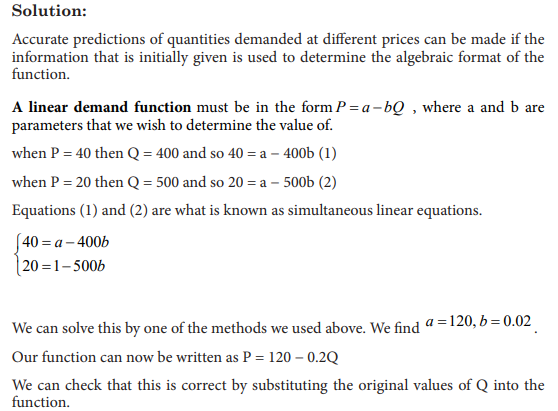
b. Suppose that a firm faces a linear demand schedule and that 400 units of output
Q are sold when price is $40 and 500 units are sold when price is $20. Once these
two price and quantity combinations have been marked as points A and B, then
the rest of the demand schedule can be drawn in. Use this data to determine the
function that can help to predict quantities demanded at different prices and draw
the corresponding graph.