Topic outline
General
- Y1: Mathematics SSE SB File Uploaded 17/08/22, 10:06
- Y1: Mathematics SSE TG File Uploaded 17/08/22, 10:10
UNIT 1:ARITHMETICS
Key Unit competence: Use arithmetic operations to solve simple real life problems
1.0. Introductory Activity
The simple interest earned on an investment is I prt = where I is the interest earned, P is the principal, r is the interest rate and t is the time in years. Assume that 50,000Frw is invested at annual interest rate of 8% and that the interest is added to the principal at the end of each year.
a. Discuss the amount of interest that will be earned each year for 5 years.
b. How can you find the total amount of money earned at the end of these 5 years? Classify and explain all Mathematics operations that can be used to find that money.
1.1 Operations of real numbers and their properties
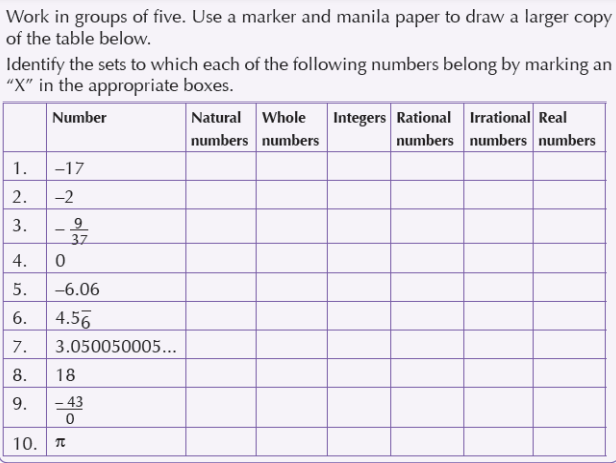
1.1.1. Sets of numbers
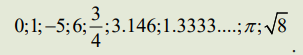
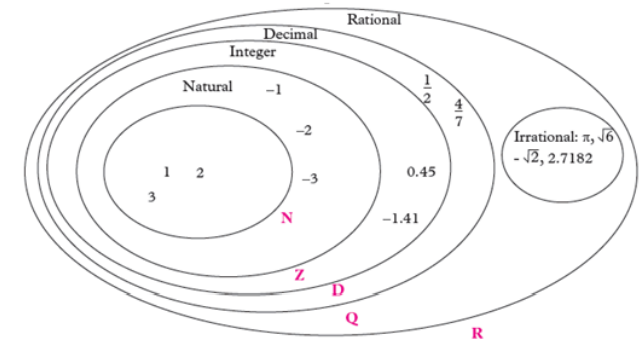
a. Carry out research on sets of numbers to determine the meanings of natural numbers, integers, rational numbers and irrational numbers. Use your findings to select the natural numbers, integers, rational numbers and irrational numbers in the list of the numbers given below:
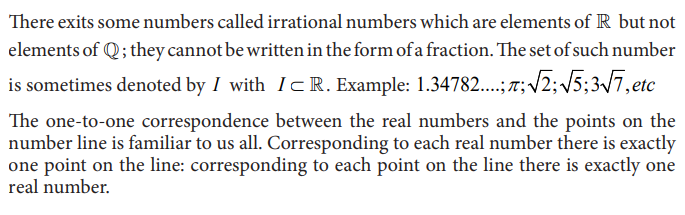
b. From (a) deduce the definition of the set of real numbers.
c. Given any 3 real numbers a b and c , of your choice, discuss the following:


Application activity 1.1.1
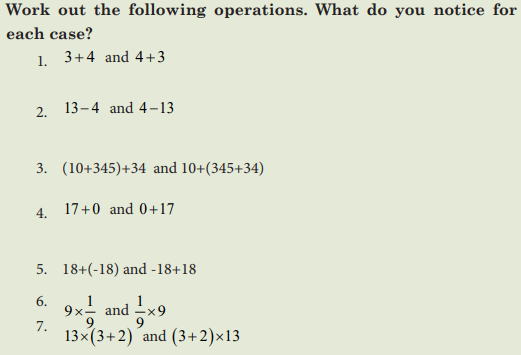
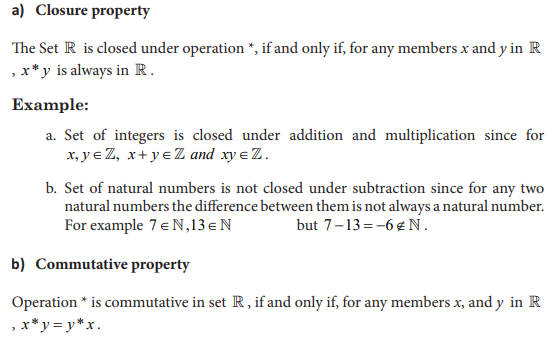
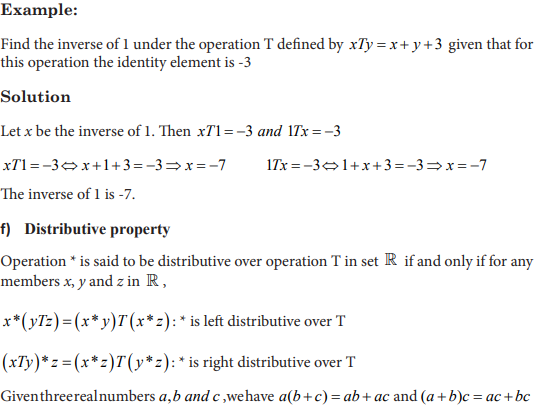
1.1.2 Properties of operations in the set of real numbers
Activity 1.1.2
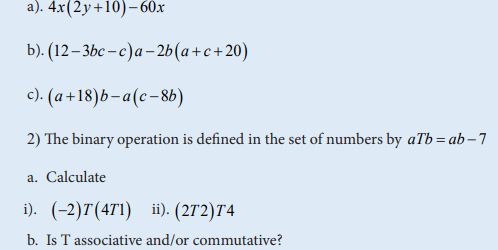
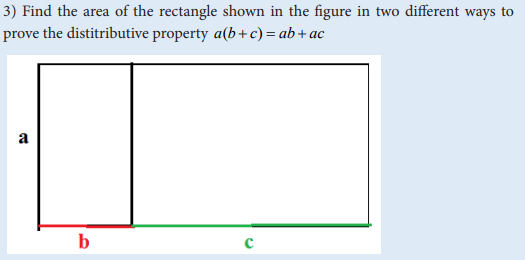
Application activity 1.1.2
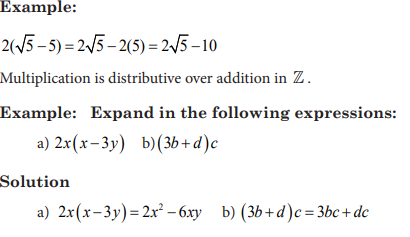
1) Use the distributive property to simplify
1.2 Fractions and related problems
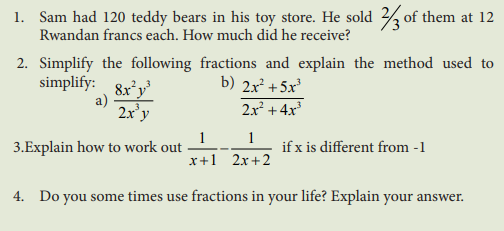
Activity 1.2
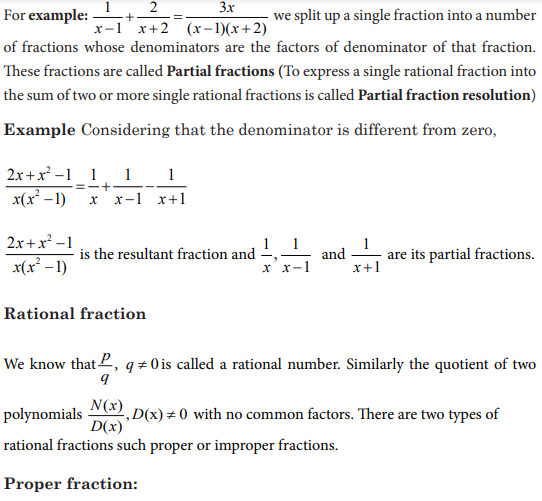
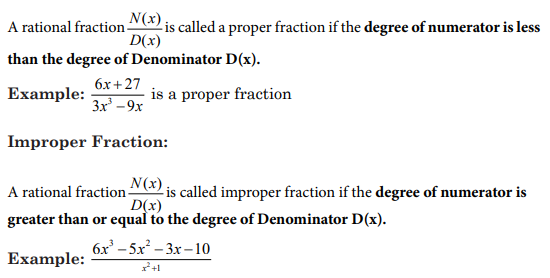
An algebraic fraction exists only if the denominator is not equal to zero. The values of
the variable that make the denominator zero is called a restriction on the variable(s).
An algebraic fraction can have more than one restriction.
Examples:
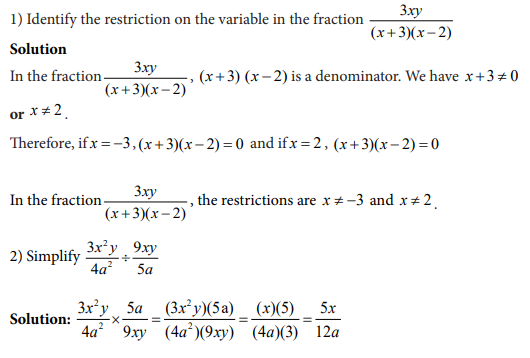
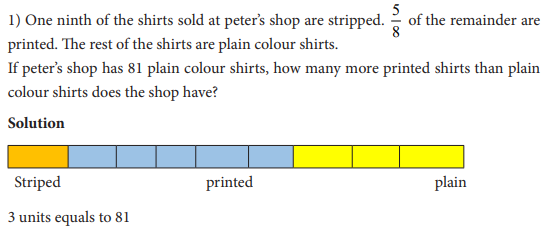
Problems related to fractions
Example
Application activity 1.2
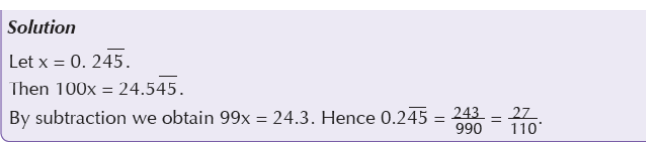
1.3 Decimals and related problems
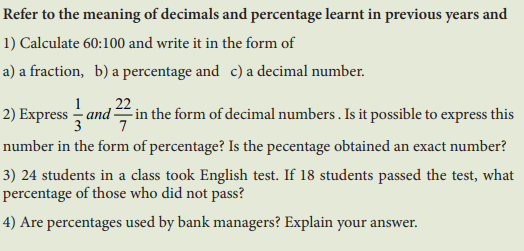
Activity 1.3
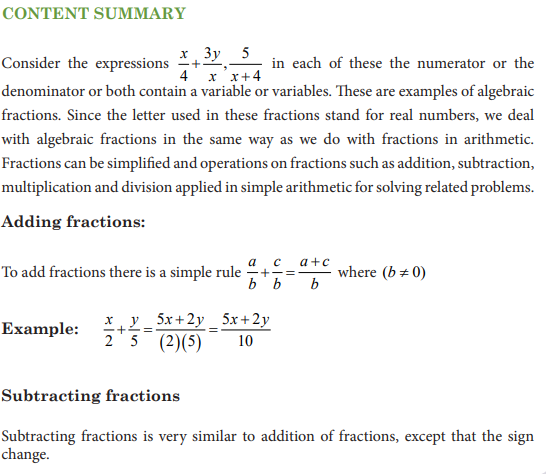
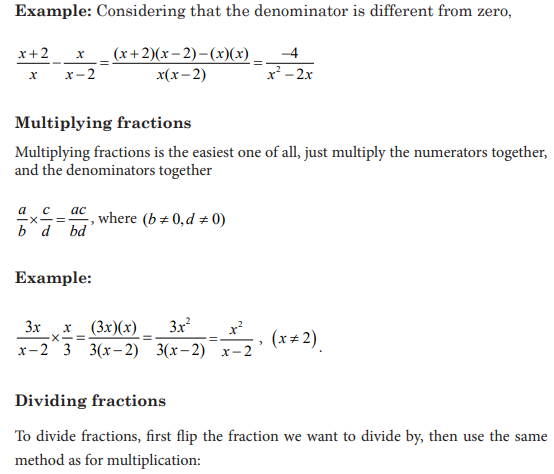
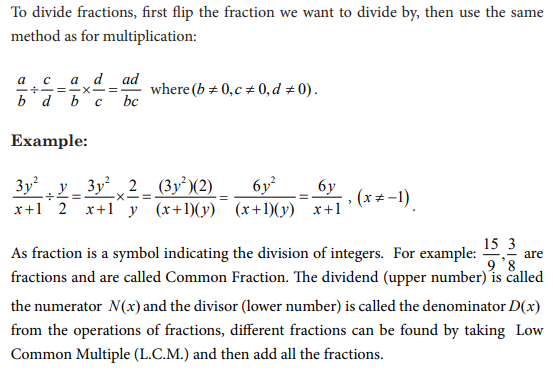
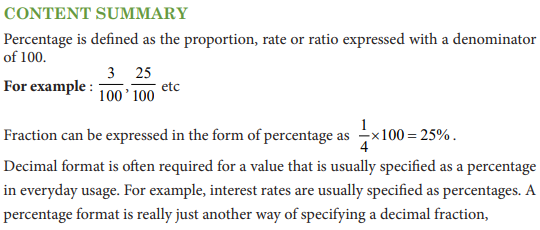
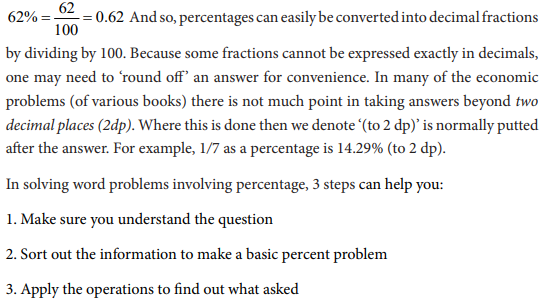
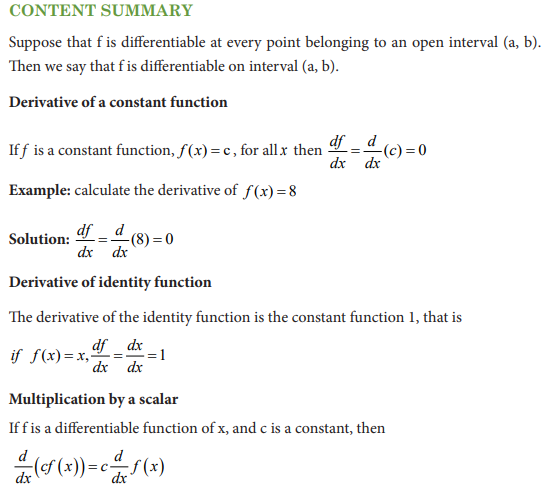
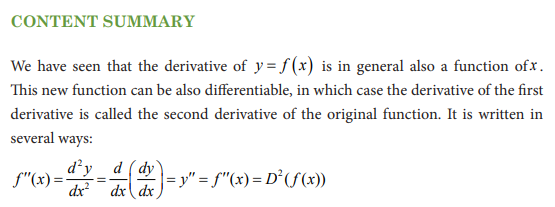
CONTENT SUMMARY
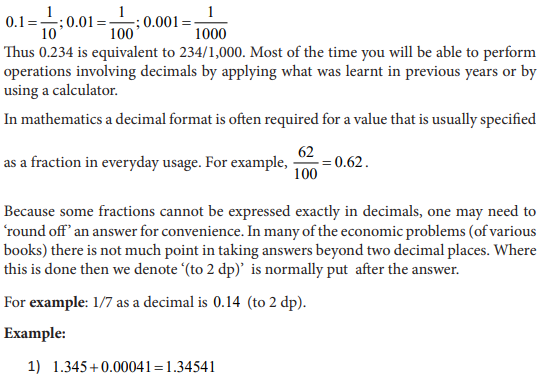
Decimals are just another way of expressing fractions
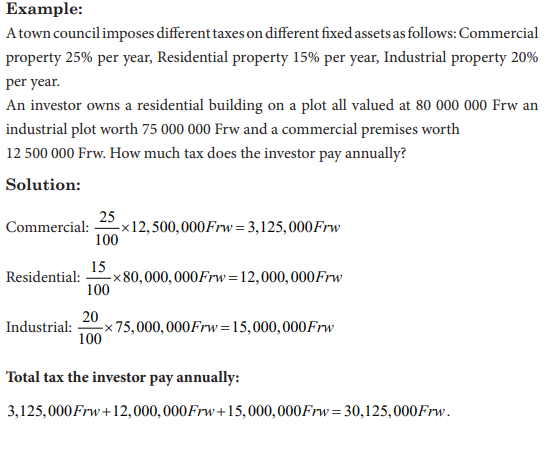
1.4 Percentages and related problems
Activity 1.4
Application activity 1.4
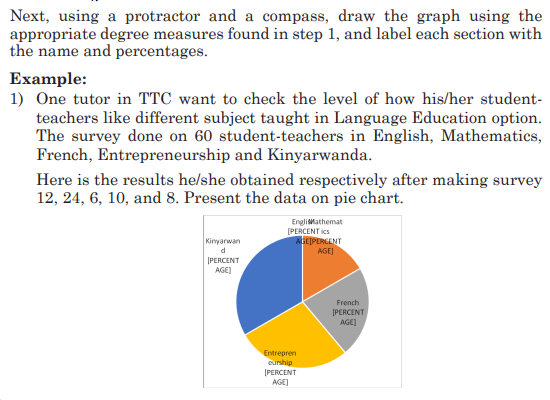
1. In the middle of the first term, the school organize the test and the tutor of
mathematics prepared 20 questions for both section A and B. peter get 80%
correct. How many questions did peter missed?
2. Student earned a grade of 80% on mathematics test that has 20 questions. How
many did the student answered correctly? And what percentage of that not
answered correctly?
3. John took a mathematics test and got 35 correct answers and 10 incorrect
answers. What was the percentage of correct answers?
4. As a future teacher, is it necessary for a student teacher to know how to
determine the percentage? Explain it with supportive examples.
1.5 Negative numbers and related problems
Activity 1.5
1. The temperature of a juice in the bottle was 0 20 C . They put this juice in the
fridge so that its temperature decreases by 0 30 C . What is the temperature of
this juice? What can you advice the child who wishes to drink that juice?

2. Suppose that you have a long ruler fixed from the hole and graduated such
that the point 0 corresponds to the ground level as illustrated on the following
figure.
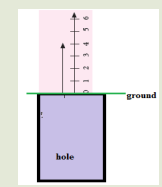
What is the coordinate of the point position for an insect which is at 3 units below
the ground level in a hole?
CONTENT SUMMARY
There are numerous instances where one comes across negative quantities, such
as temperatures below zero or bank overdrafts. For example, if you have 3500Frw
in your bank account and withdraw 6000Frw with an acceptable credit, your bank
balance is -2500Frw . There are instances, however, where it is not usually possible to
have negative quantities. For example, a firm’s production level cannot be negative.
From the above activity, you have learnt that, you can need to use negative or a
positive numbers.
For example, when measuring temperature, the value of the temperatures of the body
or surrounding can be negative or positive. The normal body temperature is about
0 +37 C and the temperature of the freezing mercury is about 0 −39 C
Example:
a) Eight students each have an overdraft (scholarship advance) of 21,000Frw. What
is their total bank balance?
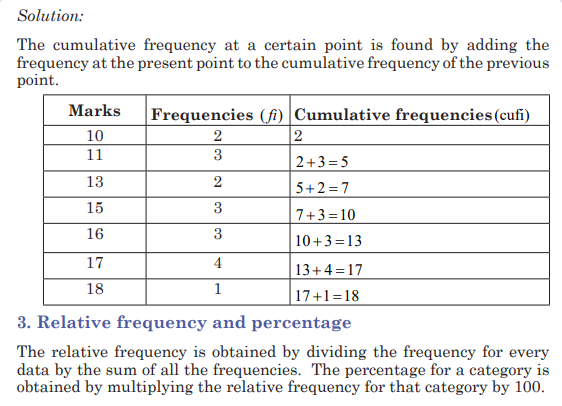
Solution:
The total balance in the bank is 8 × (−21,000) = −168,000Frw. The sign negative
means that students have the credit to be paid.
Application activity 1.5
Question1: Answer to the following questions
c) Where negative numbers are applied in the real life? Do you think that
computers of bank managers deal with negative numbers when operating loans
for clients?
Question2:
A cylinder is ¼ full of water. After 60ml of water is added the cylinder is 2/3 full.
Calculate the total volume of the cylinder.
Question3:
Between 1990 and 1997 the population of an Island fell by 4%. The population in
1997 was 201,600. Find the population in 1990.
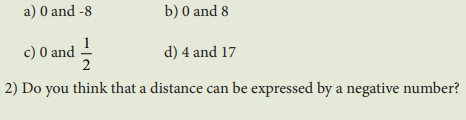
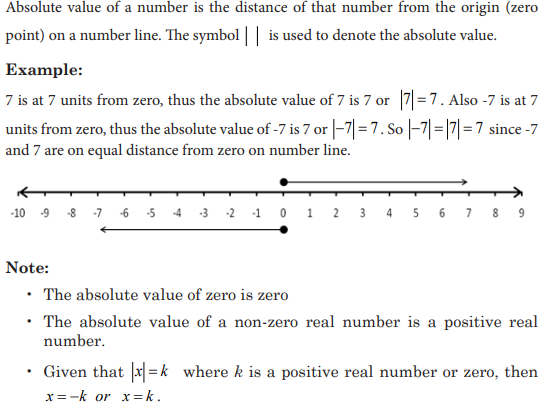
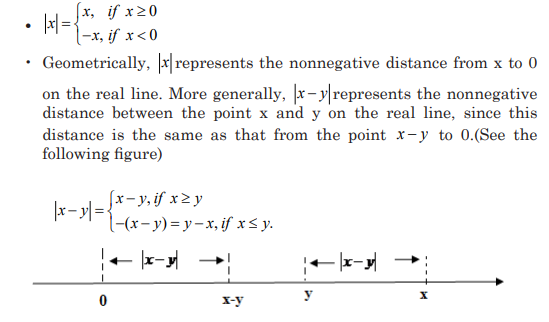
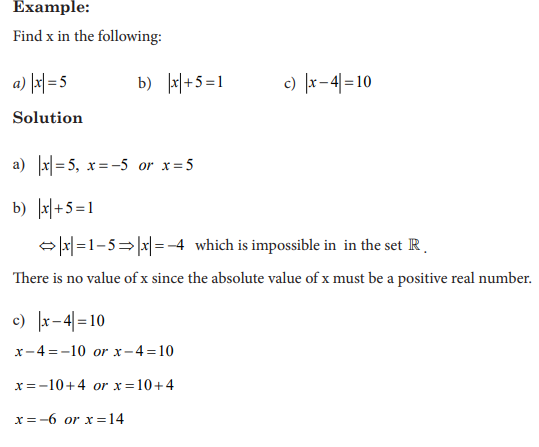
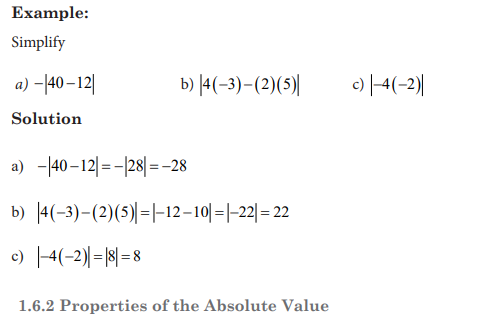
1.6. Absolute value
1.6.1 Meaning of absolute value
Activity 1.6.1
1) Draw a number line and state the number of units found between
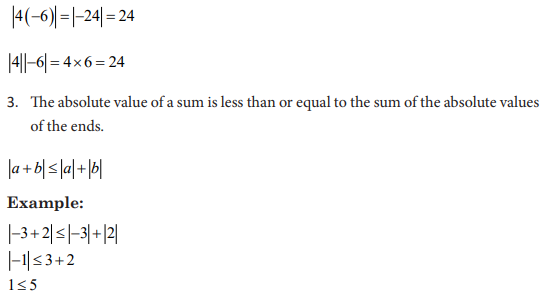
CONTENT SUMMARY
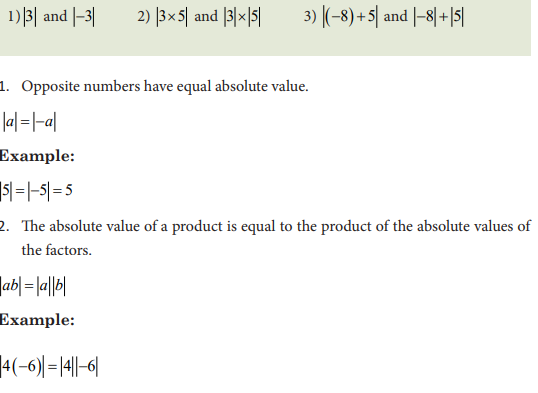
Activity 1.6.2
Evaluate and compare the following:
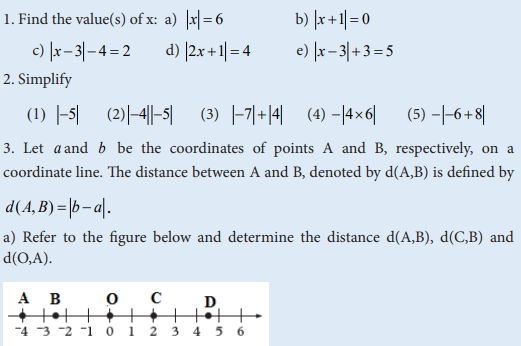
Application activity 1.6
b) Dr. Makoma went from Kabgayi to Muhanga City on foot at the constant speed
of 100m/min. If he used 60 minutes to go and 60 minutes to come back. Explain
to your colleague the distance and the displacement covered by Dr. Makoma.
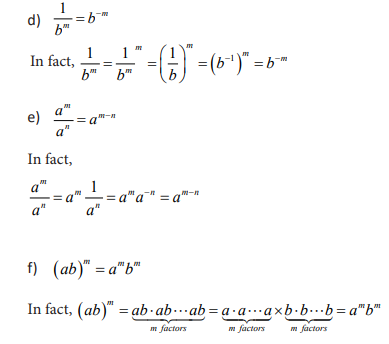
1.7. Powers and related problems
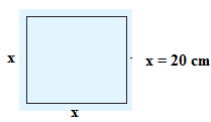
Activity 1.7
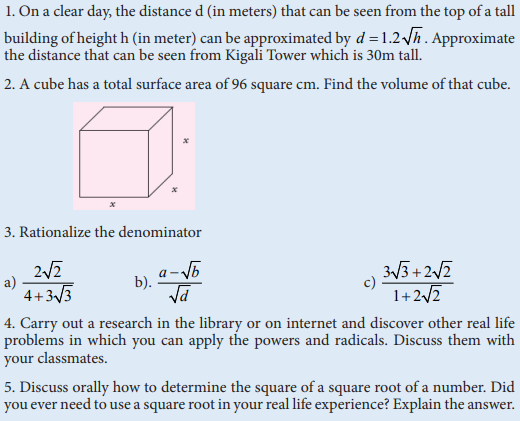
1. How can you find the area of the following paper in the form of a square?
2. Given a cube of the following form:
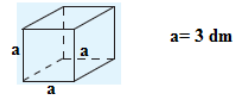
Determine the volume of this cube.
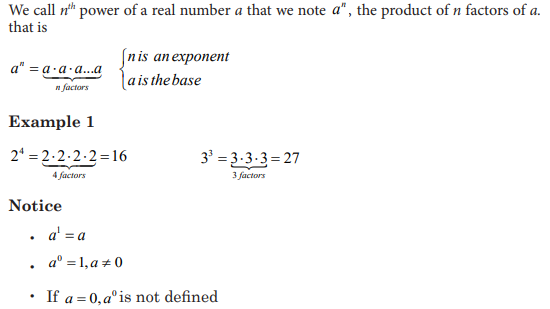
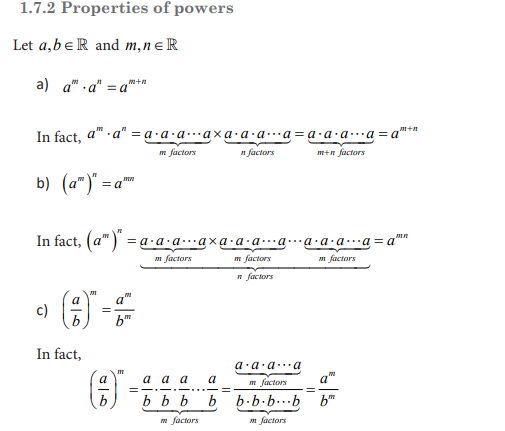
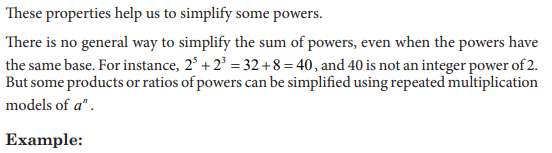
CONTENT SUMMARY
1.7.1 Meaning of power of a number
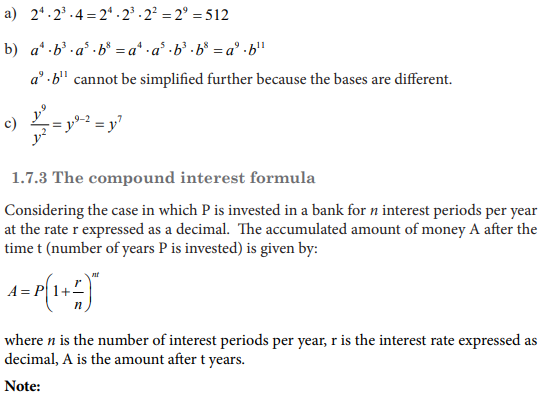
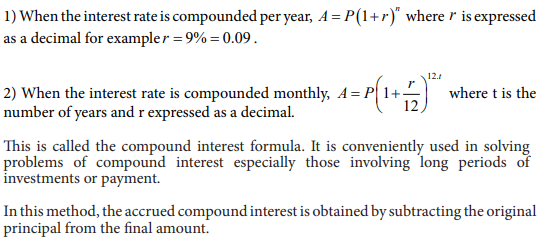
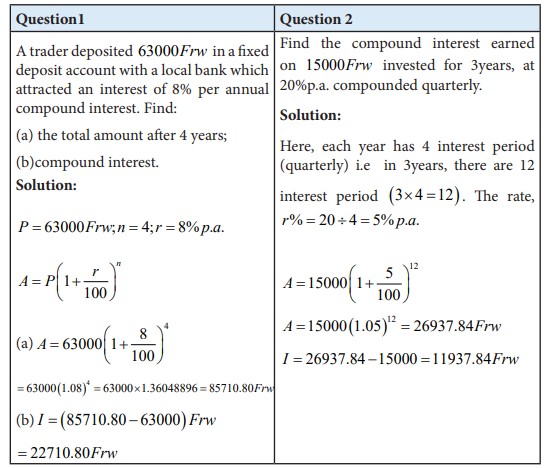
Thus, Compound interest = Accumulated amount (A) – Principal (P)
Note that the principal and the interest earned increased after each interest period.
We can also deduce that I =A-P
Examples
Application activity 1.7
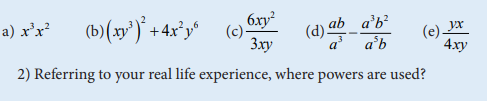
1) Simplify
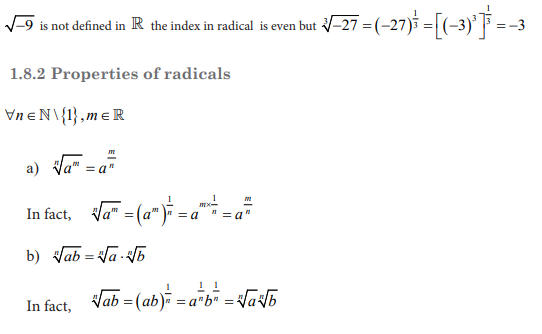
1.8 Roots (radicals) and related problems
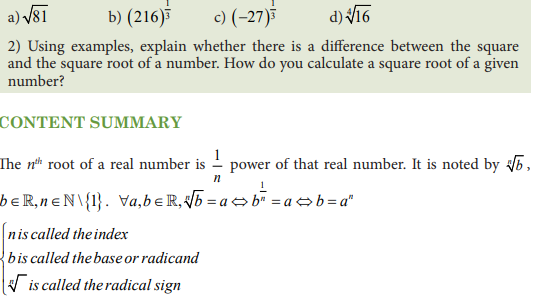
1.8.1 Meaning of radicals
Activity 1.8.1
1) Evaluate the following powers using a calculator
Example
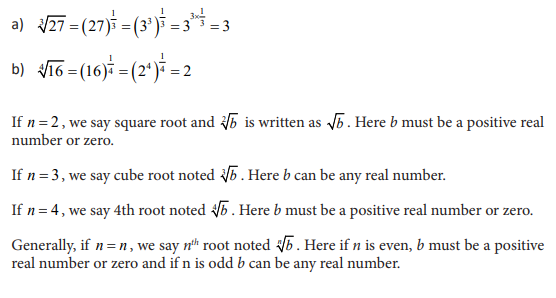
Example:
Application activity 1.8.2
1.8.3 Operations on radicals
Activity 1.8.3
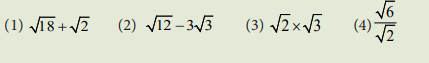
Simplify the following
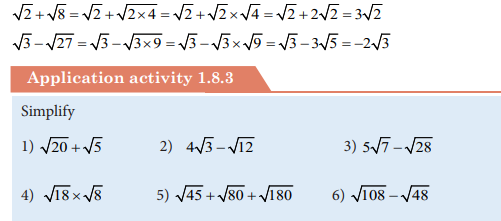
Addition and subtraction
When adding or subtracting the radicals we may need to simplify if we have similar
radicals. Similar radicals are the radicals with the same indices and same bases.
Example:
1.8.4 Rationalizing radicals
Activity 1.8.4
Make the denominator of each of the following rational
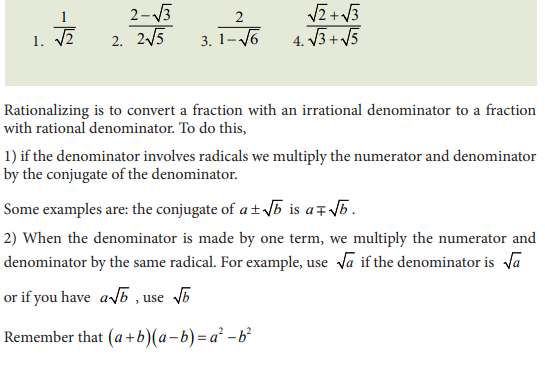
Example:
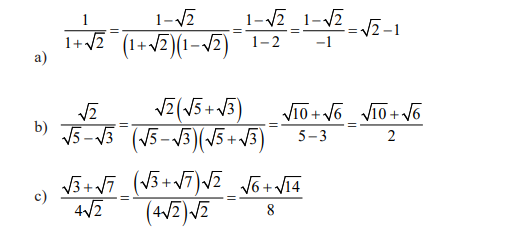
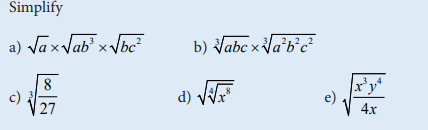
Application activity 1.8
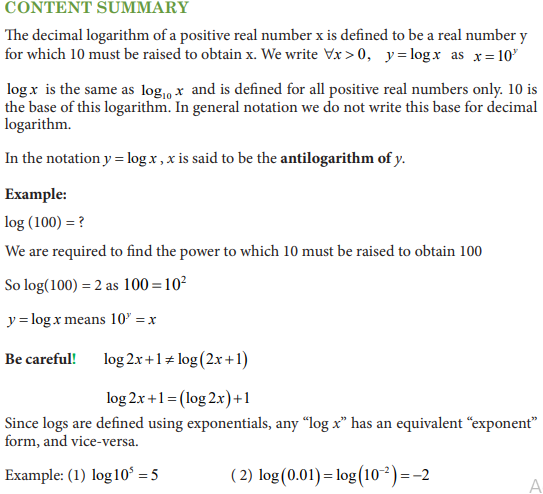
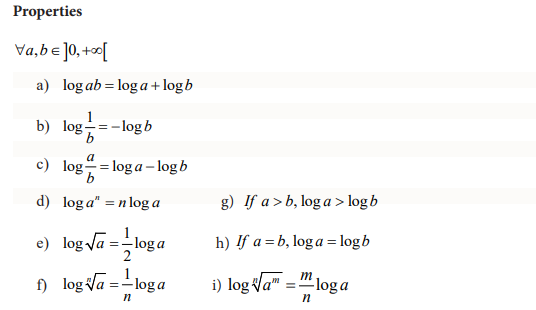
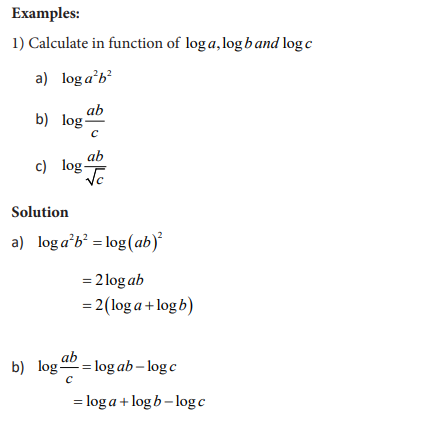
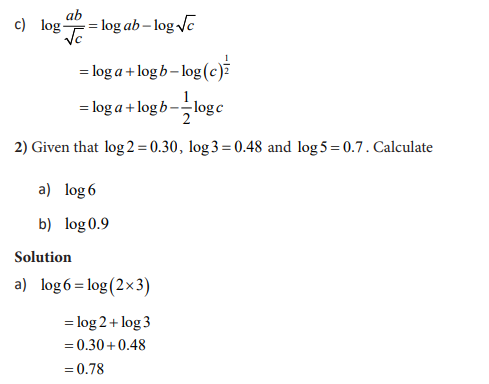
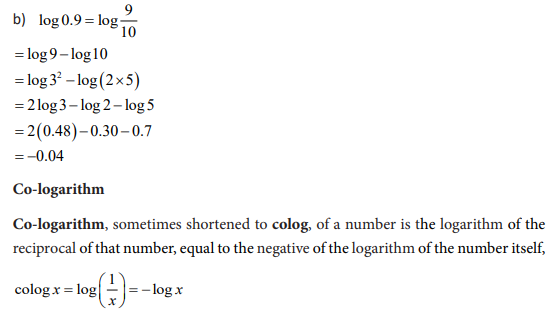
1.9 Decimal logarithms and related problems
Activity 1.9
1) What is the real number at which 10 must be raised to obtain:
a) 1 b) 10 c) 100 d) 1000 e) 10000 f) 100000

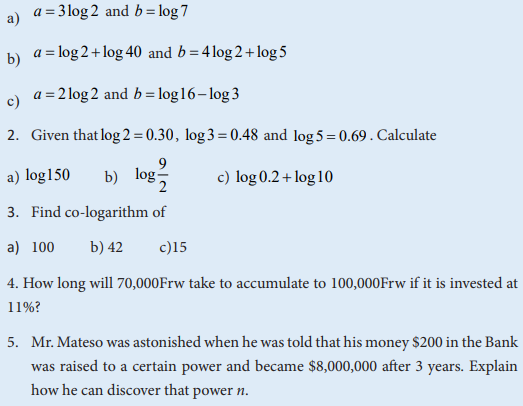
Application activity 1.9
1. Without using calculator, compare the numbers a and b.
1.10 Important applications of arithmetic
Activity 1.10
Make a research in the library or on internet and categorize problems of Economics
and Finance that are easily solved with the use of arithmetic.
Focus on the following: Elasticity of demand, Arc of elasticity for demand, Simple
interest and compound interest, Final value of investment.
CONTENT SUMMARY
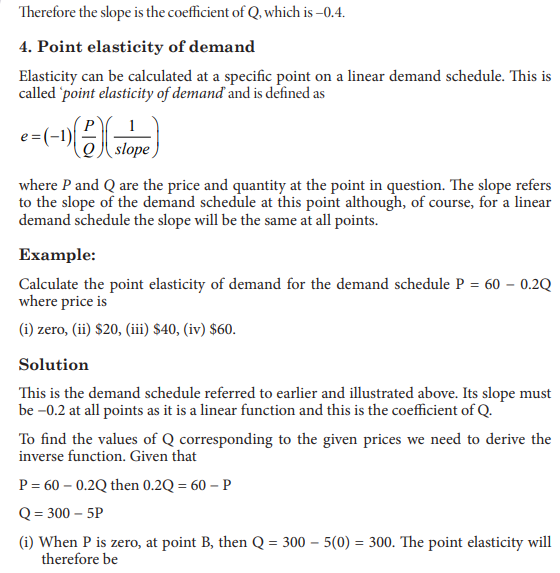
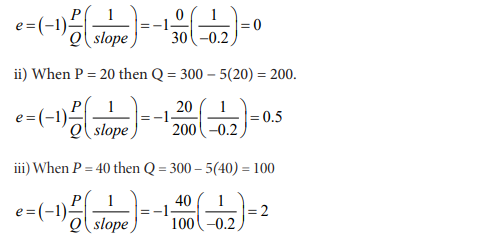
1. Elasticity’ of demand and Arc of elasticity for demand
Elasticity’ of demand:
Price elasticity of demand is a measure of the responsiveness of demand to changes
in price. It is
usually defined as
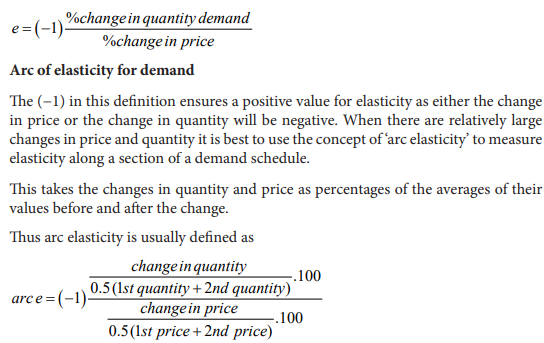
Although a positive price change usually corresponds to a negative quantity change,
and vice versa, it is easier to treat the changes in both price and quantity as positive
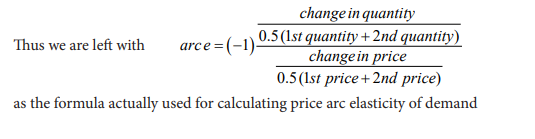
quantities. This allows the (−1) to be dropped from the formula. The 0.5 and the 100
will always cancel top and bottom in arc elasticity calculations.
Example:
Calculate the arc elasticity of demand between points A and B on the demand
schedule shown
In the following figure:
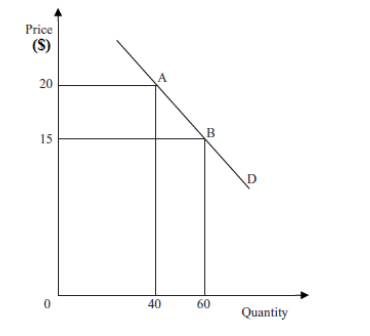
Solution:
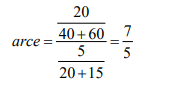
Between points A and B price falls by 5 from 20 to 15 and quantity rises by 20 from
40 to 60. Using the formula defined above:
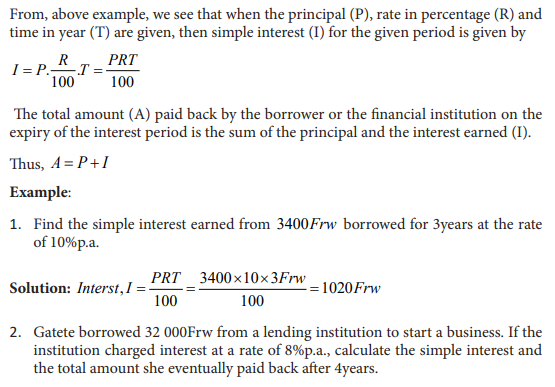
2. Simple interest
Simple interest is the amount charged when one borrows money or loan from a
financial institution which accrue yearly.
This interest is a fixed percentage charged on money/loan that is not yet paid.
This interest is calculated based on the original principal or loan and is paid at regular
intervals
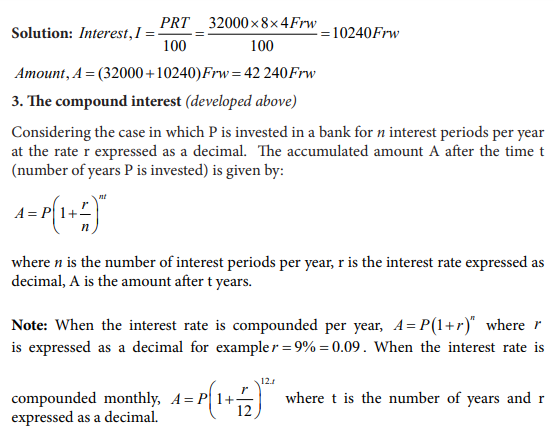
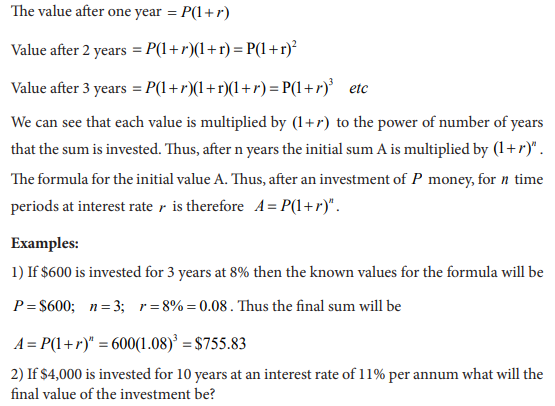
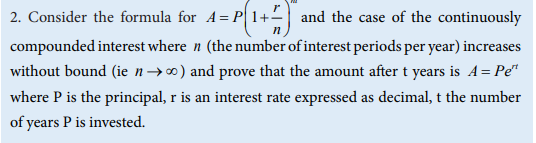
4. Calculating the final value of an investment
Consider an investment at compound interest where:
P is the initial sum invested, A is the final value of the investment, r is the interest
rate per time period (as a decimal fraction) and n is the number of time periods.
The value of the investment at the end of each year will be 1+ r times the sum
invested at the start of the year.
Thus, for any investment,
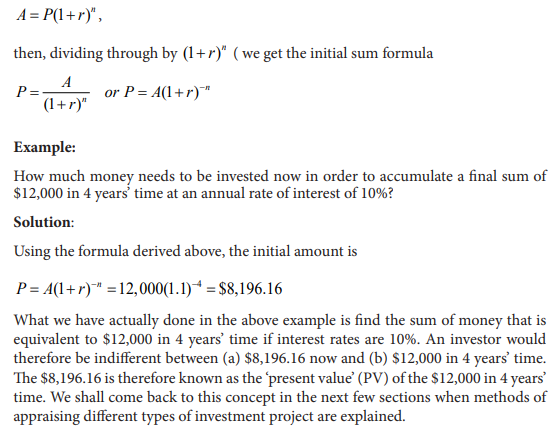
5. Time periods, initial amounts and interest rates
The formula for the final sum of an investment contains the four variables F, A, i and
n.
So far we have only calculated F for given values of A, i and n. However, if the values
of any three of the variables in this equation are given then one can usually calculate
the fourth.
Initial amount
A formula to calculate A, when values for F, i and n are given, can be derived as
follows.
Since the final sum formula is
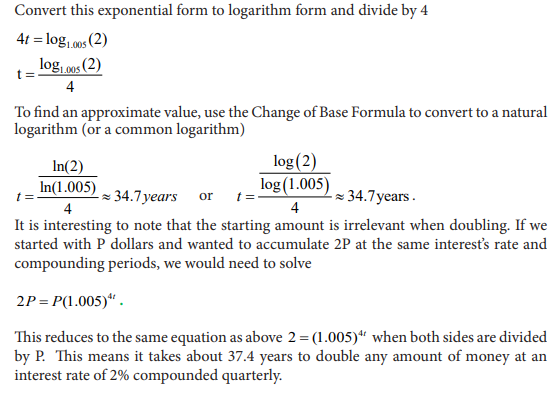
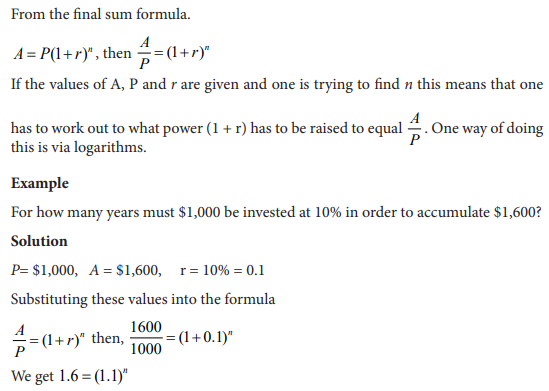
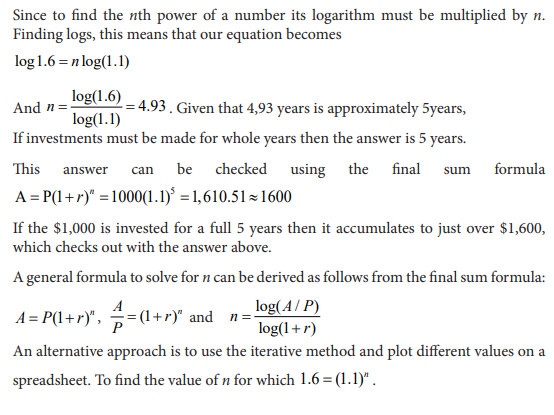
Time period
Calculating the time period is rather more tricky than the calculation of the initial amount.
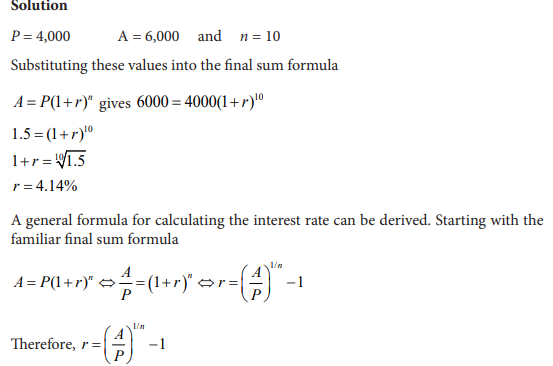
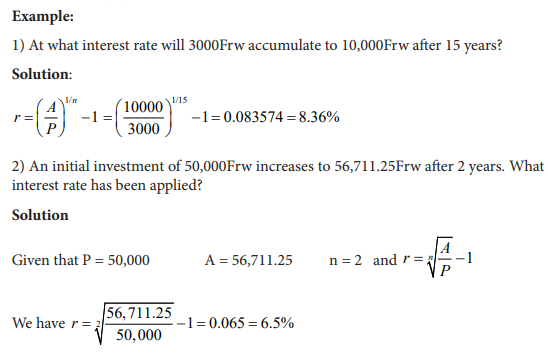
Application activity 1.8.2
1. An initial investment of £50,000 increases to £56,711.25 after 2 years. What
interest rate has been applied?
1.11. END UNIT ASSESSMENT
1. Why is it necessary for a student teacher to study arithmetic? Explain your
answer on one page and be ready to defend your arguments in a classroom
discussion;
2. The price of a house was 2000000Frw in the year 2000. At the end of each year
the price has increased by 6%.
a) Find the price of the house after one year
b) Find the price of that house after 3 years
c) Find the price that such a house should have in this year.
UNIT 2:EQUATIONS AND INEQUALITIES
Key Unit competence: Model and solve daily life problems using linear, quadratic equations
or inequalities
2.0. Introductory Activity
1) By the use of library and computer lab, do the research and explain
the linear equation.
2) If x is the number of pens for a learner, the teacher decides to give
him/her two more pens. What is the number of pens will have a
learner with one pen?
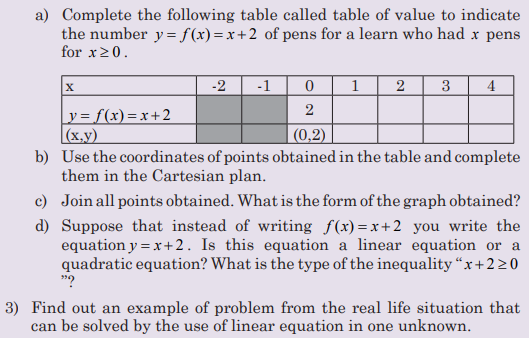
2.1 Linear equations in one unknown and related problems
Activity 2.1
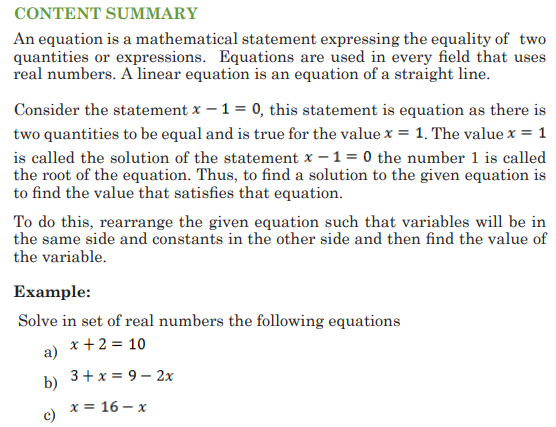
Problems which are expressed in words are known as problems or applied
problems. A word or applied problem involving unknown number or
quantity can be translated into linear equation consisting of one unknown
number or quantity. The equation is formed by using conditions of the
problem. By solving the resulting equation, the unknown quantity can be found.
In solving problem by using linear equation in one unknown the following
steps can be used:
i) Read the statement of the word problems
ii) Represent the unknown quantity by a variable
iii) Use conditions given in the problem to form an equation in the unknown variable
iv) Verify if the value of the unknown variable satisfies the conditions of the problem.
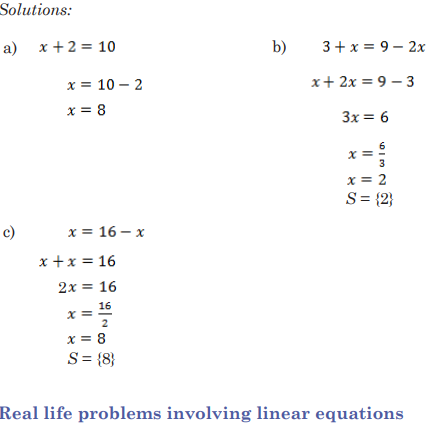
Examples
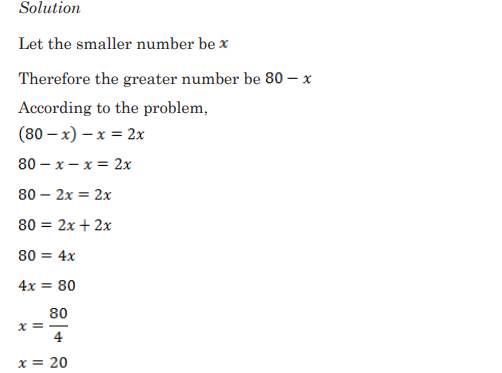
1) The sum of two numbers is 80. The greater number exceeds the
smaller number by twice the smaller number. Find the numbers.
2.2 Linear inequalities in one unknown and related real life problems
Activity 2.2
CONTENT SUMMARY
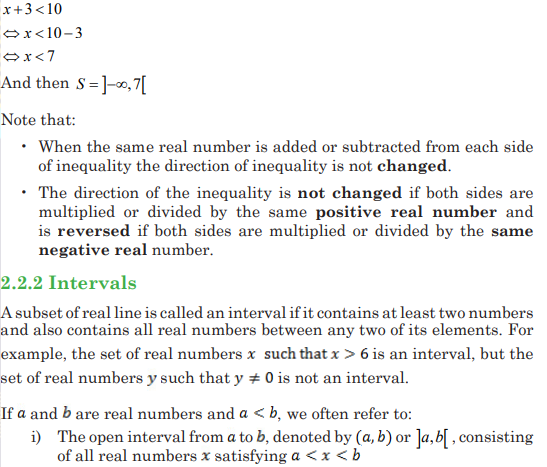
2.2.1 Meaning of an inequality
The statement x + = 3 10 is true only when x = 7 . If x is replaced by 5, we
have a statement 5 3 10 + = which is false. To be true we may say that 5 +
3 is less than 10 or in symbol5 3 10 + < . If x is replaced by 8, the statement
8+3=10 is also false. In those two cases we no longer have equality but
inequality.
Suppose that we have the inequality x + <3 10 , in this case we have an
inequality with one unknown. Here the real value of x satisfies this
inequality is not unique. For example 1 is a solution but 3 is also a
solution. In general all real numbers less than 7 are solutions. In this
case we will have many solutions combined in an interval.
Now, the solution set of x + <3 10 is an open interval containing all real
numbers less than 7 whereby 7 is excluded. How?
We solve this inequality as follow
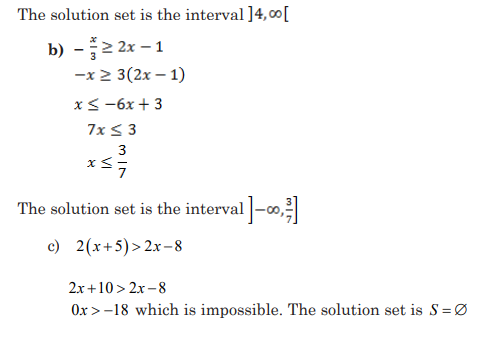
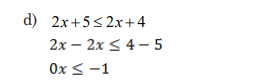
Since any real number times zero is zero and zero is not less or equal to
-1 then the solution set is the empty set. S = ∅
2.2.3 Inequalities products / quotients
Activity 2.2
Explain the method you can use to solve the following inequalities:
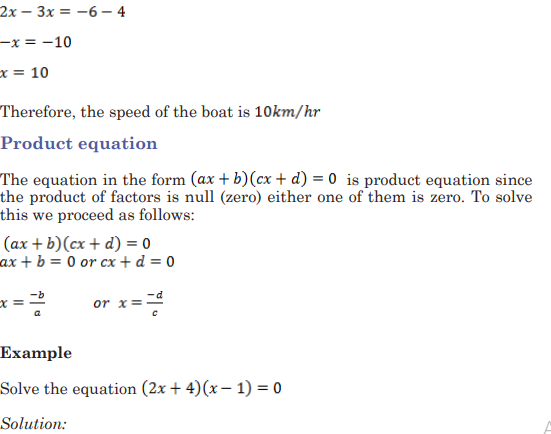
Suppose that we need to solve the inequality of the form(ax b cx d + +< )
0
For this inequality we need the set of all real numbers that make the
left hand side to be negative. Suppose also that we need to solve the
inequality of the form (ax b cx d + +> )
set of all real numbers that make the left hand side to be positive.
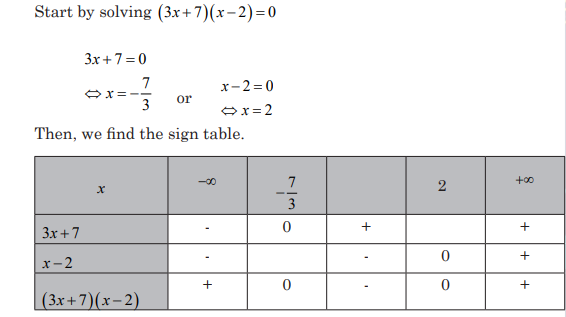
We follow the following steps:
a) First we solve for (ax b cx d + += )
b) We construct the table called sign table, find the sign of each
factor and then the sign of the product or quotient if we are given
a quotient.
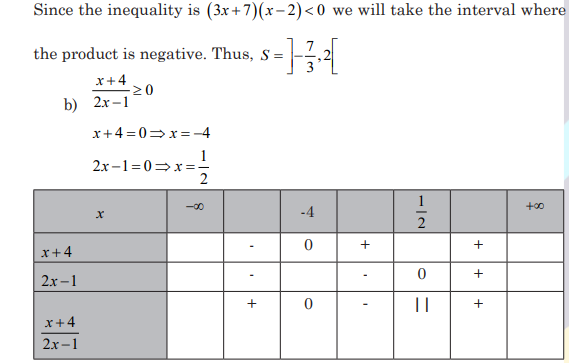
For the quotient the value that makes the denominator to be
zero is always excluded in the solution. For that value we use the
symbol || in the row of quotient sign.
c) Write the interval considering the given inequality sign.
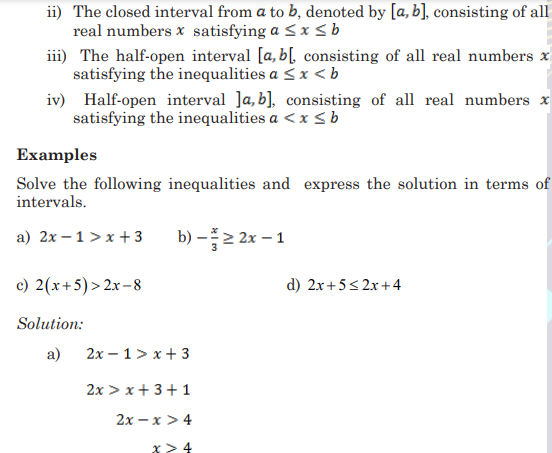
Example
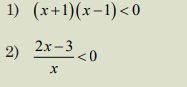
Solve in set of real numbers the following inequalities
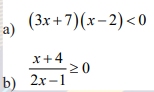
Solution
a) (37 20 x x + −< )
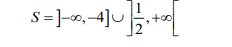
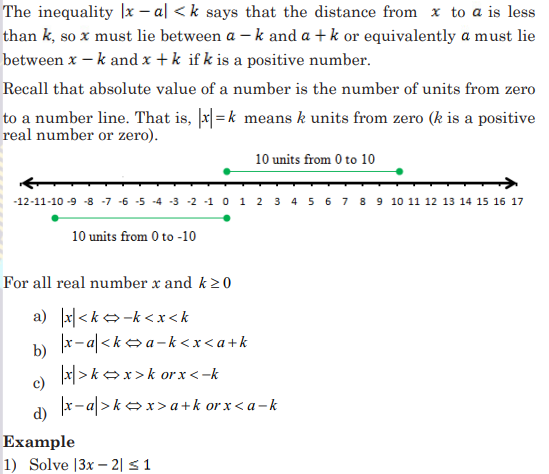
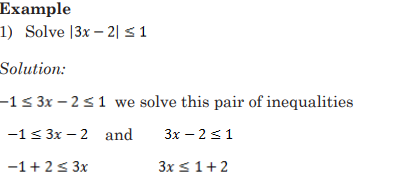
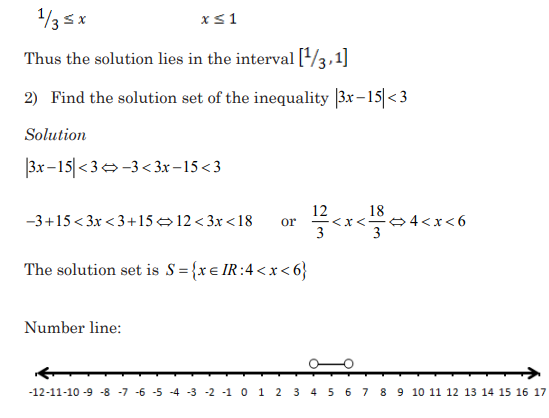
2.2.4 Inequalities involving absolute value
Activity 2.2.4
State the set of all real numbers whose number of units from zero, on
a number line, are
1) greater than 4
2) less than 6
2.2.5 Real life problems involving linear inequalities
Activity 2.2.5
Sam and Alex play in the same team at their school. Last Saturday
their team played with another team from other school in the same
district, Alex scored 3 more goals than Sam. But together they scored
less than 9 goals.
What are the possible number of goals Alex scored?
Inequalities can be used to model a number of real life situations. When
converting such word problems into inequalities, begin by identifying
how the quantities are relate to each other, and then pick the inequality
symbol that is appropriate for that situation. When solving these
problems, the solution will be a range of possibilities. Absolute value
inequalities can be used to model situations where margin of error is a
concern.
Examples
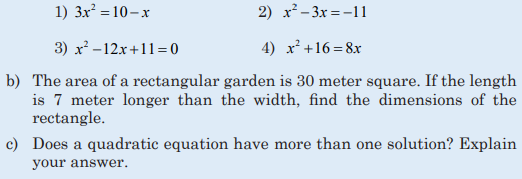
1) The width of a rectangle is 20 meters. What must the length be if the
perimeter is at least 180 meters?
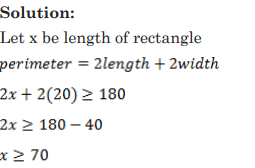
The length must be at least 70 meters.
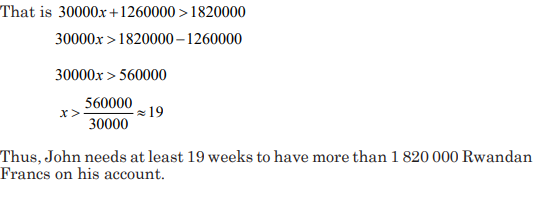
2) John has 1 260 000 Rwandan Francs in an account with his bank.
If he deposits 30 000 Rwanda Francs each week into the account,
how many weeks will he need to have more than 1 820 000 Rwandan
Francs on his account?
Solution:
Let x be the number of weeks
We have total amount of deposits to be made the current balance is
greater to the total amount wanted.
Application activity 2.2
1) Joe enters a race where he has to cycle and run. He cycles a
distance of 25 km, and then runs for 20 km. His average running
speed is half of his average cycling speed. Joe completes the race
in less than 2½ hours, what can we say about his average speeds?
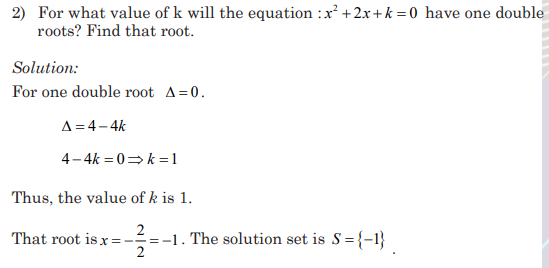
2) Explain your colleague whether or not a solution set for an
inequality can have one element.
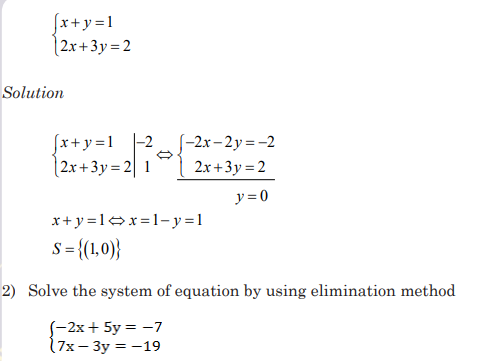
2.3 Simultaneous linear equations in two unknowns
(Solving by equating two same variables)
Activity 2.3
In each of the following systems find the value of one variable from one
equation and equalize it with the same value of another variable from
second equation. Calculate the values of those variables
 .
.CONTENT SUMMARY
To find the value of unknown from simultaneous equation by equating
the same variable in terms of another, we do the following steps:
i) Find out the value of one variable in first equation,
ii) Find out the value of that variable in the second equation,
iii) Equate the same values obtained from the two equations,
iv) Solve the equation obtained to find out the unknown variables.
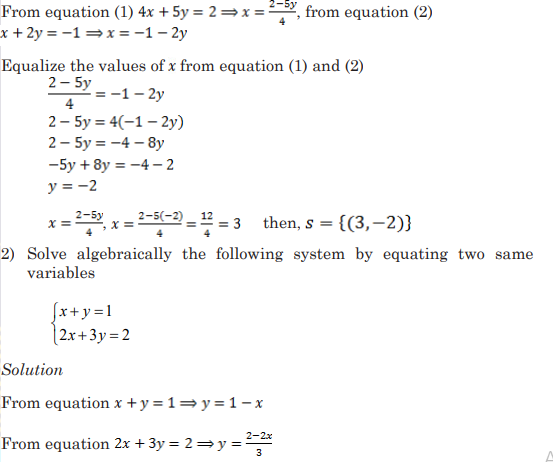
Example
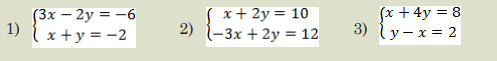
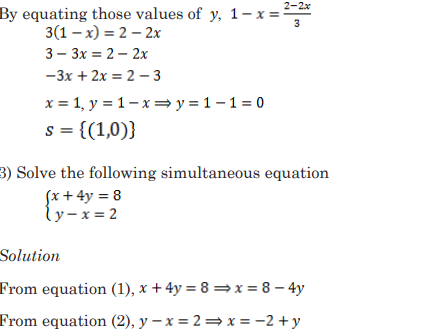
1) Algebraically, solve the simultaneous linear equation by equating the
same variables.
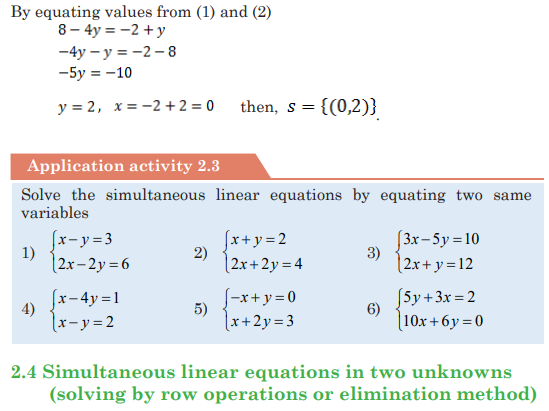
Activity 2.4
CONTENT SUMMARY
To eliminate one of the variables from either of equations to obtain an
equation in just one unknown, make one pair of coefficients of the same
variable in both equations negatives of one another by multiplying both
sides of an equation by the same number. Upon adding the equations,
that unknown will be eliminated.
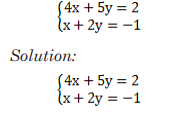
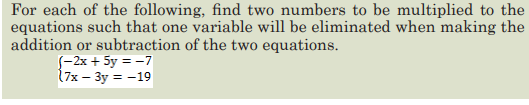
Example
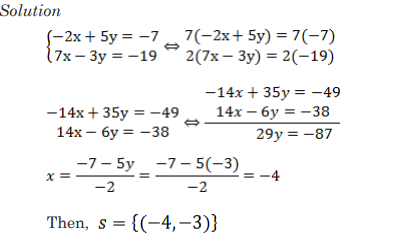
1) Solve the system of equations using elimination method
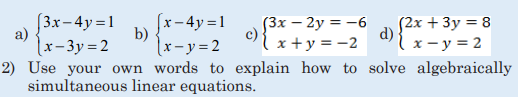
Application activity 2.4
1) Solve the following system of equation by using elimination
method.
2.5 Solving graphically simultaneous linear equations
in two unknowns
Activity 2.5
1) Discuss how you can find the coordinate of the point intercept of
two lines whose equations are known.
CONTENT SUMMARY
One way to solve a system of linear equations is by graphing. The
intersection of the graphs represents the point at which the equations
have the same -value and the same -value. Thus, this ordered pair
represents the solution common to both equations. This ordered pair is
called the solution to the system of equations.
The following steps can be applied in solving system of linear equation
graphically:
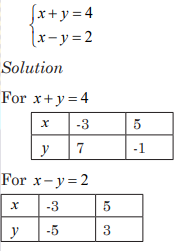
1) Find at least two points for each equation.
2) Plot the obtained points in XY plane and join these points to obtain
the lines. Two points for each equation give one line.
3) The point of intersection for two lines is the solution for the given
system
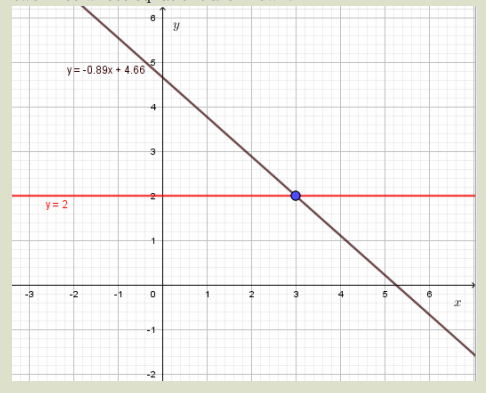
Examples
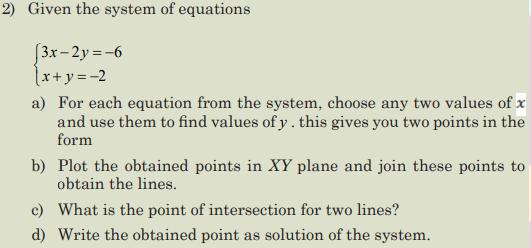
1) Solve the following system by graphical method
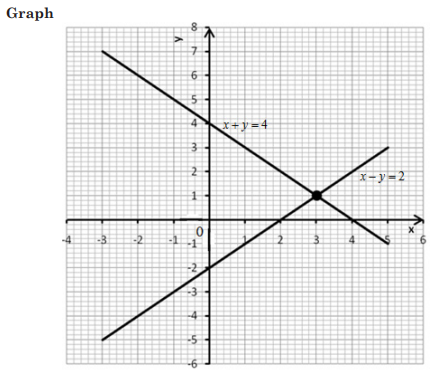
The two lines intersect at point(3,1). Therefore the solution set is
S = {(3,1)} .
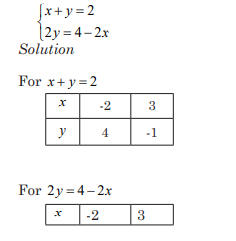
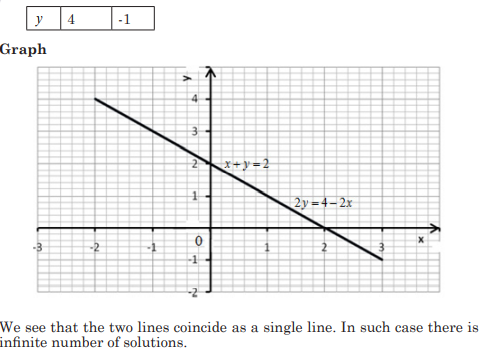
2) Solve graphically the following system of linear equations
Solve the following equations graphically
Application activity 2.5
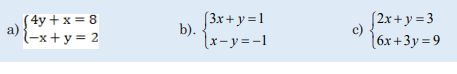
1) Solve the graphically the following system of linear equations.
2.6 Solving algebraically and graphically simultaneous
linear inequalities in two unknowns
Activity 2.6
The following graph illustrates two lines and their equations
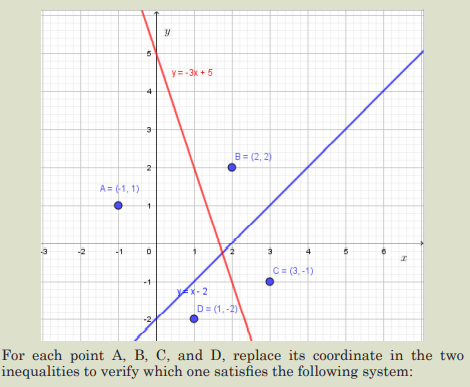
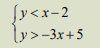
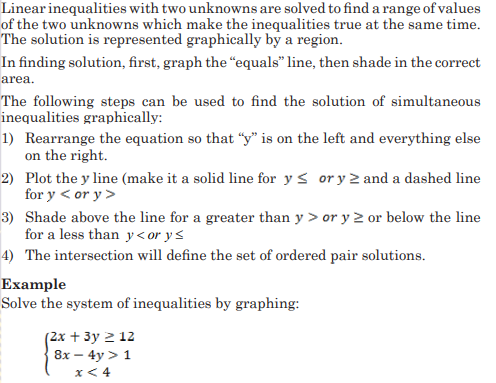
CONTENT SUMMARY
A system of inequalities consits of a set of two inequalities with the same
variables. The inequalities define the conditions that are to be considered
simultaneously.
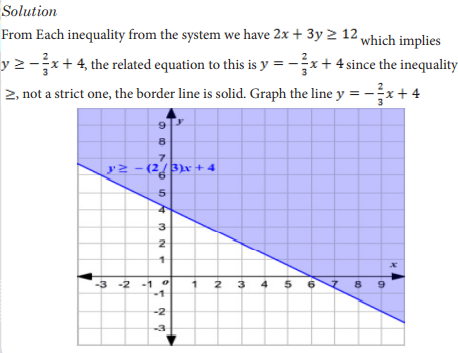
Each inequality in the set contains infinetely many ordered pair solutions
defined by a region in rectangular coordinate plane. When considering
two of these inequalities together, the intersection of these sets will
define the set of simultaneous ordered pair solutions
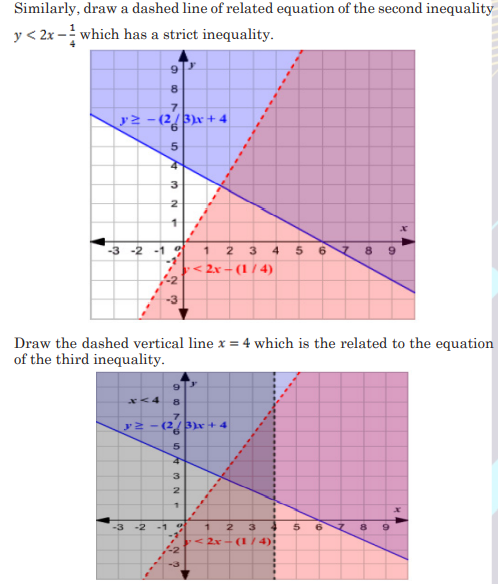
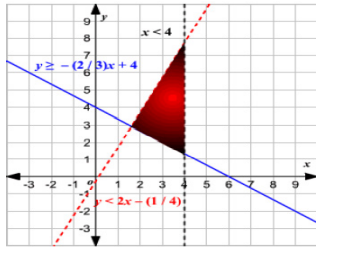
The solution of the system of inequalities is the intersection region of the
solutions of the three inequalities as it is done in the following figure.
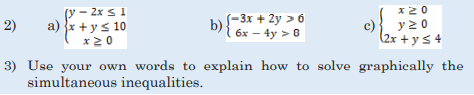
Application activity 2.6
1) Algebraically and graphically, solve the following simultaneous
inequalities
2.7 Solving quadratic equations by the use of
factorization and discriminant
Activity 2.7
Smoke jumpers are fire fighters who parachute into areas near forest
fires. Jumpers are in free fall from the time they jump from a plane
until they open their parachutes. The function 2 y t =− + 16 1600 gives a
jumper’s height y in metre after t seconds for a jump from1600m.
a) How long is free fall if the parachute opens at1000m?
b) Complete a table of values for t = 0, 1, 2, 3, 4, 5 and 6.
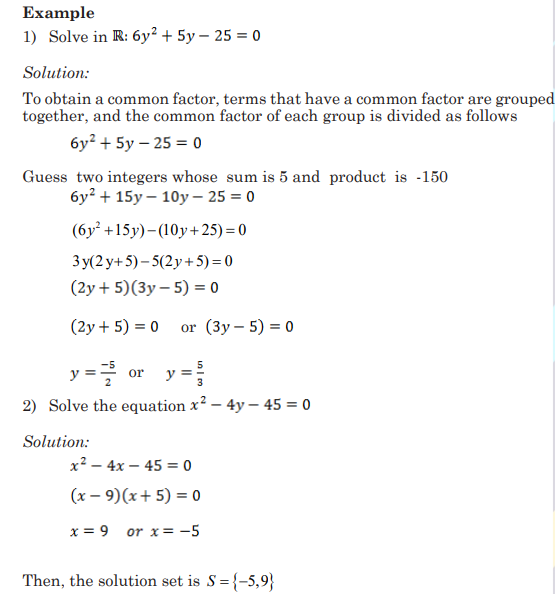
CONTENT SUMMARY
Equations which are written in the form of
called quadratic equations. To find solution of this equation the two main
ways can be used in solving such equation
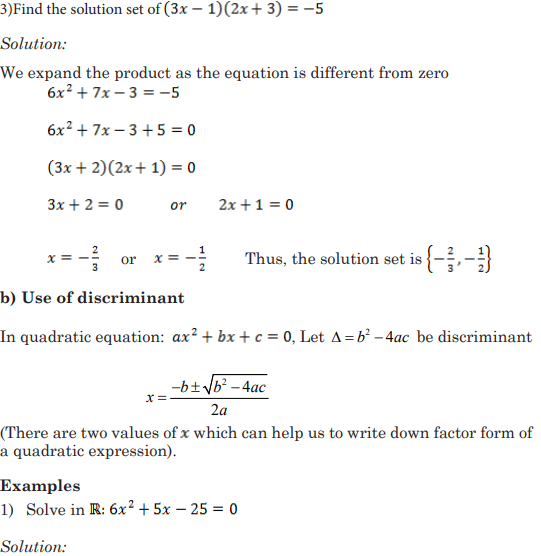
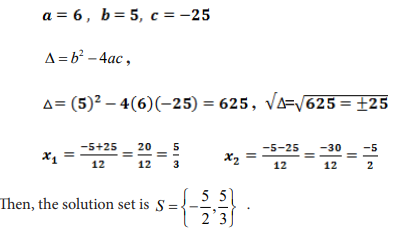
a)Use of factorization or finding square roots
Grouping terms or decomposition can be used to factorize the quadratic
equations; and later help us to find the solution of equation. By having
the product of and the sum of those two integers which gives , it
helps you to decompose into a product of factors
Example

Application activity 2.7
a) Use factorization and discriminant to solve the following equations
2.8 Applications of linear and quadratic equations in
economics and finance: Problems about supply
and demand (equilibrium price
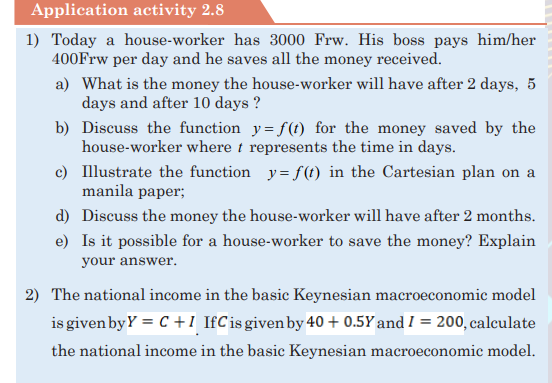
Activity 2.8
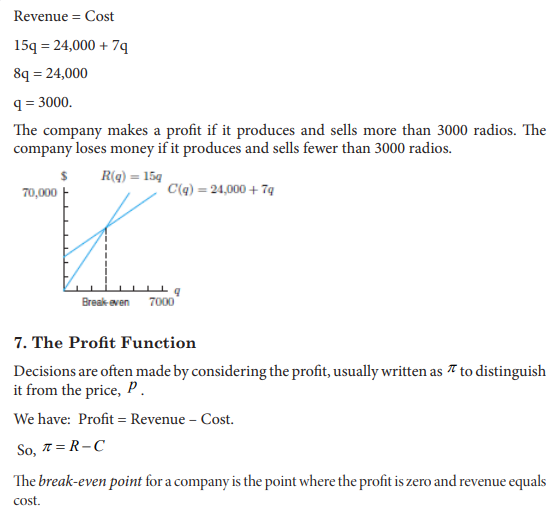
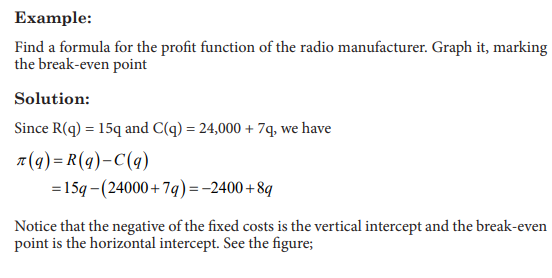
Assume that a firm can sell as many units of its product as it can manufacture in a month at 180 Rwandan francs each. It has to pay out 2400 Rwandan francs fixed costs plus a marginal cost of 140 Rwanda francs for each unit produced. How much does it need to produce to break even (where total revenue equals to total cost)?
CONTENT SUMMARY
When only two or single variables and equations are involved, a
simultaneous equation system can be related to familiar graphical
solutions, such as supply and demand analysis.
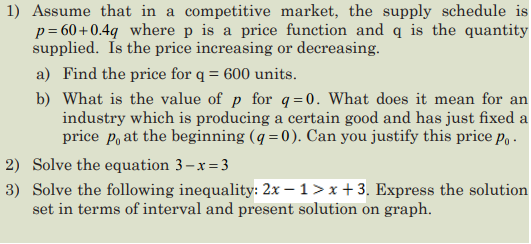
For example, assume that in a competitive market the demand schedule
is given by
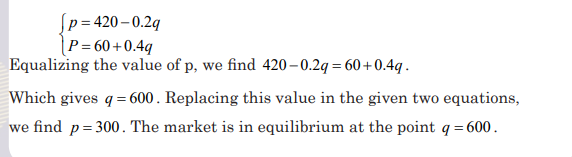
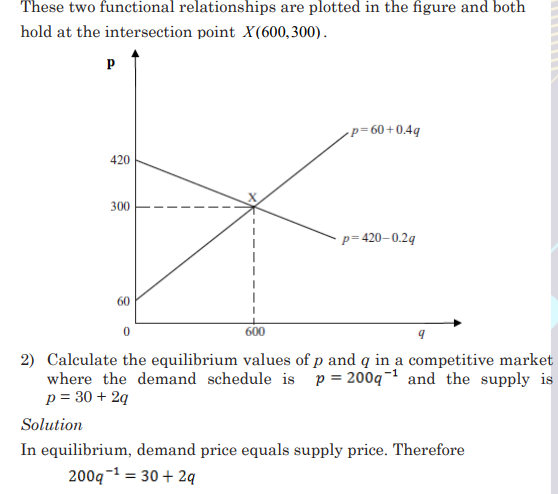
p = 420 − 0.2q and the supply schedule is given by p = 60 + 0.4q,
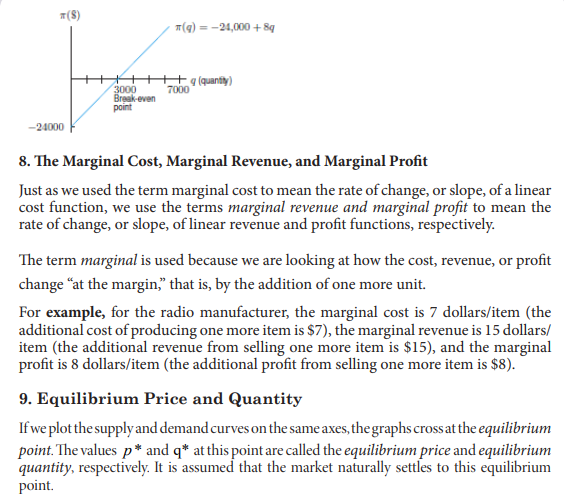
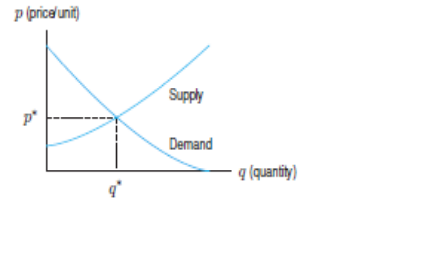
If this market is in equilibrium, the equilibrium price and quantity will
be where the demand and supply schedules intersect. This requires
you to solve the system formed by the two simultaneous equations. Its
solution will correspond to a point which is on both the demand schedule
and the supply schedule. Therefore, the equilibrium values of p and q
will be such that both equations (1) and (2) hold.
Example
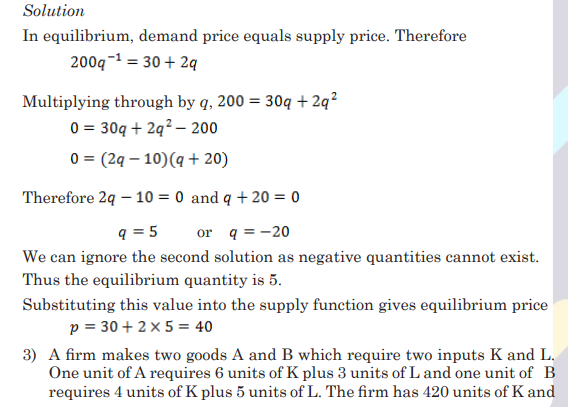
1) In a competitive market the demand schedule is given by p = 420 − 0.2q and the supply schedule is given by p = 60 + 0.4q, Solve for p and q the simultaneous equation and determine the point at which the market is in equilibrium.
Solution:
Let us solve the system

UNIT 3:GRAPHS AND FUNCTION
Key unit Competence: Apply graphical representation of
function in economics models
3.0. Introductory Activity 3
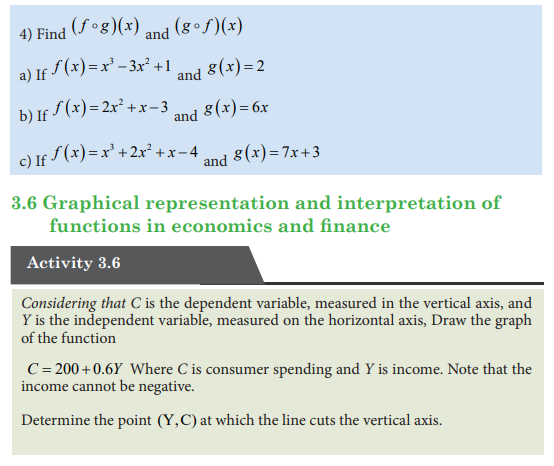
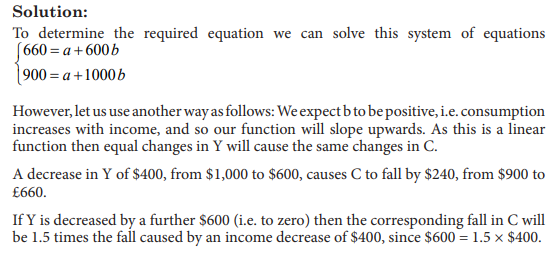
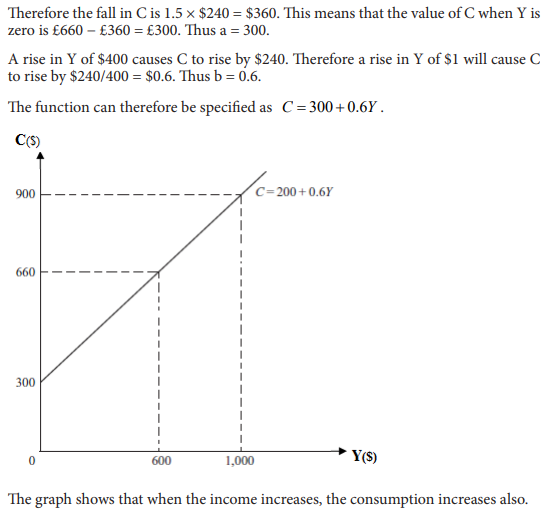
Suppose that average weekly household expenditure on food C depends on average
net household weekly income Y according to the relationshipC Y = + 12 0.3 .
a) Can you find a value of Y for which C is not a real number?
b) Complete a table of value from Y= 0 to Y= 10 and use it to draw the graph of
C Y = + 12 0.3
c) If Y=90, what is the value of C?
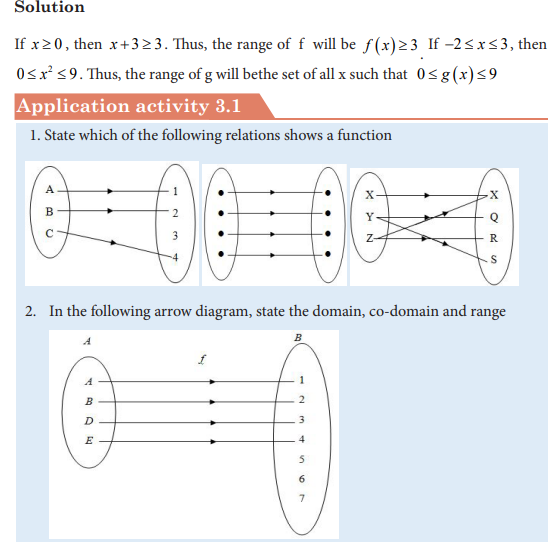
3.1 Generalities on numerical functions
Activity 3.1
In following arrow diagram, for each element of set A state which element of B
is mapped to it.
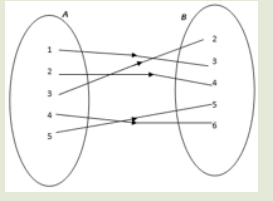
a) What is the set of elements of A which have images in B?
b) Determine the set of elements in B which have antecedent in A.
c) Is there any element of A which has more than one image?
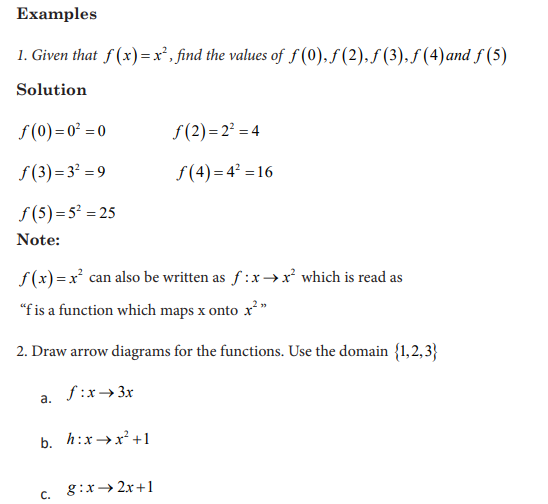
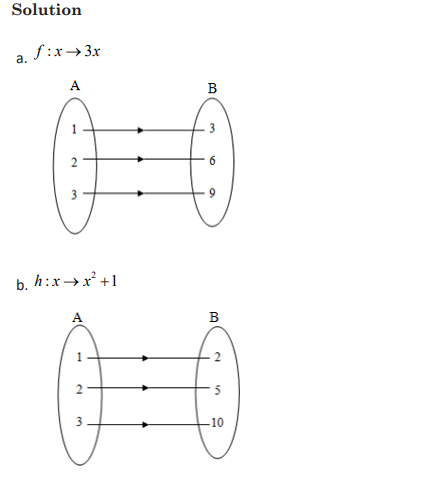
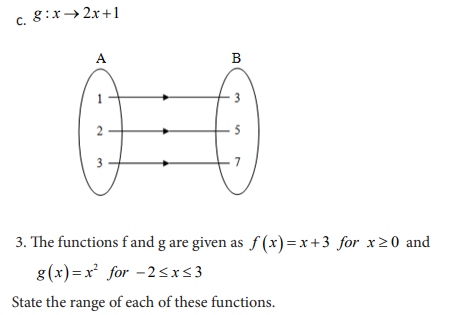
A function is a rule that assigns to each element in a set A one and only one element
in set B. We can even define a function as any relationship which takes one element
of one set and assigns to it one and only one element of second set.
If x is an element in the domain of a function f, then the element that f associates with
x is denoted by the symbol f x
the value of f at x.
The set of all possible values of f x
of f and it is denoted R f
The set of all values of A which have images in B is called Domain of f and denoted
Domf .
We shall write f x
commonly used for this purpose are f, g and h.
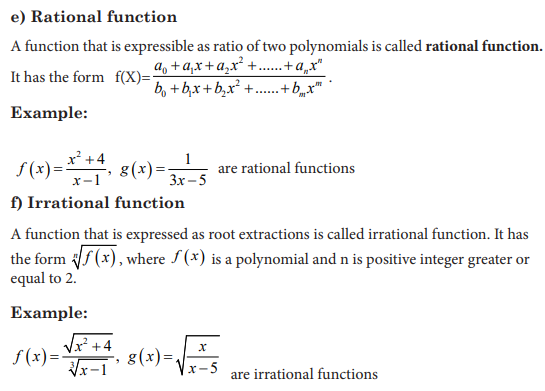
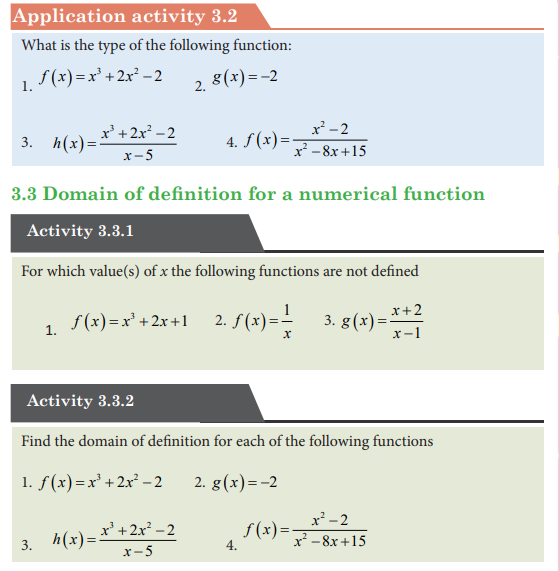
3.2 Types of functions
Activity 3.2
Differentiate rational from irrational numbers. Guess which of the following
functions is a polynomial, rational or irrational function


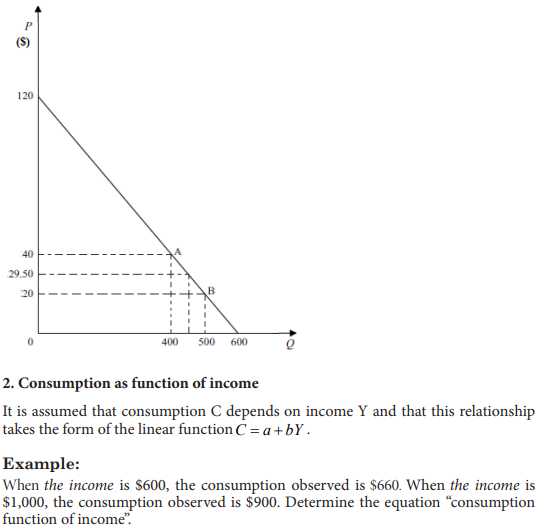
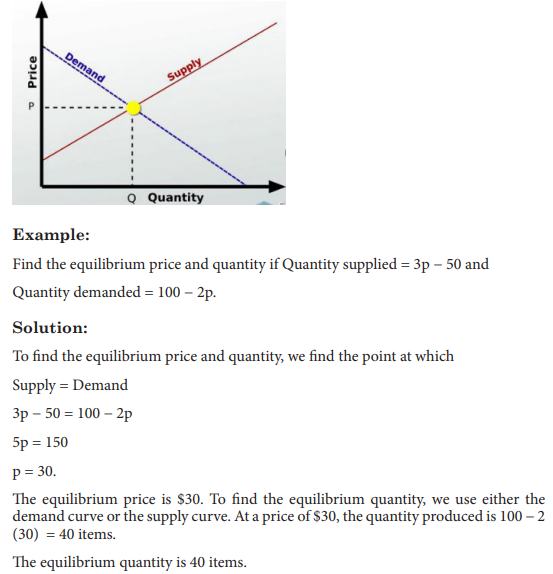
1. Price as function of quantity supplied
The quantity Q of an item that is manufactured and sold depends on its price P. As
the price increases, manufacturers are usually willing to supply more of the product,
whereas the quantity demanded by consumers falls.
The supply curve, for a given item, relates the quantity Q of the item that manufacturers
are willing to make per unit time to the price P for which the item can be sold.
The demand curve relates the quantity, q, of an item demanded by consumers per
unit time to the price P of the item.
Economists often think of the quantities supplied and demanded Q as functions of
price P. However, for historical reasons, the economists put price (the independent
variable) on the vertical axis and quantity (the dependent variable) on the horizontal
axis. (The reason for this state of affairs is that economists originally took price to be
the dependent variable and put it on the vertical axis.
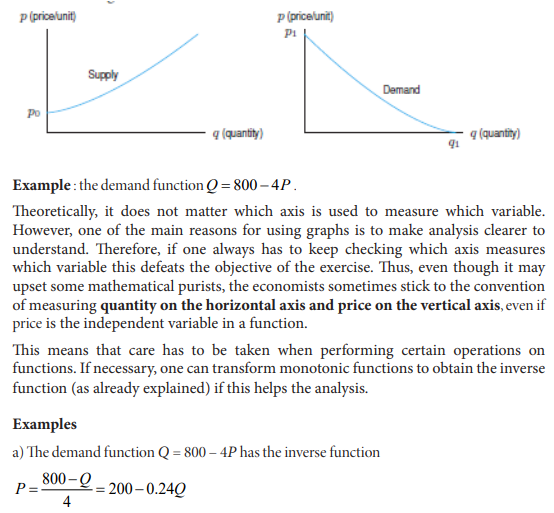
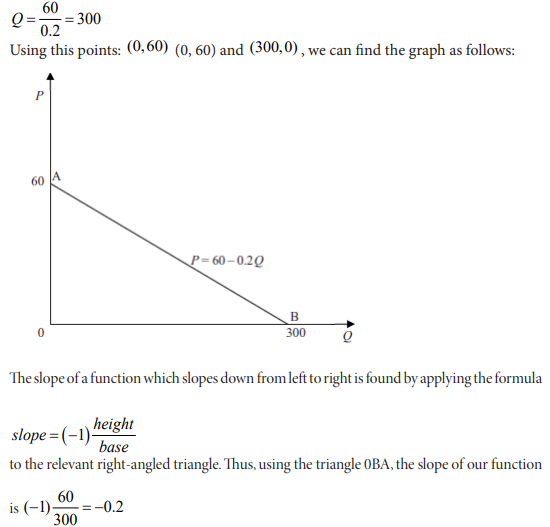
This figure shows that when the quantity Q is increasing, the price P reduces
progressively. This can be caused by the fact that every consumer has sufficient
quantity of goods and does not want to by any more.
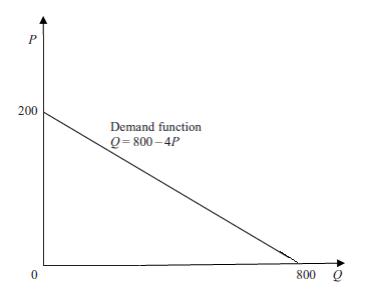
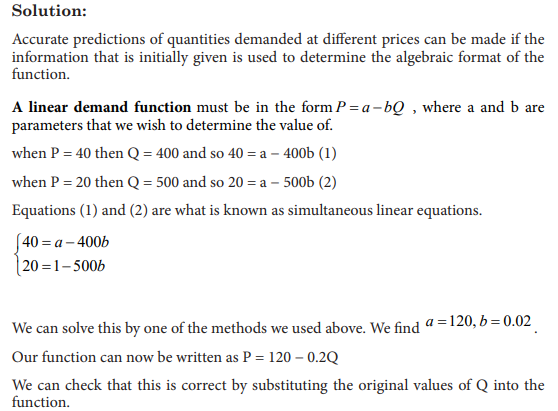
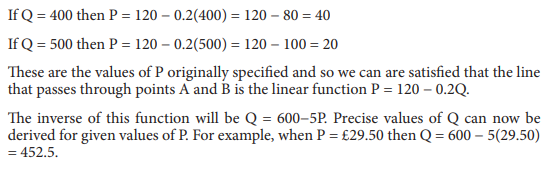
b. Suppose that a firm faces a linear demand schedule and that 400 units of output
Q are sold when price is $40 and 500 units are sold when price is $20. Once these
two price and quantity combinations have been marked as points A and B, then
the rest of the demand schedule can be drawn in. Use this data to determine the
function that can help to predict quantities demanded at different prices and draw
the corresponding graph.
UNIT 4:LIMITS OF FUNCTIONS

4.0. Introductory Activity 4


Activity 4.1.1
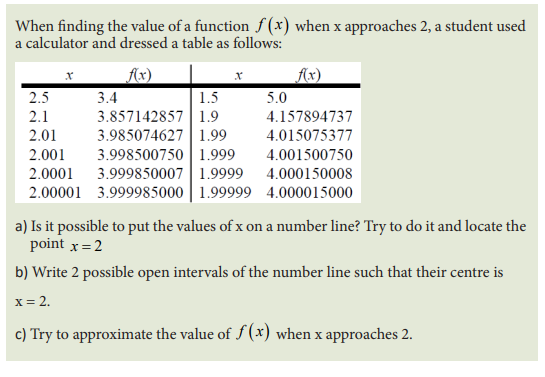
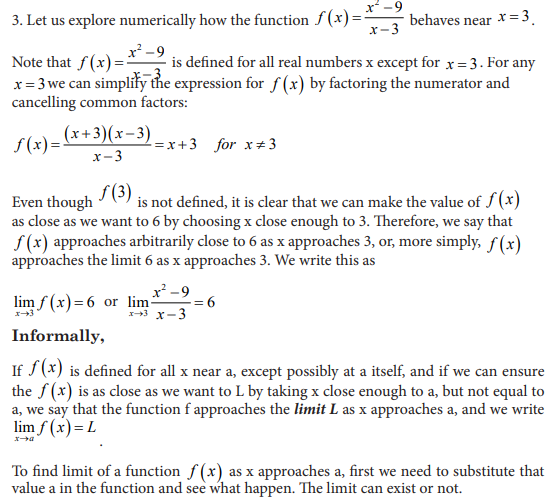
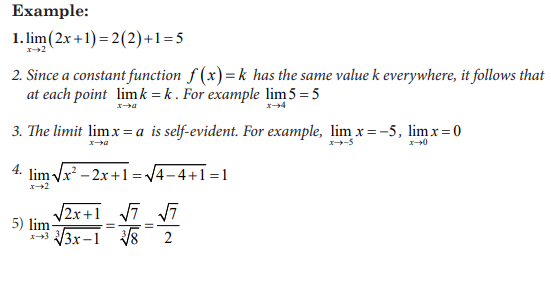
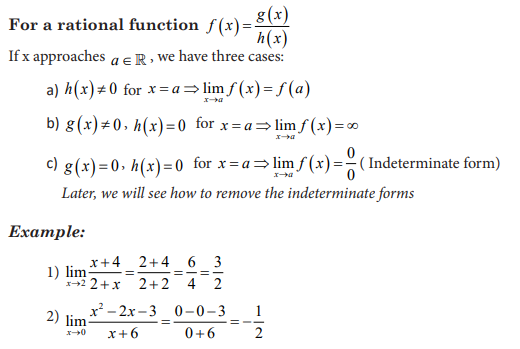
4.1.2 Limit of a function
Activity 4.1.2
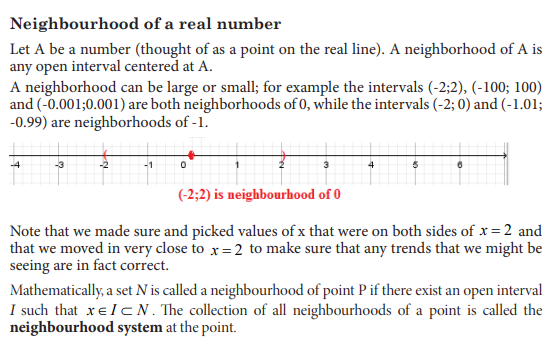
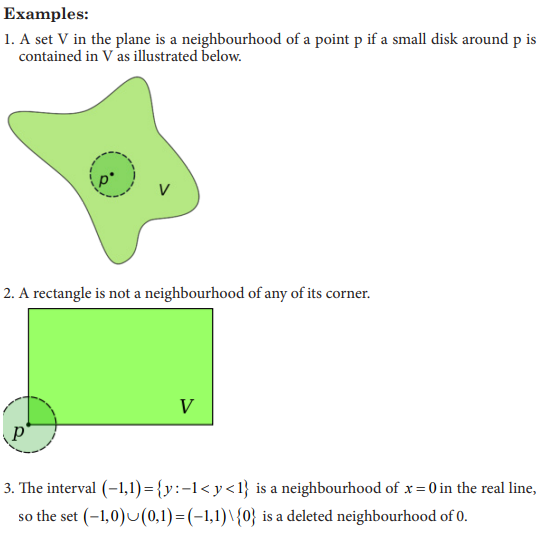
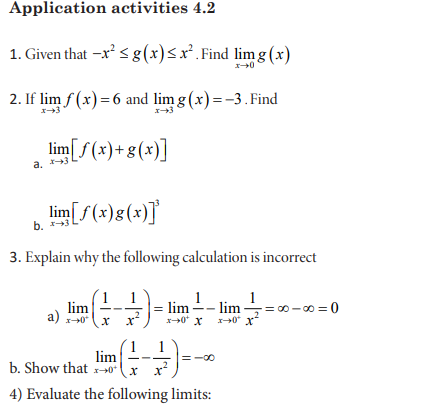
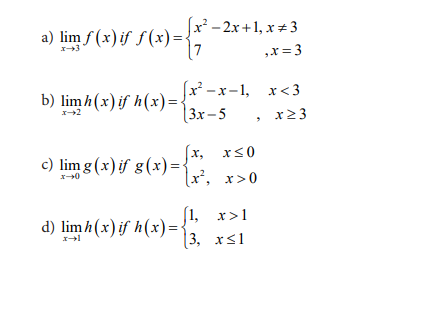
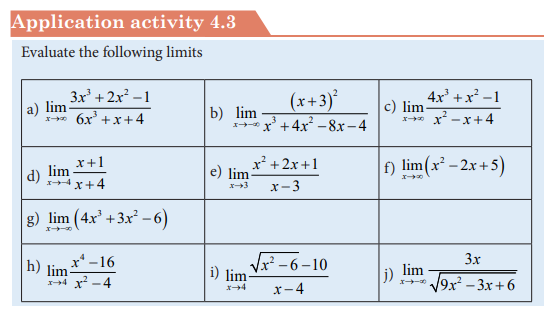
Application activity 4.1
1. Apart from the Kingdom of Lesotho, give two examples of countries or Cities
in the world that are surrounded by a single country or city.
2. Give three examples of intervals that are neighbourhoods of -5
3. Is a circle a neighbourhood of each of its points? explain your answer.
4. Draw any plane and show three points on that plane for which the plane is
their neighbourhood.
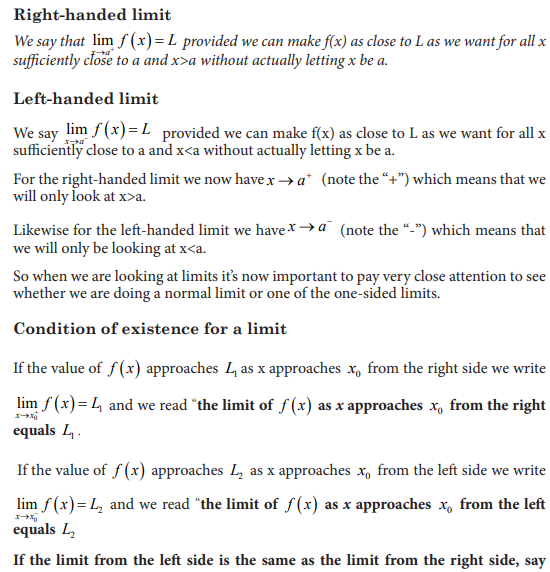
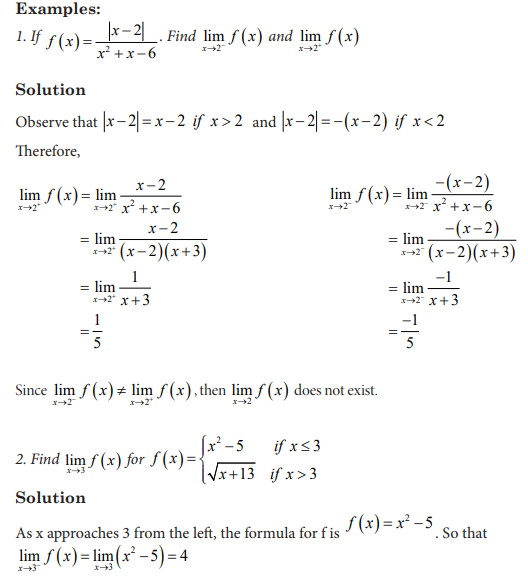
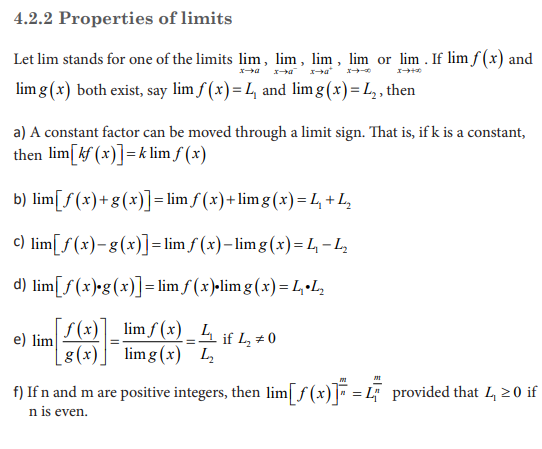
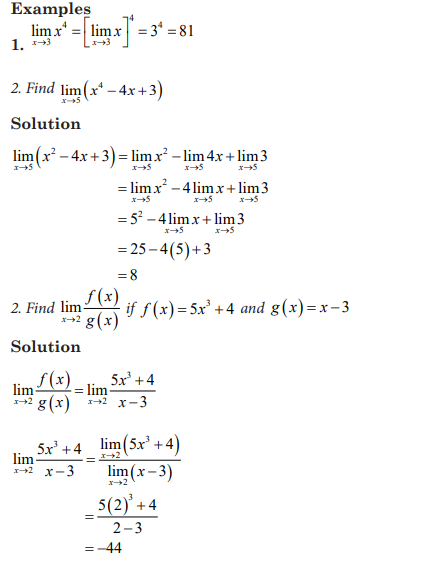
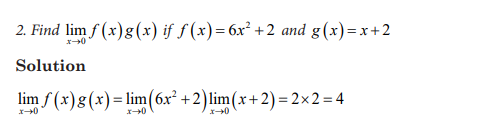
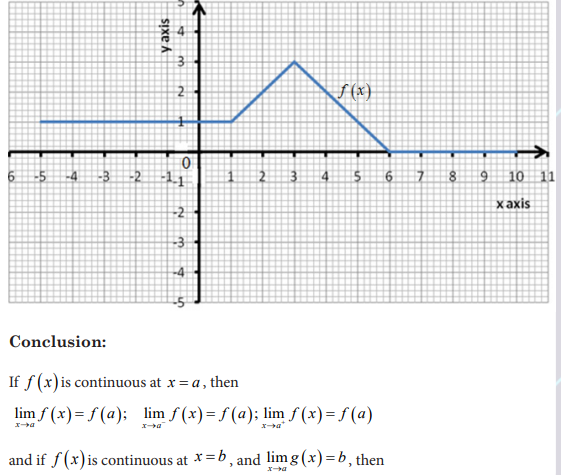
4.2 One-sided limits, existence of limit and properties
4.2.1 One-sided limits, existence of limit
Activity 4.2
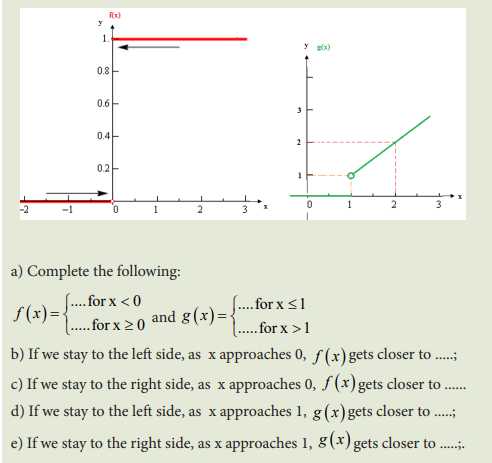
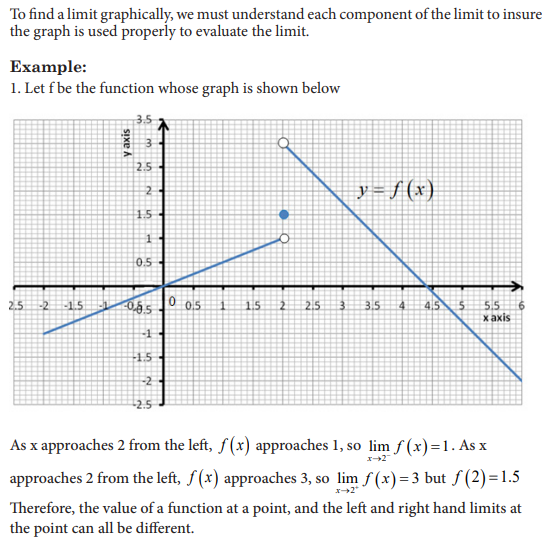
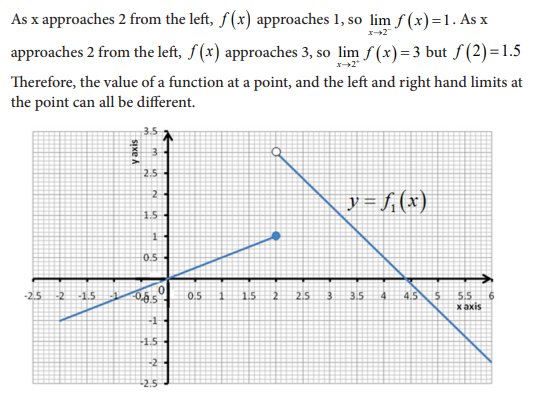
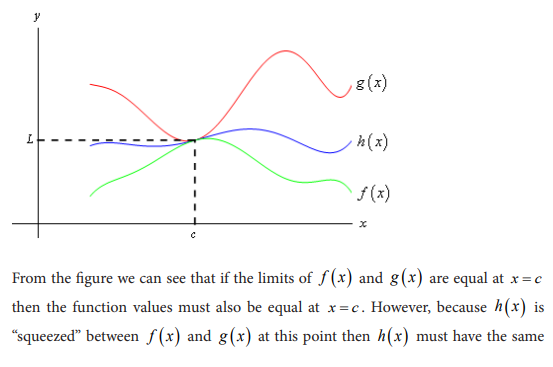
Consider the graphs of two functions f(x) and g(x) plotted below:


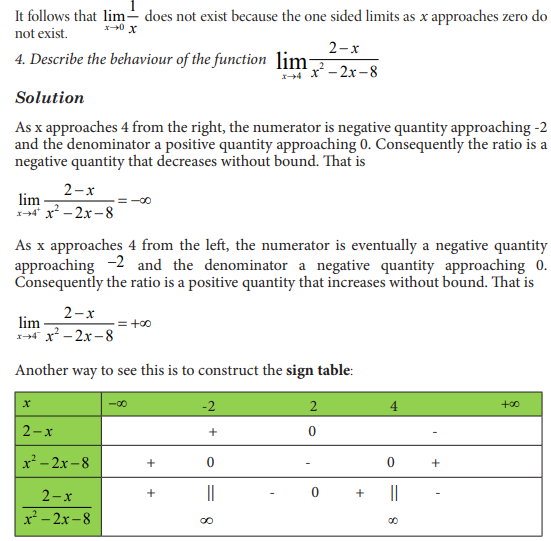
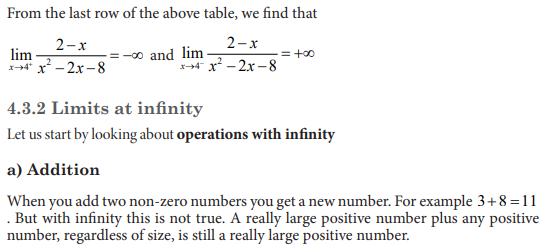
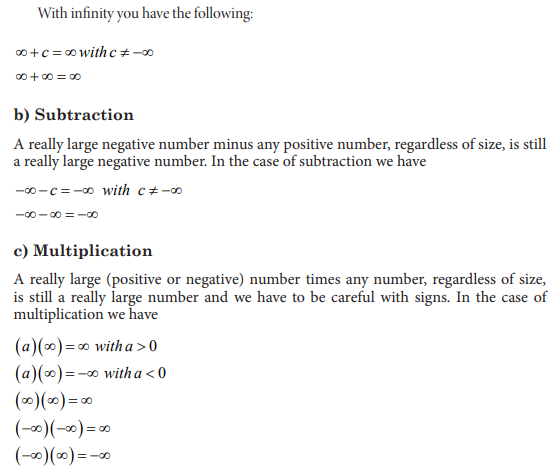
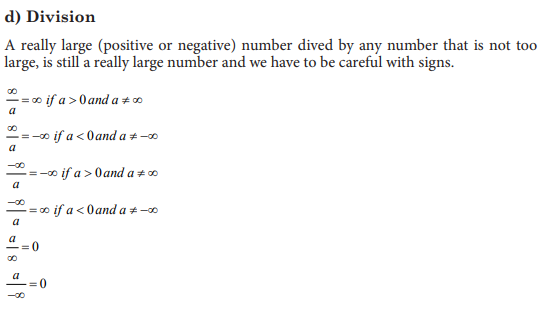
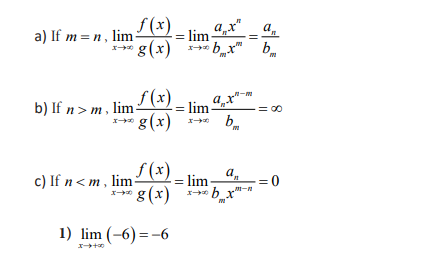
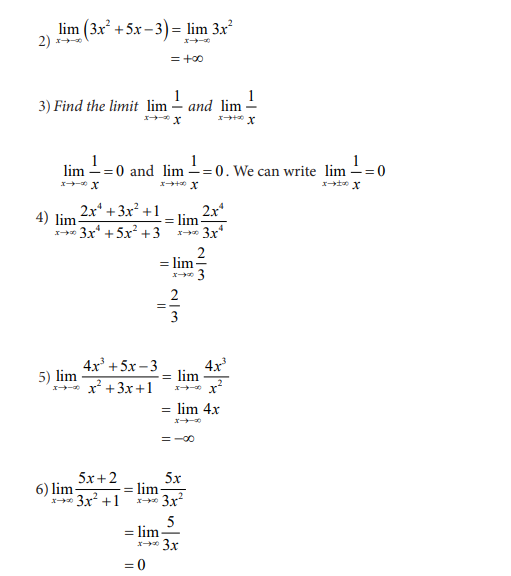
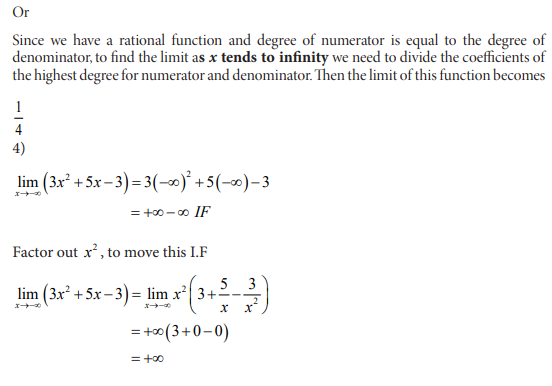
4.3 Limits of functions at infinity and involving infinity, indeterminate cases
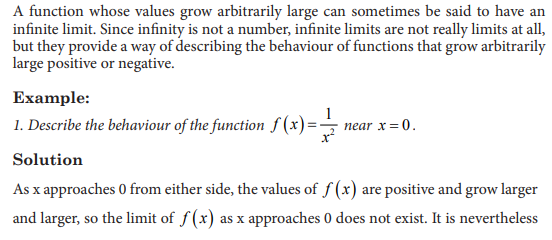
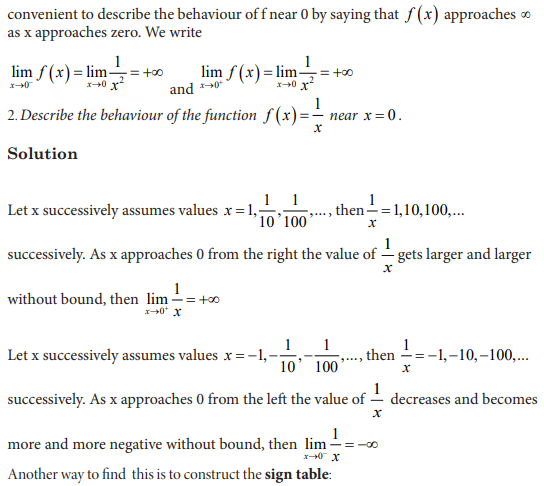
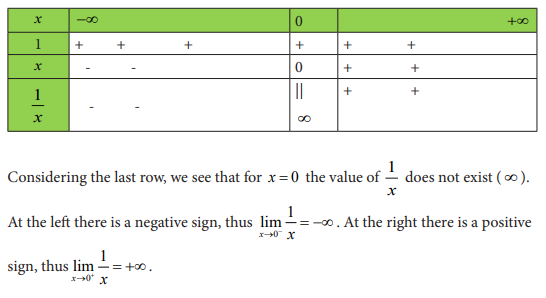
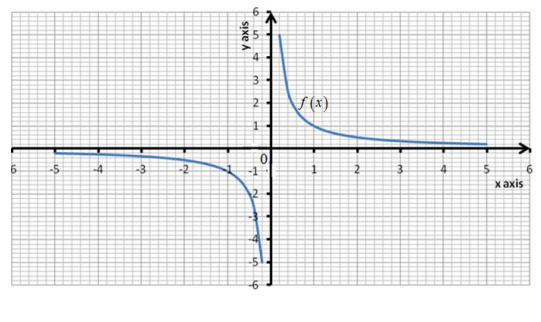
4.3.1 Infinite limits
Activity 4.3.1
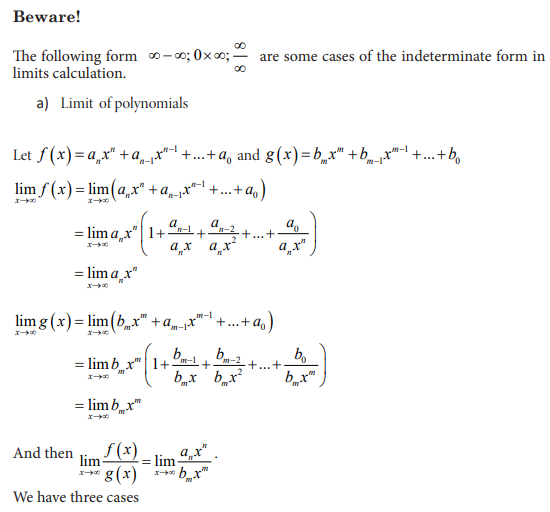
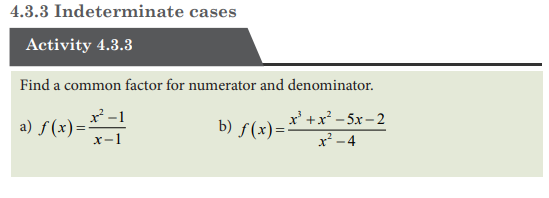
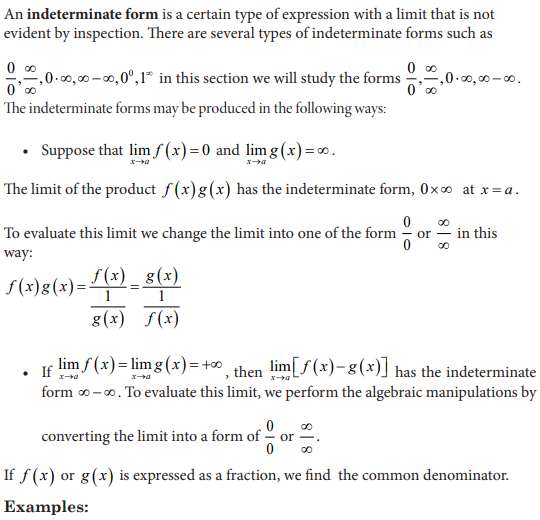
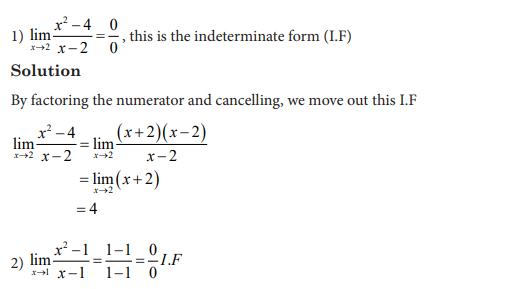

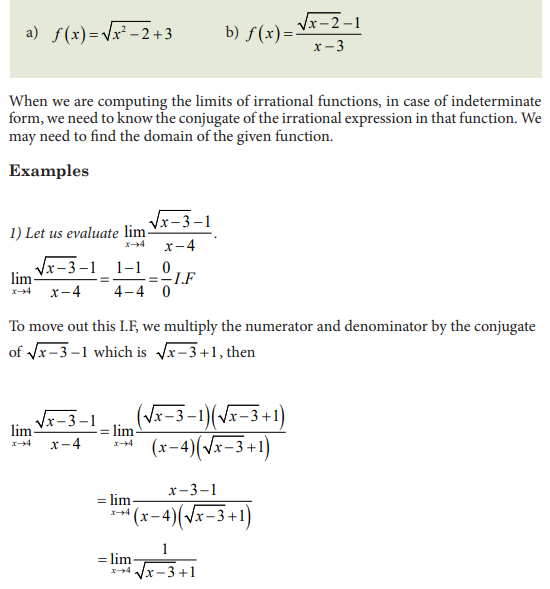
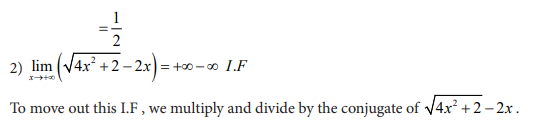
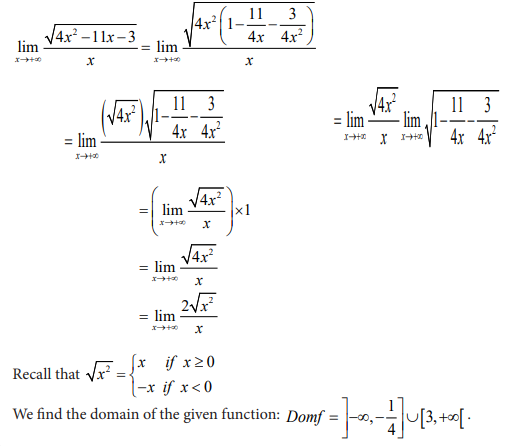
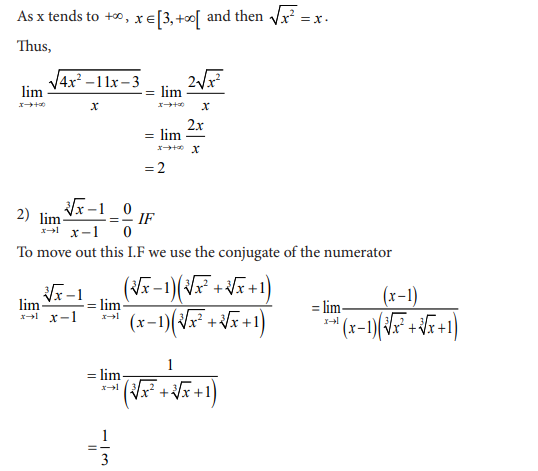
4.3.4 Indeterminate forms in irrational functions
Activity 4.3.4
What is the conjugate of the irrational expression in each of the following
functions?
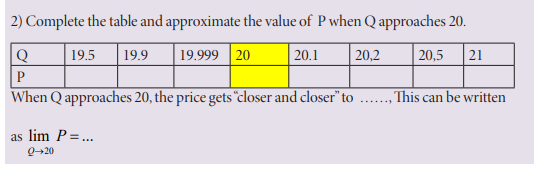
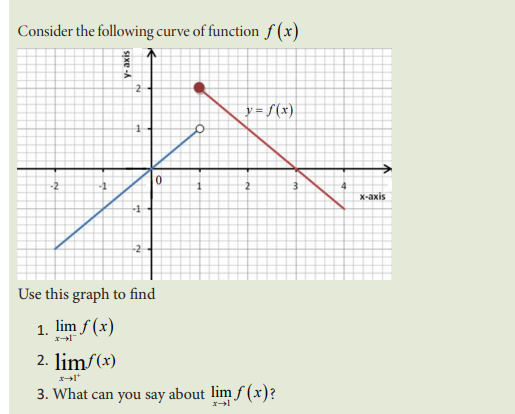
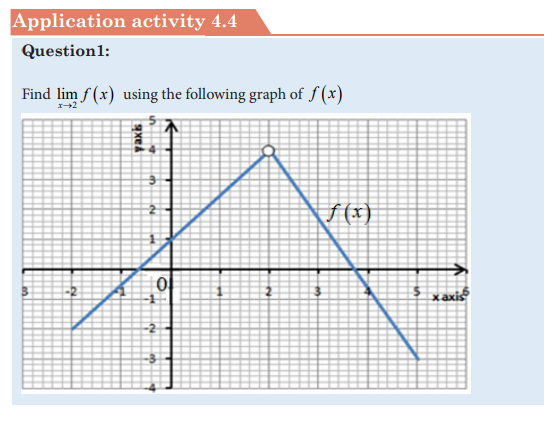
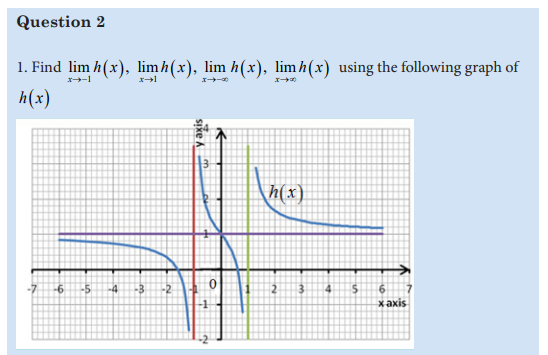
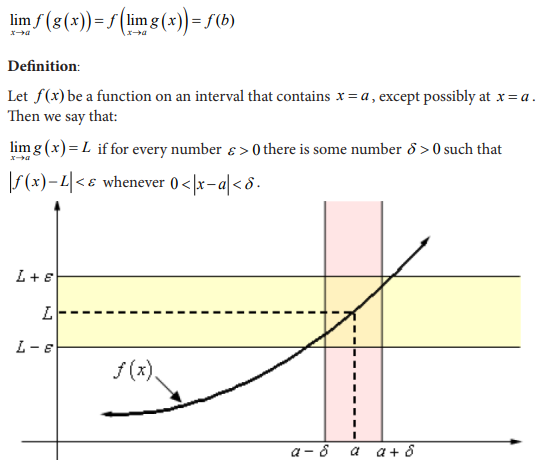
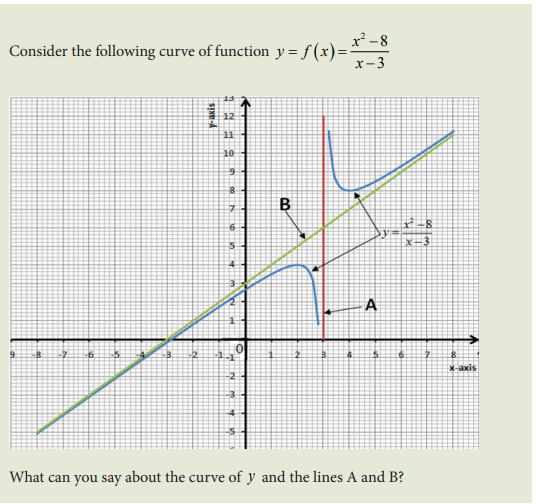
4.4 Graphical interpretation of limit of a function
Activity 4.

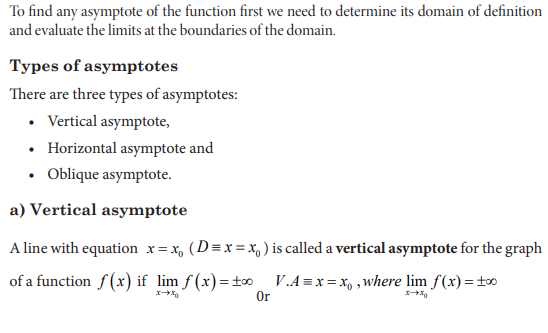
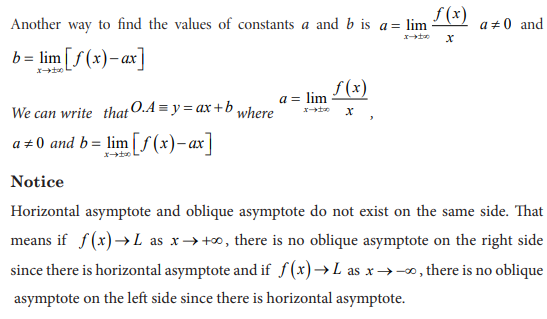
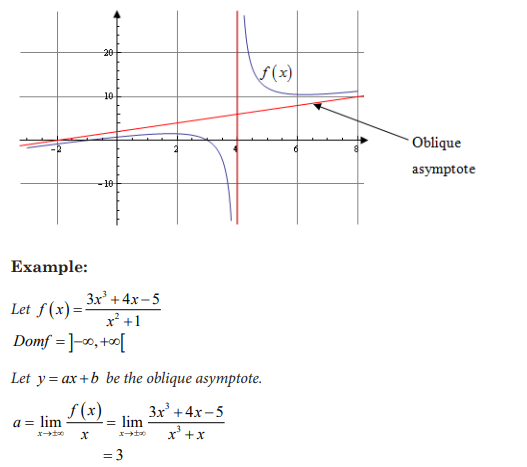
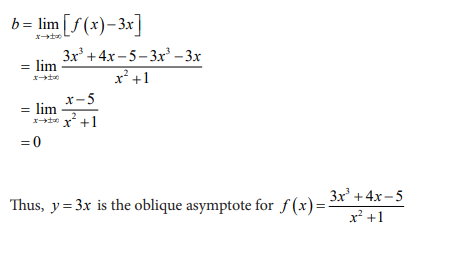
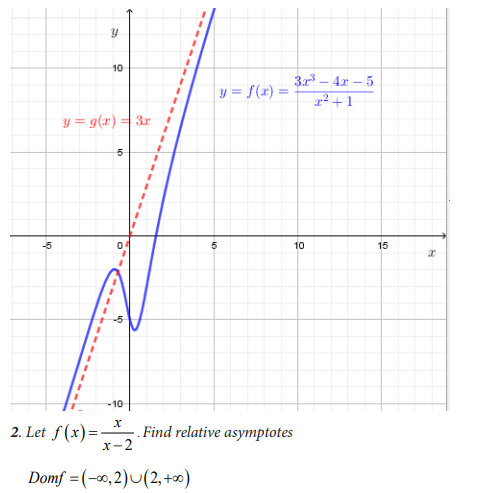
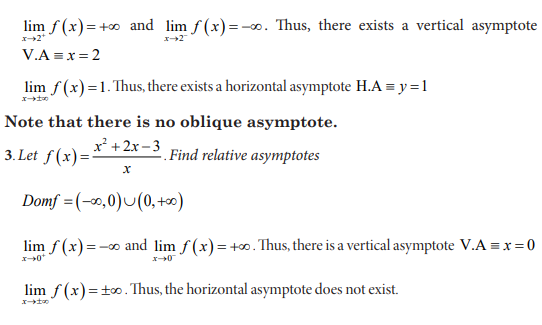
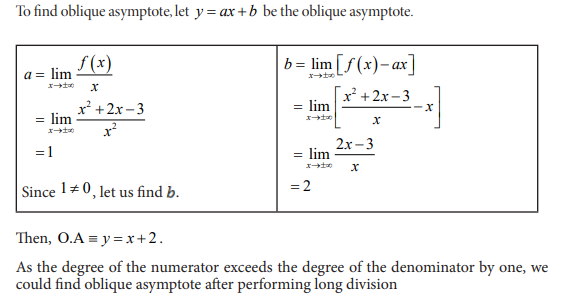
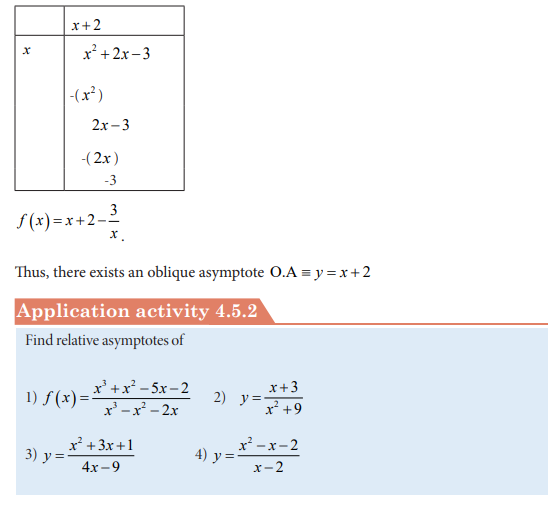
4.5.2 Asymptotes to curve of a function
Activity 4.5.2


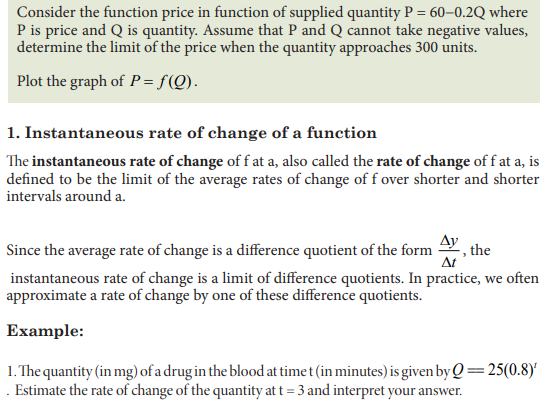
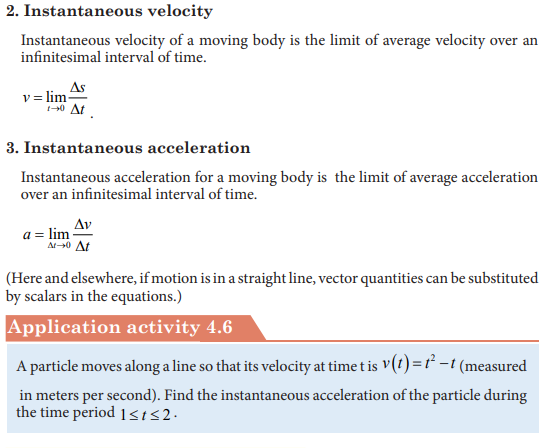
4.6 Applications of limits in real life: Solving Problems involving limits
Activity 4.6

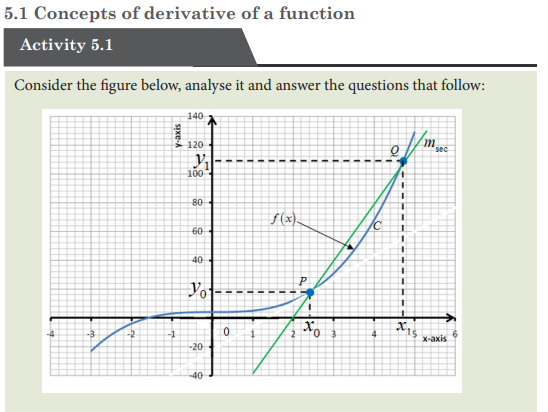
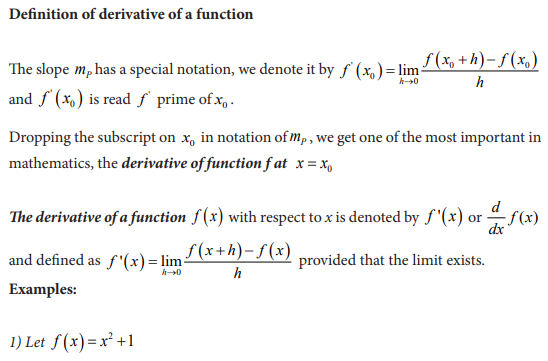
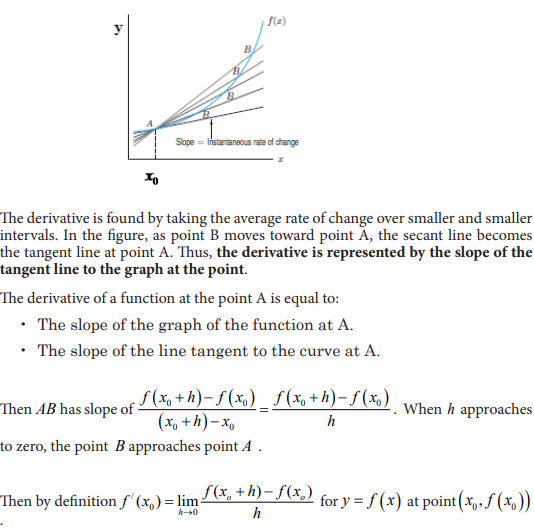
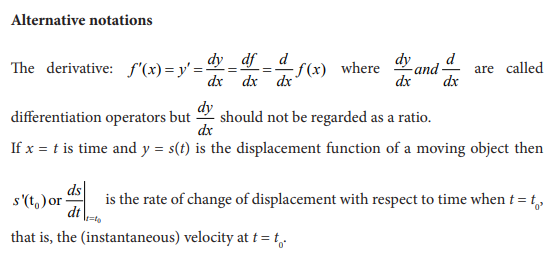
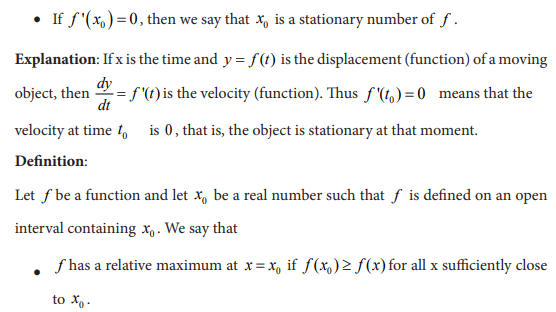
UNIT5:DERIVATIVE OF FUNCTIONS AND THEIR FUNCTIONS
Key Unit competence: Use the concepts of derivative to solve and interpret related
problems in various contexts
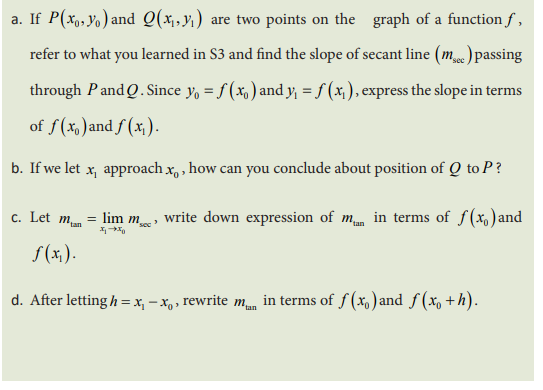
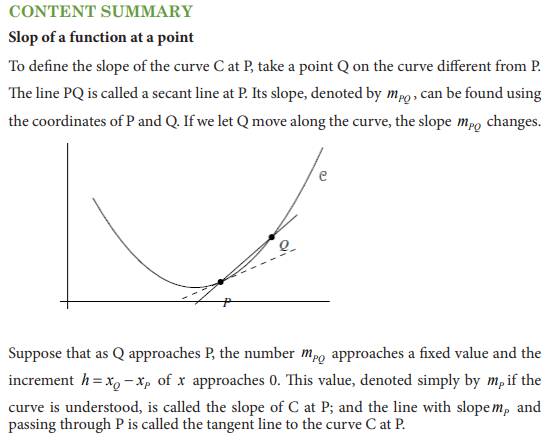
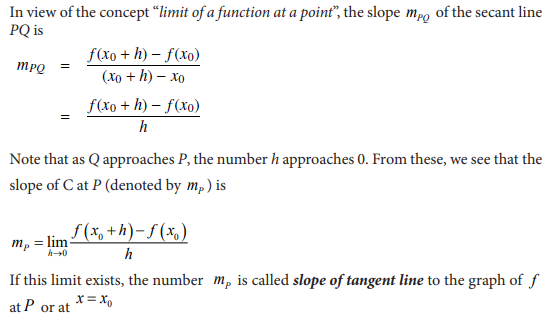
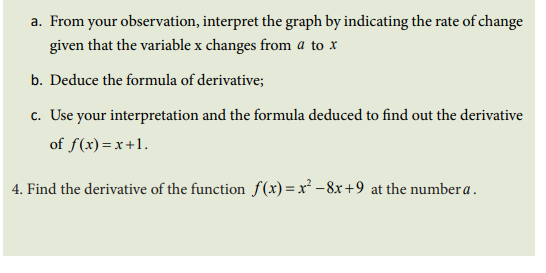
5.0. Introductory Activity

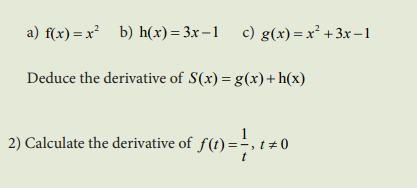
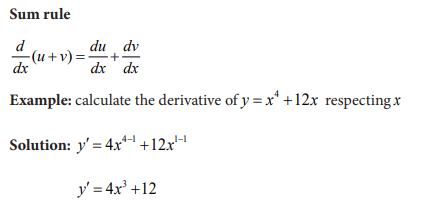
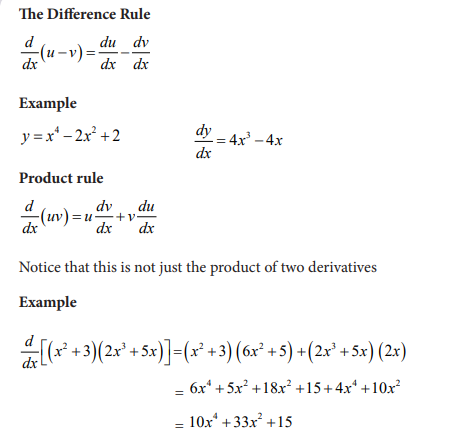
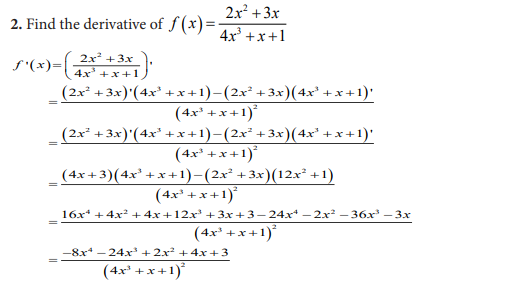
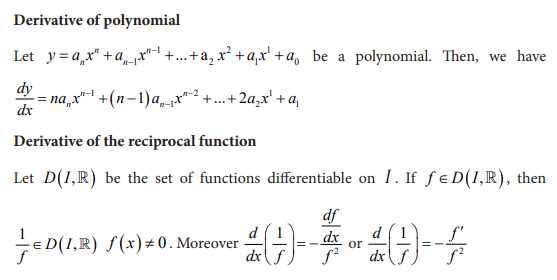
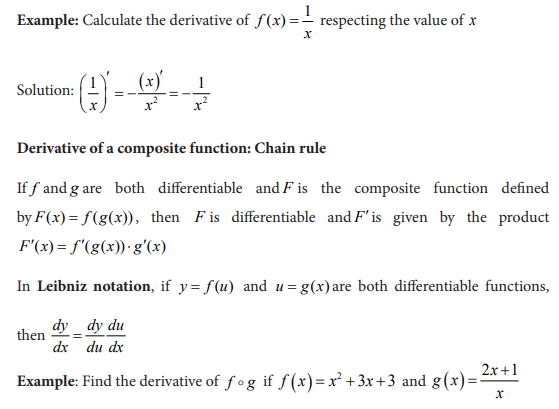
5.2 Rules of differentiation
Activity 5.2
1) Find the derivative of


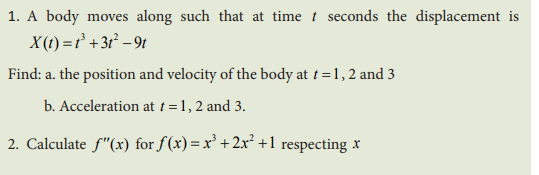
5.3 High order derivatives
Activity 5.3
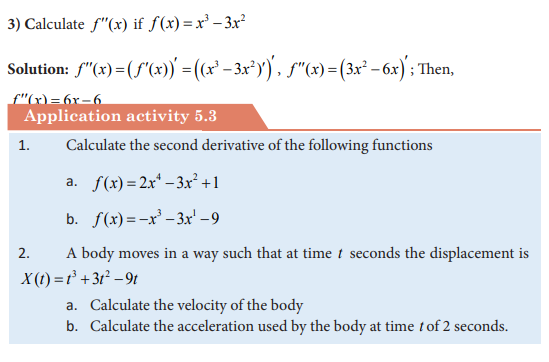
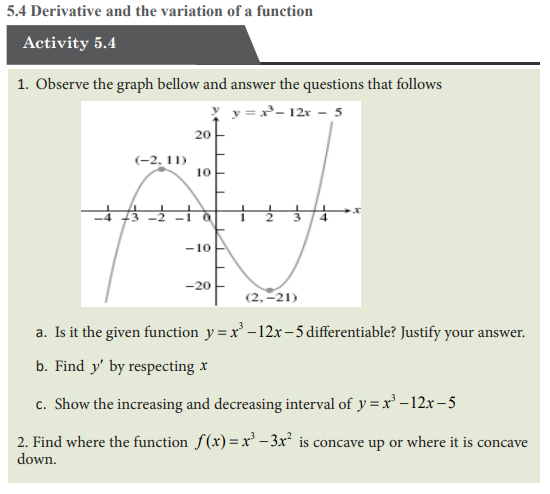


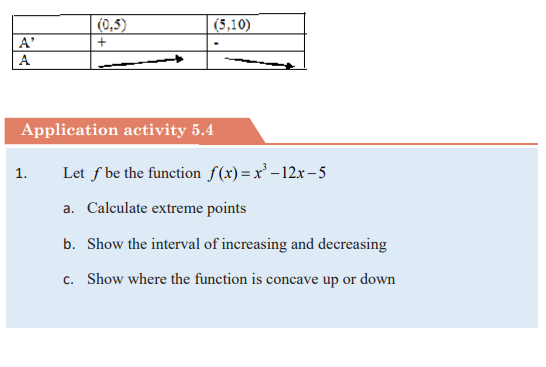
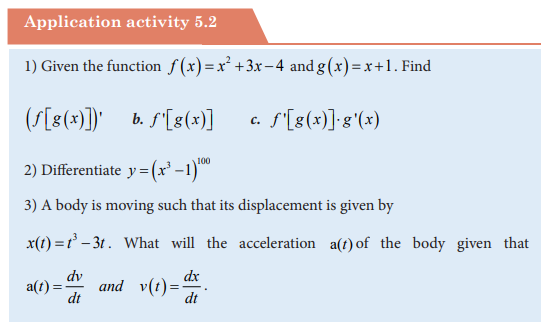
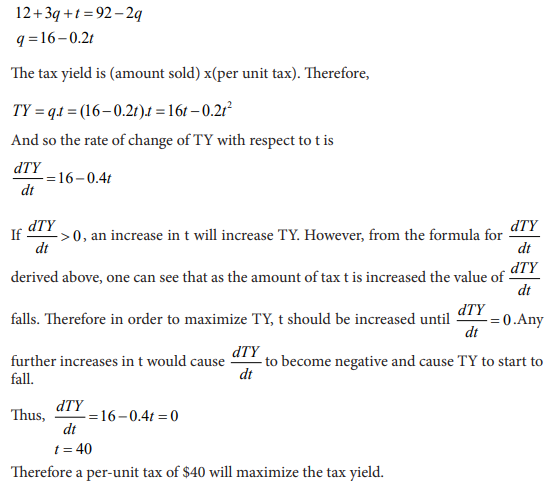
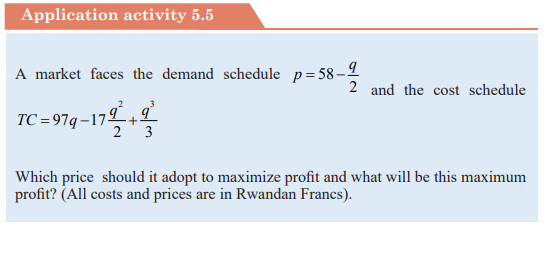
5.5 Applications of differentiation in Economics and finance
Activity 5.4
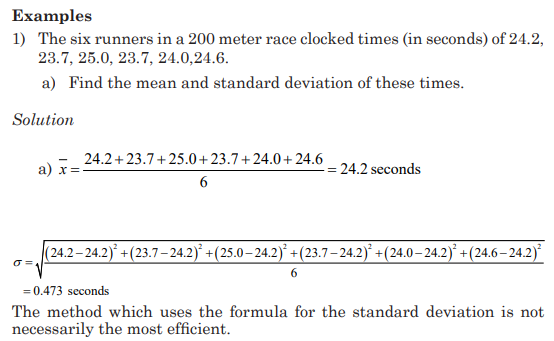
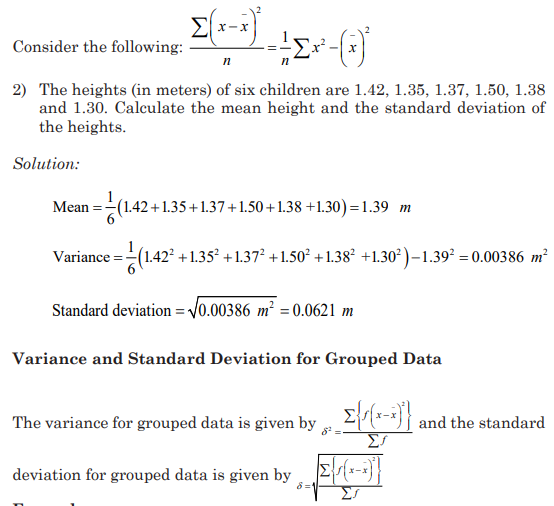
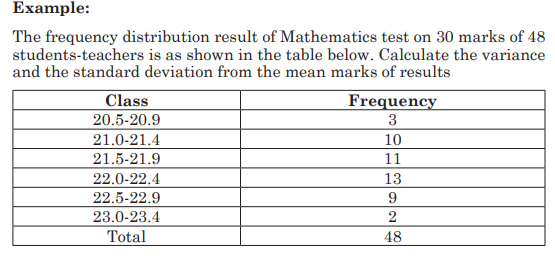
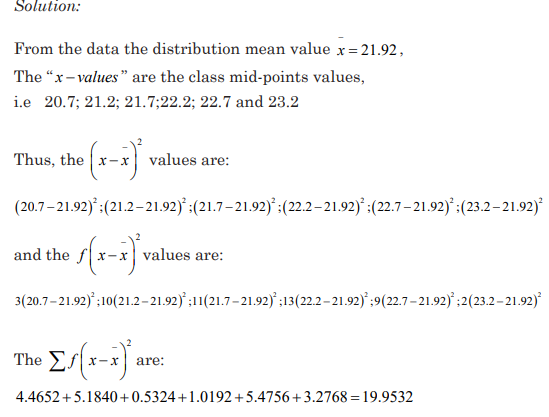
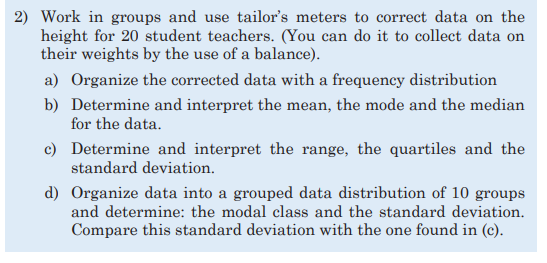
UNIT 6:DESCRIPTIVE STATISTICS
Key Unit competence: Analyse and interpret statistical
data from daily life situations
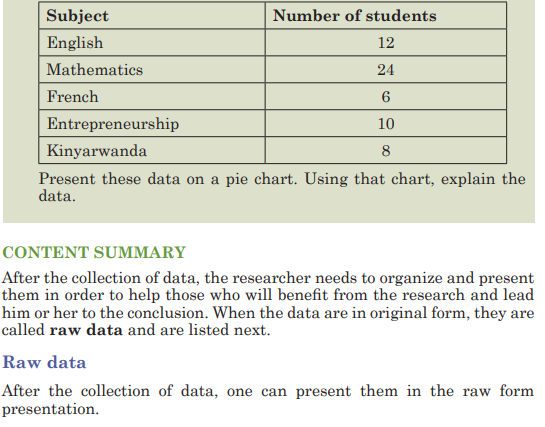
6.0. Introductory Activity
1) 1. At the market a fruit-seller has the following daily sales
Rwandan francs for five consecutive days: 1000Frw, 1200Frw,
125Frw, 1000Frw, and 1300Frw. Help her to determine the money
she could get if the sales are equally distributed per day to get the
same total amount of money

2) During the welcome test of Mathematics for the first term 10
student-teachers of year one language education scored the
following marks out of 10 : 3, 5,6,3,8,7,8,4,8 and 6.
a) What is the mean mark of the class?
b) Chose the mark that was obtained by many students.
c) Compare the differences between the mean of the group and
the mark for every student teacher.
6.1 Definition and type of data
Activity 6.1
Carry out research on statistics to determine the meanings of
statistics and types of data. Use your findings to select qualitative and
quantitative data from this list: Male, female, tall, age, 20 sticks, 45
student-teachers, and 20 meters, 4 pieces of chalk.
CONTENT SUMMARY
Statistics is the branch of mathematics that deals with data collection,
data organization, summarization, analysis and draws conclusions from
data.
The use of graphs, charts, and tables and the calculation of various
statistical measures to organize and summarize information is
called descriptive statistics. Descriptive statistics helps to reduce our
information to a manageable size and put it into focus.
Every day, we come across a wide variety of information in form of
facts, numerical figures or table groups. A variable is a characteristic
or attribute that can assume different values. Data are the values
(measurements or observations) that the variables can assume.
Variables whose values are determined by chance are called random
variables. A collection of data values forms a data set. Each value in
the data set is called a data value or a datum.
For example information related to profit/ loss of the school, attendance
of students and tutors, used materials, school expenditure in term or
year, etc. These facts or figure which is numerical or otherwise, collected
with a definite purpose is called data. This is the word derived from Latin
word Datum which means pieces of information.
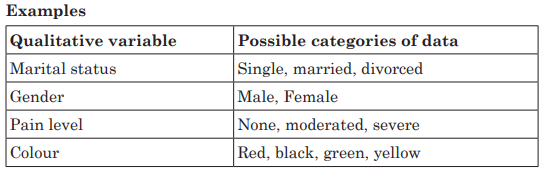
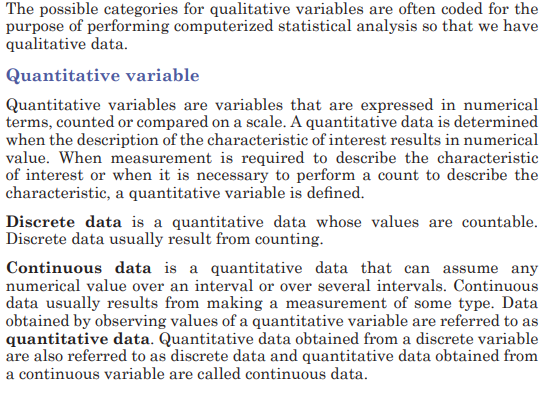
Qualitative variable
The qualitative variables are variables that cannot be expressed using
a number. A qualitative data is determined when the description of the
characteristic of interest results is a non-numerical value. A qualitative
variable may be classified into two or more categories. Data obtained by
observing values of a qualitative variable are referred to as qualitative
data.


The three most commonly used graphs in research are
1) The histogram.
2) The frequency polygon.
3) The cumulative frequency graph or ogive (pronounced o-jive).
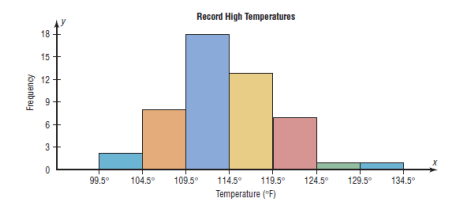
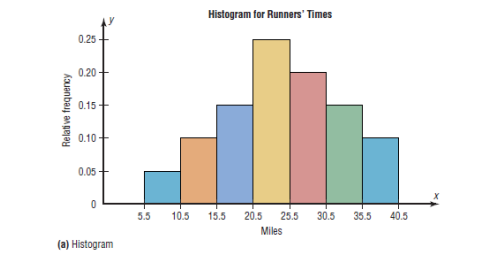
a)The Histogram
The histogram is a graph that displays the data by using contiguous
vertical bars (unless the frequency of a class is 0) of various heights to
represent the frequencies of the classes.
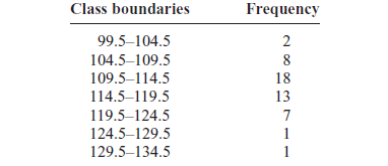
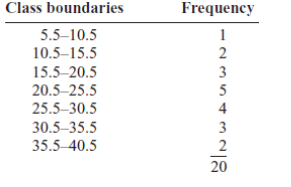
Example:
Construct a histogram to represent the data shown for the record high
temperatures for each of the 50 states
Step 1: Draw and label the x and y axes. The x axis is always the
horizontal axis, and the y axis is always the vertical axis.
Step 2: Represent the frequency on the y axis and the class boundaries
on the x axis.
Step 3: Using the frequencies as the heights, draw vertical bars for each
class. See Figure below
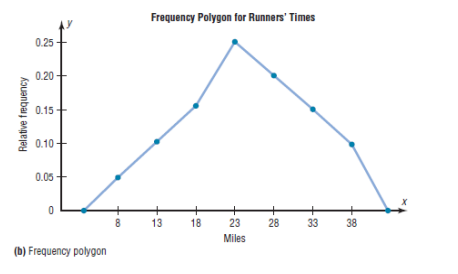
b)The Frequency Polygon
The frequency polygon is a graph that displays the data by using lines
that connect points plotted for the frequencies at the midpoints of the
classes. The frequencies are represented by the heights of the points.
Example:
Using the frequency distribution given in Example 2–4, construct a
frequency polygon
Step 1 Find the midpoints of each class. Recall that midpoints are found
by adding the upper and lower boundaries and dividing by 2:
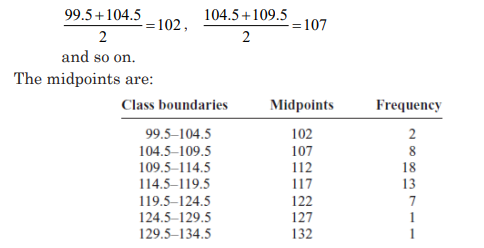
Step 2 Draw the x and y axes. Label the x axis with the midpoint of each
class, and then use a suitable scale on the y axis for the frequencies.
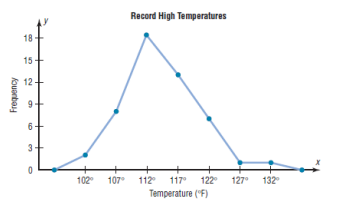
Step 3 Using the midpoints for the x values and the frequencies as the y
values, plot the points.
Step 4 Connect adjacent points with line segments. Draw a line back to
the x axis at the beginning and end of the graph, at the same distance
that the previous and next midpoints would be located, as shown in
Figure 2–3
The frequency polygon and the histogram are two different ways to
represent the same data set. The choice of which one to use is left to the
discretion of the researcher.
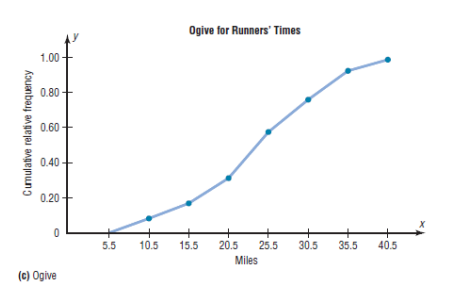
c) The Ogive
The ogive is a graph that represents the cumulative frequencies for the
classes in a frequency distribution.
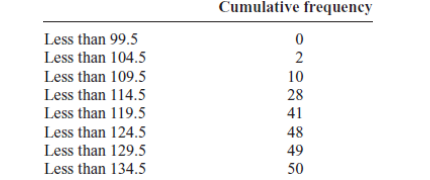
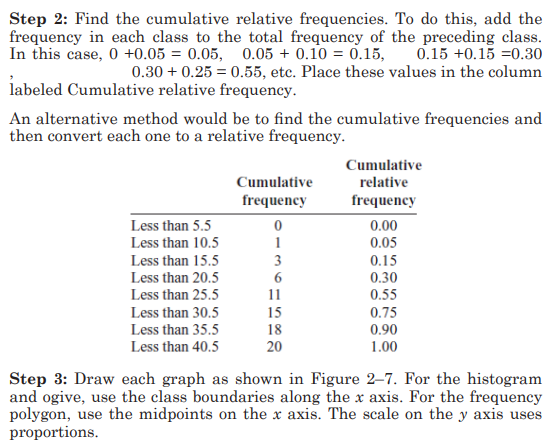
Step 1: Find the cumulative frequency for each class
Step 2: Draw the x and y axes. Label the x axis with the class boundaries.
Use an appropriate scale for the y axis to represent the cumulative
frequencies.
(Depending on the numbers in the cumulative frequency columns, scales
such as 0, 1, 2, 3, . . . , or 5, 10, 15, 20, . . . , or 1000, 2000, 3000, . . . can
be used.
Do not label the y axis with the numbers in the cumulative frequency
column.) In this example, a scale of 0, 5, 10, 15, . . . will be used.
Step 3 Plot the cumulative frequency at each upper class boundary, as
shown in Figure below. Upper boundaries are used since the cumulative
frequencies represent the number of data values accumulated up to the
upper boundary of each class.
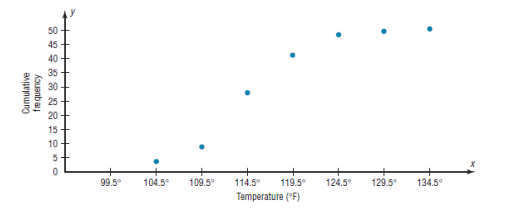
Step 4 Starting with the first upper class boundary, 104.5, connect
adjacent points with line segments, as shown in the figure. Then extend
the graph to the first lower class boundary, 99.5, on the x axis.
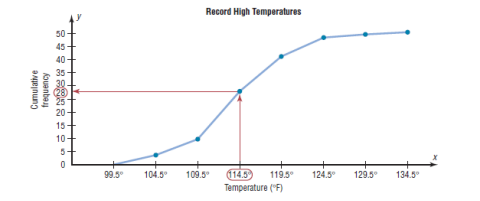
Cumulative frequency graphs are used to visually represent how many
values are below a certain upper class boundary. For example, to find
out how many record high temperatures are less than 114.5_F, locate
114.5_F on the x axis, draw a vertical line up until it intersects the graph,
and then draw a horizontal line at that point to the y axis. The y axis
value is 28, as shown in the figure.
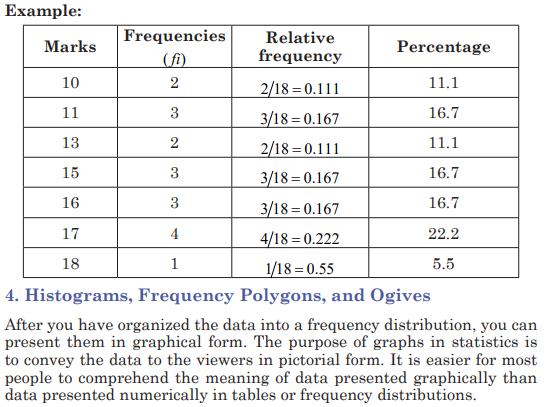
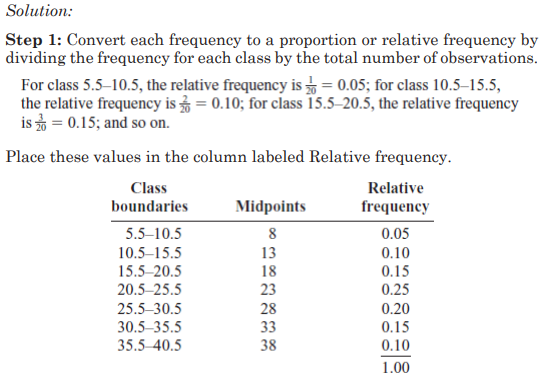
5. Relative Frequency Graphs
The histogram, the frequency polygon, and the ogive shown previously
were constructed by using frequencies in terms of the raw data. These
distributions can be converted to distributions using proportions instead
of raw data as frequencies. These types of graphs are called relative
frequency graphs.
Example:
Construct a histogram, frequency polygon, and ogive using relative
frequencies for the distribution (shown here) of the kilometers that 20
randomly selected runners ran during a given week.

7. Stem and Leaf Plots
The stem and leaf plot is a method of organizing data and is a combination
of sorting and graphing. It uses part of the data value as the stem and
part of the data value as the leaf to form groups or classes. It has the
advantage over a grouped frequency distribution of retaining the actual
data while showing them in graphical form.
Examples:
1) At an outpatient testing center, the number of cardiograms performed
each day for 20 days is shown. Construct a stem and leaf plot for the
data.
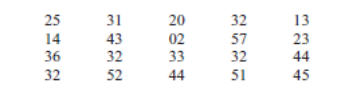
Step 1: Arrange the data in order: 02, 13, 14, 20, 23, 25, 31, 32, 32,
32, 32, 33, 36, 43, 44, 44, 45, 51, 52, 57
Note: Arranging the data in order is not essential and can be
cumbersome when the data set is large; however, it is helpful in
constructing a stem and leaf plot. The leaves in the final stem and
leaf plot should be arranged in order.
Step 2 Separate the data according to the first digit, as shown.
02 13, 14 20, 23, 25 31, 32, 32, 32, 32, 33, 36, 43, 44, 44, 45 51, 52, 57
Step 3: A display can be made by using the leading digit as the stem
and the trailing digit as the leaf.
For example, for the value 32, the leading digit, 3, is the stem and
the trailing digit, 2, is the leaf. For the value 14, the 1 is the stem and
the 4 is the leaf. Now a plot can be constructed as follows:
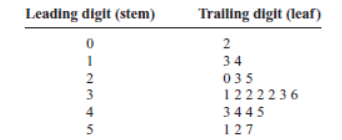
It shows that the distribution peaks in the center and that there are
no gaps in the data. For 7 of the 20 days, the number of patients
receiving cardiograms was between 31 and 36. The plot also shows
that the testing center treated from a minimum of 2 patients to a
maximum of 57 patients in any one day.
If there are no data values in a class, you should write the stem
number and leave the leaf row blank. Do not put a zero in the leaf
row.
2) The mathematical competence scores of 10 student-teachers
participating in mathematics competition are as follows: 15, 16, 21,
23, 23, 26, 26, 30, 32, 41. Construct a stem and leaf display for these
data by using 2, 3, and 4 as your stems.

This means that data are concentrated in twenties.
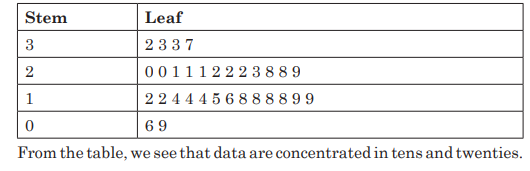
3) The following are results obtained by student-teachers in French out
of 50.
37, 33, 33, 32, 29, 28, 28, 23, 22, 22, 22, 21, 21, 21, 20,
20, 19, 19, 18, 18, 18, 18, 16, 15, 14, 14, 14, 12, 12, 9, 6
Use stem and leaf to display data
Solution:
Numbers 3, 2, 1, and 0, arranged as a stems to the left of the bars.
The other numbers come in the leaf part.
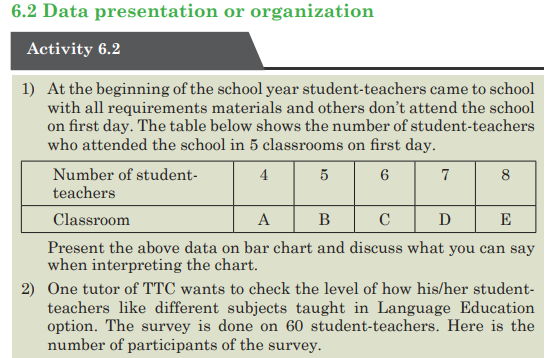
Application activity 6.2
1) Suppose that a tutor conducted a test for student-teachers and
the marks out of 10 were as follows: 3 3 3 5 6 4 6 7 8 3 8 8 8
10 9 10 9 10 8 10 6
a) Draw a frequency table;
b) Draw a relative frequency table and calculate percentage for
each;
c) Present data in cumulative frequency table, hence show the
number of student-teachers who did the test.
2) During the examination of English student-teacher got the
following results out of 80: 54, 42, 61, 47, 24, 43, 55, 62, 30, 27, 28,
43, 54, 46, 25, 32, 49, 73, 50, 45.
Present the results using stem and leaf.
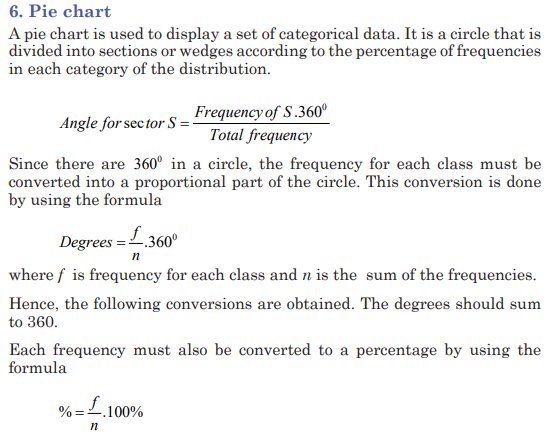
3) A firm making artificial sand sold its products in four cities: 5%
was sold in Huye, 15% in Musanze, 15% in Kayonza and 65% was
sold in Rwamagana.
a) What would be the angles on pie chart?
b) Draw a pie chart to represent this information.
c) Use the pie chart to comment on these findings
6.3 Graph interpretation and Interpretation of statistical data
Activity 6.3
The graph below shows the sizes of sweaters worn by 30 year 1
students in a certain school. Observe it and interpret it by answering
the questions below it
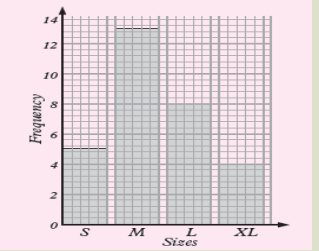
a) How many students are with small size?
b) How many students with medium size, large size and extra
large size are there?
CONTENT SUMMARY
Once data has been collected, they may be presented or displayed in
various ways including graphs. Such displays make it easier to interpret
and compare the data.
Examples
1) The bar graph shows the number of athletes who represented five
African countries in an international championship.
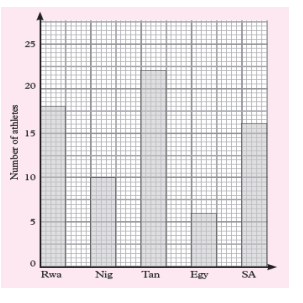
a) What was the total number of athletes representing the five
countries?
b) What was the smallest number of athletes representing one
country?
c) What was the most number of athletes representing a country?
d) Represent the information on the graph on a frequency table.
Solution:
We read the data on the graph:
a) Total number of athletes are: 18 + 10 + 22 + 6 + 16 = 72 athletes
b) 6 athletes
c) 22 athletes
d) Representation of the given information on the graph on a
frequency table.
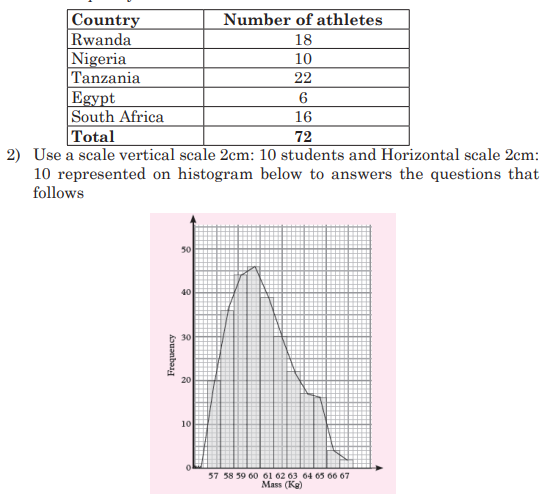
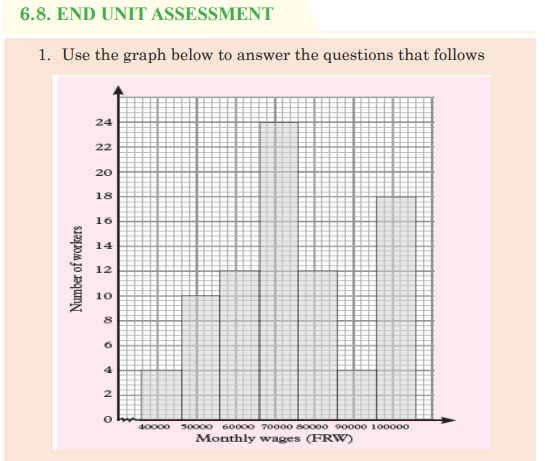
a) Estimate the mode
b) Calculate the range
Solution:
a) To estimate the mode graphically, we identify the bar that
represents the highest frequency. The mass with the highest
frequency is 60 kg. It represents the mode.
b) The highest mass = 67 kg and the lowest mass = 57 kg
Then, The range=highest mass-lowest mass=67 57 10 kg kg kg − =
Application activity 6.3
The line graph below shows bags of cement produced by CIMERWA
industry cement factory in a minute.
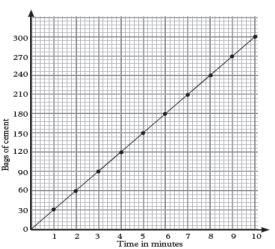
a) Find how many bags of cement will be produced in: 8 minutes,
3 minutes12 seconds, 5 minutes and 7 minutes.
b) Calculate how long it will take to produce: 78 bags of cement.
c) Draw a frequency table to show the number of bags produced
and the time taken.
6.4 Measures of central tendencies for ungrouped data
Activity 6.4
Conduct research in the library or on the internet and explain
measures of central tendency, their types and provide examples.
Insist on explaining how to determine the Mean, Mode, Median and them
role when interpreting statistic data.
CONTENT SUMMARY
Measures of central tendency were studies in S1 and S2.
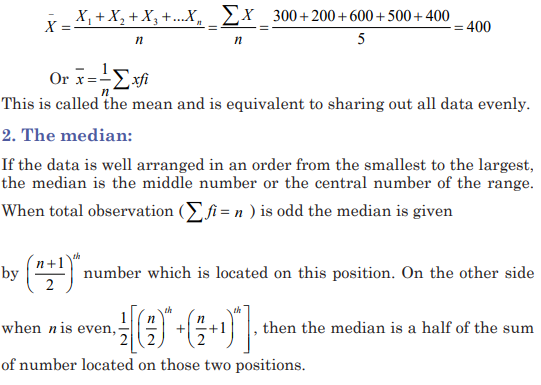
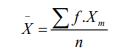
1. The mean
The mean, also known as the arithmetic average, is found by adding the
values of the data and dividing by the total number of values.
Suppose that a fruit seller earned the flowing money from Monday to
Friday respectively: 300, 200, 600, 500, and 400 Rwandan francs. The
mean of this money explains the same daily amount of money that she
should earn to totalize the same amount in 5 days.

Application activity 6.4
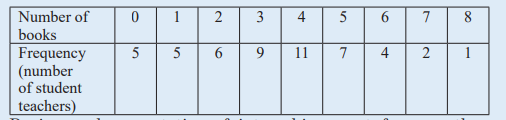
1) A group of student-teachers from language education were asked
how many books they had read in previous year, the results are
shown in the frequency table below. Calculate the mean, median
and mode of the number books read.
2) During oral presentation of internship report for year three
student-teachers the first 10 student-teachers scored the following
marks out of 10:
8, 7, 9, 10, 8, 9, 8, 6, 7 and 10
Calculate the mean and the median of the group.
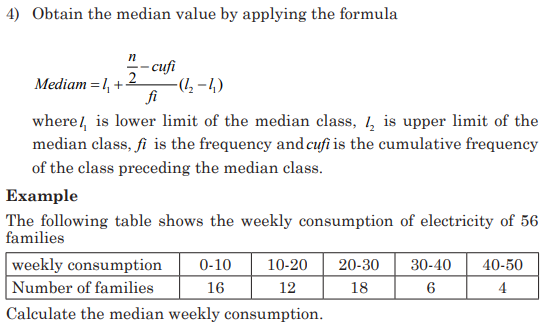
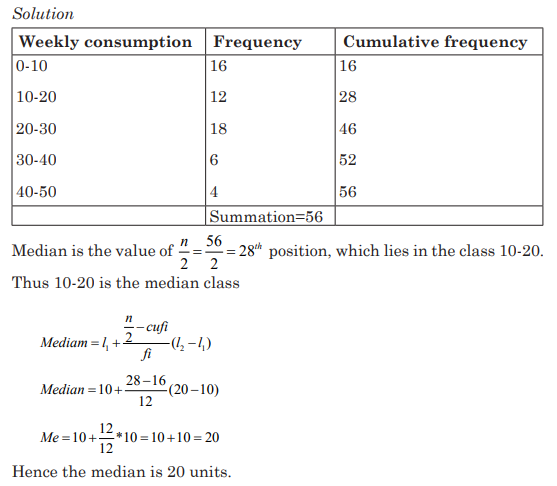
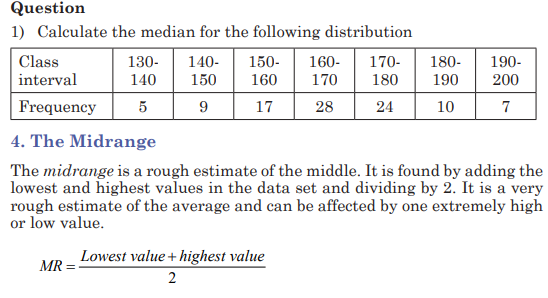
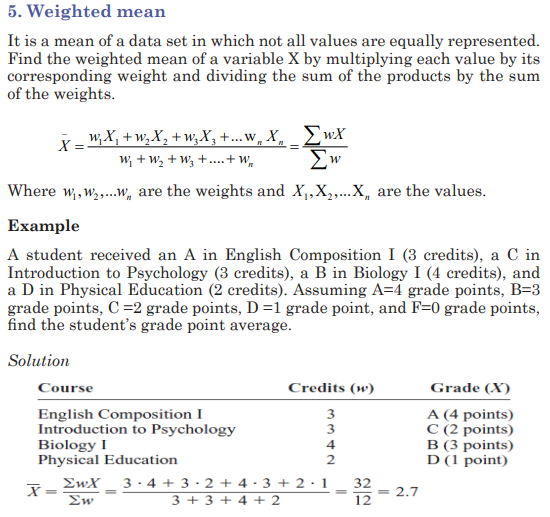
6.5 Measures of central tendencies for grouped data:
mode, mean, median and midrange
Activity 6.5
1) Conduct a research in the library or on the internet and explain
measures of central tendency for grouped data and provide
examples.
Insist on explaining how to determine the Mean, Mode, Median
and their role when interpreting statistic data.
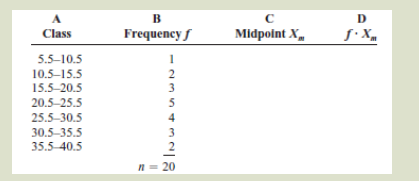
2) Using the frequency distribution given below, find the mean. The
data represent the number of kilometers run during one week for
a sample of 20 runners.
What does this mean represent considering the class in which it is
located in the data?
1. The mean
The process of finding the mean is the same as the one applied in the
ungrouped data with the exception that the midpoints mx of each class in
grouped data plays the role of x used in ungrouped data
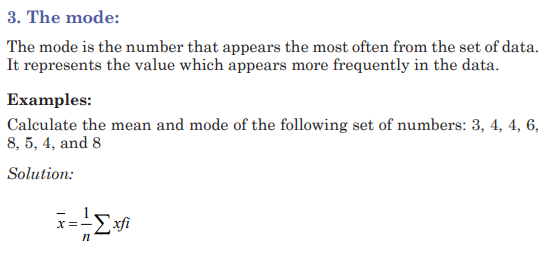
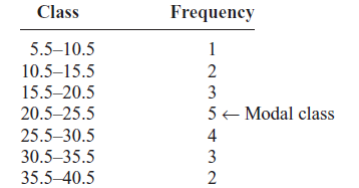
2. The mode
The mode for grouped data is the modal class. The modal class is the
class with the largest frequency. The mode can be determined using the
following formula:

Where:
L: the lower limit of the modal class
fm: the modal frequency
f1: the frequency of the immediate class below the modal class
f2: the frequency of the immediate class above the modal class
w: modal class width.
Example:
Find the modal class for the frequency distribution of kilometers that 20
runners ran in one week.


UNIT 7:ELEMENTARY PROBABILITY

7.0. Introductory Activity
A woman applying the family planning program considers the assumption that
one boy or one girl can be born at each delivery. If she wishes to have 3 children
including two girls and one boy, she knows that this is a case among other cases
which can happen for the 3 children she can have. Discuss all these cases and
deduce the chance the woman has for having a girl at the first and the second
delivery and a boy at the third delivery.

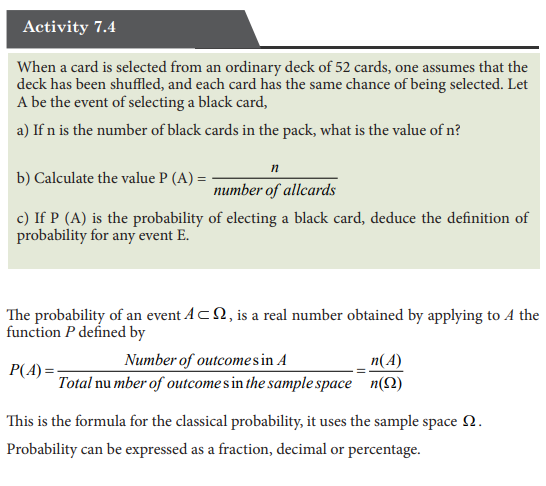
Activity 7.
Probability is the chance that something will happen.
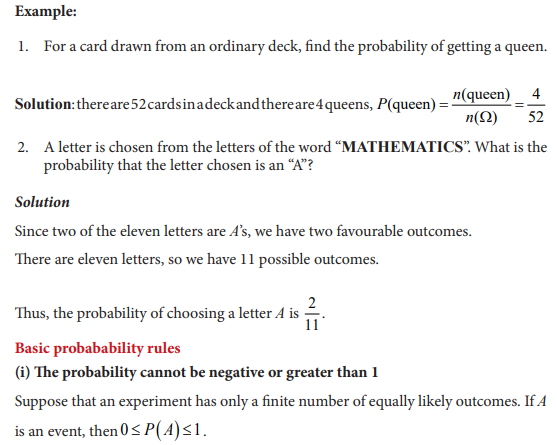
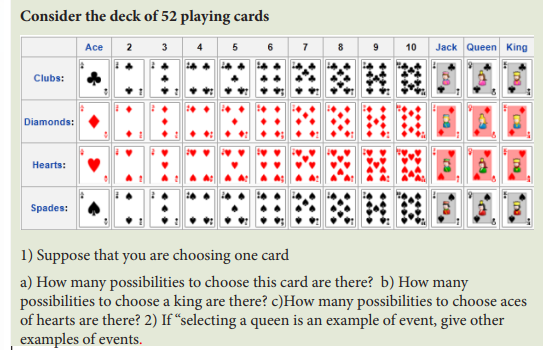
The concept of probability can be illustrated in the context of a game of 52 playing
cards. In a park of deck of 52 playing cards, cards are divided into four suits of 13
cards each. If a player selects a card at random (by simple random sampling), then
each card has the same chance or same probability of being selected.
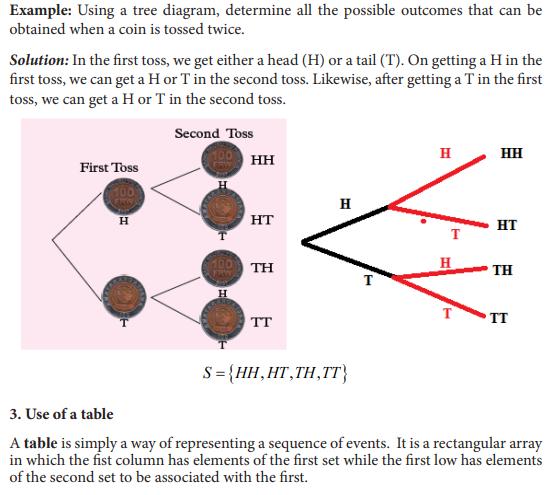
When a coin is tossed, it may show Head (H- face with logos) or Tail (T-face with
another symbol).
We cannot say beforehand whether it will show head up or tail up. That depends on
chance. The same, a card drawn from a well shuffled pack of 52 cards can be red or
black. That depends on chance. Such phenomena are called probabilistic. The theory
of probability is concerned with this type of phenomena.
Probability is a concept which numerically measures the degree of uncertainty and
therefore, of certainty of occurrence of events.
In most sampling situations we are generally not concerned with
sampling a specific individual but instead we concern ourselves with the
probability of sampling certain types of individuals.
Random experiments and Events
A random experiment is an experiment whose outcome cannot be predicted or
determined in advance.
Example of experiments:
– Tossing a coin,
– Throwing a dice
– Selecting a card from a pack of paying cards, etc.
In all these cases there are a number of possible results (outcomes) which can occur
but there is an uncertainty as to which one of them will actually occur.
Each performance in a random experiment is called a trial. The result of a trial in
a random experiment is called an outcome, an elementary event, or a sample point.
The totality of all possible outcome (or sample points) of a random experiment
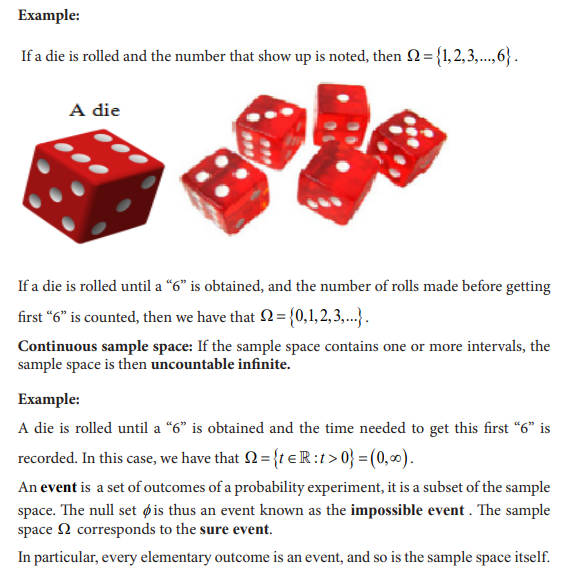
constitutes the sample space which is denoted by Ω . Sample space may be discrete
or continuous.
Discrete sample space:
• Firstly, the number of possible outcomes is finite.
• Secondly, the number of possible outcomes is countably infinite, which means
that there is an infinite number of possible outcomes, but the outcomes can be