Topic outline
General
- ICT S3 SB File Uploaded 25/01/22, 13:15
Unit 1: Application and Utility Software Installation
Key Unit Competence
Understand the functions of operating system; install and use application and utility software.
1.1 Operating system (OS)
operating system is a large and powerful program that controls and manages computer hardware and application software. It is the most important computer program.
operating system software runs and manages all the operations of the computer. All electronic devices use operating systems to work, for example; laptop computers, tablet, desktop computers, smartphone, router, etc.
he operating system that runs a laptop or desktop computer is commonly called Desktop Operating System (DOS). this includes; Microsoft Windows(with versions like Windows 10 and Windows 8, MacOS(from Apple and is formerly OSX), Chrome OS (designed by Google) and Linux (e.g. Ubuntu, Fedora).
Mobile operating system runs on smartphones, PDAs, tablet PCs and other mobile devices. examples include Android (manufactured by Google Inc.) and iOS (manufactured by Apple) etc.
Server operating system or server OS is installed and runs on servers e.g. web servers examples of server OS are: Windows server, Linux, and FreeBsD (Free Berkeley software Distribution)

When the user runs an application, the program sends requests to the operating system and the operating system commands the hardware to work as required by the user. Most of the work done by the operating system is hidden from the user, meaning the user does not need all the details going on but just sees the results.
1. Booting: the operating system is responsible for completing booting process of the computer. Booting is starting or restarting the computer. Cold boot starts the computer that has been turned off completely whereas warm boot restarts the computer’s operating system.
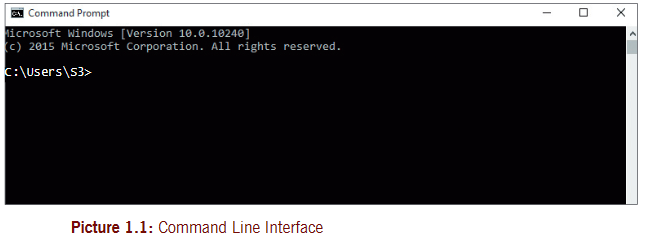
2. The operating system provides an appropriate User interface. the interface enables the user to interact with the computer software and hardware. the user interface can be Command-line interface (CLI) or Graphical user interface (GUI). With CLI, the user interacts with OS by typing in commands at the command prompt to perform specific tasks. examples include Disk operating system (Dos) such as Ms.Dos (Microsoft Disk operating system).
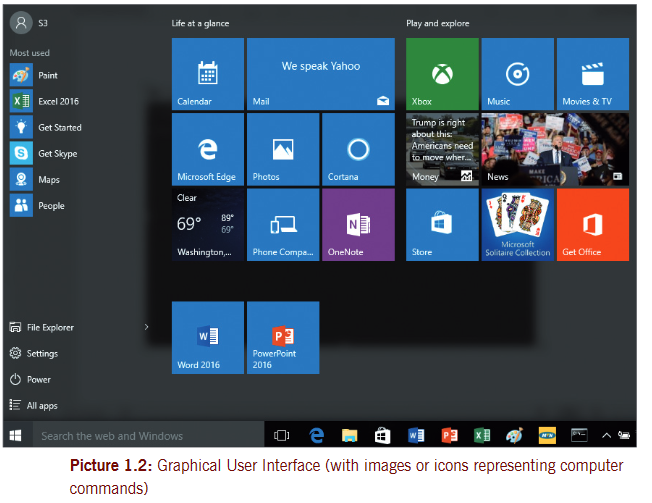
With GUI, the user interacts with OS by using a mouse to access windows, icons and menus e.g. Microsoft Windows (8 or 10)
3. Operating system manages resource allocation to various programs. the operating system loads programs in computer’s primary memory, runs them and allocates them run-time, memory space, processor time, input/output devices and instructions to use.
4. Memory management: the OS organizes how the primary memory is used by different programs through partitioning. Partitioning is the dividing of the primary memory to run different programs in different partitions or sections of the hard disk. When the size of the primary memory or RAM is not enough, the OS borrows a space from the hard disk and adds it to the primary memory or RAM. this memory is called Virtual memory or Virtual RAM. It enables the OS to run programs which require more memory than available RAM in the system, but it is much slower.
5. Manages user’s files. the OS manipulates how files are created, stored and retrieved using file system. When you store a file on a disk, it is stored in pieces and when you open it, the OS organizes those pieces together and opens your file. OS also handles tasks related to cutting, copying and deleting files and folders.
Note: File system is a method used by the operating system to name, store and organise files on a disk. For example Windows uses NTFS (New Technology File System).MacOS operating system uses a file system called HFS Plus or HFS+. HFS is written as Hierarchical File System. Linux has many file systems such as Ext 2, Ext 3, Ext 4, XFS, etc.
6. Operating system controls input/output peripherals. the operating system manages reading from the input peripheral devices and writing to all peripheral devices. It controls access to all peripherals through small programs called device drivers. A device driver is a program that controls how a specific device works with specific operating system. examples are: Printer driver, network driver and graphics driver.
7. Operating system manages files: operating system supervises the creation, storage, updating and deletion of files to various storage devices e.g. hard disk, flash disk, etc.
8. Operating system manages backup storage (secondary storage or auxiliary storage). operating system locates and retrieves files needed by user from backup storage and monitors how they are used.
9. Operating system manages security and access rights of computer users. In this case, the operating system monitors the creation of passwords, user names or account names on a computer. It also keeps record of who accesses the computer, the activities done and the resources used. In managing system security, the operating system guarantees that resources are used only for programs and users with appropriate authorization.
10. Operating system handles errors as they happen. When the computer is used, without user intervention or knowledge. It can suggest to the user what to do to correct errors through error messages.
there are several different types of operating systems and choice of which operating system to use depends mainly on; cost of buying the OS, hardware requirements to run the OS and user experience. the OS comes with two important components i.e. the Shell (which provide interface between the user and the operating system itself) and the Kernel (which provide interface between hardware and applications). You can install OS using different options among which are; fresh installation (done on a new computer or if the existing OS is damaged and cannot work); multi-boot installation (done when you install two or more different copies of OS on different parts of hard disk) and upgrading (done when you replace old version of OS with a new copy of OS e.g. replacing windows 7 with windows 10).
Activity 1.1
1. explain briefly the meaning of ‘operating system’ in the computer system.
2. Identify the operating system(s) that is installed in your school computers.
3. Discuss any five functions performed by the operating system in a computer.
4. Give an example of operating system that can be installed on each of the following devices:
a) PDA
b) Laptop computer
5. With clear examples discuss the following terms in computer system:
a) File system
b) User interface
1.3 Types of license for software
A software license is a legally binding agreement that specifies the terms of use for a software. It also defines the rights of the software producer and that of the end-user.
there are two types of licenses for software:
.open source software
.Proprietary software
1.3.1 Open Source License (General Public License or GPL)
Open source software is a computer program in which the source code is available to the general public for use or modification from its original design and free of charge.
Open source license is a license that allows the software to be freely used, modified and shared. this software license is widely used for free and guarantees end-users the freedom to run, study, share and modify software.
1.3.2 Proprietary license
Proprietary software is owned by an individual or company that developed it. the source code is kept almost secret, so you cannot modify it.
his means that the software is under restrictive copyright and the source code is hidden from users. Anybody cannot copy or change proprietary software unless permission is sought from owners. Most software today is proprietary.
Proprietary license is a software license in which the software publisher/owner grants a license to use one or more copies of software, but the ownership of those copies remains with the software publisher. the user must pay for the license before permission is given to use the software.
1.4 Download software
Download software means the transfer/copy of a software through the Internet from the remote computer (server) to a local machine or computer.
Downloaded software installation files (executable files) are commonly used for program installations.
Activity 1.2
Using a browser installed on your computer, download Google Chrome installation file from Internet onto your computer.
Step 1: open your Browser on the computer.
Step 2:Use the search engine and type “download Google Chrome” installation file in the search book.
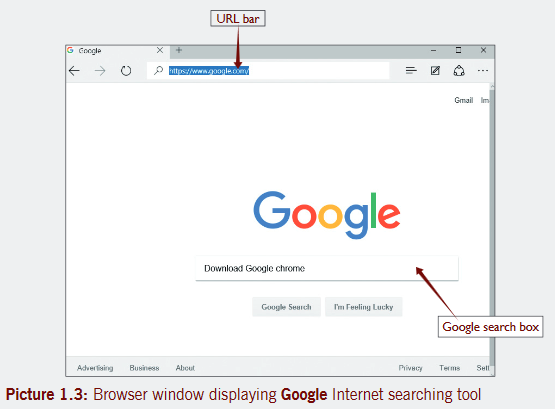
Step 3:Press enter key (Return key) on your keyboard. Doing this will start the search for the specified item. After a short time, the search results display. Scroll to find the best result.

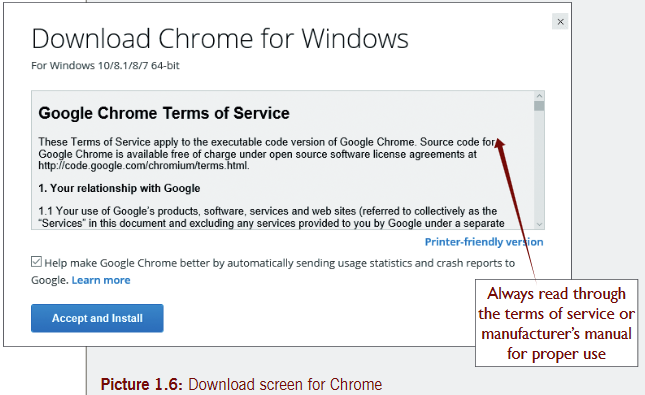
Step 4:Click the search result you think is best for you. this will take you to the items page. now click “for Personal Computers” the result will be as shown in the picture below.
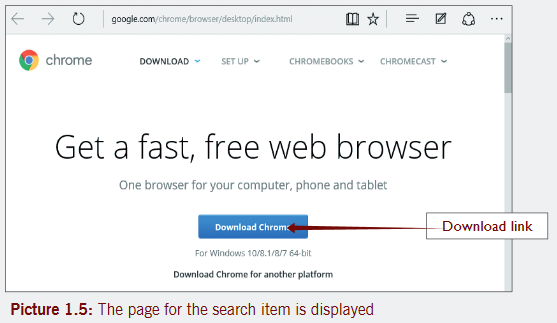
Step 5:Click the “Download Chrome” button.
Note: If you download chrome, it automatically installs itself and so you may not see the downloaded file, but an already working program
Step 6: open your downloaded file(s). Do this by clicking on the file’s name bar at the bottom of the browser or by navigating to the computer’s default download location, which is a folder called “Downloads”.
Note: By default, all downloaded software and files are kept in the folder called Downloads on your computer from where they are transferred to another location of user’s choice.
Some programs take long to download and to install and others strictly require Internet connection to complete installation.
Activity 1.3
Create a folder on your desktop using your first name and use it to save all the downloads.
Using installed browser, download the following software installation files.
a) Avast antivirus b) Mozilla Firefox
c) VLC media player d) Adobe reader
e) Chess game f) skype
1.5 Installation of software
the term Software Installation means, the process of copying installation files of a given program onto hard disk in a format that allows the computer to run the program. It means putting a computer program on a computer and ready for use.
You should always read the manufacturer’s installation manual to correctly install programs. this manual describes all the procedures and the necessary system requirements for successful installation.
System requirements for installing software
.Processor speed (the higher the speed the better)
. RAM size
.Hard disk space
.Graphics card
e.g. to install Windows 10, the minimum requirements usually include:
Processor 1 Gigahertz (GHZ) or faster processor or SoC (system on Chip or integrated circuit known as a chip).
RAM 1 Gigabyte (GB) for 32–bit or 2GB for 64-bit
Hard disk space 16GB for 32-bit OS or 20GB for 64-bit OS
Graphics Card Direct X 9 or later with WDDM (Windows Display Driver Model) 1.0 driver
WDDM is a graphic driver architecture for video card drivers running Microsoft Windows.
1.5.1 Installation of Operating system
operating system is installed in a separate section of hard disk referred to as disk partition. the hard disk is usually divided into multiple sections and each section or partition can operate independently of the other. Dividing hard disk into partitions is called disk partitioning.
Before you partition a disk, save or backup important files onto another disk because disk partitioning erases all the data on the disk and prepares it for new data using a particular file system such as FAT (File Allocation table) or NTFS.
the hard disk is usually partitioned when installing operating system. to partition your hard disk, insert in the optical drive a bootable DVD containing a desired operating system e.g. Windows 8 or Windows 10.
Note: While installing the OS, determine the type of file system you should use. File system is a method used by Operating system to keep track of files stored on computer. File systems commonly used by operating systems include: FAT32 and NTFS.
Modern operating systems such as Windows 10 mainly use NTFS (New Technology File System). Consider the type of file system best supported by OS or application software you want to use.
Since an Operating system has to take control of all other programs you will use, it must be installed first before other programs.
Activity 1.4
Provided with Windows 10 installation DVD or flash disk containing Windows 10 installation files, perform a fresh installation of Windows 10 on your computer.
Step 1:Backup all your data on an external storage device such as a flash drive or external hard drive. this is because clean installation deletes everything on your computer’s hard drive.
Step 2: start your computer and then connect the bootable USB flash drive or insert the bootable Windows 10 DVD on the PC where you want to install Windows 10.
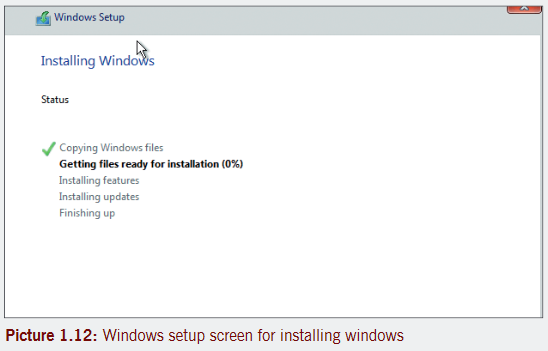
Step 3:Restart your PC, and then press any key to boot from the USB flash drive or the DVD. Press the key after seeing the message as shown below.

If you restart your PC and your current version of Windows starts, then open a boot menu or change the boot order in your computer’s BIOS or UEFI (Unified extensible Firmware Interface) settings so that your computer boots from the media.
Note: To open a boot menu or change the boot order, press a combination of keys (such as F2, F8, F9, F10, F12, Delete, or ESC) as soon as you turn on your PC. However, the key (s) you press depends on the manufacturer of your computer’s motherboard and it is usually displayed immediately the computer starts. Check it out.
once you get the boot menu, select the best boot order such as Optical disk drive then press enter key.
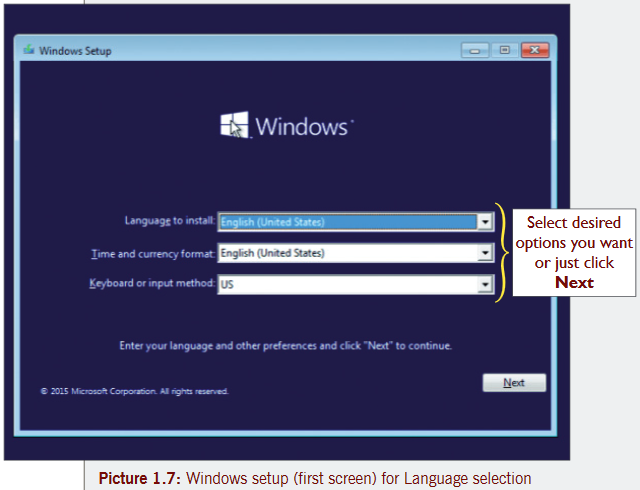
Step 4: on the first screen for Windows setup, select your language, time, keyboard preferences and then click on Next button on lower right.
Step 5: In the next screen, click on “Install Now” to install Windows.the new OS Windows 10 will start its installation. Make sure you don’t turn off your PC.

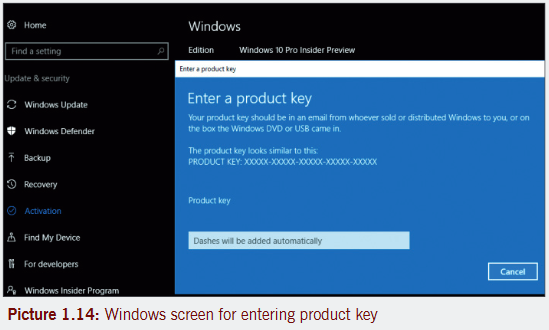
Step 6:In the next screen, you will be asked to provide a 25-character product key in the space provided. After entering it, click Next. However, if you don’t have a product key at the moment, click on Skip button so you will enter the product key later.
Step 7: the next screen is the License Agreement Window. If you have time, read through and then check the option labelled “I accept the License terms”. afterwards click Next button.

Step 8: In the next screen, you will see two options. to perform a clean installation, select Custom.
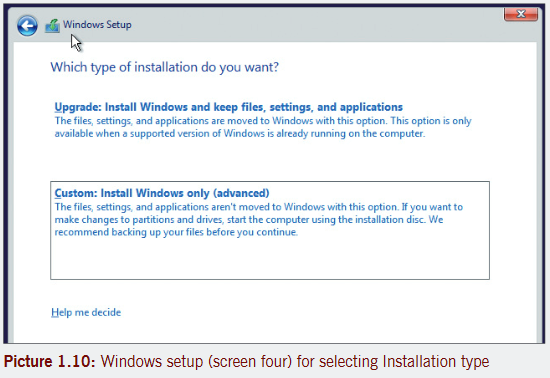
Note: Custom is selected to make fresh installation.
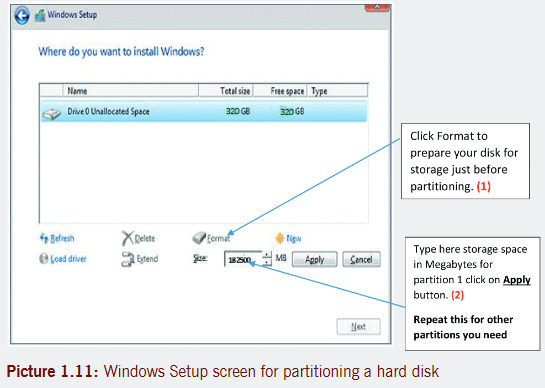
Step 9: select the drive on which to install Windows 10. You may need to format the drive for clean installation. select the drive and click on Format at the bottom of the window. In case you have just installed a new hard disk, you need to create a new partition to install Windows.
To create a partition
• select the hard drive and click on “New” button
• Allocate the space you want depending on the capacity of your hard disk.
• Click “Apply” to complete the process.
Note: The system additionally creates a partition with name “System Reserved” to ensure that the system works fine. Its size usually is 100MB.
Step 10: select partition where you want to install Windows 10 and click Next button.
At this point, the installation of Windows will start. It will take about 25 minutes to complete the installation process.
During the installation, your system may reboot two or three times but don’t press any key, leave everything to work automatically.
Step 11: once the installation is completed, a blue color screen displays.
Click on “Use Custom Settings” button if you want to go with default settings. You can also click on “Customize”button if you want to customize settings.

Follow on-screen instructions and a few minutes Windows 10 will be ready for use.
Note: If you did not enter the 25 character windows key above, then go to Settings -> Update & Security -> Activation. Enter the key to activate the windows.
1.5.2 Install Microsoft (MS) Office 2016 on selected computer(s)
Activity 1.5
You are provided with office 2016 Installation DVD. Install this application on your computer. Follow the steps below.
Step 1: obtain Ms office installation DVD (or download Installation file from the Internet.)
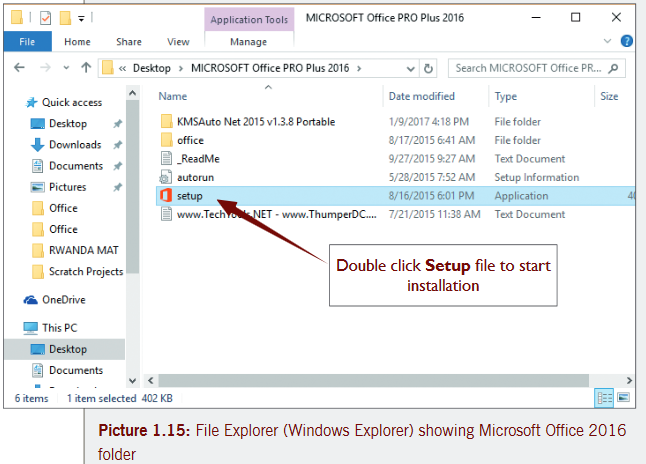
Step 2:Insert the disc in the optical drive (e.g. DVD Drive)the installation disc automatically launches setup wizard. (If the setup wizard doesn’t start automatically, open the disk drive or folder for office 2016 and double-click Setup file.see the picture below.
When the setup file is double-clicked, it displays the office screen as shown in Picture 1.16.
Remember:
to install application software successfully you must use an Administrator account, without which installation cannot take place. other types of accounts such as standard or limited accounts and Guest accounts do not have the privilege to install or uninstall software.If you normally use limited accounts for doing other practical activities, this time you should use an administrator account to install Microsoft office 2016 and other applications.

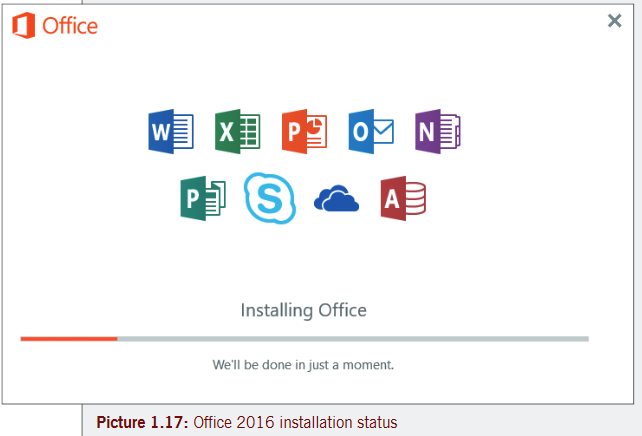
After a short time, the office installation screen appears to show the status of installation process as shown in picture 1.17.
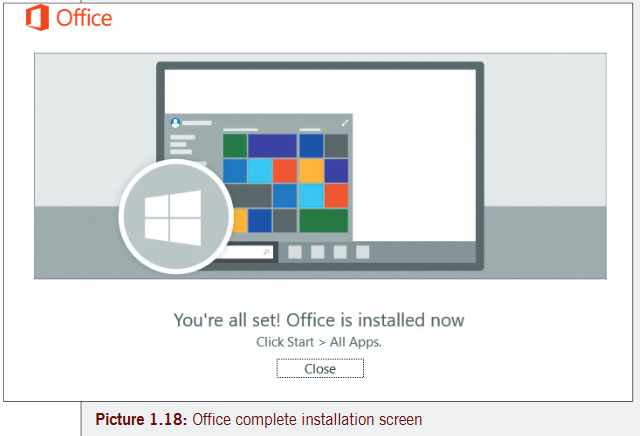
Step 3: Wait as office installs to complete the installation process. Click Close after the installation is complete (see picture 1.18).
Step 4: open an office application such as Word 2016. the message as shown in picture 1.20 may display on top of office (Word) 2016 Open back stage screen. In case you purchased a licensed product, close it and will not show again, start using office normally.
If you purchased a non-licensed product, and you have the product key, click on “enter a product key instead” (see picture 1.20).
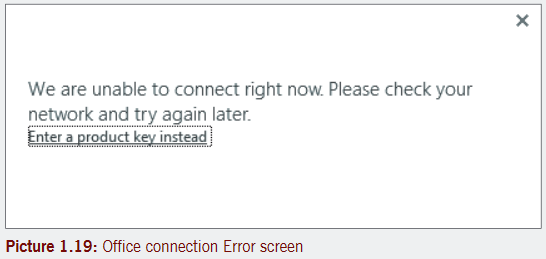
he Product key screen displays as shown below. type in your product key which must be 25 characters and then click on continue.

MS Office 2016 may not require a product key once you purchase a licensed copy.
Note: Product key is a specific software-based key for a computer program and certifies that the copy of the program is original. If you do not have product key, you may fail to use the software installed normally or if the product key is required before installation you may fail to install the software. The location of your product key depends on how you got a copy of the software.
Step 5:Afterwards office installs; click close after installation is complete.
Step 6:If the activation wizard displays, click “I want to activate the software over the Internet” and then follow prompts.
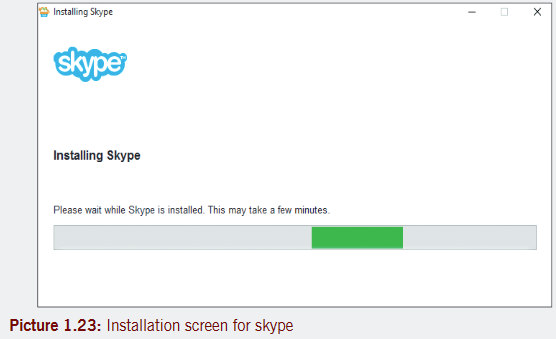
1.5.3 How to install application software (installing skype)
Procedure
Step 1: obtain a disc that contains the software to be installed. If you earlier downloaded the software, then check for the software from the folder where you save on the desktop.
Step 2: Insert the disc in the disk drive.
Step 3: open the disc. open the folder containing installation files.
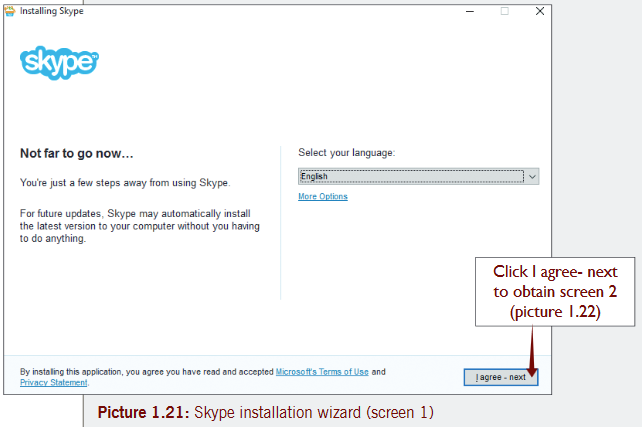
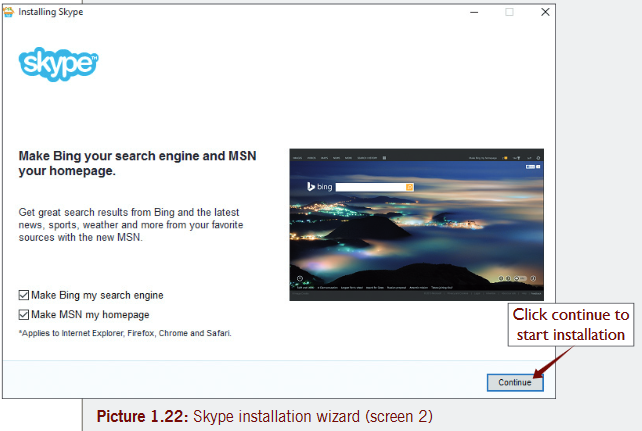
Step 4: Double click on the setup file for skype to install. the wizard for installation starts as shown in picture 1.21.
Note: Many Application programs require internet connections. So ensure Internet is available for proper and complete installation.
f you are using the latest version of Windows 10, skype is already installed on it. Just sign in with skype name, email or phone.
Step 5: Repeat step 4 above and install the rest of the software you downloaded that includes: Adobe Acrobat Reader, Chess game, Avast antivirus and nero burning software.
Activity 1.6
Locate the software you downloaded in activity 1.3. Perform software installation of each of the installation files for;
a) Avast antivirus b) Mozila firefox
c) VLC media player d) Adobe (Acrobat) reader
e) nero burning software
1.5.4 Install Antivirus
this is a utility program used for scanning computer viruses and removing them from the computer.
Viruses can corrupt computer data on hard disk, delete most important operating system files and can make the system to crash. Always install updated antivirus software and ensure you scan your system regularly with the program. You can download and install the antivirus you want depending on user experience or information from other users like norton, Kaspersky, AVG, McAfee, Avast, etc. similar steps are used to download and install different anti-viruses.
Uninstall application software
take the following steps to uninstall (Google Chrome) an application software.
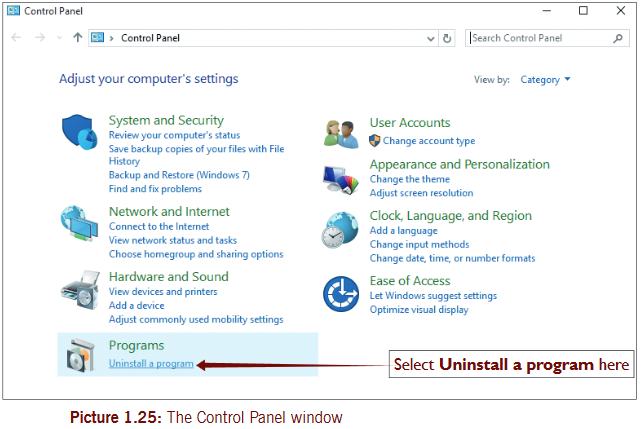
Step 1:Right click the start button and select Control Panel. (or type “Control panel” in the search box at the start and press enter).

Step 2:In the control panel window that displays (as shown in picture 1.25) select Uninstall a program under Programs option.
Step 3: In the Programs and Features screen, select Google Chrome (you can select another program you are sure you do not need and uninstall it). then click on Uninstall tab above programs list.

Step 4:Wait for the Windows Installer (as shown in picture 1.27) to gather all the features of (Google Chrome) program and remove them. Lastly close Control Panel.

Note: After uninstalling some applications such as MS Office, it requires to restart the computer to completely remove all the features. When you see a message prompting you to restart, please accept it.
1.6 Software add-on
this is a piece of software that adds a specific feature or capability to an existing software application. A software add-on cannot be run independently, it is just a software extension.
Examples of common add-ons are AdobeFlash, QuickTime and Silverlight.
Role of add-ons
.Interface change: the application can be dynamically extended to include new features which have friendly interface suitable for different users.
.Adding features: More features are added to the browser (program) to increase its usability
Download and install add-ons
Activity 1.7
Using Mozilla firefox Carryout a download to add various software extensions to your browser.
Step 1:Go to the Mozilla home page. You can use
Step 2:Click Add-ons (First scroll down the page).

Step 3: on the new page that displays, go to the add-on or extension you want to add.

Step 4:Click the add-on you want to download. this automatically installs on your computer.
Download Helper
this is a tool used to extract videos and image files from websites and save them to your hard drive. As you are surfing the web Download Helper can detect that it can do something for you, the toolbar icon highlights and a menu allows you to download files by simply clicking an item.
Download file (Video) using add-ons/download helper
Step 5:In the new tab for Add-ons Manager, click in the search box at the upper right hand corner of the window. type in the word YouTube and press enter key.
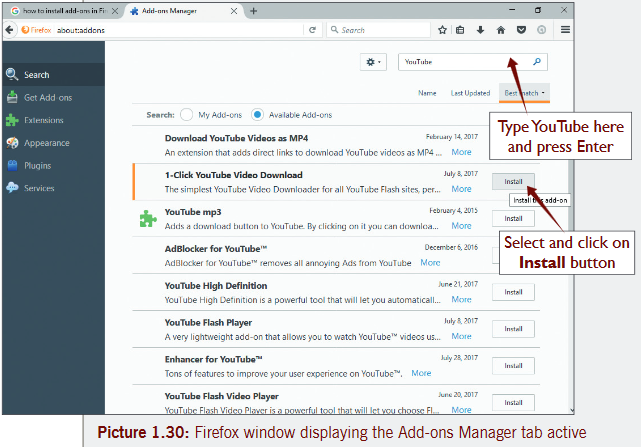
Step 6:Click the Install button next to the result “1-click YouTube Video Download”.
Step 7: once the installation is complete, wait for a few seconds and then restart Firefox.
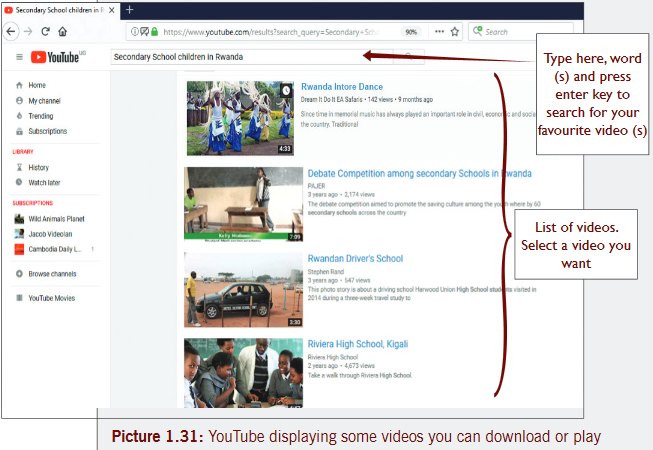
Step 8: type in the Address bar “www.YouTube.com”. Locate your favorite video and click on it.
Step 9: If “I click You tube video download” is used, to download a video on You tube, there is a red button under Active Video download.
If Download Helper is used and there is an active video on any website, the icon is active to let you download it, see pictures 1.31 and 1.32.
Copy the URL for your favorite video.
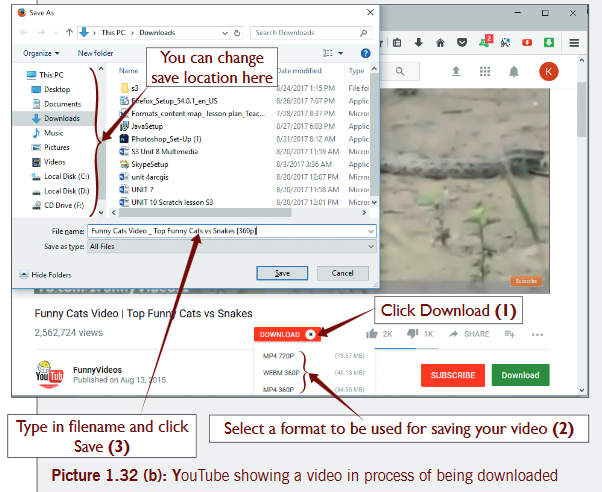
Step 11:From Save as dialog box, select location to save your video and click save continue to download the page.
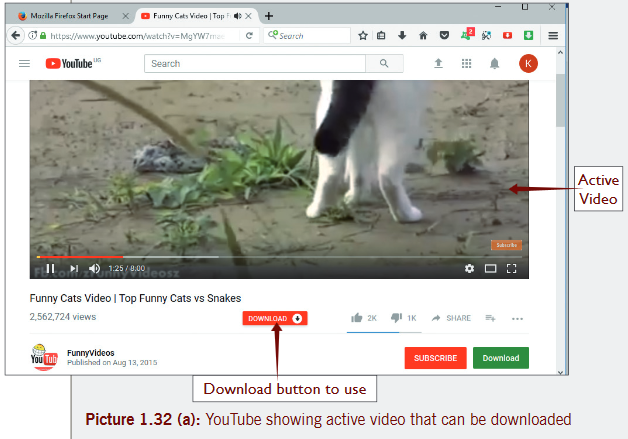
Click the Download button below the active video and the options it brings, select a suitable format. the save as dialog box displays.
Step 12: once the download is complete, watch the downloaded video at any time you want, using location specified.
Note: YouTube has been designed for users who only watch and view videos on their website. In case you want to download and save the video to your computer, you may have to select from a variety of online down loader programs or use YouTube down loader page to download the video.
Note: Ad blocker
this is software extension that reduces the number of unwanted, uncalled-for pop up ads which appear on the user’s display in a browser. Ad is short for Advertisement. Pop up ads usually appear unexpectedly.
Ad block Plus is the most popular ad blocker for Firefox, opera, chrome, safari and internet explorer. It blocks banners, pop-ups, tracking and some malware.
Why should you remove ads?
there are many reasons why people choose to remove ads. some of the most frequent arguments are:
.People do not want to be manipulated by online advertising.
.Advertising is annoying in most cases.
.Advertising often uses heavy graphics which slows the page loading.
.online advertising imposes a security risk for the Internet user, as the third-party banner ads may introduce security breaches to the site.
How to disable or remove browser plug-ins and add-ons
Internet explorer, Firefox, and Google Chrome each allow for the use of plug-ins and add-ons, which are scripts that supplement the functionality of the browser.
For - Mozilla Firefox
In the menu bar, select Tools > add-ons or click the Open menu button on the upper right page and select add-ons.
1. In the Add-ons Manager screen, find the add-on from the list of currently loaded add-ons on the right.
2. select it and click on the Disable button at the bottom right.Windows users may also be able to uninstall add-on files through the Control panel.
Activity 1.8
Download and install the following add-ons:
a) Media player for You tube
b) Mail notifier
c) screen Capture
End of Unit 1 Assessment
Theory Questions
1. a) Define the term Software Installation.
b) Briefly describe the steps for installing an operating system.c) explain the role of operating systems.
2 Apart from fresh installation, explain other choices that are available for installing operating system on computer.
3. explain the following terms:
a) File system b) Booting
c) Disk partitioning d) Microsoft office
4. Use Internet facility to research and then discuss the role of open source applications over proprietary software.
5. open your browser and download the following applications:
a) Microsoft Office b) Chess master
c) A shampoo burning software d) PDF reader
e) Ludo game f) Kerspersky Antivirus
g) Adobe Photoshop
6. Install the following programs you downloaded on to your computer:
a) Ashampoo burning software b) Adobe Photoshop
c) Chess game d) PDF reader
e) Mail notifier (add-on)
7. Uninstall the following software from your computer:
a) Acrobat Reader b) Media player for You tube
c) screen capture
File: 1Unit 2: Table of Contents and Mail Merge
Key Unit Competence
Generate a table of contents and use one document to have multiple copies for different recipients.
2.1 Table of Contents (TOC)
A table of Contents is a piece of information used by readers to quickly find or locate what they are looking for in a book, magazine or any piece of literature.
Activity 2.1
Creating Table of Contents
Follow the following steps carefully to create a table of Contents:
Step 1: start Ms Word and then create a new document in which you need to add table of Contents. You will save the document asb
now use Microsoft Word and type the following text as it appears; then you will use it to create table of Contents and Lists of tables and figures in activity 2.2 and 2.3.
Information and Communication Technology Syllabus

ICT syllabus in secondary schools contains a number of items of study. one of the interesting items in the syllabus is about software. When a teacher plans to have an ICT lesson from the Computer Laboratory, all learners smile (like a smiley face shown on the right) because they are going to use computers practically. there is some information about software as shown above:
Computer Software
Definition of computer software
Computer software is defined as a series of instructions that tell the computer hardware how to process data. Computer software is sometimes called computer program. It is divided into two main categories;
.system software
.Application software.

About three quarters of what learners study is application software. As shown in the figure above.
System software
these are computer programs that control the operation of a computer and its hardware devices. system software act as an interface between the user, application software and computer hardware. Modern computers are complex machines having many running parts all of which need system software to keep running. systems software also provide general functionality for other programs to use, tools to speed up the computer, tools to develop new software and programs to keep the user safe from attacks.
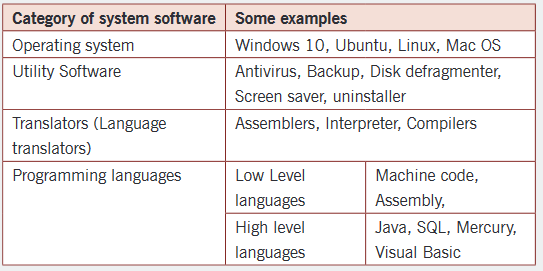
System software is divided into:
.Operating system: For example, Windows 8, Windows 10, Linux and many others.
.Utility programs: For example, Antivirus, Disk defragmenter and others.
.Translator software: For example, Assembler, Interpreters and compilers.
.Programming languages: For example, machine code, Assembly and Java.
The table below summarizes system software
Application software
these are programs that help end-users to accomplish specific tasks using a computer. these programs define what a computer can be used for. Most application programs are available as packaged software that can be bought and installed on your computer. the common categories of application software include:
Word processing software

Word processing software is the key to learning other application programs. on the above is a 7-point star for Microsoft word.
Spreadsheets software

Management of figures is best learnt from lower level with spreadsheets software. this knowledge is important in business calculations. We give Microsoft excel a six-point star as shown on the above.
Presentation software

It is important that learners can convey information to particular audience in an organized way using a computer program. We can now give Microsoft PowerPoint a 5-point star.
other applications are equally good and learning the first three (above) gives a learner a good foundation for understanding other professional applications as given faster.
- Graphics and Multimedia software.
- Computer Aided Design (CAD) software.
- Database Management systems.
- Desktop Publishing.
- Project Management.
- Geographic Information systems.
- education software.
- entertainment software and many others.
The table below summarizes Application software

Step 2:Apply Heading styles to the text that you want to include on the table of Contents (Ms Word will use these styles to build the TOC automatically).
Note: the objects you see in text were wrapped. to wrap them and appear like that, you have to do the following:
- Click shape (the drawing tools automatically display under Format tab).
- Click Wrap text in the Arrange group on the Format tab.
- In the Wrap text menu, select tight (you can also test other options to see how they work).
- Move the picture or shape to the right until all the text appears on the left of the shape.
- Release the mouse button. Justify your paragraph or block of text in case of need by clicking Justify button in paragraph on Home tab.
Procedure to apply heading stylesselect text you want to be included in Table of Contents In our activity select the heading “Information and Communication Technology Syllabus” and apply Heading1 style. Do this by selecting Heading1 style from the Styles group on the Home tab. Repeat action above for heading “Computer software”. Bold your title. Repeat the procedure on subsequent titles using heading 2 in styles group and bold command in the font group on the Home tab:the titles to apply heading 2 in the text are:
- Definition of computer software
- system software
- Application software
Apply heading 3 style to text headings below:- operating system
- Utility programs
- translator software
- Programming languages
- Word processing software
- spreadsheets software
- Presentation software
Repeat this step for every text heading you think should be in your TOC.At this stage insert page numbers. Align right page numbers in the footer using 1, 2, 3 number format.Step 3:Generate an automatic Table of Contents for the document at the beginning of your document.To create Table of contents, do the following below:Creating table of ContentsClick where you want to insert the table of contents (usually at the beginning of the document).Click References tab > Table of Contents, and then choose Automatic Table 1 style from the list (see picture 2.2).Note: If you use a Manual Table of Contents style, Word won’t use your headings to create a TOC and won’t update it automatically. If you opt for manual method, then everything has to be done manually.When created, you can format or customize your TOC by changing font, number of heading levels, etc. A TOC can also be created in any other location in your document but it is most suitable at the beginning of your document.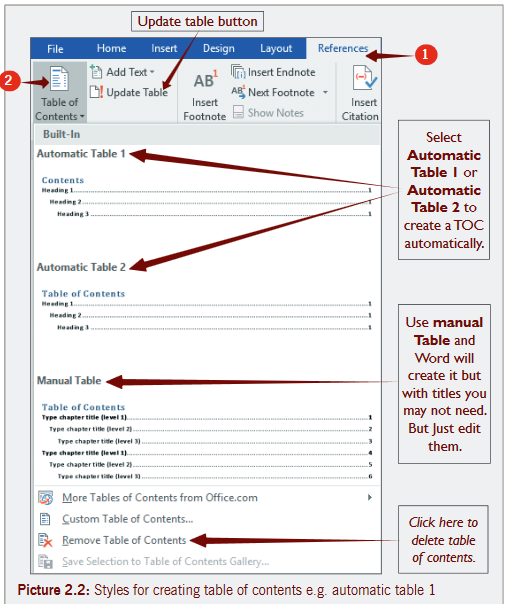 the table of contents that results from activity 2.1 is shown in picture 2.3.
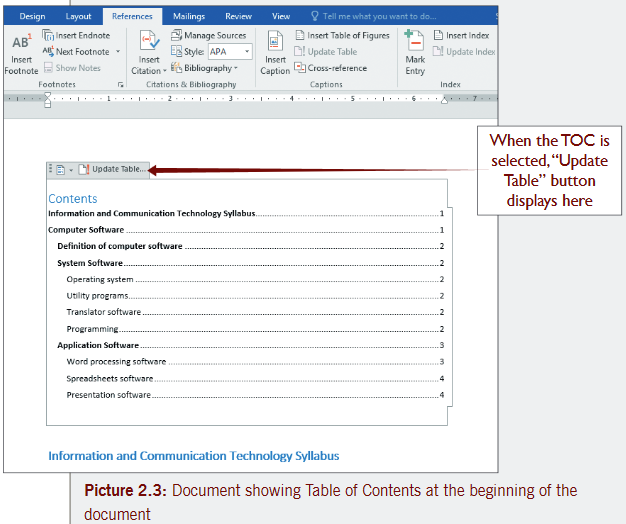 Activity 2.2open My-toC file and perform the following activities:a) Insert a page break at the end of the document.b) type the heading ‘Computer Hardware’.c) Generate a list of computer hardware available in your computer laboratory on the following categories:
- Input Hardware
- output hardware
- Processing hardware
- storage hardware
d) Apply heading 1 style on the new heading and heading 2 style on the sub headings.e) Update your Table of Contents (follow the steps given).Update Table of ContentsIf you add or remove some headings or information from the TOC in your document, you can update quickly using the following procedure:Step 1: on the References tab, in the Table of Contents group, click Update Table (see picture 2.2). You can also click “Update table” button in the selected table of Contents (see picture 2.3).Step 2:In the Update table of Contents dialog box that displays, select “Update entire table”. the new table of contents displays. When the TOC as shown in picture 2.3 is updated, the new table of contents reflecting changes/updates you have made may appear as shown below.
 Delete Table of ContentsStep 1: on the References tab, in the Table of Contents group, click Table of Contents.Step 2:From the table of Contents menu click Remove Table of Contents (see picture 2.2). the table of contents automatically disappears from its original location.Customize Table of ContentsStep 1: on the Table of Contents menu, select Custom Table of Contents.the table of Contents dialog box displays as shown below.Step 2: select the tab leader you need, number of levels and other options.Step 3:Click on OK to save changes you need in the TOC.
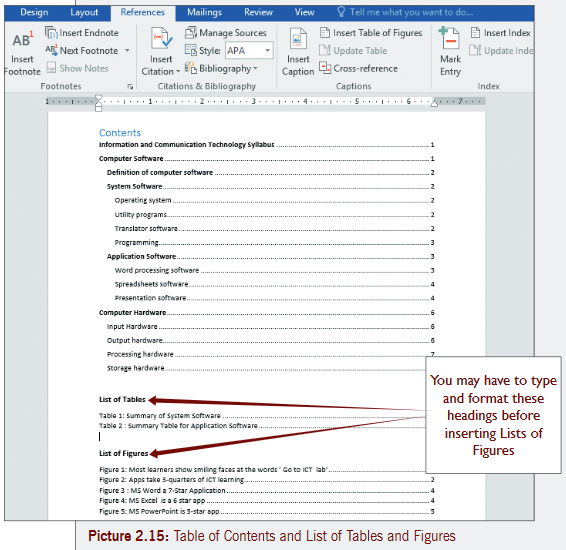
2.2 List of tables and list of figures
List of tables and figures is used to keep information organized and provide easy access to a specific element needed in the document, for example a table or particular figure such as a drawing or photo, etc.
Creating a list of tables and list of figures
Activity 2.3
open My TOC document. Just below the table of Contents:
a) Create a list of tables in the document.
b) Create a list of figures in the document.
c) save the document as List of Figures.
Follow the procedure below to generate a list of tables (table of Figures);
a) Creating a List of Tables
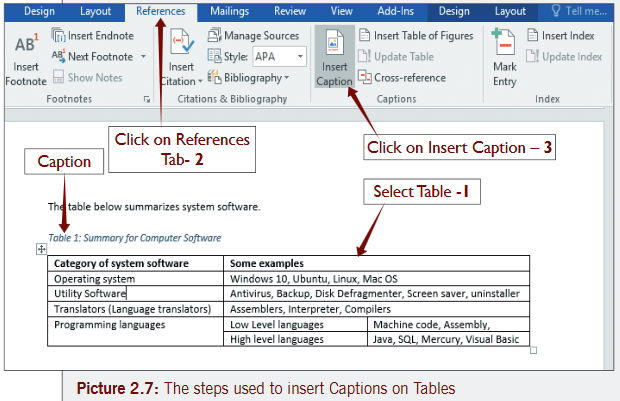
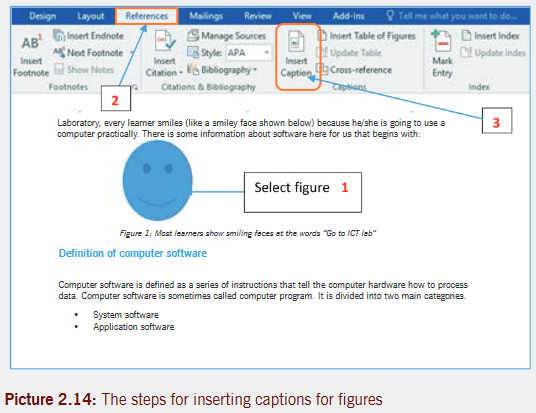
Step 1: Add Captions to every table in the document using procedure given below:
- First select a table on to which you need a caption.
- Click “Insert Caption” command on References tab. (see picture 2.7 below).
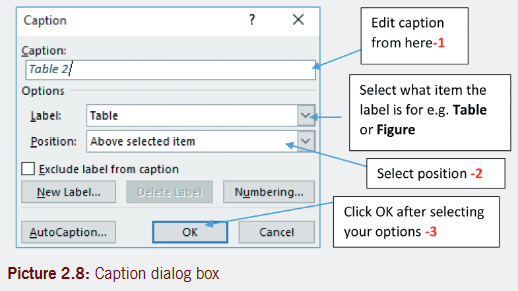
- edit table caption and click OK. (see picture 2.8).
Repeat the procedure for all the tables in the document
Repeat step 1 for all other tables in the document.Use the following text for table 1 and 2 as table captions:
Table 1: summary of system software
Table 2: summary table for application software
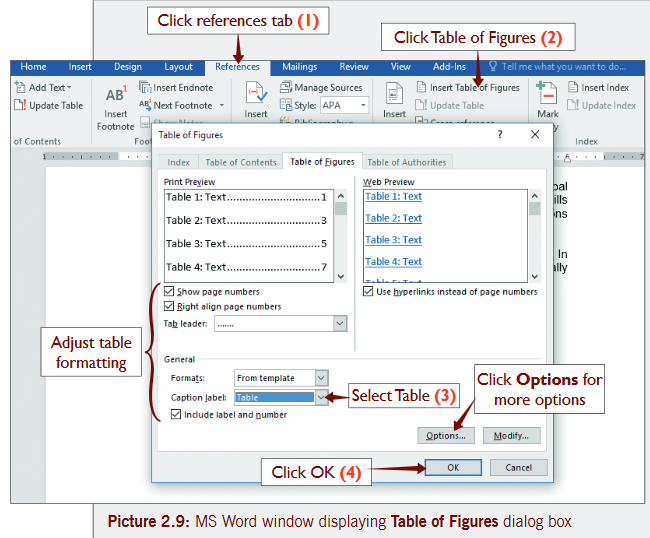
Step 2:Click where you want to insert the table of Figures.
Step 3: on References tab in the Captions group, click on Insert Table of Figures to build the table.
Step 4: In the table of figures dialog box (as displayed in picture 2.9), select the caption label as “table” and click OK.
The resulting list of tables is shown in picture 2.10.

The resulting list of tables appears as shown below.
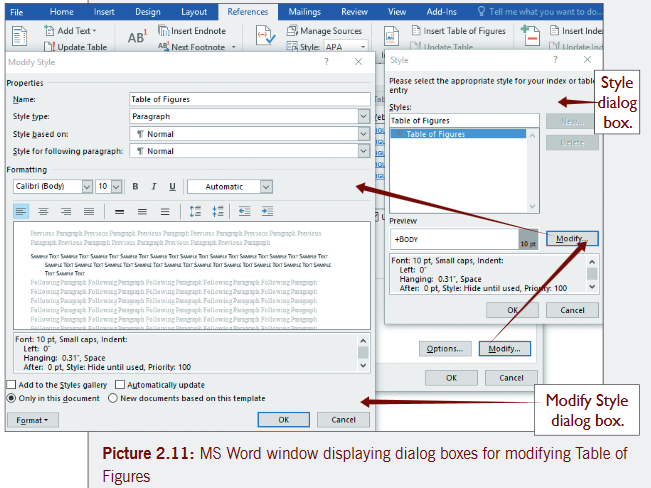
Optional steps you may take before clicking OK
Step 5:Adjust table’s formatting such as setting whether to show page numbers or changing the style of tab leader. You can use a preset style from “Formats” drop down menu. In case you want to customize the style, leave it set to “From template”.
Step 6:Click “Modify” and click again “Modify” in the style dialog box to customize the style of the table. You can change the table’s font, size and other settings in the two dialog boxes. then click OK.
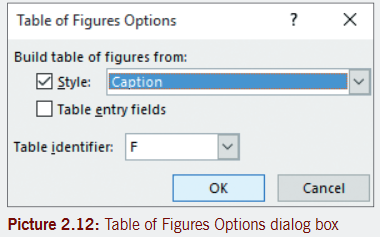
Step 7:Click “Options” in the table of Figures dialog box. Check ‘Style’ and select style used for your figure labels to build table based on text style rather than data taken on insert caption. If you used insert caption you can skip this step.
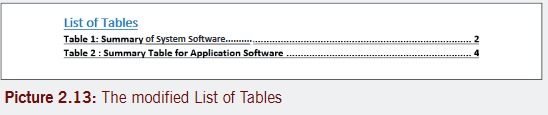
Using the modify style dialog box, if font size is 12, bold and underline styles are used on our list of tables, and a table leader is also changed, the list of tables will appear as shown below.
b) Creating a List of Figures
Step 1:Repeat steps 1 in (a) above (creating a List of tables). In this case add captions for all the figures. see procedure in the picture below (picture 2.14).
Step 2:Repeat step 2 of part (a) i.e. (step 2 in creating a List of tables).
Step 3:Repeat step 3, however in the table of Figures dialog box, select Figure.
Step 4:Click OK.
The resulting table of figures may appear as shown in picture 2.15.
2.3 Mail merge
A mail merge is the process that produces personalized letters by combining a database of names and addresses with a formal letter created in a word processor.
Activity 2.4
a) Create the letter below in Microsoft Word, that will invite parents to their meeting at GS Bumbogo school. save the letter as “Parents Meeting”. Follow other instructions after this letter.

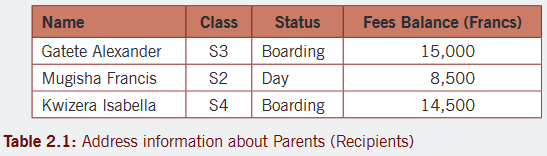
b) Use mail merge feature to generate letters for the following parents in the table below.
Creating a mail merge document
Step 1: Create a letter which you will send to various persons; similar to the one shown on screen in picture 2.16, save it as ‘parents meeting’.
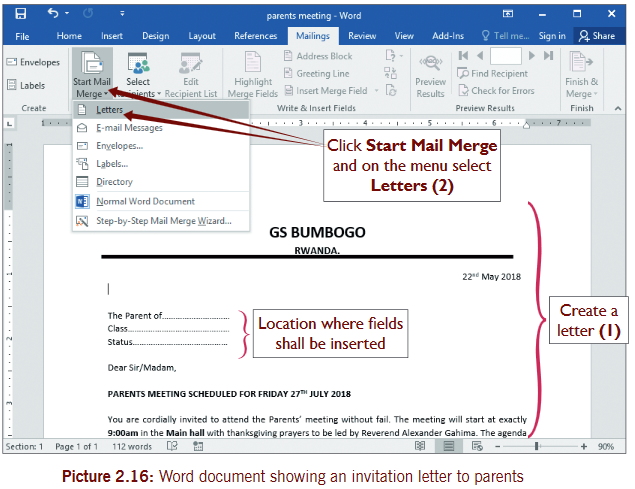
Step 2: on the Mailings tab, click the Start Mail Merge button and then select Letters in the menu.
Step 3: Click on the Select Recipients button which is next and in the list that appears select Type a New List.the new Address List box appears.
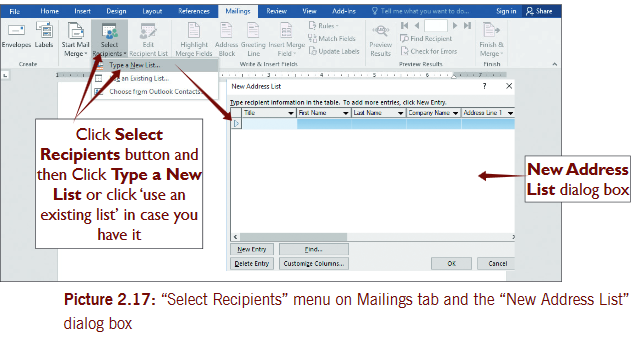
Step 4: In the new Address List, click Customize Columns.the Customize Address List appears to enable you customize the fields. (see picture 2.18).
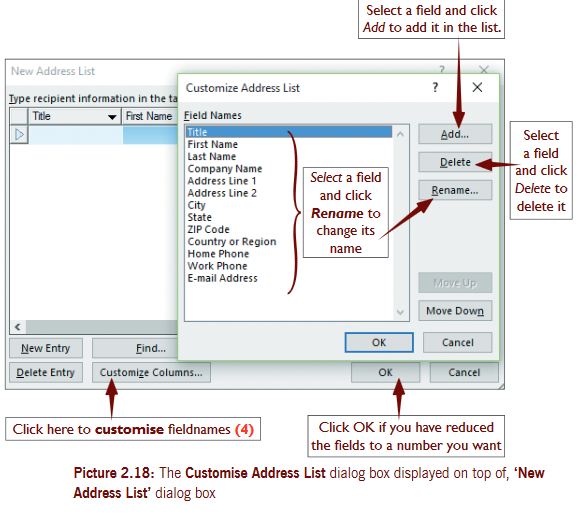
Note: You do not need all the fields that come with the program, so you can customize them by clicking on the Customize Columns as shown in picture 2.18.
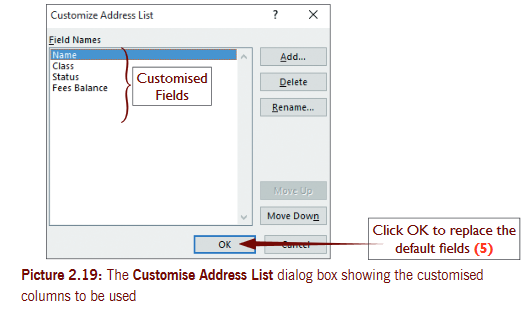
Referring to the data in table 2.1, the customized fields could appear as shown in picture 2.19:
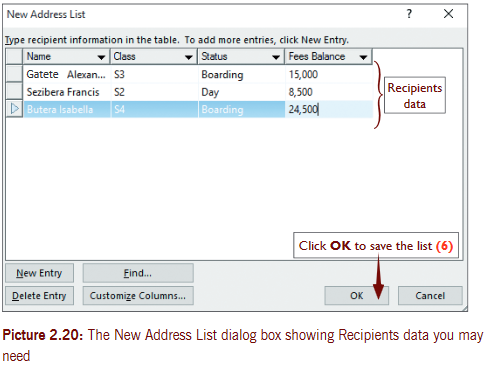
Step 5: After customizing your fields, click OK. then start entering in your data i.e. Recipients list.
Step 6: Click OK after entering Recipients list. You will be prompted to save the file (the Data source).
Step 7: the Save Address List dialog box will display to enable you save the data file. type in the file name as “parents” and select suitable location, then click save button.
Step 8: Click on Edit Recipients list on the Mailings tab, in case you want to edit some Recipients (or you can ignore this step). see picture 2.21.
Step 9: a) Click a location in the main document (Letter) where you want to insert the first merge field.
b) Click on the Insert Merge Field button, a drop down list of fields used will appear, click on the appropriate field to be inserted in the cursor position.
c) Repeat the above step until all fields in the data file are inserted in the document (Letter) in appropriate positions.
d) Preview results using the Preview Results group buttons.

Step 10: see picture 2.21:a) Click on Finish & Merge button in the Finish group; select Send Email Messages—to send merged documents as emails; or select Print Documents—to send merged documents directly to the printer to be printed or select ‘Edit individual documents’ to edit and print copies after merging them.
b) now select Edit individual documents, the Merge to New Document dialog box will display. select All and click OK.

c) the merged document will appear with a temporary name (Letters1); save the document using a new name or location.
d) Print your document when you need.
Activity 2.5
1. open Microsoft Word and make mailings tab active. study your screen and then compare it with buttons you see in picture 2.23.
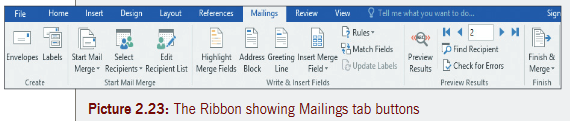
2. Using picture 2.23 above; identify the buttons used to perform the following activities:
a) to delete or add more names and addresses.
b) Display items you create using mail merge.
c) to see the letters before you merge.
d) to insert merge fields at the cursor position.
e) to send merged letters as mail or print them directly on the printer.
3. Mr. Gatete is a secretary of Biscuit trading Company Ltd. His company intends to invite its shareholders for the Annual General Meeting (AGM) this year.
the content of the letter is to be similar to all shareholders except for each shareholder’s personal details and titles.
Mr. Gatete has prepared the letter below to be sent to various shareholders.


Required
a) type the letter as it appears and save it as Biscuit letter.Include a Header as your name.
b) Use mail merge features in Microsoft word to create the table above, save it in your folder as shareholders.
c) Link the table to the letter and generate letters for various shareholders. save the new generated file as Biscuit-Data.
Activity 2.6
1. Ms. Mutesi Mary is the head of ICT in Maranyundo Academy. she is organizing an ICT learners’ seminar at her school. she intends to send letters to ICT teachers of various schools requesting for their learners to attend this seminar in September 2018. the content for the letter is the same for all schools except school names, ICT teachers and other details.A copy of the letter to be sent to schools.
a) type the letter and save it as ICT seminar.


Required
(i) Indent the body of the letter left and right by “0.5”.
(ii) Apply single line spacing on each paragraph of the body.
(iii) Put a spacing of 12pt before and after each paragraph.
(iv) Apply a bold Heading1 style to the subject for the letter with font size of “15.5” and dashed underline.
(v) Insert a text watermark of 2018 and save the changes.
(vi) Using a mail merge feature create the table above and save it as “ICT Schools” in your folder.
(vii) Use a suitable word processing feature to merge the table to the letter (ICT seminar) in order to generate individual letters to be sent to various schools.
(viii) save the resulting file in your folder as “ICT Letters”.
Suggested answers for each of the letters required in Activity 2.6 is displayed in picture 2.24 below.

2.4 Organize, print and view shortcuts
Before you print your document, you should preview your document and specify which pages you want to print.
Activity 2.7
open ICT Letters file you created using the right password, organize and print one copy of the letter for Mr. ngabo Desire and 2 copies of the letter for Mrs. Mutesi Desire.
Follow the procedure given below to print the required document.
Steps to preview your document
1. on the File menu/tab click Print.
2. to preview each page, click the forward and backward arrows at the bottom of the page.
3. If the text is too small to read, use the Zoom Slider at the bottom of the page to enlarge it.
4. enter the number of copies, to print. (see picture 2.25).
5. Under Printer, select a printer to use (in case you frequently change printers).
6. Under Settings, select options you need i.e. select Print Current Page.
7. Click on Print button to produce a hard copy of the document. (see the picture 2.25 shown below)

Note: Before you click on Print, ensure that the printer you select is connected to your computer and switched on.
View Shortcuts
In case you need to use view shortcuts to see your document in different ways, click a desired view button on the lower right of the document. see picture 2.26.

2.5 Protect your document
Use passwords to prevent other people from opening or modifying your documents. However, if you use a password and forget it, Word processors like Microsoft Word cannot retrieve the forgotten passwords. there are two methods to protect a document with password.
Steps to protect your document with a password
Method 1
1. Create or open an existing document, in this activity open the file ICT Letters. click the File tab. the Backstage view opens.
2. In the Backstage view, click Info (see picture 2.27).
3. Click Protect Document. see picture below for Protect Document options.
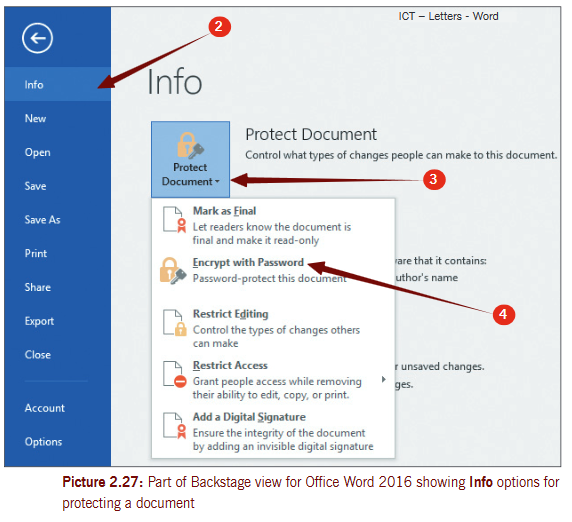
Meaning of various options
·Mark as Final: make the document read-only.
·Encrypt with Password: set a password for the document.
·Restrict Editing: control what types of changes that can be made to the document.
·Restrict Permission by People: use a Windows Live ID to restrict permissions.
·Add a Digital Signature: add a visible or invisible digital signature.
4. Click ‘Encrypt with Password’.
5. In the Encrypt Document dialog box that displays (as shown on picture 2.28), type in the desired password for your document and click OK.
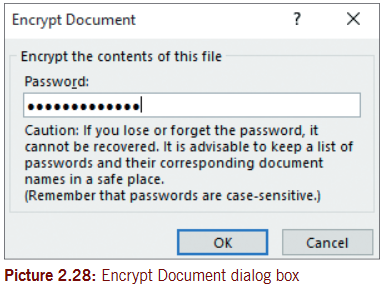
6. Retype the password again in the dialog box to confirm it and click OK.
now, you have protected your document with a password.
Method 2
1. Create or open an existing document for which you want to apply a password.
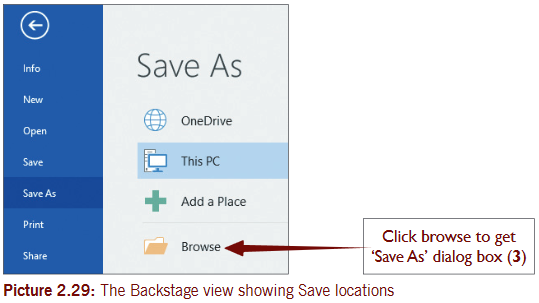
2. Click File tab; on the backstage view that displays, click Save As.
3. the save As backstage view displays save locations, click Browse. see picture 2.29.
4. the Save As dialog box displays, click Tools drop down arrow (see picture 2.30)
5. Click General Options (see picture 2.30).6. In the dialog box that appears, type in password to open the document. Retype the password and click OK.


End of Unit 2 Assessment
1. Use Microsoft Word, typeset the following document and save it as ‘Certificate of Appreciation’ this document is a certificate and should have a page border as shown.

Other Instructions
a) Use 1.5 line spacing for your work and no space after each paragraph.
b) Make the following changes to the title:
(i) Change the name of the school to stencil bold font face, font size 26 and dark blue color.
(ii) Change the second line to font size 16 and bold.
(iii) Change the third line to font size 14 and bold.
c) Leave enough space between “Southern Province”, Rwanda and ICT Club to accommodate a suitable graphic (good image) that will work like your school badge.
d) Underline the heading, “Certificate of Appreciation” change it to size 20 and color dark red. Apply a double strike through.
e) Use blue font color for signatories in font size 15
. f) Apply dark red color to page border.
g) ensure that your work fits on one page of your document Center all text. Format the rest of the text as you wish correctly.
h) the certificates are to be awarded to the following members. Create a data source and save it as ‘data file’.

i) Using a word processing facility, merge the fields above to the certificate ( place fields in appropriate positions). Change the color of the merged fields in red bold color in your main document.
j) Merge the document and the certificate such that each member of the club in the data source has a complete certificate for printing.
k) name the new file as ICT certificates with a password as, ‘joint1001’. Print a copy of the new document and close the file.
2. explain the meaning of the word Formal letter and explain how it differs from the database of names and addresses?
3. open a blank document and in it create the following items:
a) type two brief paragraphs about the history of your school. Add a suitable picture such as a clip after.
b) type five points about why you joined your school, the good about your school and the bad about your school. Insert one picture related to computers. Provide a suitable heading.
c) Insert a new page in your document. type a heading “Science Teachers”. A brief information about science subjects such as physics, chemistry. Create a table with science teachers and the subjects they teach. Include a suitable picture on the page.
d) type a list of Arts Teachers in a table, with a suitable heading on a new page. type a brief information about Arts subjects.
e) Create a list of Sports activities in your school with brief information related to your school. Provide a suitable heading that should be on a new page. Insert two pictures related to sports listed.
f) Insert a new page in your document and create a list of favorite sports stars in your country and on International level. Use two column table.
g) Generate reason(s) why you should not change your school. Do this on a fresh page.
h) save your file as ‘Love4-myschool’.
Instructions
·Generate a table of Contents for your document.
·Create a List of tables for the document.
·Create a list of Figures you have added in your document.
Unit 3: Charts and Advanced Objects
Key unit competence
Present data graphically and use different objects in a document.
3.1 Charts
A chart is a diagram or object used to display numerical information in details. A chart can also be called a graph.
Data in a chart is represented by symbols, such as bars in a bar chart, lines in a line chart, or slices in a pie chart.
Learners can see results of numerical data in a chart and can use it to predict current and future.
3.1.1 Role of charts
- Charts are used to summarize and display information in an easy manner to understand.
- Charts act as useful tools for conveying financial information.
- they are used to make patterns and trends in numerical order much easier to see.
- Charts facilitate data analysis.
3.1.2 Types of charts
there are several types of charts used to display data. the most popular types include among others the following:
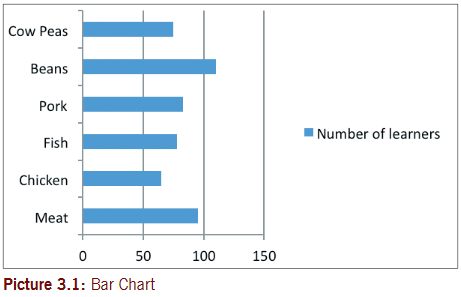
A. Bar Chart (Bar graph)
A bar chart is a graphic representation of data with horizontal bars or objects. Bar charts usually display horizontal bars or objects going across the chart vertically, with the values displayed at the bottom of the chart.
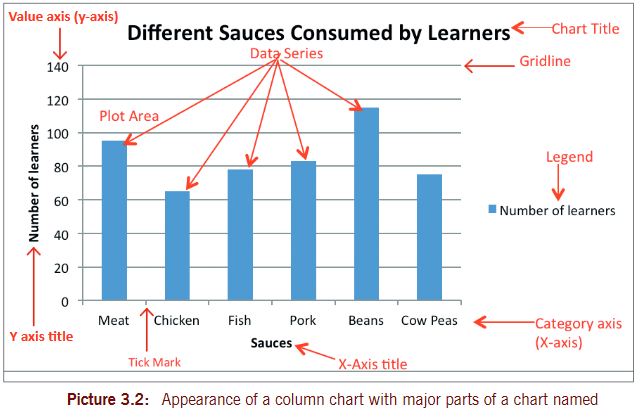
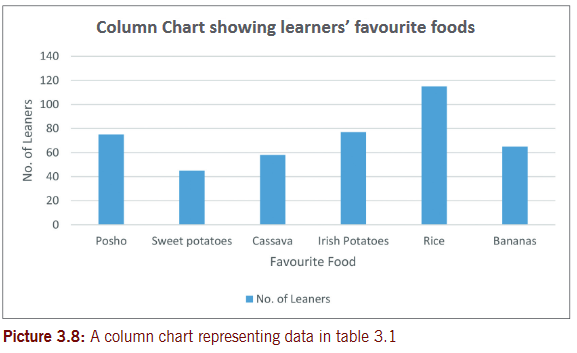
B. Column Chart
A column chart is a graphic representation of data with vertical bars or objects. Column charts display vertical bars (categories)going across the chart horizontally (along the horizontal axis), with the values organized along the vertical axis (on the left side of the chart).
Chart Overview
C. Line Chart (Line Graph)
A line chart is a graphic representation of data plotted using a series of lines. Line charts display lines going across the chart horizontally, with the values axis being displayed on the vertical axis (left side of the chart).

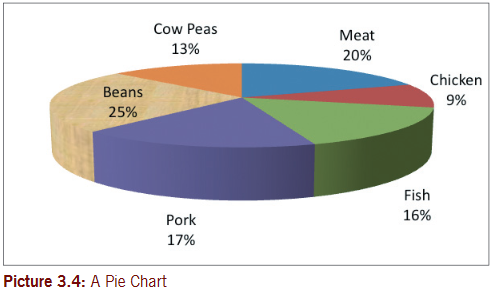
D. Pie Chart
Pie chart is a circular chart sliced into sections; each section represents a percentage of the whole. Pie charts do not display horizontal and vertical axes as other charts.
3.2 To create a chart or graph
Use the steps given below to create a graph. All the charts already shown above were created using similar data as in the ones below. Use this data to create these charts as they are in Microsoft Word. save the file as ‘Common charts’.
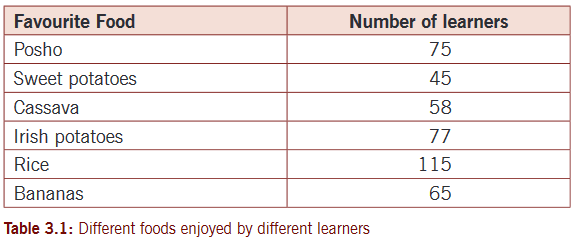
Step 1:Prepare the data that you need to make the chart (this data can be on paper or in a book).
Step 2: start Microsoft Word and then click where you want to place the chart.
Note: First create table data in Microsoft Word, but this is an option you may ignore.
Step 3: on the Insert tab, in the Illustrations group click Chart.
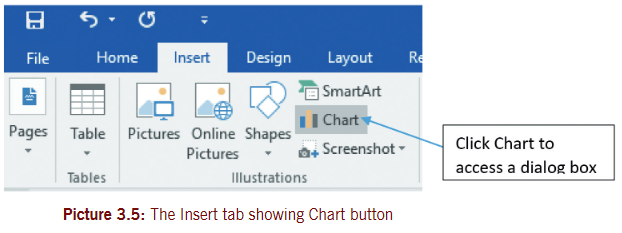
Step 4:In the Insert Chart dialog box (that displays as shown in picture 3.6), select the type of chart that you want on the left side, then select the chart sub type and finally click OK.
Step 5: the Chart remains selected and Chart tools display (on Design, Layout and Format tabs). Use Chart tools to modify your chart the way you want.

Step 6: Replace the sample data (edit data) by clicking on a cell and then typing the data that you want.
Note: to delete a column or row data, right click on column letter e.g. column D or row number e.g. row 5. then select delete.
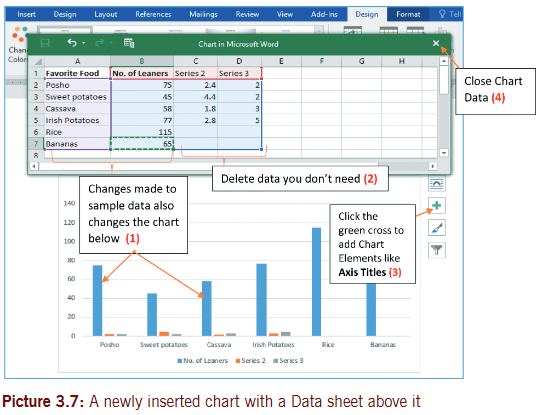
The resulting chart for our data in table 3.1 will appear as shown below
Activity 3.1
1. S.3 class has a total of 120 learners. the class teacher carried out a data survey to find out how many learners regularly eat meat, pork, chicken or fish at home. the data below in table 3.2 was collected.

Instructions
a) open Microsoft Word and create the table 3.2 above as it appears.
b) Use the data given in table and create:
(i) A clustered bar chart on page 1 just below table
(ii) Pie Chart on page 2 (with data call outs).
c) Apply Chart titles and Axis titles in b
(i) and b
(ii) above.
d) save changes to your file and save it as ‘Sauces’.
2. a) the picture below is displaying chart tools. Use it to answer the questions that follow.
(i) name the tab that is active. Identify two buttons displayed by this tab.

(ii) Identify how many tabs display Chart Tools. state the use of any one button on each tab.
b) study the Chart Tools on the Design tab in picture 3.9. Identify the name of the button used to:
(i) Change from one chart type to another
(ii) Add titles to axes and add/remove legend.
c) Which type of chart might have been selected according to picture 3.9?
d) Which button on design tab can be used to quickly apply axis labels or titles?
3. a) Picture 3.10 below shows another set of Chart tools. study the picture. Which tab is displaying chat tools?

3.3 Formatting an object and chart
Formatting an object and chart means to change the appearance of object and chart to look nice. A chart is an object in a document. A chart can be formatted to look attractive to the user. to format a chart, different features or buttons are used to make these changes. Most of the buttons are located on format tab under Chart Tools as shown in picture 3.9.
To format a chart
Step 1: select a chart you want to format.
Step 2:Click Format tab under Chart Tools and select a formatting button you want. the changes immediately take effect.
example:
To apply Word Art styles on your Chart
a) select a chart or chart element or a particular data series.
b) Click Format tab under Chart Tools.
c) In the Word Art Styles group, click Quick Styles and select a style you want (or use Text fill and or Text outline drop-down arrows and select desired colors you want). Refer to picture 3.8 or 3.9.
Alternatively perform (a) to (b) above and then use Shape styles group buttons/commands i.e. select from Shape Fill and Shape Outline drop-down lists.
Adjust chart size
a) select a chart or object you want to resize.
b) Click Format tab under Chart tools.
c) In the Size group type or scroll in to adjust the Shape Height and Shape Width of the chart (Refer to picture 3.9).
To format an object
Follow the same steps as those used to format a chart.
Activity 3.2
1. a) open Ms Word, create and display table 3.3 on a 3-D clustered column chart. save the file as ‘House competitions’.
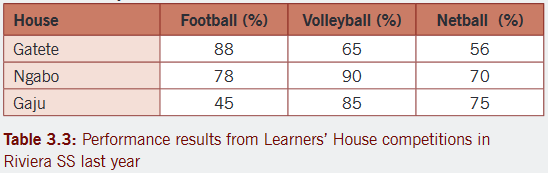
b) Include a chart title and axis titles.
c) Copy the chart and paste it on page 2 and page 3.
d) Change the chart type on page 2 to a 3-D pie chart and use a suitable chart style. Apply style 3 of pie charts.
e) Change the chart on page 3 into a line graph.
f) Page your work and save changes.
Activity 3.3
the following table was prepared by Director of studies of Gs nyarusange pertaining to extra lessons covered by 10 teachers for the 4th week of the term. Values are in minutes.

a) typeset the table above as it appears in the new document and save it as ‘Overtime’.
b) Bold all column headings.
c) Center all the figures in your table.
d) sort the data as A-Z to the names of teachers.
e) Insert the heading at the top of your table as “Teachers’ Daily Overtime in GS Nyarusange”.
f) Create a 3-D stacked column graph for all teachers for Mon, tue and Wed. Place the graph on page 2.
g) Create a line graph for the first five teachers (in ascending order) for Mon to sat. Place this chart on page 3.
h) Create a pie chart for Mon and sat for all teachers. Place the chart on page 3 below the line graph above in (g).
3.4 Add objects from file
An object is something that you can see. In Word, processing objects can be inserted from other files already created, for example; documents, workbooks, presentations, PDF and so on.
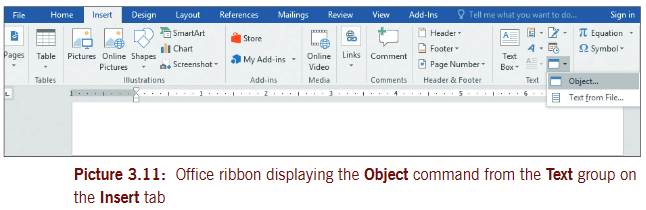
3.4.1 To add object from file
Step 1: on the Insert tab, click Object command from the text group.
3.5 Add objects
In word processing, you can add different types of objects created with other programs such as Ms excel, Presentation, and equation applications in a document.
3.5.1 To add Microsoft Excel Worksheet as an object in a document (or another type of document)
Step 1:Create a new document or open an existing document where you want to insert an object.
Step 2:Click where you want to insert the object.
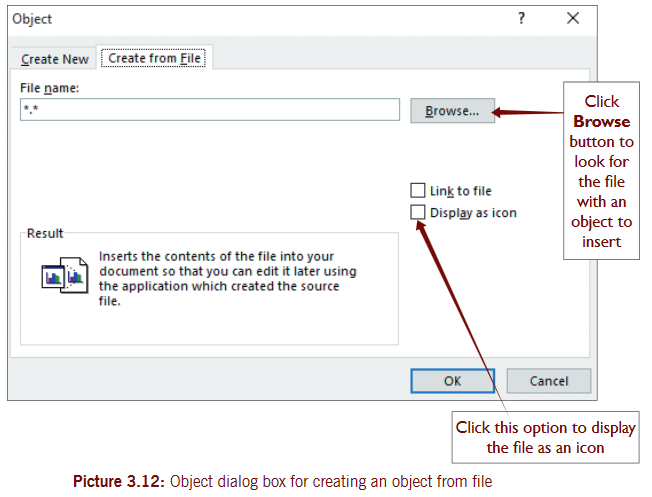
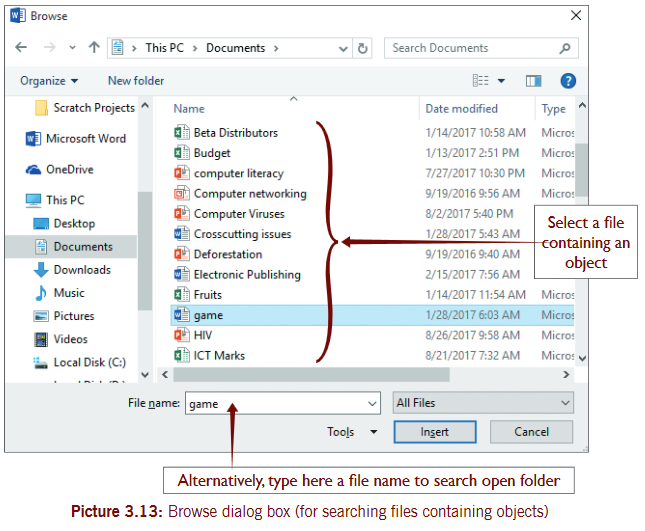
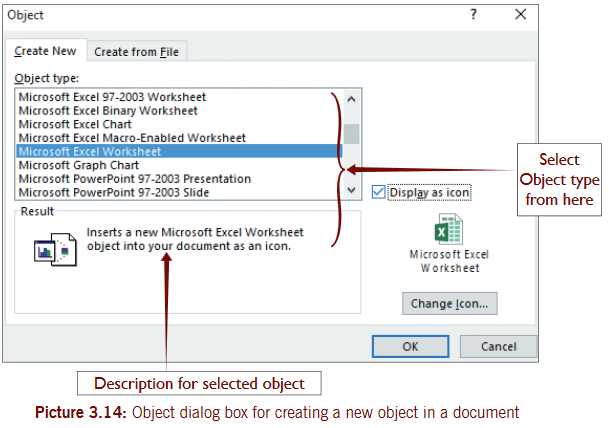
Step 3: on the Insert tab in the Text group, click Object button. the object dialog box appears. see picture 3.12.
Step 4:In the Object Type list, scroll and select the type of object you want i.e. Microsoft excel Worksheet. (You can display the object as an icon if desired by ticking the “Display as Icon” check box. see the picture 3.14.
End of Unit 3 Assessment
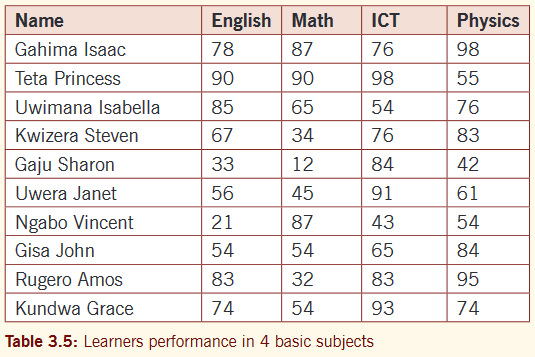
1. Data given in table 3.5 shows learners performance in 4 subjects. Use this data to generate on separate page(s):
a) A 3-D Clustered column chart showing all the learners’ performance in percentages. Change chart colors and the style you want.
b) A stacked line chart for all learners.
c) A pie chart representing the performance of learners in ICT. Use a desired chart style and color.
d) Apply page numbers in the Footer and your name and class in the Header.
e) save your file as your ‘Name-Class’.
2. type the following data in Microsoft Word and save as ‘Learning ICT’.
Learning ICT in Rwanda
ICT syllabus for Rwanda is very interesting. there are many topics that were added for purposes of improving and enhancing the skills of learners. thanks for our Government, a caring mother for all Rwandan children, taking charge of our future livelihood.
there are many topics and units that we learn on different levels gradually from lower secondary.
The following topics are learnt right from S1 to S3
- ICT Fundamentals
- safety and security
- Word processing
- GIS
- Computer network and Communication
- scratch Programming for Juniors
At s.2 level spreadsheet software is added to equip learners with basics of managing numerical data with a computer program.
At s3 level more topics are added to build learners with more skills in using graphics and multimedia presentation. they include:
- Presentation
- Graphics and Multimedia
Requireda) Justify your document and save it with a name, ‘ICT in Rwanda’.b) Insert Sauces file you created in unit 3 as object- icon (you can open from here) at the end of the text you typed above.c) Add a bitmap Image and Microsoft excel Worksheet as objects at the beginning of your text.d) Insert an equation as below the image.e) save changes to your file.
Unit 4: Arc GIS
Key unit competence
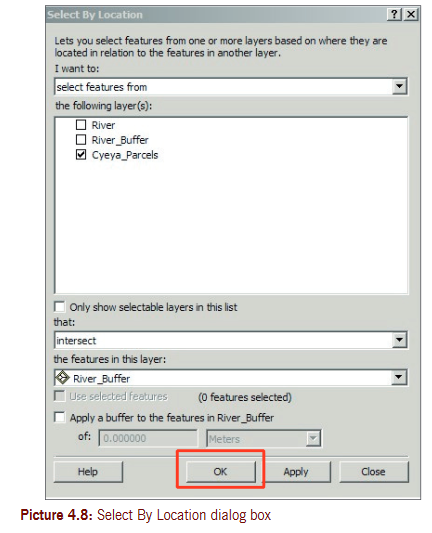
Query a map using selections (attribute and location). Create a map layout and insert map elements. Use advanced symbology and labeling. Print, export and send a map.4.1 Introductionthe most effective selection method one can use to select features in a layer is to select features using an attribute query.4.2 Querying data/information (Query methods III)4.2.1 Selecting features by attributeone of the selection methods you can use to select features in a layer is to select features using an attribute query.Activity 4.1Which parcels of Cyiri Cell belong to Birambo Village? the attribute query to use is from Picture 4.1;- “Village”: name of attribute field.
- “=”: Relationship between attribute field and value (operator).
- ‘’Birambo’’: name of value.
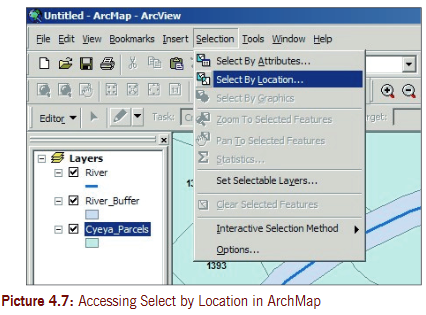
 Method 1:Step 1:Click selection > select By Attributes to open the select By Attributes dialog box.
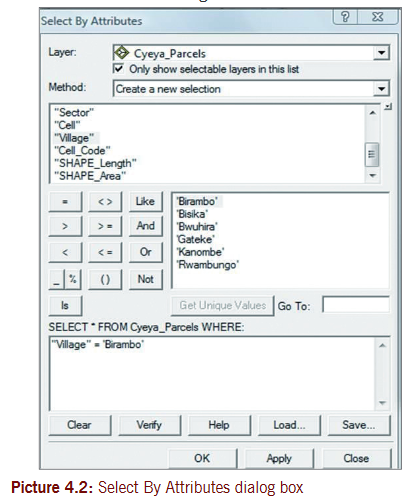 Step 2: Choose the layer to perform the selection against.Step 3: specify the selection method.Step 4: enter a query expression.see Building a query expression for information on the syntax of a query.Step 5:Validate your query expression by clicking Verify.Step 6:Click OK or Apply to execute your selection expression and work with the selection results.Step 7: optionally, you can save your query expression for later reuse before closing this dialog box
 Method 2Step 1:Click selection > select By location.
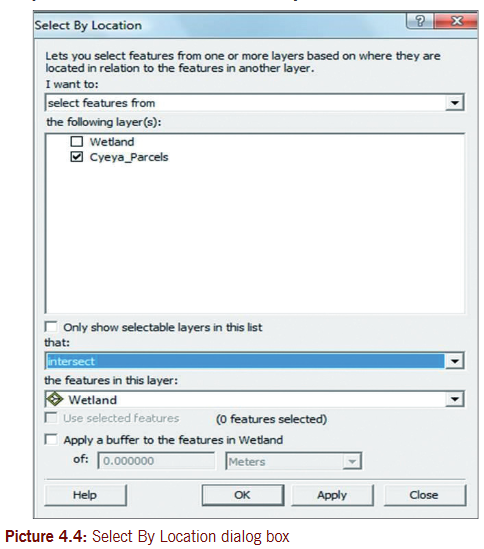 Step 2:Constructing a location query
- target layer: Parcels
- spatial relationship: Intersect
- source layer: Wetland
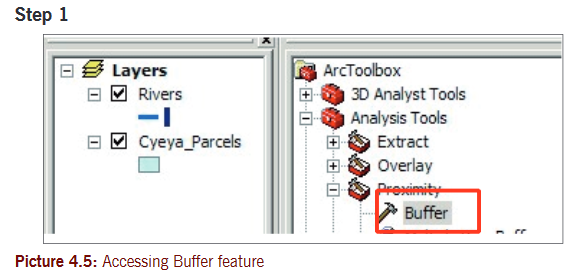
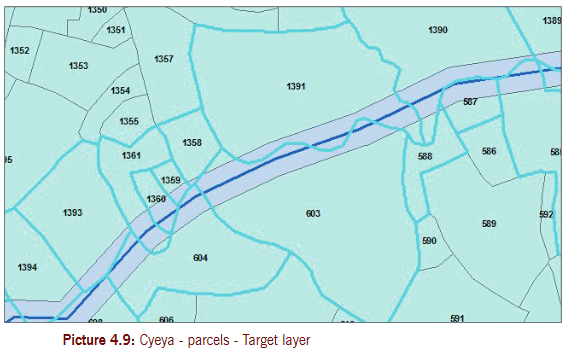
4.2.2 Select by locationBuffering features- What neighborhood is affected by 10m river buffer?
- open Arc catalogue.
- Analysis tool.
- Proximity.
- Buffer- a dialogue box is open.
- In the Input Feature put River.
- output feature class—browse to your data storage and give the name.
- Linear Unit: 10 – select Meters.
- Leave other tabs as default.
- oK.
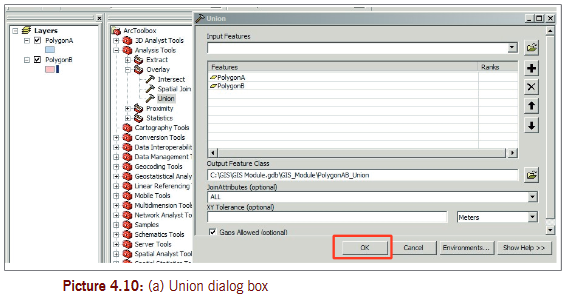
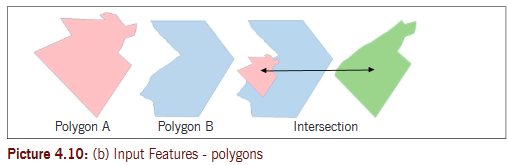
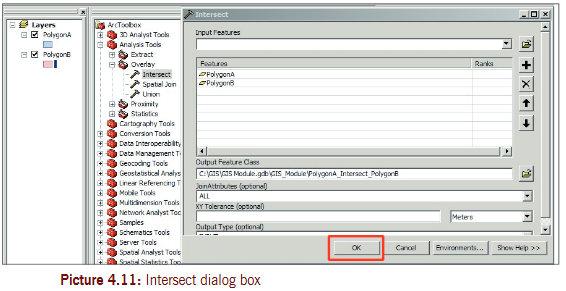
 Overlaying features
- open Arc Catalogue.
- Analysis tool.
- overlay.
- Union- a dialogue box is open.
- In the Input Feature put Polygons to unite.
- output Feature class -browse to your data storage and give the name.
- Leave other tab as default.
- OK.
- explore other functions in Arc toolbox
Activity 4.2Using Arc GIS, create an administration map of Rwanda, the map should present provinces, districts and lakes.Use the steps belowStep 1: start Arc GIS Pro.Step 2: open an empty map.Step 3:Add new data or file.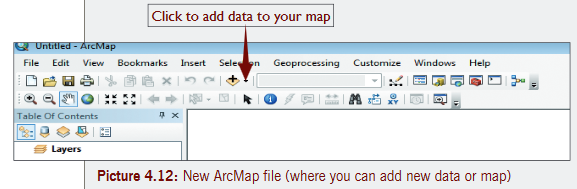 Step 4: on the Open page, under Open, click Computer and click Browse .Note: That the folder that contains data to use must be connected to Arc GIS.
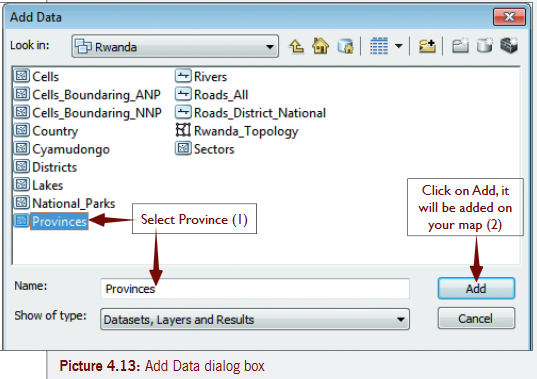 The following result will be prompted to you
 4.3 Display of a layer (II)4.3.1 Symbolize layerStep 5:If you want to change color of the layer, double click on the color, this window will open.
 Step 6: Add Districts layer.Repeat step 3 and 4.
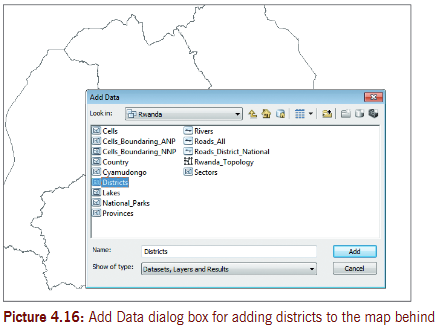
 Step 7: to change all Districts layer color, do the same as step 5.
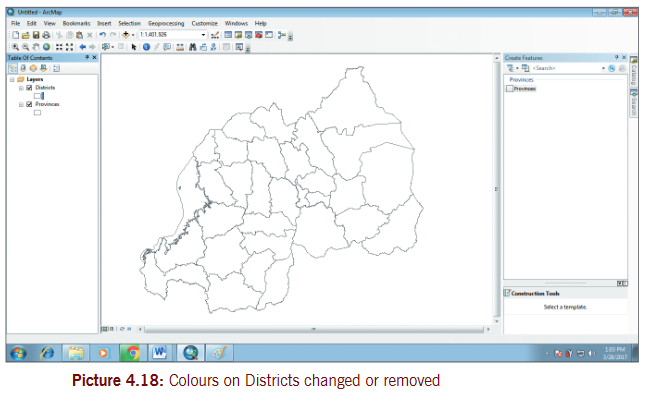 Step 8: Add lakes layer.Repeat step 3 and 4
 4.3.2 Add and remove label of layerActivity 4.31. Add province labels and districts labels to the map of Rwanda.2. Remove the labels you have added in number (1) above.Use the following steps.Step 1: Right click on the layer, (province).
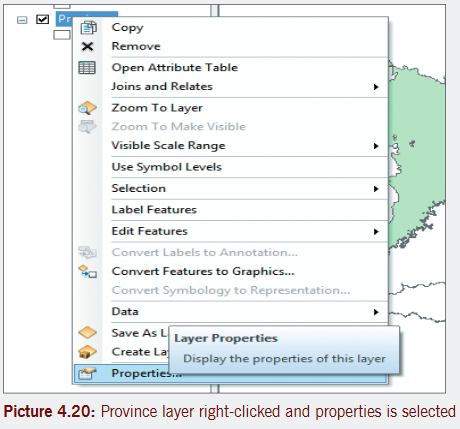 Step 2:Click on Properties, the layer properties dialog box below displays.
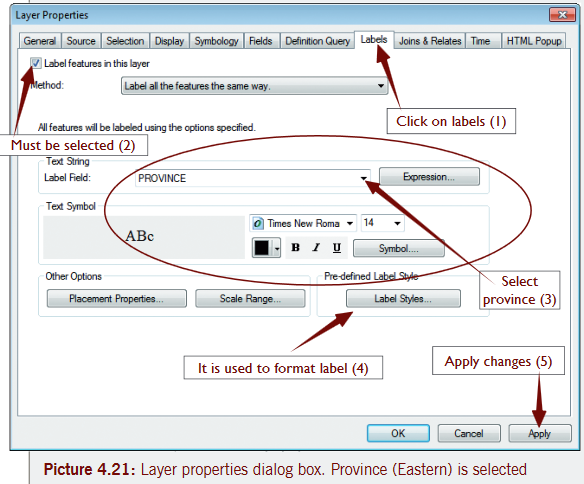 Step 3:Click on Labels tab. Perform actions 1-5 in dialog box above. After following steps in picture above, the results are shown in picture 4.23.
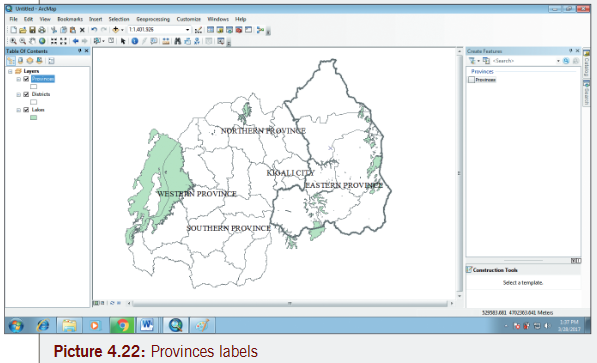 Step 4: Add labels on Districts layer. Right click Districts Layer.
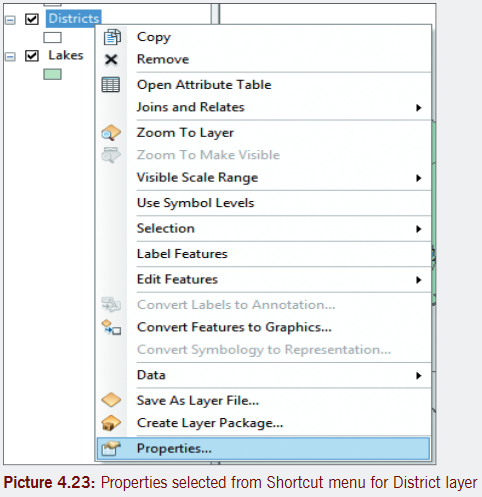 Step 5: select Labels tab, as shown below.
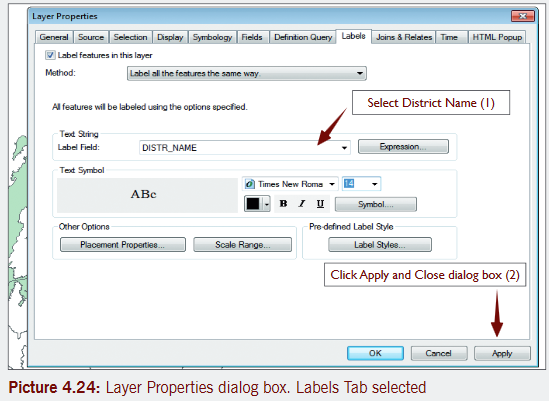 After performing actions 1 and 2 with the Layer properties box above, the result will be as shown below:
 Remove labelsto remove labels on a layer, follow the steps given below;Step 1: Right click on layer, e.g Districts then select properties.
 Step 2: Click OK at the bottom of layer properties dialog box.Activity 4.4a) Using the Activity 4.3, remove labels on provinces and then add labels on lakes.b) Add rivers layer and apply labels on it.4.4 Map layoutthe basic 4 elements that a map should have: title, legend, scale, date, author, orientation and text. We will show how to insert them in a map as an activity. Follow the steps given on each element.4.4.1 Insert LegendUsing the map of Rwanda we used in previous activities, follow steps given below to insert a legend.Step 1:Change from data view to Layer out view. Use view button or view menu on the lower left side of the Arch map window.
 Step 2:Go to Insert menu, then Choose Legend.
 Follow the instruction given by Arc GIS, then after click OK.
 4.4.2 Insert OrientationStep 1:Click Insert menu.Step 2: Choose North Arrow
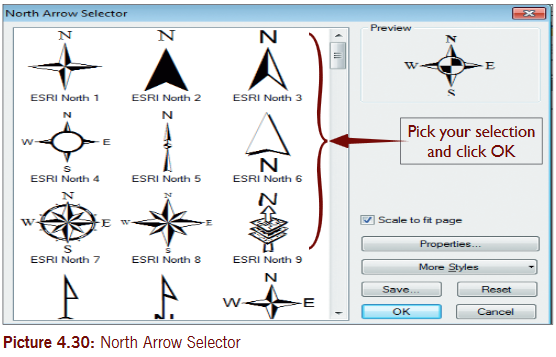 Step 3: select how to use, then Click OK
 4.4.3 Insert ScaleStep 1:Repeat step 1 and 2, above (under Insert orientation).Step 2: select Scale bar.Step 3: scale Bar dialog box will be displayed, then choose the scale you want to use, then click OK.
 Step 4: A map with scale is displayed as shown below.
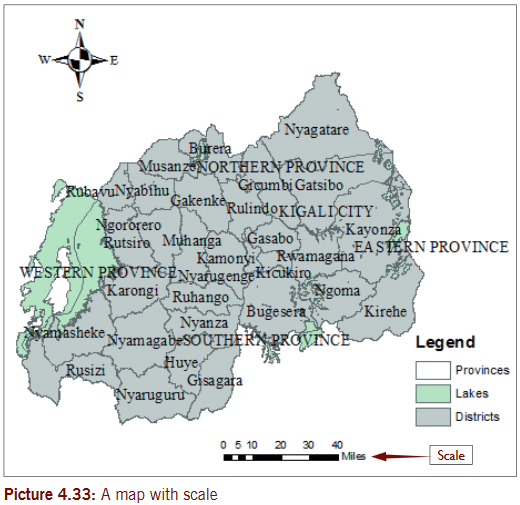 4.4.4 Insert Textthere are several kinds of text you can insert in a map. text can be meaningful words, characters or numbers placed on a map. to add text, follow steps given below:Step 1:Click Insert menu, point to Dynamic text.
 Step 2: select text category you want to insert e.g Author, Document name, etc.4.4.5 Insert TitleStep 1:Click on Insert menu.Step 2: select Title.Step 3: type text as title in the dialog box that displays.
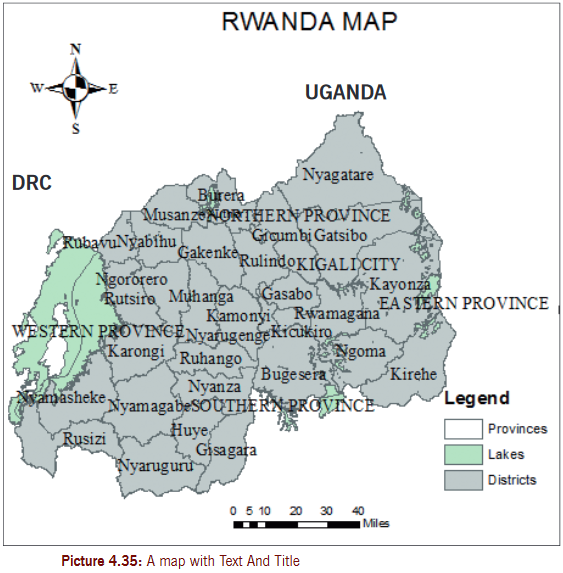 4.5 Use Page and Print Setup Menuthe purpose of page and print setup is to organize your map ready for printing.Activity 4.5Perform a page and print setup of the map you added in the previous Activity (4.3). Follow the steps below:Step 1: navigate to File > Page and Print Setup.
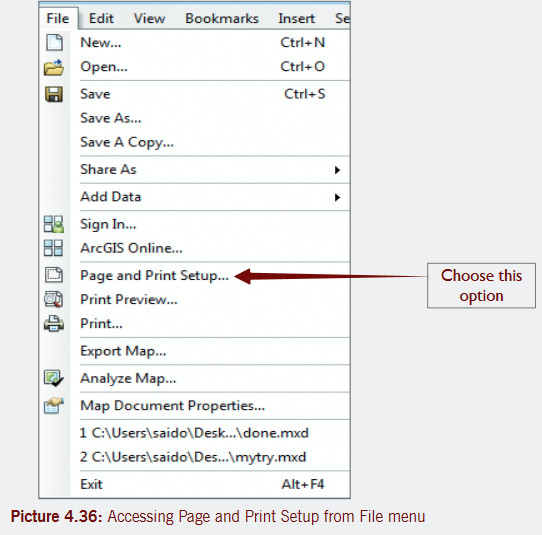 Step 2: select the printer.Step 3: select the Printer Paper size and orientation for the map. see the link in the Related Information section for information on setting up a custom page size.
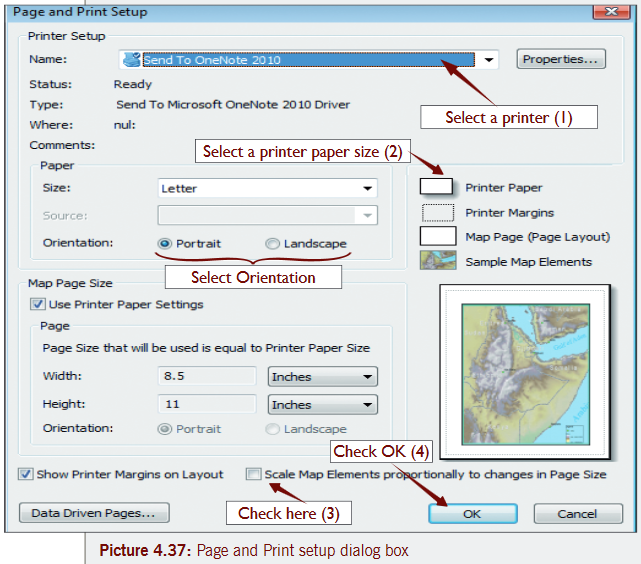 Step 4:Check, if the map has already been created, on ‘Scale map elements proportionally to changes in map size’ at the bottom of Print and Print setup dialog box.Step 5: select ‘Use Printer Paper Settings’. this grays out the bottom section, Map page size, because the map is now using the Printer paper size and orientation settings.Step 6:Click OK.4.6 Save and send a mapto save a map is to store it for future references using a specific name and location on a storage device. to save or export a map is to prepare the map in format that can allow it to be easily moved or exported from one computer to another.Save a mapFollow steps below:Step 1:Click File menu and select “Save As...”
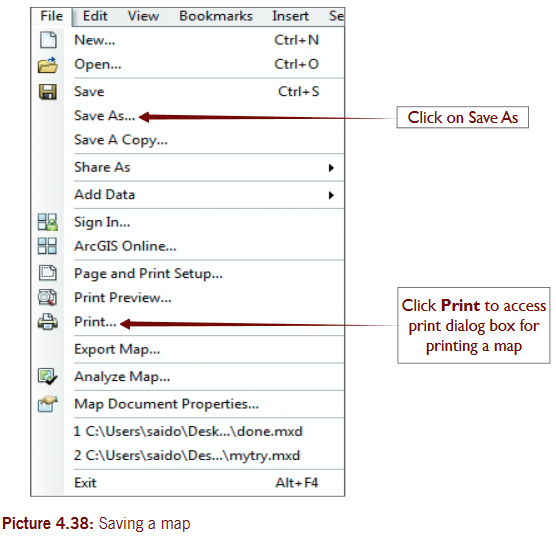 Step 2: Choose the location and the name of the map.
 Export a mapPrepare to send your map by following the steps given below:Step 1: on File menu, click Export Map
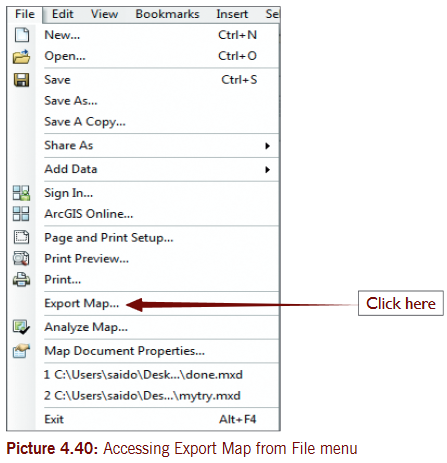 Step 2:In the export Map dialog box, select File name and File format from Save as type drop down menu.
 End of Unit 4 Assessment1. Given Rwanda administrative boundaries data ,open a new map document and add the following data on the map:a) Provincesb) Districtsc) sectorsd) Riverse) national parksthen do the following:(i) Add label to each layer.(ii) Insert legend, scale and orientation.(iii) Insert map title, author and date.(iv) export the map in PDF file and send it to your teacher’s email.2. Given the map of Kigali city, open the new map and add the following data.·City divisions.·Roads.then perform the following:(i) Add a label to each layer.(ii) Insert a map title, author and date.(iii) export the map in .jpg. file format.
Unit 5: Charts and Objects in Spreadsheets
Key Unit Competence
Use Charts and objects in a spreadsheet, use different techniques to organize a printable datasheet.
5.1 Charts (Graphs)
A chart is a graphical representation of numerical data. It is a sheet of information in form of a table, graph, diagram or object.
Charts enable users to see results of data in detail, interpret and predict current and future data in a much easier way.
5.1.1 Uses of charts
- Used to summarize numerical information.
- View relationships between different variables e.g. Price against sales volume.
- Detect trends overtime and make forecasts.
- search for patterns among a large amount of figures.
Note: In unit 3, we looked at how we create charts in MS Word and this means you already know something about charts. Like in MS Word, a chart is created almost the same way in MS Excel but the difference is in steps you take to create it.
5.1.2 Types of charts
there are several types of charts used to present data pictorially. the charts mainly include; column, bar pie, line and scatter graphs.
Activity 5.1
You are given the following data to enter in Microsoft excel. save the data as ‘ICt marks’. Use the data to create a column, bar, pie, line and scatter charts. (Follow steps for creating a chart in section 5.2).

1. Column chart:A column chart displays data as vertical bars. If the data in table 5.1 above is entered in spreadsheet and a column chart created for ICT marks, it may appear as shown in picture 5.1.

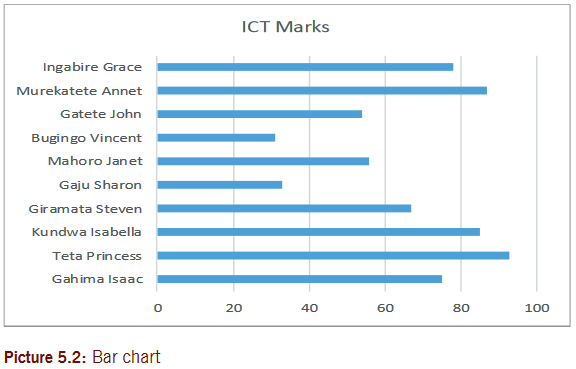
2. Bar chart: A bar chart represents data mainly as horizontal bars or objects.
When the data in table 5.1 is used in Ms excel to create a chart, a bar chart for ICT marks may appear as shown in picture 5.2.
Difference between column and bar charts
A bar chart represents data using horizontal objects but a column chart uses vertical objects.
Similarity between column and bar charts
Both bar and column charts represent data using bars or columns to compare items. the length of each bar or column is proportional to the data that it represents. this means that a bar or column corresponding to a value of 100 would be twice as long as one corresponding to value of 50.
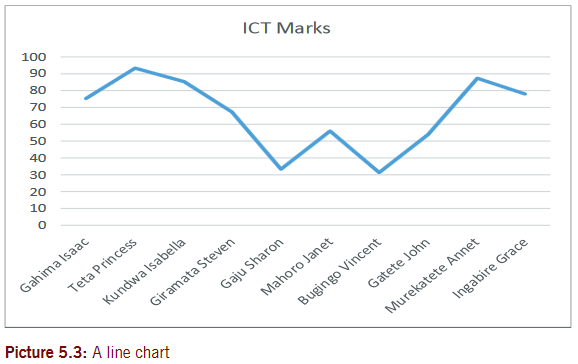
3. Line chart (line graph)
A line chart is a graphic representation of data plotted using a series of lines.
If the data in table 5.1 is used to create a line chart, it would appear as shown in picture 5.3.
4. Pie chart
Pie chart is a circular chart sliced into sections; each section represents a percentage of the whole. Pie charts do not display horizontal and vertical axes as other charts.
If the data in table 5.1 is used to create a pie chart, it would appear as shown in picture 5.4.

5. Scatter chart /graph
A scatter plot is graph of plotted points showing the relationship between two sets of data.
A scatter (XY) plot is a graph used to plot the data points for two variables. each scatter plot has a horizontal axis (x-axis) and a vertical axis (y-axis). one variable is plotted on each axis.
If English marks are added to table 5.1 to have two variables, then the scatter plot would appear as shown in picture 5.5.
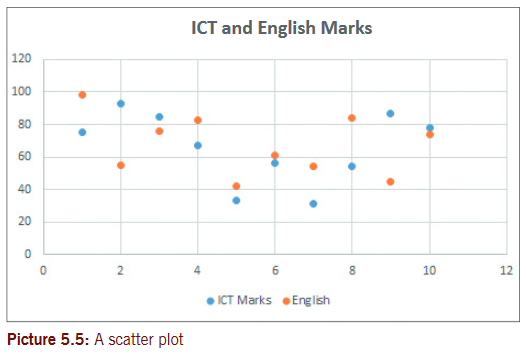
5.2 To create a chart in Microsoft Excel
there are several charts you can create and the common ones are; bar, pie, column and line charts. Common charts are illustrations that are frequently used to represent data in figures.
to create a chart follow the steps given below;
Step 1:Create or open an existing workbook with well-prepared numerical data. In this case open a file ICT marks.
Step 2: select all the cell data you need to be represented in the chart (including all the labels and titles). If the data is not nearby to each other, press Ctrl as you select other pieces of data.
Step 3: on the Insert tab, in the Charts group, click on the chart type you want (example is Column) and then click on the sub type
Desired from the list that displays (example is 3-D Clustered column).
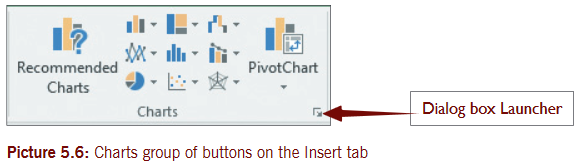
Step 4: the new chart displays automatically as a floating object(embedded chart) in your data.
Using table 5.1, we create a 3-D column chart, and it appears as shown in picture 5.7.
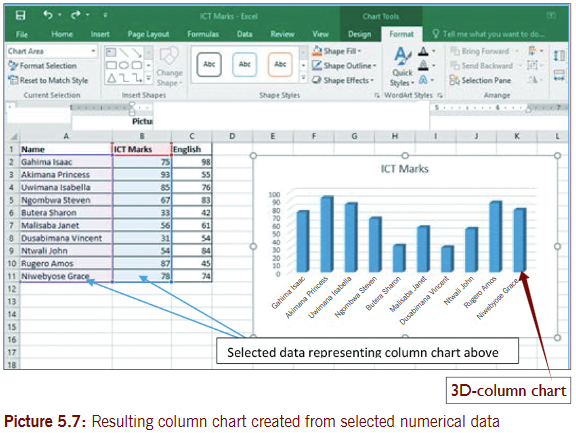
a) If you want the chart to remain in the sheet as object, drag it to appropriate position below or on the right of the data. You can also resize it.
b) If you want the chart to be on a separate sheet do the following:
(i) on the Design tab (under Chart Tools), in the Location group at the right, click on the Move Chart button.
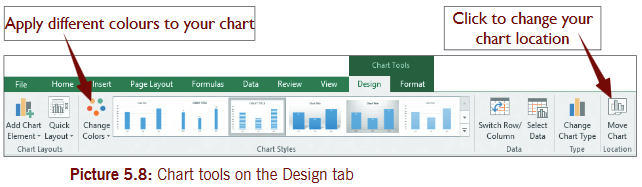
(ii) In the Move Chart dialog box that displays as shown below, choose where you want the chart to be placed and click OK.
Note: Once you select data for charting, press F11 to place the chart on a separate sheet or press Alt + F1 to place it as an object in the sheet.
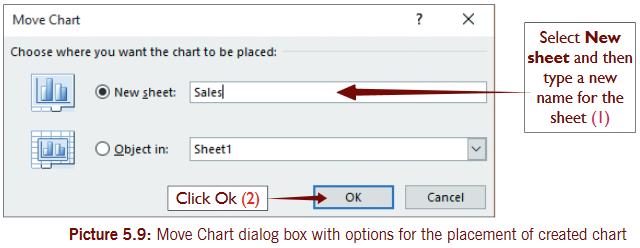
Step 5: the new chart will display on its page as shown in picture 5.10(a). Label your chart by applying chart title, x-axis title and y-axis title.
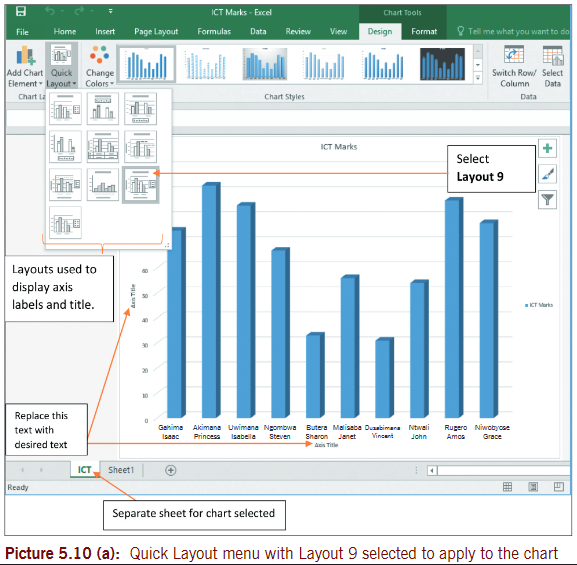
5.2.1 How to apply a predefined chart layout to your chart
Use the steps given below to apply chart layouts on the charts (column, bar and line charts) you created in Activity 5.1.
Step 1: select the chart/graph.
Step 2: on Design tab, in the Chart Layouts group, click Quick Layouts button. on the list of layouts, select Layout 9 (or you can select any other desired).
Step 3:Replace the default text in the x-axis, y-axis titles and Chart title with learners’ names, marks in percentages and a chart showing learners performance in ICT, respectively.
Note: For the chart to be easier to understand, titles must be added i.e. chart title and axis titles.
If the column chart in Activity 5.1 is changed to a 3-D column chart and labelled, it appears as shown in the screenshot. see picture 5.10(b).
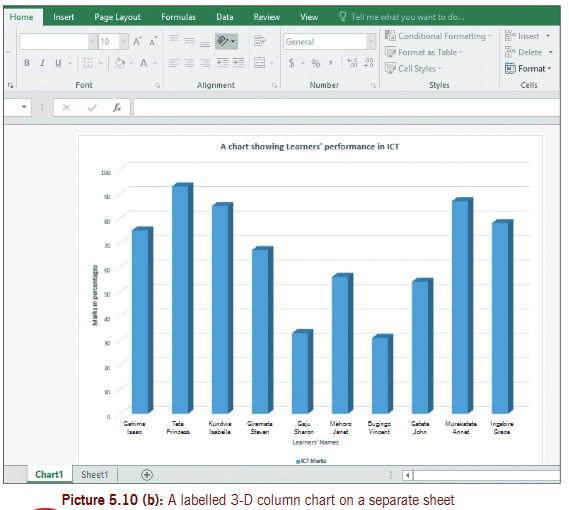
Activity 5.2
1. organize the following data in a spreadsheet software.

a) Create a 3-D line chart to display information in table 5.2.
b) Apply labels and title on your chart. save your work as ‘Rain-temperatures’ and print your work.
2. the data in table 5.3 shows Animal data between the years; 1991 and 2000. enter the following data using Microsoft excel.
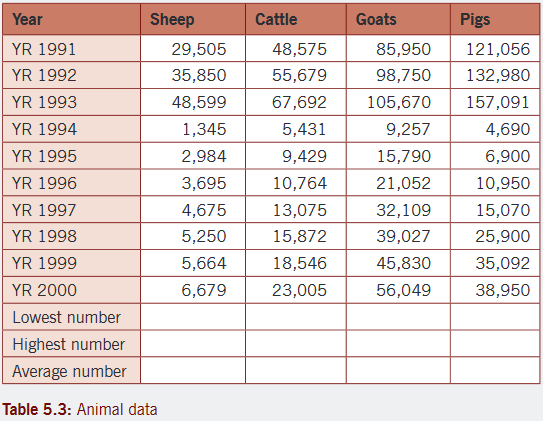
a) Copy the information above onto sheet 2 and then include one decimal place on all the figures.
b) Apply a suitable border on all the data.
c) Determine the lowest, highest and average livestock for each category given.
d) Use appropriate range of data series to represent the data for the year 1991 on a pie chart . Place your chart on a separate sheet and name the sheet YR1991.
e) Represent the data for the years; 1991, 1992, 1993, 1994, 1995, 1996 and 2000 on a 3D- column chart.
5.2.2 How to apply a predefined chart style
A style is a format clearly created which you can use to improve appearance of your chart. Follow the steps below, using the chart you created in Activity 5.1.
Step 1:Click in the Chart that you want to apply a style. the Chart Tools will display.
• on the Design tab, in the Chart Styles group, click the chart style you want to use.
If a chart style is applied to picture 5.1 we created in Activity 5.1, the results are shown in picture 5.11.
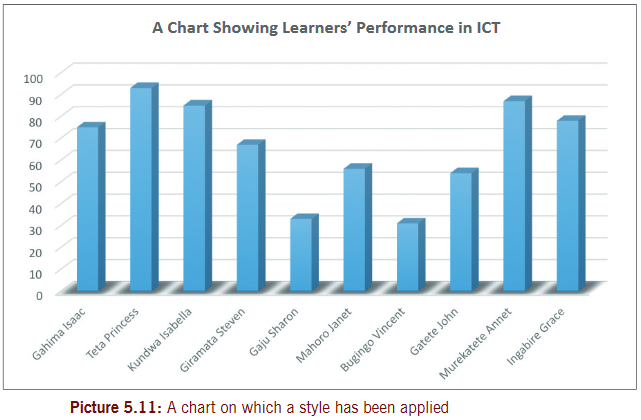
5.2.3 Creating a combination chart
A combination chart contains data series plotted using more than one type of chart.
We are going to group to use the data below to create a combination chart.
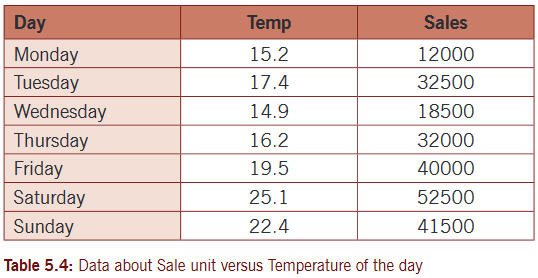
Steps to create a combination chart
Step 1:Create a chart containing all the data you want.start by entering the data in spreadsheet software and save it as Comb.
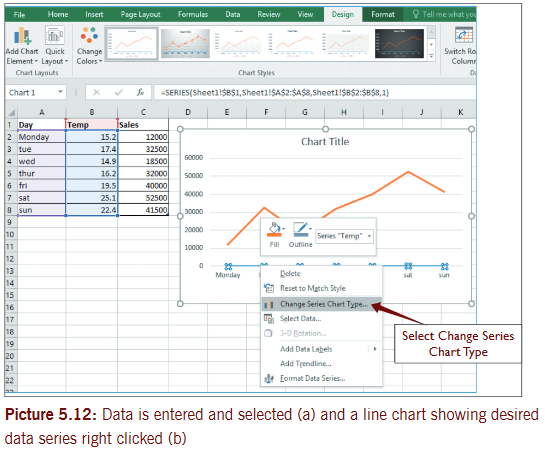
Step 2:Right click on the data series you want in the chart.
Step 3: select the Change Series Chart Type from the shortcut menu.
Step 4: select a different chart type and then observe the changes.

Note: When a combination chart is created, it is important you apply two vertical scales.
5.2.4 Change chart type
We are going to use ICT marks file to change chart type. Begin by opening the column chart as picture 5.10(b) and follow the steps given below.
Step 1: select the chart you want to change.
Step 2: on the Design tab in the Type group, click Change Chart Type.
You can also right click the chart and select Change Chart Type.
Step 3:In the Change Chart Type dialog box that displays, select the chart type and sub type you want.
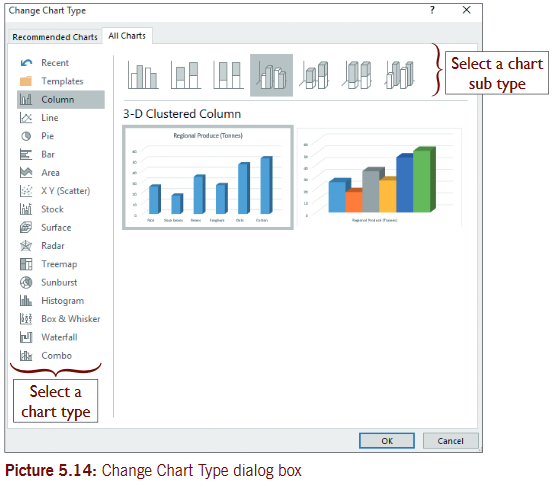
Step 4:Click OK.
In case you select a Bar Chart, the resulting chart will appear as shown in picture 5.15.
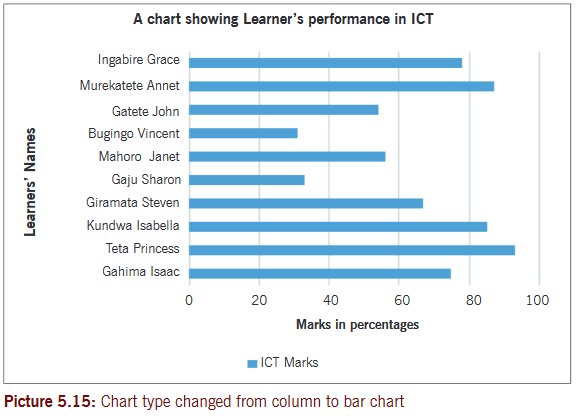
Activity 5.3
Create the following data in Microsoft excel as it is and save it as Exam Results. the figures are in percentage pass at credit level.

a) set the number of decimal places to 1.
b) Create a 3D-clustered column chart on a separate sheet to display the data given in the table above. name the sheet as ‘3D results’.
c) Apply a chart layout that includes all titles to your chart.
d) Format the plot area to a pattern fill having a yellow (50%)color in the foreground and white in the background.
e) Change the fill color for Data series ‘Boys’ to purple and ‘Girls’ to a gradient fill with a red color and black color.
5.3 Formatting chart
to format a chart is to change the appearance of a chart so as it looks attractive. You can format chart background colors and patterns, legend, axis and labels. now open ICT marks file to get a saved bar chart, as shown in picture 5.15.
Follow the steps below to format chart
Step 1:Create or open an existing chart in Ms excel.
Step 2:Click or select any part of the chart e.g. Chart Area, legend, horizontal axis or horizontal axis title, vertical axis or vertical axis title, data series, etc.

Step 3: on Format tab, in the Current Selection group click Format Selection. the task pane displays (on the right of excel window) showing Chart Options to format Chart Area. the task pane displays Chart options depending on the part you have selected.
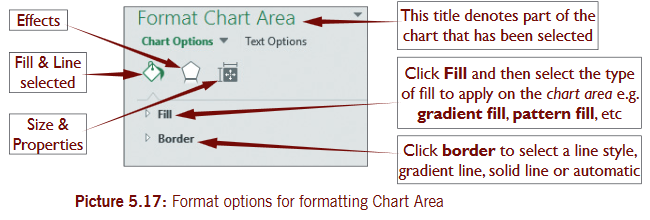
Alternatively, you can format a chart quickly by right clicking on any part of the chart you want to format. In the shortcut menu, select Fill Color or Line color you want.
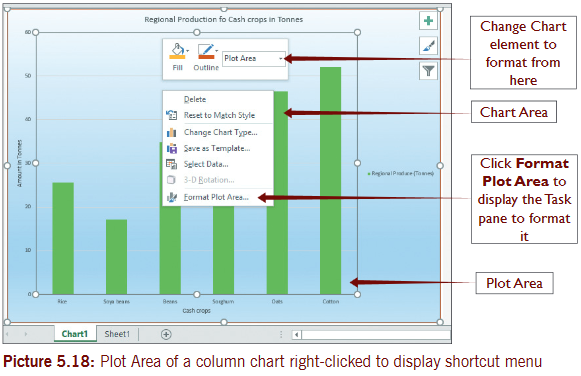
5.4 Format cell data as a table
Cell data is any piece of data you want to format as a table contained within spreadsheet cells.
Steps to format cell data as table
Step 1: select the spreadsheet data you want to format as table or click in it (must be nearby each other). In this case, open Comb file.
Step 2: on the Home tab, in the Styles group, click Format as Table drop down list and select a desired table style from the list.
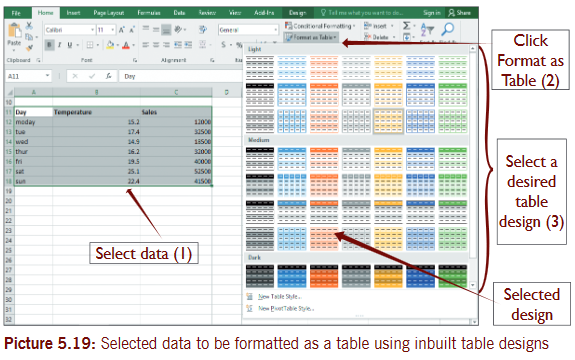
Step 3:Format as Table dialog box appear, click OK.
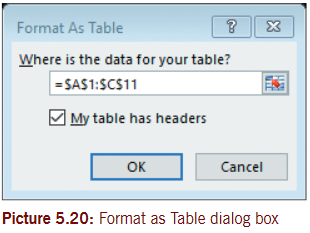
Step 4: table tools display on the Design tab. Use table tools to modify your table as desired.
Step 4: table tools display on the Design tab. Use table tools to modify your table as desired.
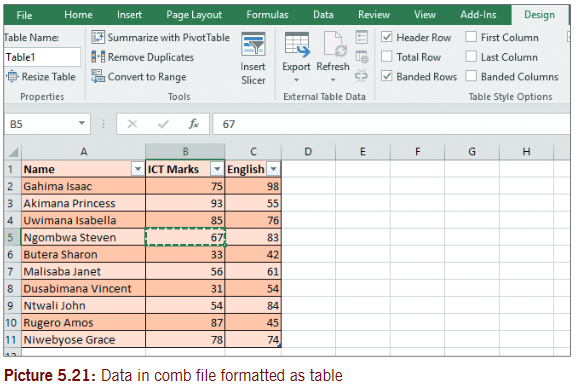 5.5 Printable datasheetBefore you print a worksheet, it is important that you set a print area. Printing is the action of producing a hard copy information using a printing machine such as a printer or printing press. Page setup options control the layout of a printed sheet and therefore must be used before a worksheet is printed. Page setup options include; margins, headers and footers.5.5.1 To set page marginsUse the data given in Comb file and use it to set page margins. Follow the following steps.Step 1: on the Page Layout tab, in the Page Setup group, click Margins and in the menu select “Custom Margins”.
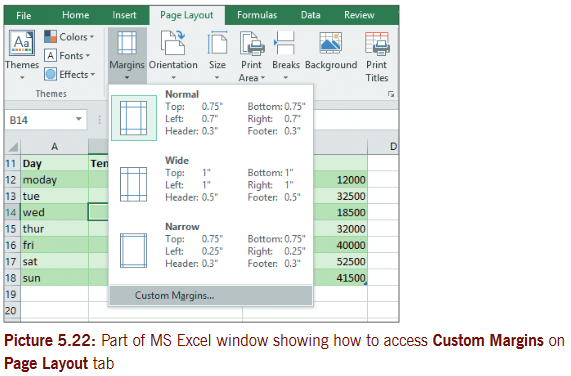 Step 2:In the Page Setup dialog box for Margins, increase or reduce the margins and click OK.
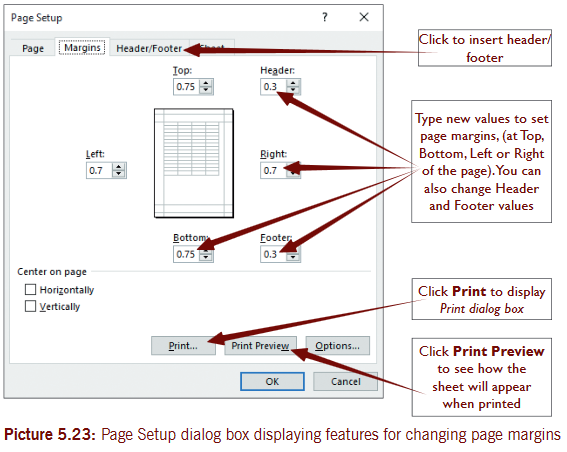 5.5.2 Set headers and footersA header is information printed at the top of every page and footer is information printed at the bottom of every page. Headers are suitable for Company names, page titles; footers are good for page numbers and printout dates or times.Note: Headers and footers are not displayed on the worksheet in normal view.On ordinary worksheets you can Insert header/footer by clicking on Insert tab, in the Text group, click Header/Footer. Automatically the cursor goes in the center of the header.Insert header/footer (for chart sheet)Follow the steps given below to insert header and footer.Step 1: on the Page Layout tab, in the Page setup group, click dialog box Launcher.Step 2: In the Page setup dialog box that displays, click on Header/Footer tab.Step 3: Click on Custom Header to insert your header or Custom Footer to insert footer.Step 4: Click in the Left section, Center section, or Right section box, and then click the buttons to insert the header or footer information that you want in that section.
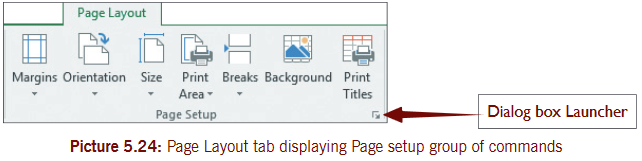 The page setup dialog box is shown in picture 5.16, if you click either Custom Header or Custom Footer, the Header or Footer dialog box displays. to add or change the header or footer text, type additional text or edit the existing text in the Left section, Center section, or Right section box.
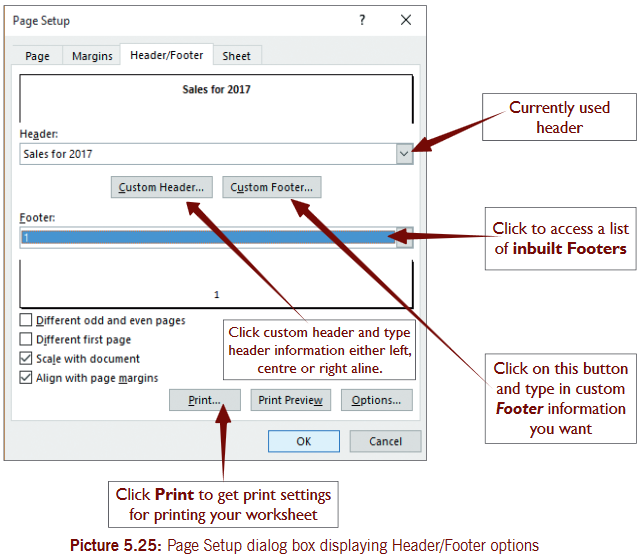 When you click on Custom Header or Custom Footer you get a Header and Footer dialog box respectively. When you use these dialog boxes, you can position your text or object in the left, center or right section of the page in the header and footer.
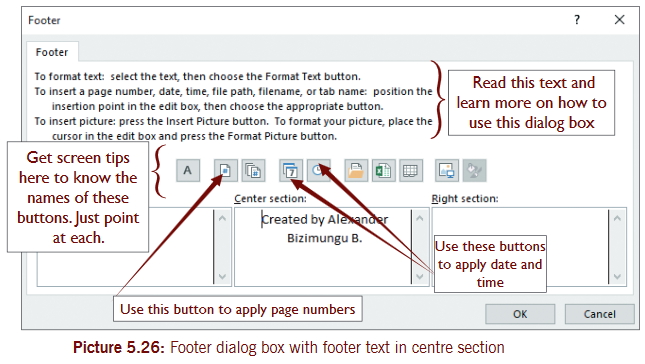 Header/Footers are displayed only in Page Layout view and on the printed pages. You can insert headers or footers in Page Layout view where you can see them, or you can use the Page Setup dialog box if you want to insert headers or footers for more than one worksheet at the same time.For other sheet types, such as chart sheets, you can insert headers and footers only by using the Page Setup dialog box.
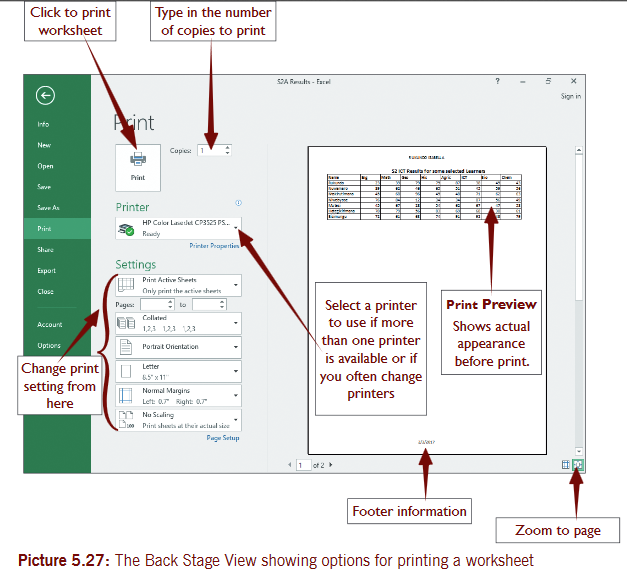 In Microsoft excel 2016, when you want to print or get a print preview, you always get the same screen similar to the one in the picture above. on File tab, click Print or press Ctrl + P on keyboard.The following important commands are available in the screenZoom: Magnifies the page to actual size. this button is located on the lower right.Print: sends a copy of the worksheet to the default printer.Page Setup: Displays page setup dialog box.5.5.3 Print areathis is one or more ranges of cells that you designate to print when you don’t want to print the entire worksheet. this means only the print area set is printed.A worksheet can have multiple print areas. each print area will print as a separate page.To define or specify the print areaUse the steps given below to specify print area. Use data give below.Step 1:Create or open an existing worksheet.Step 2: select the cells you want, define as print area (data range).Step 3: on the Page Layout tab, in the Page Setup group, click Print Area, and then click Set Print Area.
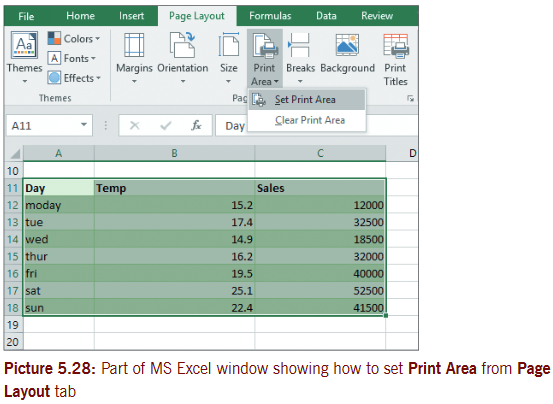 Note: A line around the data marks the print area. When you save a worksheet the print area is also saved.Use the same steps given above to add and clear the print area.5.5.4 Printing a ChartIf you want to quickly print the chart which is part of the data, select/click it and press Ctrl + P on keyboard. Click print button to print using default printer.If the chart is on a separate sheet; select Print on the File tab, then click print button to print from default printer.End of Unit 5 Assessment1. A business consultancy firm advertises in the local newspaper and it spends different amounts of money on advertising and records the number of appointments booked from different adverts as shown in table below.RequiredProduce a scatter graph (with smooth lines and markers) from the data given in table below to see any correlation between the amount spent on adverts and the appointments booked.
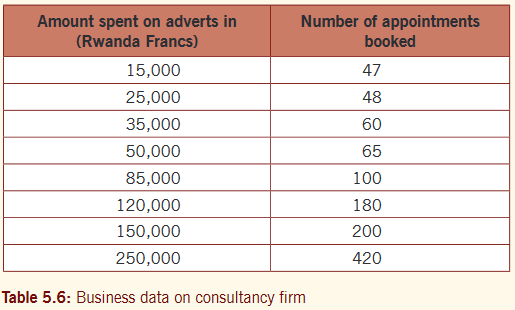 Label and save your graph as ‘business’. Print your graph.2. Use a suitable spreadsheet software on your computer and enter the following data beginning from cell A1 on sheet1. save the file as Results.
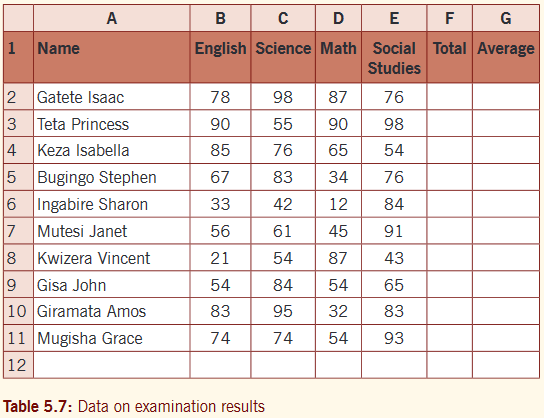 Requireda) Create a 2D-clustered column chart to represent learners’ performance in science and social studies. Label your chart correctly on a separate sheet. name the sheet as 2ess. Format your chart appropriately.b) Create a 3D-clustered column chart to represent all learners’ performance in the four subjects. Place your chart on a separate sheet you name as ‘Comparison’. Format your chart as desired.c) Use a suitable formula to calculate the total marks and average marks in the total column and average column respectively. Represent the total and average marks on a stacked line chart. Place the chart as an object on sheet2.d) Create a pie chart as an object on sheet3 to represent the performance of learners in Math only.3. Mrs Gaju has a wholesale shop selling Mineral water. the shop is located in one of the suburbs of Kigali City. Last week she decided to record track of how many bottles of mineral water she sells versus the noon temperature of that day. the figures for 7 days are as shown below:
 a) organize the data in a spreadsheet and save it as Gaju sales.b) Create a combination chart (temperature with a column chart and sales on a line chart). Apply different vertical scale for sales, a chart on a separate sheet. name sheet as ‘mineral water’.c) Apply titles or otherwise use a suitable Quick layout on your chart that can make it more organized.d) Insert header as your names and footer as Page numbers.e) Print your charts on separate sheets that contain suitable headers.
Unit 6: Presentation
Key Unit Competence
Prepare and make a presentation.
6.1 Presentation
A presentation is an organized report or message prepared as a talk before audience, with the help of a computer program.examples of programs/software which you can use to create presentations include among others the following: Microsoft PowerPoint, Harvard Graphics, Corel Presentations, open office .org Impress, Lotus Freelance Graphics, King soft Presentations, etc.
Presentation software is a program used to create slide shows for presentation on screen to an audience. Presentation program/software can supplement or at times can replace use of visual aids like handouts, chalkboards, posters, etc.
6.1.1 Role of presentation applications
- Conveying information about an important issue such as disease control measures.
- Introducing a new idea for business.
- Reporting progress using charts or graphs.
- training by demonstrating how it is done.
6.1.2 Working with (Microsoft) PowerPoint presentationMicrosoft PowerPoint is a presentation graphics software commonly used when you plan to give a talk as a presentation. the purpose of the talk may be to inform, create awareness, present strategies or to sell a product or service. PowerPoint presentations can be done on computer screen if the audience is very small. If the audience is large the computer can be connected to a projector that projects the image onto a large screen/wall.Using PowerPoint, you can create speakers’ notes or handouts for conveying information to the audience.When using Microsoft PowerPoint, the data file you create is known as a Presentation. each presentation is made up of one or more slides.6.1.3 Launching Microsoft PowerPoint presentationStep 1:Click Start button and select All apps Step 2: scroll down and select PowerPoint 2016 (or click Microsoft Office and then select Microsoft Power Point).Alternatively click in the Search box on Taskbar, type in PowerPoint 2016 and press enter key on your keyboard.
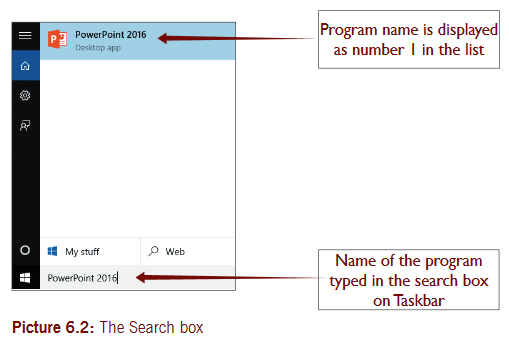 Step 3: the Presentation Gallery displays as shown below. select the Blank Presentation with a new slide, to begin from scratch.
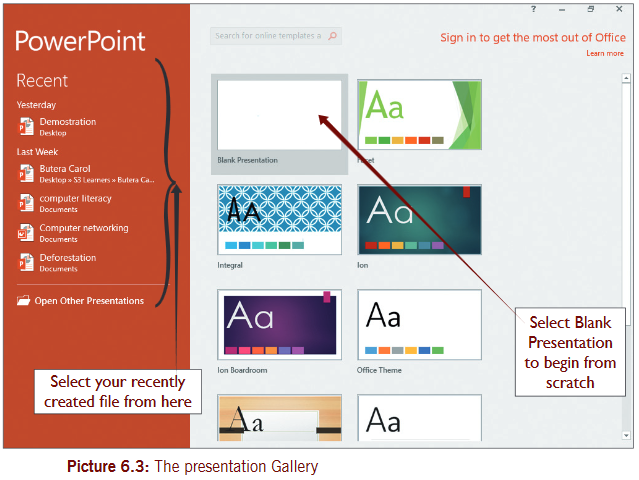
 Step 4:You can now add text, pictures or objects to the slide(s) to enhance its appeal. Afterwards save your presentation.Activity 6.1Create and save a presentation with micro soft power point.6.1.4 Saving a presentationWhen you open Ms Power point by default you have created a presentation. In this case add pieces of data e.g. level of sanitation in your school.Follow steps below to save a presentationStep 1: on the File tab, click Save As to get the backstage view for save As. see picture 6.6.Step 2: select a location or browse a location to save your file. the Save As dialog box displays, (as shown in picture 6.6).Step 3: type in the desired file name (see picture 6.7) and then click Save.Note: By default, PowerPoint 2016 save files in the PowerPoint Presentation (.pptx) file format. To save in another file format, click on the Save As type list and select the file format you want.
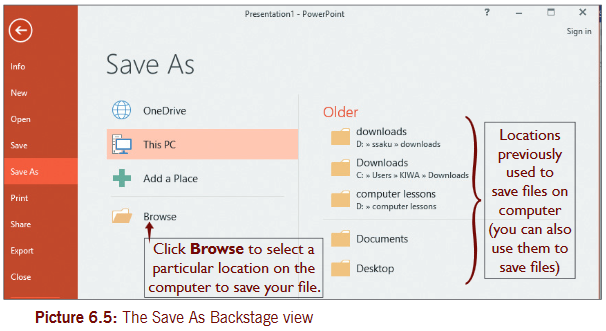 Note: Access quickly the Save As Backstage view by pressing Ctrl + S on keyboard or clicking Save button on the Quick Access Toolbar.
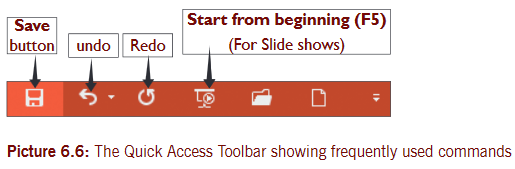
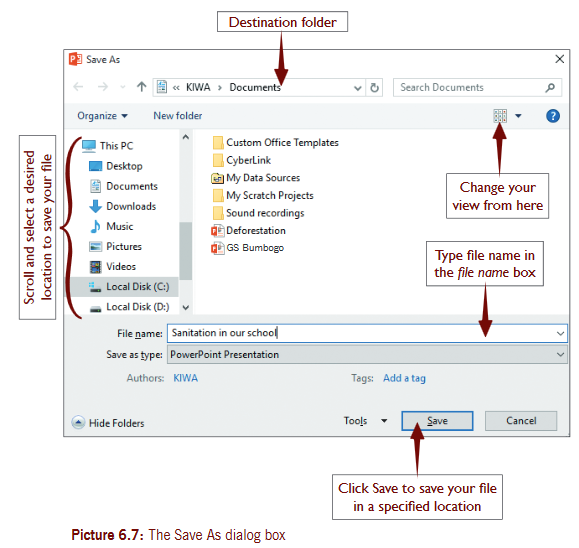 Step 5:Close the application window or file created.6.1.5 Opening an existing presentationActivity 6.2open an existing presentation you saved previously Activity 6.1 or open any other presentation earlier created.Follow the steps given below to open an existing presentation.Step 1: start Microsoft PowerPoint program.Step 2: on the File tab, click Open. the open Backstage view opens. see picture 6.8.
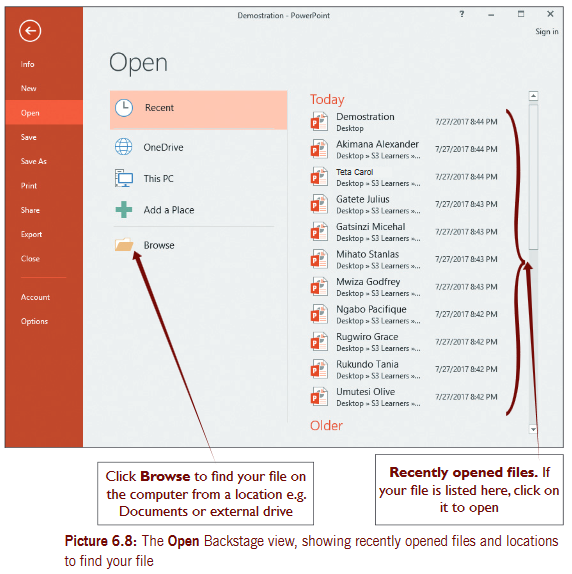 Step 3: select a location where your file is located or browse in folder to find the file. In the Open dialog box , in the File name box, type the name of the file you want to open (or scroll, locate and double click on the file).Step 4:Click Open button and the file will open.
 Note: After starting PowerPoint, you can quickly access the open Backstage View by pressing Ctrl + O on the keyboard.Other methods for opening an existing presentationStep 1:Click Start button.Step 2:In the Search box, type the file name and press ‘Enter’ key on keyboard.
 6.2 Components of presentation environmentA Window for Microsoft PowerPoint 2016
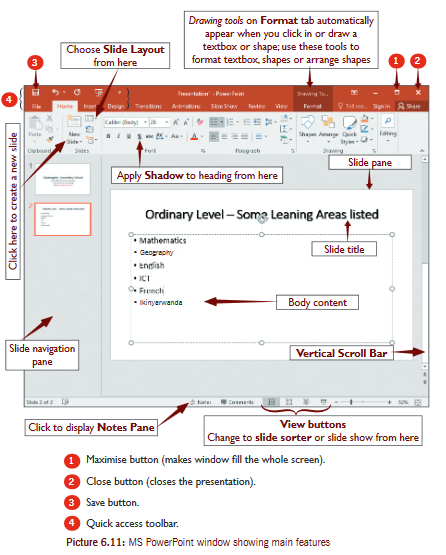 6.3 SlidesA slide is a single page of information in a presentation created with programs such as PowerPoint or Corel Presentation. A presentation is made up of several slides.Activity 6.3Rwanda Government has made a significant progress in protecting the environment. Create a presentation about environmental Protection in Rwanda and save the presentation as “Nature-protect”.Note: We shall use this presentation later to learn many features of a Microsoft PowerPoint presentation.Use the following steps to create the presentationStep 1: open a blank presentation.the presentation opens with only one slide
 Step 2: type the title as Environmental protection in Rwanda.Step 3: type the sub title as Environmental Protection is the practice of protecting natural environment to benefit humans and environment itself.save your presentation as “Nature-protect”.
 6.3.1 Insert a new slideAfter working on the first slide, you need more slides to complete your presentation. open the file Nature-protect that you have created.to get new slides, do the following:on Home tab, click New Slide button (or just press Ctrl + M on keyboard). see picture 6.14. Add the following data on the new slide.
 Add the following data to the new slide (slide 2): Add title as “Rwanda Environmental Problems”. Add bulleted text as shown below.
- Land degradation
- Deforestation
- Wetland and biodiversity loss
- natural causes
- Man-made disaster
- Reduction of water resources
- Human settlements
Note: since we are using a Presentation program, we are not supposed to write details on points. Details are explained when giving the presentation to your audience.Add the following slides in your presentationSlide 3: title as “Causes of Environmental Problems in Rwanda”. text in bullet style as;·Population growth and pressure on land·Declining resources·over exploitation of natural resources·Land scarcitySlide 4: title as “Rwanda Environmental Management Authority (REMA)”.text as;·REMA is Government organ responsible for execution of environment related policies and laws in Rwanda.·REMA designs policies and procedures used to conserve natural resources, preserving the state of current environment and where possible reversing its degradation.Slide 5: title as “How to protect environment in Rwanda”. text as;·Harvest rain water and conserve all waters for proper use·Use biodegradable items and practice re-using packaging products.·Join with others in cleaning wells, roads, beaches or riversides·Plant native trees plus flowers that bees like·Raise awareness of threats to nature·Use alternative source of energy other than woodSlide 6: title as “Rwanda Environmental Features” text as;·natural environment e.g. relief, climate, vegetation·natural resources and biodiversity¤soil and subsoil e.g. mineral deposits like gold exploited on small scale¤Wetlands such as lakes, rivers¤Forests and protected areas¤Biodiversity i.e. plant and animal species that need protection¤energy resources such as wood fuel, plant residues and biomass.·Human environment e.g. human settlements.6.3.2 To cut or copy and then paste slidesUse the open file, nature-protect to cut or copy slide(s). Follow the steps given below.Step 1:In the Slide Navigation Pane, click on the slide you want to cut or copy. In this case select slide 6 or right click on it as shown in picture 6.15.Step 2: on the Home tab, in the Clipboard group, click Cut or Copy button. Step 3:Click in the destination place and then on the Home tab in the Clipboard group, click Paste button.In our activity right click below slide 6 and then select paste.To copy and paste a slideRepeat steps 1 above and in the shortcut menu select copy. Lastly click in the destination point and choose paste from the shortcut menu.Note: When you cut a slide it disappears from its original location and goes to the clipboard, but when you copy a slide, a copy of it remains and another copy is taken to the clipboard.6.3.3 Apply design theme in a presentationBy using the file “Nature-protect”, we are going to apply a design theme to our presentation using the steps given below.Step 1:Click on the Design tab.Step 2:From the Themes group select a theme you want. (see picture 6.16)
 Step 3: select a theme Variant in case you need it and then save changes to your presentation.6.4 ObjectsAn object is something that you can see or touch. In Presentation software such as Microsoft PowerPoint, the shape of an object can be drawn or inserted from another source.there are several objects that you can insert in presentation software. these include: textbox, Images, table, Clip Art, Word Art, smart Art, shapes, Charts and Media Clips.6.4.1 Textboxthis is a box in the program from where the user can type or edit text, dates or numbers. A textbox can be drawn and used to place text in a particular location you want in your presentation.there is a difference between text placeholder and textbox. You cannot insert a text placeholder in a slide since it is part of the layout for your slide and exists when you insert a new slide but textbox need to be inserted manually.Activity 6.4open “Nature-protect” file. Add textbox in the upper middle part of slide 1 and type in your names. Repeat the same action for all the slides in the presentation. Follow the steps given below for Inserting textbox:Step 1: on the Insert tab, click Text box command from the Text group. the pointer changes to upside down cross.
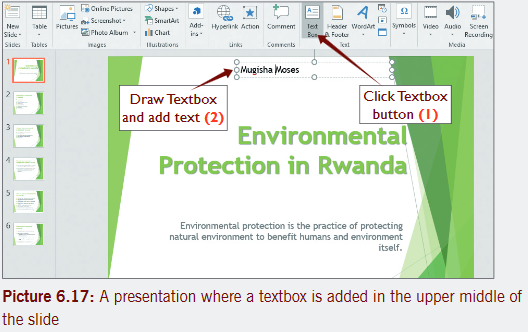 Step 2:Move the pointer to the location where you need to draw the textbox and then draw it. Automatically the insertion point appears in the textbox to indicate where text will appear when you type it.Step 3: type in your information (i.e. your names) in the textbox. If you move the textbox in another place, the text will move together with the textbox.6.4.2 ImagesAn image is the actual picture or mental picture of something. Adding pictures can make your presentation more interesting and attractive. You can insert a picture from a file on your computer onto any slide.Activity 6.5open the file Nature-protect. In it add a suitable picture on the lower middle of each slide from your computer or another location. the picture may be the same or different. save the changes to your presentation.To insert a picture in a presentationselect a slide where you need a picture. In this case select slide 1 in Nature-protect file to add a picture.Step 1: select the Insert tab, then click the Pictures command in the Images group.
 Step 2:Insert Picture dialog box will appear. Locate from your PC and select a desired image file, then click Insert.
 Step 3: the picture will display on the currently selected slide. Repeat step 1 and step 2 for the rest of the insertions. Alternatively copy the picture and then right-click on each and every slide as you select paste.
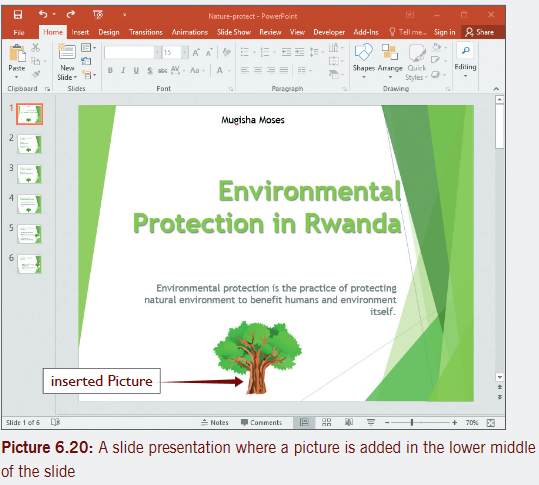 Note: You can also click the Pictures command in the slide placeholder to insert images (for new slides).
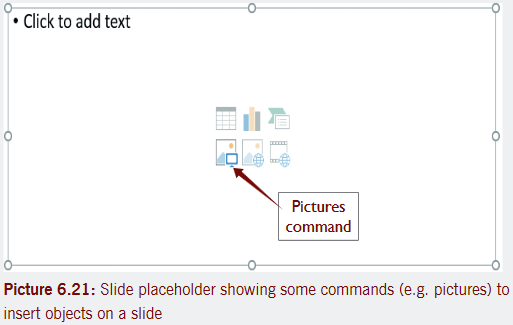 6.4.3 Inserting online pictures (Clip Art)In case you don’t have a desired picture on your computer, you can find a suitable picture online and then add it to your presentation. In PowerPoint 2016, online pictures are used instead of Clip Art that exist in earlier versions of the program.Activity 6.6open “Nature-protect” file and add 2 suitable online pictures on a new slide (slide 7).Use the following steps to add online pictures to nature-protect presentation;Step 1:Insert a new slide after the last slide.Step 2: on the Insert tab, in the Images group, click Online Pictures command.
 Step 3: the Insert Pictures dialog box will appear as shown below.
 Step 4:Choose Bing Image Search.Step 5:Press the enter key. Your search results will appear in the dialog box.
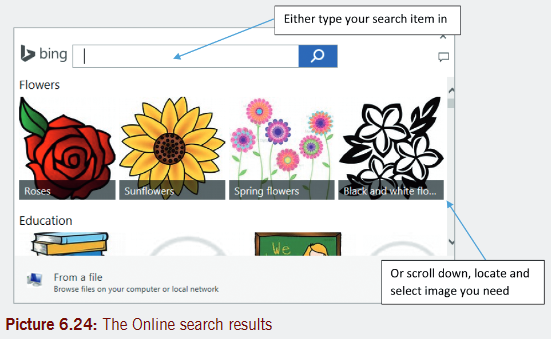 Step 6: select the desired image, then click Insert.Step 7: the image will appear on the currently selected slide.
 You can also select Online Pictures command in a placeholder to insert online images
 6.4.3.1 Moving and resizing pictures/imagesonce a picture is inserted, it may require you to move it in a different location on the slide or change its size.6.4.3.2 To move a pictureClick and drag to move a picture to a new location you want on a slide. see picture 6.27.6.4.3.3 To delete a pictureselect the picture and then press backspace or delete key on your keyboard.6.4.3.4 Resizing pictureFollow the steps below:Step 1:Click on the picture. the picture will display selection circles as shown in picture 6.27.Step 2: on the Format tab, click on shape height and or shape Width using existing arrows
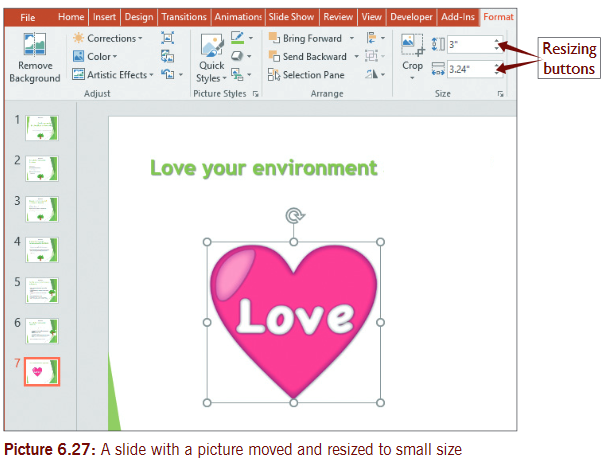 Note: Alternatively, after clicking on the picture, point to one of the selection circles until the pointer changes to double pointed arrow. Then click and drag outwards to increase size; or inwards to reduce the size.6.4.4 TableA table is made of rows and columns. Data or information can be arranged using these rows and columns.Methodsa) Create and format a table within a presentation.b) Import a table from Word or a group of cells from excel spreadsheet.6.4.4.1 Method 1: Create and format a table in MS PowerPointUse the steps given below to create the table: open the “Nature-protect” file.Step 1: select the slide that you want to add a table to. In this case add a new slide after last slide.Step 2: on the Insert tab, select Table.
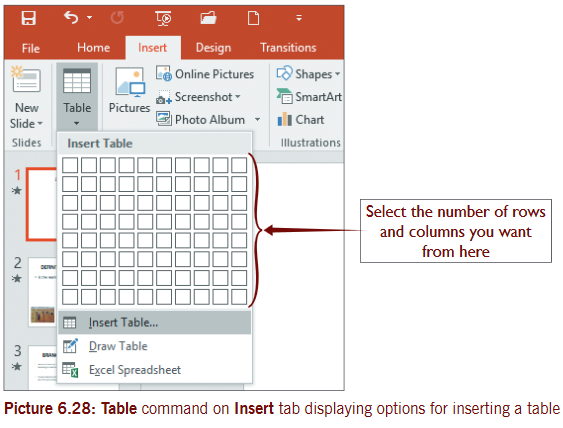 Step 3:In the Insert Table dialog box displays.Note: Either use a mouse to select the number of rows and columns you want or Select Insert Table and enter the number in Number of columns field and Number of rows field. Lastly click OK.Activity 6.7open “nature-protect” presentation file and create the table given below on slide 8.In our activity we are going to add the following data on the new slide 8.Learners were given assessment tests about environmental protection. the following is part of S3 learners’ marks obtained in 2 tests.
 save changes to your file. the new slide in your presentation may appear as shown below.
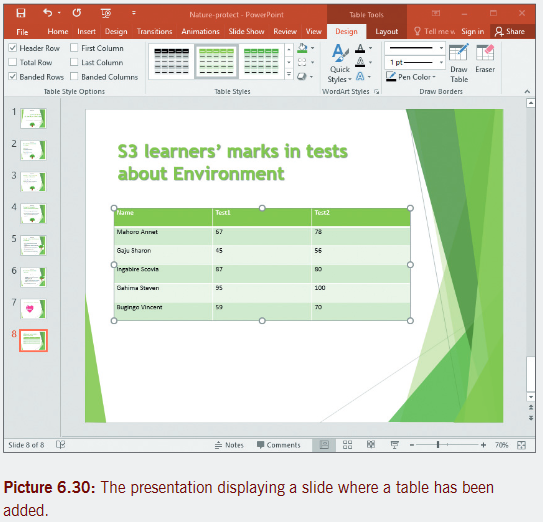 Step 4: to add text to the table cells, click a cell and then enter your text. Afterwards click outside the table.6.4.4.2 Method 2. Copy tableUse the steps given below to import table;Step 1: open a Word document containing a table you want to copy.Step 2: on the Layout tab (Table Tools) in the Table group, click Select and then click on Select Table.Step 3: on the Home tab in the Clipboard group, select Copy.Step 4: Click on your PowerPoint Presentation, select a slide where you want to copy the table to. on Home tab, in the Clipboard group, click on Paste.Note: Using the method above, you can copy and paste a table from one office application or file to another.6.4.5 Word ArtWord art is an object that you can move, resize or rotate within the document. Word art is applied to text to appear in a unique form such as a circle, curve or oval; use word art.6.4.5.1 Insert Word artFollow steps given below for adding word art in Nature-protect slide. start by opening the file.Step 1: select the slide where you want to insert a Word Art.Step 2: Click on the Insert tab and then click on the Word Art button in the Text group. A gallery of Word Art styles is displayed as shown in picture 6.31:
 Step 3: select a Word Art style you want to use. the Word Art textbox will be inserted on the slide as shown in picture 6.32.
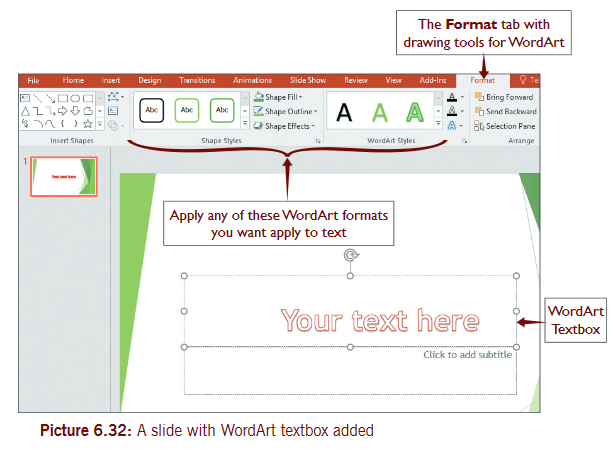 Step 4:Move the Word Art in suitable location. And then delete the original text and textbox.Step 5:Repeat steps 1-4 and apply a desired Word Art to all slide titles. slide 1 in our presentation may appear as shown in picture 6.33.
 Step 6:Click on the Word Art textbox and then type the desired text.6.4.6 Smart ArtSmart Art is a picture used to communicate information in many different ways. It is an option that allows the user to create diagrams easily.Create a Smart Art graphic and add text to itUse the steps given below to insert a smart Art graphic to your presentation.Step 1: open “nature-protect” file presentation and insert a new slide (slide 9) where you need a Smart Art. You can also create new presentation.Step 2: on the Insert tab, in the Illustrations group, click Smart Art.
 Note: Alternatively insert a Smart Art using the Smart Art Graphic button in the content holder, as shown in picture 6.35.
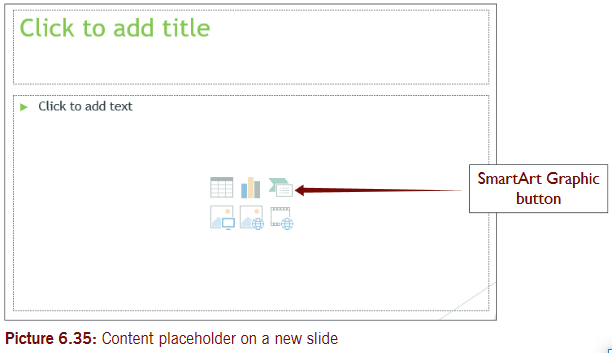 Step 3:In the Choose a Smart Graphic dialog box that displays, click the type and layout that you want. In our case, we are going to create a hierarchy of officers in our school.
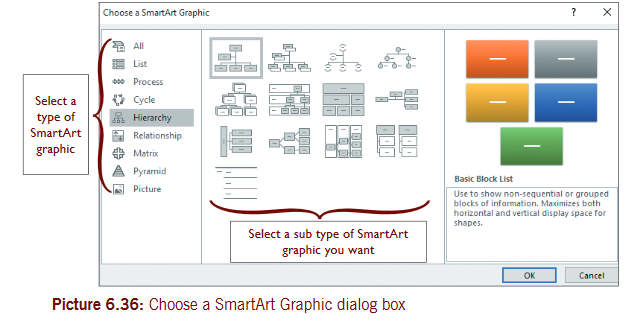 Step 4: enter your text by either:Clicking in the text pane (left) and then type your text or clicking directly in the Smart Graphic and type the desired text. Afterwards save your file.
 6.4.7 ShapesA shape is an outline form of an object. In office applications such as Microsoft PowerPoint, you can add shapes such as boxes, circles and arrows to your slide show presentation.6.4.7.1 Insert a shapeUse the steps given below and insert any type of shape you want. open nature-protect file or create a new presentation. In the open file create a new slide for your shape(s) as slide 10.Step 1:Click on Insert tab.Step 2:Click Shapes from the Illustrations group.
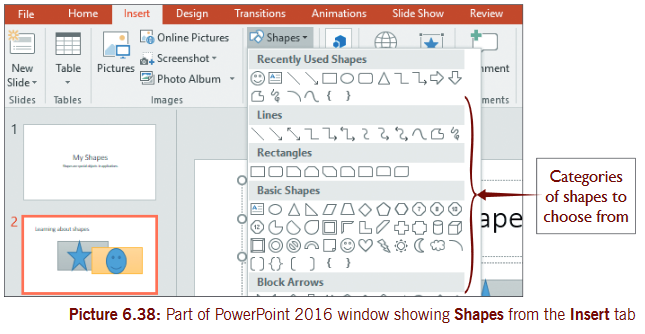 Step 3: select a shape such as a rectangle and then click and drag to draw the shape in the desired place.After drawing a shape, you can add text, bullets and numbering to them. You can also change their fill, outline and other effects on the Format tab.
 6.4.8 A chartthis is a pictorial representation of numerical data. there many charts that can be created on a slide, but common charts frequently used are: column charts, line charts and pie charts. Using the knowledge from previous units of creating a chart, let’s add a column chart in nature-protect file.Using the data in the table we inserted on slide 8 of nature-protect presentation, let’s create a column chart.Step 1:Insert a new slide (title and content layout) as slide 11.Step 2:Click the Chart button in the content holder to generate a column chart. Alternatively use Insert tab and click Chart button in the Illustrations group.
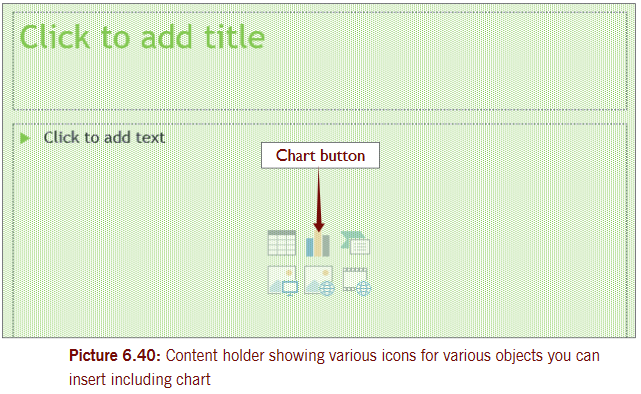 Step 3: the column chart appears together with a data sheet that you should edit to suit your chart.
 Step 4: edit data sheet by replacing default data with your data. the resulting chart is shown in picture below if table data on slide 8 is used for charting.
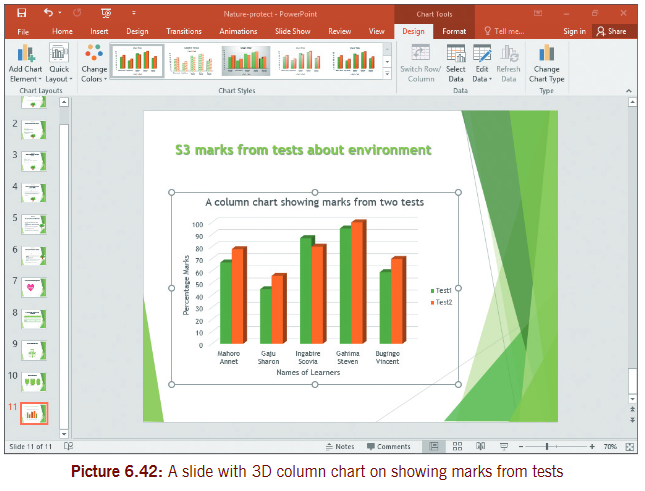 6.4.9 Media clipsMedia clip is a small segment of an electronic media either an audio clip or a video clip.6.4.9.1 Audio clip to insert audio clip, follow the steps given below.Step 1:In normal view, select the slide where you want to insert an audio clip.Step 2: on the Insert tab, in the Media group, click arrow under Audio, and then click Audio on My PC.
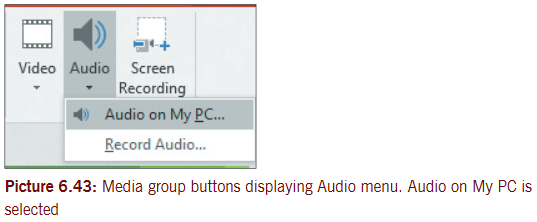 Step 3:In the Insert Audio dialog box, select a folder with the audio you want and then select the file.Step 4:Click on Insert button to insert the audio. (see picture 6.44).
 Step 5: the slide where audio has been inserted will have a graphic as shown in picture 6.45. Play using the media buttons displayed.
 6.4.9.2 Video clipthere are two ways to insert video i.e. by linking and by embedding a video directly from your PC into your presentation.
- Embedded videos are appropriate but tend to increase the size of your presentation.
- Linked videos keep your presentation smaller in size, because links can easily break, copy the video into the same folder as your presentation and create the link from there.
a) Embed a video clipto insert a Video clip by embedding it, follow the steps given below.Step 1:In normal view, select the slide where you want to insert video clip.Step 2: on the Insert tab, in the Media group, click arrow under Video, and then click Video on My PC. Step 3: In the Insert Video box, click the video that you want from a specific folder.Step 4:Click Insert.
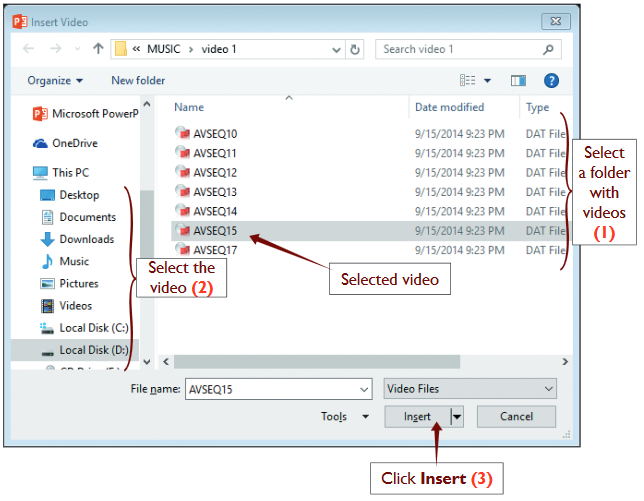 A slide with an embedded video will have the graphic as shown in picture 6.48.
 b) Link a videoto link to a video on your PC follow the steps given belowStep 1:Follow steps 1 to 2 above (for embedding video clip).Step 2:In the Insert Video dialog box, click the file that you want to link to.Step 3:Click the down arrow next to the Insert button, and then click Link to File.
 6.5 Formatting a slideto format a slide is to change the appearance of the slide and or its contents. to make these changes, open “nature-protect” file and use the following steps:Step 1: select text to apply a font. Font changes font size, color, style, shadow, etc.) from the Home tab. Apply bold, size 24, red, shadow on all slide titles and size 18 plus shadow to the other text.
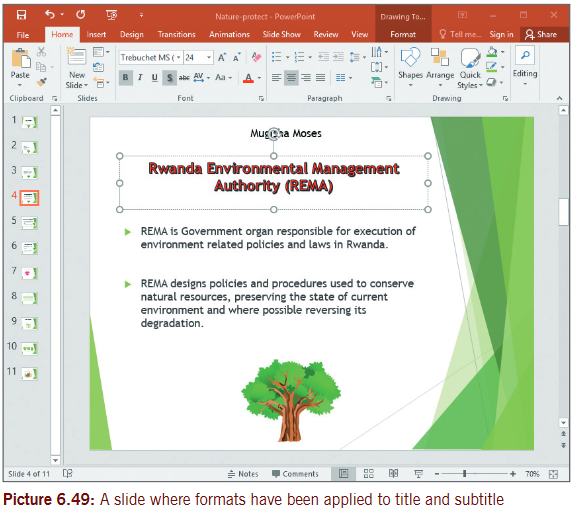 Step 2:Change backgroundto change slide background, click Format Background on the Design tab. Follow steps written on picture 6.50 and then save changes to your file.
 Step 3:Change slide layoutIn case you need to insert a special type of information on a slide, you need to change its layout. You do this by selecting a suitable layout from the list of layouts in the Slides group.In the Nature-protect file, insert a new slide after the last slide and then apply a 2-column slide layout. type in the names of 4 teachers on the left and suitable picture on the right; who are involved in environmental education at your school. the slide may appear as shown in picture 6.51.
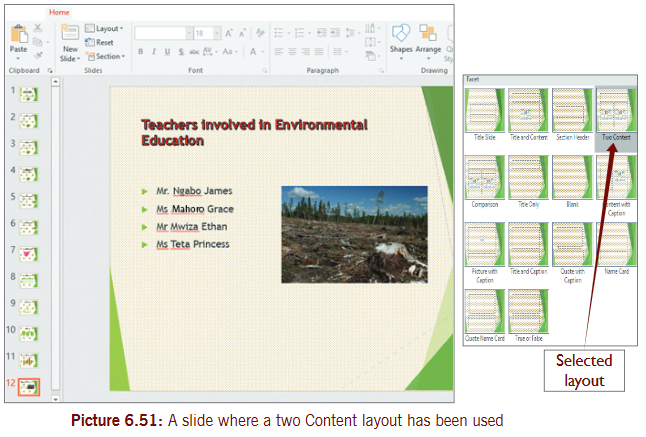 6.6 Animation of a presentationAnimations are presentation features that give motion or life to text or objects in the slide show. Animation effects can be added to text or graphic objects and if well applied, can bring excitement and increase the audience ability to understand your message. If they are not used well, can bring frustration and confuse the message you are communicating.6.6.1 Applying animations to text or objects in a presentationActivity 6.8open nature-protect presentation and apply animations to all text and pictures. Apply a suitable transition effect and run the slide show.Use the following steps to apply animations you want.Step 1: select text or object you want to animate.Step 2: on the Animations tab, in the Animations group, select one animation you wante.g. Fade, Fly, etc.Step 3:Apply Timing to animation, that is, in the Timing group, increase or reduce the duration or delay of the animation. see picture 6.52.Note: To apply Custom Animation, use the Advanced Animation group as shown in the picture below.
 6.6.2 Apply a slide transition effect in a presentationopen the file nature-protect. Use the following steps to apply a slide transition.Step 1:Click on the Transitions tab.Step 2: select a transition effect of your choice from the Transition to This slide group.
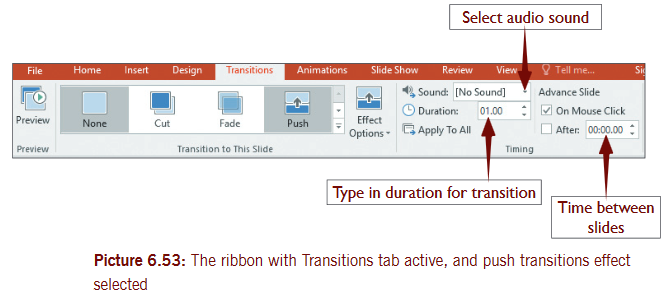 Step 3:Click Apply to All in the timing group so that the transition selected is used by all the slides. Doing this will save you time of selecting different transitions for each slide in the presentation.Step 4:Click Preview in preview group to see how the selected transition works.Step 5: save the changes to your file by pressing Ctrl + S on keyboard.6.7 Presentation views
 Steps to access all presentation views togetheron View tab in the Presentation Views group, click a presentation view e.g. Notes Page.see picture 6.55. You can also access the main presentation views by clicking on the respective buttons on the right of status bar (before zoom). the views used for creating and editing a presentation are:(i) Normal View: It is the main working window in the presentation. every slide is shown full size on the screen.
 (ii) Slide Sorter View: this is a window that displays miniature (small) versions of all your slides, arranged in horizontal rows. this view is very useful when you want to duplicate, delete, hide or reorder slides.
 (iii) Notes Page View: this is located under slide pane. It shows a smaller version of a slide with an area below for adding speaker’s notes. each slide is created on its own notes page. the speaker can print these pages out to use as a reference while making his/her presentation. the notes do not show on the screen during the presentation.
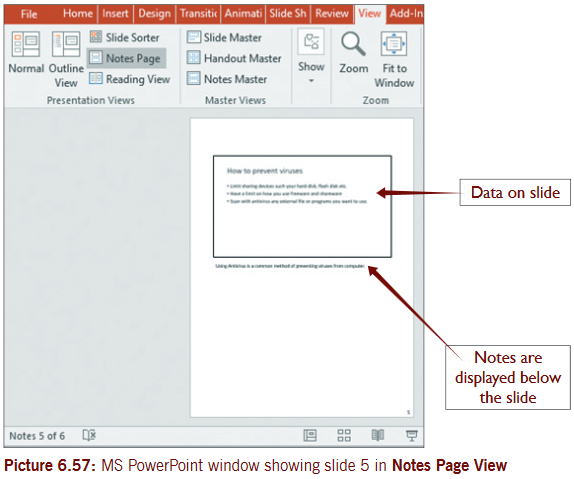 (iv) Reading View: In this view a slide is shown in full screen mode like it is to slide show view. this difference is that in Reading View you can still see the title bar and status bar at the top and at the bottom of the window respectively.
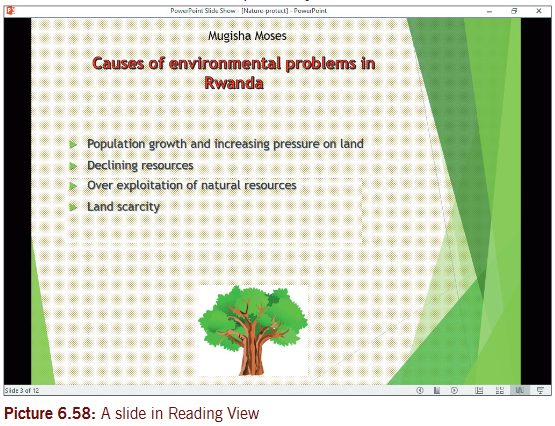 (v) Master Views: Master Views are the main slides that store information about the presentation including background, color, fonts, effects, placeholder sizes and positions.By using Master views, you can make universal slide changes to every slide, notes page or handout associated with your presentation. these views include:a) Slide Master: When you make a change on the slide master, it replicates on all the slide layouts and slides. the slide layouts can receive all the formatting, position and common elements from slide master but you can also edit individual slide layouts to differ from the master slide. Any change you make to a slide layout affects only the slides based on that particular layout.
 Note: It is important to make modifications to your slide master and slide layouts before adding slides to your presentations. This makes items on the slides to conform to slide master design.b) Handout Master: A handout is a document that you can print from within a PowerPoint presentation. You can have 1 up to 9 slides on a handout page. A handout is created to be printed out. the appearance of a printed handout is determined by the handout master.to access handout master, click View tab on the Ribbon and select Handout Master from Master Views group.
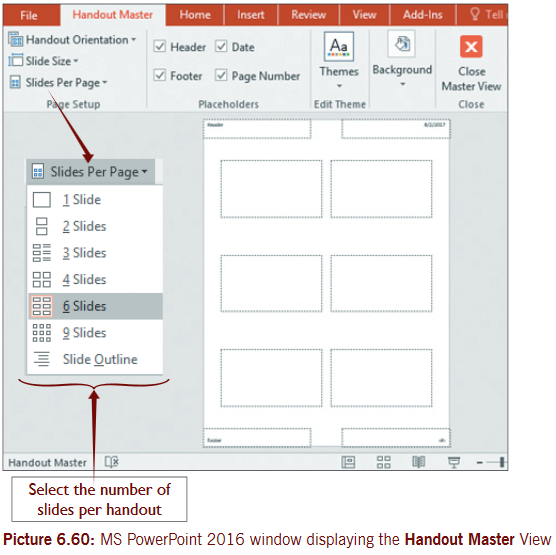 c) Notes Master: each slide in your presentation could have notes associated with it and these placed in the Notes Pane area. If you want to modify and print these notes, you make use of the Notes Master.to access notes Master: on the View tab, click Notes Master in the Master Views.
 Slide showthis is a window that fills the whole screen when it runs. It displays any animations or transitions added to the slide in the presentation. each page of a PowerPoint presentation is called a slide and the default orientation of the slide is in landscape layout.slide shows can contain eye-catching text, bulleted lists, charts, graphic objects or be completely covered by a single picture, as in a photo album.
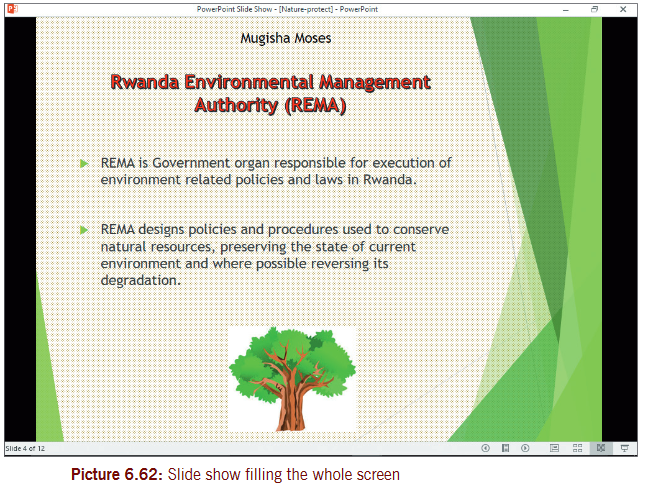 End of Unit 6 Assessment1. Computer viruses are some of the biggest limitations faced by computer users all over the world. As a computer learner, you have been tasked to educate computer users about this threat.Create 6 slides which you are going to use during the presentation to your audience following the guidelines below:Slide 1:should include the title and definition of Computer virus, your name as presenter and school.Slide 2:should include symptoms of viruses on a computer system. Add an audio clip on this slide.Slide 3: should include the damage made by viruses in a computer and its accessories.Slide 4:should include ways through which viruses spread to computers.Slide 5:should include the precautions of preventing viruses from entering the computer.Slide 6:should include ways to treatment of computer viruses.each slide should have the following additional information:a) Relevant message needed to convey the required information.b) Apply bold and shadow effects to all slide titles.c) Your name, class and slide number as Footer of each slide and on the Handouts.d) Use minimal but relevant effects (animation and transition) to make the presentation entertaining.e) search for a suitable online picture about computer viruses and insert it at the top right hand side of each slide using the Slide Master. save presentation as Virus.2. Create a presentation of six slides on the topic of Impact of computers to Rwandans which will be used to conduct ICT lesson in S3 class.a) (i) Slide 1 should have the title of the topic, definition of term computer and Name of presenter (as Word art).(ii) Slide 2 should have the advantages of computers to Rwanda people. Link a suitable video clip on this slide.(iii) Slide 3 should have the disadvantages of computers to Rwanda people.(iv) Slide 4 should have uses of computers in Rwanda.(v) Slide 5 should have list of hardware and software or programs used in your school in form of a 2-column table.(vi) Slide 6 should have a column chart about number of computers used by different classes in your school. Use the data in the table below to create a 3D column chart.
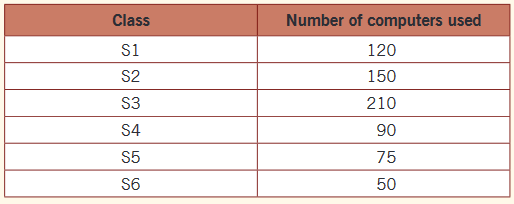 Note: Provide a suitable chart title, axis titles and slide title.b) Apply minimum animations in your presentation.c) Insert relevant picture on the master slide in the lower left of each slide. (Use view tab, then slide master, click the first slide in the list, insert clip in correct place and close the master view).d) Insert your name and class as footer on both the slides and notes and Handouts page.e) Use a suitable background design of your choice.f) Insert slide number on all slides.g) Make your slide to run automatically after 3 seconds.h) save your work as Today’s Computer.3. a) Create a presentation about Deforestation in Rwanda following the procedure below:• on the first slide: topic and definition• on the second slide: Importance of Deforestation• on the third slide: Disadvantages of Deforestation• on the fourth slide: Areas most affected by Deforestation in Rwanda• on the fifth slide: Methods used to reduce Deforestation.b) save the presentation as Deforestation.c) Insert a header as ‘your name and class on the Handout.d) Change the background of all the slides to an appropriate format of your choice.e) set a slide transition of your choice, with transition time of 6 seconds. Apply an audio sound from your PC on a slide of your choice.f) set animation of your choice for all slide titles and other parts of the slides.g) Make use of relevant graphics or pictures, from your PC or Internet.h) Insert a summary table slide between the last slide and second last slide with the following data.Level of Deforestation
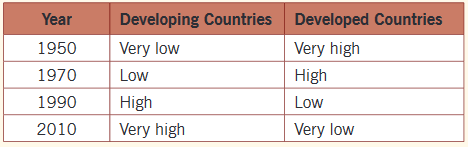 Make use of the notes pane to add speakers notes.i) save and print your work as a handout.
Unit 7: Introduction to Computer graphics
Key unit competence
Create graphics using basic graphic elements and edit predefined graphics.7.1 Introductionsketch something on paper (a man or a house) and what you have is a piece of analog information. Changing what you draw can be easy or hard: you can erase pencil or charcoal marks easily enough, and you can scrape off oil paints and redo them with no trouble; but altering water colors or permanent markers, swapping colors or resizing your picture is more complicated.that’s why it is more efficient to draw a picture on a computer screen and what you have is a piece of digital information (your picture is stored as a series of numbers). Change the numbers and you can change the picture, in the blink of an eye or even quicker. It’s easy to shift your picture around the screen, scale it up or down, rotate it, swap the colors, and transform it in all kinds of other ways. once it’s finished, you can save it, incorporate it into a text document, print it out, upload it to a web page, or email it to a client or work colleague, all because it’s digital information.7.2 Definition7.2.1 Computer graphicsthis is the use of a computer and specialized programs to produce and manipulate pictorial images.the purpose of creating computer graphics is mainly for: Animation, business presentation and scientific research.there are two very different ways of drawing digital images on a computer screen, known as raster and vector graphics.7.2.2 Bitmap/ Raster graphicsA bitmap (or raster graphic) is a digital image composed of a matrix of dots. A bitmap graphic is composed of many tiny parts, called pixels, which are often many different colors. It is possible to edit each individual pixel.When you take a photograph using a digital camera or scan an image from a magazine, you are creating a bitmap graphic.since the computer has to store information about every single pixel in the image, the file size of a bitmap graphic is often quite large. When you resize a bitmap graphic, it tends to lose quality.7.2.3 Vector graphicsVector graphics are graphics stored and drawn with instructions rather than grids of pixels. Vector images are mathematical calculations from one point to another that form lines and shapes. If you zoom into a vector graphic it will always look the same.7.2.4 Comparing Raster graphics and Vector graphics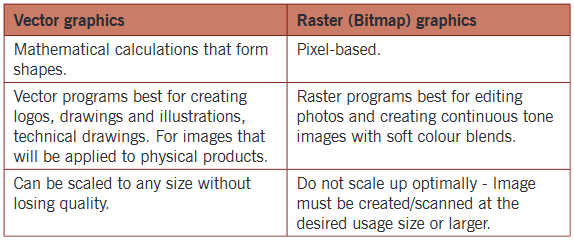
 7.2.5 ResolutionResolution is the total number of pixels that make an image. In general, the more pixels used when capturing an image, the sharper the stored image is. this is called resolution, it is measured in dots per inch (dpi).7.2.6 2-Dimensional computer graphics2-Dimensional computer graphics are mainly used in applications that were originally developed upon traditional printing and drawing technologies. In those applications, the two-dimensional image is not just a representation of a real-world object, but an independent artifact with added semantic value. two-dimensional (2D) models are therefore preferred because they give more direct control of the image than 3D computer graphics, whose approach is more akin (similar) to photography than to typography.7.2.7 3-Dimensional computer graphics3D graphics, compared to 2D graphics, are graphics that use a three-dimensional representation of geometric data. For the purpose of performance, this is stored in the computer. this includes images that may be for later display or for real-time viewing.7.2.8 Core elements of computer graphics·Modelling is the process of developing a mathematical representation of any three-dimensional surface (3D) of an object (either living or non-living) via specialized software. the product is called a 3D model.·Rendering is the process of converting automatically 3Dwire frame models into 2D images with 3D photo realistic effects or non-photo realistic rendering on a computer.·Animation is a process that uses computer generated images to create animated scenes. An animated scene starts with one picture, which is referred to a frame.·Interaction is a technique of using a physical input/output device to perform a broad task in a human-computer dialogue.7.3 Graphic file format7.3.1 DefinitionGraphic images are stored digitally using a small number of standardized graphic file formats such as:
- BMP : Limited file format that is not suitable for use in pre press. It is a file extension for Bitmap file.
- GIF: Graphic Interchange Format mainly used for internet graphics.
- JPEG: Joint Photographic experts Group which is used for internet graphics, photos, etc.
- TIFF:tag Image File Format a popular and versatile bitmap file format.
- PNG: Portable network Graphics.
7.4 Areas of graphics useGraphics are visual elements often used to point readers and viewers to particular information. they are also used to supplement text in an effort to aid readers in their understanding of a particular concept or make the concept more clear or interesting.- Entertainment: Animated pictures, audio – videos, and TV shows, Computer games.
- Advertisement: Graphics are among the primary ways of advertising the sale of goods or service e.g. creating logos.
- Book illustrations:to produce illustrations which summarize various kinds of data. e.g. it is used to illustrate themes and concepts such as human anatomy in Biology and diagrams in mathematics.
- Magazines: Magazines contain graphic materials in abundance to attract readers.
- Education: As learning and teaching aid.
- Computing designing computer games, web sites.
7.5 Graphics softwareGraphics software are better at creating and manipulating bitmaps or vector graphics.7.5.1 Bitmap/Raster graphics softwarethis software includes Microsoft Paint and Adobe Photoshop.Microsoft PaintA paint program is a software graphics program that allows the user to draw or paint bit mapped images on a computer.Adobe Photoshopthis is a professional software used in photography, design and video editing. It is a program that can edit images of any type. It was developed by Adobe systems. Photoshop is mainly a raster graphics editor. Photoshop is used in a similar way as Paint but in a more professional style. More information about Adobe is provided at the end of the unit.Vector graphics softwareVector graphics softwarecommonly used include: Adobe Illustrator, Adobe Free Hand, Corel Draw, Paint shop Pro.7.5.2 Microsoft PaintWindows operating system comes with a basic, easy-to-use image creation program called Microsoft Paint which is a basic raster graphics program capable of creating, opening, and basic editing of image files, including BMP, JPG, GIF, and PNG. the default bitmap file type for Paint is BMP.Activity 7.1Launch MS Paint program on your computerFollow these steps to open Ms Paint:·Click the start button, all programs.·From windows accessories, choose Paint.the following window appears.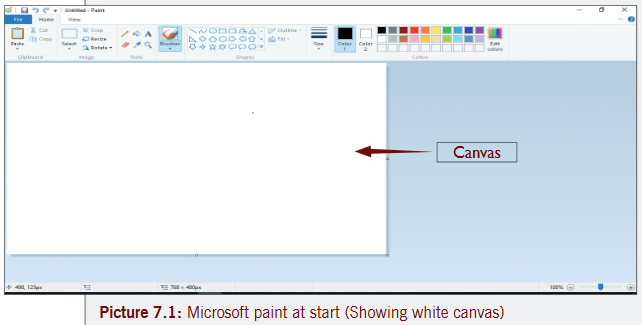 Understand the canvasWhen Paint launches, you’ll see a white “canvas” appear on the screen. Imagine this canvas as a piece of paper for you to draw or write on. You can adjust the size of the canvas before you start creating your masterpiece.7.6 Basic graphic elements (with MS Paint)
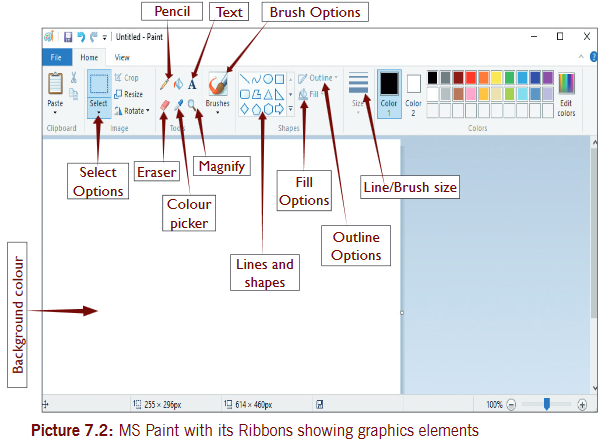 7.6.1 Line and curve toolsUsing the already open paint program, you are going to locate and use the following tools;
 7.6.2 Paintbrush too
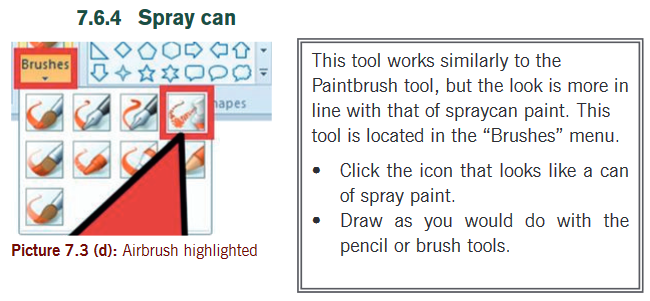
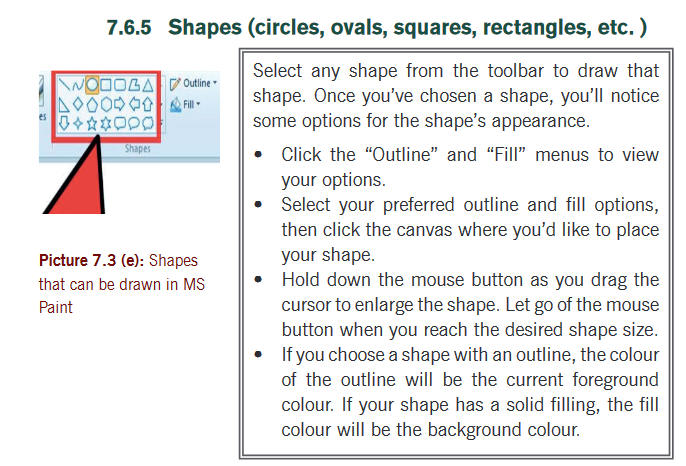
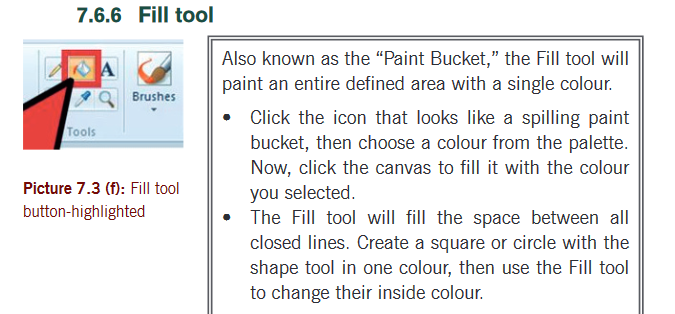 Activity 7.2Use an ellipse tool to create a basketball with a suitable background.7.6.7 Ellipse toolto get a round shape that has a black outline and an orange interior, use the following steps:Step 1:Choose the ellipse tool.Step 2:In the Fill options area, choose ▼ then select solid color. this will set foreground color for the outside, and set background color for the inside.Step 3:Click the foreground Color box, and then click black to set the foreground color.Step 4:Click the background Color box, and then click orange to set the background color.Step 5:Click and hold the left mouse button and drag the mouse to form the oval.
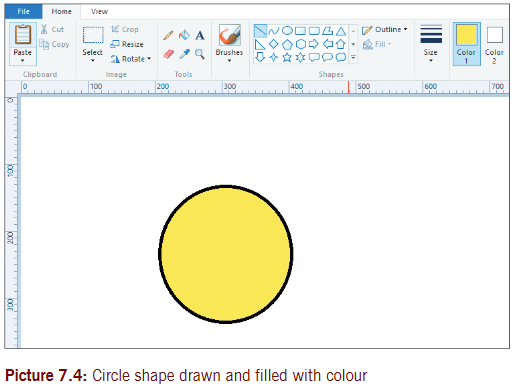 Tip:to make it perfectly round, hold down the shift key as you drag the mouse.Step 6:Use line tool.·now choose the Line tool,·then set size, and draw the vertical /horizontal lines, by dragging the mouse.
 Tip:to make the lines perfectly straight, hold down the shift key as you drag.Step 7:Curve tool.·now, choose the Curve tool.·Draw a straight line to the left of your vertical line.·Click in the middle of the new line and drag it toward the vertical line to curve it.IMPORTANT:to lock in the new shape, click on some other tool, like the selection tool.·now, choose the Curve tool again.·Draw a straight line to the right of your vertical line.
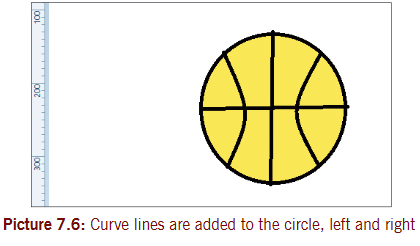 Step 8:Fill tool.·now, go ahead and fill the white canvas with a different color.·the Fill with color tool will flood a connected area with the color you choose.·the final product should look something like this:
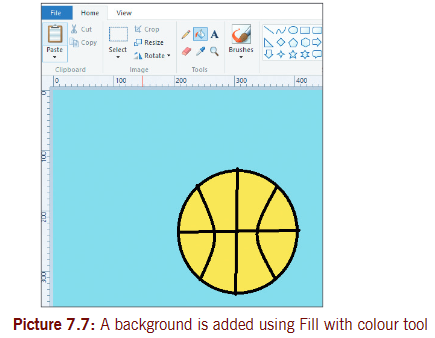 Step 9: save your work.·From File menu, choose save as.·From a dialog box, choose BMP picture.
 ·Choose the location where you want to save.·type the name you wish to use (ball) make sure it will be saved as a 24 bit Bitmap – this will add .bmp to the filename for example: ball.bmp. We shall use this file later on7.7 Graphic featuresIn order to use graphics features well, you should learn to select images or parts of the image to be affected/changed by the graphic feature. to select is to choose an option from two or more available options. Practice selecting image parts you may need to cut, copy or fill with color.7.7.1 Selection toolsthere are two different tools you can use to select parts of your image:
- Rectangular selection (a dotted outline of a rectangle).
- Free form selection (a dotted outline of oval shape).
Free-form selection allows you to draw your own freehand selection line around an image, while the rectangular selection tool lets you draw a rectangle around an image.Steps to select an imageStep 1:Click the arrow beneath the “Select” button.Step 2:Choose “Rectangular” or “Free form.” see picture 7.9(a).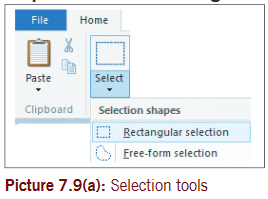 Step 3: to use either tool selected, start by clicking at the top left corner of your image, then hold down the mouse button as you trace your way around the image. then release the mouse.7.7.2 Copy and paste (a selected image)Follow the steps given below to copy your image:Step 1: select Image and make sure the image is highlighted with dotted rectangle.Step 2:Copy the selected area by pressing Ctrl+C or click Copy command from the Home tab.Step 3:Paste the image using Ctrl+V or Paste command on the Home tab.Note: You can paste the copied selection in the same file in Paint or in other compatible programs, like Microsoft Word or Microsoft PowerPoint.If the image you want to copy has a background color that you don’t want to be a part of your selection, then:
- Check “Transparent Selection” in the select menu.
- And to disable this later, click back to the top selection icon.
Let us draw an image of a basketball net as shown below. By so doing we are to learn the following tools; copy and paste, move, resize, flip, skew, rotate, cutout, trim. these actions are repeated in this unit for purposes of learning more about paint in respective sections. Copy and pasteFollow steps 1 to 3 in section 7.7.2 to copy and paste the image. the results may appear as shown in picture 7.9(c).
 7.7.3 To move an imageStep 1: select the image to be moved.Step 2:Click on the selection and drag to a new position. see picture 7.9(d), the pasted copy has been moved to lower left corner.
 7.7.4 To resize an imageWe are going to use original image and we resize it manually.Use the following steps to resize an image:Step 1: select the imageStep 2:Click in any of the selection boxes and drag inwards (to reduce size) or drag outwards (to enlarge its size). see picture 7.9(e).
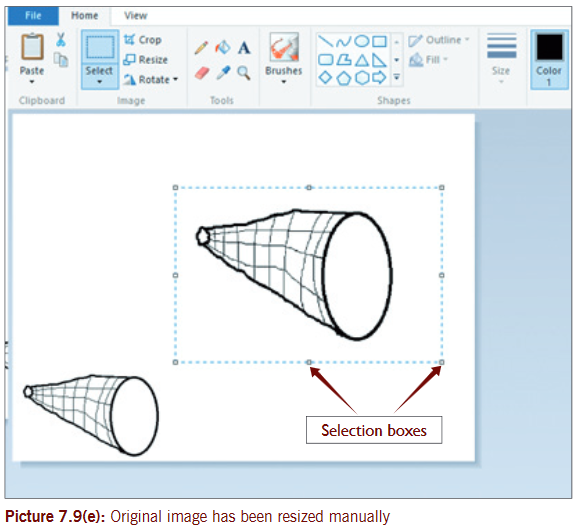 Note: You can also resize the image using the resize tool in the image group. This is covered later on in this unit.7.7.5 To flip an imageUse the following steps to flip an image:Step 1: select the image to be flipped.Step 2:In the Image group click Rotate tool and then select Flip vertical or Flip horizontal. see picture 7.9(f), how the resized image is flipped horizontally.
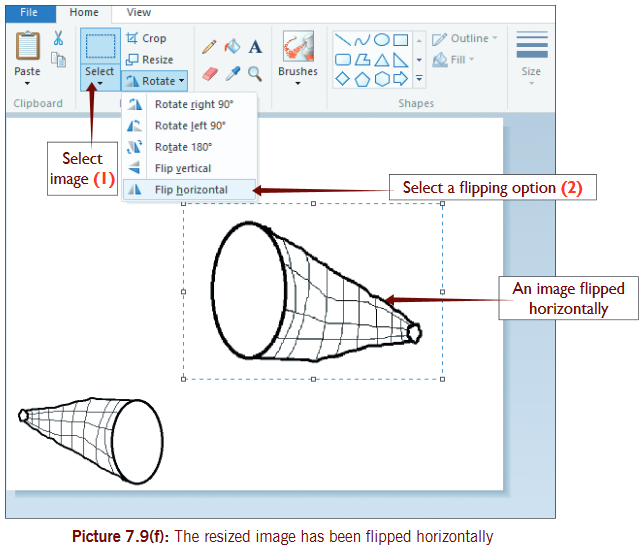 7.7.6 To rotate the imageSteps:Repeat steps 1 and 2 of part (d) above but instead of selecting a flipping option, select a rotate option e.g. Rotate right 900. this task is repeated in other activities later in this book.
 7.7.7 To skew an imageStep 1: select an image.Step 2:Click Resize tool in the Image group.Step 3:In the Resize and Skew dialog box, use section down for skew and type in Degrees for skewing the image.7.7.8 Cut-out or trim an imageStep 1: select a part of the image you want to cut-out or trim.Step 2:Press delete key on keyboard.Activity 7.3(a)a) Draw the shape of a heart and fill it with red color.b) Move the shape to the left side on the page.c) Copy and paste any half of the shape and move the pasted copy on the right side of the page.d) type a Green bold text of font size 26 in the pasted copy as “Divided heart” and “one Heart” text in the original image.e) erase a small part of the original shape that you want.f) Apply a suitable background to the shapes and save your file as ‘our Hearts’.Follow the steps given below to perform this activity
- open Ms Paint.
- Pick the Heart shape and draw it in an appropriate size. Use rectangular selection and move the shape towards the left margin.
- select Red color from the Colors group – Home group or color palette.
- select Fill with color button from Tools group – Home tab.
- Use Rectangular selection option on select menu and draw a rectangle covering half of the heart.
- on the Home tab, click Copy.
- Click Paste button.
- Click the pasted copy and drag to a new position you want towards the right margin.
- Click on the text button and draw a textbox over the pasted copy and type your text. Repeat the same action and type text in the original image as required.
- Pick Eraser tool and remove any small part of the original heart.
- Pick green color and select Fill with color button. then click any part outside the shapes.
- save your file with a name. (see results of this activity in picture 7.12).
7.7.9 Add textto add text, follow the steps given below:- select the text tool, which is signified by the letter “A,” then,
- Double-click somewhere on the canvas to start typing.
- Make sure the text in the textbox is exactly the way you want it before switching to another tool (you will be unable to edit text after closing the textbox).
- to increase the textbox size (which will give you more room to type). Hold the mouse over one of the square corners until the cursor turns to an arrow, then drag the box to a larger size.
- Choose a font face and size from the top of the screen and begin typing.
- to change the color, size or face of the text after you type, highlight the text, then choose the new color, size, etc. When you are typing, click somewhere outside of the textbox to leave the tool.
 7.7.10 To erase something you have drawn with Eraser toolFollow the steps given below;
- Click the Eraser icon (see picture 7.12(a))
- Drag over the area you would like to disappear several times until it disappears.
Note: Like other tools, you can adjust the width of the eraser with the Size menu.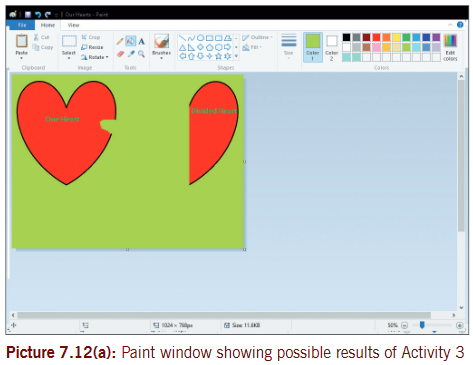 7.7.11 Vector Graphicsto create and edit or reshape vector graphics suitably requires you to use a vector graphics software such as Adobe Illustrator, Adobe Freehand or Corel Draw. You can also introduce a Raster graphic into a vector graphics software and edit by converting it to vector graphic. For our case we use Adobe Illustrator. With Adobe Illustrator, you can design logos, t-shirt design, posters and flyers as vector graphics.Activity 7.3(b)a) Using Adobe Illustrator, create the following vector graphics or shapes as they appear and save the project as Better shapes.
 b) Reshape or edit the graphics drawn in (a) above to appear as shown below
 Follow the steps given below to perform this activity.Step 1: open Adobe Illustrator, a vector graphics software. the window for Adobe Illustrator appears below.
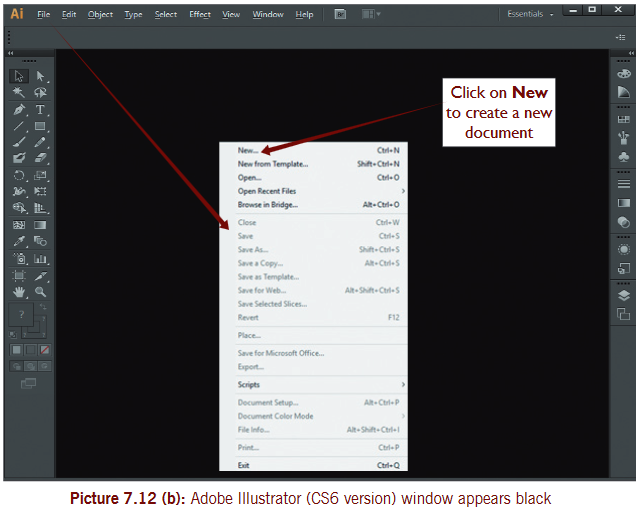 Step 2:Click on File menu and select ‘New’ button to get a new document dialog box (shown below). name your file as My Shapes.
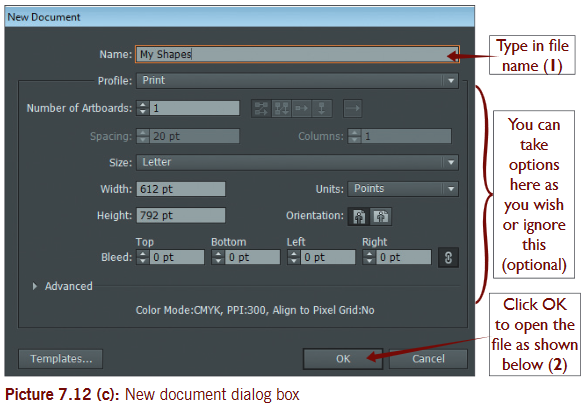
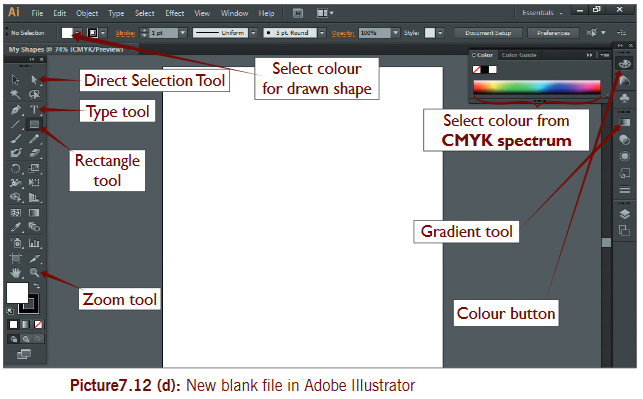 Step 3: start creating the shapes using various toolsto create the square:click the Rectangle Tool on the toolbox and then drag in the white background to draw the square.to draw other shapes, click on white graphic near the rectangle tool to display other shape tools. then click on the ellipse tool to draw the circle/oval shape and afterwards click on the rounded rectangle tool to draw the rounded rectangle.
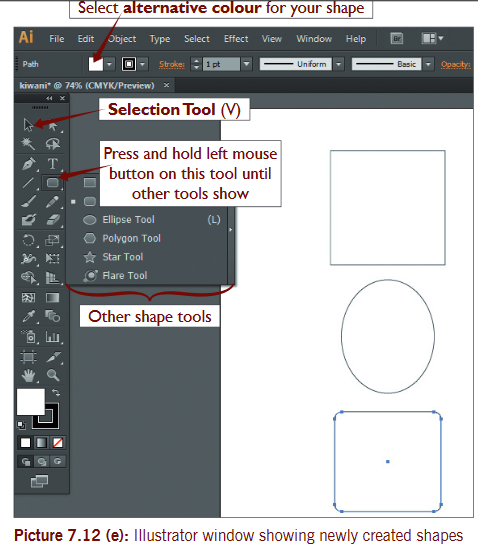 Step 4:Fill the square with green; the circle with gradient fill and rounded rectangle with brown color and increase on its shape outline.to fill green color in the square, select the square using the selection tool, click where there is green color on the CMYK spectrum on the right of the window (or from alternative color button on toolbar).to fill gradient in the circle/oval, select the circle and then click on the gradient button.to fill the rounded rectangle with brown color, select it first, then click on the alternative color button on the toolbar.Increase the outline of the rectangle by increasing points in the shape outline size.
 b) To reshape or edit the graphicsStep 1: To reshape or edit the square: select the square, click on Effect menu and on the menu click Distort & Transform and then select the zigzag... effect. In the Zigzag dialog box, adjust the size to be 12 pts and ridges to be 5. then click OK.
 To insert text in the square; select Type Tool on the toolbox and draw a box in shape where you can type text. type in the text in the shape. Change font size to 24pt, Book Antiqua; using the Character button on the upper toolbar. see picture 7.12(i).
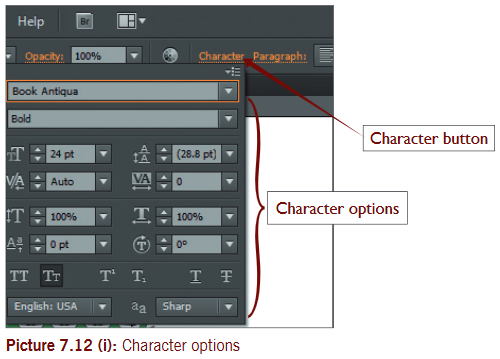 To change text color, select typed text and click on red color from the CMYK spectrum colors on the right of the window or using alternative option on the upper toolbar. Lastly click the center button on the upper toolbar.
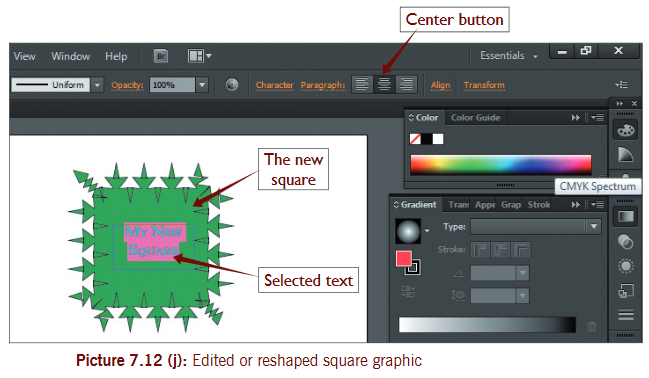 Step 2: To edit circle oval; select it and on the effect menu click Texture and then Traquelure. see picture 7.12 (k). In the Traquelure dialog box that displays, (you can adjust the crack spacing depth and brightness as you like), click OK. select radial gradient on the right.
 the traquelure dialog is shown below
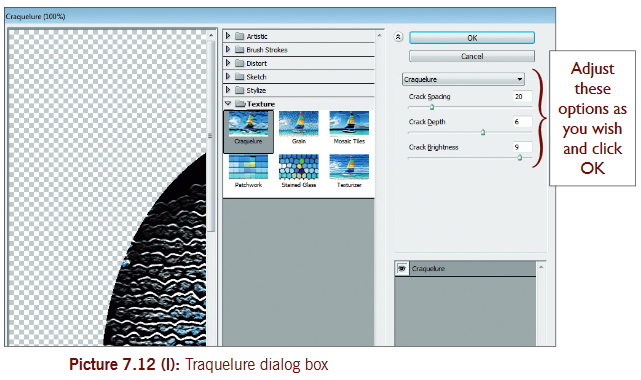 Step 3: to reshape the rounded rectangle, select it and click Effects menu. on the menu, click Warp and select Shell lower in the sub menu.
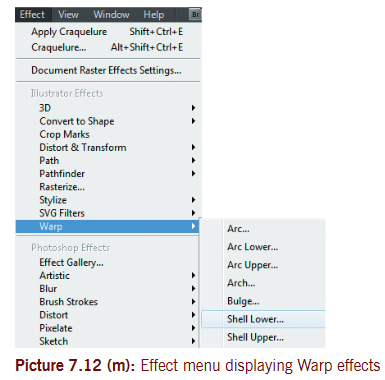 to add special fill effects, click Pixelate on the effects menu and then select Mezzotint.
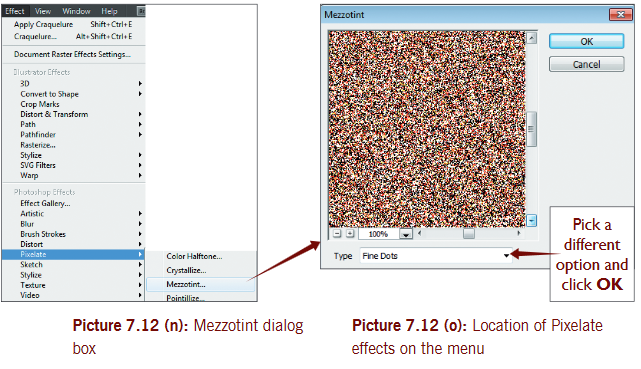 to add text to the rounded rectangle, repeat as done in step 1 above.the suggested answers for the activity are shown in picture below.
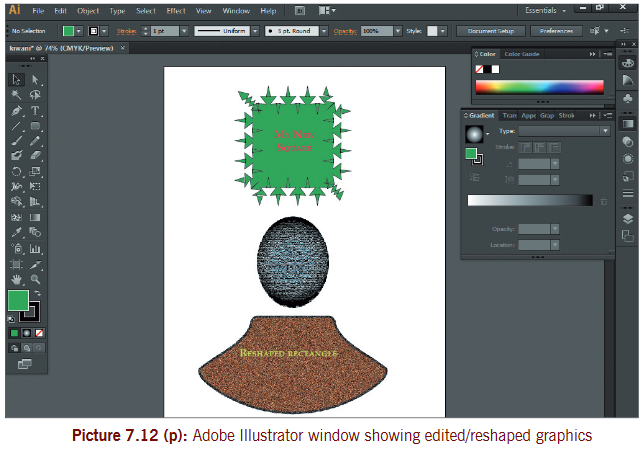 Saving a projectClick on File menu and select Save As.the Illustrator options dialog box displays as shown below. Click OK. the save dialog box displays. type in the file name and click on ‘Save’ button.
 7.7.12 Manipulate nodes and control pointsthese are the selection boxes and circles that appear when you select an image for reshaping. Point on one of the node or point until the pointer changes shape of double pointed arrow. then click and drag inwards or outwards to reduce size or enlarge its size respectively.
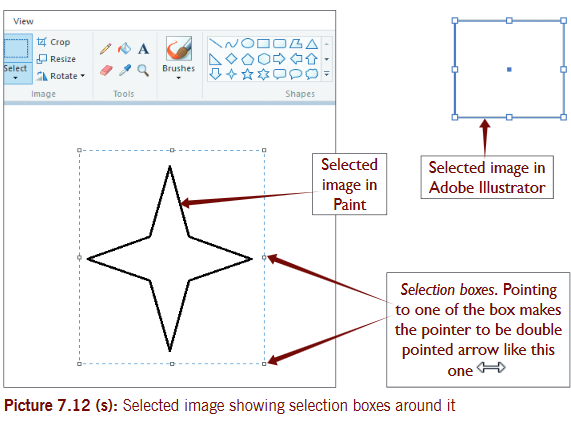 7.8 Graphics formattingActivity 7.4a) Create a new Paint file and draw a star object (another object of your choice).b) Fill the object outline to color red and fill color to green (or light green).c) Insert text as “star” in the star shape. Adjust the font size to a suitable size.d) save the file as ‘Green star’.Follow the guidelines given below7.8.1 Colors for the outlines and fill of objects
- select a pencil or a shape to use.
- Click the outline button from shapes, select the option you want eg. (no fill, marker, crayon,..).
- click the desired color.
- Drag the mouse to draw the object, then resize the object.
 7.8.2 Create shading and fill objects with patterns and textures
- Click on Fill With color tool, then choose the desired color.
- Click inside the object.
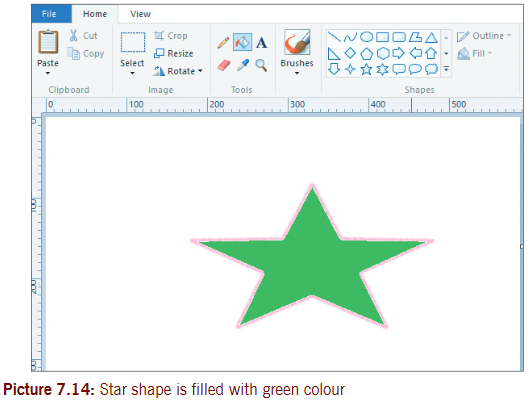
- Fonts as part of the graphic design.
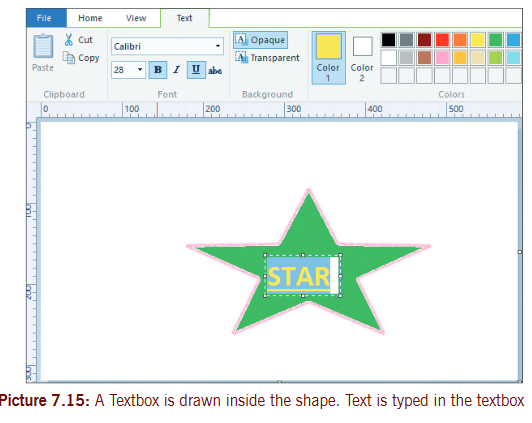 7.9 Edit imageto edit image means to make changes that make an object more meaningful. You can edit a newly created image or an existing image.
- Opening an image file
Paint can open up many different image types, including *.bmp, .gif, .jpg/.jpeg, .tif/.tiff, and .png. to open a file in Paint,- Click “File,” then “Open.”
- navigate to the folder where your image file is stored and click “open.”
a) open Microsoft Paint and add an image of a bird from your computer or from Internet (you may also opt to use any other image you already have).b) Crop part of the image and save it as ‘cropped’.c) Resize the image by 150% horizontally and vertically.d) Rotate the original image by ‘Flip Horizontally’.e) Using rotated image, zoom into the eye of the bird. Afterwards you can zoom out.7.9.1 Crop an imageWith an image open in Paint,·Click the “Select” tool at the top of the screen.·Highlight the area you want to crop by clicking and dragging with the cursor. everything inside the dotted lines is your new image, that you can save or transfer to another location in the document ·Click “Crop”.
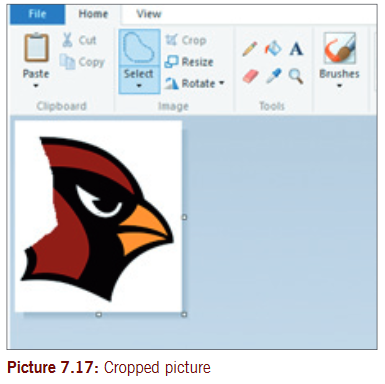 ·You will remain only with the selected part.7.9.2 Resize an image·Click “Image,” then select “Resize”.·type a new size (in pixels, or by percent, as you did when creating the canvas) to increase or decrease the image size.
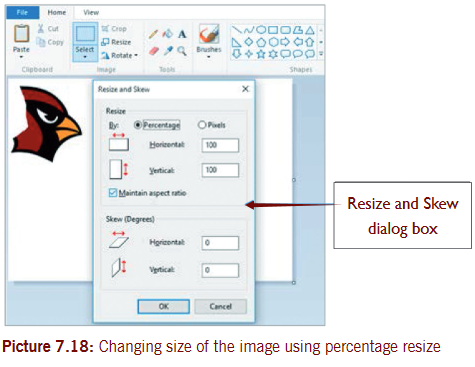 7.9.3 Rotate an imageto flip an image upside down (or some other direction), use the Flip and Rotate tools.·on the toolbar, click “Rotate” and choose a direction in the menu.
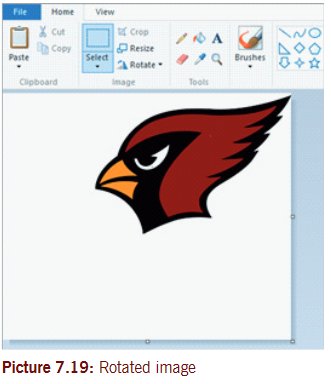 7.9.4 Magnify an area of a picture/Zoom·Click the magnifying glass icon to enable the Zoom tool. ·to zoom in, click anywhere on your image with the left mouse button. ·to zoom out, click with the right mouse button. Alternatively, ·Use the keyboard shortcuts Ctrl+ Pg Up to zoom in and Ctrl+ Pg Dn to zoom out.7.9.5 Stretch or skew an imageYou can distort an image with the “skew” feature.·Click “Image,” then select “Resize/Skew”.·to stretch/distort the image by degree, type a number (in degrees) in the boxes marked “horizontal” and “vertical”, in the Resize and Skew dialog box.·Given that you earlier used a different image like this in 7.20 (a) below, you would skew it by 20degrees and it changes as shown in 7.20(b).
 7.9.6 Changing pixelsIf you want to resize the image, and you don’t care if it gets a bit stretched, then:·select Pixels.·Uncheck the Maintain aspect ratio checkbox.·enter a width (Horizontal) and a height (Vertical) in Pixels.·Click OK.
 7.9.7 The Color Pickerthe small eyedropper icon represents the Color Picker tool.·Click this tool, then·Click somewhere in your drawing. the area you click will now become the foreground color for your next tool of choice.
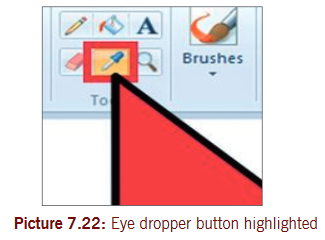 7.9.8 Change colorYou can edit any of the colors by adjusting their hue, brightness and other options in the Paint color mixer.·Click “edit colors” or “Define Custom Colors” to enter the color mixer.·After you have decided on a color you like, click “Add to Custom Colors.”
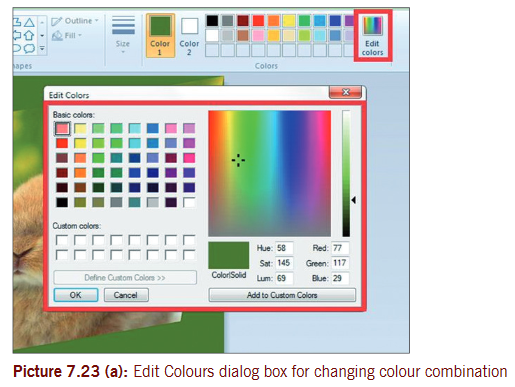 7.9.9 Brushing ToolsMs Paint has several brushing tools you can use to make your image artistic in appearance. Below is an image showing collection of all the brushes in paint.
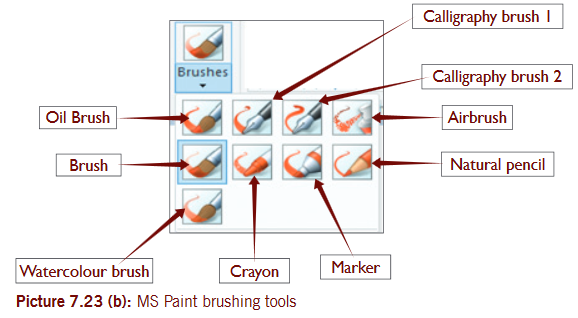 Here below is a table showing the effect of each of the brushes.
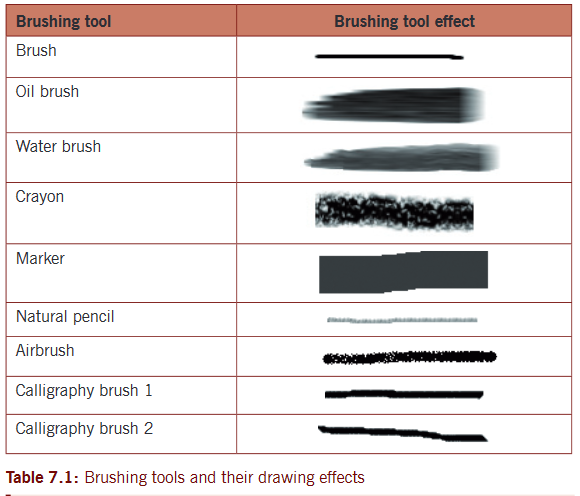 Note: apply these brush effects on your pictures the way you like.Activity 7.6Editing image
- open ball.bmp file that you created earlier when saving files.
- Crop the upper part of the ball and paste it at the right of the entire ball.
- Use eraser and fill with color tools to come up to the following result.
 Activity 7.7Drawing a flower1. Open up Microsoft Paint from the Accessories folder in your start Menu.2. Drawing the stem using the wavy line tool, draw a curved and dark green line of medium-thick thickness in a position like in the picture. In order to curve the line, draw a straight line and then click and drag where you want to curve it. You can curve each line twice.
- Click Fill with color tool, choose yellow from colors group.
 3. Choose the circle tool with a light yellow outline and a light yellow fill to draw a petal.·Choose circle, then from outline choose mark then you click light yellow.·Make an appropriately sized oval in the top left corner.·then fill the circle.
 4. select the petal, copy it and then paste in another petal.
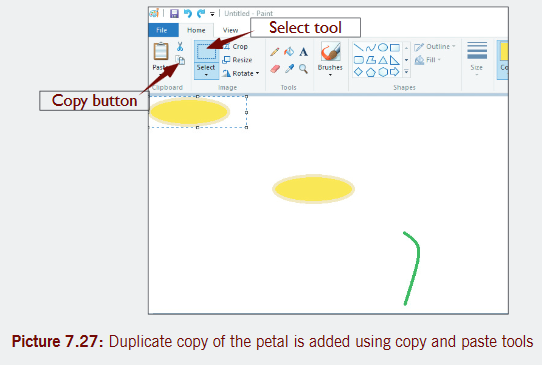 5. Drag the petal down to the end of the stem.
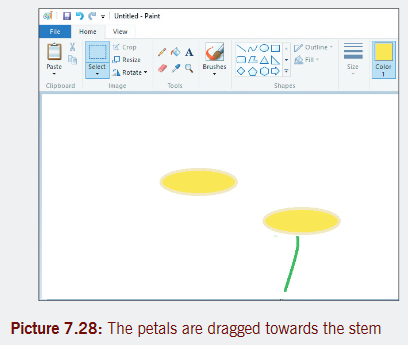 6. Re-select the other petal using the box tool and then drag the petal down to the left side of the stem. Make sure that the second option is selected on the sidebar under the main tools as it will make sure not to overlap any of your previous work.
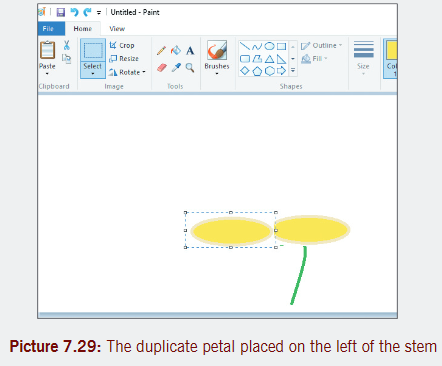 7. Hit Ctrl -V to create another petal
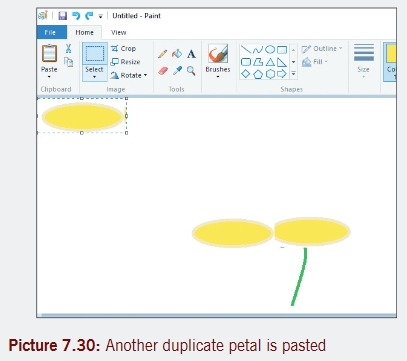 8. Click Rotate, then choose Rotate right 90º.
 9. Move the petal down onto the flower.
 10. Copy and paste the vertical petal, then drag it and draw a circle and fill light yellow as shown in picture 7.33.
 11. Use curve line to add small petals and fill with yellow.
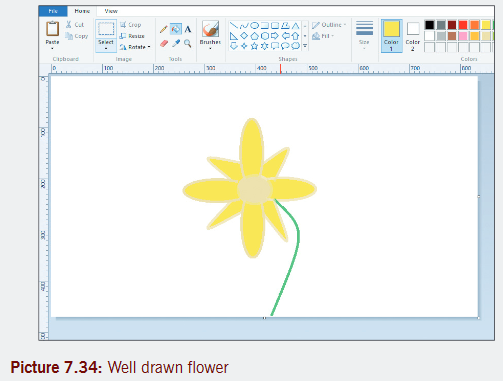 12. starting at the base of the stem, draw the leaves on both sides.·Use a pencil to draw leaves and fill them with green color.
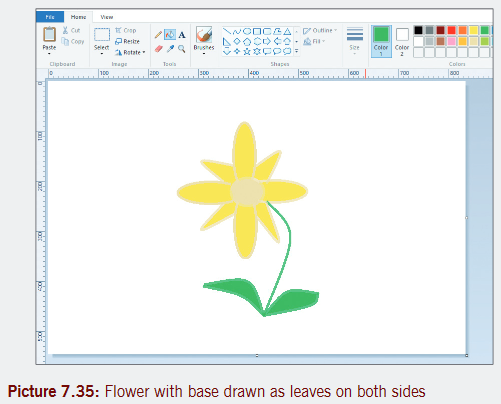 13. Use Pencil tool to add in some veins and make the leaves look more realistic
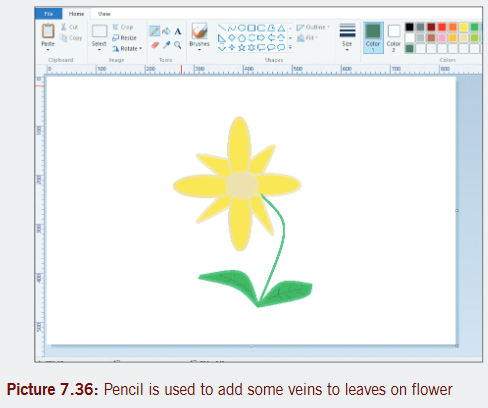 7.9.10 Working with layers in MS PaintSteps for working with layers in PaintStep 1:Draw an image (initial sketch) you want using a color you do not want to be its final. In our case we are going to draw a book. Let us use Indigo color pencil.Note: Make sure the color you make your sketch is not the same color you want your final drawing to be.
 Step 2: select your final line-art color you want and put it in the Color 1 slot, leaving Color 2 slot with white color. In our case let us use red color. trace over your sketch using color 1 slot. save your file as book. the sketch may appear as shown in picture 7.38.
 Step 3:Put your initial sketch colour(Indigo) in Color 1 slot, leaving color 2 slot white. Click on the eraser button and then RIGHt-CLICK while erasing your drawing. this action will remove the original color.
 Step 4:Repeat step 2 and step 3 to get many different versions of the book. save each different version you create and compare later. You can also fill in colors.7.9.11 Microsoft Paint 3DMicrosoft Paint 3D is a new application (app) in Windows 10 Creators Update, designed for working with 3D graphics. It replaces the old Microsoft Paint program that allows users to sketch objects in 2D. It is a new version of Ms Paint. Ms Paint 3D comes with newer versions Windows 10 and it is meant to make 3D scenes, cartoons 3D objects much of fun.You still have the opportunity to use both Paint and Paint 3D on your computer. You can use Paint 3D to turn photos into 3D models, add colors and textures to models you make from 3D.Starting Paint 3DClick start and type paint in the search box. Paint 3D is one of the items listed, click on it to open. see picture 7.10. eventually paint 3D opens with a welcome screen.

 Paint 3D interface has the canvas, a flat, 2D digital backdrop for your scene. the canvass is an empty white background and appears behind your 3D image. see picture 7.40.Activity 7.8(a)Using Ms Paint 3D, create the dog as shown below. then apply changes that will make dog A appear as shown by dog B. Use orange, green and dark grey color plus a polished metal brush. Apply a spearmint effect, type the text “My dog is nice” on your model and save it as my dog.
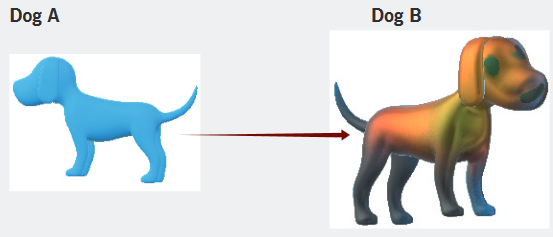 Use the following steps to perform activity 7.8 (a).Step 1: Click on 3D objects on toolbar. on the Tools pane, select dog button and drag in the canvas to draw the dog. see picture 7.41 (c).
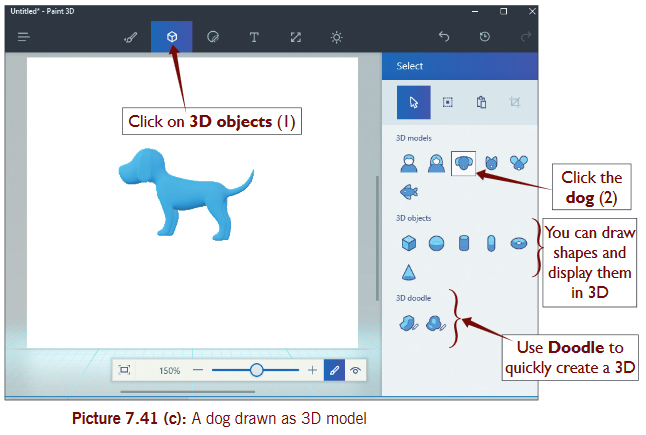 Step 2:Click Tools on the toolbar and select a desired tool. In this case will select spray can tool and then select orange color. Click on the parts of the dog to fill them. Rotate the dog using the floating rotate tool and apply orange color. select gray color and apply on tail, legs and mouth parts. select water color and green color and apply on neck parts of the dog. see picture 7.41 (d).
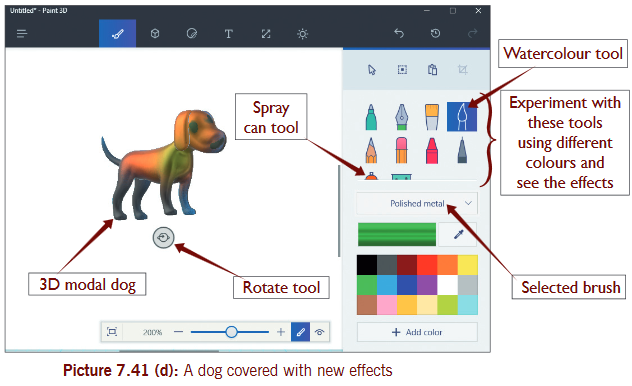 Step 3: Click on the Effects button on the toolbar and select the spearmint effect in the tools pane. the results appear as shown in picture 7.41 (e).
 Step 4: type text “My dog is nice”select the text tool on the toolbar and draw a box where you want in the canvas and then type the desired text.Step 5: save your file as a project. Procedure for saving Paint 3D project:Click on the Expand menu button and then select Save As. see picture 7.41 (f).
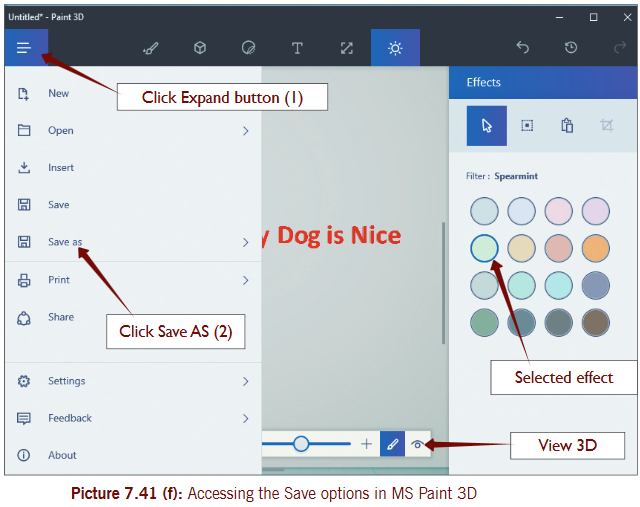 the complete project in 3D will appear as shown in picture 7.41 (g).
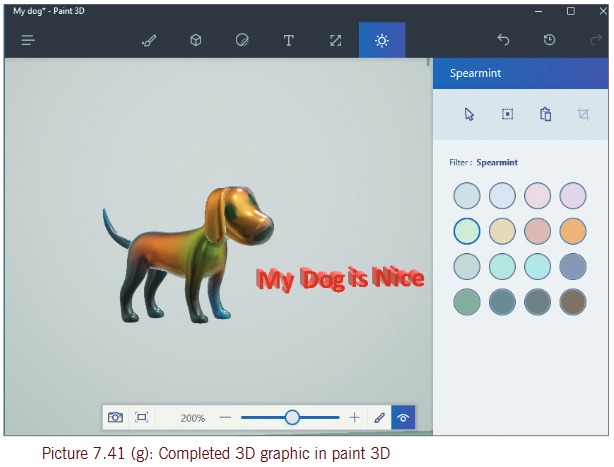 Activity 7.8 (b)1. Draw the following pictures in Microsoft Paint and save the files as their names shown.
 2. Imagine and draw a picture of a learner seated attentively in a classroom lesson using graphics software of your choice.7.10 Using PhotoshopAt the start when you open Photoshop it displays a dark interface as shown below in picture 7.42.7.10.1 Create a new Photoshop fileStep 1:When Photoshop opens, click on File menu and select New.In the new document screen that appears, select a category of orientation for your document; then type in the file name in the PRESETS DETAILS pane.Click OK at the bottom. the new named document will display with a white background as shown in picture 7.42.
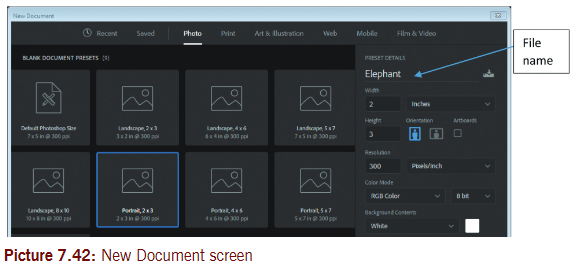
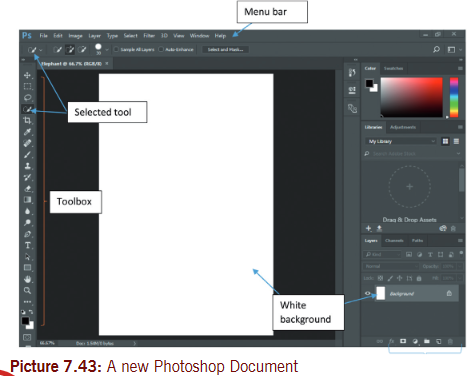 Activity 7.9Use the available digital camera and take desired photos as you master how to use it. Pick a suitable rough photo from your camera or open an existing rough photo in Photoshop . edit the photo by :a) Adjust image size to a suitable size.b) Reduce the roughness of the background or skin.c) Apply desired text depending on the image applied in the upper right hand corner.d) Crop part of the image and discard the rest. save changes.e) Rotate the cropped image by 180 degrees.Follow procedure below7.10.2 Open an imageStep 1:Open or Add an image: In a new file select Open on file menu.Step 2: select an image you want. the image I have chosen here below is an elephant:
 7.10.3 Resize imageStep 3:Adjust Image Size: Use Image menu and adjust image to the size you want. Click Image Size on the Image menu Make other adjustments using Image menu. see picture 7.46.Note: In case of a mistake you make in using Tools, press CTRL+Z (Undo) but if there are several mistakes, then press ALT+CTR+Z to reverse those actions.
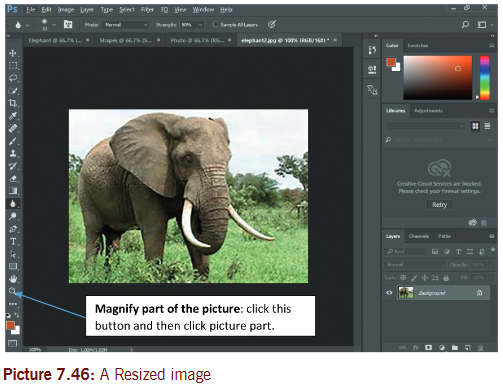
 7.10.4 Use brushing toolsStep 4:Remove some rough elements on the animal skin. Use the Spot Healing Brush and Blur tool. Afterwards apply some light on parts using Dodge tool.7.10.5 Add text to photoStep 5:Add text to the upper right hand corner as “African elephant”. Use the ‘Horizontal Type Tool’ and draw a textbox in required position. type the text. You can format the text using menu items below the menu bar. the text may appear as shown in picture 7.48.
 7.10.6 Crop an imageStep 5:To Crop an image. select the Crop Tool from image menu or from toolbox and then select part of the picture you want to crop. You can press the check button on toolbar.7.10.7 Rotate an imageStep 6:Using the Image menu, on Image Rotation menu select 1800. You can use a different option.
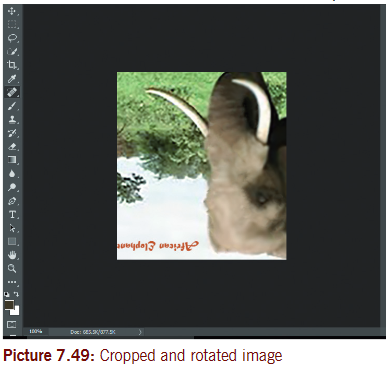 Note: Photoshop generates better picture because many actions are done in a much professional way using advanced tools. Practice editing images using all the tools available in Photoshop to build your skill. If you need to draw lines and shapes within your image, you can use Pen tool.Keyboard shortcutsKeyboard shortcuts can greatly increase your productivity. Here are some of the more common ones:
- new Canvas: Ctrl+N
- Cut: Ctrl+X
- Paste: Ctrl+V
- Copy: Ctrl+C
- save: Ctrl+S
- Delete: Del
- Print: Ctrl+P
- Undo: Ctrl+Z
- Highlight All: Ctrl+A
- open: Ctrl+O
- Redo: Ctrl+Y
- Hide toolbar: Ctrl+T
- open Attributes: Ctrl+E
- stretch And skew: Ctrl+W
End of Unit 7 AssessmentMultiple choice questions1. Which of the following will you use to select any irregularly shaped part of the picture?A. Free-Form select B. selectC. eraser D. Fill with Color2. Which of the following indicates the current foreground and background colors?A. Free-Form B. eraserC. Color box D. select3. Which of the toolbox is used to erase areas of your picture?A. Free-Form B. eraserC. Magnifier D. Brush4. Which of the following will you use to fill the entire picture or an enclosed shape with color?A. Airbrush B. Fill With ColorC. Pencil D. Color box5. to zoom in on a section of your picture, you should use;A. Magnifier B. Free-FormC. Brush D. eraser6. to select any square or rectangular part of the picture, which toolbox will you use?A. Line B. Fill with colorC. Free-form select D. select7. Which of the following is used to set the current foreground or background color of a canvas?A. Airbrush B. BrushC. Pick color D. text8. A toolbox used to draw thin, free form lines or curves.A. Pencil B. AirbrushC. Brush D. textPractical work1. Create a simple image using some of the drawing tools in Paint (Pencil, Brush, Airbrush and Filled shapes).a) selecting and moving part of an image.b) selecting and copying part of an image.c) storing an image in a file Bmp as a large uncompressed file and Jpg as a smaller compressed file.d) Using the image in a Word document.2. Use Paint to create the following effects:Draw a picture of some people stick figures. Be creative! the Figure below is an example.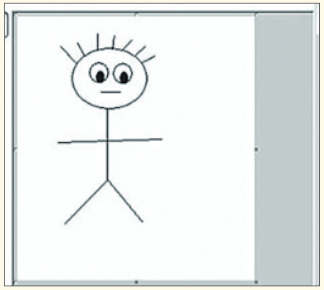 3. Draw the following
 4. Using Ms paint, draw a flag of Rwanda as shown below.
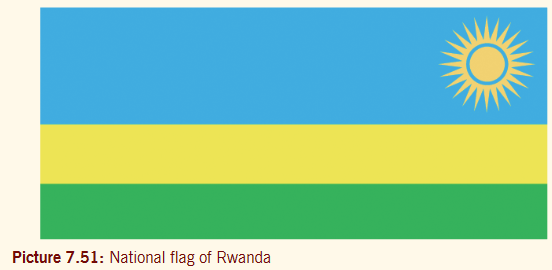 a) Create a folder named ‘lab2’. Create an image using Microsoft Paint, and save as a 24 bit .bmp file start with a good size canvas, use lots of colors: DO something interesting! Include many different colors, lines, circles, etc. save as a 24 bit .bmp file called 24bit.bmp.
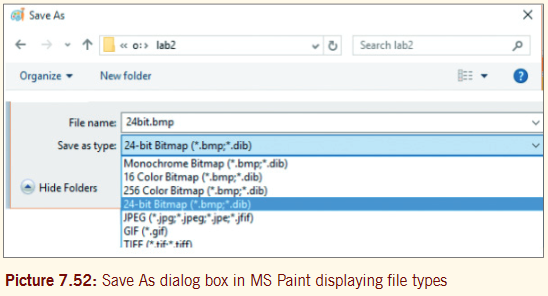 b) • Save as a 256 color.bmp file called 8bit.bmp.• save as a 16 color .bmp file called 4bit.bmp.• save as a monochrome .bmp file called 2bit.bmp.• Close Paint.• start a new Paint session, and open 24bit.bmp.• save as a tiff file called 24bit.tif.• Close Paint.• start a new Paint session, and open 24bit.bmp.• save as a gif file called 24bit.gif (will warn about color loss).• Close Paint.• Browse to your lab2 folder, and compare file size.• Right click each image, and choose Preview to compare how the images look.5. take a picture of yourself using a digital camera and edit the photo in a way you wish using various tools on the toolbox and menu. In case of absence of a camera, use any available photo on your computer and perform editing functioning to crop, resize, flip, rotate and magnify parts of the picture.6. scan or search from Internet for these pictures below and introduce them into Photoshop. edit the pictures by adjusting their brightness or contrast, resize and change their color or add a different background. save the changes. Use other pictures provided by the teacher and edit them accordingly.
 7. Create a line, a curve, polygon, a circle and a square using Photoshop. Make the shape outlines colored and filled with color effects where possible. Apply accompanying text. save the file as super shapes.8. Draw the pictures below using Ms Paint and then Ms Paint 3D.
Unit 8: Introduction to Multimedia
Key unit competence
explain the different uses of multimedia and interactive multimedia applications. Use multimedia software to create a video.
8.1 Introduction
Multimedia has become familiar in our life, it can be found in different areas of life such as in education, business, wedding ceremony and others. In these days, with the evolution of the use of computer, the demand of multimedia contents has also increased, multimedia content can be: movies, power-point presentation and audio sounds.
8.2 Definition
Multimedia is the collection of medias that use multiple forms of information content and information processing to inform or entertain the user.
Examples of multimedia contents are; text, audio, graphics, animation, and video.
Multimedia also refers to the use of electronic media to store and experience multimedia content.
Multimedia information can be represented in form of audio file, graphical file, image file, video file and animation file.
8.3 Categories of multimedia
Multimedia may be broadly divided into linear and non-linear categories.
- Linear multimedia; active content progresses without any navigation control for the viewer/user. Examples: Movies, video clips and songs.
- non- linear multimedia content offers the ability to control the content interactivity with the user/viewer.Examples: Computer games, assimilation software used in self computer based trainings.Multimedia presentations can be live or can be recorded.
- A recorded presentation is a presentation which has been recorded and edited, after all processing stages.Example: TV program.
- A live multimedia presentation occurs when things are happening at that moment.Examples: news on television and Football game.
8.4 Features of multimedia
- Presentations may be viewed in person on stage, projected, transmitted, and played locally with a media player. examples: Power point presentation and cinema presentation.
- Games and simulations may be used in a physical environment with special effects, played /used by multiple users on the computer network and locally with an offline computer, game system, simulator.Examples: online games and game on mobile telephone.
8.5 Types of multimedia
- Text: It is used as the basic element for all multimedia applications. It is directly used to inform users about the information that it wishes to communicate.
- Graphics: It uses pictures as visuals in digital form used in multimedia presentations. there are two types of graphics:
(i) Bitmap Graphics (Image Raster): Formed by pixels arranged in specific ways in a matrix form.(ii) Vector Graphics: Formed by lines that follow mathematical equations called vector.Animation: It is the process of adding movements to static images or picture through using various computing methods.Audio: It is the sound in digital form used in multimedia presentations.Video: Moving pictures in digital form in multimedia presentations.Activity 8.1Use internet or school library textbooks to make research and answer the following questions.1. explain the term multimedia.2. Describe different types of multimedia.3. explain features of multimedia.4. Using examples, describe categories of multimedia.You can share your opinions to the rest of the class.8.6 Applications of multimediathe application of multimedia is found in various areas including: advertisements, art, education, entertainment, engineering, medicine, mathematics, business, scientific research and spatial. A few of application areas of multimedia are discussed below:1. CommercialMost of the electronic media used in commercial advertisement fall in multimedia. In most Rwandan cities, there is exciting presentations that are used to take and keep attention of people with the interest of advertising.2. EntertainmentMultimedia is heavily used in the entertainment industry. It is especially used to develop special effects in movies and video games.3. EducationIn education, multimedia is used to produce computer-based training courses and reference books.4. IndustryIn the Industrial sector, multimedia is used as a way to help present information to shareholders, superiors and coworkers. Multimedia is also helpful for providing employee training, advertising and selling products all over the world via virtually unlimited web-based technologies.5. MedicineIn Medicine, doctors can be trained to do human surgery and they can simulate how the human body is affected by disease viruses and how bacteria spread, using multimedia tools and then develop techniques to prevent it.6. Multimedia in public placesIn hotels, airports, shopping malls, museums, and grocery stores multimedia tools are available to help people/tourists to give information, they need.Example: In airport, there is no need to ask plane information to the personnel of the airport; notice board is there to inform passengers.Activity 8.2Using your school internet facilities1. search for multimedia application and compare your results.2. Discuss the applications of multimedia in your local community.3. Compare what is happening in other communities and what you have found in your community.8.7 Hardware and software in the multimedia requirement8.7.1 Multimedia hardwareBelow are some of the hardware that can be used in multimedia :- Computer.
- Digital camera.
- Microphone.
- scanner.
- Microphone.
- speaker /headphone.
- Digital camera
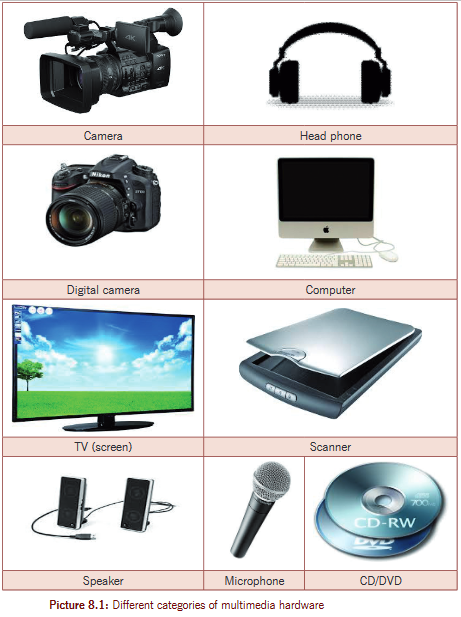 8.7.2 Multimedia software
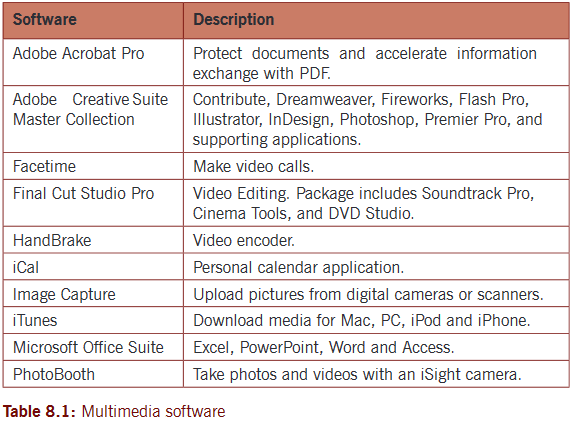 these hardware and software are used together to make up the multimedia system which can capture, digitize, compress, decompress, retrieve multimedia components (multimedia data) and show it on the output device like computer monitor and multimedia projectors.Activity 8.31. Discuss other multimedia hardware and software which are not discussed in here. Use the facilities available within your school.2. Identify multimedia hardware which are used in your school.3. List multimedia software that are installed in school computer lab.8.8 Interactive multimedia8.8.1 Create hyperlinks to link to a slide in the current presentationYou already know how to use Ms PowerPoint presentation. now open the program and perform the following actions. You should use an existing file.Step 1: In normal view, select the text, shape, or picture that you want to use as a hyperlink.Step 2: on the Insert tab, in the Links group, click Hyperlink.
 Step 3:In the Insert Hyperlink dialog box, under Link to, click Place in this Document.
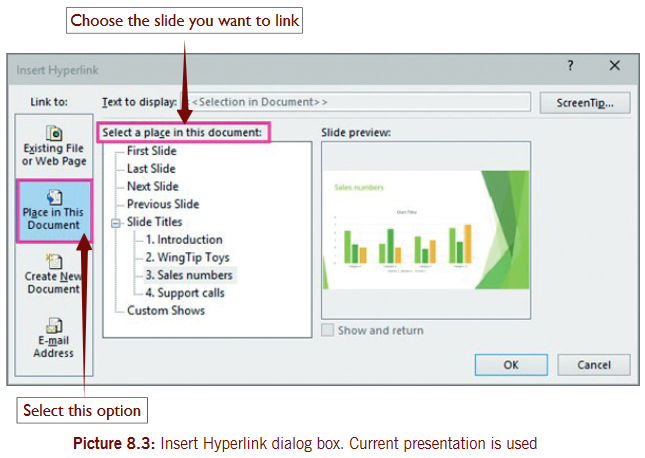 Activity 8.4Create a PowerPoint presentation “Rwanda nziza”. this presentation has the following slides:·slide 1: Province.·slide 2: northern Province.·slide 3: eastern Province.·slide 4: southern Province.·slide 5: Western Province.·slide 6: City of Kigali.Link slide 1 to other remaining slides in any way that you can jump from slide1 to any other of these slides.Step 4: select “First slide, next slide, Previous slide or Last slide”. You can use slide titles.Step 5:Click OK.8.8.2 Create hyperlinks to link to a slide in a different presentationUse the following steps to link a slide in a different file.Step 1:In normal view, select the text, shape, or picture that you want to use as a hyperlink.Step 2: on the Insert tab, in the Links group, click Hyperlink.
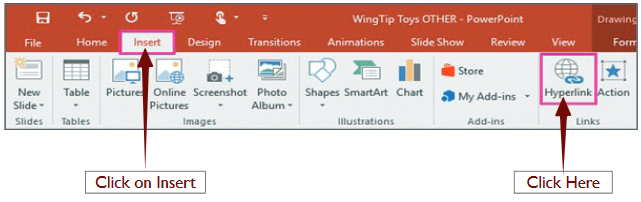 Step 3:Under Link to, click Existing File or Web Page.Step 4:Locate and select the presentation file that contains the slide that you want to link to.Step 5:Click Bookmark and then click the title of the slide that you want to link to. Click OK and then OK.
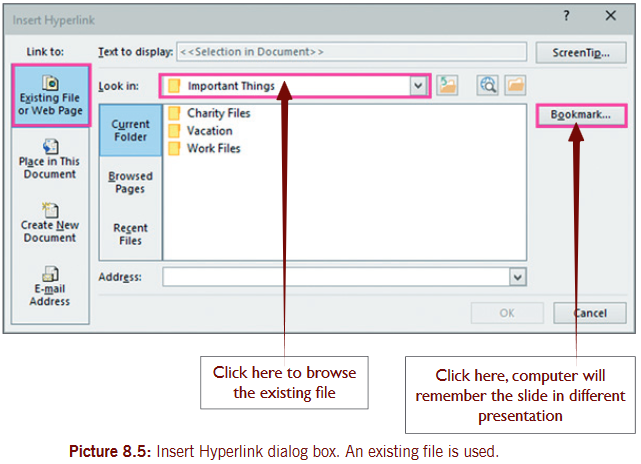 Activity 8.5Create a PowerPoint presentation “My school” and connect it to the previous presentation “Rwanda nziza”. “My school” presentation should contain the slides about your school as follows:Slide 1: name of your school and school motto.Slide 2:Location of your school, addresses or contacts. Headmaster’s name.Slide 3:5 male and 5 female teachers in your school.Slide 4: sports activities in your school.Slide 5:Co-curricular activities in your school.Slide 6: subjects taught in your school.8.8.3 Create hyper links to link to an e-mail addressStep 1: In normal view, select the text, shape, or picture that you want to use as a hyperlink.Step 2: on the Insert tab, in the Links group, click Hyperlink.
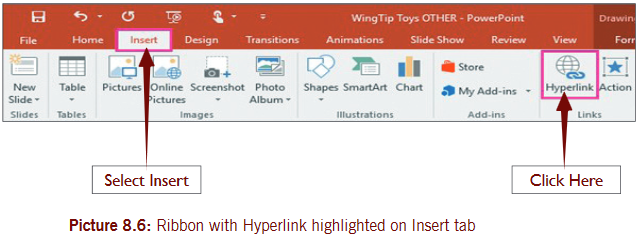 Step 3: Under Link to, click E-mail Address.Step 4: In the E-mail address box, type the e-mail address that you want to link to, or in the Recently used e-mail addresses box, click an e-mail address.Step 5: In the Subject box, type the subject of the e-mail message.
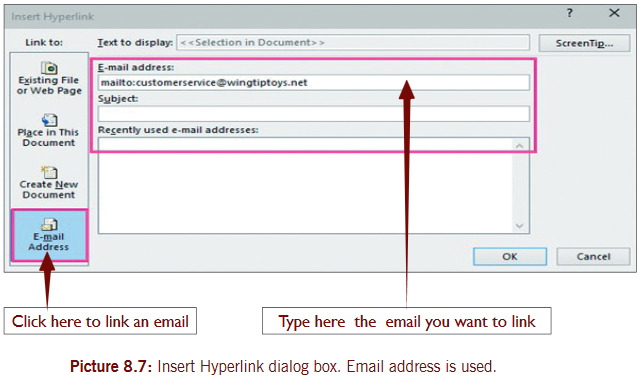 Activity 8.6open a PowerPoint presentation “My school” and connect it to the class email “classsenior3@gmail.com”8.8.4 Create hyperlinks to link to a new fileFollow the steps below to create a link between my school and classroom3@gmail.com.Step 1: In normal view, select the text, shape, or picture that you want to use as a hyperlink.Step 2: on the Insert tab, in the Links group, click Hyperlink.
 Step 3: Under Link to, click Create New Document.Step 4: In the Name of new document box, type the name of the file that you want to create and link to.Note: If you want to create a document in a different location, under Full path, click Change, browse to the location where you want to create the file, and then click OK.Step 5: Under When to edit, click whether you want to Edit the new document later or Edit the new document now.
 Activity 8.7open presentation “My school” and connect it to the new presentation you are going to create “My Class”.“My class” presentation should contain the following information:Slide 1:name of your class e.g. s.3.A.Slide 2:List of 10 girls in your class.Slide 3:List of 10 boys in your class.Slide 4:Reasons why learners like ICT.Slide 5:Disadvantages of ICT to learners.8.9 Create action buttons8.9.1 Add commands to your presentation with action buttonsFollow the steps given below to use Action buttons.Step 1: o n the Insert tab, in the Illustrations group, click Shapes, and then under Action Buttons, click the button shape that you want to add.
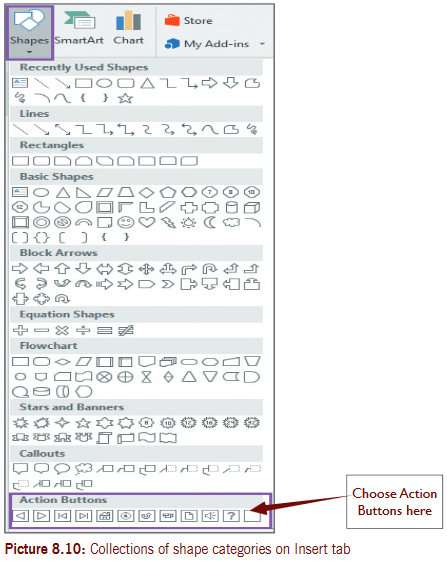 TIP: Action buttons provide great visual cues to the action it launches, but you can also assign actions to other objects, such as clip art, pictures, general shapes, or to the text in a Smart Art graphic. Use the procedure below to add an action to those objects as well.Step 2: Click a location on the slide, and then drag to draw the shape for the button.Step 3: In the Action Settings dialog box, do one of the following:• to choose the behavior of the action button when you click it in slide show view, click the Mouse Click tab.• to choose the behavior of the action button when you move the pointer over it in slide show view, click the Mouse Over tab.
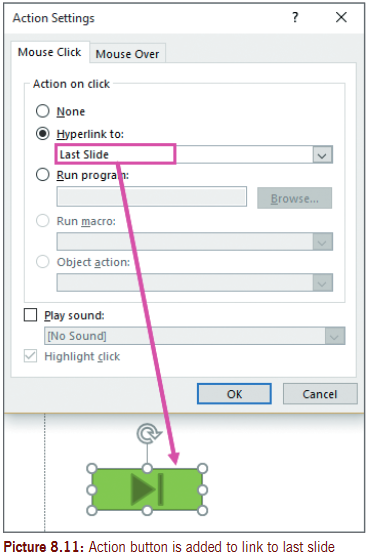 Add a button shape, and then assign an action (in this case, a hyperlink).Step 4: to choose the action that will take place when you click or move the pointer over the action button, do one of the following:TIP:To play a sound, select the Play sound check box, and then select the sound that you want to play.Step 5: When you’ve finished choosing your action, pick OK.Activity 8.8Insert in each slide play buttons and stop buttons on the last slide in “my class presentation”.8.9.2 Insert an MP3 audio file into a presentationActivity 8.9You are provided with an audio file which has mp3 file extension. Insert the audio file into “my class presentation” in the 3rd slide.Step 1:From the Insert tab, click the Audio drop-down arrow, and then select Audio on My PC.
 Step 2:Locate and select the desired audio file, then click Insert.
 Step 3: the audio file will be added to the slide.8.9.3 Insert a video file into a presentationActivity 8.10You are provided with a video file. Insert the video file into “my class presentation” in the 4th slide.Step 1:From the Insert tab, click the video drop-down arrow, and then select Video on My PC.
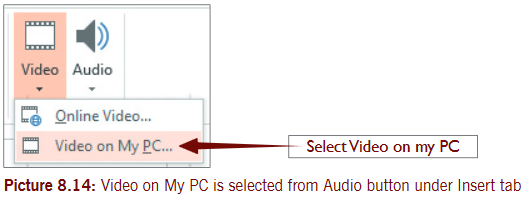 Step 2:Locate and select the desired audio file, then click Insert.
 8 .9.4 Insert a CD audio track in the presentationActivity 8.11You are provided a CD audio track. Insert the CD audio track into “my class presentation” in the 5th slide.If you want to add the Play CD Audio Track command back to the Insert tab, you must create a custom group and then add the command to the new group. to do this, follow these steps:Step 1:Click the File tab, and then click Options in the navigation pane.Step 2:In the navigation pane of the PowerPoint Options window, click Customize Ribbon.
 Step 3:In the Customize ribbon column, in the Main Tabs list, expand Insert, and then select Media.
 Step 4:Under the Main Tabs list, click New Group. the new group named New Group (Custom) is inserted under the Media group.Step 5:Click Rename, type CD audio, and then click OK.
 Step 6:In the Choose commands from drop-down list, select All commands.Step 7:Locate and then select the Play CD Audio Track command, and then click the Add button. the command appears under the new CD Audio group.Step 8:Click OK.
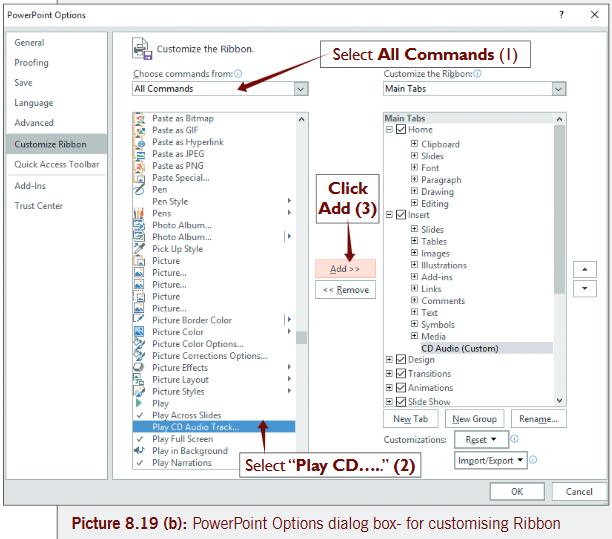 Step 9:Return to Insert tab and click play CD Audio Track from CD Audio group (new group created). this will work as long as you have the CD inserted in computer.8.10 Create digital image, audio and video fileActivity 8.12You are provided with a digital camera or smart phone elaborate on:1. How to capture a video using a digital camera / smartphone.2. How to take a picture using a digital camera / smartphone.After the teacher has demonstrated on how to do the activity, take a video of 4 minutes and 6 pictures to be presented in class.Step 1: open and switch on digital camera.Step 2:Click the Video Capture button.
 8.10.1 Manipulate an imageActivity 8.13In reference to Activity 8.12, open GIMP and use the 6 pictures you have taken and do the followings:1. Crop the pictures.2. Rotate to 128 degrees.3. save the pictures on the desktop.We are going to use GIMP (GNU Image Manipulation Program). It is free software and it is a powerful application that can alter, manipulate, enhance, and create digital image files. this software should be downloaded and installed on your computer.Saving an image to save an image file;Step 1:Right-click on the image, follow the steps below;Step 2:Choose File.Step 3: select either Save or Save As.Step 4: the Save Image window opens.Create a new imageStep 1:Choose File => New.
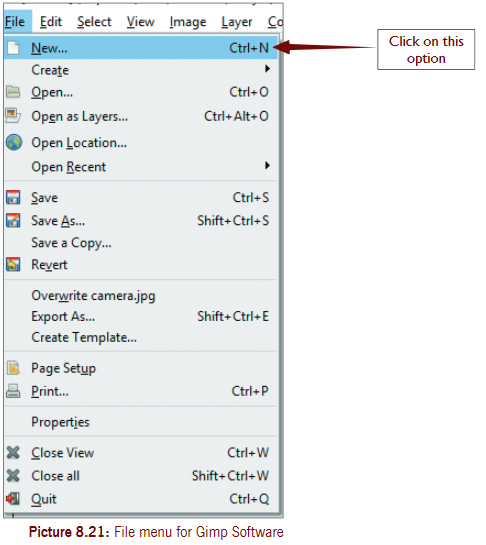 Step 2: enter the image size, image type, and fill type of the file.
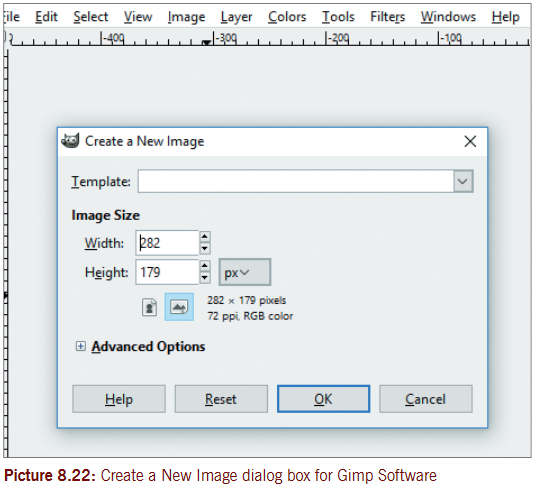 Step 4:Click the OK button.Step 5: edit and manipulate the image with the GIMP’s various tools.Step 6: save your file.Editing an imageSteps to crop an imageStep 1: open the image.
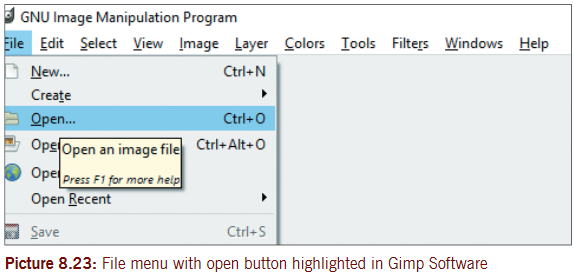 Step 2:Browse your picture from the computer.Step 3:Right click on the image and select Tools=> Transform Tools => Crop.
 Step 4:Left-click and drag the mouse pointer to create a frame that fits the part of the image to keep.Step 5:Click the Crop button in the window that opens as you drag the frame across the image.Step 6:If you are unhappy with the cropped image, press [Ctrl]-[Z].To Rotate an imageStep 1: open the image.Step 2:Right-click on the image and select Image => Transform, then select any of the Flip or Rotate options.
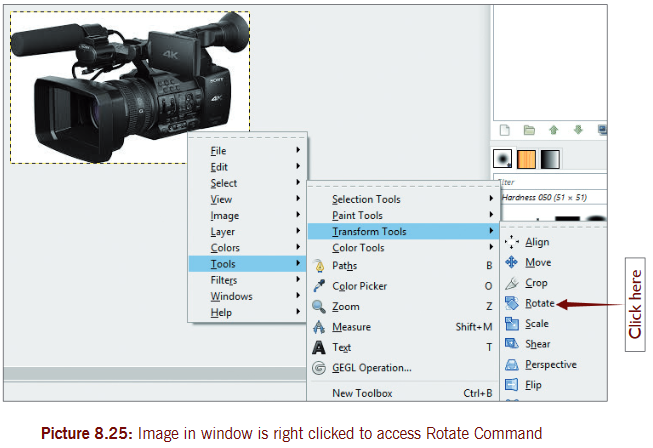 Step 3:If you are unhappy with the changes, press [Ctrl]-[Z].Activity 8.14Record audio file (on your computer)Follow these steps to create or record an audio file on your computer1. Connect a microphone on your computer. A microphone can connect through USB port (USB microphone) or input jack- (audio port) for microphone. some computers come with built-in microphone. If you don’t have microphone, use headphones.2. open Windows Voice Recorder. Follow procedure given below:·Click Start·Click All Apps·select Voice RecorderAlternatively, you click in the Search box near the start button and type Voice and then click Voice RecorderNote: Voice Recorder is a small application in Windows OS having the capability to make sounds louder, quieter, faster or slower.3. In the Voice Recorder window, click Record button to record your message. When you click Record button, wait for 3 seconds and then start to speak or sing. When you have finished speaking or singing, wait for 3 seconds and then click on Stop recording button. this will prevent the recording to start or stop abruptly. see the picture below.
 4. Click Play to hear your message or song. (see picture below)
 Note: When you are not pleased with your recording, you can delete it and then record again or record new files for comparison.When audio file (s) is named and played, may appear as shown.
 Create/record videothere are two main ways you can use to create video on your computer i.e. using Microsoft PowerPoint and using Windows Movie Maker.Method 1: To create/record a video file (with PowerPoint) follow steps below:1. Create a PowerPoint presentation and save it. You can also open an existing presentation. In this activity, let us open Nature-protect presentation we created in unit 6.2. Add transitions and animations to your PowerPoint presentation in case they are missing (follow steps for adding animation and transitions in Unit 6)3. Add audio to your presentation: on Insert tab, in the Media group, click Audio. on the Audio menu, select Audio on My PC... see picture below.
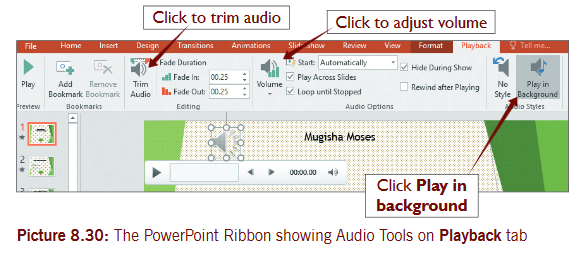 4. Record narration and add timings to the slide showRecord a narration during a presentation·In Normal view, select the slide that you want to start the recording on.·on the Slide Show tab, in the Set Up group, click Record Slide Show.
 ·In the Record Slide Show box that displays, click Start Recording5. export (save) your PowerPoint presentation as a video by;Click File tab, select Export and then click Create Video. on the recording tab of the ribbon, click on Export to Video.
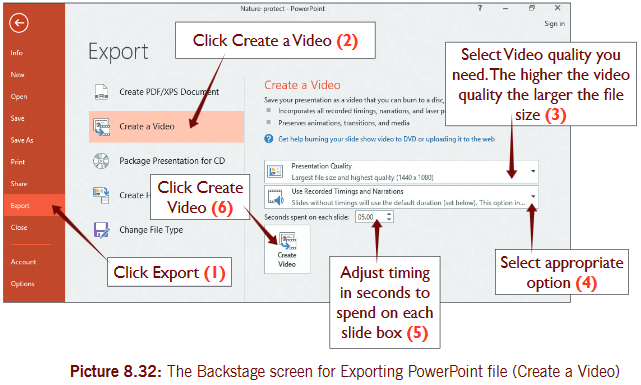 6. Click Create a Video
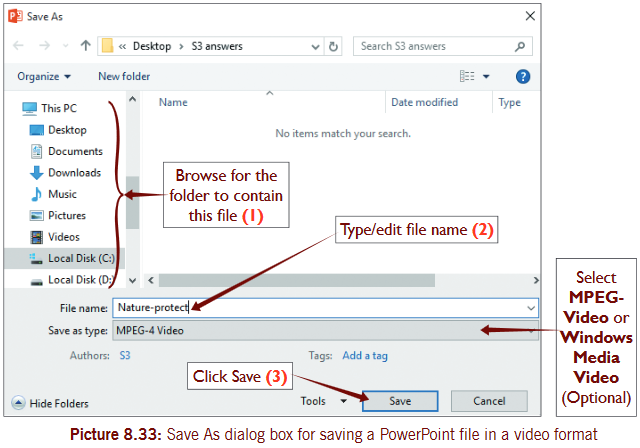 Track the progress of the video creation by looking at the status bar at the bottom of your screen. see picture 8.34 for status bar.
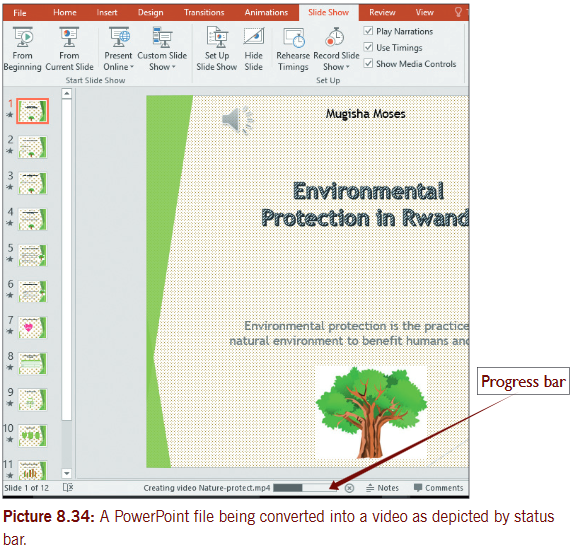 Note: The video creation process can take many hours depending on the length of the video and the complexity of the presentation. If the video is long, you can set it up to be created overnight. By morning time, it will be ready.To play your newly-created video, go to the folder location, and then double-click the file.Activity 8.15Create or open any presentation file you have on a computer and use it to make a video file.Method 2: To create video (movie) file - using Windows Movie Makerstart Windows Movie makerNote: Users of Windows 10 must have to download Movie Maker and install it on their computers. When Windows Movie Maker is ready, then:First add videos and photos to Movie Maker following the procedure below:(i) In Movie Maker, on the Home tab, in the Add group, select Add Videos and Photos.(ii) In the Add Videos and Photos dialog box, open the folder that contains the photos or videos that you want to add, select the video files and photos, and then select open.
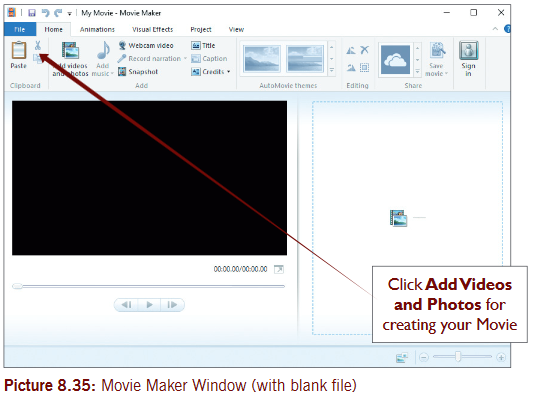
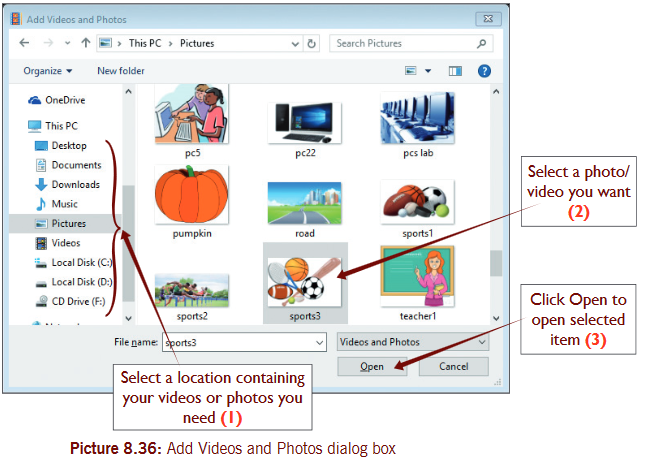 To select multiple photos or videos, press and hold the Ctrl key, and then select each photo and video you want.Note: You can import photos and videos from many different kinds of cameras and devices to your PC using Movie Maker. For example, a webcam built into your PC, a data CD/DVD, digital camera, flash disk, or Secure Digital card (SD card) in a card reader. With your webcam you can record a live video and add to Movie Maker.
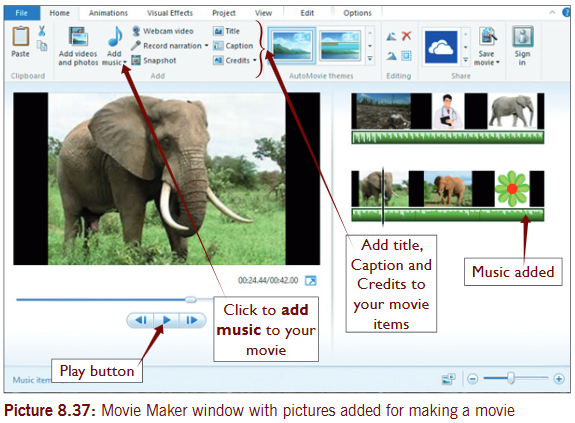 Add and edit audio - in Movie MakerYour movie requires you to add a soundtrack to feel professional. Later you can use editing tools to adjust the volume, fade music in or out.To add music1. on the Home tab, in the Add group, select Add music.
 2. select the music file you want to use, and then select Open.
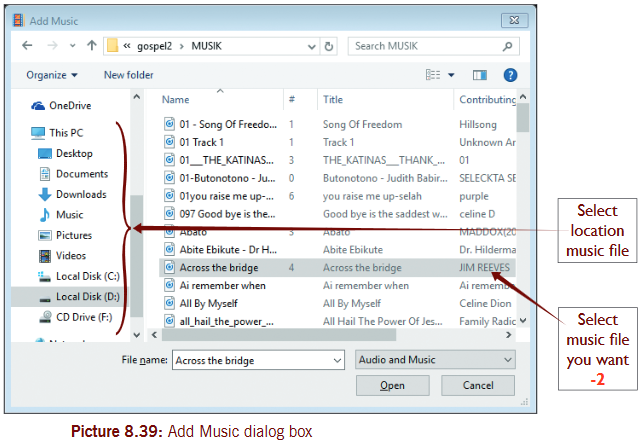 To fade music in or out1. select the music you want to fade in and or out.2. Under Music Tools, in the Options tab, in the Audio group, do either and or:·select the Fade in list, and then select the speed for the music to fade in.·select the Fade out list, and then select the speed for the music to fade out. see picture below.
 To change the start or end point of the musicUse picture above and follow steps given below:1. select the music.2. Drag the playback indicator on the storyboard to the point in the music where you want it to start or stop playing in your movie. then do one of the following:·to set a new start point for the music to start playing at the current point, under Music Tools, on the Options tab, in the Editing group, select Set start point.·to set a new end point so the music stops playing at the current point, under Music Tools, on the Options tab, in the Editing group, select Set end point.To change the audio volume of a music item1. select the music.2. Under Music Tools, on the Options tab, in the Audio group, select Music volume, and then move the slider left to lower the volume or right to increase it.Edit video (Movie Maker)there are several applications used today to edit videos/movies and movie maker is one them. You can use it to make your video/movie look the way you want it to be. one way of editing video is to trim it as described below. see edit video tools in picture8.41.Trim your video (see picture 8.41 and 8.42)You can trim the beginning and the end of a video such that the video shows only the part you want. For example, if you have a video with black frames at the beginning, you could trim the beginning of the video so the black frames don’t appear in your final saved movie, however this does not affect the original video file.To trim a video in Movie Maker1. on the Home tab, in the Add group, select Add videos and photos.
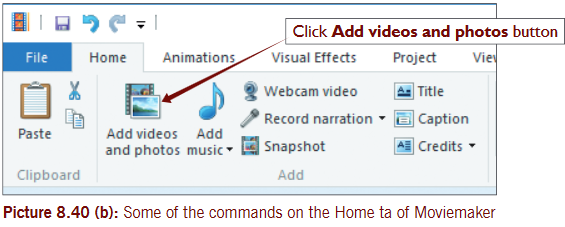 2. In the Add Videos and Photos dialog box, open the folder that contains the photos or videos you want to add, select the video file or photo, and then select Open. see picture 8.40 (c).3. select the video that you want to trim.
 4. Under Video Tools, on the Edit tab, in the Editing group, click on Trim tool, either and or·Move the slider underneath the preview monitor to the point that you want the video to start, and then select Set start point. see picture 8.41 and 8.42.·Move the slider underneath the preview monitor to the point that you want the video to stop playing, and then select Set end point. see pictures 8.41 and 8.42.
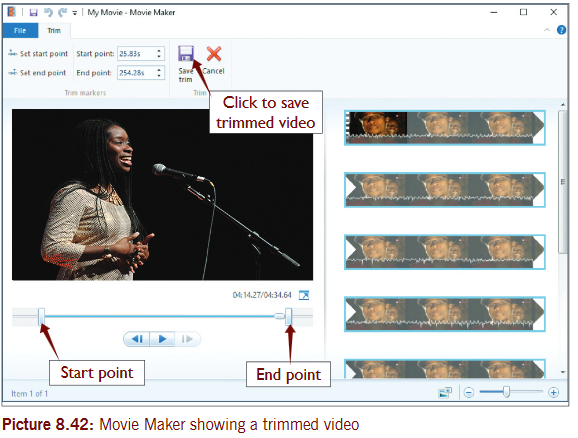 Note: To remove the start and end points and allow the whole video to play, repeat 1 – 3 above. Move the start trim handle to the beginning of the video and end trim handle to the end of the video (in their original locations). Afterwards click Save trim to save the changes.Split a videoYou can split a video into two smaller items and then continue editing.To split a video into two items1. select your video, and drag the playback indicator to the point where you want to split the video.2. Under Video Tools, on the Edit tab, in the Editing group, select Split (see picture 8.41).Speed up or slow down a videoChange the speed of your video in Movie Maker to make it play faster or slower by:
- selecting the video, and under Video Tools, on the Edit tab, in the Adjust group, select the Speed list, and then select a speed (depending on how much you want to speed the video up or slow it down). see picture 8.41.
Activity 8.16Use a digital camera to capture video (s) about different activities different learners do during either break or lunch time. Use this video in windows Movie Maker and trim as you may like. split the video into two parts and burn each part on a separate compact disk.End of Unit 8 Assessment1. List at least 5 multimedia tools used in your community (Village, town, Home, and school).2. In which area are these multimedia tools being used?3. open Ms PowerPoint and create the following presentation:a) Geography of Rwanda , it must have 8 slidesb) Cities of Rwanda , it must have 6 slidesc) Gender in Rwanda, it must have 5 slides therefore create the following hyperlinks:(i) In geography of Rwanda presentation , link the second slide and the last slide.(ii) Link together cities of Rwanda and geography of Rwanda presentation in the third slide of cities of Rwanda presentation.(iii) Link gender in Rwanda to your class email. save the presentation as “Beauty of Rwanda”.4. Use a digital camera and do the following:a) take 20 pictures which show learners doing different activities.b) Record a video in your school where learners are in extra-curriculum activity (learners in sport, different club and other activities).5. explain 5 ways in which you can use pictures captured by digital camera on different school activities.6. open voice recorder on your computer and record yourself singing the:a) national anthemb) school anthemc) east African anthem7. Introduce one audio track in Power point and edit it by trimming parts you do not want at the beginning or at the end of the track.8. take a video about learners playing football or netball using digital cameras. Introduce the video into Windows Movie maker and edit the video by splitting it into two parts.Unit 9: Network Security
Key Unit Competence
explain network security and apply basic security measures.
9.1 Introduction to Network security
network security consists of policies implemented to prevent and monitor unauthorized access, misuse, modification, or denial of a computer network and network-accessible resources.
It includes all technologies designed to protect the usability and integrity of computer network and information.
Implementing network security can save a business from malicious hacking and virus attacks that could cause a great data loss.
network security and privacy are major issues in data communications.to deal with internal and external security threats, networks need to be safeguarded with antivirus and firewall solutions. Good computer networks must meet performance levels expected. Good networks should also be reliable, consistent, and meet recovery procedures and security criteria to maintain smooth flow of data in an organization.
Activity 9.1
Research on the internet or library books and answer the following questions.
1. explain the meaning of the term network security.
2. Distinguish between the terms security and threat.
3. Identify security threats that are common with computer networks today.
4. suggest solutions that can be used to safeguard a computer network.
5. What are computer viruses? What risks are involved when a computer virus attacks your system?
6. How do you get to know that your computer is having a virus?
7. explain what you can do to protect computer system from viruses.
Practical
8. scan your computer with installed antivirus. If viruses are found, delete them. turn on your internet connection and allow the antivirus to auto update itself (or if it requests for permission to do so allow it). scan any available external disk e.g. flash drive before use.
9.2 Definitions of terms
- Security:this is a state of feeling safe and protected. something that provides a sense of protection against attack, harm or loss is security.
·Computer security means techniques developed to safeguard information stored on computer network.
- Threat: this is a possible danger that might exploit a vulnerability to breach/break security and therefore can cause damage, pain and loss. Vulnerability is a weakness in a system which allows an attacker to reduce system’s information assurance.
- Authentication: this is a process used to identify individuals based on username and password. this process establishes whether;
·someone or something is in fact who or what is declared to be.
·Authentication ensures that the individual is who he or she claims to be but nothing about access rights of an individual.
·Authentication proves that somebody or something is genuine or valid. Authentication is a security measure and uses data encryption to identify the user and verify that the message was not tampered with.
- Authorization: this is permission to perform action.
- Encryption: this is the process of encoding messages between two or more parties information such that hackers cannot read the message/information except the authorized parties. Restricted/sensitive information include:
- Identity information such as social security numbers, identification card numbers, driving license numbers, etc.
- Financial account information i.e. saving and credit card numbers, etc.
- student record information e.g. learner’s grades, financial aid information, etc.
- Medical record information e.g. diagnoses, treatment information, etc.
Note: If your computer is lost or stolen and you have encryption activated, people who try to access information on the computer won’t be able to read it.
Note: Encoding is a method designed to protect the integrity of data as it crosses networks and systems i.e. to keep original message upon arriving at destination.
Importance of encryption
1. encryption protects data in transit i.e. via computer networks like internet, e-commerce, mobile phones, wireless microphones, blue tooth devices and Automated teller machines.
2. It is used today to protect information on computers and storage devices such as flash drives belonging to civilians.
3. It is used by governments and in the military to facilitate secret communication.
Decryption: this is the process of decoding messages information such that authorized parties can read them.sensitive information stored on computer must be encrypted (using encryption key) so that it cannot be understood if it is accessed without using a (decryption key) to decrypt the information.
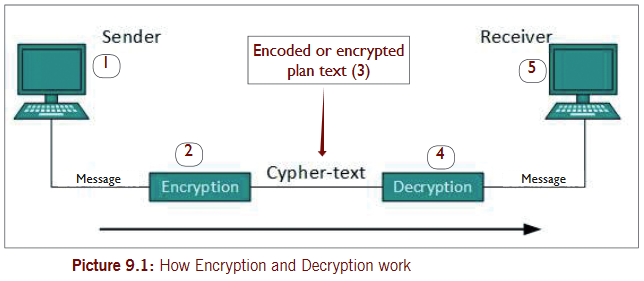
Additional information for Picture 9.1. above
elements of communicating data on a network include:
(i) Sender:this is a computer where message has been created by the user.
(ii) Encryption:this is the process of converting/encoding the message. the message is encrypted into cypher text form that cannot easily be understood.
(iii) the information is transmitted into cypher text to the receiver
(iv) Decryption:this is the process of decoding or reconverting cypher text to original message so that it is easily understood by the receiver.
(v) Receiver:this is a computer where the reader accesses the message.
Firewall: A firewall is a security software designed for preventing/blocking unauthorized access to data and system software on a computer network.
Note: A firewall is a piece of software or hardware. Firewall acts as a protection line between your network and the external threats from internet or other networks.
the firewall keeps track of every file that enters or leaves the local network so as to detect the sources of viruses and other problems that might enter the network.
9.3 Importance of computer security
Computer security is the protection of computer systems from threat that can damage software, hardware, and information and from disruption and misdirection of the services they provide.
the major importance of computer security is:
- protect the computer
- protect data
- protect user’s identification
this is mainly because data present in the computer can be misused by unauthorized intrusions.
Purpose of computer security is to:
- keep your information on computer protected
- maintain your computer’s overall health
- help prevent viruses and malware
- help programs run more smoothly.
9.4 Security threats
A security threat is anything that has the potential to cause serious harm to a computer system. threats can lead to attacks on computer systems and networks.
9.4.1 Origins of threats
Deliberate: I.e. aiming at information asset, for instance spying and illegal processing of data. Deliberate threat is planned intentionally.
Accidental: e.g. equipment failure or software failure. this occurs unexpectedly.
Negligence:I.e. known but neglected factors that can compromise network safety. negligence comes from paying less attention on a serious issue at hand.
Environmental:I.e. natural event and loss of power supply. this is generated by nature or condition of service.
9.4.2 Threats can be classified into two main categories
Intended threats:Include people within the organization. this is the most dangerous threat.
External threat:Include people outside the organization such as thieves, hackers.
The following are the threats in general that commonly affect systems:
- Physical damage such as fire, water, and pollution.
- natural disasters such as volcanic eruptions, climatic changes.
- Loss of essential services such as electrical power, air conditioning and telecommunication.
- Compromise of information e.g. hacking, theft of media.
- technical failures; equipment, software or capacity saturation.
- Compromise of functions i.e. error in use, abuse of rights and denial of actions.
9.4.3 Computer networks attacks
- Computer Viruses: Viruses are malicious programs that can corrupt your data on hard disk, delete most important operating system files, slow your computer operations and can make the system to crash. Viruses can also allow hackers to run programs on your computer or allow access to your files.
- Spyware: A big threat to online computers. Spyware is a software code installed on a computer without user’s knowledge to monitor or supervise user activities.
Spyware can do the following:·Gather personal information and can transmit it without your knowledge.
·Change computer settings.
·Corrupt windows Registry files.
·slow down internet connection speeds and the machine itself.
·steal your privacy.·take up memory and space on your computer.
·Can make a computer to malfunction or totally crash.
- Trojan horse (or Trojan): this is malware (malicious software) that is disguised as legitimate software. In computing, a trojan is any malicious computer program which misrepresents itself as useful, routine, or interesting in order to persuade a victim to install it on computer. trojans do not replicate themselves and appear harmless but in fact malicious.
- Social Engineering:this is a method used by hackers to gain access to computer systems by exploiting human behavior.In computer networking and security; social engineering is a collection of methods used to trick internal computer users to carry out specific actions or revealing confidential information thus breaking normal security procedures.
- Identity Theft: this occurs when personal information is obtained by unauthorized individuals who then use the information to commit a crime such as fraud or theft.everyone is at risk of identity theft. therefore, be careful managers of personal information, identification, and passphrases to help minimize your risk.
Risk involved with identity theft include: victims have to spend time and money cleaning up their personal and financial records. they may be refused loans, housing or cars, or even get arrested for crimes they didn’t commit.- Sabotage by employees:sabotage is malicious damage done usually by annoyed employees. An employee can intentionally enter data incorrectly, destroy hardware or delete sensitive data, changing known passwords and disappearing with customer information. the major solution is to regularly monitor employees’ activities and limit their access to certain sensitive systems or resources.
- Denial of Services Attack (D o SA): this is a method used by hackers to send too many requests to a specific server thereby using all available resources. this leads the server to become unavailable for internet users or crash down.
Unauthorized access by intruders or hackers.Activity 9.21. explain the difference between a spyware and a spam. Identify risks involved when your computer is infected with spyware.2. explain the term ‘social engineering’ in regard to computer security threats.3. explain the term ‘identify theft’. Identify the risks involved with identity theft.4. Describe the concept of firewall as a security solution to network threats.5. explain the difference between encryption and decryption.6. Identify the kind of information that should be encrypted in your school.Practical7. start your computer and open a folder where you frequently save your files.Do the following tasks:(i) Make two of your files as Read-only files (this will prevent other users from modifying contents).(ii) Hide two of your files such that other users do not see them even when they open that folder.(iii) encrypt any two of your important files.(iv) Un hide the hidden file(s).To make a file a Read-OnlyStep 1: open the folder where you often save your files such as My Documents folder.Step 2: Right-click on a file (s) and in the shortcut menu select Properties (see picture 9.2)Step 3:In the File Properties dialog box that displays, check Read-Only Attribute. (see picture 9.3)Step 4:Click on Apply and close the dialog box.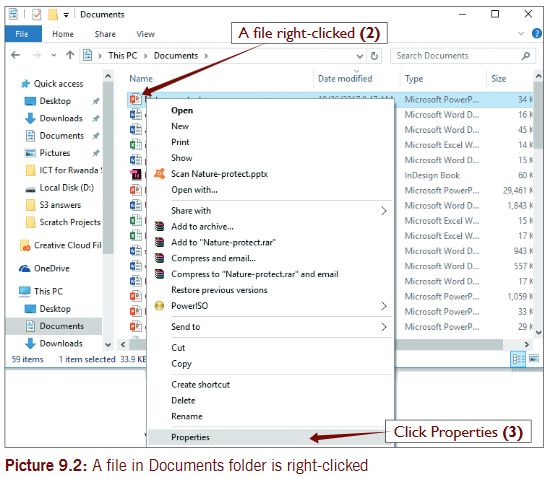
 To hide a fileStep 1: open a folder where your files are stored such as My Documents folder.Step 2: Right-click on a file (s) and in the shortcut menu select Properties (see picture 9.2)Step 3:In the File Properties dialog box that displays, check Hidden Attribute. (see picture 9.3)Step 4:Click on Apply and close the dialog box.To encrypt a file or folderStep 1: open a folder where your files are stored such as My Documents folder.Step 2: Right-click on the file (s) and in the shortcut menu select Properties (see picture 9.2)Step 3:In the File Properties dialog box that displays, click Advanced Attribute. (see picture 9.3)Step 4:In the Advanced Attributes dialog box that displays, check box for “Encrypt contents to secure data” and then click OK.
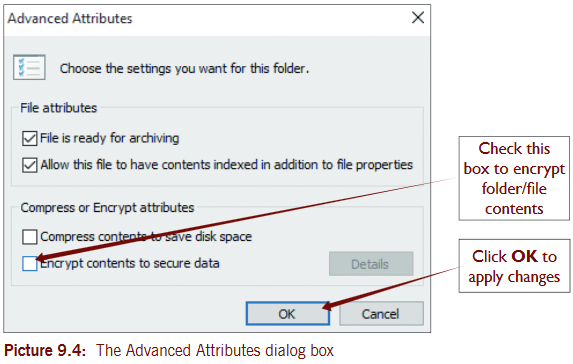 Step 4:Click on Apply and close the dialog box.To un hide hidden file(s)Step 1: open Control Panel window and display the contents as small or large icons
 Step 2:Click on File Explorer Options (see picture 9.5 above).Step 3:In the File Explorer Options dialog box that displays, click on View tab. see picture 9.6.Step 4: select “Show hidden file, folders and drives”
 9.5 Security procedures9.5.1 Protect physical equipment
- to protect physical equipment against fire and burglary, put in place fire extinguishers against fire, use metallic doors and windows with strong padlocks against theft. security cameras and burglar alarms and security guards are used to detect theft.
- Use UPS (Uninterruptible Power supply) to protect system failure and data loss due to the power failure. A UPS is a power backup device. UPS keeps power for about 15 minutes after power loss.
- Use power surge protector to protect your computer against voltage spikes that can harm your system.
9.5.2 Protect dataProtection of data is aimed at safe guarding data against loss, damage and theft. the procedures include;a) Data backupsYou risk losing your data that could have taken you a lot of time to gather if you do not back it up. Your files could disappear due to virus, crash, accidental keystroke, theft or disaster. to backup is to create a second copy of your important data/files somewhere other than your computer’s hard drive.To be sure and secure, that your data is protected, do the following:·Create a duplicate copy of your critical data.·Backup critical and essential files on a daily basis.·Backup and non-critical files on a weekly or monthly basis. You can back up your data to a CD or DVD, to an online backup service (for a small monthly fee), flash drive or to a server. ·store your backup media (CD/DVD, external hard disk and backup server) in a safe, secure place away from your computer, in case of fire or theft.·Periodically, test the capability to restore from the backup media. An unreadable backup is not worth keeping. to ensure that your backup files are reliable, simply upload the files to your computer.b) Regularly update antivirus software.c) scan your computer data and programs regularly.d) Update your operating system regularly with the latest security patches and service packs.e) Have a strong password and change it frequently.f) Install and configure a firewall.g) Don’t download information from the insecure websites.h) Don’t open email attachments from unknown sources.i) scan every external disk memory attached to your computer to protect from malware.j) scan all shareware and freeware before installing them on your computer.Activity 9.31. Describe security risks to computers in your school computer laboratory. suggest solutions that can be used to protect school computers and information stored therein.2. Discuss the concept of ‘backup’ in regard to security procedures on computer.3. explain security procedures that can be used to protect physical equipment of computers.Practical Numbers4. Create a backup of all your important files existing on the computer to a Flash disk or a DVD. (simply save the files on the disk and keep this disk in a safe place for future use).Note: In case school computers are serviced, all the files and programs may be deleted, so backing your files can help store your files safely for longer periods without getting lost.5. a) start your computer and then use Administrator Account to create a User Account with a strong password (8 characters and above).b) exchange computers with a friend. Give your password to that friend to allow him use your account for 10 minutes. Return back to your computer and log on by typing your password. Change your password to become even stronger (12 characters and above).Note: Each time you are prompted to give someone your password, make sure when you return to the computer you change it immediately.6. Collect all rubbish and papers (as heap) from your class and place them in a particular location outside the computer lab. Light fire on the rubbish and papers. Quickly pick the Fire extinguishers to extinguish that fire and avoid its spread.Note: Ensure you learn properly how to use a fire extinguisher so that in case of fire outbreak on Network devices, you can contain it.7. Disconnect your UPS from the computer. Connect your computer directly to power source such as Power socket. start your computer and begin working by typing a brief background about your school. one learner shall switch the main power source without your consent. When you switch back your computer, determine how much data you have lost without using a UPS.8. Download nero burning software and attempt to install it using your limited account.Note: If you don’t have administration password, you cannot install programs.9.6 Basic security precautionssecurity precautions are guidelines you need to follow in order to use a system when you are protected on a network. You need these guidelines on both wireless and wired network.9.6.1 Wireless networksA wireless computer network can be protected from the internal and external security threats by implementing the following techniques:- Control access rights. Unauthorized access must be stopped immediately.
- Don’t expose your SSID server password for your wireless network or login password to wired network.
- encrypt your Wi-Fi network.
- Use encryption method i.e. converting data into unreadable format during transmission using an encryption algorithm and encryption key.
- Disconnect your PC from the network when you are not using it.
- enable firewall and the antivirus software on each computer.
9.6.2 Wired networksthe following techniques are necessary to protect wired networks:- Control direct physical access to network devices and avoid unauthorized access.
- Use strong passwords that must be regularly changed.
- Disconnect your PC from the network when it is not in use.
- Use hardware firewall for access to external network and internet.
- secure loose cables.
End of Unit 9 Assessment1. Describe the kind of data security that can be implemented on a wireless computer network.2. explain how you can protect computer information in relation to data backups.3. explain the meaning of the following terms:a) Denial of service Attackb) trojan horsec) Hacking4. Describe solutions designed for the following network attacks:a) spam b) sabotage by annoyed employeesc) spyware d) Denial of service5. Your teacher has instructed you to clean your computer laboratory, describe the precaution you should undertake to;a) protect computers and network devicesb) protect other users (fellow learners)Practical Numbers6. a) Backup all your important files on your computer to a flash drive.b) Delete all files on the computer that you have backed. Perform the process to restore these important files on the computer.Follow the procedure belowa) Steps to set up your backup on the computerStep 1:Click Start button, select Settings.Step 2:Click Update & Security (see picture 9.7 below) Step 3:In the Update & Security screen that appears, select Backup tab on the left and then click Add a drive on the right. (see picture 9.8 below). In the screen that displays, select an external drive or network location for your backups.
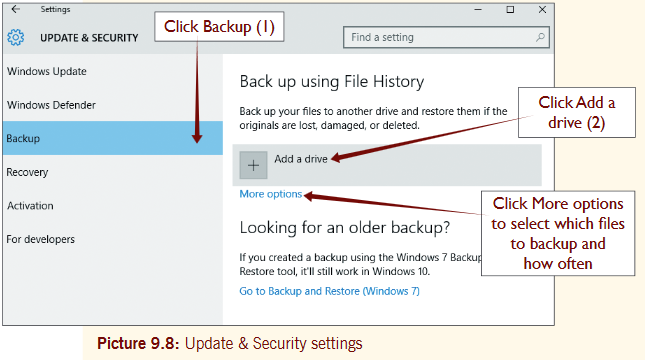 Note: Determine which files to backup and how often to backups happen click More Options
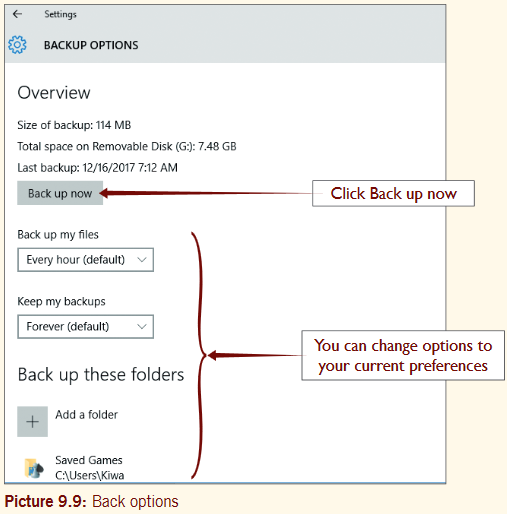 b) Steps for Restoring your filesStep 1: type Restore files in the search box on the taskbar, and then select Restore your files with File History.
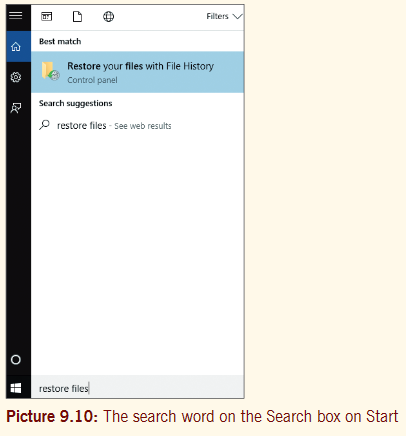 Step 2:Look for the file (or folder) you need, then use the arrows to see all its versions.Note: You must connect the Restore source or backup device.Step 3:When you find the version you want, select Restore to save it in its original location. to save it in a different place, press and hold (or right-click) Restore, select Restore to, and then choose a new location.
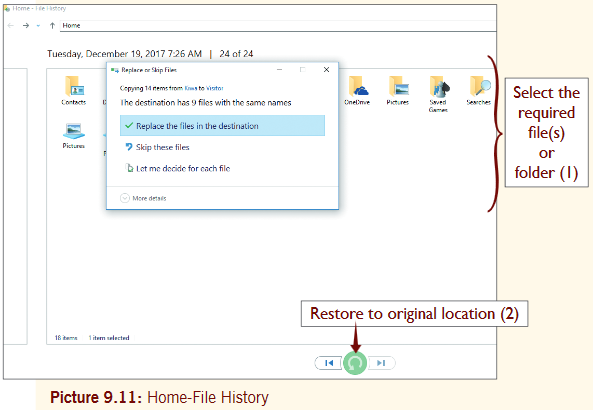 7. a) start your computer and update your antivirus.b) Carryout a complete scan (to scan all drives and devices attached to your computer).8. Download Windows Updates and install them on your computer.
Unit 10: Platform Game Programming
Key unit competence
to be able to use complex expressions, operators and controls to design platforms.
10.1 Concepts of platform and its usage
A platform sprite is an immobile sprite usually a stage background and can interact with other sprites on stage. Most platforms are located at the bottom of the stage and appear as either ground, wall, grass field, brick pavement, etc. A game where there is no platform, the player cannot jump, swing, or bounce; the actions that are characteristics of a game.
the platform sprite is the avatar controlled by the player. Its appearance can affect game play slightly, depending on the angles and size of its costume(s).
An avatar is usually a picture representing a particular person or something in a game or forum.
10.1.1 Create platform sprites
Before you create a platform sprite, you must know what type of the game you want the platform to work for, the level of the game, etc. Learn more about creating platform sprites in section 10.2.
10.1.2 Interact with platform sprites
two or more sprites may interact with each other when they touch each other, or touches certain specified colors, moves in certain direction, etc. the scratch player can interact with platform depending on the type of game and sprites therein designed. Most platforms are designed immobile, the main sprite-player must be given commands that limits or allows movements and in any form of interaction. the scratch window below is showing two sprites. one is Lion and another is a parrot. Whenever the lion touches the parrot, the parrot runs away. the accompanying sprites are given below. try using these scripts and see how sprites interact. Assume all the white space (background) is your area of interaction.
Activity 10.1 (a)
(i) Introduce the two sprites as shown in the screen below. You can use paint to draw them or at this stage just import them into scratch. For more information on how to use scratch paint tools, see Activity 10.1 (b).
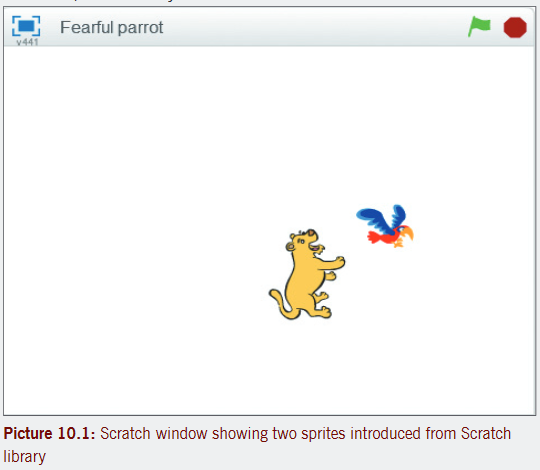
(ii) Place these scripts in the scripts area for the lion and for the parrot and watch how these sprites interact.
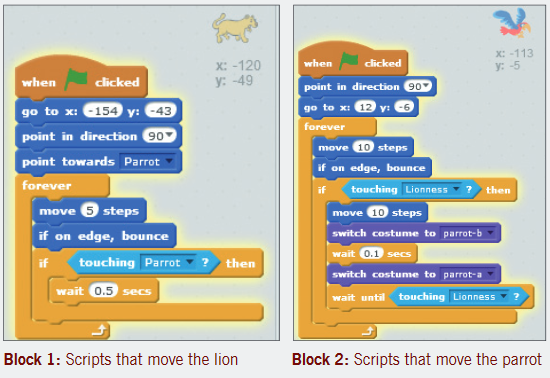
The way sprites interact with others and the platform is covered within the games we have developed in this unit.
10.1.3 Role of platforms in scratch
In a platform, objects i.e. sprites can fall, move, slide, jump, and bounce. the platform acts as an area of sprite interactions. the platform associates those properties identified into the game in which one controls a character to typically move towards a given goal.
10.2 Creating a platform sprite
We need to create a platform and so we think of a game for which to create and a suitable platform to use.
Activity 10.1 (b)
Create a platform sprite for a game named Hard Journey in which a sprite named John is to walk to the end in order to win. In this platform, John should find items that give him a challenge to pass on.
Use the steps given below to create the platform sprite
Step 1: Create a platform sprite as a walk way for John using scratch tools. First open scratch (I am using scratch 2.0 the newer software) and then click on stage1 Backdrop. see picture below.

10.2.1 Pick a color
scratch editor has very many colors to choose from. After you have clicked on 1 and 2 as shown in picture 10.2 above, you can then make a choice of the color (s) you want using the mouse and design a needed item. see picture 10.3.
10.2.2 Design a needed item
Step 2:Use scratch Paint tools to design a needed item (platform- journey where John is to walk). It’s better we use two colors. one color (green) for free movement in the journey and another color (red) indicating enemy.
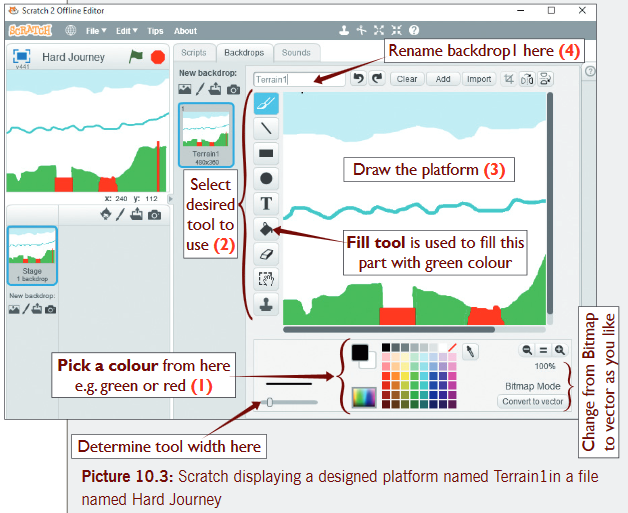
10.2.3 To edit or copy a sprite or an item
to edit a backdrop name, click on it and type a new name. see picture above.
to copy a backdrop, right-click on it and select duplicate.
to delete a backdrop, right-click on it and select delete.

to edit a sprite’s name, click on default name and type the new name in the name box.
to copy a sprite; right-click on the sprite; select duplicate.
to delete a sprite; right-click on the sprite; select delete.
Designing a needed item (Player)
If you had deleted the cat sprite you can now draw a new item (John) using scratch paint tools.
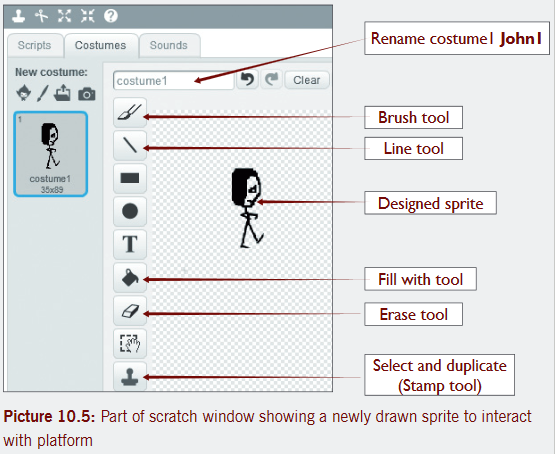
Duplicate John1 costume and then click Flip left-right.
Do this by right clicking on the John1 costume then select duplicate. Afterwards click “Flip left-right” button as shown in the picture below.
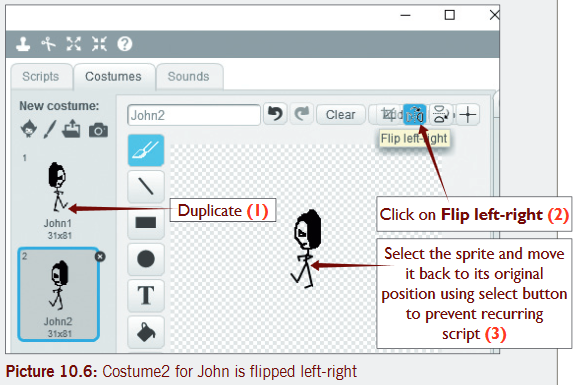
10.2.4 Build a Combo block
A combo block is a combination of scripts that can make a sprite to move, jump, walk, make sound, etc. and can also affect the behavior of the background platform.
Activity 10.2
Create combo blocks that will make John to appear in a specific position when the game starts, ready to move and jump.
Solution
to create combo blocks, you must know what each block does and we already have this knowledge. now you give John-sprite the following scripts (combo block) to take his initial position, show up and get set each time the green flag is clicked.

to give John the ability to move forward or backward. Use the following scripts below.
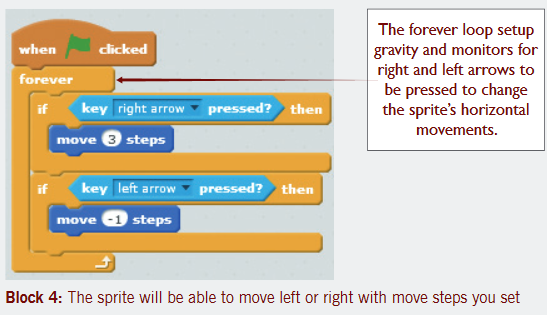
Give John-sprite some movement limits by using the scripts below.
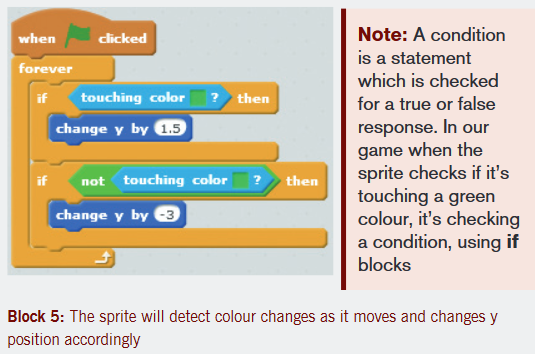
With the scripts below, John will be able to jump

Activity 10.3
1. In groups, discuss how you can associate scratch tools and produce a planned platform. Just think of a game and look at the tools you may need.
2. Discuss the role of platforms in scratch programming language.
3. Modify the platform (Stage1 backdrop) we made in Activity 10.1(b) to appear as shown in the following pictures using scratch paint tools.

4. Create the Stage2 backdrop and make it terrain2 to appear as shown below.
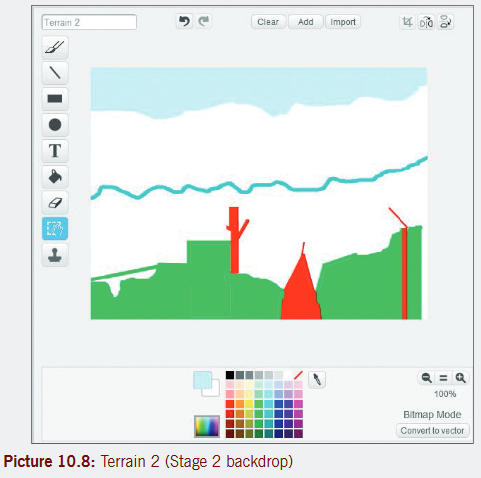
Use the following steps to create backdrop2
·select stage1 Backdrop and then click on the Backdrops tab.
·Right click on Terrain1 backdrop and select duplicate. this will create Terrain2 backdrop.
·Make changes to the backdrop using scratch paint tools to appear as shown in picture 10.8.
5. Create stage3 backdrop to appear similar to the following as shown in picture 10.9 and call it terrain3.
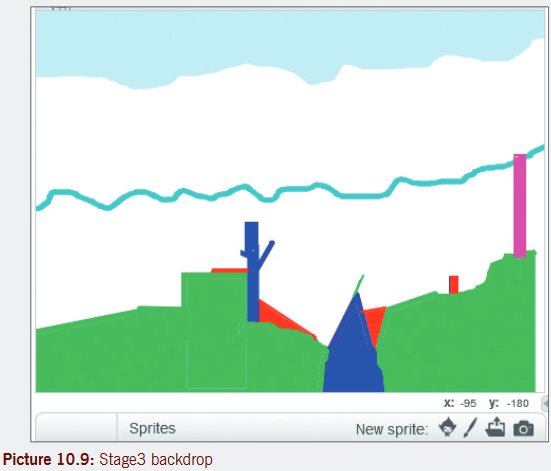
to all level backgrounds add the following scripts to enable a player move back to level 1 faster if it is required.
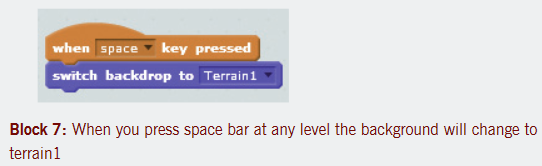
10.3 Add Level of a game
You can use colors in a platform to detect the end of a level or determine the end using edge of a platform. You can also use an object which sends one back to the beginning of the level.
the character sprite is named John. Green is the color of the walking ground. edge has been used such that if one reaches to it; qualifies for next level platform.
Activity 10.4
Using the designed backdrops (platform) in Activity 10.3, add levels of the game enabling a player to move from one level to another. Create a winning costume that will produce a sound and a winning message at level 3.
Follow the following steps
Step 1:Let us add more scripts to block 4 enabling the sprite to move from one platform or backdrop to another. see block 8 below (as a result).
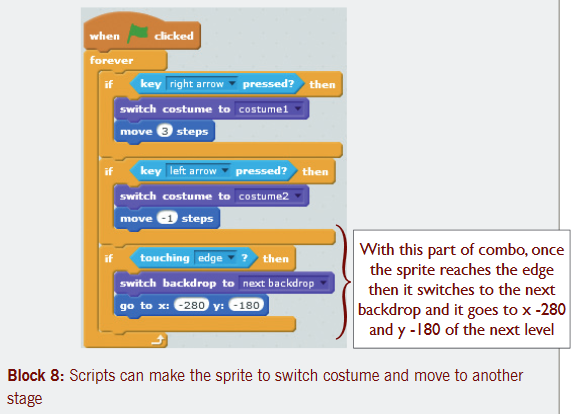
Step 2:In this game, RED objects are used to send the player back to the beginning of the level. We can now modify block 5 by adding in more scripts as shown below in block 9 below (as a result).
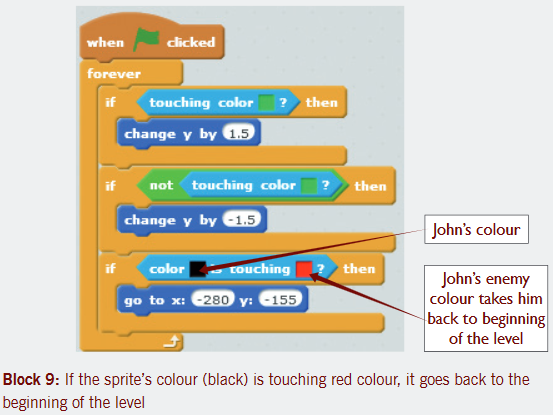
Step 3:Let us add more scripts to block 6 and determine where the game ends. see block 10 below as a result

Step 4: Create a winning costume for John sprite by giving him a different facial color.

Step 5:Let’s us add more scripts to make John produce sound and a winning message. see block 11 below.
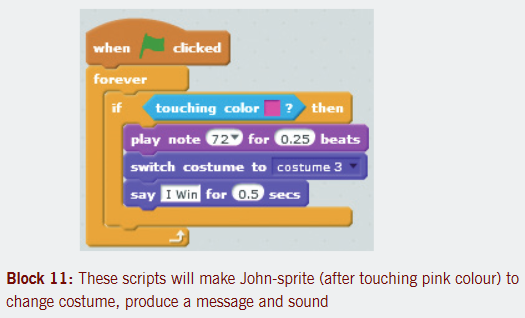
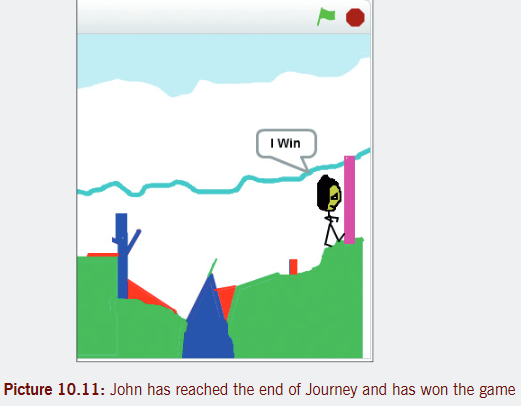
Activity 10.5
1. Using the Hard Journey game in the previous activity, design two more challenging backdrops (add 2 levels) to work for level 4 and level 5 of the game. Let the backdrops be placed in-between backdrop 2 and 3.
2. Make a variable called Jump and use it to test how John-sprite works with gravity while jumping. Use the following scripts.

3. Use appropriate scripts that could make the blue color to hide John (disappear automatically) such that a player must show him in order to play again.
Suggested answers for Activity 5
1. new backdrop3 may appear as this one shown in the following pictures (a) and (b) but you are free to design a different one. this level can later be renamed Terrain3.

the new backdrop4 which can later be renamed Terrain4 may appear as this one below.

2. steps for making a variable are:
·on the Scripts tab click Data block.
·Click Make a Variable. In the New Variable dialog box type in Jump. select “For this sprite only” and click OK.

·the resulting blocks appear as shown in picture 10.13 from which you can pick what you want.

3. the scripts that can make John-sprite hide when touching blue color are in block 13.

10.4 Commands for sprite manipulations
there are a number of commands in scratch, which you can use to make your game interesting. Most of the commands below have been used in our activities. You should learn more of what they exactly do. Also practice on locating them quickly when needed.
1. Color () is Touching ()?: this is a condition for checking if a color (represented by first brackets) on the sprite is touching a specific color (represented by the second brackets).
2. Repeat Unit l:this is a loop that will stop once the condition is true.
3. Change () by (): this script changes the specified variable by the amount.
4. Key () Pressed?: this is a condition for checking if the specified key (represented by brackets) is being pressed.
5. Touching ()?: this is a condition for checking if the sprite is touching the mouse-pointer or another sprite (represented by the brackets).
6. Touching Color ()?: this is a condition for checking if the sprite is touching a specific color represented by brackets.
7. Switch Costume to ():this block changes the sprite’s costume to the specified one (represented by brackets).
8. Switch Backdrop to (): this changes the stage’s costume/backdrop to the specified one (represented by brackets).
9. Switch Backdrop to () and wait: this block is for stage only, it waits until all of the hat blocks triggered by this have completed.
10. Next Costume: this block changes the sprite’s costume to the next one in the costume list.
11. Next Backdrop:this changes the stage’s costume/backdrop to the next one in the costume list.
10.5 Sample controls
there are a number of controls in scratch and some of them include the following:
1. Repeat (): this is a loop that repeats the specified amount of times.
2. Forever: this is a loop that will never end.
3. If () Then:this block checks the condition so that if the condition is true, the blocks inside it (represented by brackets) will activate.
4. If () Then, Else: this block checks the condition so that if the condition is true, the blocks inside the first C will activate and if the condition is false, the blocks inside the second C will activate.
5. Move () Steps: this block moves the sprite forward the amount of steps (represented by brackets) in the direction the sprite is facing.
6. Turn () Degrees (Clockwise): this block turns the sprite (clockwise) the specified amount (represented by brackets).
7. Turn () Degrees (Counter-clockwise): this block turns the sprite (counter-clockwise) the specified amount (typed in brackets).
8. Point in Direction (): this block points the sprite in the direction you specify.
9. Point Towards (): this block points the sprite towards the mouse-pointer or another sprite.
10. Go to X: () Y: (): this sprite moves the sprite to the specified X and Y position.
11. Go to (): this block moves the sprite to the mouse-pointer or another sprite.
12. Touching ()?: this is a condition for checking if the sprite is touching the mouse-pointer or another sprite.
13. Show: shows the sprite.
14. Hide: Hides the sprite.
15. Set () to (): sets the specified variable to the amount.
16. Change () by (): Changes the specified variable by the amount.
17. Show Variable (): shows the variable’s stage Monitor.
18. Hide Variable (): Hides the variable’s stage Monitor.
Note: Try to use most of these block sprites in your games.
End of Unit 10 Assessment
1. Use Internet facility and explore millions of scratch projects that other scratch users have shared. Look inside and see how they work and then learn from them.
Note: Since playing scratch games is fun, make sure you know how the codes used in those projects work and try them. Remix projects or borrow scripts and graphics from them but ensure to include credits on the projects page if you are to use other people’s material.
2. a) Design a platform stage (background) similar to the one shown below as lake waters and sky. In the waters there is a shark that eats small fish that you will introduce in the water. name the game file as Danger shark.

b) Introduce in a big fish (shark) with two costumes. Costume1 is biting and costume2 is opening mouth.
c) Apply necessary scripts to make the shark, move up, down, left and right in the waters so as to catch pray but must not move beyond waters upwards.
d) Introduce in 2 small (can be similar or different) fish as prey for the shark. Use similar scripts on each of them. set score variable and time variable. set time at 20 such that if it elapses, the game is over and the player just counts the scores achieved in that time.
e) Design a platform where the game ends (Game over) and show its sprite commands.
f) Apply sound in your scripts such that each time the shark eats a fish it makes sounds.
Glossary
Ad blocking: this is a software technology, which allows for blocking ads before they are loaded by the web browser. that means that you are saving bandwidth and the page is rendered faster within your browser.
Add ons: these are apps that Internet explorer uses to interact with web content like videos and games. toolbars and extensions are also types of add-ons.
App:A program written mainly for mobile operating system like iOS or Android. Apps are usually games, utilities, or suites.
Application:A program that turns your computer into a specific tool, such as a word processor, photo editor, or browser.
Axis Title:this is text that identifies plotted data on x or y- axis.
Browser extension:software that modifies the interface and/or behavior of web browser e.g. add-on.
Chart Title:this is text that identifies the purpose of the chart.
Content-control software (content filtering):this is computer software designed to restrict or control the content a reader is authorized to access, especially when utilized to restrict material delivered over the Internet via the Web, e-mail, or other means e.g. ad blocker.
Data point:this is a value in data series.
Data range:this is a block of cells that provides data to be used to create a chart/graph.
Data series:this is a range of data that comprises of a bar, column, line or pie slice.
Data source: this is a named source of data usually a DBMS file.
Document Protection: this is to safeguard or preserve a document from damage or misuse.
Download:this means copying files from a remote computer to your computer using a modem or network connection. For example, you can download files from the web to your hard disk.
Downloading:this is a process of transferring information (copying) from a remote computer to your computer.
File system:this is the overall arrangement in which files are named, stored and organized by the operating system, for example, Windows 8 uses NTFS file system.
Grid lines:these are horizontal and vertical lines that help the reader to determine data values in a chart.
Install:this is to copy a program on to your computer for use. e.g. you can install operating system on your computer and Microsoft office applications after and then use them do perform tasks.
Legend:this is a feature that connects colors and patterns in a chart with the data they represent. the legend acts as the key that explains what each color or pattern in the chart means.
Open source operating system: this is an operating system that anybody is freely licensed to use, copy, study and change e.g. Linux is a Free and open source software (Foss); this means, anybody can use Linux operating system in any way he/she wants. the source code is openly shared such that people are encouraged to voluntarily improve its design. Chrome OS is also open source.
Photography: this is the method of producing procedures with camera. It is a profession or hobby of taking photographs, developing and printing/processing the images.
Plug-in (or Add-on) and Add-in:these are simple extensions that extend the usability of the program such as Internet explorer or Mozilla Firefox.
Printing:this is the action of producing text or graphics on paper or another medium by a Printing machine.
Source code:this is a computer code used by programmers to write a program and it is human readable.
Suite:A collection of applications or utilities sold for a single price, and having a single or similar user interface. these include both application suites (Microsoft office), and utility suites (Norton Internet security).
Typography:this is the art and craft of designing typefaces and organizing for display.
Uploading: this is the process of sending or transferring data or programs, usually from a peripheral computer to a central often remote computer.
Utility:A program that either protects the computer or makes it faster, more reliable, or easier to use.
Video game accessory:this is a piece of hardware used in conjunction with a video game console for playing video games.