Unit 1: MAP WORK INTERPRETATION
Key unit competency
At the end of this unit, you should be able to demonstrate how to measure distance and area on a map.Introduction
Activity 1.1
Draw a sketch map of your school compound on a squared piece of paper.
a)List the main things that you will include on your sketch.
b)Explain how you will represent major features such as classrooms, the staffroom, playing ground, toilets and the gate on your sketch.Include all the elements of a good map on your sketch, that is, the key, scale, frame, title and compass direction.
The activity above shows that you can use a map of your school to:
• Show the location of major features on the ground.
• Give direction and bearing from one point to another.
• Estimate the distance between one place to another.
Using the sketch you have drawn, show your classmate how a person can move from the gate to the staff room, from your class to the playing ground and from the car park to the toilets.
You will realise that you can also help a person to tell the direction from one point to another as well as bearing.
We are now going to discuss the following sections with the aid of a map:
• Location of places and features on maps
• Direction and bearing
• Use of grid references
• Measuring distances and areas on a map
• Description of relief on a map
1.1 Location of places and features on maps
It is also possible to tell the location of places and features on a map, the same way it is possible to do so using the sketch map you drew in Activity 1.1.
In Senior One, you learnt about the good qualities of a map. You mention five elements, one of them being a compass point. What were the other elements of a map?
Activity 1.2
In pairs, study carefully the following map then answer the questions that follow: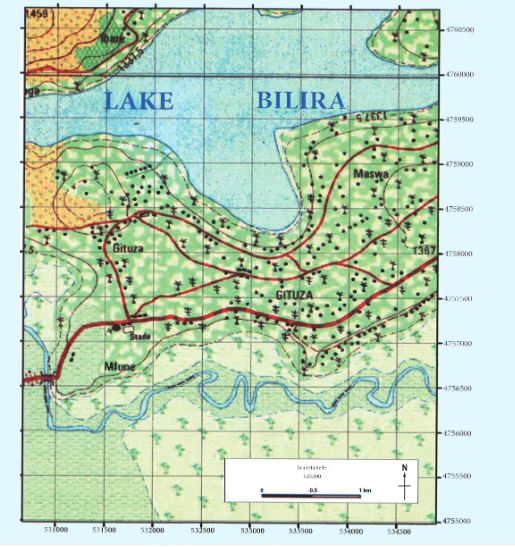
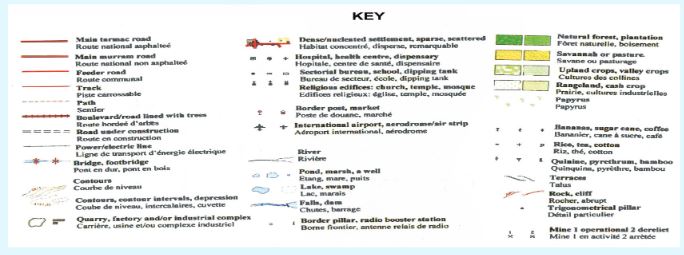
1.Using the key provided, identify the main features shown on the map.
2.If you were near Maswa, how would you describe the location of the Stade near Mfune.
3.Redraw the compass given on the map to have eight points. Use your new compass for this activity.If the bridge on the river is described as being on the south western part of the map, give a description to show the position of the plantation at Ibare.
4.From Lake Bilira on the northern part of the map, give the direction of the Papyrus swamp.
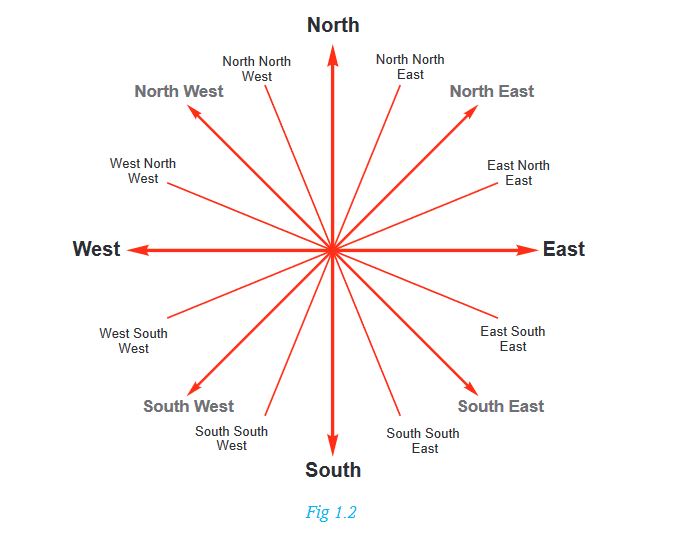
The activity above details how to give direction on a map using a compass. The compass points you have drawn above can further be divided into sixteen points as shown below.
1.2 Direction and bearing
On a map, direction is the description of a place in relation to another known point by use of a compass.
a) How to find direction on a map
To find direction on a map, follow these steps:
-Identify the two points in question.
-Draw a line joining the two points.
-Draw a compass with the four cardinal points on the point where you are told ‘from’.
-Draw a horizontal line on that point showing east and west direction.
-Use the compass drawn to determine direction.
Activity 1.3
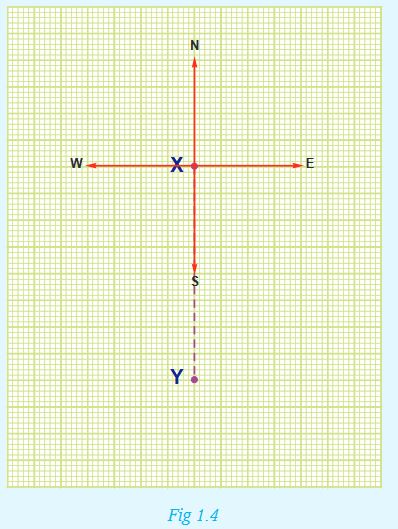
1. Use the following steps to identify the direction of Y from X as shown in the diagram below.
Steps
i) Draw a compass with four cardinal points through point X. Label the lines with compass directions, that is, North (N), South (S), East (E) and West (W).
ii) Draw lines joining X and Y.
iii) Starting from North, move clockwise until you reach the line joining X and Y.
iv) You will realise that Y is to the South of X.
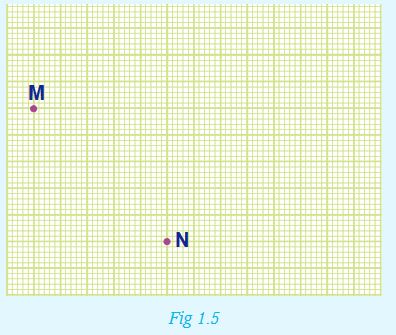
2. Use the steps detailed above to give the direction of point M from point N on the diagram below.
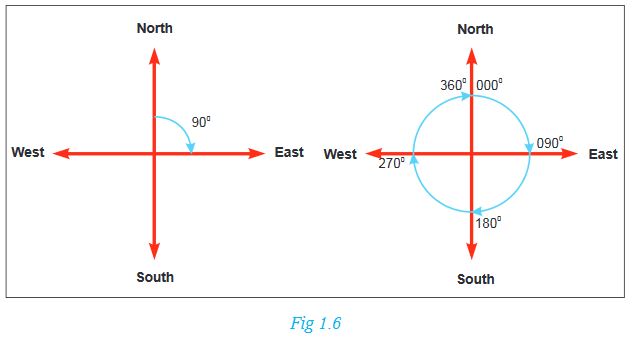
Bearing
Bearing is the direction measured as an angle and given in degrees. Bearing is read in a clockwise direction from the north line as shown below.
Activity 1.4
1.Use the following steps to determine the bearing of point A from B shown in the figure below.
- Identify the two points, in this case given as A and B.
- Mark the two places with a pencil.
- Join the two places with a straight line.
- At the point where the bearing is required, draw a line running through the point from north to south.
- Place a protractor on the point where bearing is required. Read the angle in a clockwise direction from the North line.
- Read the angle where the protractor touches the drawn line that connected two points. This angle should be stated in three digits. Say if it is 45º, write 045º
2.The following diagram shows the bearing of point C from D. Using a protractor, measure the angle indicated by the red line and give the correct bearing of point C from D.
Points to note
- All places to the East of the North-South line have bearings of between 0º to 180º. Those to the West of the same line have bearings of between 180º to 360º.
- The North has a bearing of 360º or 0º.
- Bearing is stated in three figures, such as 000º , 075º or 250º.
Activity 1.5
Study the diagram below then answer the questions that follow:
1.Determine the direction of point Z from X.
2.Use the following steps to determine the bearing of point X from Z.
• Draw a line to join points X and Z.
• Draw a compass at point Z.
• Measure using a protractor the angle between the North and line XZ.
• Measure clockwise from North, up to line XZ.
1.3 Use of grid references
Grid reference method involves the use of grid lines. Grid lines are the vertical and horizontal lines which are printed on topographical maps.
Activity 1.6
Create your own graph with gridlines
Get a graph paper, on it draw a rectangle that is 18 cm long and 14 cm inside. Use an interval of 2 cm to draw vertical lines using a red pen and horizontal lines using a blue pen.The resultant drawing will look like a mesh wire with square boxes. These are called grid squares. Keep the graph paper for the next activity.
The lines you drew above are similar to those that make a system of small squares on survey maps. However, these grid lines should not be mistaken with the latitudes and longitudes.
The vertical lines you drew using the red marker pen, when shown on a survey map, represent Eastings. They are called Eastings because they are usually numbered eastwards.
The horizontal lines you drew using the blue marker pen, when shown on a survey map, represent Northings. They are called Northings because they are usually numbered northwards.
Giving the four figure grid reference
Activity 1.7
Use the following procedure to determine the location of point A.
Read and give the figure for the Eastings (vertical grid line) then follow this with the Northings (horizontal grid line). From the grid given below, point A will be recorded as follows: Eastings: 44; Northings: 36. The four figure grid reference is 4436.

1.Using the grid squares above, state the four figure grid reference of points B to F.
2.On the graph paper you drew the grid, mark at random points X where two grid lines intersect.Give the four figure grid reference of point X you have marked on your grid.
Note: All points within a square have the same four figure grid reference.
Giving the six figure grid reference
Activity 1.8
Use the following procedure to give the six figure grid reference of point N from the grid given below.
- Write down the easting, which in this case is 52.
- Subdivide the easting between 52 and 53 into ten equal parts.
- Write the value of N from the easting out of the ten subdivisions, which is 7.This figure forms the third digit for the easting.The easting for this point therefore is 527.
- Write down the Northing which is 34.
- Subdivide the distance between northing 34 and 35 into ten equal parts.
- Write down the value of the northing out of the ten subdivisions, which is 7. This figure forms the third digit for the northing.The northing for this point therefore is 347.•The six figure grid reference for point N therefore will be 527347.
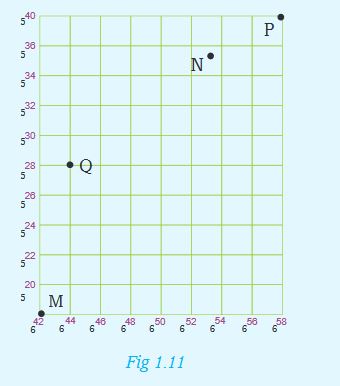
1.Using the grid squares above,state the four figure grid reference of points M,Q and P.
2.On the graph you drew on the graph paper, mark all the Eastings and Northings with two-digit numbers. Within the graph, mark at random points J and K.Give the six figure grid reference of the points you have marked on your grid.
1.4 Measuring distances and areas on a map
To measure distance and calculate area on a map, we use a scale and grid boxes.
Activity 1.9
From the knowledge gained in Senior One when studying elements of a good map:1. Define a scale.2. Identify the types of scales used on maps.In order to understand this section well,let us first handle the measurement of distances. Since maps are usually representations of a bigger area on a small piece of paper, then to know the distance between two places on the actual ground is indeed crucial.What should be noted here is that there are distances of straight lines and those of curved lines.Measuring distance of straight lines
The features with straight edges include runways, sections of some roads, football grounds, rectangular water dams and others. Distances of such features can be measured using:
• A pair of dividers
• A straight edge of a piece of paper
• A ruler
a) How to use a pair of dividers
Mark the starting and end points on the distance asked to be measured on the map.
Join the two points with a straight line using a ruler and a pencil. Open your pair of dividers to a convenient unit on the scale as shown below.
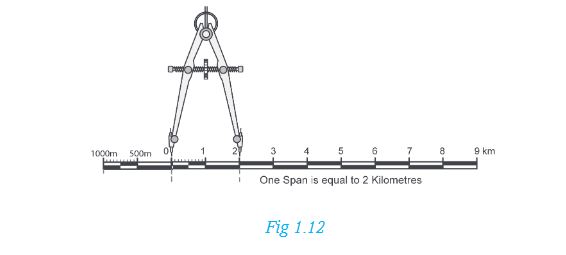
Rotate the pair of dividers along the line. Make sure you count the number of rotations.
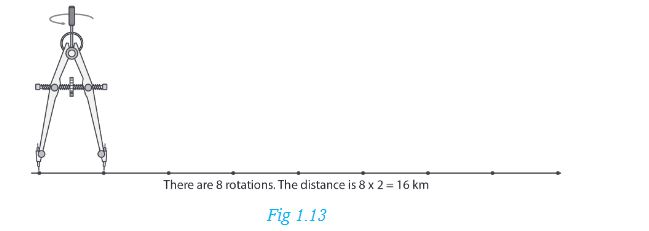
Multiply the number of rotations with the distance of the span.
b) How to use a straight edge of a paper
• Mark and join the starting and end points on the map using a pencil and a ruler.
• Place the straight edge of a paper along the required distance of a straight line.
• Mark on the paper the start and end points of the required distance.
• Transfer your marked paper to the linear scale and read off the distance as it appears on the actual ground.
c) How to use a ruler
• Mark both starting and end points on the map.
• Draw a line joining the two points using a pencil and a ruler.
• Use the centimetre side to read the measurement.
• Use the scale to obtain the actual distance on the ground.
Activity 1.10
Measure the distance of the murram road from the tarmac road to the church on the map given on page 4:
1. Using a straight edge of a paper.
2. Using a ruler.Use the scale: 1 centimetre represents one kilometre.
3. Compare your answers with that of your classmate. Discuss how you arrived at your answers.
Measuring distance of curved lines
Some of the features on the earth’s surface are irregular and curvy. With curving features, sections of such a feature have to be measured in patches. Thereafter, the lengths are added together and the overall distance is obtained.
To measure their distances, we can use:
a) a non-elastic cotton thread.
b) a straight edge of paper.
a) How to use a cotton thread
This is a method that is used to measure curved distances on a map such as roads, rivers or railway lines. Steps to be followed:
1.Identify and label the two points of the feature that will be measured, for example, A and B.
2.Tie a knot at the end of the string then place it at point A then align the string along the curved line up to point B.
3.Mark the end point then transfer it to the linear scale and read the distance on the linear scale.
Remember to express the results in ground distance such as kilometres or metres.

b) How to use a straight edge of a paper
This is another method of measuring curved distances.Identify and mark the two points of the feature that will be measured, for example, X and Y.
Take a strip of paper with a straight edge and mark X along the edge of the paper.Align the strip of paper along the distance you want to measure as shown below.
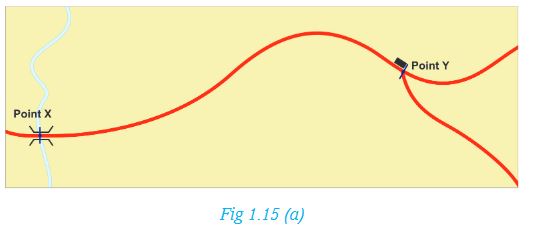


Move the paper carefully along the river, road or railway line, marking off the straight edges up to point Y. Take the marked paper and place it on the linear scale. Point X should be placed at 0 km. Read the distance as shown in Fig 1.15(e).
Activity 1.11
Measure the distance of the road between grid reference 764790 and 790850.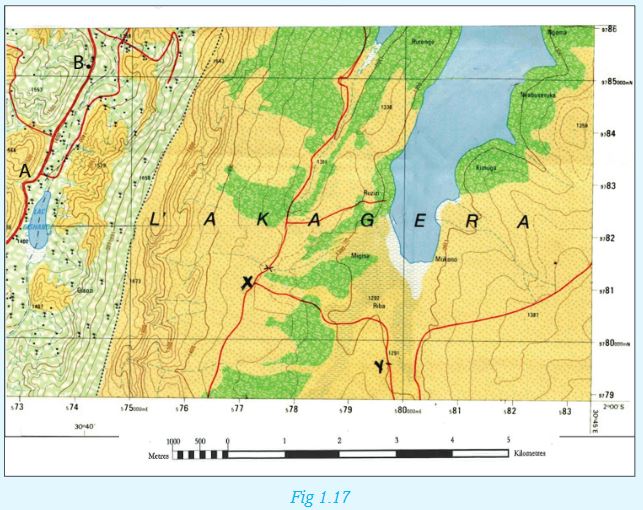
Measuring areas on a map
Areas with regular shapes
The areas on a map with regular shapes are calculated using mathematical formulae.
Activity 1.12
Write down the mathematical formulae used to calculate the area of:•A square •A rectangle •A triangle•A trapezium •A circleAreas with irregular shapes
Most natural features such as lakes and forests have irregular shapes. To calculate their areas, we use the grid square method.
The following steps should be followed:
Divide the map into equal squares with the help of eastings and northings. Each square will represent 1 km2(one square kilometre).
Mark out and count the complete squares covered by the irregular surfaces.
Mark out and count the squares which are not fully covered. Take the total number of the incomplete squares and divide them by two.
Add the number of the complete squares to the answer you got after dividing the total number of the incomplete squares with two.The figure you get is the area of the irregular surface. Give your answer in km2.
Activity 1.13
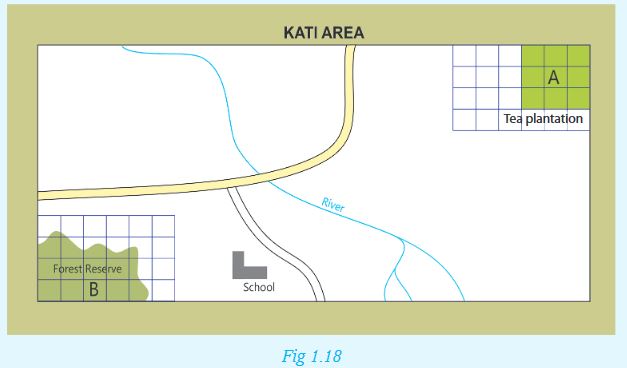
Calculate the area covered by the forest reserve on the sketch map of Kati Area.
1.5 Description of relief on a map
Relief refers to the general physical appearance of the landscape. It includes all the physical features found on the earth’s surface. Therefore, a map shows a number of selected physical and human features and their exact positions on the earth’s surface.
The relief features that can be shown on a map include:
•Hills •Mountains •Plains
•Valleys •Plateaus
The various relief features that can be shown on a map are usually represented by use of:
a) Colours c) Trigonometric stations
b) Contours d) Spot heights
Each of these is as explained below.
i) Use of colours
Relief can be represented on a map by use of colour. The following are features and colours used to represent them.
• Mountains–Purple
• Hills and uplands–Brown
• Mountaintops-White
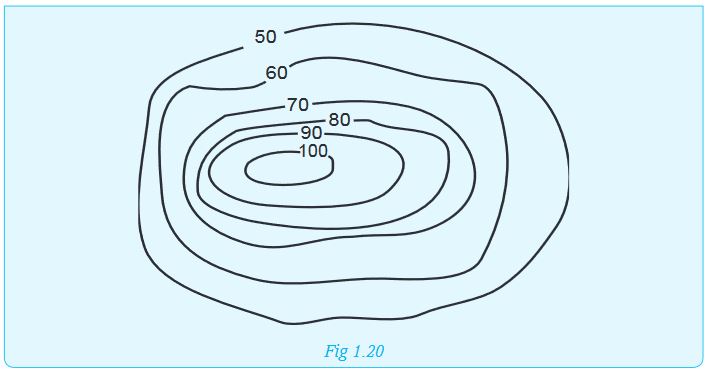
ii) Use of contours
Contours are lines drawn on a map to join areas with the same height above sea level. They show height and shape of relief features such as hills, valleys, slopes and ridges. Contour lines that are drawn close together depict a steep slope while those that are widely spaced depict plateaus and plains. Contours are measured in metres. Differences in height between two successive contours is referred to as vertical interval or contour interval.
iii) Trigonometric stations
A trigonometric station is a point represented on a map by a triangle or circle with a dot at the centre. In some cases, trigonometric stations on maps are represented as triangular drawings with the height above the sea level indicated below them. Trigonometric stations on maps usually appear in areas that are highlands. These places include mountains, hills and mountain ranges.
A trigonometric station usually indicates a fixed surveying station used in surveying.
iv) Spot heights
A spot height is an exact altitude of a point on a map. The height of the area is recorded next the spot height.
Activity 1.14
1. Relief is the general physical appearance of the landscape. Identify and explain:
a) Some of the relief features that can be shown on a topographical map.
b) How colour can be used to show relief on topographical maps.
2. Using the following map extracts, give the height above sea level basing on the following indicators of relief:
• Trigonometric stations
• Spot heights
• Contour lines
Map of Rutonde (Part of Rwamagana Survey map)

1. Contour interval is the difference in height between two successive contours. Study the following illustration showing arrangement of contours on a certain landscape and calculate its contour interval.
END OF UNIT REVISION EXERCISE
1.(a) Explain the procedure followed while finding the bearing of one point from another.
(b) Using the procedure you have given in question (a) above,find the bearing of point F from G in the diagram below.

2.Briefly write notes on the meaning of grid references.
3.Define the following terms:
a) Relief
b) Contours
c) Contour interval
d) Trigonometric station
4.Find out how important a spot height is to a map reader. Make short notes from your findings
- Geography S2 SB File Modified 3/11/21, 16:46