Topic outline
General
- ICT S2 SB File Uploaded 24/01/22, 15:32
Unit 1:Data Protection
Key Unit Competency: By the end of this unit, you should be able to:
Use computers safely and securely to ensure that data is protected.
Introduction
Data is the plural form of the word datum. In modern usage, the word data is accepted when expressed either in singular and plural form. Data refers to a collection of numbers, characters, and symbols which are held in a computer. Data are usually represented in units of eight bits, which are called bytes.
Data protection is defined as the process of safeguarding data from corruption, loss, or unauthorised access. All forms of data are considered assets for an organisation or an institution.
1.1 Protect the Computer
In any organisation or institution, it is always necessary to think about the security of computers, as well as the data and information stored in them. Security should be ensured for both computer software and hardware.
It is essential to take measures to protect the computer from threats such as unauthorised access. Persons who gain unauthorised access to a computer system pose a great threat to any institution.
A computer system can be protected from security threats by assigning every authorised person user privileges or passwords in order to access it. In this case, every authorised user would have to log into the system. Every user’s history of activities can be tracked if the system is carefully inspected.
1.1.1 User Privilege
A computer requires the configuration of certain control measures to ensure that privacy is maintained. This also ensures that personal data or information in the computer is secured.
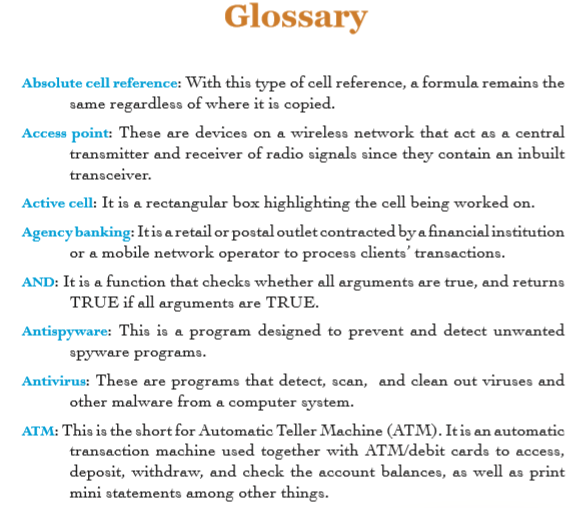
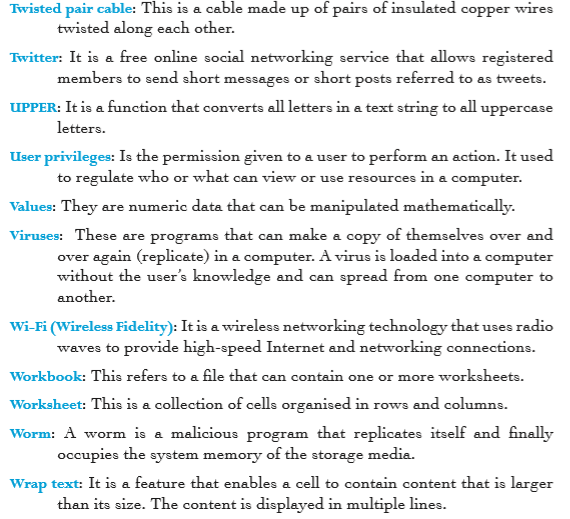
Every user of the computer can have an account created for their use, each account with different privileges. User privilege is the permission given to a user to perform an action. It is used to regulate who can view or use the resources in a computer.
In order to access a computer, the user requires some form of identification and authentication. Identification refers to the process of a proving one’s identity. Authentication refers to the process of verifying the identity of a user.
For the identification process, the computer system first verifies that the user has a valid user account. The process then requires a confirmation of the validity by use of a password if one had been set. The computer maintains an internal list of valid user accounts and a corresponding set of access privileges for each account.
An account can either be an Administrator or Standard user (Guest) in Windows operating system.
• Administrator: This is a user that has superior privileges. Administrators can make changes to the accounts of other users such as changing the security settings, installing software and hardware, as well as accessing and modifying all files on the computer.
• Standard user (Guest): This is a user account that allows people to have temporary or limited access to a computer. People with this type of account can use most of the software installed. They can also change the system settings that do not affect other users or the security of the computer. Standard users cannot, however, install software or hardware, or create passwords.Procedure for creating a user account
Practice Activity 1.1: Creating a user account
(i) Click the Start button.
(ii) Select All Apps from the Start menu.
(iii) Click on Settings then select Accounts icon. A dialog box appears.
(iv) Click on Family & other users in the left pane.
(v) Select Add someone else to this PC in the right pane as shown in Figure. 1.1.
(vi) Type the details of the user in the window displayed then click the Next button as shown in Figure 1.2.
(vii) The account is automatically created. The account is given a default account type of Standard. To change to Administrator account type do the following:
(viii) Click on the account in the right pane of the Accounts window. A dialog box is displayed as shown in Figure 1.3.
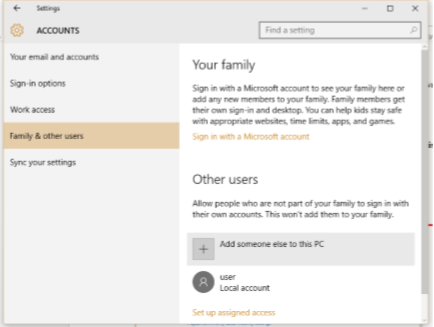
Figure 1.1: Accounts window
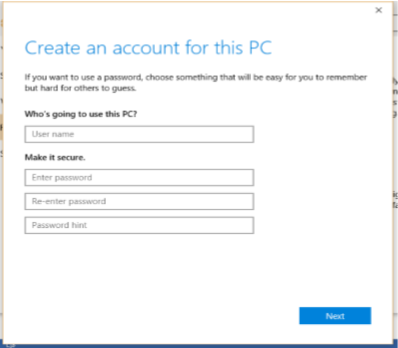
Figure 1.2: User Accounts window
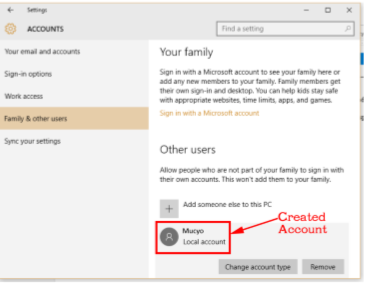
Figure 1.3: The Manage Account dialog box
(ix) Select Change account type button. The dialog box in Figure 1.4 appears.
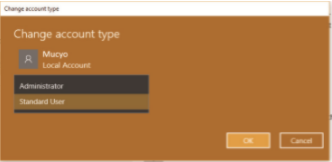
Figure 1.4: The Change account type dialog box
(x) Click on the box written Standard User. Select Administrator. Click OK.
Switch between users without logging off
If a computer has more than one user account, it is possible to change from one user account to another without logging off the Active user account. To switch between users, do the following:
Method 1: Using the Start Menu
(i) Click the Start Menu and then click on Switch User command.
(ii) Select the desired user account.
Method 2: Using the Keyboard Shortcut
(i) Press Ctrl+Alt+Delete and then click on Switch User command.
(ii) Select the desired user account.
Method 3: Using the Shut Down dialogue box
(i) Open the Shut Down Windows dialogue by pressing Alt+F4.
(ii) Click the down arrow. Choose Switch user in the list and click OK.
Note: You can also use a shortcut to switch user through the Ctrl+Alt+Delete options.
Press Ctrl+Alt+Delete on the keyboard, and then select Switch user in the options.
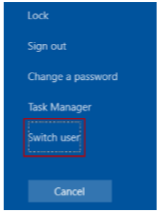
Figure 1.5: Switching user dialog box
Method 4: Using the User Icon
(i) Click the Start button on the desktop.
(ii) Click the User icon on the top-left corner in the Start Menu.
(iii) Select the desired user account such as Guest from the menu displayed.

Figure 1.6: Switching the user account icon
Practice Activity 1.2: Switching the user account
Practice how to switch accounts using various methods.
1.1.2 Passwords
The most common method of protecting a computer against any intruder is to set up user accounts with usernames and passwords. Access to the computer is, therefore, denied to anyone who not have the username and the password.
A password is a secret code used to prevent unauthorised access to a computer hardware, software, as well as the data and information stored in the computer. A password provides the user with authority to access information in a computer.
A good password should be strong and easy to remember; but it should be difficult for a hacker to guess. A hacker tries to access an account in a computer without permission. The following are characteristics of a strong password:
(i) It should have at least eight (8) characters.
(ii) It should contain a combination of uppercase and lowercase letters. It should also have numbers and symbols if they are allowed. An example of a strong password is: Nkosi%88#
(i) It should be changed frequently, for example, after every one month.
Tips for creating a strong password
A good and easy method of creating a strong password is as follows:
(i) Think of a phrase that you can easily remember. To create a strong password, the phrase should have at least eight words. For example: I Am Smart And I Work Very Hard.
Practice Activity 1.3(a)Write down a phrase that you can easily remember. The phrase should have at least eight words.
(ii) Take the first letter of each word. In our example (I Am Smart And I Work Very Hard) the letters are IASAIWVH.
Practice Activity 1.3(b)
Now write down the first letters of each of the words in the phrase you wrote down in Part (i) above.
(iii) Choose some letters and change them to numbers that match in shape. For example, you could change the letter I to number 1, and the letter S to number 5. In our example, this change will result in: 1A5A1WVH.
Practice Activity 1.3(c)
Now change some letters to numbers that you consider to be similar in shape as we have done in Part (iii) above.
(iv) Change some letters to lowercase. For example, the letters that are the same, and the last letter. In our example it is letters A and H. The resulting password is: 1a5a1WVh
Practice Activity 1.3(d)
Now change some letters to lower case and write down your resulting password.
Procedure for creating a password using windows
(i) Click the Start button. Select All Apps from the Start menu.
(ii) Click on Settings then select Accounts icon. A dialog box appears.
(iii) Click on Sign-in options in the left pane.
(iv) Click on Change button in the right pane under Password as shown below.
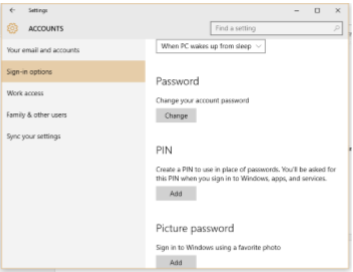
Figure 1.7: Managing sign-in options
Note that not every computer user has privileges for creating accounts and passwords.
Procedure for changing the password
(i) Type the current password in the window provided as shown in Figure 1.8, then click Next.
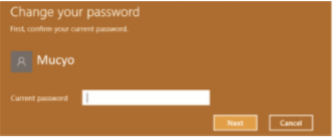
Figure 1.8: The dialog box used for changing the user’s password.
(ii) Type the new password and re-type it again in the window provided as shown in Figure 1.9, then click Next.

Figure 1.9: Make changes to your password.
(iii) Enter a new password in the New Password box. Re-type the password in the Reenter password box.
(iv) Type a hint in the Password hint box. The hint is displayed when you cannot remember the password.
(v) Click the Next command. A final dialog box is displayed. Click on Finish as shown in Figure 1.10.
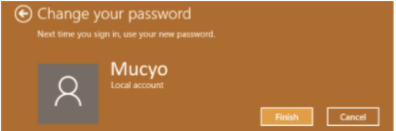
Figure 1.10: The final step in changing the password
Why do you need to change your password?
• It is advisable to change one’s password every few months for security reasons. Sometimes you may forget to log out of your account in a computer that is used by several people. In this case, someone may find your account open and gain access to your data.
• If someone gets to know your username and password, he or she could log into your computer and change, delete, or corrupt your files.
• If someone gets to know your username and password, he or she could log into your computer and share your files with other users.
Practice Activity 1.4: Creating and changing passwords
Practice to do the following on your PC:
(i) Create three possible strong passwords.
(ii) Change the passwords.
Setting user privileges(i) Click the Start Menu. Select Settings. Click Accounts.
(ii) Select Family & other users. Click “Add someone else to this PC.”
(iii) Select “I don’t have this person’s sign-in information.” Select “Add a user without a Microsoft account.” Enter a username.
(iv) Type the account’s password twice, enter a clue, and select Next.
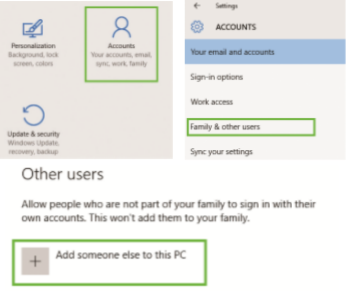
Figure 1.11: Setting user privileges
Allow and block specific programs in Windows 10
When an account is created in Windows 10, the user privileges are automatically defined with the type of account that has been created. It could either be a standard or an administrator’s account.The administrator account has more privileges than the standard account. The administrator is able to allow and block specific programs.
To do this, follow these steps:
(i) Double click on This PC icon on the desktop.
(ii) Open the drive where the application files are located, for example, C:
(iii) Open the Program files folder.
(iv) Right-click on the specific application file and select Properties.
(v) Click on the Security tab of the window.
(vi) Click on the User profile name to allow or deny access to the user under Group or User names.
(vii) Click on the Edit button and give permissions to the user profile accordingly.
(viii) Click Apply then OK.
(ix) Close the window and check if the changes are effective.

Figure 1.12: Allowing and blocking users from accessing specific programs
Practice Activity 1.5: Setting user privilege accounts
Practice to allow and block users from using specific programs in Windows10.
Revision Activity 1.1
Part A: Fill in the missing words with the correct answers
1. A computer is protected by setting up user accounts with................................................ and....................
2.............................................................. is the permission given to a computer user to perform an action.
3.............................................................. is a secret code used to prevent unauthorised access to a computer, data, and software.
4.One who gains unauthorised access to a computer system is a .................................................................
5. A strong password should have at least ............................................. characters................................
Part B: Answer these questions
1. Define the term “data protection”.
2. Explain the meaning of these terms: (a) User privileges (b) Password
3. Identify the two types of password accounts.
4.Outline the procedure for setting up any one of the password accounts named in Question 3 above.
Part C: Do the following:
(i) Create two new user accounts on your computer; one for the Administrator and another for a Standard User.
(ii) For both accounts, set strong passwords.
1.2 Harmful Programs
1.2.1 Definition
The term harmful program refers to software that interferes or poses security problems to the computer hardware, software, data, and information.
1.2.2. Categories of Harmful Programs
Another name for harmful programs is malware (malicious software), which refers to software which is specifically designed to gain access or damage a computer without the user’s knowledge. Malware (harmful programs) affect the smooth running of a computer system or carry out illegal activities such as collecting information from unknown users.
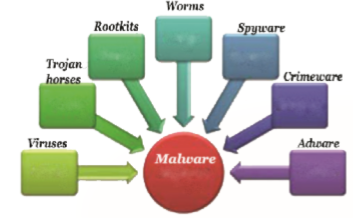
Figure 1.13: Categories of harmful programs
Malware can take the form of forced advertising (adware), stealing sensitive data (spyware), facilitating illegal activities (crimeware), or spreading e-mail (spam).
among others. The categories of harmful programs include the following: viruses, worms, Trojan horses, rootkits, spyware, crimeware, and adware. The discussions that follow explain the various types of harmful programs:
Viruses
• A virus is a program that makes a copy of itself over and over again in a computer. This is called replicating. Some examples of computer viruses are program viruses, file viruses, boot sector viruses, and hoax viruses.
• A virus is loaded into a computer without the user’s knowledge. It can spread from one computer to another.
• It inserts copies of itself into other computer programs, data files, or the boot sector of the hard disk thereby erasing or altering computer files, filling computer memory, or making the computer fail to function.
Worms
• A worm is a malicious program that replicates itself and finally occupies the system memory of the storage media. Worms use the network to duplicate.
• A worm does not alter files. It resides in the active memory and duplicates itself.
• Worms are only noticed when they occupy a lot of space in memory, thereby slowing or halting tasks during processing.
Trojan Horses
• A Trojan horse is a harmful program that disguises itself as genuine software. An unsuspecting user is tricked into downloading and running it on his or her computer system.
• After it is activated, it can irritate the user by popping up windows or changing the desktop, deleting files, stealing data, or activating and spreading other malware.
• Trojan horses are also known for creating back doors to give malicious users access to the computer system.
•Trojan horses do not replicate like worms and viruses; instead they spread through user interaction such as opening an e-mail attachment or downloading and running a file from the Internet.
•Trojan horses can be used to gain access to a computer system. For example, a user can be tricked to download what he or she thinks is a game. Once it is downloaded and runs on the computer, it deletes files in the hard disk. It can also copy and send the saved password to another person through an email.
Rootkit
• A rootkit is a collection of malicious programs designed to a computer or areas of its software and hide there. It may also hide the existence of other malicious programs. A rootkit hides the fact that an operating system of a computer has been compromised. It does so sometimes by replacing important executable files in the system.
•A rootkit is activated even before an operating system boots up therefore it is difficult to detect.
•Rootkits themselves are not harmful. They are used to hide viruses, worms and other harmful programs by disguising them as necessary files that your anti-virus will overlook.
Spyware
• Spyware is a program that monitors or tracks personal information or Internet activity and sends such information to someone else.
• Spyware can also gather information about e-mail addresses and even passwords or credit card numbers by recording the key strokes entered into a web form.
•Since spyware exists as an independent program, it has the ability to do the following:
® monitor keystrokes;
® scan files on the hard disk;
® spy on other applications such as chat programs or word processors;
® install other spyware;
® read cookies; and
® change the default home page on the web browser.
•Spyware then relays the collected information to the author who uses it for marketing or advertising purposes. Some malicious authors sell the gathered information to another party.
•Sometimes spyware is included along with genuine software. Sometimes it may come from a malicious website.
Crimeware
•Crimeware is a type of harmful software that is designed to carry out or facilitate illegal online activities.
Adware
•Adware is software that automatically displays or downloads advertising material (often unwanted) when the user is browsing the Internet.
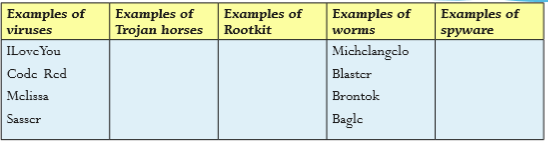
Revision Activity 1.2
Research on examples of names of malware. You could present the examples in a table as shown below. Some examples are given.
1.3 Sources of Viruses
There are many sources of computer viruses. They include the Internet and storage devices or media.
1.3.1 Internet
The following are some sources of computer malware:
• E-mail attachments: A virus can come as a file attached to an e-mail message. This type of virus is known as a hoax. When the file is opened, the virus is activated. This causes damage such as destroying on the hard disk. It may also get forwarded to every contact listed in the address book.
• File sharing: Internet users are able to share or exchange files that are in their individual computers. This, therefore, makes it possible for such computers to be vulnerable to virus infection risks. This is because viruses can be transmitted along with the file to be shared.
• Malicious websites: These are sites that trick the user into giving away information or downloading a virus. They may have a code that finds and exploits weak security points in a computer. If such a site finds a security weakness, it downloads a virus to the computer and installs it without the user knowing. Malicious websites may be associated with malware, viruses, and misleading applications such as antivirus, computer games, or fake codes.
1.3.2 Storage Devices or Media
A common way of spreading viruses among computers is the use of removable storage media. These devices are connected to a computer system through a port or drive. Examples of such devices are flash disks and external hard drives.
Windows Autorun in a computer is a feature that runs automatically when Windows starts. Windows Autorun triggers the virus to run and get transferred to the computer system when a storage device is inserted.
When copying data, the data together with the malware are transferred to the storage medium, for example, a flash disk. When the medium is connected to another computer, the malware is automatically copied to the next computer.
Symptoms of a computer infected by viruses
(i) A computer system takes longer than usual to load programs and carry out other operations.
(ii) Unfamiliar graphics appear on a computer file.
(iii) The drive light of a non-referenced drive comes on without a reason.
(iv) The computer unexpectedly restarts without instruction.
(v) The file size in the computer becomes unusually large.
(vi) The size of Random Access Memory (RAM) may become smaller. Revision Activity 1.3
Part A: Fill in the missing words to complete the sentences
1.Rootkit are harmful programs. They are used to hide.............................................. , and .........................................................
2. ............................................... refers to viruses whose source is e-mail attachments.
3 .....................................................are sites that trick one into giving away information or downloading viruses.
4. A Trojan is a harmful program that disguises itself as......................................... software.
5. Drive light of a non-referenced drive coming on without a reason is an indication of..............................
Part B: Study these questions carefully and give the correct answers1. What is the meaning of the term harmful program?
2. Apart from viruses, identify other categories of harmful programs.
3. A lab technician found out that some of the computers in a school were infected with a computer virus.
(a)Give the symptoms of a virus-infected computer.
(b)What are the measures to protect a computer system from virus attacks?
1.4 Measures to Prevent Harmful Programs
The following measures can be used to prevent harmful programs:
1. Install an antivirus program
An antivirus refers to computer software that is used to prevent, detect, and remove malicious software. Antivirus software is sometimes abbreviated as AV. It is also known as anti-malware software. In a computer installed with an antivirus program, always do the following:
• Keep the antivirus up-to-date at all times. This ensures that the antivirus is able to detect and remove any emerging viruses.
• Scan and detect viruses. To scan means to go through all the parts of the computer system carefully in order to detect the presence of viruses.
• Quarantine infected files and programs to prevent the virus from spreading. To quarantine means to separate the infected files on a computer’s hard disk. Quarantined files are no longer capable of infecting the computer system.
• Delete or remove the files infected with viruses.
• Notify the user in case a virus is detected.
Antivirus programs can be purchased from seller outlets directly or downloaded from the Internet.
It is advisable to install the latest antivirus software in the computers and regularly have it upgraded so that it is able to deal with any new viruses.
Examples of antivirus programs include Microsoft Essentials, Kaspersky, Norton, Bitdefender, WindowsDefender, Avast, Panda, Macfee, and Rising among others. Figure
1.10 shows examples of antivirus programs. Figure 1.14: Some antivirus programs
Practice Activity 1.6: Installing an antivirus program in a computer
Do the following:
(i) Access the Internet.
(ii) Search for an antivirus software you are familiar with.
(iii) Download the installer of the latest version of the antivirus software by clicking the Free Download button. The installer icon will be displayed.
(iv) Right-click the installer and click Run as Administrator.
(v) Click Install.
(vi) The progress bar will indicate when the installation is complete.
(vii) You can now run the antivirus program to protect your computer.
Figure 1.15: Scanning the computer for malicious software
Steps for scanning a flash disk for viruses
A flash disk is an example of a secondary storage medium. Viruses can easily be spread across computers through the use of secondary storage media such as flash disks. It is advisable to always scan a flash disk or any other secondary storage medium for viruses before use. Most antivirus programs automatically run when a medium, for example, the flash disk is inserted in the USB port in the computer.
Practice Activity 1.7: Scanning a flash disk for viruses
To scan a flash disk for viruses, do the following:(i) Insert the flash disk into the USB port.
(ii) Run the antivirus program installed in the computer.
(iii) If there are any security threats, the antivirus displays their details.
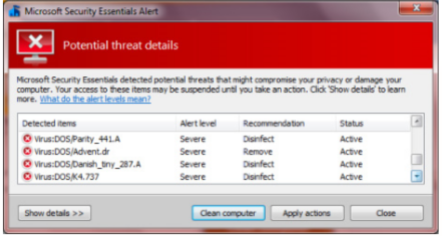
Figure 1.16: Scanning the computer for malicious software
Practice Activity 1.8: Scanning a flash disk for viruses
Do the following:
• Identify the antivirus program installed in your computer.
• Use it to scan a flash disk for viruses.
Note: The use of cloud-based storage service to store and share files and folders is a safe way to avoid the spread of computer viruses through secondary storage devices. Cloud-based services refer to data storage services where data are stored, maintained, managed, and backed up over the Internet.
Examples of cloud-based storage services are Onedrive by Microsoft, Dropbox, and Google Drive by Google. Documents stored in the cloud service can be retrieved from a computer located anywhere in the world as long as there is Internet connectivity.

Figure 1.17: Cloud-based storage services
2. Keep the antivirus software updated
Companies that sell antivirus programs keep updating them. It is important to always keep the antivirus program installed updated at all times. Microsoft always releases security updates that can help protect one’s computer. Always ensure that your operating system is always updated by turning on Windows Automatic update.
3. Install anti-spyware software
This is a type of program designed to prevent and detect unwanted spyware program installations. It also removes those programs that have been installed.
4. Scan emails for viruses
Do not open email attachments unless you are sure of the source. Since computer viruses are often contained in email attachments, scan the attachments for viruses before opening them. Most email services, for example, Google and Yahoo automatically scan emails for viruses before downloading any attachments.
5. Avoiding non-secure sites
The following are some control measures to be observed when dealing with nonsecure websites:
• Avoid visiting sites you are not familiar with. These may be unsecured sites. Such sites promise to have free downloads of games and books.
• Block sites that you do not want the computer to connect to through the browser. Examples are sites that may contain indecent information and graphics.
• Google Chrome tells you if the site you’re trying to visit is dangerous or deceptive.
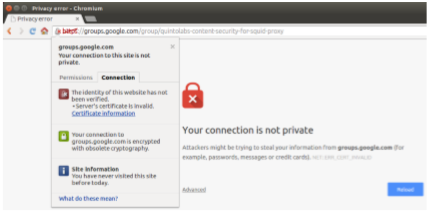
Figure 1.18: Warning on dangerous sites
This is how you turn on warnings about dangerous sites: On your computer, open Chrome. At the top right, click the Chrome button and then Settings.
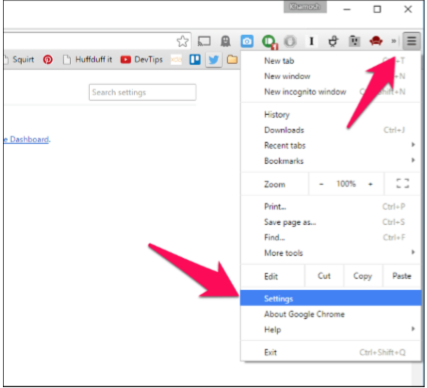
Figure 1.19: Settings in Chrome
At the bottom, click Show advanced settings.

Figure 1.20: Advanced settings in Chromed
Under “Privacy,” check the box next to “Protect you and your device from dangerous sites.” It is recommended that you ensure that the alerts are turned ON at all times.
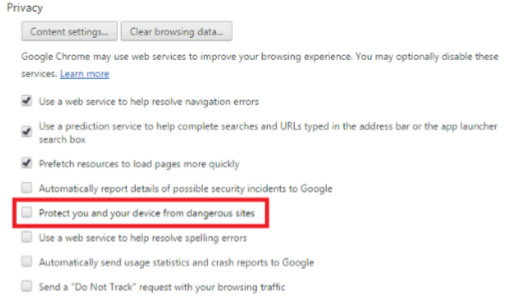
Figure 1.21: Settings for protecting the computer from harmful sites
• Use Windows firewall to block unsecured sites. A firewall is a software program or a piece of hardware that helps to detect and keep out hackers, viruses, and worms that try to reach your computer over the Internet.
• Always avoid sites that have warning of certification. A site’s certificate allows your browser to establish a connection with the site. If your browser warns you of a certification error, it is likely that the website could pose a threat to your computer system.
• Avoid clicking on pop-up sites that appear on the Internet.
6. Other precautionary measures
Other ways of ensuring safety of the data are as follows:
• Use proper cleaning agents to clean the computer hardware including the screen and the keyboard, for example, soft cotton cloth and cleaning solvents available in the market.
• Prepare backups for all the data and documents held on the computer. A back up is a copy of file or any other item of data made in case the original is lost or damaged.
• Compressing files, folders, and programs decreases their size. This then reduces the amount of space they use on the computer drive or removable storage devices. Files that have been stored in a zipped compressed folder can be protected with a password.
Revision Activity 1.4
Part A: Fill in the missing words to complete the sentences:
1. An antivirus software................................................................... infected files to prevent virus spread.
2. Computer viruses are mainly spread through secondary storage devices.......................................... and ................................................. are examples of secondary storage devices.
3. A............................................................ is a set of hardware and or software equipment that is used to prevent hackers from invading private networks.
4. List some examples of antivirus programs:
(a)......................................................
(b)......................................................
(c)......................................................
Part B: Do this exercise
Viruses are a major problem for a computer user. Explain the possible measures to protect computer systems from virus attacks.
Part C: Do the following:
• Install an antivirus in the computer system.
• Use the antivirus software installed in the computer to scan the computer and a flash disk for viruses.
1.5 Definition of Key Words in this Unit
Revision Activity 1.5
Find out the meaning of the words given below. Share your findings with the rest of the students in a class presentation. Check the meanings you find against those provided in the glossary at the end of this course book:
- Data Protection
- User privileges
- Passwords
- Viruses
- Worm
- Spyware
- Trojan
- Rootkit
- Malware
- Internet Antivirus Scan
- Restore
- Firewall
- Piracy Cleaning agent Antispyware
- Backup
- Compressing files
Revision Exercise 1
1. State two reasons why data protection is necessary in an organisation.
2. Differentiate between standard and administrator accounts.
3. State three ways in which an antivirus software can protect a computer system from virus attacks.
4. Differentiate between spyware and adware.
5. Give two sources of computer viruses.
6. State two characteristics of a strong password.
7. State three preventive measures that could be taken to avoid infection from a virus through a secondary storage medium.
8. State one function of a password.
9. While using your e-mail, a pop-up menu could be displayed that could contain a virus. State one method of preventing pop-ups in your web browser.
Files: 4Unit 2:ICT in Financial Transactions
Key Unit Competency: By the end of this unit, you should be able to:
1. Analyze and criticise the role and impact of computing tools financial transactions.
2. Use computing tools in financial transactions.
Introduction
To transact means to conduct or carry out business. Financial transaction refers to an agreement or communication between a buyer and a seller on how to carry out business. They agree on the terms of exchanging goods or services for payment.
ICT as a tool in financial transactions enables the smooth and efficient running of the agreements and payments made between the buyer and the seller.
Practice Activity 2.1: Role of computers in society
Research on the role of computer use in society. Compile a report. Make a presentation in class.
2.1 The Role of Computers in Financial Transactions
Computers are important tools in all financial transactions. Computers are used to automate business operations, for record keeping, and for the stock exchange.
2.1.1 Automated Operations
Automation is the process of using computers and information technology to produce products and offer services with minimal human involvement. Some examples of automated operations include automated accounting, automated mailing, and Electronic Data Interchange (EDI).
1. Automated Accounting
• Automated accounting refers to the process of maintaining up-to-date accounting records using accounting software.
• Accounting software allows easy cross-posting of accounting records.
• Most of the readily available automated accounting systems can be customised to suit the needs of the company that purchases the software. This makes it possible to create customised reports.
• Many organisations in Rwanda use accounting software. With this type of software, an organisation is able to administer and manage the income, expenses, and assets, as well as maximize the profits and ensure sustainability.
• The Unstructured Supplementary Service Data (USSD). USSD is the short for Unstructured Supplementary Service Data. This is a technology that is used for communication.
® The USSD is a system for mobile telephony that enables a mobile user to send text between a mobile phone and an application program in the computer network of the service provider.
® Examples of USSD applications may include prepaid call back services, mobile money services, and mobile chatting.
® USSD services allow a two-way exchange of data
® When the mobile user sends a message to the phone company network, it is received by a computer that gives USSD services. The computer gives a response that is sent back to the phone. The message is displayed on the phone screen. The service provider determines the format of the messages that are sent over USSD to their customers.
Using the USSD
(i) The user sends a request to the network via USSD by dialing the number such as *182# or *131#.
(ii) This message is received by the computer in the service provider’s network that processes USSD requests.
(iii) The USSD may have a reply for the user with a number of options and ask the user to select, for example, *182#. The USSD may reply with acknowledgement message such as: “Thank you for your request. Your message is now being processed. A reply will be sent to your phone.”
Practice Activity 2.2: Types of financial technologies and their use
1. Identify USSD codes available locally and frequently used in Rwanda. Practise to use each USSD code.
2. Find out some examples of software in financial transactions commonly used in Rwanda. Write down their trade names. Find out some of the functions that the identified software offer. Share your findings with the rest of the students.
2. Automated mail
• Automated mail refers to a business tool that makes it easy to process a large volume of mail.
• The sender uses electronic methods to address, sort, and prepare the information for mailing. The mails are then automatically sent to the users.
• Automated mail software can be configured to automatically send a reminder to customers about a planned event. The message sent will remind the customers about the date, the venue, and the time of the event.
• Institutions that send mails in bulk use automated mail. The Rwanda Education Board (REB) is an institution that uses automated mail to send bulk mails to stakeholders in the education sector.
3. Electronic Data Interchange (EDI)
• EDI is a computer-to-computer exchange of business documents.
• It is a process that allows business partners to trade without the need for humans and paper work.
• EDI replaces postal mail, fax, and email. Though email is also an electronic approach, the documents exchanged via the email must still be handled by people rather than computers.
• EDI documents flow straight through the receiver’s computer. The processing of the business transaction can begin immediately.
• With EDI, an organisation receives and processes an order electronically. EDI reduces the number of days that the process takes to complete.
• Rwanda became the first country in sub-Saharan Africa to launch a one-stop electronic clearing system. This is an example of an electronic data interchange system where cross-border trade procedures are automated. This reduces the cost of doing business.
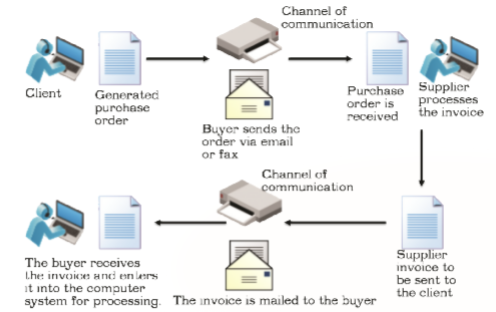
Figure 2.1: Processing a purchase order using an electronic data interchange (EDI)
2.1.2 Record Keeping
A record is something that represents proof of existence. A record can also be used to recreate or prove evidence about the past. Records are usually in writing or any other permanent form.
Record keeping is the systematic process of recording, creating, capturing, and maintaining transactions and events in an accounting system.
Record keeping software such as accounting software, databases, and book keeper provide ready-made reports. They also provide the user with a large storage space for files, back-up of records, and security of files through the use of passwords among other things.
Advantages of using computers in record keeping
(iv) It is an efficient way to keep financial records.
(v) It requires less storage space than physical files.
(vi) It is easy to generate financial reports such as orders, invoices, and debtor reports or other records.
(vii) Once the separate documents are done, the computer program is able to summarize and prepare the final financial records automatically.
(viii) Enables the user to back up records faster and keep them safely.
Disadvantages of using computers in record keeping
(i) Investing in computers for record keeping requires great amount of money.
(ii) For people to work with computers, they need to be trained properly. Training requires money.
(iii) In case there is no backup, one can easily lose data.
(iv) The quality of instructions issued to the computer by human operator determines the accuracy of content. 2.1.3 Stock Exchange
Stock exchange is a market where the shares of public listed companies are traded. These shares are in bonds, stocks, and other securities. In this market the shares are issued, bought, and managed.
Other names used to describe the stock exchange are stock market, bourse, and equity market.Automated Trading Systems (ATS) enable the customers to trade in stock without going through stockbrokers.
A stockbroker is a professional who buys and sells securities on a stock exchange market on behalf of his or her clients. In using the ATS, the computer in this case acts as the broker. The computer program used is able to create orders and automatically submit them to the ATS.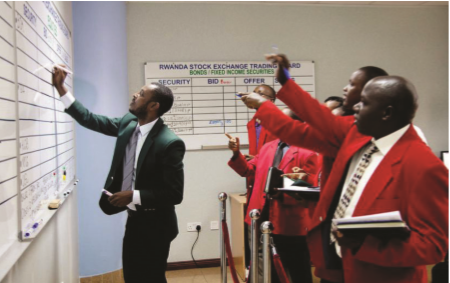
Figure 2.2: The stock exchange market in Rwanda
The use of computers in the stock exchange
An Electronic Communication Network (ECN) is a type of computerized network that is used in the stock exchange. It allows orders made to be communicated electronically.
To trade with an ECN, one must open an account with a broker. This allows the user direct access trading. To use the ECN, one enters an order into the ECN through a computer to allow one to trade on stock exchange.
Some ECN systems offer additional features such as negotiation. Negotiation is the process of making offers and counteroffers, with the aim of finding an acceptable agreement.
Stock trading
When a person or an institution engages in the buying and selling of stock, he or she is said to be engaging in stock trading.
Stock trading can be done online using computers that are connected through the Internet. This is called online stock trading.
Advantages of online stock trading
(i) Computers ensure that stock trading is faster and more efficient.
(ii) Investors get more up-to-date information.
(iii) It allows investors to buy or sell shares quickly.
(iv) It provides accurate market data. This is important for investors to make informed choices.
Disadvantages of online stock trading
(v) Mechanical failures may interrupt the trading process. Back up Internet connection is always required.
Revision Activity 2.1
Part A: Fill in the missing blanks with the correct answers
1. EDI stand for............................................... .
2. Examples of accounting software are .............................................and............................ .
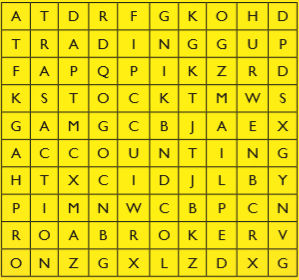
Part B: Find and highlight terms used in financial transactions
Identify the following word that related to financial transactions. Circle them in the maze below: Transaction; Trading; Mail; Accounting; Stock; and Broker
Revision Activity 2.2
Read the following questions carefully and give the correct answers
1. Define the term ‘record keeping’.
2. State the role of computers in record keeping.
3. State three advantages of using ICT in the stock exchange.
4. Explain the role of ICT in Automation.
5. Explain automated accounting as used in financial technology.
Revision Activity 2.3
Do this activity:1. Research the advantages of the automated record keeping system over the manual. Make a class presentation to the other students.
2. Research the Rwanda stock exchange. Find out the stocks available in the market. Research some terms commonly used in the stock market. Find out their meanings. Prepare a report and present it to the teacher for marking.
2.2 Financial Technologies in Society
Financial Technology also known as FinTech refers to the use of software and digital platforms to offer financial services to consumers.
The use of financial technological tools often creates new and efficient means of providing services to consumers. It allows monies to be transferred through mobile devices. Users are able to transact without handling cash.
Most banks now offer a service called online banking. This service is also known as Internet banking, e-banking, or virtual banking. It refers to an electronic payment system that enables customers of a bank or other financial institution to perform banking transactions through the financial institution’s website. A customer is able to transfer money from one account to another through the use of a computer that is connected to the Internet. The following is a discussion of some technologies related to financial transactions, namely: E-commerce, ATM, and mobile banking.
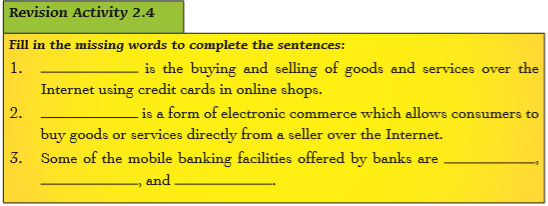
2.2.1 E-Commerce
E-Commerce is electronic commerce. It is also known as eBusiness. It is the buying and selling of goods and services over the Internet using credit cards in online shops.
• Credit card: This is a plastic card normally issued by a financial institution to allow its user to borrow short-term pre-approved funds at the point of sale in order to complete a purchase. The debt does not incur interest until the period given by the bank elapses.
• Online shopping: This is a form of electronic commerce which allows consumers to buy goods services directly from a seller over the Internet.
Using a credit card in online shopping
The following are the steps for using a credit card in online shopping:
(i) Connect to a secure and encrypted network. To encrypt is to convert information or data into a secret code. This process helps to prevent unauthorised access.
(ii) Enter the online address of the website where you want to purchase the item from in the address box of the browser’s window.
(iii) Select the items to purchase and click the appropriate button used for purchasing the item.
(iv) Enter the shipping, billing, and credit card details.
(v) Click the appropriate button to complete the transaction.
(vi) Print the confirmation screen or proof of purchase received upon completing the transaction. Keep this record until the purchased item arrives.
How to Make Online Financial Transactions Secure
(i) Do not use the same passwords and usernames for all accounts.
(ii) Ensure that the password used is strong enough. A strong password contains a combination of numbers, symbols, and lowercase and uppercase letters.
(iii) Change the passwords frequently, preferably every one to three months.
(iv) Ensure the antivirus and firewall security programs are up-to-date.
(v) Consider using debit cards for online shopping transactions.
(vi) When performing online transactions do not use unsecured WIFI.
2.2.2 Automated Teller Machine (ATM)
An Automated Teller Machine (ATM) is an automatic transaction machine. It is used together with an ATM card or a debit card to access, deposit, withdraw, and check the account balances and print mini statements among other things.
To withdraw money from an ATM, do the following:
(i) Insert the card into the ATM machine. A dialog box is displayed.
(ii) Enter the Personal Identification Number (PIN) then press the Enter key. A dialog box is displayed. PIN refers to an identifying number. It is assigned to an account holder by the bank or any other organisation. It i used to check the accuracy of the user’s details when carrying out an electronic transaction.
(iii) Choose the type of transaction from the list provided such as withdrawal, deposit, mini statement, or checking account balances.
(iv) To withdraw money, select the amount from the list by pressing the button next to the desired value. However, if the value is not among the list, press the button labelled Next to avail other options. Type the amount in the box provided.
(v) The machine will automatically confirm if the account has enough money; if the money in the machine is adequate; and if the required money is within the bank withdrawal limit. A dialog box is displayed.
(vi) Select the button labelled Yes for the machine to produce a printed receipt, or No if a receipt is not required.
(vii) The machine dispenses the money, ejects the ATM Card, and finally produces the receipt if it was required.
Note: ATMs are primarily used for checking account balances and withdrawing money, but some ATMs enable the user to deposit money.
Depositing money in an ATM
To deposit money in an ATM, do the following:
(i) Insert the money in the dispenser.
(ii) Enter the Personal Identification Number (PIN) then press the Enter key. A dialog box is displayed.
(iii) Choose the type of transaction from the list provided, in this case deposit.
(iv) Press Enter button. The machine automatically counts the money and updates your account balance. It then displays a dialog box requesting if another transaction is required.
(v) Press the button next to No to exit. Remove your ATM card.
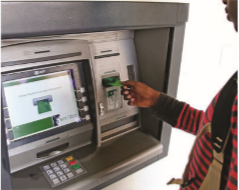
Figure 2.3: Using an Automated Teller Machine (ATM)
Checking the account balance in an ATM
To check your balance in an ATM, do the following:
(i) Insert the ATM card and your personal identify number (PIN).
(ii) Choose the type of transaction from the list provided, in this case balance enquiry.
(iii) Press the button labelled Next then press the Balance Enquiry option. The machine automatically checks the account and displays the information. Press ESC/Exit button to remove the ATM card.
Practice Activity 2.3: Using an ATM
Visit the nearest bank and ask the information officer to guide you to do the following:
• Use the ATM to withdraw and deposit money.
• Check the account balance.
• Understand the advantages and disadvantages of using the ATM.
You could also perform a library or Internet search on the above topics.
Some advantages of using the ATM
• Cash can be withdrawn at any time of the day.
• The ATM offers the convenience of transacting in multiple locations.
• The use of PIN ensures that your money safe in case the card is lost. Some disadvantages of using the ATM
• When there is a failure in the network, access to your account is denied.
• The ATM card could be stolen.
2.2.3 Mobile Banking
Mobile banking refers to the use of a mobile application and device to provide banking services to customers.
Most banks nowadays have the mobile banking facility. Some of the mobile banking facilities offered are:
(i) Buying airtime
(ii) Sending money to your mobile phone
(iii) Checking the balance
(iv) Withdrawing cash
(v) Transferring funds
(vi) Getting a mini statement
(iv) Service requests (Cheque book requests, Forex rates, full statement request, stop cheque)
Practice Activity 2.4: Activities on mobile banking
Use mobile devices or visit a mobile banking agent to do the following:
• Use mobile banking services to withdraw and deposit money.
• Check the account balance and get a mini statement.
Advantages of mobile banking
The following are some advantages of mobile banking:
(i) It makes life easier since customers can access their accounts from the comfort of their homes.
(ii) The customer is notified of any transaction carried out on their account.
(iii) Mobile banking applications are easy to use thus user-friendly.
(iv) The use of mobile banking reduces cases of fraud.
(v) The transfer of funds from one account to another is easy.
(vi) Paying of bills is done more quickly and at the convenience of the customer.
The process of loading money on a mobile phone account
When money is deposited in an account, it is automatically loaded to that account.
To load money in a mobile phone account, do the following:
(i) Visit an agent shop displaying the sign of a mobile money service provider.
(ii) Pay the money.
(iii) Provide your mobile phone number to the agent. Ensure that you do not disclose your PIN details to the agent.
(iv) Wait for a confirmation of the transaction from your service provider.Once the money is loaded on the mobile platform, it can now be transferred to the bank account. To transfer money to the bank account, obtain the procedure from the bank.
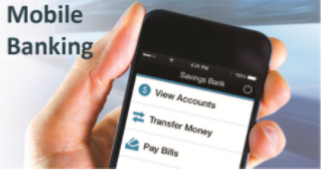
Figure 2.4: Mobile banking
The process of sending and receiving money
To send money via mobile banking services, do the following:
(i) Select SIM Toolkit from the phone.
(ii) Choose the mobile money service provider.
(iii) Select the Send Money option.
(iv) Enter the phone number of the recipient.
(v) Enter the amount of money to be sent. Ensure there is enough money to cater for the transaction charges.
(vi) Enter your PIN details.
(vii) Confirm the details entered then click OKThe process of withdrawing money
To withdraw money from the account, do the following:
(i) Visit an agent shop displaying the sign of mobile money service provider.
(ii) Select SIM Toolkit from the phone.
(iii) Choose the mobile money service provider.
(iv) Select the Withdraw Cash option.
(v) Select From Agent option.
(vi) Enter the agent number.
(vii) Enter your PIN details.
(viii) Enter the amount of money to be withdrawn. Ensure there is enough money to cater for the transaction charges.
(ix) Confirm the details entered then click OK.
(x) Wait for a message to be sent to the agent’s phone and your phone confirming the transaction. The agent provides the money at the end of the transaction.
Practice Activity 2.5: Using mobile telephony to send and withdraw money
With phones that are enabled for mobile banking, do the following:
• Deposit, withdraw, and send money.
• Use mobile money to buy items and pay for services such as airtime, electricity, water, goods, and television services among other things.
Mobile money transfer services have made life easier in Rwanda
(i) Users can easily save and withdraw money using their mobile phones.
(ii) Through mobile money transfers, users can easily buy and sell items without travelling long distances.
(iii) Some mobile money service providers in Rwanda have collaborated with transport companies that operate various routes. Travellers are able to pay their travel fares using mobile telephony.
Mobile money security
To ensure that your money in the mobile device is secure, do the following:
(i) Do not share the details of your PIN with anyone.
(ii) Reset the security details such as the PIN frequently.

2.3 Impact of Financial Technology in Society
Financial technologies can have both positive and negative effects on society.
2.3.1 Positive Impact of Financial Technologies
Financial technologies have brought beneficial changes to society. These include the following:
• Quick service delivery
• Security in transactions
• Unlimited access to the users bank account
• Automated billing
• Automation of routine tasks
• Creation of job opportunities
• Communication networks
• Easy management of payroll
• Increased revenue to country
• Solution to bank service problems
1. Quick Service Delivery
The use of computers to buy and sell shares on the stock market is an example of a financial technology. It allows the stock exchange to be carried out through Internet connectivity. Customers are able to get the information they require faster. This enables them to make informed decisions very fast.
The Bank of Kigali, for example, has partnered with mobile telephone service providers to offer online banking. In this way, service delivery has improved and customer satisfaction is enhanced.
2. Security in Transactions
• Every account holder deposits and withdraws money from his or her account. This money must be protected from danger or threat related to financial transactions such as fraud.
• To protect money held in a bank account, customers are advised to take some precautionary measures. For example, one should not share their PIN number with anyone.
• To withdraw money from an Automated Teller Machine (ATM), customers are issued with an electronic card. The card contains the customer’s financial details.
• A customer can withdraw and deposit money, pay bills, and shop using it. A customer should report to the bank immediately if his or her electronic bank card gets stolen or lost.

3. Convenience
• Through the use of an ATM, customers have access to banking services from anywhere worldwide.
• Customers are able to access their accounts without going to the main branch.
• Some banks have also expanded online banking to mobile banking. In this way, a customer is able to perform a transaction through a mobile device such as a smart phone or a tablet.

Figure 2.7: Mobile banking
4. Unlimited access to the user’s bank account
Banks are able to provide their customers unlimited access to their accounts through agency banking, mobile banking, plastic money, and remote banking among other things.
In agency banking, a mobile network operator is able to offer banking services within a locality, for example, in a rural setting or village. In this way, one does not have to travel long distances to the headquarters of the bank in order to carry out a transaction.
Some transactions that one is able to do in agency banking include depositing, withdrawing, and transferring funds, paying bills and requesting the account balance. Banking agents can be situated in drug stores, supermarkets, post offices, and near workplaces.5. Automated system of issuing bills (invoices)
An invoice is a list of goods sent or services provided by a company, issued together with a statement of the amount of money owed. Another name for an invoice is a bill.
Financial technologies enable businesses to invoice goods and services through computer systems. The bills are then sent to the customers via emails through Internet connectivity. This eliminates the cumbersome manual preparation of invoices.
Billing software is designed to allow the creation of customer accounts. Each account contains all the data bout the customer that is needed to accurately prepare the invoice. This data may include the customer’s name, the contact address, including the email, and the physical address to allow the efficient delivery of goods.
In Rwanda, billing systems are commonly used by suppliers of goods to supermarkets and other stores
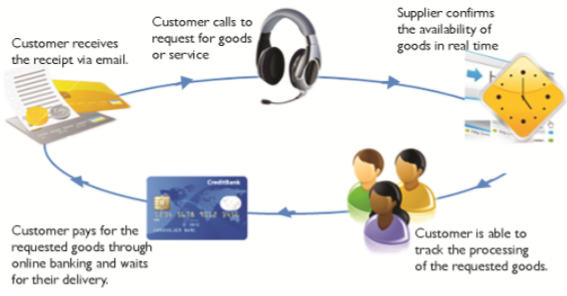
Figure 2.8: An Automated Billing system
There is also a law that requires every VAT registered taxpayer to use electronic billing machines (EBMs). The transactions on the billing machines enable the Rwanda Revenue Authority (RRA) to monitor payment of taxes by business operators.

6. Automation of routine tasks to increase efficiency
Computers and computerized systems have replaced human labour in performing some activities, especially routine tasks. The following are some benefits of automating routine tasks:
• The quality of products is improved. This is because tasks are performed with accuracy and with speed. The level of accuracy that s achieved by automation is higher than that which is achieved by human labour.
• An automated system works at a constant speed without pausing for frequent breaks, sleep, and holidays. In this way higher productivity is achieved.
• Automation increases safety in the workplace. Workers are moved to supervisory roles where they no longer have to perform hazardous tasks.
7. Creation of job opportunities
New job opportunities are created by the introduction of financial technology. In Rwanda and other countries across the world, new job opportunities have been created. Examples include the following: ICT manager, bank agents, data entry clerks, and systems analysts among others.
8. Communication networks
Communication networks have improved financial services by bringing the services nearer to the people, making it cheaper, faster, and more reliable. The following are communication networks that are used to offer financial services:
• Internet: Communication of information on financial transactions through emails has led to improvement in business operations. The Internet banking has improved operations in the banking sector. Customers are able to access their bank accounts and perform transactions any time of the day and from anywhere. Financial institutions also use the Internet to send statements of accounts to their customers.
• Social Networks: Financial institutions have embraced the use of social networks as communication tools. These platforms are used by financial institutions to share information with their clients, as well as to market their services to potential customers. Some examples of common social networks include Twitter, Facebook, and Instagram among others.
• Short Message Service (SMS): These are short text messages sent via a mobile phone for communication. Financial institutions use these services to communicate with their customers.
9. Easy management of the payroll
In most organisations in Rwanda, salaries are paid through electronic funds transfer (EFT). This is a financial system by which money is transferred from one bank account to another. This transfer can either be within a single financial institution or across other institutions. EFT does not require the direct involvement of bank staff. The use of EFT simplifies the process of preparing the payroll and reduces the costs associated with the process.
10. Solution to bank service problems
Banking institutions have been experiencing huge challenges when serving large numbers of customers. Some of these challenges include long waiting times, limited time for customer servicing,transaction errors due to the bank personnel and excessive bureaucracy. Financial technologies have been used to provide solutions to these challenges in several ways. A discussion on some of these follows.
• Long waiting times: Long queues of customers waiting for services in the banking hall have been reduced. This has been achieved through:
- Electronic Funds Transfer (EFT): Customers use debit cards, credit cards, and smart cards to transfer money without visiting the bank either by use of ATM or online banking.
- Mobile banking: The customer is able to access banking facilities by the use of mobile phones and applications that support all services offered by the bank.
- Internet banking: This is made possible through online banking facilities available on the Internet. Clients can carry out banking transactions without physically visiting the bank.
• Limited time for customer servicing: Before the introduction of technology, the banks were not able to provide services to their customers beyond their operational hours. The introduction of ATM means that the user can access his or her account any time and from anywhere without limitation of time or place. Also through the use of Agency and online banking, a customer can access banking services from anywhere.
• Transaction errors by the bank personnel: Transaction errors caused by banking personnel have been reduced through automation of most of the bank services, for example, counting of currency notes is now done by currency counting machine, withdrawals are done by use of the ATM, funds can be transferred electronically, deposits can be done using the ATM, and bills can be paid using a credit card. All these processes help to reduce errors.
• Excessive bureaucracy: This happens when management takes too long to make decisions on issues such as approval of bank loans. Customers wait for a long time trying to get feedback. Automation of loan processing and approval has reduced excessive bureaucracy and made the process quicker.
2.3.2 Negative Impact
These are the problems that society experiences related to financial technology. Examples include fraud and unemployment.
1. Online financial fraudOnline fraud is an intentional act of dishonesty that is committed using Internet connectivity that may lead to loss of funds or financial data. A bank may, for example, lose personal information of the customers. This information may then be used to commit theft or other unlawful activities.
In other online financial fraud, victims may be misled to transfer money to the accounts of those committing fraud.
For example, an offender may send an email to a victim pretending to be an officer in the bank. The victim may be led to give his or her bank account information.
If the victim unwittingly releases his or her information, the offender may use the stolen identity to withdraw money from the victim’s bank account and transfer it to his or her own account. In this case, a financial fraud is committed.
2. Loss of jobs causing unemployment
Technological unemployment is a situation where job losses are caused by the development of technologies.
Financial institutions have automated certain services such as counting of money. They have also automated services such as deposits and withdrawals through the use of automated teller machines. This automation has led to loss of jobs for tellers and cashiers.


2.5 Definition of the key words in this unit

Revision Exercise 2
1. Explain three points to illustrate the positive impact of financial technology in society today.
2. State two advantages of mobile banking.
3. Explain how fraud can be carried out using computer tools.
4. Explain the impact of mobile and agency banking on society.
Unit 3:Objects in a Document
Key Unit Competency: By the end of this unit, you should be able to:
1. Insert symbols, pictures, tables, and objects in a document.
Introduction
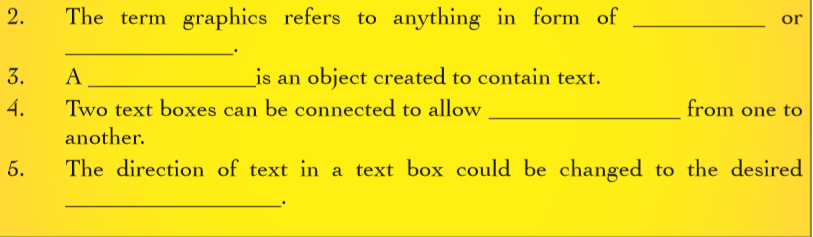
This unit deals with insert in and manipulation of graphics in a word document. The term graphics refers to anything in the form of images or pictures. The graphical objects could be in form of textboxes, tables, pictures, equations, symbols, word art and tables.
3.1 Objects: Insert and Format Text Boxes
The word processing program allows the user to insert a text box in a document. A text box also known as a text field or a text entry box is a graphic that is intended to enable the user to input textual information to be used by the program. A text box may contain simple text, a quote, or any other information that the creator may wish to use. Text boxes may be used in the following situations:
• Drawing attention to a piece of text.
• Enhancing the layout of a document.
• Inserting a label on an object or in the margin.
3.1.1 Inserting a Text box in a Document
Method 1: Using the Insert Tab to insert a text box in a document
To add a text box in a document, do the following:
(i) Click on Insert tab from the menu bar, select Text box from the Text group. A drop down menu appears as shown in Figures 3.1(a and b).
(ii) Click on the desired text box in the Built-In section or click on Draw text box to insert a customised one.
(iii) If Draw text box option is selected, the cursor changes to a plus sign in the document. Click and drag it in the desired location. Otherwise, begin typing in the box and the content in it will automatically be deleted.
(iv) The keyboard shortcut is as follows: Long press ALT, press N then X and finally D. Then insert the customised text box or use the arrow keys to select the desired option.
(iii) Type the desired text.
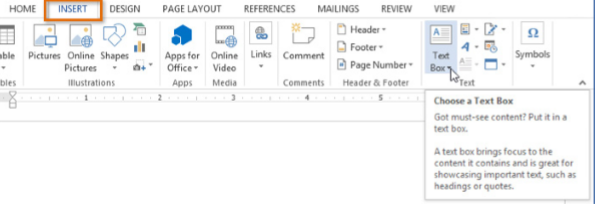
Figure 3.1(a): Selecting Text box from the Insert menu
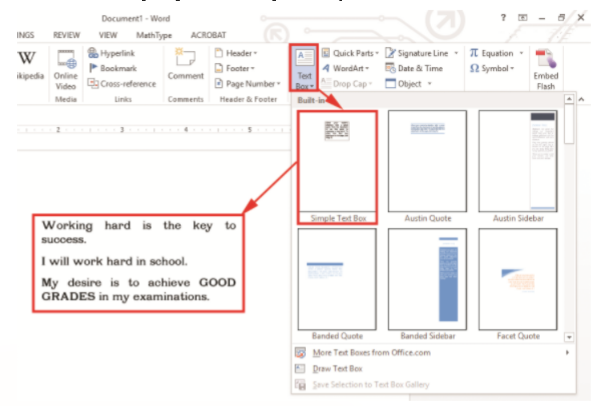
Figure 3.1(b): Inserting a simple text box
Method 2: Using the Shapes Feature to insert a text box in a document
You can use the Shapes feature to add a text box in a document. The steps are as follows:
(i) Click on Insert tab from the menu bar.
(ii) Select Shapes from the Illustrations group. A drop down menu appears as shown in Figure 3.2(a).

Figure 3.2(a): Using the shapes feature to draw a text box.
(ii) Click on the desired text box in the Built-In section use it to draw the desired shape.
(iii) Right-click the drawn Shape and choose Add Text from the pop-up menu.
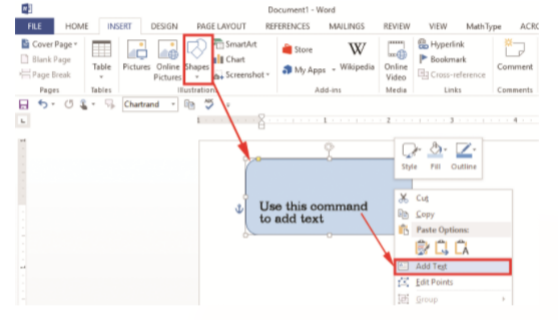
Figure 3.2(b): Inserting text into a shape
Practice Activity 3.1: Inserting text boxes
Draw text boxes of different shapes and add text as shown in Figure 3.2(c) on page 46.
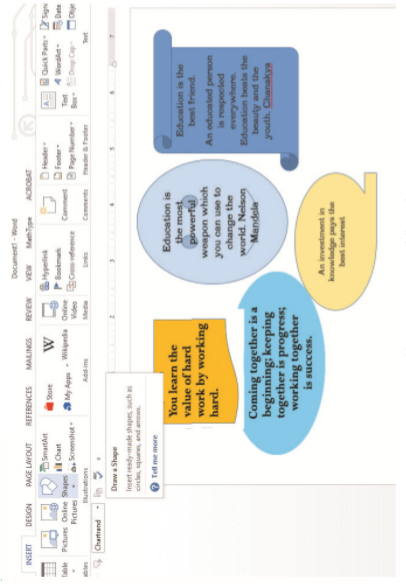
Figure 3.2(c): Inserting text into a different shapes
3.1.2 Formatting a text box
When a text box is highlighted in a document, the Drawing Tools tab which comes along with the Format tab in the menu bar is activated.
There are various formatting features available some of which include: editing the text box shape, creating a link, and changing text direction.
3.1.3 Editing the shape of a text box
The editing feature is used to change the shape of a drawing. To use this feature to change the shape of a text box, do the following:
(i) Click on the text box to select it.
(ii) Click on Format tab under Drawing Tools tab in the menu bar.
(iii) Select Edit Shape under Insert Shapes group. A drop down menu appears.
(iv) To change the shape of the text box, select the desired shape from Change Shape option as shown in Figure 3.3(a) on page 48.
The keyboard shortcut is as follows: Long press ALT, press JD then E and finally press the right arrow key.
(v) To edit points of a text box, click on the Edit Points option. The points are selected and the shape changes to red colour.
(vi) Once you select the points, you can drag them to the desired shape. In this case, the points were dragged to achieve the shape shown in Figure 3.3(c) on page 49.
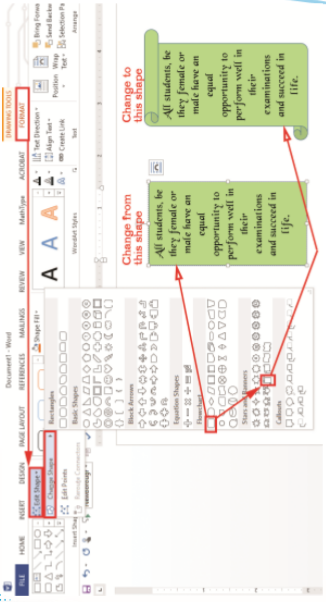
Figure 3.3(a): Changing the shape of a text box
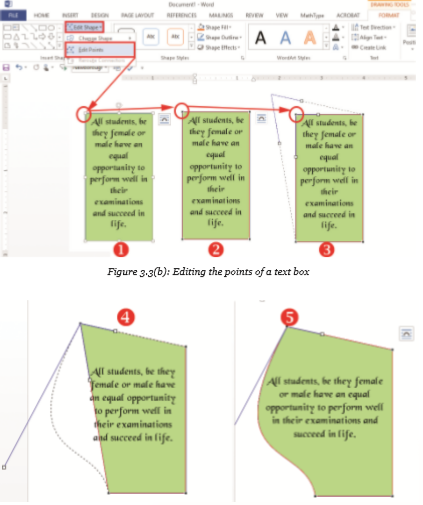
Figure 3.3(c): Editing the points of a text box and dragging them to a desired shape

3.1.4 Modifying colours and lines for text boxes
The default colour for lines is black.
To change this colour to a desired one, do the following:
(i) Click on the text box.
(ii) Click on Format tab under Drawing Tools tab in the menu bar.
(iii) Select Shape Outline in the Shape Styles group. A drop down menu appears as shown in Figure 3.4(a). (iv) Click on the desired colour under Theme Colours to change the border colours.
(v) To remove the borders, click on No Outline.
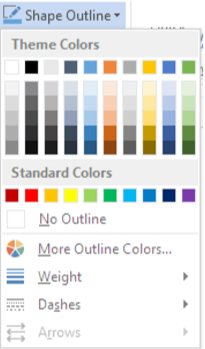
Figure 3.4(a): Changing the colour of lines
(vi) Click on Weight and select the desired line to change the line thickness or to change the line style.
(vii) Click on Dashes and select an option in the side kick menu. See Figure 3.4(b).

Figure 3.4(b): The weight and colour of the line have been changed to dashes style.
Practice Activity 3.3: Modifying the lines and colours for text boxes
Draw the text box labelled 1 as shown in Figure 3.5. Change its colour and lines to match those in the text box labelled 2.
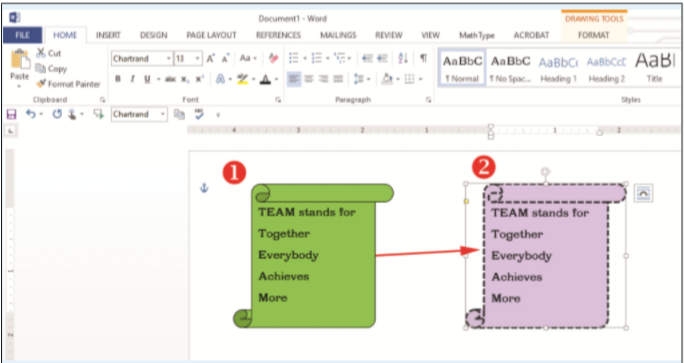
Figure 3.5: Modifying colours and lines for text boxes
3.1.5 Creating Links between Text Boxes
You may have text that you would like to run in a series of text boxes. You want the text to flow from one text box to the next and ensure that the reader will be able to follow the text.
This feature of creating links allows you to insert text that will flow from one text box to another. When the first text box is full, this feature allows the text to be inserted automatically to the next text box and fills it.
If you add or delete text in one text box, Create Link will adjust the text in the rest of the text boxes accordingly.
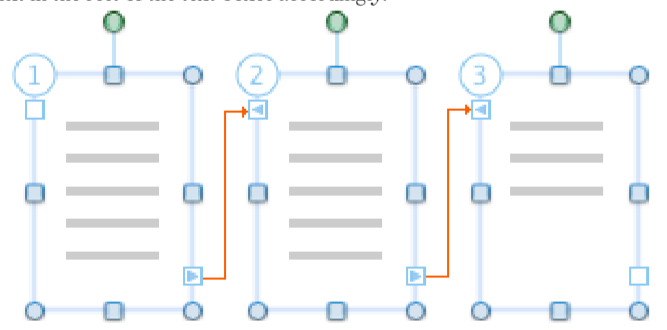
Figure 3.6: Text in linked boxes flows from one box to the next
To create a link between two text boxes, do the following:
(i) Add two text boxes and ensure that they are empty.
(ii) Click on the first text box.
(iii) Click on Format tab under Drawing Tools tab in the menu bar.
(iv) Select Create Link icon under Text group.
(v) Click on the next text box to automatically create the link.
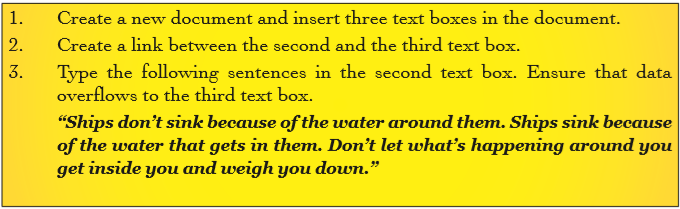
Practice Activity 3.4: Creating links between text boxes
Do the following:
(i) Create three text boxes.
(ii) Type the poem titled, Don’t Quit.
(iii) Link the three text boxes as shown in Figure 3.7 shown on page 53.
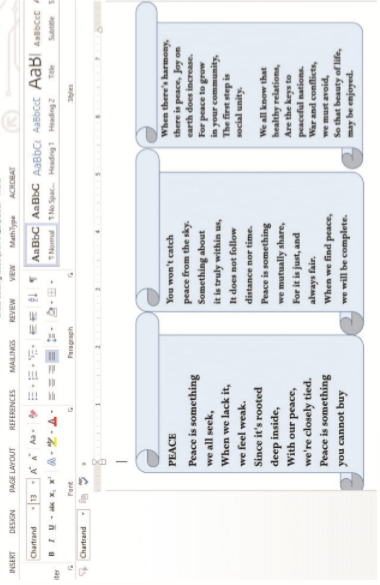
Figure 3.7: Linking text boxes
3.1.6 Text Direction in Text Boxes
The direction of text in a text box can be changed to the desired orientation using the following procedure:
(i) Highlight the content in the text box.
(ii) Click on Format tab under Drawing Tools tab in the menu bar.
(iii) Select Text Direction icon under Text group.
(iv) Click on the desired direction from the resulting drop down menu.
(v) If the desired option is not in the list, click on Text Direction Options. A dialog box appears as shown in Figure 3.8.
(vi) Select the desired orientation and click OK. Note: The keyboard shortcut is as follows: Long press ALT, press JD then AX and finally X.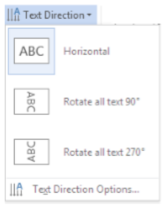
Figure 3.8: Changing the text direction.
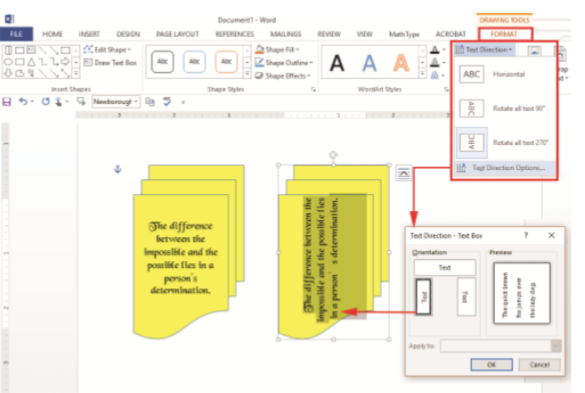
Figure 3.9: Other options available for changing text direction
3.1.7 Applying Fill Effects to a Text Box
The feature of Fill Effects adds colour inside the text box. To apply it, do the following:
(i) Click on the text box.
(ii) Click on Format tab under Drawing Tools tab in the menu bar.
(iii) Select Shape Fill in the Shape Styles group. A drop down menu appears as shown in Figure 3.10(a).
(iv) Click on the desired colour under Theme Colours to fill the shape.
(v) To remove fill added, click on No Fill box.
(vi) Click on Gradient and select the desired fill style, click on Texture and select an option in the side kick menu.
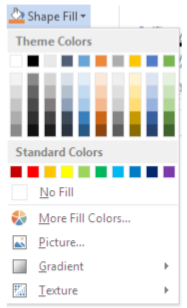
Figure 3.10(a): Filling a shape with colour
Note: The keyboard shortcut is as follows: Long press ALT, press JD then SF.

Figure 3.10(b): A shape with coloured borderline

Part B: Fill in the missing words to complete the sentences
Part C: Answer these questions

Part D: Do this practical activity
3.2 Adding Shapes
Various shapes can be added in a word document then formatted as required by the user.
3.2.1 Inserting Shapes
(i) Click on Insert tab from the menu bar, select Shapes icon from Illustration group. A drop down menu appears as shown in Figure 3.11(a).
(ii) Click on the desired shape, the pointer changes to a plus sign.
(iii) Position the pointer at the desired area of the document and drag it in the desired direction to draw the shape.
Note: The keyboard shortcut is as follows: Long press ALT, press N then SH.
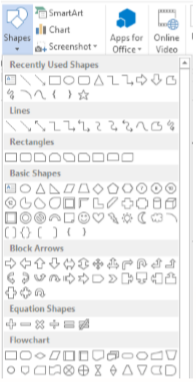
Figure 3.11(a): Adding shapes
3.2.2 Formatting Shapes
Once a shape has been inserted in a document, one can format it. To format in this case means to arrange it in the desired way.
Some formatting styles that can be applied on a shape include the following: changing the shape; rotating the shape to an angle; and grouping a number of shapes into one image.
Most of these formatting features are contained in the drawing tool menu that is added on the menu bar anytime an image is inserted.
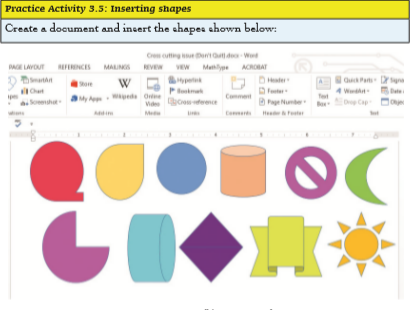
Figure 3.11(b): Inserting shapes
3.2.3 Using Drawing Tools
Drawing tools are normally used when another shape or line exists and is highlighted to activate the Drawing Tools menu option in a document. This reduces cluttering of options on the ribbon.
Figure 3.12 shows the ribbon displayed when the Drawing Tools tab is selected.

Figure 3.12: The drawing tools tab
3.2.4 Inserting Shapes
Insert shapes group is normally used for drawing different shapes according to the user’s preference. Examples of shapes that one can insert include lines, rectangles, basic shapes, arrows, flow charts, stars, banners, and speech bubbles as shown in Figure 3.13.

Figure 3.13: Inserting shapes
3.2.5 Shape Styles Group
Shape styles are used for formatting the shapes using fill colour, outline, or effects. Figure 3.14 shows insert shapes styles group.

Figure 3.14: Shape formatting styles
3.2.6 WordArt Styles Group
WordArt style is used for formatting text found in shapes using text fill, text outline, and text effects. WordArt enable you to create special text effects such as shadowed, rotated, stretched, and multicoloured text.
Method 1: Inserting WordArt
(i) On the Insert tab, click the Insert WordArt button.
(ii) In the WordArt gallery, click the WordArt style that you desire.
(iii) Replace the placeholder text with the text you want to format using WordArt.

Figure 3.15: Inserting WordArt styles
Method 2: Converting regular text to WordArt
To convert regular text to WordArt, do the following:
(i) Select the text you want to convert, then click the Insert tab.
(ii) Click the WordArt drop-down arrow in the Text group.
(iii) Word will automatically create a text box for the text, and the text appear in the selected style.

Figure 3.16: Converting text to a WordArt style
3.2.7 Text Group
It is usually used when formatting text in a shape by changing the direction, or alignment of the text, or when creating a link in text found in two shapes.
3.2.8 Arrange Group
It is used when arranging text and shapes in a document. It can also be used for changing position and rotating a shape.
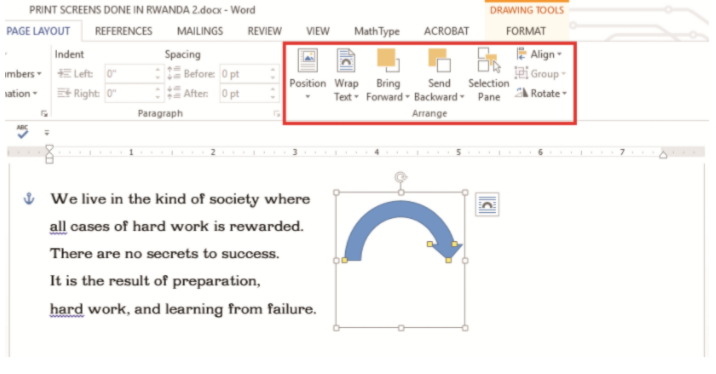
Figure 3.17: Arranging text and shapes in a document

3.2.9 Formatting Features
Changing shape
To change a shape that has already been inserted, do the following:
(i) Select the shape.
(ii) Click on the adjustment handle which is normally a yellow diamond and drag it either inward or outward.
(iii) Release the mouse button once the desired shape is realized.
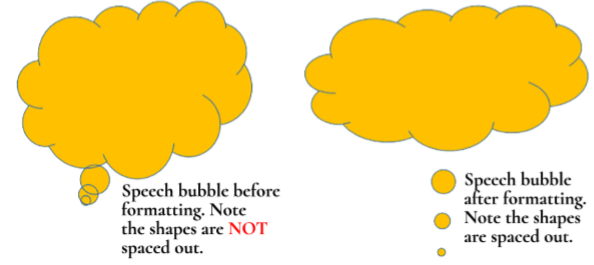
Figure 3.18: Using the formatting features to change a shape
Rotating (Method 1)
A shape can be rotated to a desired angle. Rotating is done to change the orientation of the shape. To rotate a shape, do the following:
(i) Click on the shape to be rotated.
(ii) Click on the handle and drag the picture to the desired direction.
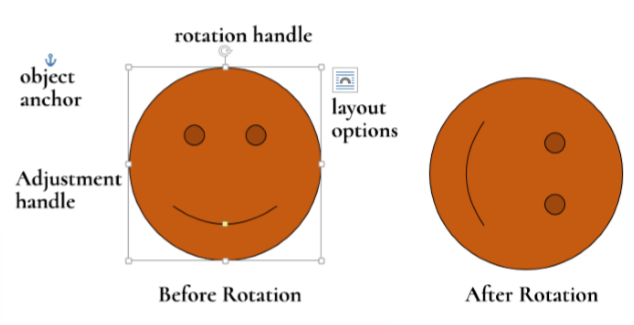
Figure 3.19: Rotating is done to change the orientation of the shape
Rotating (Method 2)
(i) Click on Format menu in the Drawing Tools menu.
(ii) Select the dialog box launcher in the Size group. A dialog box is displayed with the Size tab activated as shown in Figure 3.20
(iii) Type or select the degree of rotation in the Rotation box.
(iv) Click OK to apply. The keyboard shortcut for the above process is as follows: Long press ALT then JD and finally SZ.
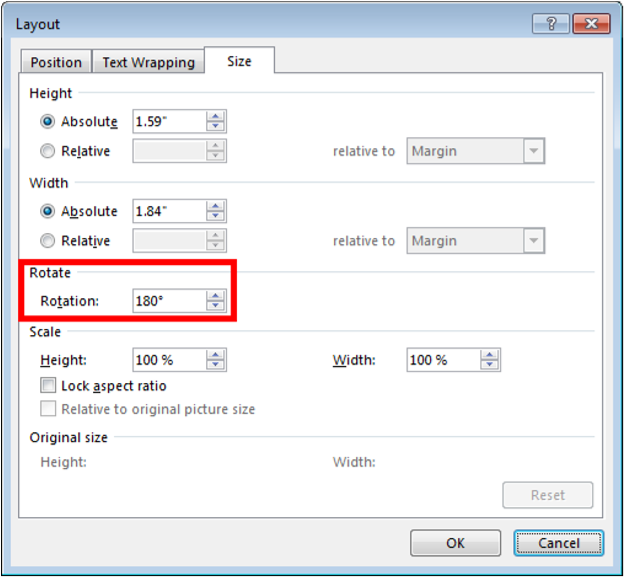
Figure 3.20: Changing the degree of rotation
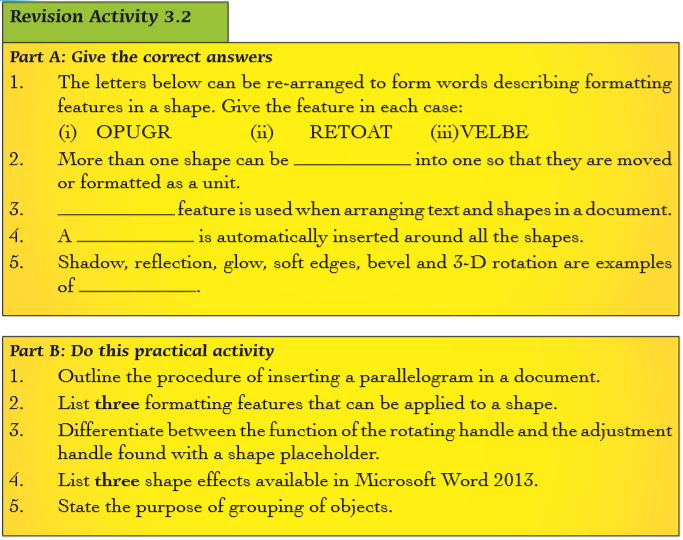
Grouping
More than one shape can be grouped in one so that they are moved or formatted as a unit. To group shapes, do the following:
(i) Select the shapes by clicking on them as you hold the shift key down.
(ii) Right-click on the selected shapes. A pop-up menu appears as shown in Figure 3.21.
(iii) Select Group then Group again from the next pop-up menu. A canvas is automatically inserted around all the shapes and hence making it easier to format all the shapes at once.
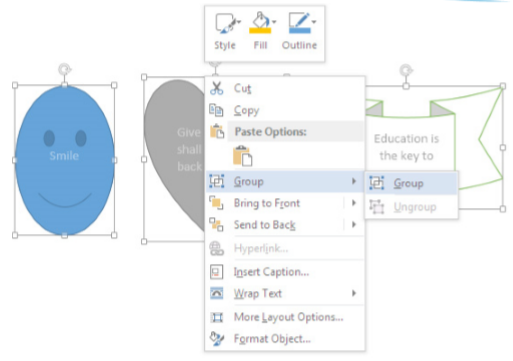
Figure 3.21: Grouping objects
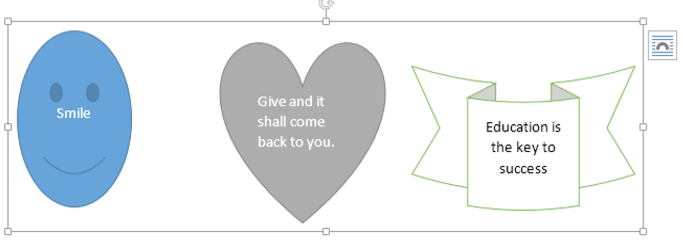
Figure 3.22: Grouped objects
Shape effects
The following are some examples of effects that can be added on a shape: shadow, reflection, glow, soft edges, bevel and 3-D rotation. To add a shape effect, do the following:
(i) Select the picture.
(ii) Click on Format tab in the Drawing Tools tab from the menu bar, select the Shapes Effects icon from Shape Styles group. A drop down menu appears as shown in Figure 3.23.
(iii) Click on the desired effect to display other options in a pop-up menu.
(iv) Select the desired effect to automatically apply it to the shape.
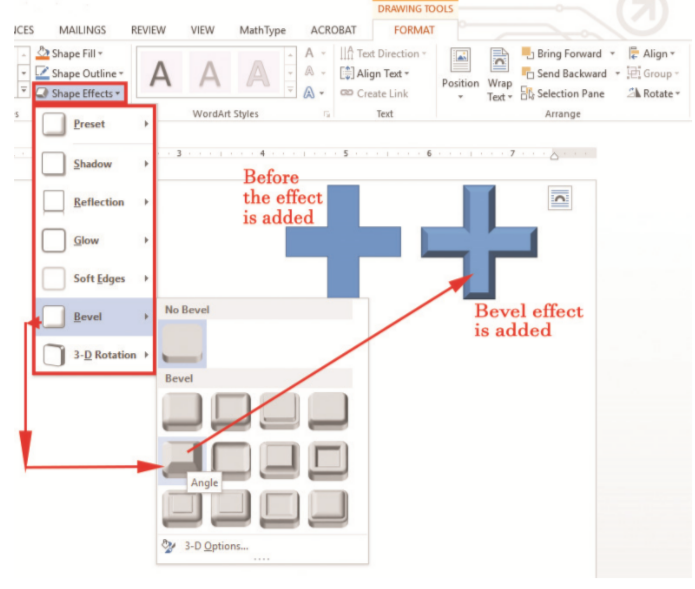
Figure 3.23: Shape effects options

Figure 3.24: Shape effects options
Adding text in shapes
Text can be added in a document using the following procedure:
(i) Right-click on the shape and select Add Text option from the pop-up menu as shown in Figure 3.25.
(ii) Type the desired text.
(iii) Click away from the shape. Figure 3.26 shows a cloud shape containing text, which is a message on peace.
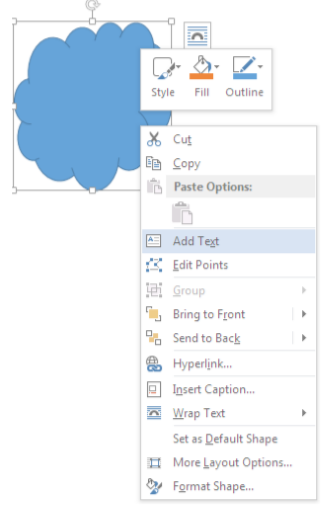
Figure 3.25: Adding text to a shape

Figure 3.26: A cloud shape with a peace message

3.3 Inserting Pictures and WordArt Objects
A picture can be inserted from the Internet or from an existing file.
3.3.1 Inserting pictures from the Internet(i) Position the insertion point where the picture is to be inserted.
(ii) Click Insert tab from the menu bar in the Illustrations group and click Online Pictures icon. If there is Internet connection, a dialog box is displayed as shown in Figure 3.27.
(iii) Type the name of the image to be located in the box provided. Click on Go button to display the result on the window as shown in Figure 3.28.
(iv) Click on the desired image then select Insert button.

Figure 3.28: Images displayed based on the search result
3.3.2 Inserting pictures from an existing file
(i) Position the insertion point where the picture is to be inserted.
(ii) Click Insert tab from the menu bar.
(iii) Under Illustrations group, click Pictures icon. A dialog box appears as shown in Figure 3.29.
(iv) Select the location where the picture is stored.
(v) Select the picture then click Insert command.
Note: The keyboard shortcut for the above process is as follows: Long press ALT, press N, then P.
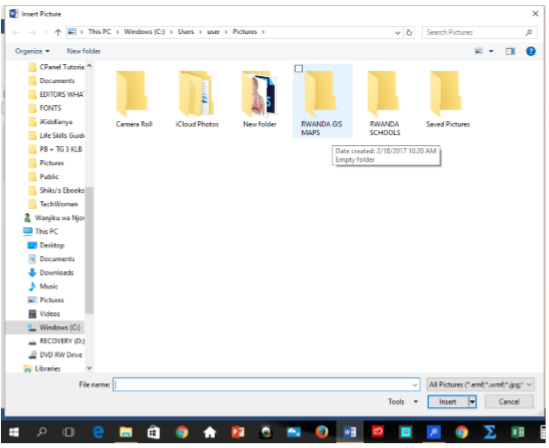
Figure 3.29: Inserting a picture from file
3.3.3 Inserting WordArt objects
(i) Position the insertion point where the WordArt is to be inserted.
(ii) Click Insert tab from the menu bar. Under Text group, click WordArt icon. A drop down menu appears containing a list of WordArt options as shown in Figure 3.30. The keyboard shortcut for the above process is as follows: Long press ALT, press N then W.
(iii) Select the desired WordArt option. It is automatically inserted in the document with the words, “Your text here” as shown in Figure 3.30.
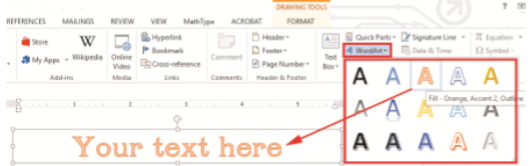
Figure 3.30: Word Art text box
(iv) Click inside the text box. The words in it will automatically be deleted. Type the desired text.
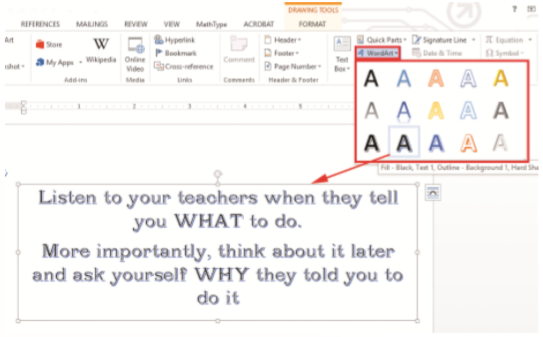
Figure 3.31: Inserting a WordArt object

Figure 3.32: Creating a document with text boxes
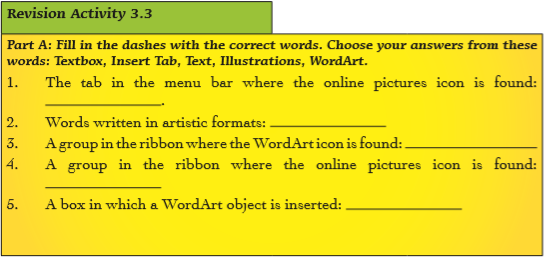
3.4 Equations and Symbols
The equations available in Microsoft Word 2013 are mathematical. Symbols and special characters are also available.
3.4.1 Inserting Symbols and Special Characters
Inserting symbols
Symbols are non-alphabetical signs that have specific meaning when used in a particular context. An example is the © symbol, which is a copyright symbol. To insert a symbol, use the following procedure:
(i) Position the insertion point where the symbol or the special character is to be inserted.
(ii) Click Insert tab from the menu bar. Under Symbol group, click Symbol icon. A drop down menu appears containing a list of symbols as shown in Figure 3.33. The keyboard shortcut for the above process is as follows: Long press ALT, press N then U. Select the desired symbol option to automatically insert it in the document.
(iii) However, if the desired symbol is not in the list, click on More Symbols command to display a dialog box as shown in Figure 3.33.
(iv) Select the desired symbol, then click the Insert button.
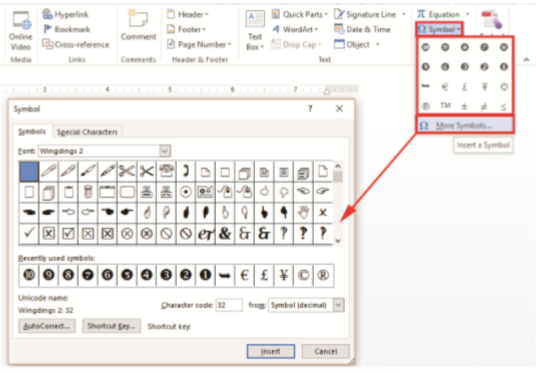
Figure 3.33: Inserting symbols
Inserting special characters
To insert a special character, use the following procedure:
(i) Position the insertion point where the special character is to be inserted.
(ii) Click Insert tab from the menu bar. Under Symbol group, click Symbol icon. A drop down menu appears containing a list of symbols and a More Symbols command as shown in Figure 3.33.
(iii) Click on More Symbols command, select Special Characters tab to display a dialog box as shown in Figure 3.34.
(iv) Choose the desired character then click the Insert button.
Note: The keyboard shortcut for the above process is as follows: Long press ALT, press N then U and finally M.

Figure 3.34: Inserting special characters.
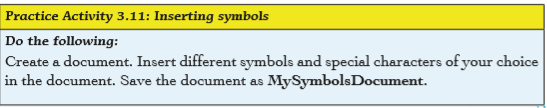
3.4.2 Writing Equations
An equation is a mathematical statement that has two expressions, usually separated by equals sign. Equations comprise numbers, letters, operators, and symbols. To insert an equation in a document, do the following:
(i) Position the cursor where the equation is to be inserted.
(ii) Click Insert tab from the menu bar.
(iii) Under Symbol group, click Equation icon. The Equation Tools menu is added along with Design in the menu bar.
(iv) Click on Design to reveal the ribbon under it as shown in Figure 3.35(a).
Note: The keyboard shortcut for the above process is as follows: Long press ALT, press N then E.
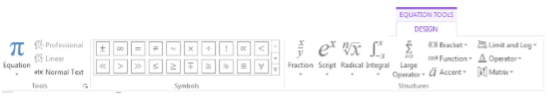
Figure 3.35(a): Writing equations
(v) Select the desired equation from the Symbols group or Structures group to automatically insert it in the document. For example, to insert a quadratic equation, click on the equation in the Radical icon from the Structures group. Figure 3.35(b) shows a sample of a quadratic equation.

Figure 3.35(b): A mathematical expression used for calculating the value of x


3.5 Tables
A table is a feature that is used to present information in an organised layout. It consists of rows and columns intersecting to form cells where data is entered and manipulated. A cell is a box formed by the intersection of a row and a column in a table.
3.5.1 Inserting a Table
There are three ways of creating a table namely:
(i) Using the Graphic Grid.
(ii) Using the Insert Table feature.
(iii) Using the Draw Table tool.
Using the Graphic Grid
(i) Position the cursor where the table is to be inserted.
(ii) Click on Insert tab from the menu bar and select Table command under the Tables group
A drop down menu appears as shown in Figure 3.37.
(iii) Select the desired number of rows and columns from the grid.
Using the Insert Table
(i) Position the cursor where the table is to be inserted.
(ii) Click on Insert tab from the menu bar and select Table command under the Tables group.
(iii) Select Insert Table. A dialog box appears as shown in Figure 3.38.
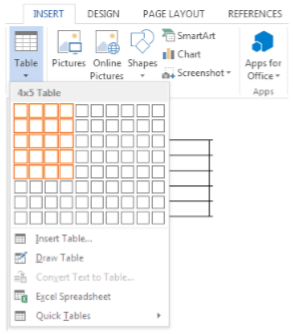
Figure 3.37: Using the graphic grid to insert a table
(iv) Type the number of columns required in the Number of columns box.
(v) Type the number of rows required in the Number of rows box.
(vi) Select the desired option under AutoFit behavior.
(vii) Click OK to apply.
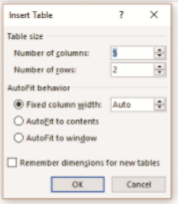
Figure 3.38: Inserting a table dialog box
Using the Draw Table Tool
(i) Position the cursor where the table is to be inserted.
(ii) Click on Insert tab from the menu bar and select Table command under the Tables group.
(iii) Click Draw Table to display a pencil. Start drawing the table by dragging the pencil in the direction where the table is to be displayed. Release the mouse button once the required cell size is realized.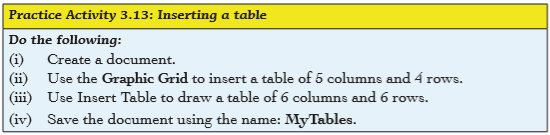
3.5.2 Formatting a Table
When a table is created, the Table Tools is added on the menu bar together with Design and Layout tabs. Most formatting features of a table are found in the Layout tab.The following are some of the formatting features: Inserting rows, inserting columns, deleting (row, column and table), merging cells, splitting cells and formulas among others. Figure 3.39 shows the ribbon containing the different formatting icons.

Figure 3.39: Tools for formatting tables
Inserting columns and rows in a table
Method 1
Inserting columns
To add a new column(s) in an already created table do the following:
(i) Place the cursor in any cell within the column to precede or succeed the new one.
(ii) Click Layout tab from the menu bar and select Insert Left or Insert Right command under the Rows & Columns group.
Deleting a row, table and column
To delete a row(s) in an already created table do the following:
(i) Select a cell in the respective table.(ii) Click Layout tab from the menu bar and select Delete command under the Rows &Columns group. A drop down menu appears as shown in Figure 3.40. Click on the desired option. Note: The keyboard shortcut for deleting rows, tables, and columns is as follows: Long press ALT, press JL then D.
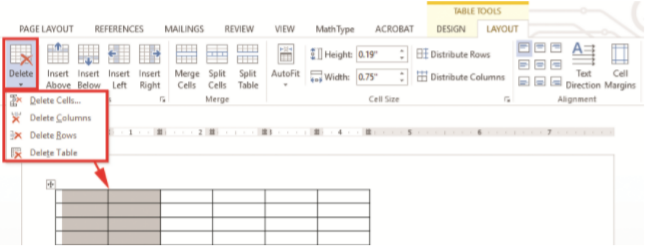
Figure 3.40: Deleting cells, rows, tables, and columns
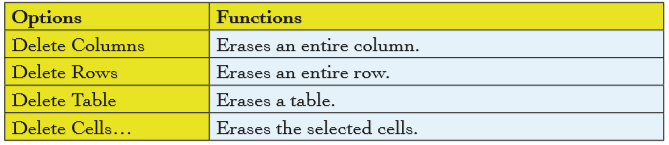
Figure 3.41: Options available in delete command
Method 2
Place the insertion point in the row or column next to which you want to insert a row or column.
(i) To insert rows: Right-click the mouse, then select Insert Row Below or Insert Row Above from the pop-up menu that appears. Your choice is dependent on what you desire.
(ii) To insert columns: Right-click the mouse, then select Insert Column to the Right or Insert Column to the Left from the pop-up menu that appears. Your choice is dependent on what you desire. See Figure 3.4 on page 78.
Place the insertion point in the row or column you want to delete.
(i) Right-click the mouse, then select Delete Cells... from the menu that appears.
(ii) Select Delete Cells.

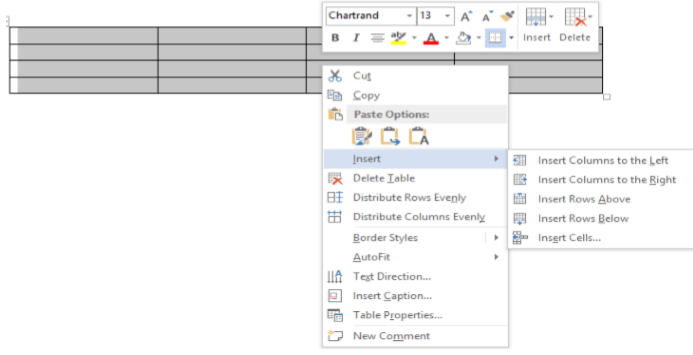
Figure 3.42: Inserting rows and columns by right-clicking
3.5.3 Merging Cells and Splitting Cells
Merge cells command is used to combine more than one cells to appear as one large cell while split cells command is used to divide a cell to more than one section hence appearing as many different cells.
Merging cells
The following is the procedure for merging cells:
(i) Select the cells to be merged.
(ii) Click Layout tab from the menu bar and select Merge Cells icon under the Merge group. The cells are automatically combined.
Splitting cells
The following is the procedure for splitting cells:
(i) Position the cursor in the cell to be split.
(ii) Click Layout tab from the menu bar and select Split Cells command under the Merge group. The keyboard shortcut is as follows: Long press ALT, press JL, then P.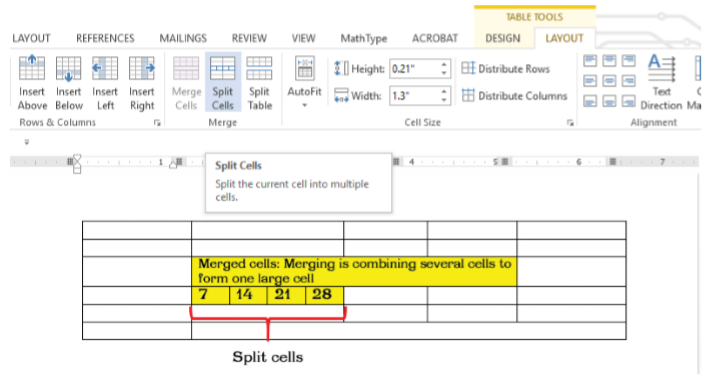
Figure 3.43: Merged and split cells
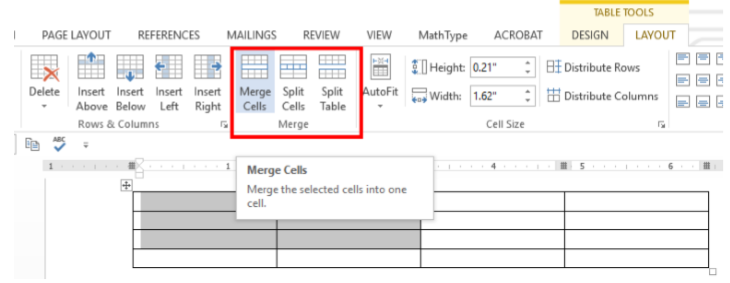
Figure 3.44: Merging and splitting cells
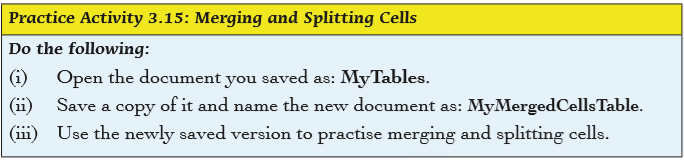
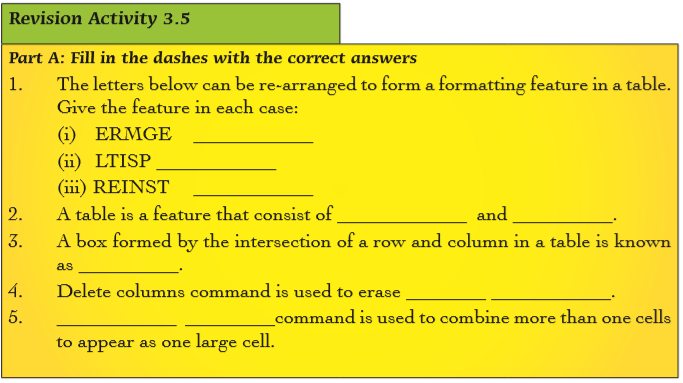
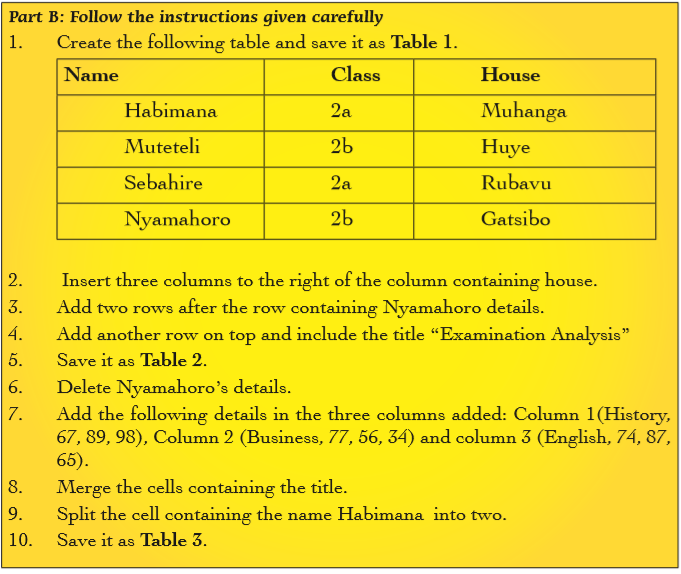
3.5.4 Table Auto Format and Formulas
Table Auto format
This option provides in-built table formats that enable the user to quickly design tables with a professional look. To apply this feature, do the following:
(i) Position the cursor where the table is to be inserted.
(ii) Click on Insert tab from the menu bar and select Table command under the Tables group.
(iii) Select Quick Tables. A dialog box appears as shown in Figure 3.45.
The keyboard shortcut is as follows: Long press ALT, press N then T and finally T.

Figure 3.45: A dialog box for auto formatting a table
Formulas
Formulas are used to perform calculations in a table. Microsoft Word 2013 enables the user to add formulas in a document in order to perform simple calculations. The user can do the following:
(i) Total numbers in a row or column.
(ii) Perform other calculations.
Total numbers in a row or column
(i) Click the cell in which the sum is to be displayed.
(ii) Click Layout tab from the menu bar and select fx command under the Data group. The formula dialog box is displayed as shown in Figure 3.46. The keyboard shortcut is Long press ALT, press JL then UL.

Figure 3.46: Formula dialog box
(iii) If the selected cell is at the bottom of a column of numbers, Microsoft Word proposes the formula =SUM (ABOVE). If the selected cell is at the right end of a row of numbers, the formula =SUM (LEFT) is proposed by Microsoft Word.
(iv) Click OK to apply if the proposal displayed is correct.
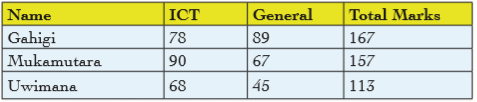
Figure 3.47: Total marks calculated
Notes
• If a column or a row contains any blank cells, Microsoft Word will not total the entire column or row. To total the entire row or column, type a zero in the blank cell.
• If a column or a row selected for totalling does not contain a value, Microsoft Word will not display any proposal in the formula box.
• Microsoft Word inserts the result of the calculation automatically in the selected cell. If the values in the referenced cells are changed, select the cell containing the result and then press F9 to update the value.
Perform other calculations in a table
The user can perform other calculations by selecting a function from the Paste function.
(i) Click the cell where the formula is to be typed.
(ii) Click Layout tab from the menu bar and select fx command under the Data group.
(iii) Delete the proposed formula from the Formula box if it is not desired except the equal sign.
(iv) Select a function from the Paste function box. For instance, to obtain average, click Average. The formula dialog box is displayed as shown in Figure 3.48.
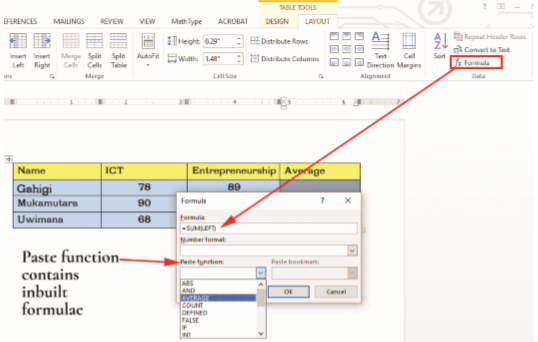
Figure 3.48: The Formula dialog box
(v) Click in the parenthesis and type “Left” or “Above” depending on where the cells are located. See Figure 3.49.
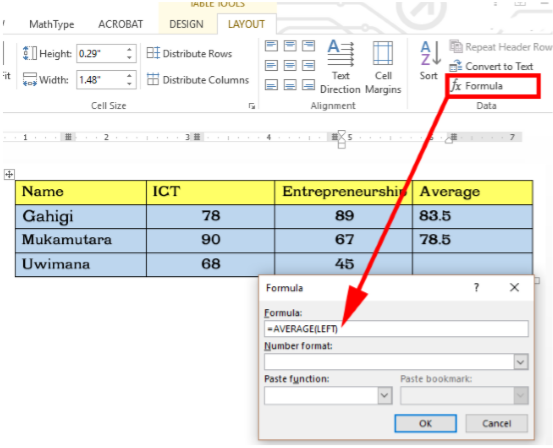
Figure 3.49: Average is used to display the mean of selected cell
(vi) In the Number Format box, enter a format for the numbers. For example, to display the numbers as a decimal percentage, click 0.00%.
3.5.5 Writing a Formula
You can sum numbers in a column or a row in a table. To add up a column or row numbers in a table, use the Formula command.
(i) Click the table cell where you want your result.
(ii) Click the Table Tools Layout tab and click Formula.
(iii) Check between the parentheses to make sure the selected formula includes the cells you want in the sum. In this case, the sum required is of the cells to the left. The formula to use is =SUM(LEFT)
(iv) Other formulas available are:
=SUM(ABOVE) adds the numbers in the column above the current cell.
=SUM(LEFT) adds the numbers in the row to the left of the current cell
=SUM(BELOW) adds the numbers in the column below the current cell.
=SUM(RIGHT) adds the numbers in the row to the right of the current cell.
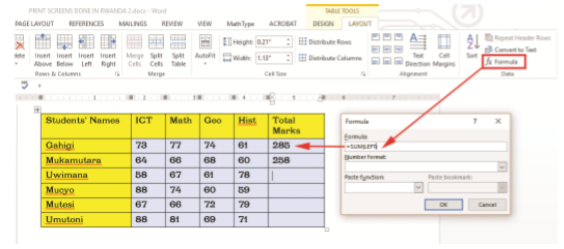
Figure 3.50: Summing numbers in rows and columns
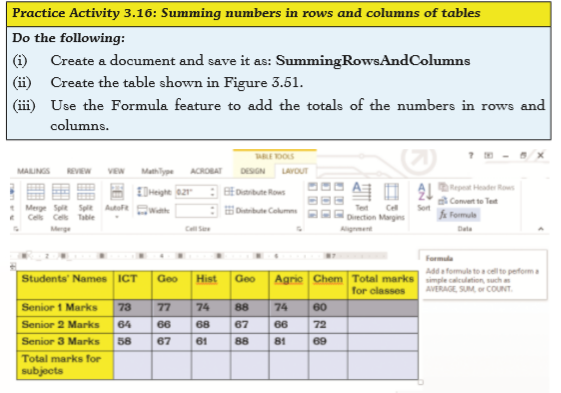
Figure 3.51: Summing numbers in rows and columns
3.5.6 Writing in a Table and Text Direction
To write data in a table, click on a cell then type the information.
To change the direction of text in a cell, do the following:
(i) Click on the cell where the data is to be displayed.
(ii) Click Layout Tab from the menu bar. Select Text direction icon in the Alignment group. The text direction is automatically changed. Keep clicking on Text direction command until the desired direction is reached. See Figure 3.52.
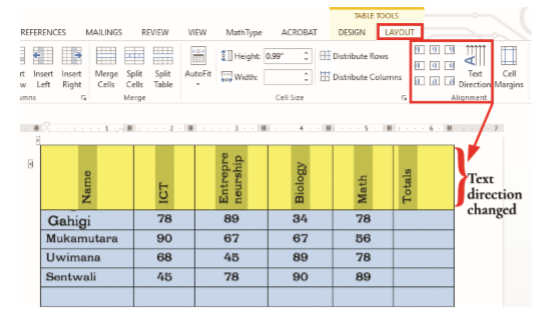
Figure 3.52: Changing of text direction
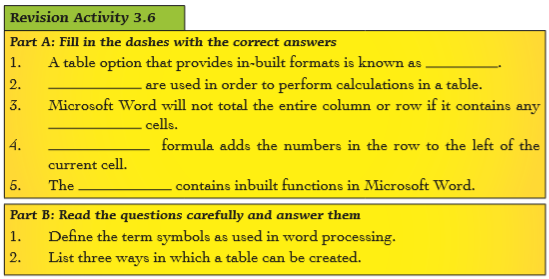
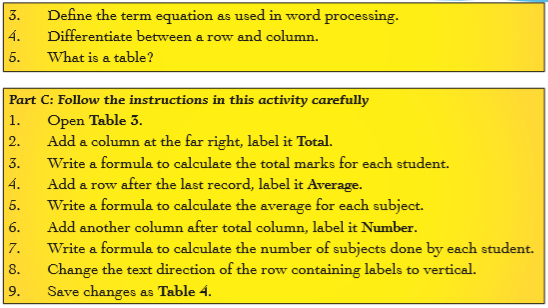
3.5.7 Table Properties, Layout, and Design
To change the properties of a table, do the following:
(i) Right-click on the table. A popup menu appears as shown in Figure 3.53.
(ii) Select Table Properties… option. A dialog box appears as shown in Figure 3.54.
(iii) The Table Tab is active by default. Make the desired changes such as indentation, alignment, border and shading, text wrapping, and indentation.
(iv) Click OK to apply.
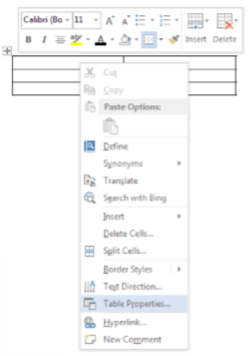
Figure 3.53: Table properties options
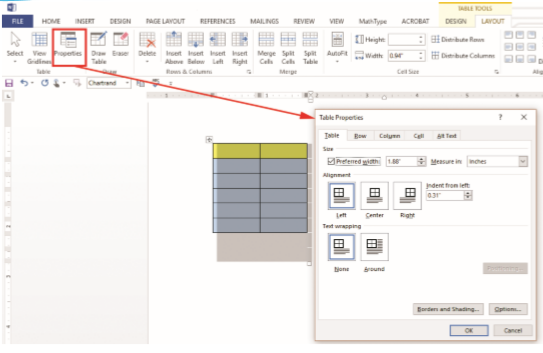
Figure 3.54: Table Properties dialog box
Borders and Shading
To change borders and shading style of a table, do the following:
(i) Right-click on the table. A pop-up menu appears as shown in Figure 3.55.
(ii) Select Table Properties… option. A dialog box for Borders and Shading appears as shown in Figure 3.56.
(iii) Click on Borders and Shading button. A dialog box appears as shown in Figure 3.57.

Figure 3.55: Table Properties in the pop-up menu
(iv) Borders tab is selected by default. Click on the desired line Style, Colour, and Width.
(v) To apply a shading style, click on Shading tab and select the desired option.
(vi) Under Apply to, select Table. Click OK to apply.
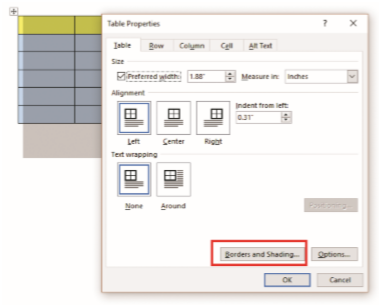
Figure 3.56: Borders and shading dialog box
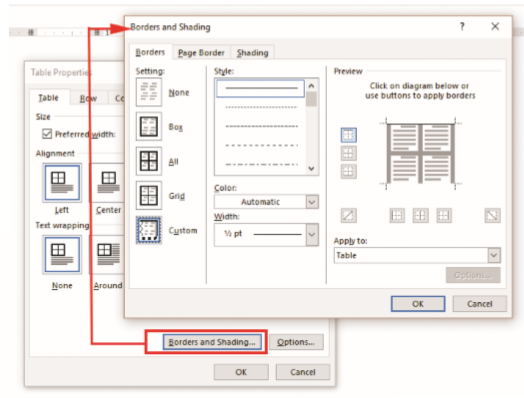
Figure 3.56: Borders and Shading dialog box
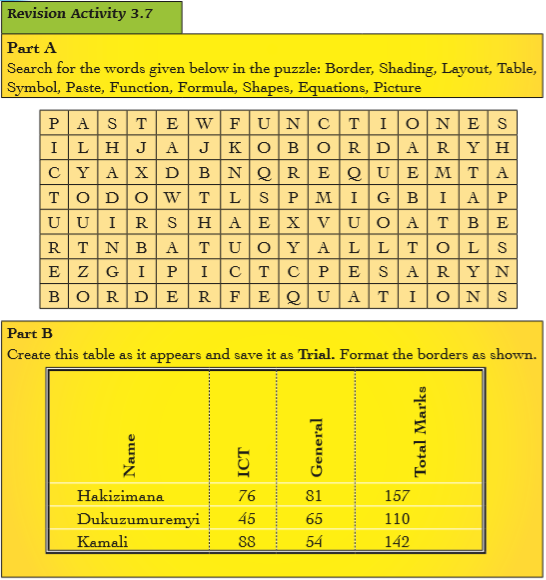
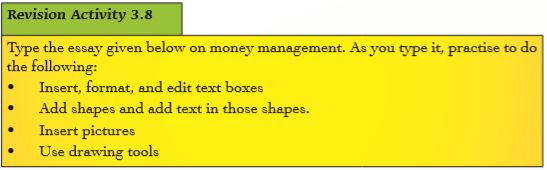


3.6 Definition of key words in this unit

Revision Exercise 3

Unit 4:Spreadsheet Basics
Key Unit Competency: By the end of this unit, you should be able to:1. Work with spreadsheets and apply basic manipulation of cell content using arithmetic operations.
Introduction
A spreadsheet program is an interactive program that enables the user to layout and organise numerical data tabular form. Spreadsheets contain rows and columns that intersect to form cells into which data are entered.
Examples of spreadsheet programs include the following: Microsoft (MS) Excel, Lotus 1-2-3, Quattro Pro, Multiplan, and Super Calc among others. The spreadsheet program discussed in this unit is Microsoft Excel 2013 (Ms Excel 2013).
4.1 Definition and Role of a Spreadsheet
A spreadsheet is a software that enables the user to organise numerical data on the screen in a tabular form. The program is made up of rows and columns used to present and analyse numerical data.
The word spreadsheet is also used to describe an electronic document in which data is arranged in the rows and columns of a grid. A spreadsheet can be manipulated and used in calculations.
Spreadsheets enable the user to enter data, edit and perform calculations, as well as present data in graphic form.
4.1.1 Features of Spreadsheets
(a) They consist of a workbook and worksheets.
(b) Every worksheet consists of cells where data is entered.
(c) Every individual cell has a unique cell address used for identification.
(d) It contains inbuilt formulas known as functions that enable the user to perform calculations quickly.
(e) It allows presentation of information using charts.
4.1.2 Create, Save, and Open a Workbook
A workbook refers to a file that can contain one or more worksheets used to organise different kinds of related data.
A worksheet is a form containing cells that are organised in rows and columns. A worksheet on a computer screen resembles a sheet of paper with multiple columns that are used to analyse numerical data.
Opening Microsoft Excel Program
When you open Microsoft Excel 2013, the first window that is displayed is as shown in Figure 4.1 below:
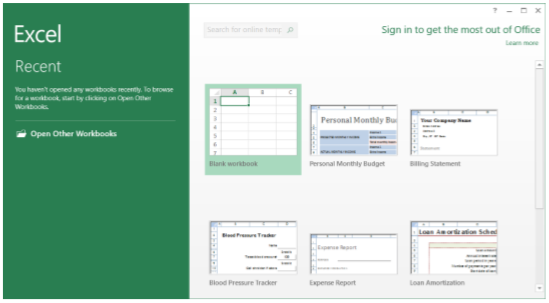
Figure 4.1: Opening Microsoft Excel 2013
There are four possible ways of starting Microsoft Excel program. These are:
(i) Click START button, select All Apps then Click on Microsoft Office to display a list of programs contained in the office suite. Click on Excel 2013.
(ii) Type the word RUN in the Search the web and Windows box next to the start button then press Enter key. Type excel in the dialog box that appears and click OK, or Press ENTER on the keyboard.
(iii) Click START button then select Microsoft Excel 2013 if it was pinned on the start menu.
(iv) Click Microsoft Excel 2013 icon if it was pinned on the task bar.
Note: Any of the options above will display a window as shown in Figure 4.1. Click on the blank workbook icon to launch Excel and open a workbook window.
Creating a workbook
When Excel is launched, it automatically opens a workbook containing a worksheet with a default name of Sheet1.
After the program is opened, the following steps can be used to create a new workbook:
(i) Click on the File tab from the menu bar.
(ii) Select New from the pull down menu.
(iii) Click on the desired template from the right pane. For example, to create a new blank workbook, click on the Blank workbook option.
Saving a workbook
To save a workbook for the first time, do the following:
(i) Click on the File Tab in the menu bar.
(ii) Click the Save As option from the pull down menu that appears. The Save As window appears on the right as shown in Figure 4.2.

Figure 4.2: Saving a workbook
(iii) Click on the location where the workbook is to be stored if it displayed on the Save As window. Otherwise click on Browse or Computer icon to display the Save As dialog box as shown in Figure 4.3. The keyboard shortcut for saving a document in Excel is as follows: Long press ALT then select F then A and finally press 1.
(iv) Type the name of the workbook in the File name box. To select another storage location click on it on the left pane of the window.
(v) Click Save button.
Once a workbook has been saved, a user can make changes to it and save it under the same name or a different name. To save changes on an existing workbook, do one of the following:
(i) Press Ctrl + S on the keyboard.
(ii) Click the File tab, then select Save command.
(iii) Click the Save icon on the Quick Access Tool bar.
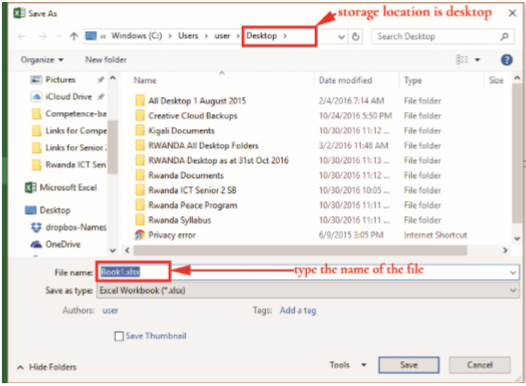
Figure 4.3: Choosing the location for saving a document
To close an active workbook, do one of the following:
(i) Click Close button on the title bar of the active worksheet.
(ii) Press ALT + F4 on the keyboard.
(iii) Click the File Tab then select Close command.
Opening an existing workbook
It is also known as retrieving a saved workbook. To open an already saved workbook, do one of the following:
It is also known as retrieving a saved workbook. To open an already saved workbook, do one of the following:
(i) Click the File tab then select Open command. Select the location where the workbook was stored then click on the name of the workbook from the list displayed or click Browse to locate the file and finally click Open.
(ii) If the file was among the ones that were recently created or modified, click on the File tab, select Open command then finally click on the name of the file in the Recent Workbooks pane .
(iii) Click Open icon on the Quick Access Toolbar. The open window appears. Proceed as in option (i) or (ii) above.
(iv) Press CTRL + O on the keyboard and proceed as option (i) or (ii) above.
(v) Open the location where the workbook was saved then double click on the workbook.
4.2 Spreadsheet Environment
The spreadsheet package used in this case is Microsoft Excel (Ms-excel) 2013. It contains the following parts:
• Title bar: It displays the name of the application currently in use as well as the name of the active workbook. When a new spreadsheet is opened, Ms Excel allocates default names such as Book1, Book2 and so on. The default name changes any time the workbook is saved using a new name.
• Buttons: The title bar also contains three buttons which are: Minimise, Restore Down/Maximise and Close buttons at the top right corner.
• Menu bar: This bar displays the following tabs: File, Home, Insert, Page Layout, Formulas, Data, Review and View. Additional tabs appear when a chart is inserted or selected.
• Ribbon: The ribbon consists of icons of commands organised and classified into groups. Clicking on any tab on the menu bar displays a ribbon unique to it. For example, clicking on Page Layout tab displays a ribbon with 5 groups namely Themes, Page Setup, Scale to Fit, Sheet Options and Arrange.
• The Quick Access Toolbar: It is a small customisable toolbar of the most commonly used commands located at the top left corner of the workbook window. By default, this bar contains Save, Undo and Redo commands. See Figure 4.4 on page 100.
It can be customised in the following ways:
(i) It can be made to appear above or below the ribbon.
(ii) Commands can be added or removed from it.
• Scroll bar: The scroll bar allows one to move or navigate through a large worksheet. There are two types of scroll bars the vertical scroll bar and horizontal scroll bar. Vertical scroll bar allows upward or downward movement on the worksheet while horizontal scroll bar allows movement from left to right and vice versa.
• Formula bar: It provides the user with a box for entering or editing data or formula in a cell. It is located below the ribbon by default. It contains the cell naming box and the formula box used for entering a formula or editing data.
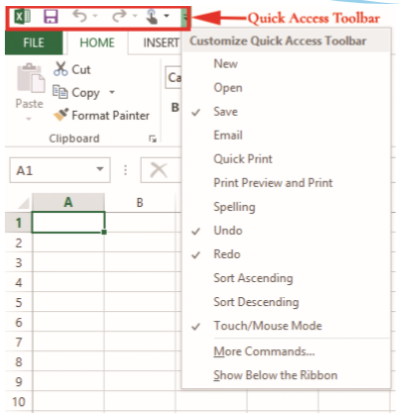
Figure 4.4: Customising the Quick Access Toolbar
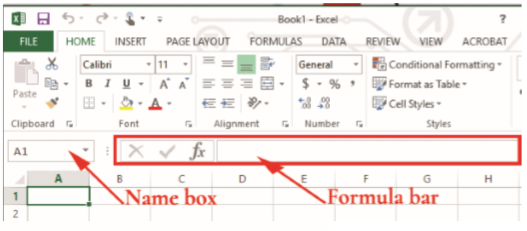
Figure 4.5: The formula bar contains the name box and the formula box
• Status bar: It is located at the bottom of the window and it displays status on options that are selected to appear on the status bar. For example, to display average, count, or sum of selected cells is looking at the status bar. Figure 4.6 shows a display of the status bar.
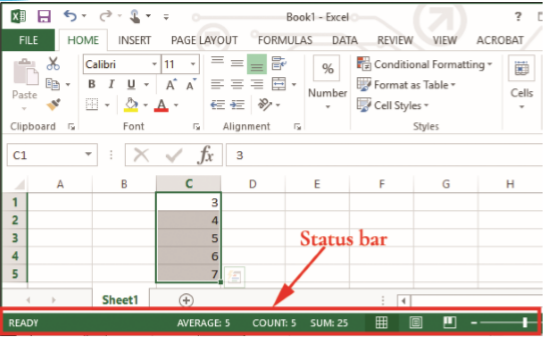
Figure 4.6: The Status Bar
• Cell: It is an intersection of a row and a column where data is entered.
• Active cell: It is also referred to as cell pointer or selected cell. It is a rectangular box highlighting the cell being worked with and where data is being entered. By default A1 is usually the active cell. To make a cell active simply click on it.
• Name box: It displays the name of the active cell.
• Column Title: It is also known as column heading and is labelled in letters. This is a row containing the column labels.
• Sheet Tab: It contains the name of the worksheets in the workbook.
• Row Title: It is also known as row heading and is labelled in numbers. This is a column containing the row labels.
Parts of the Microsoft Excel Window
Figure 4.5 shows the parts of Microsoft Excel window.
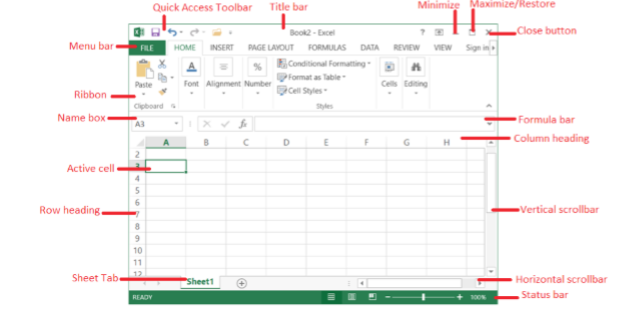
Figure 4.7: The Microsoft-Excel application window


4.3 Cell, Row, and Column basics
4.3.1 Definitions
• Row: It is a range of horizontal cells having a unique number. They run vertically on the left side of the worksheet.
• Column: It is a range of vertical cells labelled using a unique letter. They run horizontally at the top of the worksheet.
4.3.2 Cell Content
In this section we will discuss the different types of data in a cell. These types include: Labels, Values, Functions and Formulas.
(a) Labels
They are text or alphanumeric characters that are entered in a cell which cannot be manipulated mathematically. By default, all labels are aligned to the left of a cell.
Entering a Label
(i) Click on the cell where the text is to be entered.
(ii) Type the text.
(iii) Press the Enter key or click on a different cell.
(b) Values
They are numeric data that can be manipulated mathematically. They include numbers, dates, time and currency among others. A value can be entered as a label if it is preceded by an apostrophe. By default, all values are aligned to the right of a cell.
Entering Values
(i) Click on the cell where the value is to be entered.
(ii) Type the value.
(iii) Press the Enter key or click on a different cell.
(c) Formulas (or Formulae)
They are mathematical expressions created by the user. Every formula must have the following components:
(i) Begin with an equal sign (=).
(ii) Contain mathematical operation such as +, -, / and *.
(iii) Cell addresses that contain values.
(d) Function
They are in-built formulas in Excel. In-built means that they exist as essential parts of the program that the user can quickly apply to a cell in order to perform mathematical calculations. Every function must have the following components:
(i) Begin with an equals sign (=).
(ii) The name of the Function.
(iii) The cell addresses that contain values.
Entering formula Formulae can be typed within a cell in a worksheet but when the enter key is pressed, the actual cell displays the result of the calculation.
To view the formulae, simply click on the cell, it will be automatically displayed on the formula bar.
Enter data in a cell When data is typed in a cell, it is displayed in the selected cell as well as in the formula bar. The data enters the cell when the Enter key or Arrow key is pressed. Text can be wrapped on a cell by pressing ALT+ Enter while typing.
Selecting data
This refers to highlighting a cell containing data that is supposed to be formatted. The table below summarises the different ways of selecting data in a worksheet.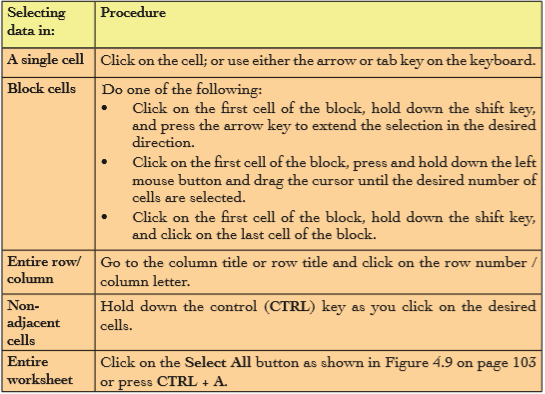
Copy and paste
Copying is the process of creating a duplicate of data. The content remains in its original location as a copy of it is stored on the clipboard. A clipboard is a temporary storage location for items to be moved or copied. Pasting is the process of inserting the current clipboard content to a new location. To copy and paste, do the following:
(i) Select or highlight the data.
(ii) Use one of the following options:
• Right-click on the highlighted data then select Copy from the pop-up menu. Press Ctrl + C on the keyboard. From Home tab, click Copy icon under the Clipboard group. Figure 4.10 on page 103 shows a section of the Home tab ribbon showing the clipboard group.
• The keyboard shortcut is as follows: Long press ALT then H and finally C key.
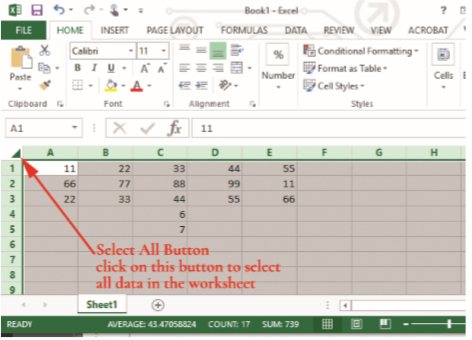
Figure 4.9: Using the Select All Data button
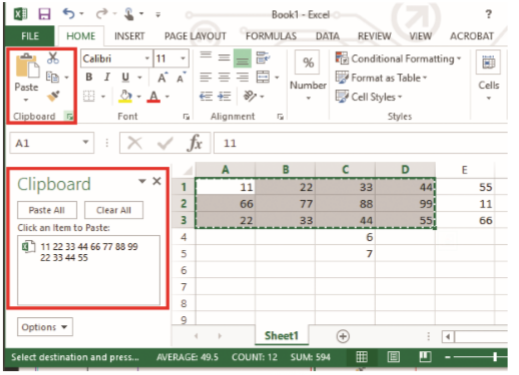
Figure 4.10: Copying and pasting
(iii) Position the cursor where the duplicate is to be placed.
(iv) Paste it by doing one of the following:
• From Home tab, click Paste icon under the Clipboard group.
• Right-click at the cursor position and select Paste from the pop-up menu that appears.
• Press Ctrl+ V on the keyboard.
Copying can also be done using Format Painter command. This method is used when copying formats which had been previously applied on a cell or a group of cells. To copy formats do the following:
(i) Select the cells containing the format to copy.
(ii) Click Format Painter from clipboard group in the Home tab.
(iii) Click the cells where the format is to be copied.
Note: To copy the formatting in the selected cell or range to several locations, double-click the Format Painter button. Click on the first location to apply the format then the second, third all the way to the last one.

Figure 4.11: Using the Format Painter
Cut and paste
Cutting is also known as moving. It is the process of changing the position of data to a new location. The data is deleted from its original location.
To move data, do the following:
(i) Select or highlight the text or object.
(ii) Use one of the following options:
• From Home tab, click Cut icon under the Clipboard group.
• Right-click on the highlighted text or object then select Copy from the pop-up menu.
• Press Ctrl + X on the keyboard.
(iii) Position the cursor where the data is to be transferred.
(iv) Paste it by doing one of the following options:
• From Home tab, click Paste icon under the Clipboard group.
• Right-click at the cursor position and select Paste from the pop-up menu that appears.
• Press Ctrl + V on the keyboard.
Changing row height
The row height can be made smaller or larger than the default. There are two methods of changing a row height.
Alternative 1
(i) Place the mouse pointer at the boundary between two rows on the row title.
(ii) When the mouse pointer changes to a two headed arrow, click and drag to the desired direction.
(iii) Release the mouse button to apply.
Alternative 2
(i) From Home tab, on the Cells group click on Format. A drop down menu appears as shown in Figure 4.12. keyboard shortcut is: Long press ALT key, then H followed by O to display a drop down menu.
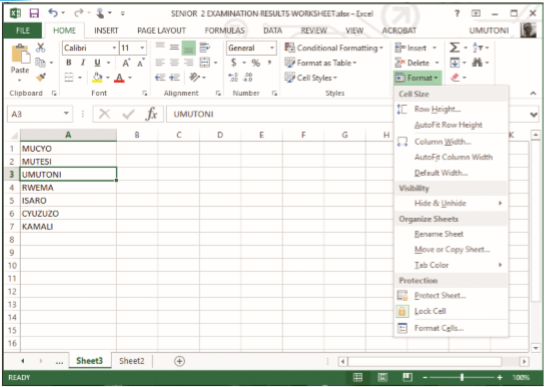
Figure 4.12: Changing the row height
(ii) From the resulting menu select Row Height… A dialog box appears as shown in Figure 4.13.
(iii) Type the desired value in the Row height box.
(iv) Click OK.

Figure 4.13: Row Height dialog box
Changing column width
The column width can be made narrow or wider than the default. There are two methods of changing a column width.
Alternative 1
(i) Place the mouse pointer at the boundary between two columns in the column title.
(ii) When the mouse pointer changes to a two headed arrow, click and drag to the desired column width.
(iii) Release the mouse button to apply.
Alternative 2
(i) From Home tab, on the Cells group click on Format.
(ii) From the resulting menu select Column Width… A dialog box appears as shown in Figure 4.14.
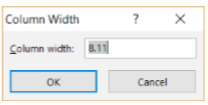
Figure 4.14: Column width dialog box.
(iii) Type the desired value in the Column Width box. Click OK.
Wrap text
Wrap text feature enables a cell to contain content that is larger than its size and all the content is displayed in multiple lines. The cell is automatically enlarged as data is entered. To wrap text, do the following:
(i) Select the cell(s).
(ii) Click on the Home tab then select Wrap text icon in the Alignment group.
Alternatively
(i) Select the cell(s).
(ii) Click on the Home tab then select Format icon under the cells group. (iii) Click on Format Cells… from the drop down menu. The format cells dialog box appears as shown in Figure 4.15. The keyboard shortcut is: Long press ALT key, then H followed by O and finally E.
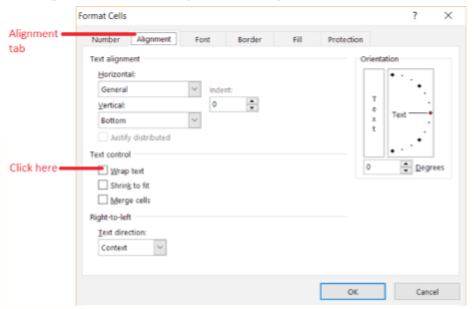
Figure 4.15: Wrapping text
(iv) Click on the Wrap text under the Text control section.
(v) Click OK to apply and close the dialog box. Figure 4.16 shows how the wrapped text will appear in the cell.

Figure 4.16: Cells containing wrapped text
Merge cells
Merge cells refers to the combination of two or more horizontally or vertically adjacent cells to become one large cell that is displayed across multiple columns or rows.
The content of the first highlighted cell appears in the merged cell. A single cell that is created by combining two or more selected cells.
The cell reference for a merged cell is the upper-left cell in the original selected range. To merge cells, do the following:
(i) Select the cells to be merged.
(ii) Click on the Home tab then select Merge & Center icon in the Alignment group. The cells are automatically merged. Figure 4.17 shows how the merged cells will appear.
Figure 4.17: Cells that have been merged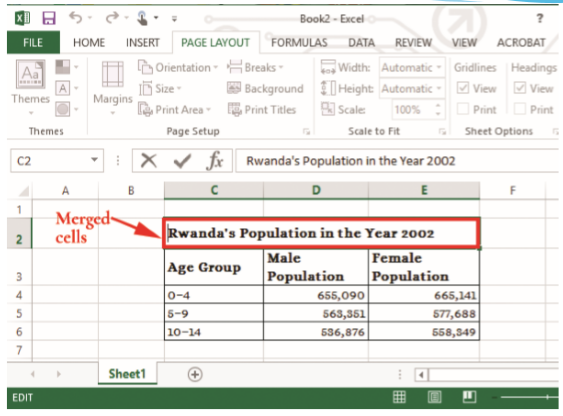
Inserting a column or a row
It is possible to insert a row or a column between existing rows or columns respectively.To insert a row or a column, do the following:
Inserting a column
(i) Click on the column heading to select it.
(ii) Right-click on the selected column, and then click Insert from the resulting pop-up menu to automatically add a new column to the left of the selected column.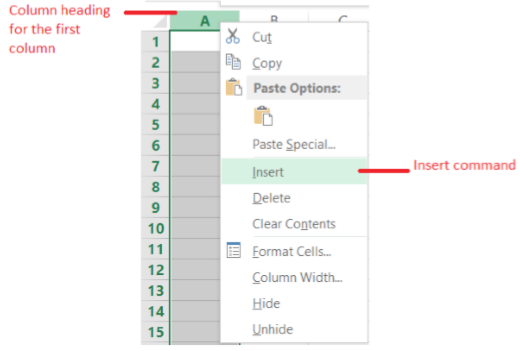
Figure 4.18: Click insert to add a column to the left
Inserting a Row
(i) Click on the row heading to select it.
(ii) Right-click on the selected row, and then click Insert from the resulting popup menu to automatically add a new row above the selected row.
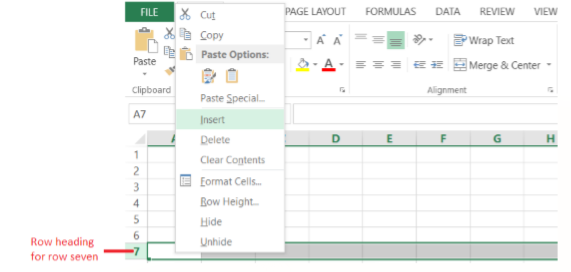
Figure 4.19: Click insert to add a row above row seven
Deleting rows and columns
To delete rows or columns in a worksheet do the following:
(i) Highlight a cell or cells to be deleted.
(ii) Right-click on the selected cell(s) then select Delete… option from the pop-up. A dialog box appears as shown in Figure 4.20.
(iii) Select on Entire row option to delete the selected row(s) or Entire column option to delete the selected column(s).
(iv) Click OK to apply.

Figure 4.20: Delete dialog box
Moving rows and columns
To move a row or column in a worksheet, do the following:
(i) Select the row or column to be moved.
(ii) Move the mouse pointer to the edge of the selection until it changes from a regular cross to a four-sided arrow cursor.
(iii) Then drag the column or row to a new location.
(iv) Release the mouse button to place the row or column to its new location.
Hide and unhide row/columns
This feature is used to temporarily hide rows and columns from view in order to prevent certain data from being changed or deleted. It is also used to simplify the appearance of a spreadsheet. To hide or unhide a row or a column; do the following:
(i) From Home tab, on the Cells group click on Format.
(ii) From the resulting drop down menu, point to Hide & Unhide then select the desired option from the side kick menu as shown in Figure 4.21 on page 112. The keyboard shortcut is: Long press ALT key, then H followed by O and finally U.
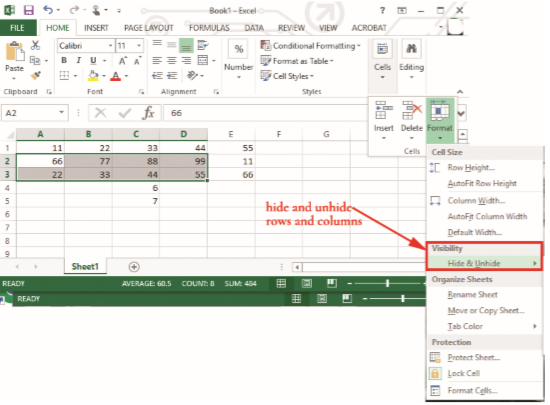
Figure 4.21: Hiding and unhiding columns

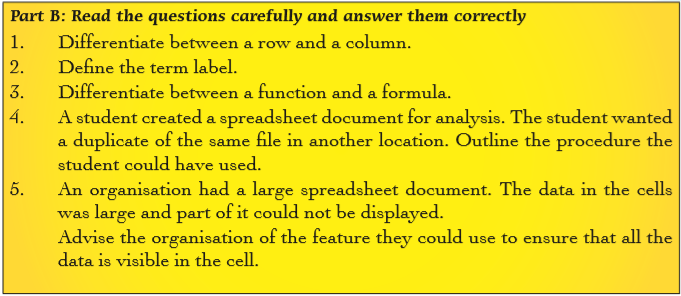
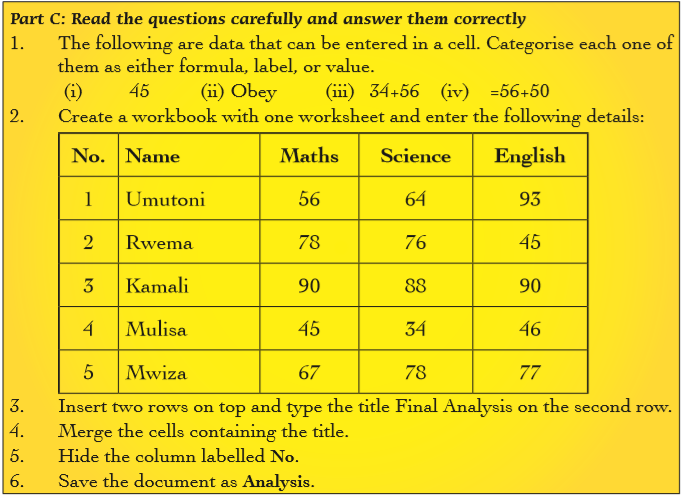
4.4 Formatting a Cell
Formatting is the process of improving the appearance of a data in a worksheet. The following are some of the formatting options available in Microsoft Excel: font, text alignment and orientation, cell borders and fill colours, and formatting numbers and text.
4.4.1 Font
There are different ways of changing the font of text in a worksheet:
(a) Using icons in the Home tab ribbon.
To format font in cells using this option, do the following:
(i) Select the cells.
(ii) Click on the arrow on the Font list box as shown in Figure 4.22.
(iii) Select the font from the list.
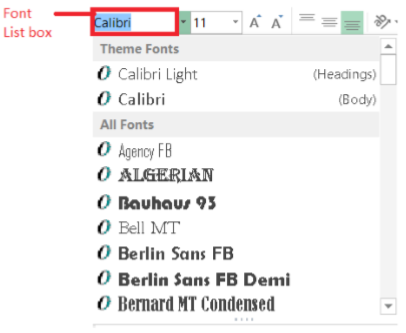
Figure 4.22: The font list box
(b) Using the dialog box launcher
(i) Select the cells to apply the format and do the following:
(ii) From Home tab, under the Font group, click on the dialog box launcher to get a dialog box as shown in Figure 4.23.
(iii) Select the desired font attributes.
(iv) Click OK to apply. The keyboard shortcut is: Long press ALT key, then H followed by FN. Use the arrow keys to select a tab.
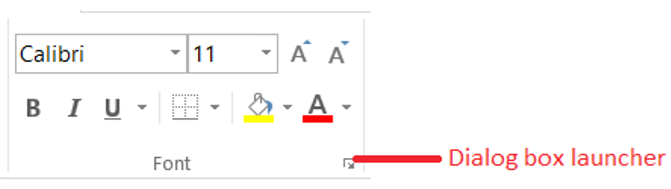
Figure 4.23: Using the dialog box launcher to change font

Figure 4.24: Selecting font attributes
4.4.2 Text Alignment and Orientation
To format text alignment, do the following:
(i) Select the cells to apply the format.
(ii) From Home tab, under the Alignment group, click on the dialog box launcher.
(iii) Select the desired alignment option from the available options in the resulting dialog box shown in Figure 4.25.
(iv) Click OK to apply. The available options include:
• Alignment: This contains the following options:
• Text Alignment: It contains three options, namely horizontal, vertical and indent.
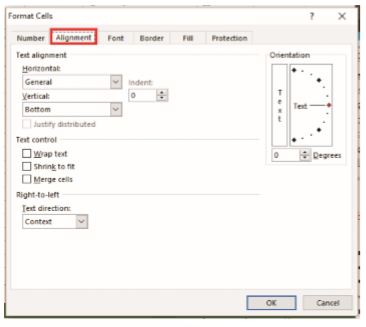
Figure 4.25: Controlling and aligning text
- Horizontal: It is used for changing the horizontal alignment of cell contents. Click on the box to make the desired option.
- Vertical: Used for changing the vertical alignment of cell contents. Click on the box to make the desired option.
- Indent: It indents cell contents from any edge of the cell, depending on the selection made under Horizontal or Vertical options.
• Orientation: Used to change the angle at which the text is inclined in the selected cells.
Degrees: Sets the value in which text will be rotated in the selected cell.
• Text control: The options under Text control are used to adjust how the text should appear in a cell. They include:
Wrap text: Wraps text into multiple lines in a cell. The number of wrapped lines is dependent on the width of the column and the length of the cell contents.
Shrink to fit: Decreases the apparent size of font characters so that all data in a selected cell fits within the column.
Merge cells: Joins two or more selected cells into one large cell.
• Right-to-left: Select an option in the Text direction box to specify reading order and alignment.
• The keyboard shortcut is: Long press ALT key, then H followed by FN. Use the arrow keys to select a tab.
4.4.3 Cell BordersThe worksheet gridlines do not appear when a worksheet page is printed. The cell border helps in ensuring that the cell outline appears in the print out. They are also used for enhancing the appearance of a document. To apply cell borders, do the following:
(i) Select the cells to apply the format.
(ii) From Home tab, under the Font group click on dialog box launcher.
(iii) Click on Border tab. A dialog box will appears as shown in Figure 4.26.
(iv) Select the desired border style under Style option.
(v) Click the buttons under Presets or Border to apply borders to the selected cells. To remove all borders, click the None button. It is also possible to click areas in the text box to add or remove borders. To change Colour, click on the Colour list box and select the desired colour from the colour palette.
(vi) Click OK to apply.
The keyboard shortcut is: Long press ALT key, then H followed by FN. Use the arrow keys to select a tab.
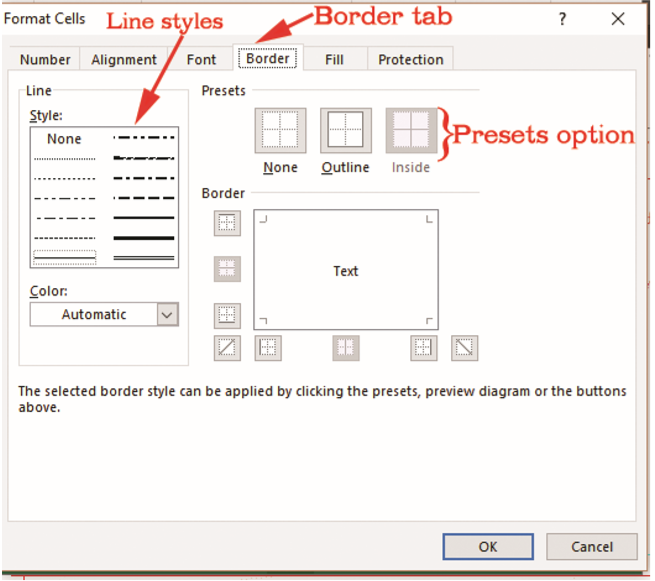
Figure 4.26: Formatting cell borders
4.4.4 Fill Colours
To apply the fill colour command, do the following:
(i) Select the cells to apply the format.
(ii) From Home tab, under the Font group click on dialog box launcher.
(iii) Click on Fill tab. A dialog box will appear as shown in Figure 4.27.
(iv) Select the desired fill style from the available options, namely background colour, pattern colour, and pattern style and fill effects.
(v) Click OK to apply.
The keyboard shortcut is: Long press ALT key, then H followed by FN. Use the arrow keys to select a tab.

Figure 4.27: Formatting colours
4.4.5 Formatting Number
Select the cells to apply the format and do the following:
(i) From Home tab, under the Font group click on dialog box launcher.
(ii) Click on Number tab. A dialog box will appear as shown in Figure 4.28. The keyboard shortcut is: Long press ALT key, then H and finally FN.
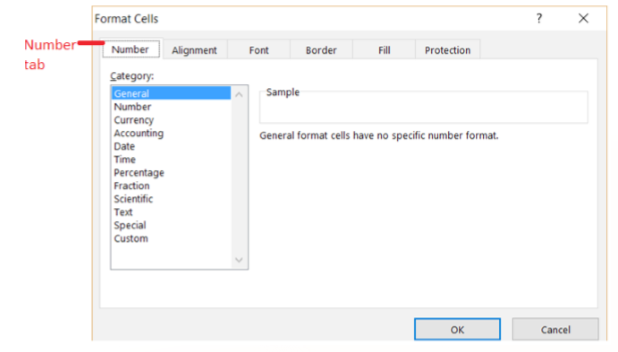
Figure 4.28: Formatting number
(iii) Under Category section, select an option and then select the desired options to specify a number format. The chosen format is shown as it will appear in the Sample box.
(iv) Click OK to apply.
4.5 Worksheet Basics
When excel is activated, a workbook is launched with a default worksheet. The user can insert, delete, rename, copy move a worksheet. The following commands can be used when manipulating a worksheet.
4.5.1 Inserting a Worksheet
This feature enables the user to add a worksheet in a workbook. By default, the workbook in Microsoft Excel 2013 only comes along with one worksheet. To add another worksheet, do the following:
(i) Right-click on the name of the sheet. A pull-up menu appears as shown in Figure 4.29.

Figure 4.29: Adding a worksheet
(ii) Select Insert option. A dialog box appears as shown in Figure 4.30.
(iii) Click OK to apply. The new worksheet name appears before the current worksheet.
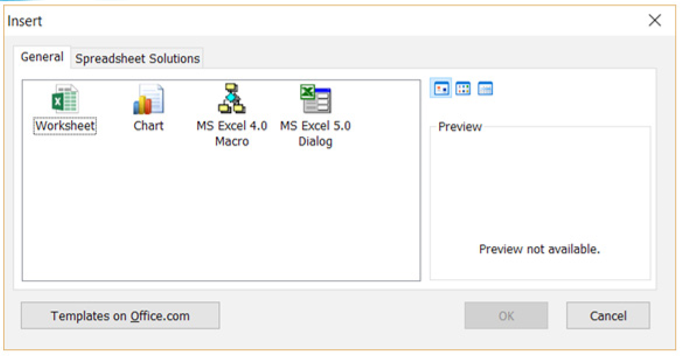
Figure 4.30: Inserting a worksheet
This option is used when the entire worksheet is to be deleted. Do the following:
(i) Right-click on the name of the sheet. A pull-up menu appears as shown in Figure 4.31.
(ii) Select Delete option. The sheet is automatically deleted.

Figure 4.31: Click on Worksheet name then select Delete to apply
4.5.3 Renaming a Worksheet
Renaming is the process of assigning a worksheet a different name. To rename a worksheet, do the following;
(i) Double click on the name of the worksheet. The worksheet is highlighted as shown in Figure 4.32.
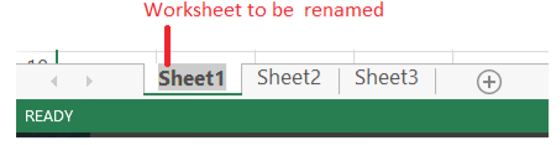
Figure 4.32: Renaming a worksheet
(ii) Type the desired name and then press Enter.
4.5.4 Copying and Moving a worksheet
(i) Right-click on the name of the sheet. A pull-up menu appears as shown in Figure 4.33.

Figure 4.33: Moving or copying a worksheet
(ii) Select Move or Copy option. A dialog box appears as shown in Figure 4.34.
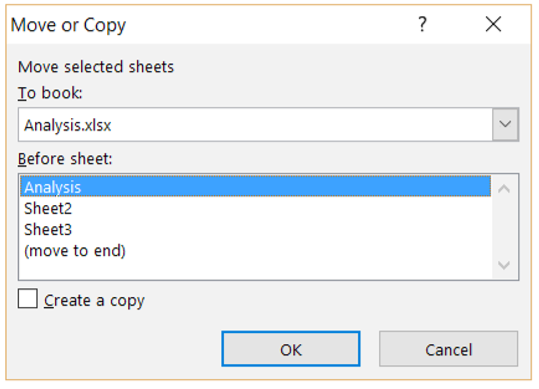
Figure 4.34: Moving a selected worksheet
(iii) Select the book name in the To book: list and the worksheet to appear before it in the Before sheet: box.
(iv) When Copying click on the Create a copy check box to enable it duplicate the worksheet else it will be moved.
(v) Click OK to apply.
4.5.5 Grouping and Ungrouping Worksheets
Grouping worksheets
(i) Select the first worksheet to be included in the group.
(ii) Press and hold the CTRL key on your keyboard.
(iii) Select the next worksheet needed in the group.
(iv) Release the CTRL key.
(v) Select Group.
Ungrouping worksheets
(i) Select the grouped worksheets to be ungrouped into separate worksheets.
(ii) Select Ungroup.

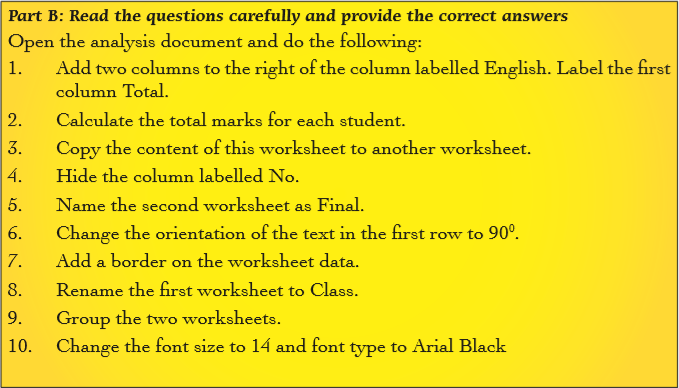
4.6 Mathematical Operators
Operators are symbols used in a formula to define the relationship between two or more values or cell references. They are symbols or signs that represent arithmetic operations in Excel formula. There are four major mathematical operators that can be used to write an expression.
Figure 4.35 shows different operators as well as their functions.

Figure 4.35: Mathematical operators and their functions
Figure 4.36 shows data about student’s marks of different subjects entered in a worksheet.
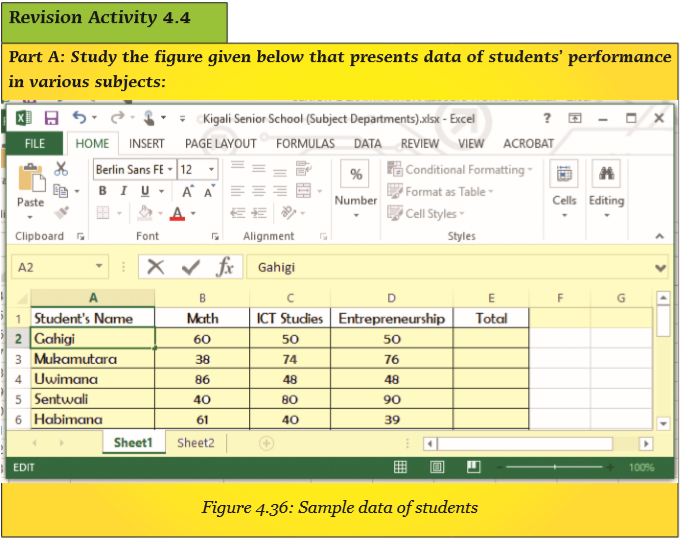

4.7 Definition of Key Words in this Unit
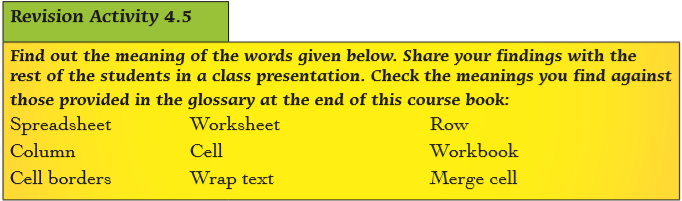
Revision Exercise 4
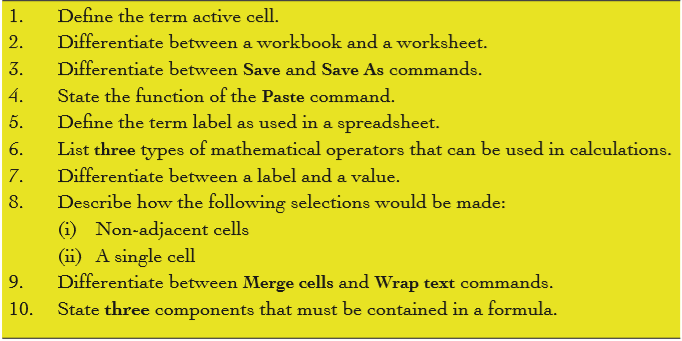
Unit 5:Worksheet Data Presentation
Key Unit Competency: By the end of this unit, you should be able to:
Manage a window, sort and filter data in a spreadsheet.
Introduction
The Microsoft Excel worksheet is made up of many columns and rows. Information entered in a worksheet may occupy many columns and rows such that it cannot be viewed in one screen.
This topic introduces the learner to ways of dealing with large data and information in a worksheet such as sorting, filtering, freezing, and splitting worksheets.
5.1 Freeze panes
If information in the worksheet stretches down or across more than one screen, normally as the user scrolls down or across the worksheet, the information keeps on disappearing to the top or to the left as the ones towards the bottom or right of the screen are displayed.
The freeze command is used to permanently display selected rows or columns. For example, the column or row titles can be frozen to ensure that the data displayed is viewed with the correct title after scrolling.
5.1.1 Freeze Top Row
If a worksheet contains a large amount of information, the top row containing the titles or column headings could be frozen to keep it visible while scrolling through the rest of the worksheet. To freeze the top row, do the following:
(i) Select a cell in the top row where the freeze command is to be applied.
(ii) Click on View Tab on the menu bar.
(iii) Click on the Freeze Panes icon under the Window Group on the ribbon. A down menu appears as shown in Figure 5.1.
(iv) Select on Freeze Top Row option to automatically the freeze command. The keyboard shortcut for freezing a pane is: Long press ALT, press W then F.
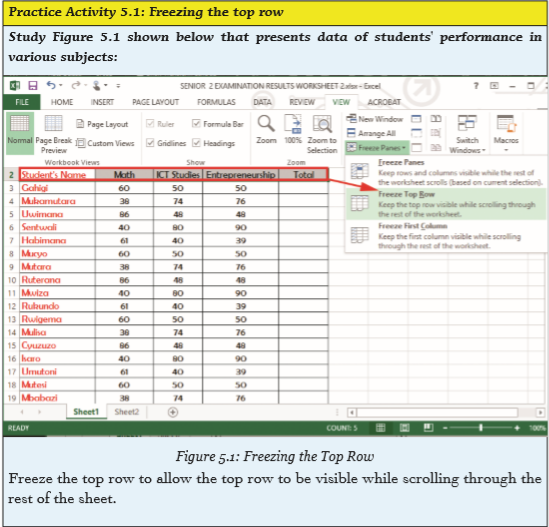
5.1.2 Freeze First Column
The first column containing row headings could be frozen to keep it visible while through the rest of the worksheet. To freeze the first column, do the following:
(i) Select a cell in the first column where the freeze command is to be applied.
(ii) Click on View Tab on the menu bar.
(iii) Click on the Freeze Panes icon under the Window Group on the ribbon. A drop down menu appears as shown in Figure 5.1.
(iv) Select on Freeze First Column option to automatically activate the freeze command.
Table 5.1 provides a summary of the available freezing options and their functions.
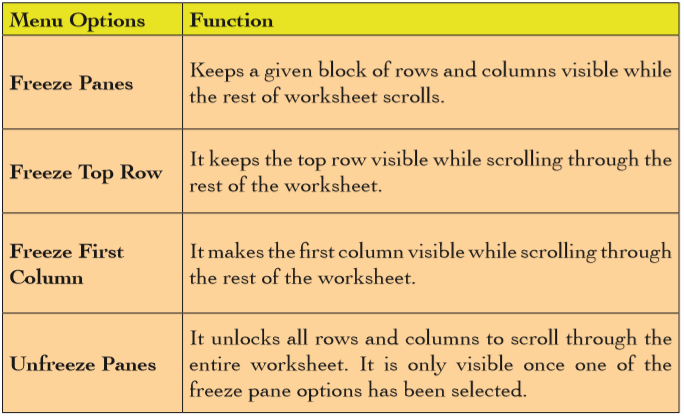
Table 5.1: Freeze menu options

5.2 Workbook View
Microsoft Excel provides the following workbook views: Normal, Page break Preview, Page Layout, and Custom View. They are found in the View tab of the menu bar under the Workbook Views group.
5.2.1 Normal
It displays the worksheet in normal view. It is the default view. However, if the worksheet was displayed in another view, to change to normal view, select the Normal option from the Workbook Views group. The worksheet appears as shown in Figure 5.3. The keyboard shortcut is as follows: Long press ALT, press W then L.
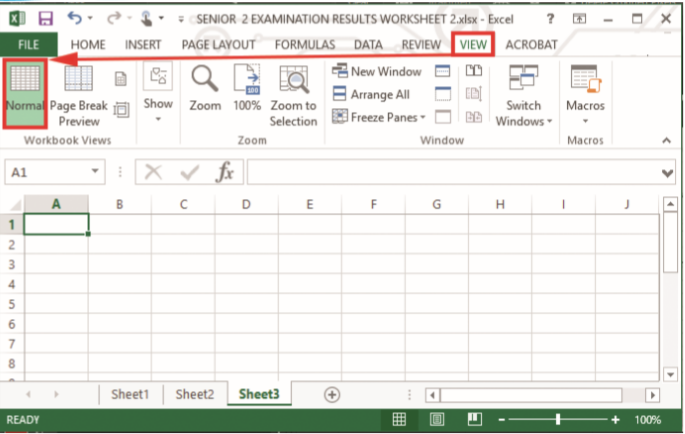
Figure 5.3: The normal workbook view
5.2.2 Page Layout
This view display the worksheet as it will appear on a printed page. It is used to view where pages begin, end and to view or insert footers or headers on the page.
It can only apply if no column or row has been frozen. To display a worksheet in page layout view, select the Page Layout option from the Workbook Views group.
The worksheet appears as shown in Figure 5.4. The keyboard shortcut is as follows: Long press ALT, press W then P.
5.2.3 Page Break Preview
It is used to display a preview of where pages in a document will break when being printed. To display a worksheet in page break preview, select the Page Break Preview option from the Workbook Views group. The page numbers appear as water marks. The worksheet appears as shown in Figure 5.5. The keyboard shortcut is as follows: Long press ALT, press W then I.

Figure 5.4: The page layout workbook view
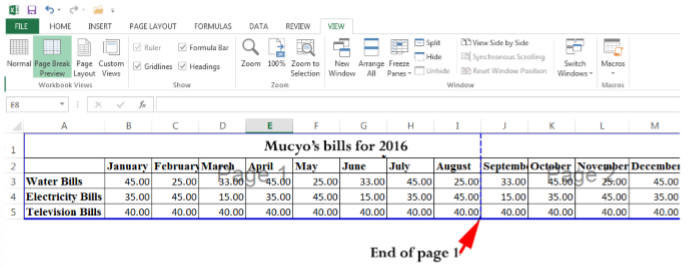
Figure 5.5: The page break workbook view
5.2.4 Custom Views
This is a flexible tool that can be used to view the same data in different ways, which is faster than manually changing the settings. This view can retain hidden columns and rows, some filters, zoom and print settings among others.
To create a customised view, do the following:
(i) Select one of the above views then click on Custom Views option from the Workbook Views group. A dialog box appears as shown in Figure 5.6. The keyboard shortcut is as follows: Long press ALT, press W then C.
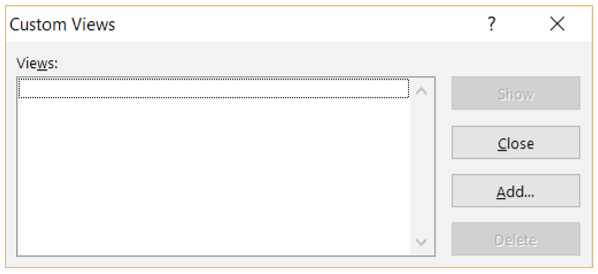
Figure 5.6: Adding a custom workbook view
(ii) Click Add… command. The Add View dialog box is displayed as shown in Figure 5.7. The keyboard shortcut is as follows: Long press ALT, press W then C, press Tab key to move to Add button then finally press Enter.

Figure 5.7: Naming a custom workbook view
(iii) Type the name of the view in the Name text box then click OK.
(iv) To display a list of the created customised view, select the Custom Views option from the Workbook Views group. A dialog box appears as shown in Figure 5.8. To open a worksheet in an already created custom view, select the view from the Views list then click Show.
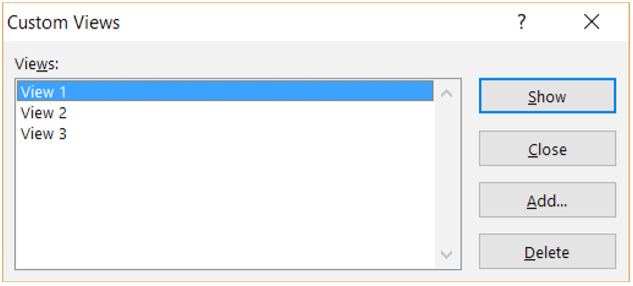
Figure 5.8: Viewing a workbook in a custom view
5.2.5 Split Worksheet
Splitting a worksheet is necessary when all the information in it cannot be displayed in one view. This option divides the worksheet into four sections. The user is able to scroll through a section of the worksheet while keeping other sections visible. The following are the steps followed to split a worksheet:
(i) Position the cursor at the cell where the split should begin. For example, select Cell E10.
(ii) Click on the View tab in the menu bar then select Split command on the ribbon from the Windows group.
The worksheet is automatically split into four sections vertically at the left edge of the pointer and horizontally along the top edge as shown in Figure 5.9.
The keyboard shortcut is as follows: Long press ALT, press W then S.

Figure 5.9: Splitting a worksheet
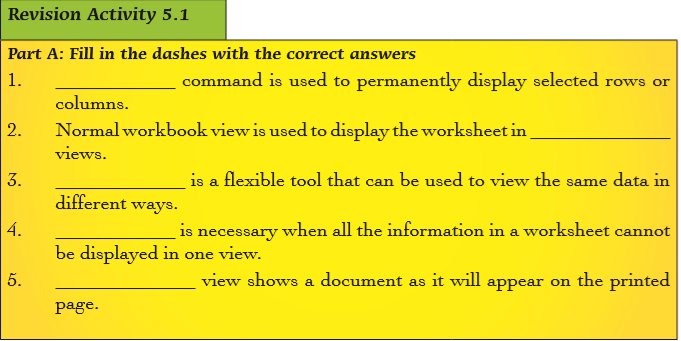
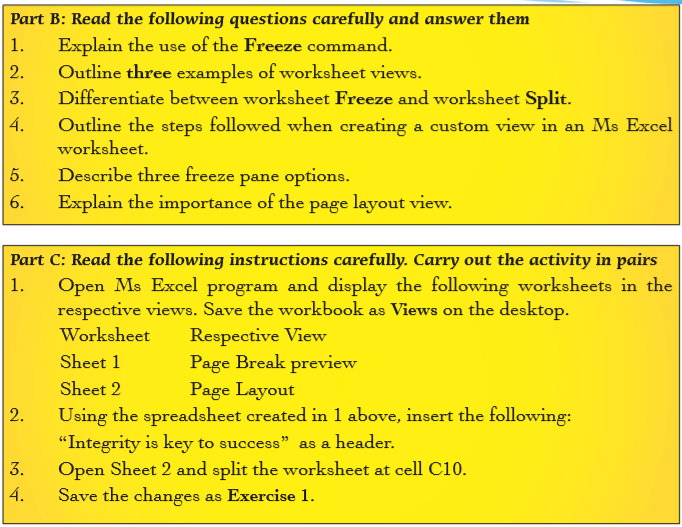
5.3 Sort and Filter
Sort and filter commands are both used to enable the user access the required information faster.
5.3.1 Sort
Sorting refers to the process of arranging data in a predefined order. The order could either be ascending or descending.
The ascending order is used when arranging data from the smallest to the largest while descending arranges the data from the largest to the smallest.
The sorting feature is used for managing data in a large worksheet. To sort data, do the following:
(i) Select the cell range containing the data to be sorted.
(ii) Click on Data tab from the menu bar then select one of the sort option from the Sort & Filter group.
(iii) To sort in ascending order, select the A to Z icon. To sort in descending order, select the Z to A icon.
Figure 5.10 shows data that is sorted in ascending order (A to Z). Figure 5.11 shows data that is sorted in descending order (Z to A). The keyboard shortcut is: Long press ALT, press A then SA and finally SD.
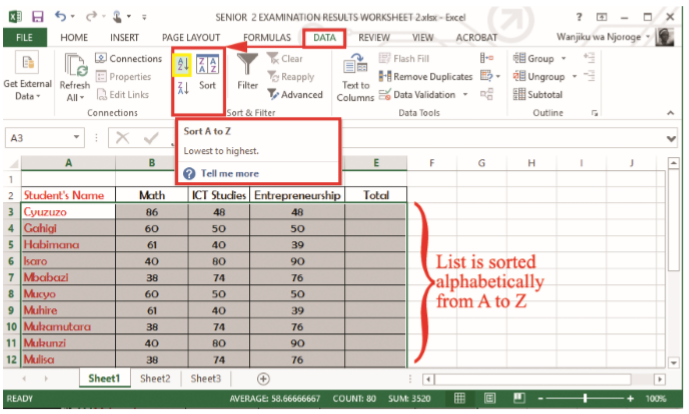
Figure 5.10: A worksheet sorted alphabetically in ascending order (A to Z)

Figure 5.11: A worksheet sorted alphabetically in descending order (Z to A)
(iv) To customise the sort, select the Sort icon. A dialog box is displayed as shown in Figure 5.12. Select the column to use under Sort by box, select the sort order in the Order box and the data to be sorted on the Sort On box then click OK. The keyboard shortcut is: Long press ALT, press A then SA and finally SS.
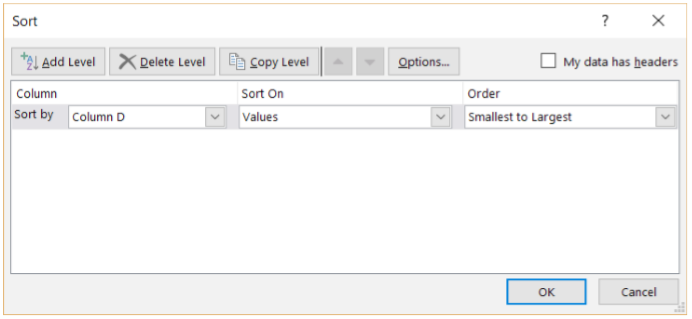
Figure 5.12: Customising the sorting order
5.3.2 Filter
It is done to only display records that meet a certain criteria. To filter data, do the following:
(i) Select the cell range containing the data.
(ii) Click on Data tab from the menu bar then select Filter command from the Sort & Filter group. The filtering controls are added to the worksheet headers automatically. Filtering can be done by number, text or colour. Figure 5.13 shows a window having filtering controls. The keyboard shortcut is: Long press ALT, press A then SA and finally T.

Figure 5.13: Filtering data
Filter by Number
(i) Click the filter control of the column header to be filtered. Number Filters option is only activated if the column contains numbers.
(ii) By default all the check boxes next to the numbers are marked (checked). Uncheck the check boxes which do not meet the desired criteria. Figure 5.14 shows Filter by numbers menu.

Figure 5.14: Filtering by number
(iii) Click OK. The worksheet will display all the records of people who are position 2. Figure 5.15 shows the filter results of the data.
(iv) Select the filtering criteria display on the list box to the right, for example, select Equals ...
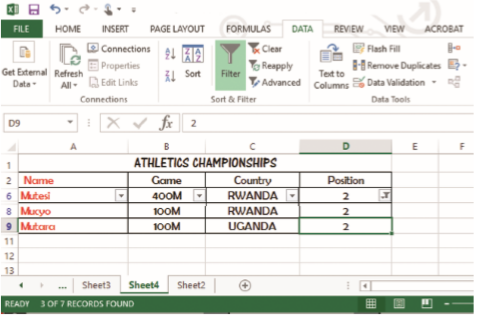
Figure 5.15: Filtered data
Note: It is important to copy the data to another worksheet before filtering.
Filter by Text
(i) Click the filter control of the column header to be filtered. Text Filters option is only activated if the column contains text.
(ii) By default all the check boxes are marked. Uncheck the check boxes which do not meet the desired criteria. Figure 5.16 shows a worksheet filtered by text.
(iii) Click Ok.
The worksheet will display all the records whose country of origin is Rwanda as shown in Figure 5.17.

Figure 5.16: Filtering by text
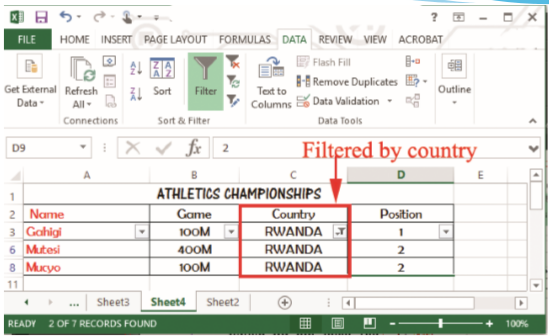
Figure 5.17: Filtered results
Filter by Colour
(i) Click the filter control of the column header to be used to filter.
(ii) Select Filters by Colour. This option is only activated if the cells in the worksheet have different colours. A side kick menu is displayed as shown in Figure 5.18.
(iii) Select the colour to filter by from the side kick menu.
(iv) Click OK to apply.

Figure 5.18: Filtering by colour
Custom filter
This filter option enables user to specify with great accuracy the records that he or she desires to appear on the filtered list. To custom filter data, do the following:
(i) Click on the filter control in the table header of the column to be filtered.
(ii) Select Numbers Filters if the column has numbers and if the column has text entries, click Text Filters as shown in Figure 5.19.
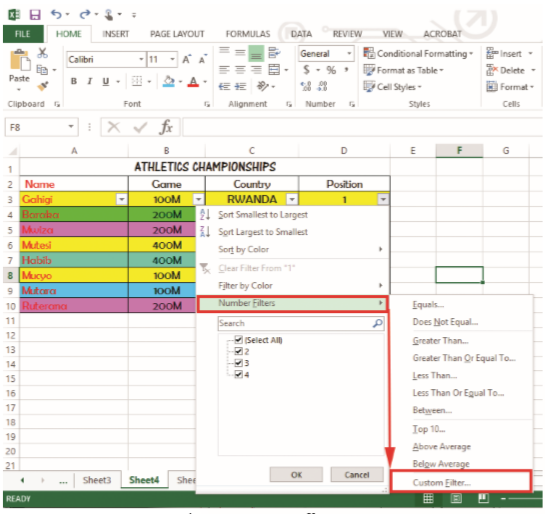
Figure 5.19: Custom filter menu
(iii) From the side kick menu, select Custom Filter… option. A dialog box appears as shown in Figure 5.20.
For example, to show numbers equal to a certain amount, select Equals in the first box, then enter the number in the box in the adjacent box.
To filter by two conditions, enter filtering conditions in both sets of boxes, and select And for both conditions to be true, and Or for either of the conditions to be true.
(iv) Then click OK.

Figure 5.20: Dialog box for custom filter

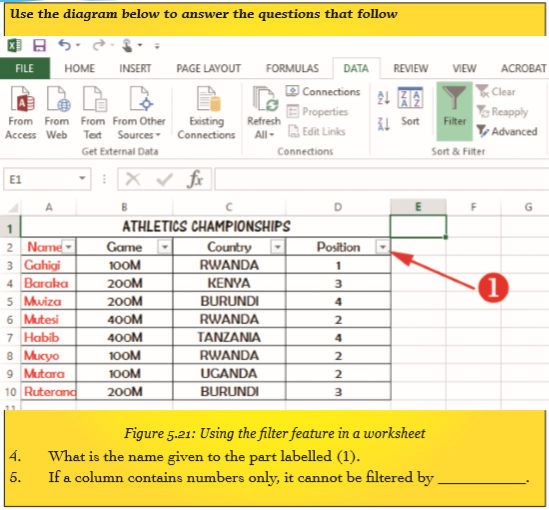
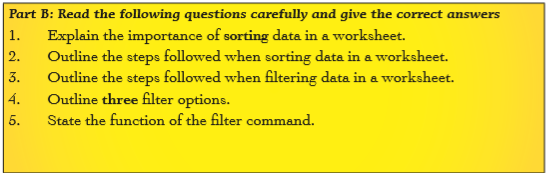

5.4 Definition of Key Words in this Unit
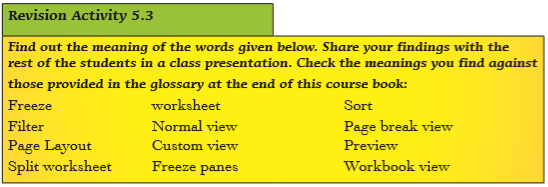
Revision Exercise 5
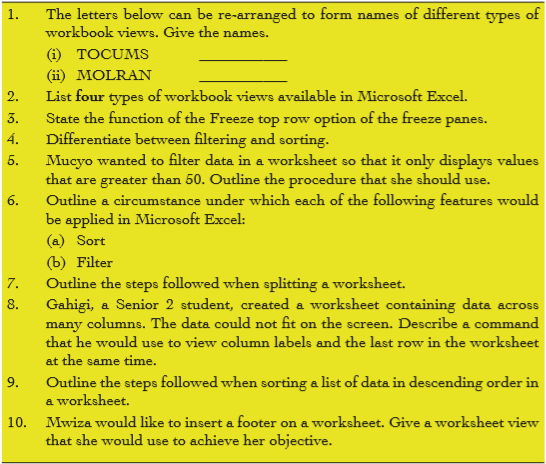
Unit 6: ArcGIS
Key Unit Competency: By the end of this unit, you should be able to:
Fill in a new empty map with data, use simple symbols, label features and attributes table, and navigate a map.
Introduction
Maps are important ways of organising and displaying data.
6.1 Creation of Maps
Maps contain many kinds of data such as world imagery, street maps, topographic data, and base maps. The data on a map is organised into layers, which are drawn on the map in a particular order. Each map is displayed in a Page Layout view or window where graphic elements such as legends, North arrows, scale bars, text, and other graphics, are arranged.
Layers give a layout of geographical features added to a map. Layers refer to data that is stored in the Data folder. Layers also define how a set of geographical features will be drawn when they are added to a map. They also act as shortcuts to the storage location where the data is stored.
Generally, making maps in ArcMap takes the following steps:
(i) Load Geospatial data into ArcMap.
(ii) Identify the features and attributes to present.
(iii) Define how to show the data.
(iv) Add map components.
(v) Export the map.
ArcMap allows one to work with geographic data in maps, regardless of the format or location of the underlying data. With ArcMap, one can assemble a map quickly from predefined layers. Data can also be added from coverages, shapefiles, geodatabases, grids, images, and tables of coordinates or addresses.
ArcCatalog is another GIS application that is designed to work with ArcMap. It is used to browse, organize, and document geographic data. It is also used to easily drag and drop it onto an existing map in ArcMap.
6.1.1 Introducing ArcCatalog
To start the ArcCatalog application, proceed as follows:
(i) Click the Start button on the taskbar.
(ii) Point to Programs to display the Programs menu.
(iii) Point to ArcGIS.
(iv) Click ArcCatalog.
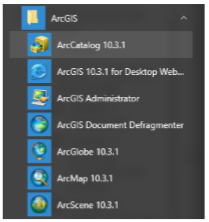
Figure 6.1: Launching ArcCatalog
The ArcCatalog window starts and the two panels in the ArcCatalog window are displayed as shown in Figure 6.2 below.
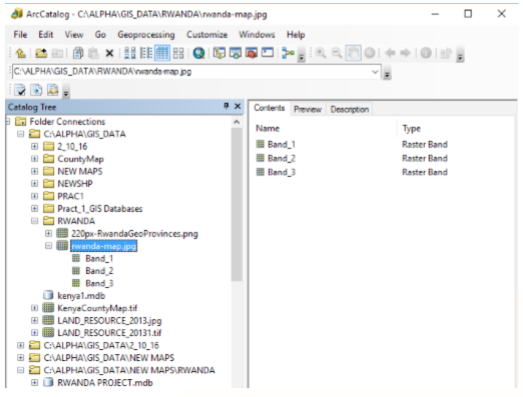
Figure 6.2: The ArcCatalog Window
The Catalog tree on the left side of the ArcCatalog window is for browsing and organising the GIS data. The contents of the current branch (Rwanda-map.jpg) are displayed on the right side of the Catalog window.
When more information about a branch of the Catalog tree is needed, one can use the Contents, Preview, and Description tabs to view the data in many different ways.
For example, clicking on the Preview tab for the selected branch displays the view shown in Figure 6.3 below.

Figure 6.3: Previewing the contents of a Branch
By default, ArcCatalog recognises many different file types as GIS data including shapefiles, coverages, raster images, TINs, geodatabases, projection files, and so on.
If the list of the recognised file types does not include a file type that is being used in GIS analysis, ArcCatalog is customised to recognise additional file types, for example, text files as GIS data.
6.1.2 Maps and layers
Maps and layers are the main ways of organising and displaying data in ArcGIS.
Maps, such as printed paper maps, can contain many kinds of data. Data on a map is organised into layers, which are drawn on the map in a particular order
Each map contains a Page Layout where graphic elements, such as legends, North arrows, scale bars, text, and other graphics, are arranged. The layout shows the map page as it will appear in print.
Layers outline how a set of geographic features are drawn when they are added to a map.
If geographic data is stored in a central database, then maps and layers can be created that refer to the database. This makes it easy to share maps and layers with other related users, eliminating the need to make duplicate copies of your data for each user.
ArcGIS has tutorial data which we need to know where it has been installed on the system.
6.1.3 Adding Data to a Map
Make a connection to the tutorial data Now we will add a connection to the folder that contains the tutorial data. This new branch in the Catalog tree will remain until it is deleted.
(i) Click the Connect to Folder button.

Figure 6.4: Connecting to a Folder from ArcCatalog
After clicking the button, a window opens. It allows one to navigate to a folder in the computer or to a folder in another computer in the network.
(ii) Navigate to the ArcGIS\ArcTutor\Getting_Started\Greenvalley folder on the drive where the tutorial data is installed. Click OK.

Figure 6.5: Connecting to the Tutorial Data
The new connection is displayed as a branch in ArcCatalog tree as shown in Figure 6.6 below.
Figure 6.6: The new Connection in the Catalog Tree The Greenvalley folder has a special icon to show that it contains GIS data.
6.1.4 Open the Greenvalley map
Double-click Greenvalley in the Catalog tree. Double-clicking a map in the Catalog tree opens the map in ArcMap.
One may also want to start ArcMap without opening an existing map. This is done by clicking the ArcMap Launch button in ArcCatalog.ArcMap can also be launched from the start menu just like ArcCatalog.
6.1.5 ArcMap
ArcCatalog is used for browsing, organising, distributing, and documenting GIS data. ArcMap is the tool for creating, viewing, querying, editing, composing, and publishing maps. Maps can present several types of information about an area at once. This map of Greenvalley contains three layers that show public buildings, streets, and parks. The layers in this map are listed in the table of contents. Each layer has a check box that lets you turn it on or off.
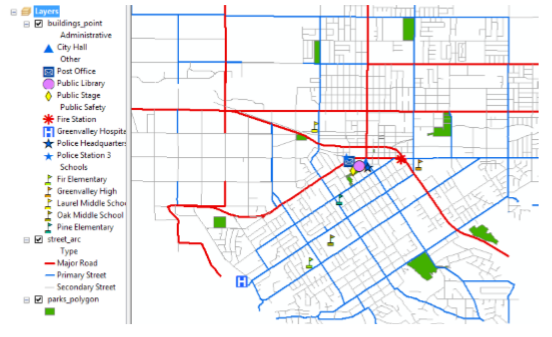
Figure 6.7: Layers Displayed in ArcMap
Within a layer, symbols are used to draw the features. In this case, buildings are represented by points, streets by lines, and parks by areas. Each layer contains two kinds of information.
(i) Spatial information: This kind of information describes the location and shape of the geographic features.
(ii) Attribute information: This kind of information tells you about other characteristics of the features.
In the park layer, all the features are drawn with a single green fill symbol. This single symbol lets one identify areas that are parks, but it does not tell anything about the differences between the parks.
In the street layer, the features are drawn with different line symbols according to the type of street that the lines represent. This symbol scheme lets you differentiate
streets from other types of features and tells you something about the differences between the features as well.6.1.6 Adding a layer to a map
We will start by adding the Water Use layer to the in ArcMap map.
(i) Position the ArcMap and ArcCatalog windows so that both windows can be seen.
(ii) Click the Water Use layer in ArcCatalog and drag it onto the map in ArcMap. One can click and drag any layer from the ArcCatalog tree onto an open map in ArcMap.
The map now shows a new water use layer as shown in Figure 6.8 below.

Figure 6.8: Addition of a new water use layer
One can add raw geographic data to a map just as easily as you can add a layer.
6.2 Display of a Layer
6.2.1 Adding Features and Symbolising Layers
Symbology is a set of conventions, rules, or encoding systems that define how geographic information is represented with signs and different colours on a map.
A characteristic of a map feature may influence the size, colour, and shape of the symbol used. Figure 6.9 below shows examples of custom symbols common in maps.
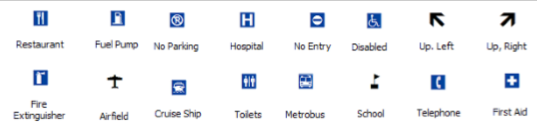
Figure 6.9: Example of Symbols used in Maps.
Symbols can be applied into layers in different ways depending on the type of data.
The following are some of the forms used:
(i) Single symbol: All features are represented in the map with a common symbol.
(ii) Unique values: A different symbol is applied to each category of feature within the layer.
(iii) Graduated colours: Variety of colours are used to show differences in feature values.
(iv) Dot Density Symbols: Thematic dot density maps use dots or points to show a comparative density of features over a map based on values stored in the fields. Attribute values determine the number of dots displayed in the polygon feature.
(iv) Graduated symbols: These are common symbols that are used to represent qualitative information of different values using symbol with varying sizes. Using graduated symbols, the quantitative values for a field are grouped into ordered classes. Within a class, all features are represented with the same symbol.
6.2.2 Adding Features
When features are added directly from a coverage, shape file, or database, they are all drawn with a single symbol. Let us go back to the Green valley example. The data will be added from a database in this case.
(i) Position the ArcMap and ArcCatalog windows so that both can be seen.
(ii) Click the plus sign (+) next to the Data folder in the Catalog tree to view the contents of the folder.
(iii) Click the plus sign (+) next to GreenvalleyDB.
(iv) GreenvalleyDB is a geodatabase that contains the remainder of the data to be used. This data is organised in five feature datasets, namely Hydrology, Parks, Public Buildings, Public Utility, and Transportation.
(v) Click the plus sign (+) next to Public Utility.
(vi) Click Watermains_arc and drag it onto ArcMap.
Figure 6.10 below represents the ArcCatalog window showing the steps followed to access the data in the geodatabase.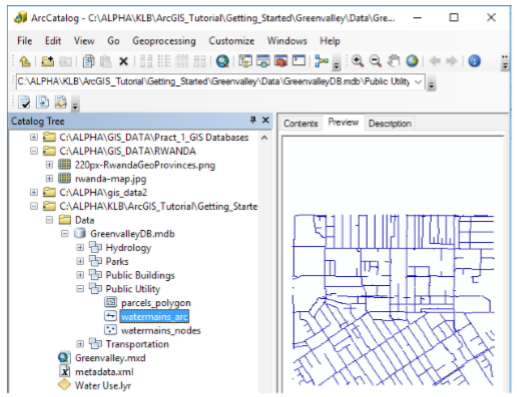
Figure 6.10: ArcCatalog Window showing the location of the Greenvalley Database
Watermains_arc layer is then dragged and added to the ArcMap window. It appears as shown in Figure 6.11 below.
Notice that, the map now has four layers: Building_point, Watermains_arc, street_arc, and parks_polygon.
The Watermains_arc layer features are represented using a single symbol which is a uniform line. In this case, the features are polyline shapes that represent the pipes in the water distribution system.
The features in the Building_point layer are represented using unique values, where a different symbol is applied to each category of feature within the layer. The represented features include city hall, post office, public library and schools among others.
Following the steps above, add the water use layer from the catalog tree.Figure 6.12 below represents the added layer.
Figure 6.11: ArcMap window showing the added Watermains_arc layer

Figure 6.12: The water use layer added represented using Graduated colour scheme.
The features in the water use layer are represented using the graduated colour scheme. Zero (0) represents nil water use, 1-2 represents light water use and 7-8-9 represents heavy water use. For example,the school and the fire station are heavy water consumers and they are represented using colour code 7-8-9 as indicated in the table of contents.
The street_arc layer also represents the different classes of roads using different colours. Figure 6.13 below shows the colour graduated scheme differentiating the countries neighboring Rwanda.
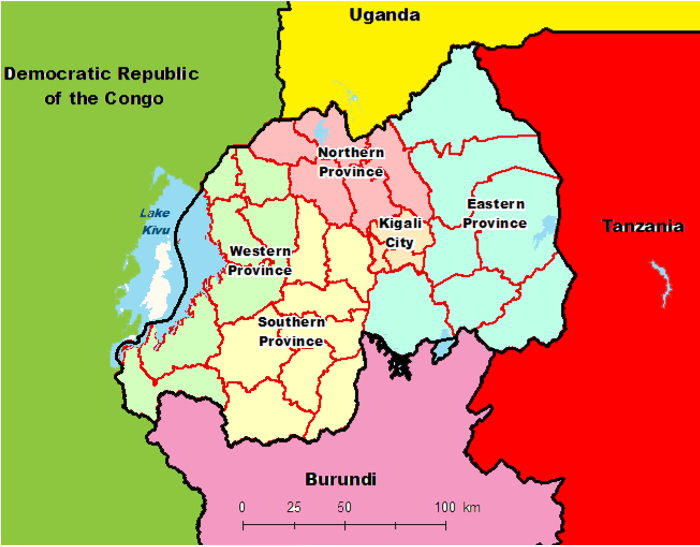
Figure 6.13: Graduated Color Scheme Differentiating Rwanda’s Neighboring Countries
6.2.3 Editing the feature Symbols
Sometimes, the size, colour and shape of the features need to be changed to give the correct representation. To achieve this, proceed as follows:
(i) Right-click the layer title (for example Watermains_arc) in the ArcMap table of contents and click Properties. The layer Properties dialog box shown in Figure 6.14 below appears. It can be used to inspect and change a wide variety of layer properties.
(ii) Click the symbology tab. The symbol scheme for the layer, as well as its appearance in the table of contents can be edited from this tab.
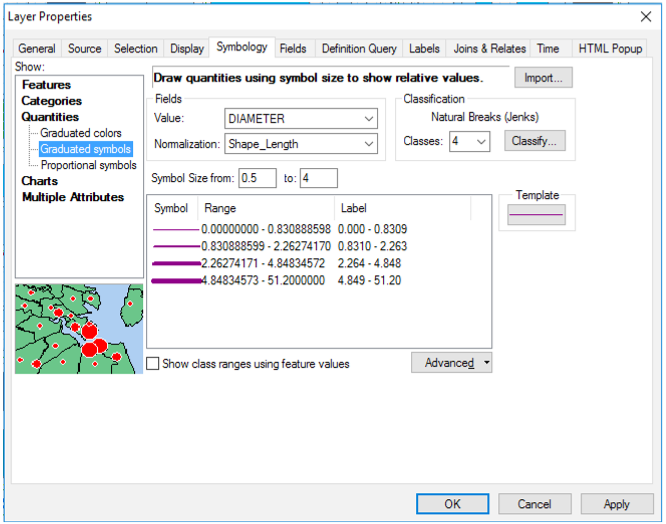
Figure 6.14: Layer Properties Dialog box
(iii) Click Quantities. The panel changes to give controls for drawing with graduated colors, graduated symbols, and proportional symbols.
(iv) Select Graduated symbols option and click the Value dropdown arrow and click DIAMETER. By default, ArcMap assigns the data to five classes using the Natural Breaks classification (Jenks’ method).
The classes can be adjusted to the desired number. Now the width of the line symbols indicates the diameter of the water mains.
If one wants to change the water mains colour (for example to be ginger pink), click on the template button and select the desired colour.
After clicking, apply and then okay, applies the changes to the selected layer in the map as shown in Figure 6.15.

Figure 6.15: Water main Pipes represented using graduated symbols to show different sizes.
From the geodatabase, add another layer for Water mains_nodes. This layer will represent the water points. From the layer properties dialog box, edit the colour, shape and size of the nodes and apply the changes. Figure 6.16 below represents the changes.

Figure 6.16: Water nodes represented using the Dot Density Symbols.
6.2.4 Add/Remove Labels of a Layer
Progressively, layers have been added to the Greenvalley map as shown in Figure 6.16 above. The table of contents usually displays the active layers in a map. In a Map, to remove the label of a layer, uncheck the dialogue box, next to the layer label. Figure 6.17 below shows the label for water use layer unchecked. The map will not display the water use scheme of the town.
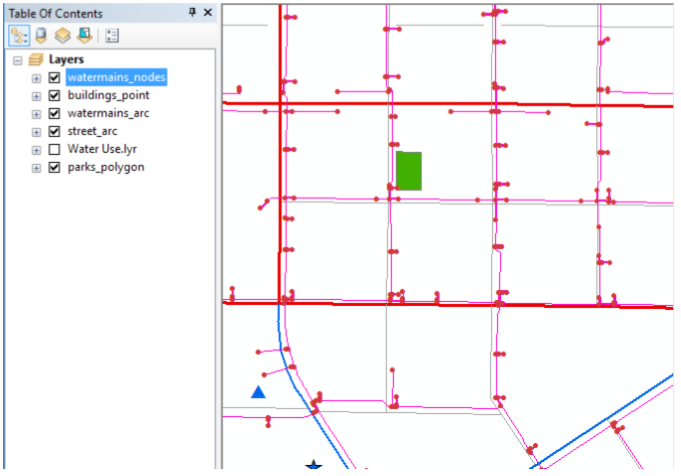
Figure 6.17: Removal of Layers from a Map with layer of Water Use unchecked.
To add the layer for the cities, just check the Checkbox against the layer and the feature appears in the map.
6.2.5 Layer Properties
Layer properties usually define the display and feature of a layer. All the aspects of the layers can be controlled through Layers properties. The properties of a layer can be updated and accessed through the layer Properties dialog box. The properties set are different for different types of geographic data. For example, when designing 3D maps, additional properties, such as elevation of the layer from the surface are set.
To change these settings, select a layer in the Table of Contents pane, right-click on it and select properties. The Layer properties dialog box in Figure 6.18 appears.
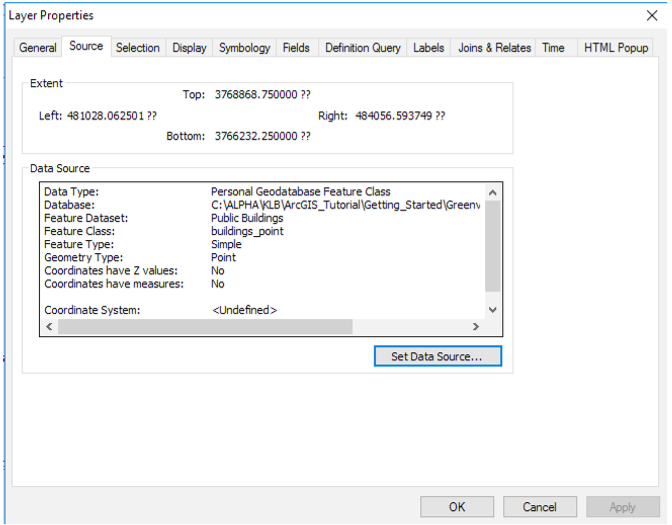
Figure 6.18: The Source tab in the Layer Properties dialog box.
The tabs on this dialog box are specific to the type of layer. The following are some of the properties for feature layers one can set using the Layer Properties dialog box. The tabs in the Layer Properties dialog box for Feature layers can be described briefly as follows:
(i) General: This tab allows the recording of layer properties such as layer name,its description, and set credits. It also specifies scale-dependent drawing properties.
(ii) Source: This tab allows viewing of the extent of the data. The source of the data can be viewed and changed from this tab.
(iii) Selection: This tab allows the setting of how features in a specific layer are highlighted when they are selected. The symbol shape and color can be changed in this tab.
(iv) Display: The tab is used for setting the symbol transparency, display field expressions, support hyperlinks using fields, and exclusion of features from the drawing.
(v) Symbology: This tab provides options for assigning map symbols and rendering the data. The tab provides options for drawing all features with one symbol, using proportional symbols, using categories based on attribute values, the use of quantities, colour ramps, or charts based on attributes and the use of representation rules and symbols.
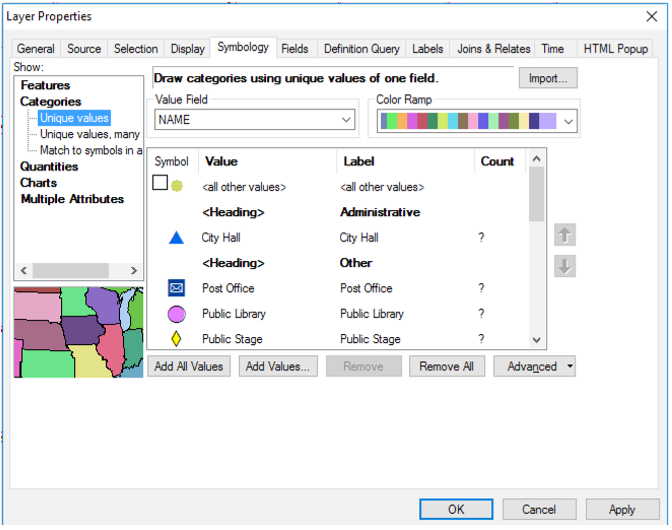
Figure 6.19: Symbology.
(vi) Fields: The tab is used to set characteristics about attribute fields. Other options include creation of aliases. An important aspect is to set alias names for visible fields that make it easier for users to work with feature attributes. One can also format numbers, and make fields invisible.
(vii) Definition Query: This tab allows one to specify that a subset of a feature is used inthe layer. With the Query Builder dialog box, one can create an expression to select particular features of a dataset to be used in a layer.
(viii) Labels: This tab allows one to turn on a layer’s labels, build label expressions, manage label classes, and set up the labelling options for label placement and symbology. Alternatively, one can set labelling properties for all layers within the map using the Label Manager.
(ix) Joins and Relates: This tab allows one to join or relate attribute tables to the layer’s feature attribute table.
(x) Time: This tab is used to specify the time properties of time-aware layers.
(xi) HTML Popup: This tab is used to specify how pop-up lists are generated when you click a feature to display information about it.
When working with one symbol at a time, any of its properties can be changed and even restructured by adding or removing components.
When more than one symbol is selected, one can only change basic symbol properties, which vary based on symbol type as shown in the table below: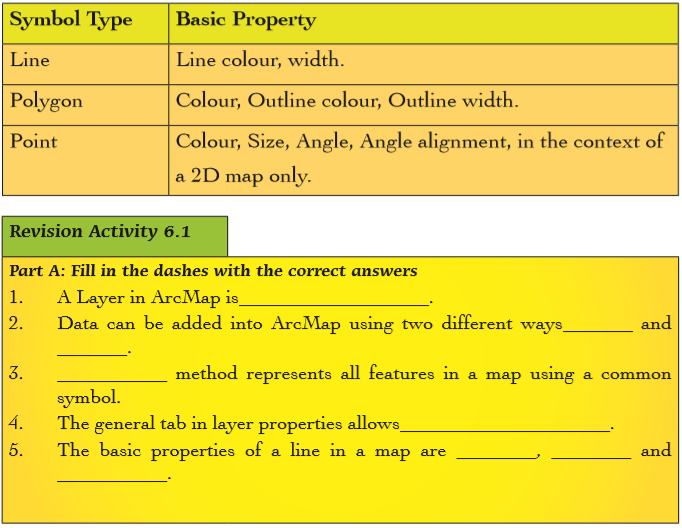
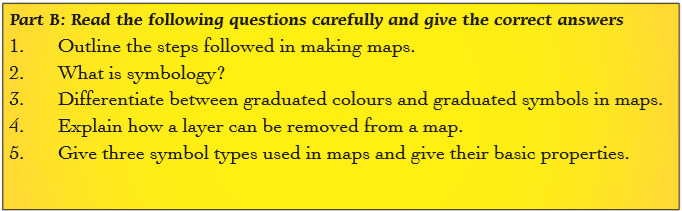
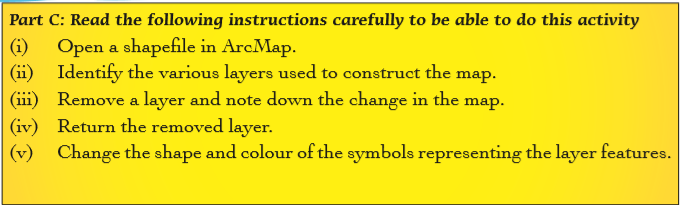
6.3 Attribute Table
6.3.1 Adding a Field to a Table
Follow the following procedure to add a field to a table.
(i) Click the Add Data button and browse to the data to be added.
(ii) Open the attribute table of this file by right clicking on the layer and choosing the Open Attribute Table from the drop down menu as shown in Figure 6.20. Note that when you let the cursor hover on the Open Attribute Table from the drop down menu, a help tip showing the keyboard shortcut appears as shown in Figure 6.21.

Figure 6.20: The window for opening the Attribute Table
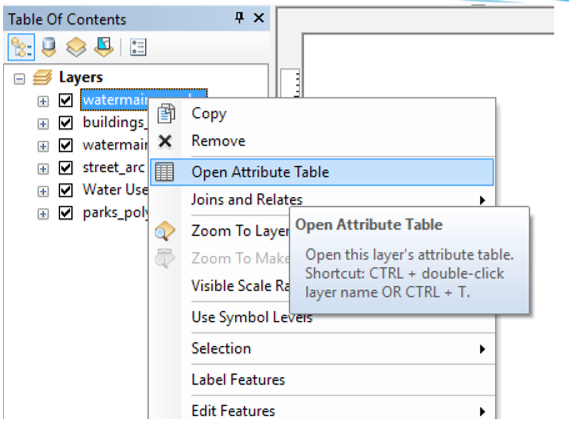
Figure 6.21: The window for opening attribute table showing the help tip.
(iii) Once you click on Open Attribute Table, the window shown in Figure 6.22 appears. In the attribute table, click on the Table Options in the top left corner and choose Add Field.
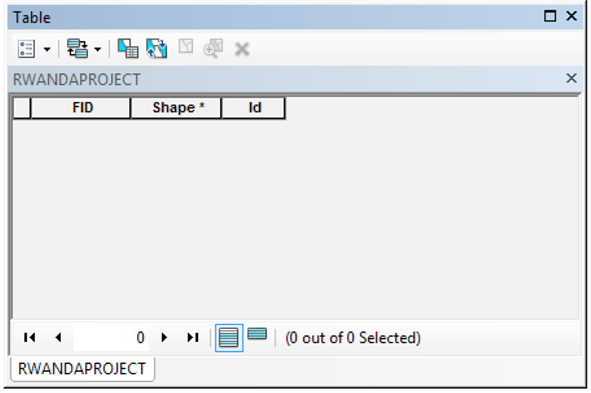
Figure 6.22: The Attribute Table
(iv) To create a new field called AREA1, click on the Table Options in the top left corner and choose Add Field. Type in the name of the field (AREA1) and click OK. Figure 6.23 shows how a field is added.
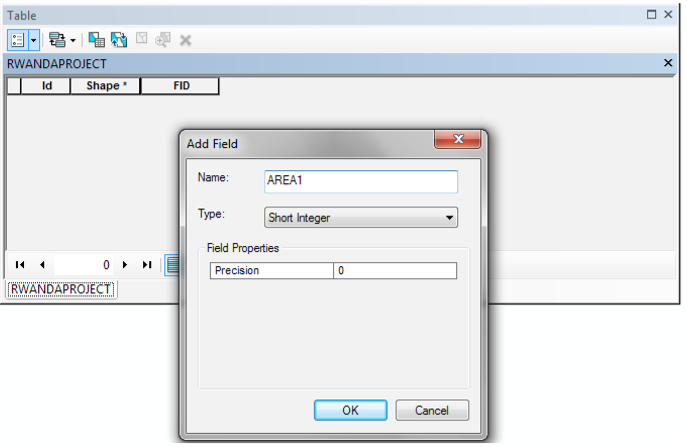
Figure 6.23: Adding a Field to a Table
Field is a column in an attribute table that contains information for each feature.
Each row in a basic table contains the following:
• FID – Feature ID
• Shape–Point, Polyline, Polygon
• ID – initially 0 but can be reset by user
Field types can be:
• Integers (short or long)
• Decimal numbers (floats or doubles)
• Text
• Date
• Binary Large Objects (BLOB)
• Global Unique Identifier (GUID)
(v) For the created field called Area, use a built-in function to populate this field. Right-click on the field name and choose Calculate Geometry
• For the option to work, populate the values of the field to be geometric values derived from the features that the table represents such as area, perimeter, and length among others.
• The dialog box that appears lets one decide whether the records will be calculated or just the selected records.
• Note that when you let the cursor hover on the Calculate Geometry from the drop down menu, a Help Tip giving further details appears as shown in Figure 6.24.

Figure 6.24: Selecting the calculate Geometry feature.
• Probably a warning about calculating outside of an edit session will appear. Click Yes to ignore it and continue.
• In the Calculate Geometry dialog box, the area will be calculated.
6.3.2 Sorting Records in Attribute Table
Sorting the rows in a table allows information about the contents to be derived more easily.
For example, if the information is about the population of a country in a particular period, after sorting a column’s values in ascending order, the values are ordered from A to Z or from 1 to 10.
With descending order,a column’s values are arranged from Z to A or from 10 to 1. To sort records:
(i) Click the heading of the field column whose values are to be used for sorting.
(ii) Right-click the selected field’s heading and click Sort Ascending or Sort Descending. The drop down menu in Figure 6.25 will appear.
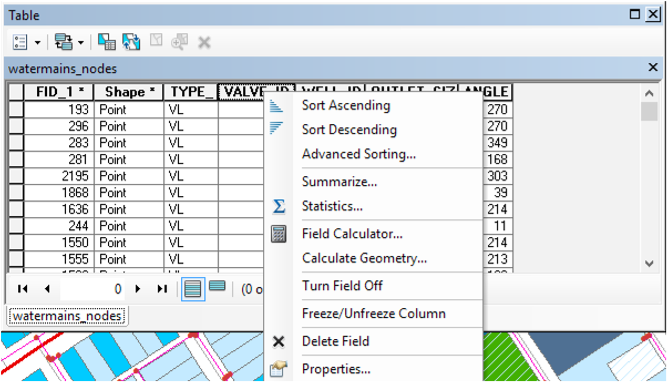
Figure 6.25: Sorting Records
Note that when you let the cursor hover on the Sort Ascending from the drop down menu, a Help Tip giving further details appears as shown in Figure 6.26 below.
(iii) Sort the values in the field FID_1 in ascending order (A–Z) (1–9). The data before and after sorting appears as shown in the Figure 6.27 below.
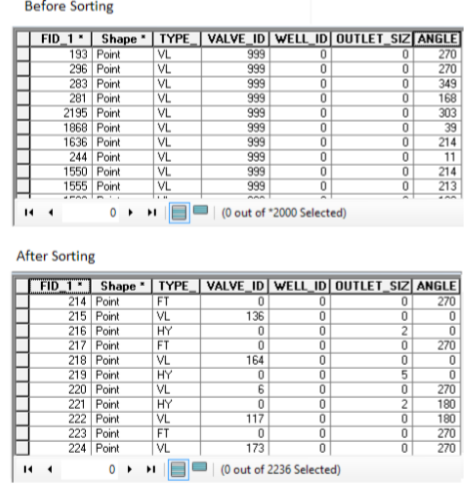
Figure 6.27: Results after Sorting Record
6.3.3 Freezing and Unfreezing a Column
Freezing a column helps in showing how attributes for the same feature are related with respect to one or more key fields (that are frozen). When a column gets frozen, it is always displayed even when scrolling horizontally in the table. To freeze a column, do the following:
(i) Click the heading of the column to freeze.
(ii) Right-click the selected column’s heading and click Freeze/Unfreeze Column. The column is frozen.
Figure 6.28 below shows the process of freezing the column named NAME.
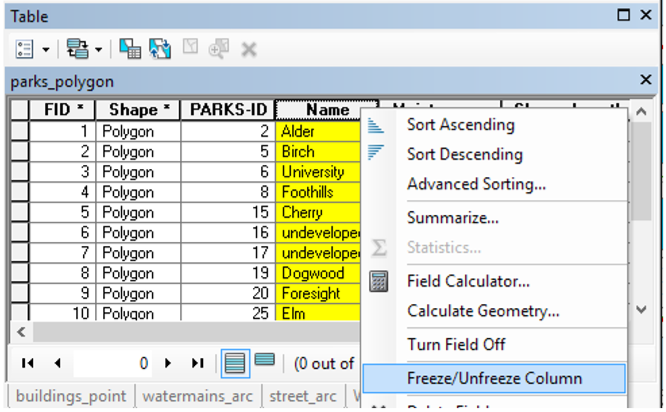
Figure 6.28: Freezing a Column
Figure 6.29 shows the same column after it has been frozen.

Figure 6.29: Frozen Column
(iii) Right-click the column heading of the frozen column and click Freeze/Unfreeze Column to unfreeze the column.
6.4 Querying Data
A request that examines features or tabular attributes based on user-selected criteria and displays only those features or records that satisfy the criteria is called data querying.
Information about features can be retrieved in different ways. Features can be identified by clicking on them to display their attributes.
The user can find features by using known information about the feature in order to search the map for that particular feature.
There are different ways of retrieving information about features in ArcMap. The user can identify features by clicking on them in order to display their attributes.Alternatively, the user can select features by clicking on them to highlight and then look them up from their records in the layer attribute table. The user can find features by using known information about the feature in order to search the map for that particular feature.
6.4.1 Identify
The identify tool offers a quick way of getting information about a single feature. To use the Identify tool, proceed as follows:
(i) Select the Identify
 tool from the Tools Toolbar.
 (ii) Within the map, click on the feature of interest in order to view the attribute information for that particular feature.
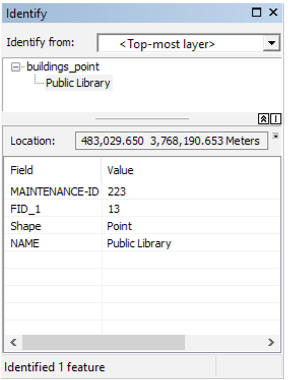
Figure 6.30: Using the Identify Tool
6.4.2 Measure
This tool allows distances, areas, and feature locations on a map or scene to be measured. One can draw a line to measure length, a polygon to measure area, or click an individual feature to get measurement information.
Once the user highlights what is to be measured, they click on the map. For example, to measure the distance of a line feature such as a river, the first click begins a line segment, and the next click ends that segment and begins another. Double-click to finish measuring.
One can measure any number of segments in a sequence. That means to measure the distance of the river as it meanders, click each point where the river curves to make a segment.Downstream the next curve will require another click. A cumulative sum for the distance or area displays as part of the results. The results can be copied and pasted for use in other application.
To measure in a map;
(i) Click the Measure
 tool.
tool. (ii) Choose a measuring tool and click the map to begin measuring.
• Distance: Click the map to measure the straight-line distance between two or more points. Figure 6.31 shows measuring of distance in a map.
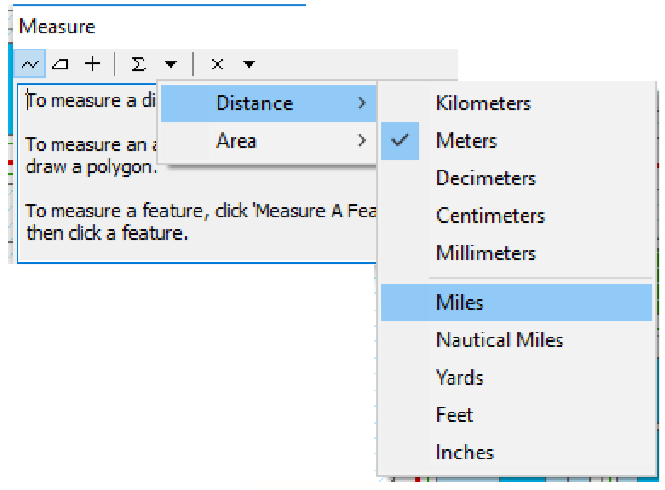
Figure 6.31: The Measure Dialogue Box.

Figure 6.32: Measuring Distance
• Area: Select the tool for measuring area. Click the map to measure the area of a given locality, for example, a forested area. Identify the starting point on the map, and then successively keep clicking along the edges of the area to be measured until the starting point. The dimensions of the polygon shape will be displayed. Figure 6.33 shows measuring of an area in a map.
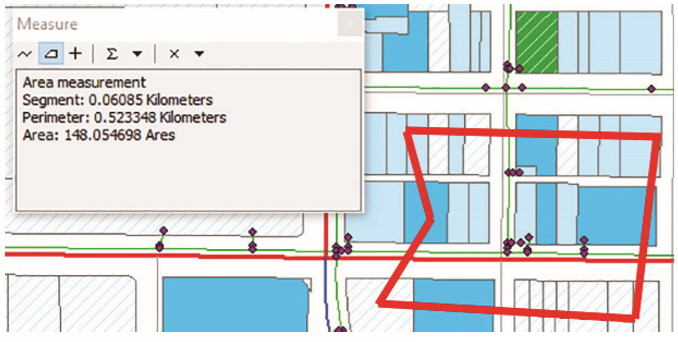
Figure 6.33: Measuring Area in a Map
6.4.3 Go to XY This tool is used for typing in XY coordinates of a location and navigating to them. The coordinates entered can be:
(i) Longitude-Latitude: This is giving the Global Positioning System (GPS) of a given location.
(ii) Values in the map document’s coordinate system. These refer to the values of the given location.
(iii) Military Grid Reference System (MGRS) coordinates: The military grid reference system (MGRS) is the geocoordinate standard used by NATO militaries for locating points on the earth.
(iv) Universal Transverse Mercator (UTM) coordinate notation: This is a system that uses a two-dimensional Cartesian coordinate system to give locations on the surface of the Earth. The MGRS is derived from the Universal Transverse Mercator (UTM) grid system. On the tools toolbar, click the Go To XY button
 to open the Go To XY dialog box, which is shown in Figure 6.34.
Figure 6.34: Go To XY dialogue Box.
The dialogue box can be used to pan to, zoom to, flash or add call out to a location. Figure 6.35 below is showing a point with coordinates X (612,000) and Y (9,835,000) having a call out.
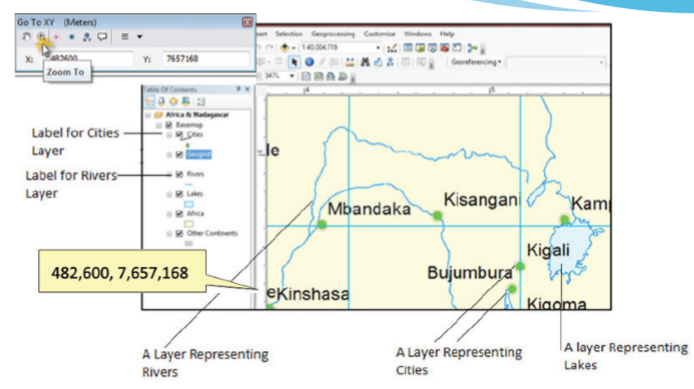
Figure 6.35: A location with XY coordinates
6.4.4 Hyperlink
Hyperlinks allow access to documents or web pages related to features. These hyperlinks can be accessed for each feature using the Hyperlink tool on the Toolbar. Hyperlinks have to be defined before using the Hyperlink tool. Hyperlinks are usually of three types:
(i) Document: Clicking a feature with the Hyperlink tool opens a document or file using its appropriate application (such as Microsoft Excel). For example, on selecting a hyperlinked feature such as a school, a linked Microsoft Word document pops up to provide more information on the school.
(ii) Universal Resource Locator (URL): On clicking a feature with the Hyperlink tool, a web page is launched in the web browser. For example, when a hyperlinked feature like the Kigali Genocide Memorial Centre is selected with the hyperlink tool, a linked website pops up to give more details about the centre.
(iii) Script: On clicking a feature with the Hyperlink tool, a feature value is sent to a script.
Hyperlink for a feature can be defined in a layer either by using field-based hyperlinks or by defining a dynamic hyperlink using the Identify tool. To define field-based hyperlink properties:
(i) Right-click the layer for which the hyperlink properties are to be set and choose Properties.
(ii) Select the Display tab on the Layer Properties dialog box.
(iii) Check Support Hyperlinks using field. Figure 6.36 below show the dialogue
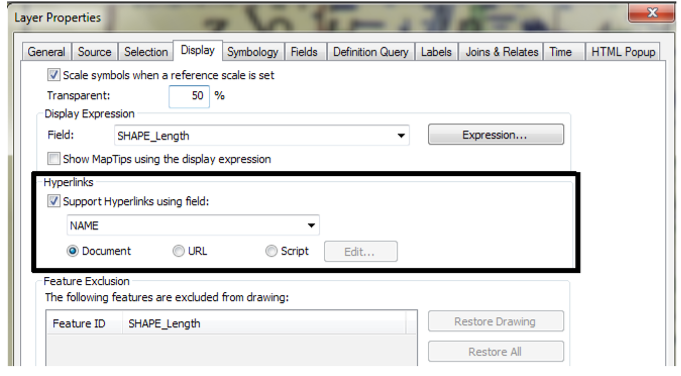
Figure 6.36: Setting Hyperlink Properties
The hyperlink field has to be set up before specifying hyperlinks in this dialog box.
For example, if a particular web page needs to be launched whenever a feature is clicked with the Hyperlink tool, first add a text field to the attribute table of this layer to contain the URLs associated with each feature.
Then in the dialog box, check the Hyperlink option, choose the field from the drop-down list of fields, and choose the URL radio button option.
The values of the field chosen to provide hyperlinks can include the full path to the target document or the full URL of the target web page.
Alternatively, the value may just contain the name of the target document or web page, and one can use the Hyperlink Base property to specify the path or URL where the target can be found. Omit the “(http://)” part of the URL.
If a protocol different from http is to be used, then it must be included in the protocol at the beginning of the URL.
(iv) Select the field name you wish to use for the hyperlink and the link type, either document, URL, or Script.
(v) If you choose to use Script, use the Edit button to write your script using JScript or VBScript. Click OK.
(vi) Click OK or Apply on the Layer Properties dialog box.

Fig. 6.37: Hyper Link Script Dialogue Box
Note:
(a) The dialog box allows building of a script that will launch a hyperlink. The script should be coded using the rules of the scripting language selected in the Parser drop-down list. The script can include any valid statements supported by the selected scripting language.
(b) Fields are enclosed in square brackets [ ], irrespective of the data type of the layer’s data source.
(c) The hyperlink script is written as a function, which can contain programming logic and multiple lines of code.
(d) The default functions utilise the ShellExecute function, which is part of the MSDN library.
• Microsoft ShellExecute Function Reference
• Microsoft VBScript Language Reference
• Microsoft JScript Language Reference
• Python Language Reference
(e) Click OK or Apply on the Layer Properties dialog box. You can define a hyperlink for the features in a layer either by using field based hyperlinks or defining a dynamic hyperlink using the Identify tool.
A hyperlink can be added to a feature using Identify tool. To define field-based hyperlink properties, do the following:
(i) Right-click the layer for which you want to set hyperlink properties and choose Properties.
(ii) Select the Display tab on the Layer Properties dialog box.
(iii) Check Support Hyperlinks using field. Alternatively, you can also add a hyperlink as follows:
(i) Click the Identify tool on the Tools toolbar.
(ii) Click the feature for which you want to define a hyperlink.
(iii) Right-click the feature in the Identify window and click Add Hyperlink.
(iv) Specify the desired hyperlink target. Suppose we want to hyperlink the Public Library, we click on it with the Identify tool as shown in Figure 6.38. Figure 6.38: Adding Hyperlink using the Identify Tool
 (v) On clicking Add the Hyperlink, the dialogue box shown in Figure 6.39 below appears.
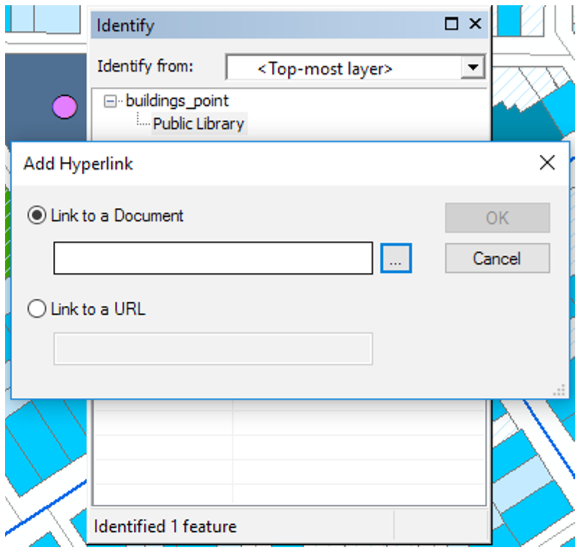
Figure 6.39: Hyperlinking a Document or URL
(vi) Browse to link the document or type the URL and then click OK.
(vii) To access the linked document, using the hyperlink tool, click on the feature; that is, Public library. The linked document opens. Moving the hyperlink tool over the feature displays the name of the linked document as shown in Figure 6.40.

Figure 6.40: Displayed name of the hyperlinked document.
6.4.5 Select Features
The Select Feature tool
 allows the selection of features based on various categories relative to other features. Figure 6.41 below is showing the different options selections can be performed.
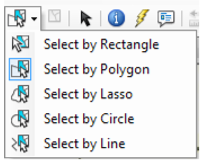
Figure 6.41: Different Select Options
For example:
If the number of schools within a certain area is to be found, and the area is mapped by a boundary, all the schools within that area can be selected.
To find all the students who live within a 10-kilometre radius of the school and who made a recent improvement in their academic performance so as to give awards, proceed as follows:
(i) First select the students within this radius (select by location).
(ii) Refine the selection by finding those students who have made a recent improvement according to the recently released results.
The example of the selection given above is known as select by attribute. The attributes in the above example are students selected by:
• Living within a 10-kilometre radius of the school.
• Made improvement in their academic performance.
6.4.6 Spatial ThinkingSpatial thinking is about how we think about and understand our environment. A spatial thinker visualises and understands his or her environment from various angles. We apply spatial thinking when we create representations such as maps.
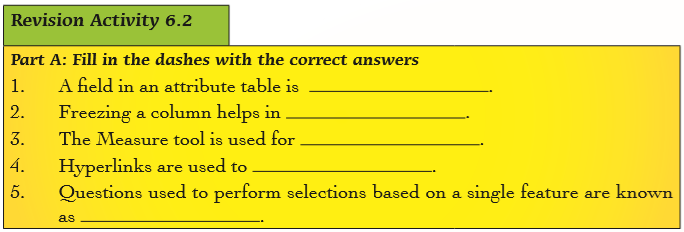

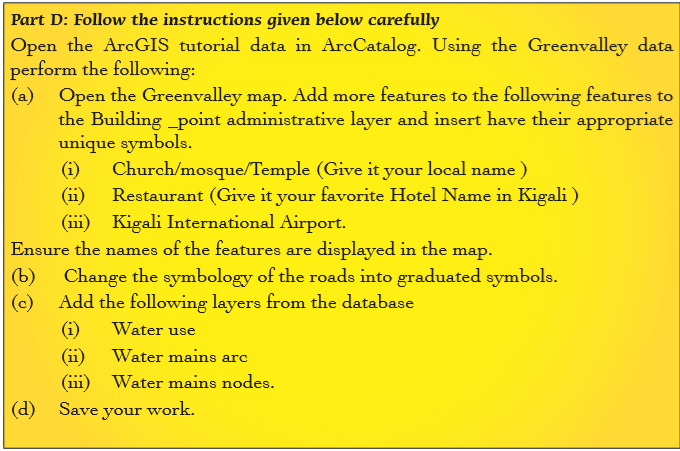
6.6 Definition of Key Words in this Unit
Revision Exercise 6

Unit 7:Complex Formulae and Functions
Key Unit Competency: By the end of this unit, you should be able to:
1. Work with spreadsheets to apply complex formulas and functions recognising the order of operations.
2. Apply conditional formatting to the content of a worksheet.
3. Use absolute and relative referencing.
Introduction
Spreadsheets are programmed in such a way that they can accept different formulas and functions.Formulas may comprise a combination of actual values, cell references, functions and mathematical operators. When the correct formula is typed in the formula bar, the result of the formula appears in the active cell.
7.1 Predefined Operators and Symbols in Microsoft Excel
Some predefined operators used in excel include: addition, subtraction, multiplication and division operators which have been discussed in Unit 4. The symbols used include:

7.2 Complex Formulas
In Unit 4, we discussed how to create simple formula involving a single operator. Excel has a provision of using complex formula.
They are written using more than one operator. Example of a complex formula is = (B2 + B3)/2 written in cell B5. In this case, the operators used are addition and division.
Creating Complex Formulas
The following are the steps followed when creating complex formulas.
(i) Click the cell where the result of the formula is to be displayed such as B5.
(ii) Type the equal sign.
(iii) Type an opening parenthesis.
(iv) Click on the first cell tobe included in the formula or type the cell address such as B2.
(v) Type the mathematical operator such as (+).
(vi) Click on the second cell in the formula or type the cell address such as B3.
(vii) Type a closing parenthesis.
(viii) Type the next mathematical operator such as (/).
(ix) Type the next cell address or value such as 2.
(x) Press Enter, or click the Enter button on the Formula bar to end the formula. For example, figure 7.1 on page 188 shows the formula =(B35+B36)/2 entered in cell B38.

Figure 7.1: The formula for computing the average bill for January
7.3 Cell References
They are also known as cell addresses. Cell address consists of a column letter and row number. They are used in formulas. There are three types of cell references, namely relative, absolute, and mixed cell references.
(i) Relative cell reference:This type of reference automatically changes the cell addresses of a formula relative to the position of the cell where it is copied. For example, if the formula =A1+B1+C1 is written in cell D1 then copied to cell F1, the formula becomes =C1+D1+E1. It is the default cell referencing style used in excel anytime a formula is entered.
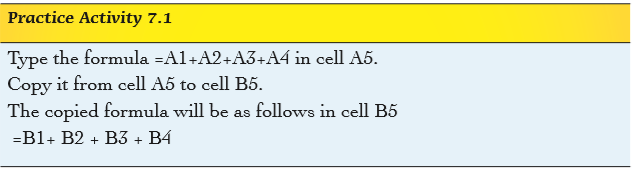
(ii) Absolute cell reference: In this type of reference, the formula remains the same regardless of where it is copied. To make a cell absolute, type dollar signs before the column letter and the row number. For example, $A$1 is an absolute cell reference of cell A1. If the formula =($A$1*$B$1) is written in cell C1 then copied to G1, it remains =($A$1*$B$1).
(iii) Mixed cell reference: It is a type of reference that combines both relative and absolute cell reference. To apply this reference, the $ sign appears on the column letter or row number in the cell reference but not on both. The row could be made absolute while the column is relative or vice versa. For example: Table 7.1 shows some examples of cell references together with an explanation of each.

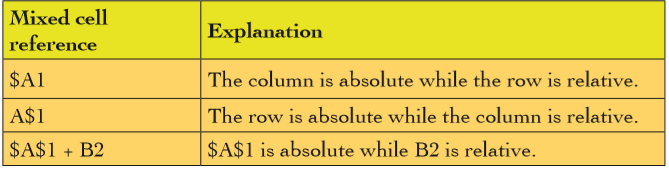
Table 7.1: Mixed cell references and their explanation
If any of these references are written in cell E2 then copied to cell G2 the formula would become:
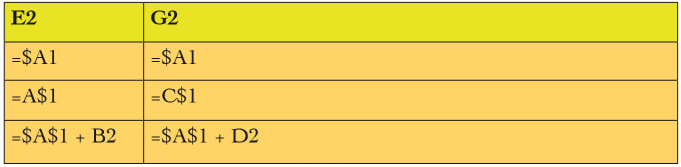 Table 7.2: Example of mixed cell references
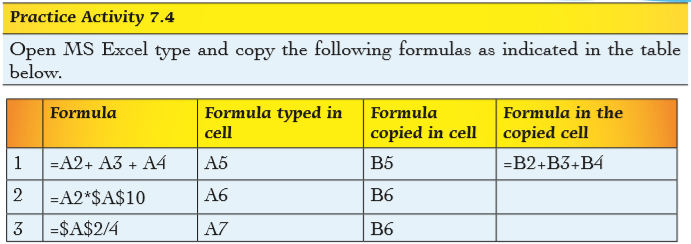
7.4 Cell References of another Worksheet
In Spreadsheets, it is possible to refer to a cell in another worksheet. Information can also be copied from a worksheet then pasted to another.
7.4.1 Copy Paste Option
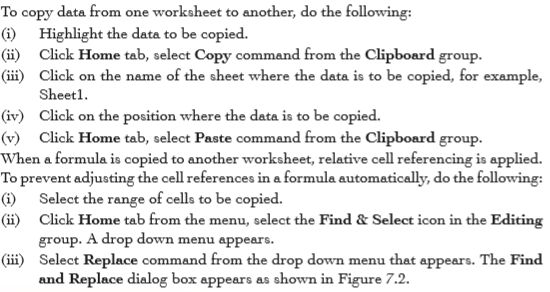

Figure 7.2: Find and replace dialog box
(iv) In the Find What box type “=”, and in the Replace With box type “#”.
(v) Click Replace All, to replace all occurrence of “=” with “#” in the range then close the dialog box. The formula is changed to a label. For example “=A1*B1” becomes “#A1*B1”.
(vi) Copy and paste the formula to the desired location in another worksheet.
(vii) To change it back to formula, simply replace all occurrence “#” with“=”.
Copying formula
Once a formula is entered in a cell, it can be copied to other cells within the worksheet. When a formula is copied, the cell references are automatically adjusted depending on the type of reference used in the original formula. To copy a formula, do the following:
(i) Click on the cell that contains the formula.
(ii) Move the cursor to the fill handle of the cell selector. Ensure that the cursor changes to a plus sign.
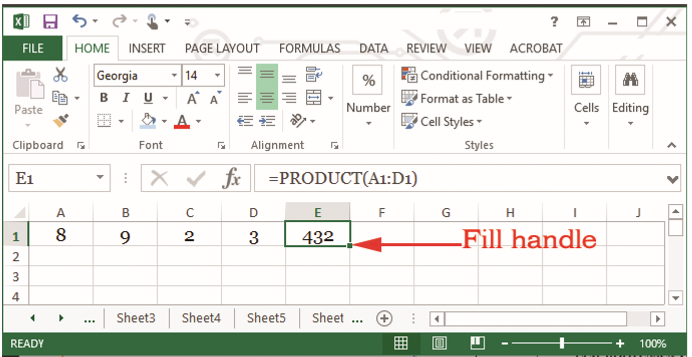
Figure 7.3: Copying a formula to the desired location
(iii) Click and drag the cursor either across the row or column. Release the button once all the cells where the formula is to be copied are selected.

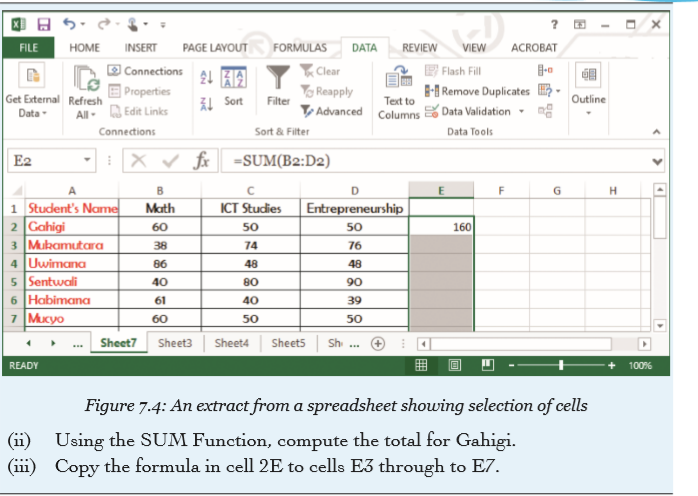
Note:The formula can also be copied by right-clicking on it then selecting Copy command from the pop-up menu that appears. Right-click on the cell where the data is to be copied, then select Paste.
7.4.2 Sheet Reference
Instead of the copy paste option, the user can decide to write a formula to reference a specific value from another worksheet.

Alternatively, type the formula by beginning with the equal sign then sheet name then exclamation mark (!) and then the cell reference such as E14, for example, =Sheet1!E14: Sheet1 is the name of the sheet where the data is being obtained from.
Figures 7.5 to 7.9 show different worksheets and the formula when content is copied to a different worksheet.

Figure 7.5: Data entered in Worksheet 1
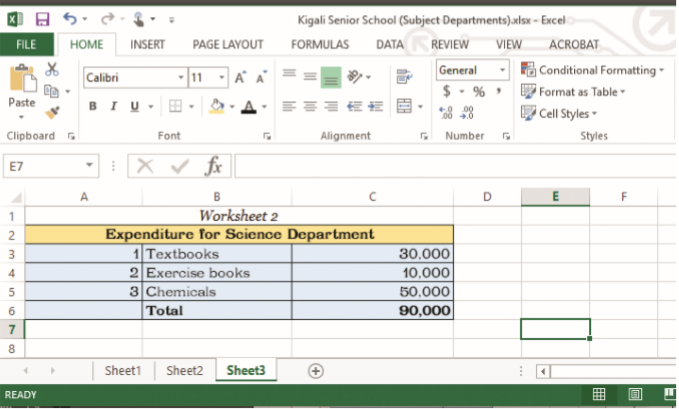
Figure 7.6: Data entered in Worksheet 2

Figure 7.7: Data entered in Worksheet 3

Figure 7.8: Data entered in Worksheet 4

Figure 7.9: Data entered in Worksheet 5
The Worksheet in figure 7.8 displays the formula used in sheet reference whereas the worksheet in figure 7.9 shows the actual values. The advantage of using sheet referencing is that whenever values in the original sheet are changed, the values are automatically updated in the other worksheets.

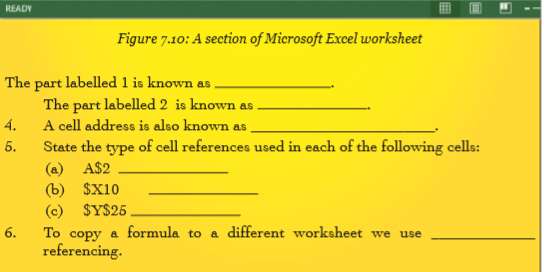
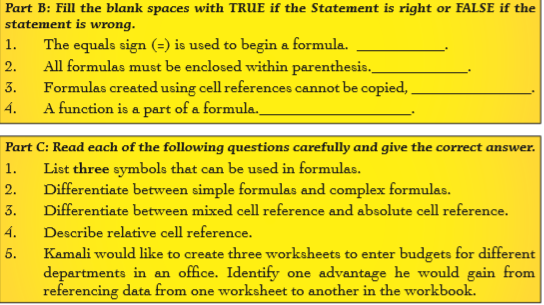

Figure 7.11: Students’ marks for CAT and examinations

2. Figure 7.12 shows a list of items in a shop. Use it to answer the questions that follow.

Figure 7.12: Costs of items
(a) Open a new workbook and type the following data in a worksheet as it appears and save it as Costs on the desktop.
(b) Use cell references to:
(i) Compute the VAT for cement using the cost in cell D6.
(ii) Copy the formula entered in cell E2 to cells E3 to E5.
(iii) Compute the total cost of cement, including VAT in cell F2.
(iv) Copy the formula entered in cell F2 to cells F3 to F5.
3.The following is a hypothetical budget for three ministries in Rwanda. Use it to answer the questions that follow.
(a) Open Microsoft Excel and type the data in figures 7.13, 7.14, and 7.15 in separate worksheets that are named Sheet1, Sheet2, and Sheet3 respectively. Save the Excel document as Budgets on the desktop.
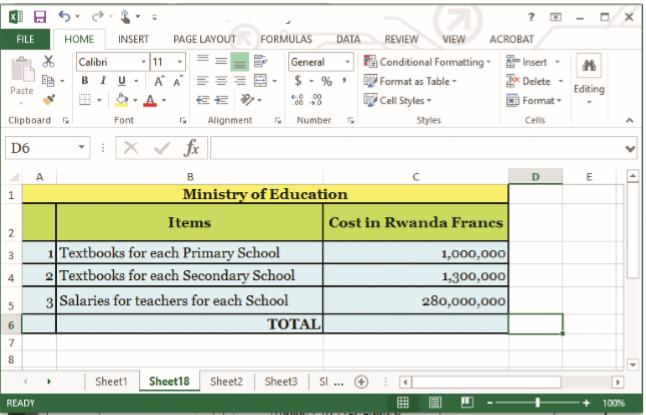
Figure 7.13: Cost of items at the Ministry of Education
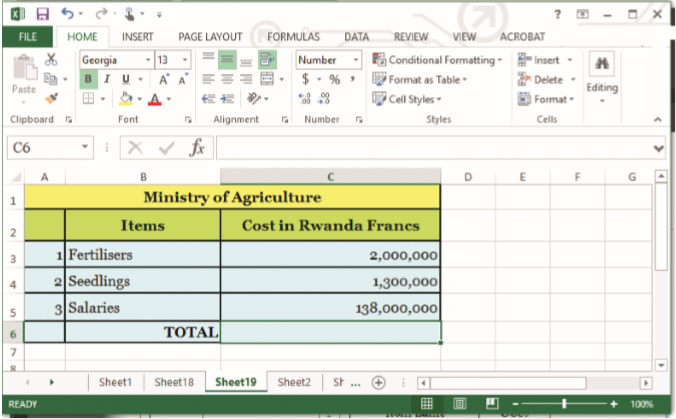
Figure 7.14: Cost of items at the Ministry of Agriculture

Figure 7.15: Costs of items at the Ministry of Health
(b) Calculate the total in each ministry.
(c) Create another worksheet and key in the information shown in

Figure 7.16: Total cost of items for the ministries
(d) Sheet reference the total for each ministry to appear on Sheet4.
(e) Calculate the totals for all the ministries.
(f) Change the cost of seedlings from 1,300,000 to 1,350,000 on Sheet1.
(g) Observe the change in the worksheet you created for TOTALS.
Save the changes in the document as Final.
7.5 Functions
Functions are inbuilt formulae that you can quickly use to perform calculations automatically.
As discussed in Unit 4, every function must have the following components:
(i) Begin with an equal sign (=) or the at (@) sign.
(ii) The name of the function.
(iii) Cell addresses or data range. The data range is enclosed in parenthesis () or round brackets (). It contains the cell addresses which have the information to be manipulated mathematically. The addresses can be separated by use of a colon or comma.
The user can either type functions on their own or use the paste (fx) function. To activate this function, simply click on the fx label on the formula bar or click the Formulas menu on the menu bar and select Insert function from the Function Library group. A dialog box appears as shown in Figure 7.17(a).

Figure 7.17 : The Insert Function dialog box
To make use of this function, do the following:
(i) Click on the cell where the result is to be displayed.
(ii) Activate the Paste function to display the Insert Function dialog box shown in Figure 7.17.
(iii) Select the function required to manipulate the data under Select a function: section.
(iv) Click OK to apply and to open the Function Arguments dialog box. See Figure 7.18.
(v) Excel automatically inserts the data range under Number1 box and displays all or some of the values to be manipulated besides the box. However, the user has an option of either accepting the argument or typing their own. To type a new argument,click on the box and delete the given range then type another one.
Figure 7.18: Function Arguments dialog box
Excel has many functions which are divided into different categories. The following are some categories of functions: Mathematical, Logical and Text. Figure 7.19: Categories of functions
7.6 Mathematical Functions
They are used to perform common mathematical operations. They include: SUM, AVERAGE, ODD, INT, ROUND, EXP, SQRT, POWER, MOD, MAX, and PRODUCT.
• SUM: This function adds all the values in a specified range of cells. The general syntax is =SUM(Number1, Number2…Number N).
• AVERAGE: It is used to calculate the mean of values specified in a selected range of cells. Empty cells within the range are ignored while those that have zero values are included. The syntax is: =Average(data range).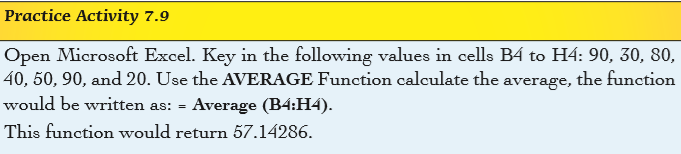
• ODD: It returns a value rounded up to the nearest odd integer. The general syntax is =ODD(number) where number is the value to be rounded.
Note:
(i) If number is non-numeric, ODD returns the #VALUE! error.
(ii) Regardless of the size of the number, a value is rounded up when adjusted away from zero.
(iii) If number is an odd integer, no rounding occurs.
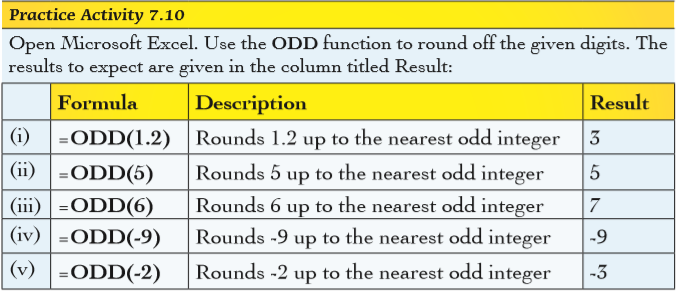
• INT: Rounds a number down to the nearest integer. The general syntax is =INT(number) where number is the real number to be rounded down to an integer.
• ROUND: This function rounds off a number to a specified number of digits. The general syntax is =ROUND(number, num_digits) where number is the value to be rounded and num_digits is the number of digits in the fractional part of the number to which the result is to be displayed.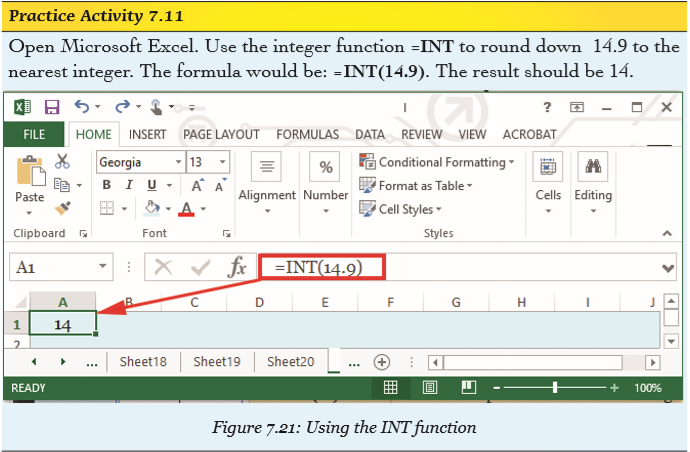
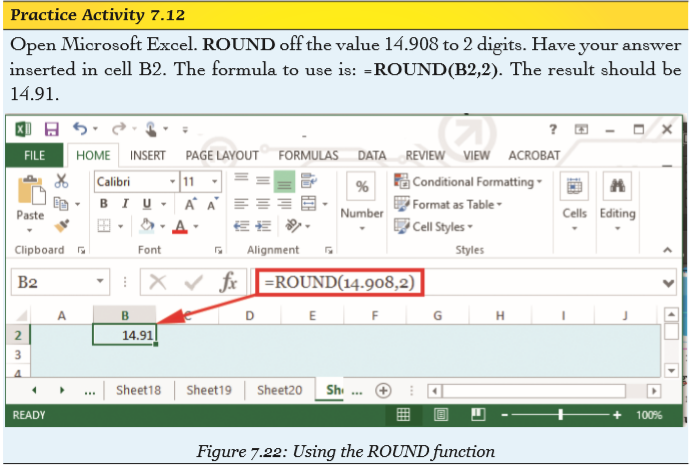
Note:
(i) If num_digits is greater than 0, then number is rounded to the specified number of decimal places.
(ii) If num_digits is 0, the number is rounded to the nearest integer.
(iii) If num_digits is less than 0, the number is rounded to the left of the decimal point.
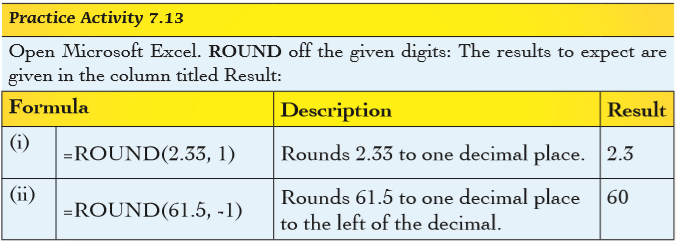
• EXP: Returns “e” raised to the power of number. The constant e equals 2.71828182845904, the base of the natural logarithm. The syntax is =EXP(number) where the number is the exponent application to the base of “e”.
• SQRT: This function returns a positive square root of a number. The general syntax is =SQRT(number) where number is the value for which the square root is to be obtained. If number is negative, this function returns #NUM! error.
• POWER: Return the result of a number raised to a power. The general syntax is =Power(number, power) where number is the base number which can be any real number while power is the exponent to which the base number is raised.
The “^” operator can be used instead of Power to indicate to what power the base is to be raised.

• MOD: It returns the remainder after a number is divided by a divisor. The result obtained has the same sign as the divisor. The general syntax is: =MOD (number, divisor). Where number is the number for which the remainder is to be found and divisor is the number used for dividing.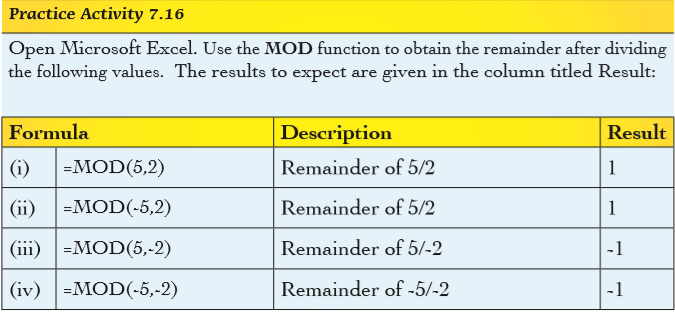
• Note: If divisor is 0, MOD function returns the #DIV/0! error value.
• The MOD function can be expressed in terms of the INT function: MOD (n, d) = n – d*INT (n/d).
• MAX: The term Max refers to the function used for obtaining the maximum or largest value in a selected range of cells. If the selected range of cells contains no value, it returns a zero. The syntax is: =Max(data range).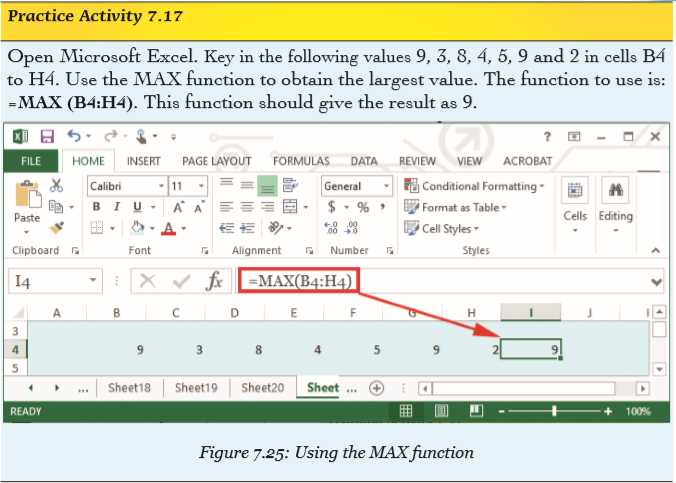
• PRODUCT: This function multiplies all the values within a specified range of cells. The general syntax is =Product(Number1, Number2… NumberN).
7.7 Logical Functions
All logical functions return either the logical TRUE or logical FALSE when their functions are evaluated. They include AND, NOT, OR and IF.
IF: This function evaluates a condition and returns one of the values in case it is found to be true and another value if it is false. When writing a formula using this function, there should be no space however long it is. The syntax for this function is dependent on the number of options and is as follows:
• For two options only:
® General syntax =IF(Condition, True, False)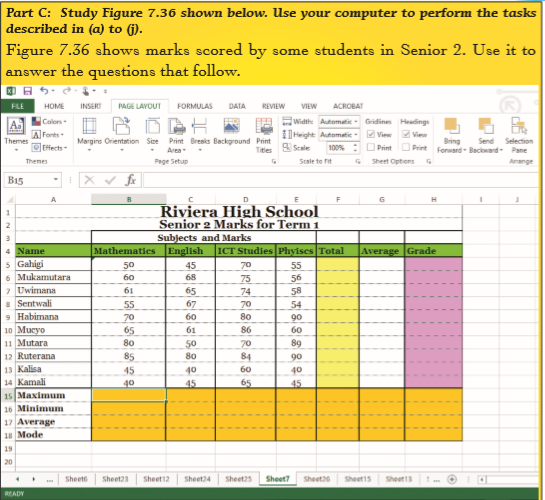
• For three options only: General syntax =IF(Condition1,Option1,IF(Condi tion2,Option2,Option3))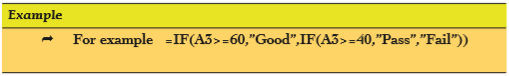
• For four options only: General syntax =IF(Condition1,Option1,IF(Condit ion2,Option2,IF(condition3,Option3,Option4)))

Note:
• It is important to note that the number conditions is always one less than the options. For example, if the options are four then the conditions are three because the last option is always the default.
• Any open bracket should be closed at the end of the entire “IF” function.
• No space should be used in the entire formula instead use commas.
• AND: It returns TRUE if all values are TRUE and it returns FALSE if one or more values are FALSE. The syntax is =AND (logical1, logical2,...) where logical1 is the first condition to be evaluated and logical2 is the optional condition.
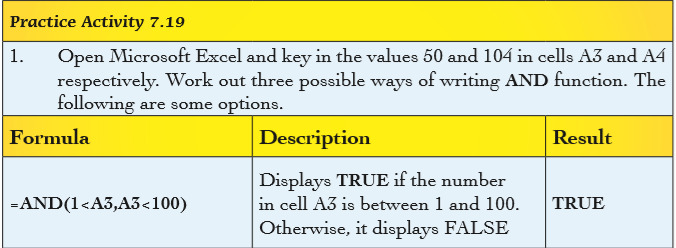
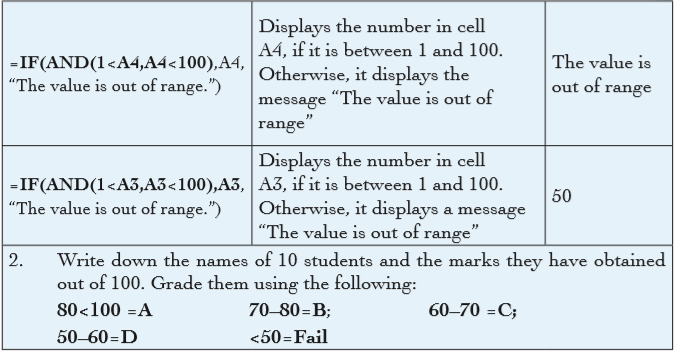
Notes:
• Text or empty cells found within the selected range of cells are ignored.
• If the selected range of cells does not contain any logical values, the function returns a #VALUE error.
• NOT: Reverses the value of its argument, that is, it changes FALSE to TRUE and TRUE to FALSE. It is used to make sure a value is not equal to one particular value. The syntax of the function is =NOT(logical) where logical is a value or expression that can be evaluated to TRUE or FALSE. If logical is FALSE, NOT returns TRUE and if logical is TRUE, NOT returns FALSE.
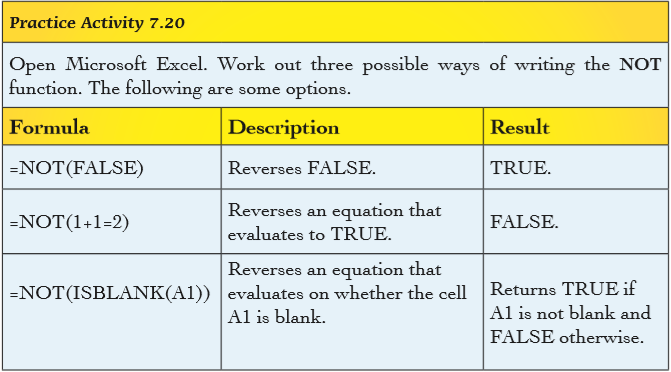
• OR:Checks whether any of the arguments are TRUE, and returns TRUE if any argument is TRUE and returns FALSE if all the arguments are FALSE. The syntax is:
=OR(logical1, logical2, ...) where Logical1 is required and subsequent logical values are optional. Notes:
• Text or empty cells given as arguments are ignored.
• It returns a #VALUE error if no logical values are found.
• Each logical condition must evaluate to TRUE or FALSE.
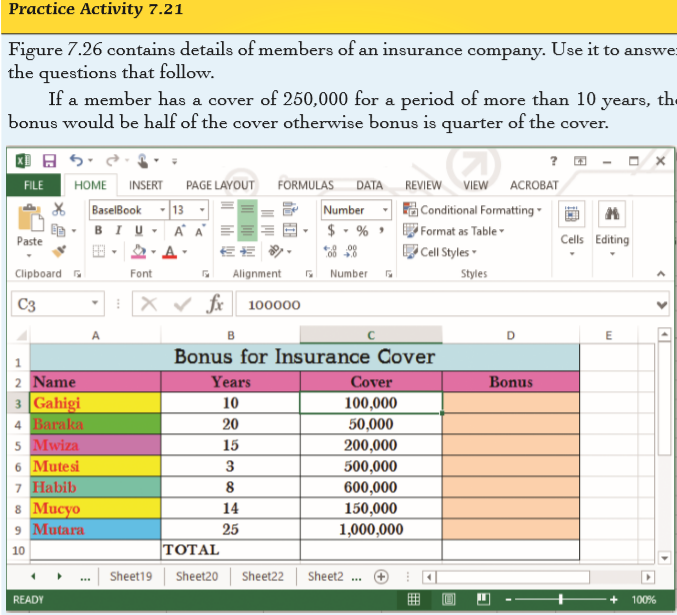
Solution

Solution with formulas
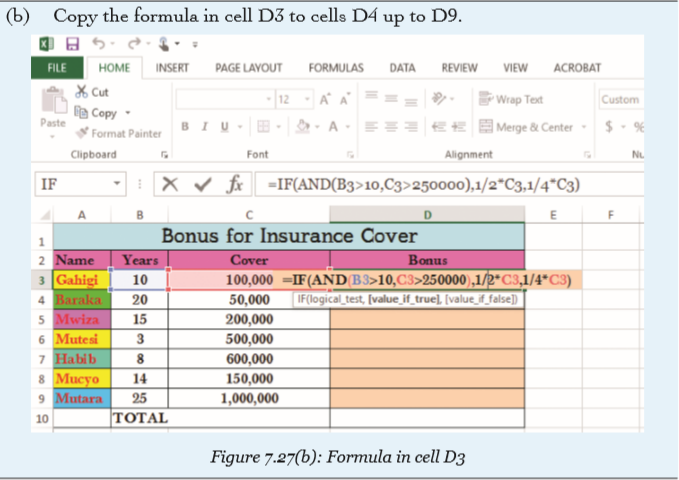

Solution showing calculated values

Figure 7.29: The bonus for each person
7.8 Text Functions
These are functions used in manipulating text strings. Examples of the text functions include: COUNTA, COUNTABLANK, UPPER, LOWER and REPLACE and SEARCH.
• COUNTA: This function counts the number of cells that are not empty in a specified range (range: Two or more cells on a sheet. The cells in a range can be adjacent or nonadjacent.). It counts cells containing any type of information such as error values, text and empty text (“”).
For example, if the specified range contains a formula that returns an empty string, the COUNTA function counts that value. However, it does not count empty cells.
The syntax of the COUNTA function is: =COUNTA(value1, value2,…). Note: To count cells containing only values use COUNT function and to count cells that meet a given criteria, use COUNTIF function.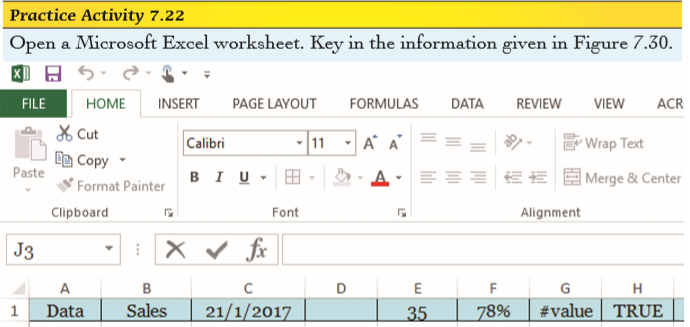
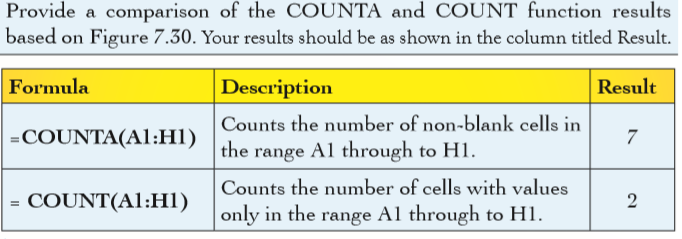

Figure 7.31: Comparison of COUNTA and COUNT functions
• COUNTBLANK: This function counts the number of empty cells in a specified range of cells as well as cells with formulas that return empty text (“”). However, it does not count cells with zero (0). The syntax is: =COUNTBLANK(data range).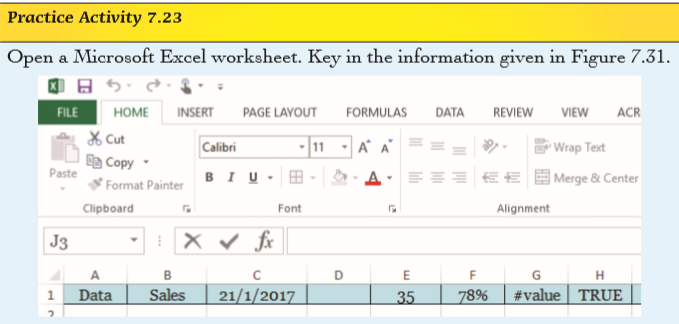
Figure 7.32: Worksheet data containing different types of data
To count the empty cells only in the range, the formula would be written as =COUNTBLANK(A1:H1). The result is 1.
• UPPER: This function converts text to uppercase. The syntax of the function is: =UPPER(text) where text is the information to be converted to upper case which can be a reference or text string.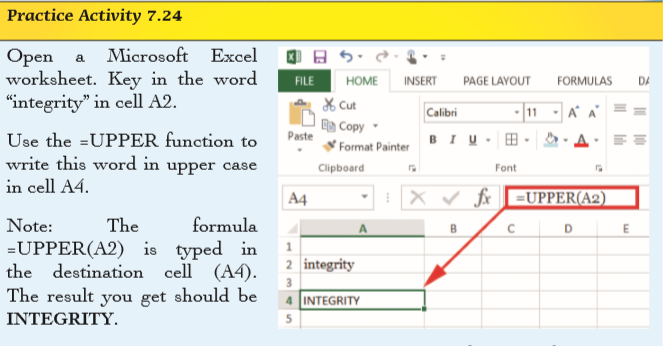
• LOWER: This function converts all uppercase letters in a text string to lowercase. The syntax of the function is: =LOWER(text) where text is the information to be converted to lower case.
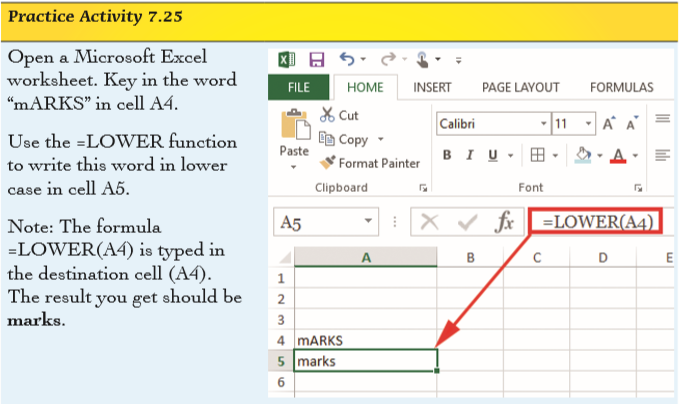
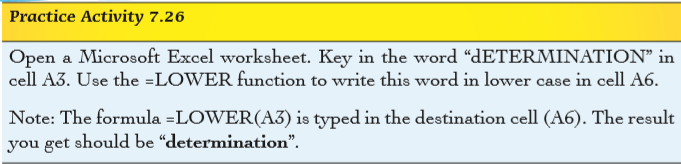
• REPLACE: It is used to substitute part of a text string based on the number of characters specified, with a different text string. The syntax of the function is:
=REPLACE(Old_text, start_num, num_chars, new_text) where:
® Old_text: This refers to the text containing some characters to be replaced.
® Start_num: This is the position of the character to be replaced in the old_text.
® Num_chars: is the number of characters in old_ text that the REPLACE function is to replace with new_text. ® New_text: is the text that will replace characters in old_text.

Figure 7.34: Using the REPLACE function
• SEARCH: This function locates one text string within a second text string then returns the number of the starting position of the first text string from the first character of the second text string. The syntax is: =SEARCH(find_ text,within_text_start_num) where:
® Find_text is the text to be found.
® Within_text is the second text string where the text in the find_text is to be found.
® Start_num It is optional. It is the character number in the within_ text argument at which the search should begin.
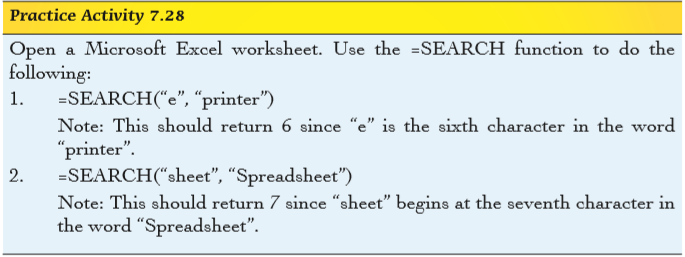

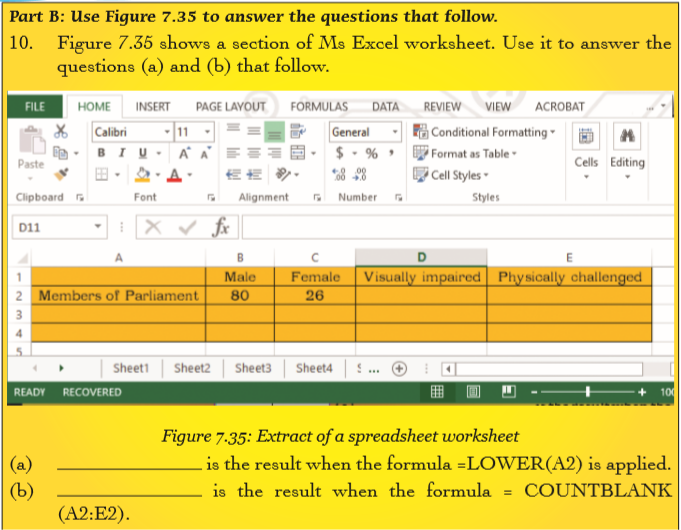


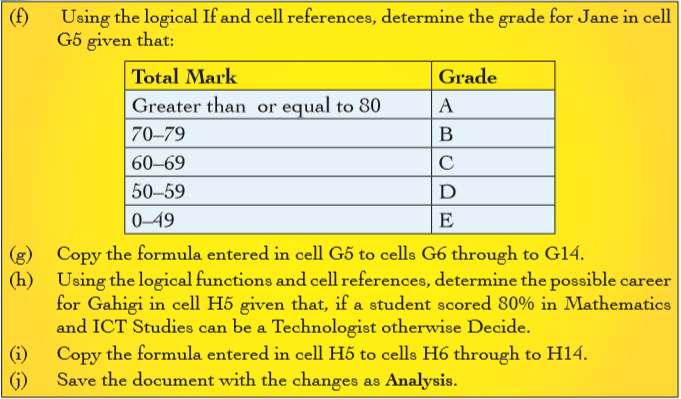

7.9 Conditional Formatting
Conditional formatting enables the user to answer specific questions about the data in a worksheet. It can be applied to a cell range or an entire worksheet. It changes the appearance of a range of cells based on the conditions (or criteria).
If the condition is true, the range of cells is formatted based on that condition.
However, if the condition is false, the range of cells is not formatted.
When a conditional format is created, it is possible to reference only other cells on the same worksheet or, in certain cases, cells on worksheets in the same workbook currently open.
Conditional formatting, however, cannot be used on external references to another workbook. The following are some of the features of conditional formatting that can be applied: highlight cell rules, top bottom rules, data bars, colour scales, and icon sets.
7.9.1 Highlight Cell Rules
To apply Highlight cell rules, do the following:
(i) Select the data where the highlight cell rules are to be applied.
(ii) Click on the Home tab, in the Styles group, click on Conditional Formatting icon then point to Highlight cell rules. A drop down menu appears as shown in Figure7.37. The keyboard shortcut is as follows: LONG press ALT then H followed by L, and finally H key.
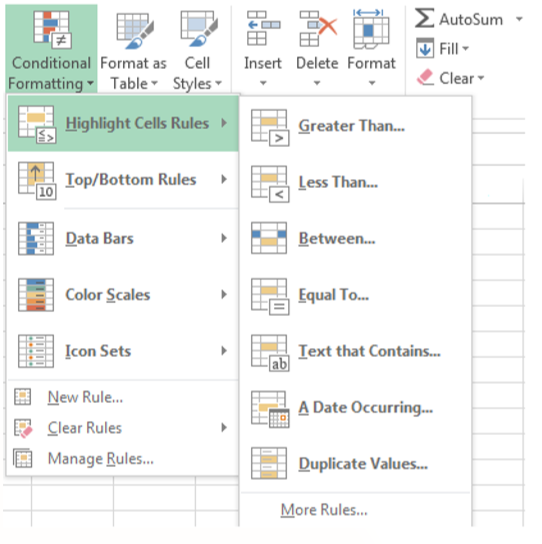
Figure 7.37: Highlighting cell rules
(iii) Select the desired highlight cell rules option such as greater than or less than options.
The following are the options available and their descriptions.

Figure 7.38: Highlight cell rules
(iv) Choose the desired format style from the with box as shown in Figure 7.39.

Figure 7.39: Different fill options that are available
(v) Click OK to apply.
7.9.2 Top/Bottom Rules
To apply Top/Bottom, rules do the following:
(i) Select the data where the Top/Bottom Rules is to be applied.
(ii) Click on the Home tab, in the Styles group, click on Conditional Formatting icon then point to Top/Bottom Rules. A drop down menu appears as shown in Figure 7.40. The keyboard shortcut is as follows: Long press ALT then H followed by L and finally T key.
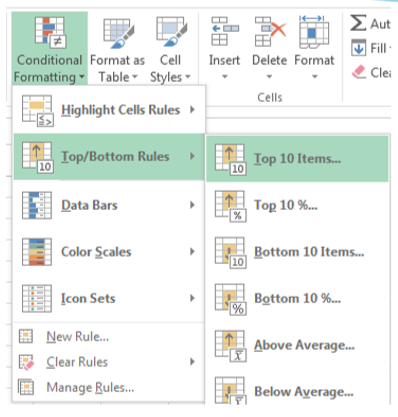
Figure 7.40: Applying Top/Bottom rules
(iii) Select the desired top/bottom option such as Above Average options.
(iv) Choose the desired format style from with box.
(v) Click OK to apply.
7.9.3 Data Bars
To apply Data Bars do the following:
(i) Select the data where the data bar is to be applied.
(ii) Click on the Home tab, in the Styles group, click on Conditional Formatting icon then point to Data Bars. A drop down menu appears as shown in Figure 7.41. The keyboard shortcut is as follows: Long press ALT then H followed by L and finally D key.
(iii) Select the desired data bars option. The format is automatically implemented.
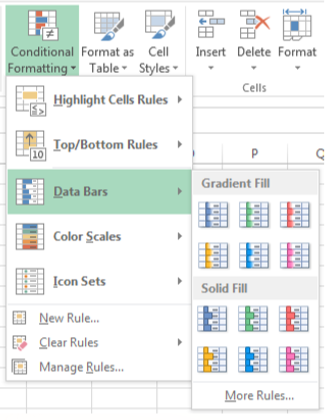
Figure 7.41: Applying data bars
7.9.4 Colour Scales
To apply colour scales, do the following:
(i) Select the data where the colour scales is to be applied.
(ii) Click on the Home tab, in the Styles group, click on Conditional Formatting icon then point to Colour Scales. A drop down menu appears as shown in Figure 7.42. The keyboard shortcut is as follows: Long press ALT then H followed by L and finally S key.
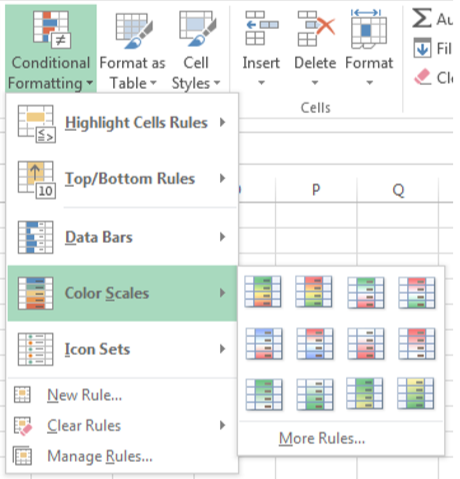
Figure 7.42: Applying colour scales
. (iii) Select the desired colour scales option.The format is automatically implemented. 7.9.5 Icon Sets To apply icon sets, do the following:
(i) Select the data where the icon sets is to be applied.
(ii) Click on the Home tab, in the Styles group, click on Conditional Formatting icon then point to Icon Sets. A drop down menu appears as shown in Figure 7.43. The keyboard shortcut is as follows: Long press ALT then H followed by L and finally I key.
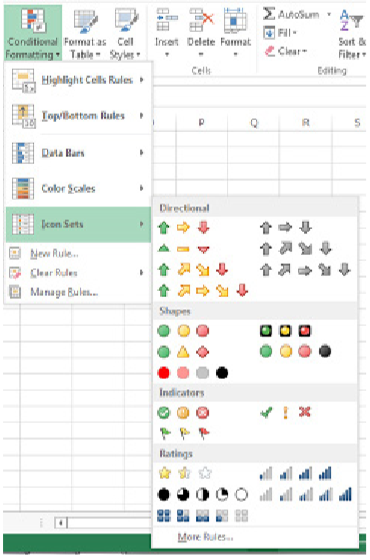
Figure 7.43: Applying icon sets
(iii) Select the desired icon sets option. The format is automatically implemented on the cells containing values.
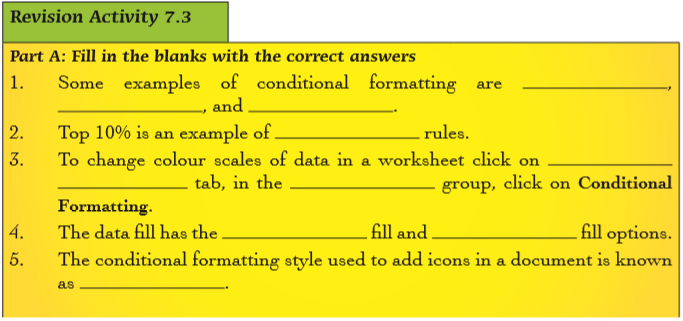
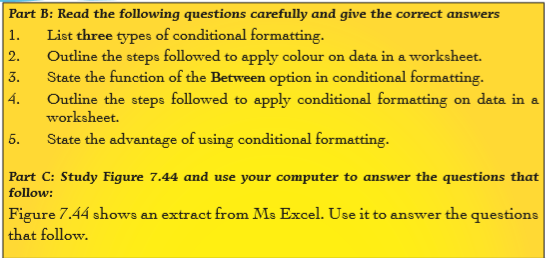
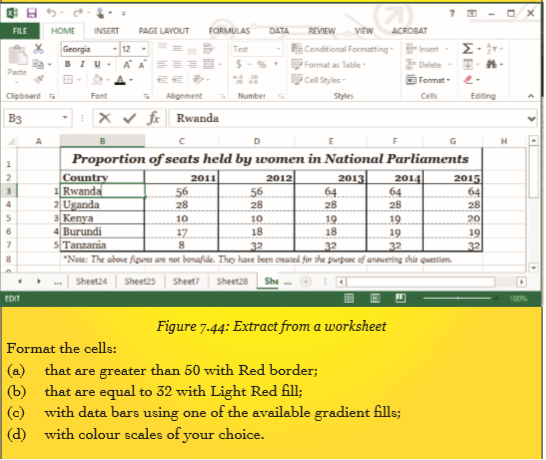
7.10 Definition of Key Words in this Unit
Revision Exercise 7
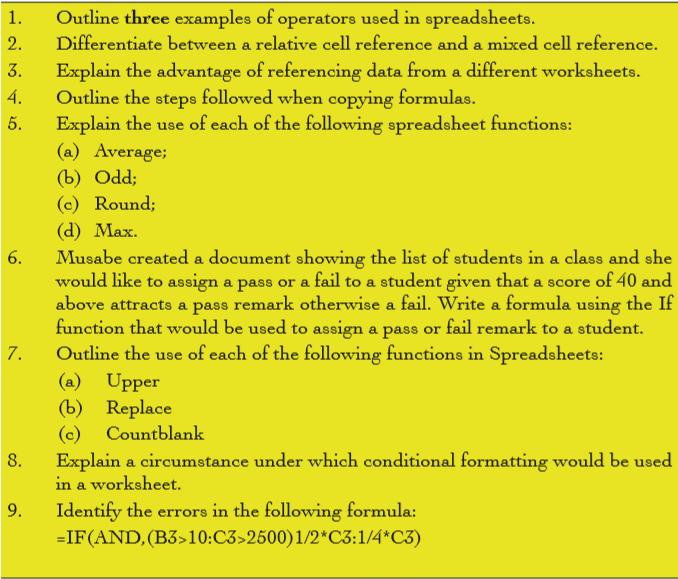

Unit 8:Network Components and Social Media Applications
Key Unit Competency: By the end of this unit, you should be able to:
1. Identify computer network devices, medium and peripherals.
2. Connect different computer devices to the network.
3. Use social media to exchange information on social life.
Introduction
Sharing of information is vital within organisations and institutions locally, nationally, regionally and internationally.
Due to technological developments, sharing of information is made possible through Internet connectivity. Indeed, the term Global Village is now commonly used to refer to the world. This is because the world is today considered as a single community where members are connected by electronic communications.
Electronics and technology refer to devices such as computers and mobile phones that enable people to easily communicate and share information through Internet connectivity. A person can communicate with friends and relatives within Rwanda, Africa and even the entire world.
8.1 Definition of network and computer network
The term network refers to a collection or a group of interconnected objects or people. A computer network refers to a set of computers that are connected together for the purpose of sharing resources.
The most common way of connecting computers is through the Internet. Examples of resources that are shared through a computer network are printers or a file server.
A computer network is also defined as set of interconnected computing nodes that are organised in such a way that they can exchange data, information, or resources. A node is a connection point in a computer network. Devices such as a personal computer, laptop, cell phone, smart phones, tablet, scanners and printers are examples of nodes.
8.2 Devices that can be connected to a network
Computers in a network are connected through a transmission medium using a set of rules called protocols. In computing, a protocol or communication protocol refers to a set of rules in which computers communicate with each other.
Devices that can be connected to a network are also referred to as Data Terminating Equipment (DTE) or computing nodes. Examples include desktops, laptops, printers, scanners, PDAs, smartphones and the server.
A server is an application program that provides services to other computer programs in a network. Note that the computer on which the server application program runs is also referred to as a server.

Figure 8.1: Devices connected in a computer network
8.3 Connecting different Devices to the Computer Network
Through technology, any of the devices shown in Figure 8.1 can be connected to a computer network through the use of cables, or through wireless connectivity.
8.3.1 Connecting Devices Using Cables
To connect devices in a computer network, you can use cables. There are different types of cables.
The cables are connected to the devices through an Ethernet port. An Ethernet port is a socket on a computer that allows one to connect devices to a computer network.An Ethernet port is usually found on networking devices, such as computers, routers, and television sets. Devices are connected in a network through an Ethernet cable.
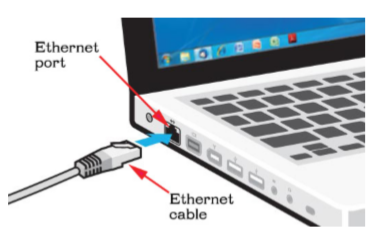
Figure 8.2: An Ethernet port and cable
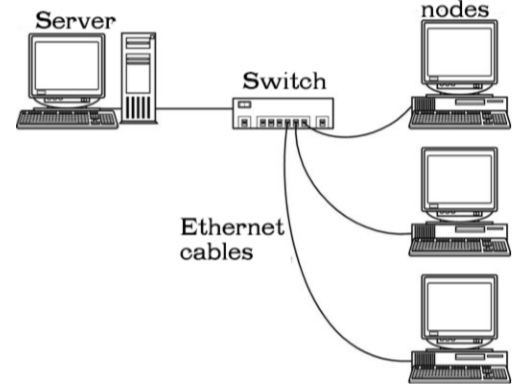
Figure 8.3: Computers in an Ethernet network
8.3.2 Connecting Devices Using Wireless Media
As the word wireless suggests, it means without wires. A wireless computer network, therefore, does not require a cable of any kind for connection. Sometimes the wireless network is also referred to as a Wi-Fi network. Wi-fi stands for Wireless Fidelity. It is a technology that allows computers, smart phones, or other devices to connect to the Internet or communicate with one another in a wireless network. The use of a wireless network enables devices to be connected to a network without the process of introducing cables into buildings. Instead, the devices are connected by radio waves.
In a wireless network there is a component called the wireless router or access point.
The wireless router or access point should be installed in a way that ensures that the network coverage is wide. In a large area, one may require more than one access point in order to have adequate coverage. One can also add access points to the existing wireless router to improve coverage.

Figure 8.4: Devices connected in an wireless network
In Windows 10 that you covered in Senior 1, you can connect to a wireless hotspot using your laptop.
A wireless hotspot is an area covered by a usable signal that allows wireless connection to the Internet or to some other computer network.
Wireless connections are secured by use of passwords. To connect to a locked hotspot, you must know the password.

Figure 8.5: A laptop screen showing wireless connections available
Computers in a network share resources. Network resources refer to forms of data, information, hardware devices, and software that can be accessed by a group of computers through the network. Network resources are also known as shared resources
Shared resources are important in work environments where collaboration is essential to success.
Network Services
The term network services refers to software and connectivity tools that are installed in a network. Network services are managed by a central server and are then distributed to the networked computers. The computers are able to access the shared files and other services from a central location.
In a computer network, the desktops connected are known as client computers or workstations.
The server may be located in a different room or building away from the workstations. The networked services are accessed through network cables or through a wireless network. Through the network, data is transferred within the network. Cables or wireless network connection also provide access to the Internet.
Some of the services offered by a network include:
• User management
• System administration
• Email services
•Shared printing
•File sharing
• Shared computer software
1. User management
• This involves the creation of user accounts. Each account contains user names and their respective passwords.
• It also involves allocation of user access rights and privileges to ensure data protection.
• For example, when a student joins a school, the network administrator creates a new account for the student to be able to access the network services. A network administrator is also called a systems administrator. This person manages the network in a school or organisation.
The network administrator ensures that the computer network is up to date and running smoothly.
2. System Administration
• The system administrator is able to control all the computer users from a central location.
• The administrator is able to view what each user is doing with their computer and even control the kind of programs that the users can access.
• The system administrator can add new programs or update existing software from the network. This increases the overall quality of the network and reduces staff time spent on computer maintenance.
3. Email Services
• These are also known as webmail or online email services.
• Email services enable users in a network environment to send, receive and review e-mails from their workstations.
• Email services offer easy access and storage of e-mail messages for users.
• When logging into an email service, users type in their username and password. The messages are stored on the provider’s server.
4. Shared Printing
• A printer is connected to a computer within a network.
• The shared printer can be used by all other computers within the network instead of having each computer connected to its own printer.
5. File sharing
• A computer network enables users to share files.
• You were introduced to Windows 10 in Senior
1. This operating system has the feature that allows you to share your files with others and access their files as well.
• The Share tab in the File Explorer has different tools and options you can use to share files within a computer network.
• File sharing allows students to collaborate when doing a project.
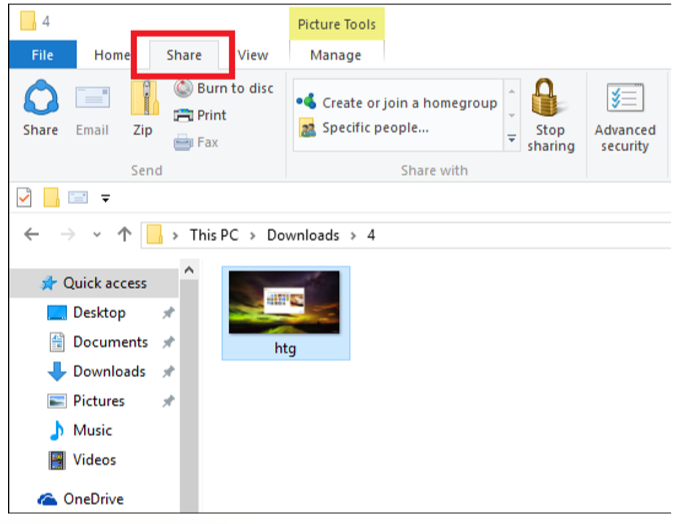
Figure 8.6: File sharing in a computer network
6. Shared Computer Software
• A computer network allows users to share software. Users do not have to install the application software on their different computers. The software is hosted on the server. In this way, the individual computers do not have to utilise disk space for installation.
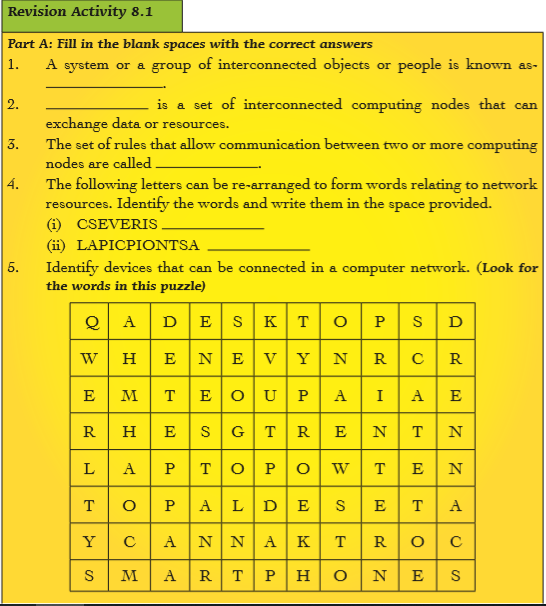
8.5 Network Medium
It is also known as transmission media or channels. They facilitate interconnection of computers and other devices in a network by providing a pathway through which data and information is carried from one point to another. Examples of transmission media are cables and radio waves.
8.5.1 Cables
They are also known as bounded or guided media. Data signals are carried from source to destination through a physical pathway that is restricted. They are made up of a conductor protected by a jacket insulating material.
There are three types of bounded media, namely Twisted Pair Cable, Coaxial Cable, and Fibre Optic Cable.
1. Twisted-pair cable
This is a cable made up of pairs of insulated copper wires twisted along each other. The twists are done to protect the cable from crosstalk.
Crosstalk is interference that is caused by one or more wires. Crosstalk can cause errors, noise, or prevent cables from transmitting accurate data. They are usually packed as four sets of pairs in a cable. There are two types of twisted pair cables namely: Unshielded Twisted Pair (UTP) and Shielded Twisted Pair (STP).
2. Unshielded Twisted
Pair This is a type of twisted pair cable where each pair is not shielded from the others and hence the name unshielded twisted pair. This cable is vulnerable to noise whose source could be radio signals, radiation from spark plugs in motor vehicles and lightening sparks.
3. Shielded Twisted Pair
Each twisted pair has a shield around it protecting the pair from others. The shielding minimizes electromagnetic interference, as well a cross-talk from neighboring pairs.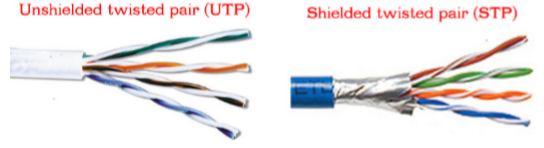
Figure 8.7: Types of twisted cables
Advantages of Twisted Pair
• It is easy to install.
• STP cables yield maximum bandwidth regardless of the external conditions.The shielding, however, makes the cable heavier and more difficult to bend.
• Cost of installation is low since the cables are readily available in the market.
• STPs are commonly used by large-scale companies in high-end applications that require the maximum bandwidth.
• It can only up to a maximum of 100Mbps (Megabits per second).
Disadvantages of Twisted Pair
• It is very sensitive to Electromagnetic Interference compared to other cables.
• UTP has a great disadvantage in that it has a limited bandwidth, which restricts long distance transmission with low error rates.
4. Coaxial Cable
This type of cable contains two conductors, namely copper wire which runs through the centre of the cable where the actual data travels and a shield made of wire mesh tube, metallic foil, or both.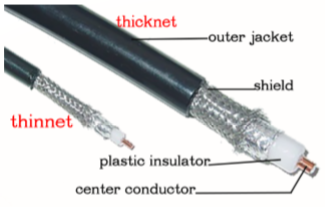
Figure 8.8: Coaxial cables
The copper wire is surrounded by plastic insulator which is covered by a conducting shield that acts as a return path and also filters Electromagnetic Interference (EMI).
The outer jacket which also acts as an insulator forms a protective covering for the cable. It resembles the cable used for connecting a television (TV) aerial to the TV set. It carries data in form of electrical signals.
There are two types of coaxial cable, namely thinnet and thicknet. Thicknet is also called thickwire and thinnet and called Thinwire. Thicknet and thinnet are commonly used terms for the larger and smaller size of coaxial cable used in Ethernet local area networks.
Advantages of Coaxial Cable
• It can carry data, voice and video signals. Therefore, it is commonly used in TV aerial cables.
• It is more resistant to radio and electromagnetic interferences (EMI) hence more stable than twisted pair.
• It can transmit up to one Gigabite per second (1Gbps).
Disadvantages of Coaxial Cable
• They are more expensive to buy as compared to twisted pair cables.
• Installation cost is high compared to twisted pair cables.5. Fibre Optic cable
This type of cable uses glass material strands or fibres which are as thin as a human hair. Fibre optic cables carry digital information over long distances.
Figure 8.9: Fibre optic cable
Light is used to transmit data signals unlike in coaxial and twisted pair cables which use electrical signals. The electrical signal from the computing node is converted to a light signal using a Light Emitting Diode (LED) or lasers and then they are transmitted through the cable. At the receiver the light signals are converted back to electrical signals by a photosensitive device.
Advantages of fibre optic cable
Note the following facts about fibre optic cables:
• Fibre is thinner and smaller than other types of cabling such as copper. They are therefore lightweight. They are suitable for situations where space is limited.
• Fibre optics have more bandwidth. This means that fibre optics can carry more information with far greater efficiency than cables. This translates to faster internet speed.
• Fibre optic cabling is easier to work with and transport.
• Fibre optics are more secure.
• Fibre optics are more efficient. Signals sent over fibre optics do not reduce nearly as quickly as those sent over copper wiring. There is nearly no signal loss in many situations.
• Fibre optics use less energy. Lower energy requirements means that fibre optics are more friendly to the environment.
• Fibre optics use light. Since there is no electrical current passing through a fibre optic cable, there is no heat. No heat means that fibre optic cabling is not a fire hazard in the same way that metal wiring is.
• Fibre optic cables are not affected by weather conditions such as changes in the temperature, rain, cold, or any other environmental conditions.
• Fibre optics are faster. Data is transmitted faster because of the increased capacity of fibre optic cables.
• Fibre optic cables are immune to Electromagnetic Interference (EMI). They do not generate electrical signals hence can be used in dangerous places such as flammable areas.
Disadvantages of fibre optic cable
• They require expensive connectivity devices and media.
• Their installation is a delicate process because the cables must be handled carefully.
• They are relatively complex to configure.
• A broken fibre optic cable is difficult and expensive to repair.8.5.2 Wireless Connectivity
1. Radio waves
They travel just like surface water waves that is, when an object is dropped in a body of water,
waves move out from the object in all directions (omnidirectional). This means that radio waves
start from a central point and spread outwards over the covered area hence they travel in all
directions from the source.
As they travel outward, their energy spreads outwards over the covered area.
They have no physical link between sender and receiver. They are also known as unbounded, unguided
or wireless media. Usually radio waves are sent through the atmosphere.
At the source there is a transmitting antenna which propagates the signals and at the destination
there is a receiver antenna which collects the signals.
Radio waves are used in radio and television broadcasts, but they can also be used to transmit data. Radio waves can be of High Frequency (HF), Very High Frequency
(VHF) or Ultra-High Frequency (UHF).
2. Infrared transmission
Infrared does not penetrate walls or solid objects hence security and interference problems are not encountered. There is no frequency allocation issue since no licence is required. This technology is used in TV remote control and wireless computer networking.
For transmission to take place, there must be a transceiver to aid in the communication. Transceivers must be in close range with each other, either directly or via reflection from a light-coloured surface such as the ceiling of a room.
3. Bluetooth
This is a technology that enables the connection of electronic devices over a short distance of up to about 10 metres creating a Personal Area Network (PAN) with a high level of security.
This technology can be used with cell phones, personal computers, laptops, printers, digital cameras and telephones among others. It is also an example of radio transmission technology. It is not licensed, therefore, communication takes place at no cost. To connect a laptop to a Bluetooth network, do the following:
(i) Click on the Bluetooth icon on the task bar as shown in Figure 8.10.
(ii) Ensure that the Bluetooth feature in the other device is activated.(iii) Click on Add a Bluetooth Device for the system to automatically locate a nearby Bluetooth device.
(iv) Pair the devices then click Join a Personal Area Network.
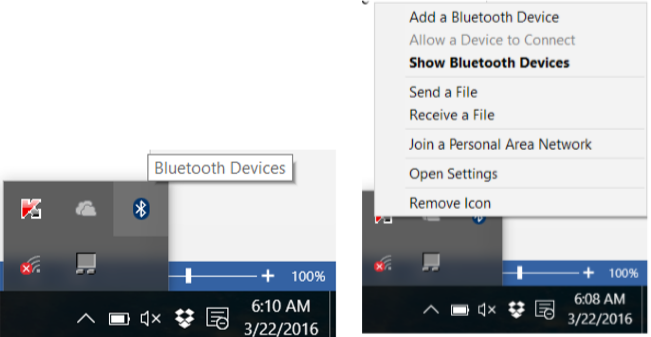
Figure 8.10 : Connecting via Bluetooth
4. Wi-Fi (Wireless Fidelity)
It is a wireless networking technology that uses radio waves to provide highspeed Internet and networking connections. Examples of WiFi-enabled devices include laptops, cell phones, tablets, iPads, peripheral devices such as printers and keyboards among others. They communicate with a single computer which is fitted with a WiFi adapter.
Advantages of wireless communication
• Allows users of the network to roam without losing access to the network.
• It is easier to add and remove nodes.
• It is ideal for use in networks that cover a wider geographical area.
• Enables communication in remote areas where the laying of cables is not possible.
Disadvantages of wireless communication
• Initial installation cost is very high.
• Security of information can be compromised since it can be easily tapped.
• Speed is slower than the use of fibre optic.
8.6 Computer Network Devices
They are communication devices that are used in networking. They are used in between the DTE and transmission media to provide an interface or junction for the network to be fully operational.
They are also known as Data Circuit Terminating Equipment (DCE). Examples of computer network devices include: Switch, Hub, Access Point, Router and Multifunctional device.
8.6.1 Hub
A hub is a connection point in a network. The hub connects many computing nodes together and is able to send signals from one node to another on the same network.

Figure 8.11: A hub that has devices connected to it
A hub connect networks that have the same rules and it transmits signals by broadcasting them to all the computing nodes in the network.
8.6.2 Switch
A switch is similar to a hub in physical structure except that it forwards data directly to its destination address without broadcasting it to all the other nodes in the network. Figure 8.12 shows computers in a network connected through a switch.
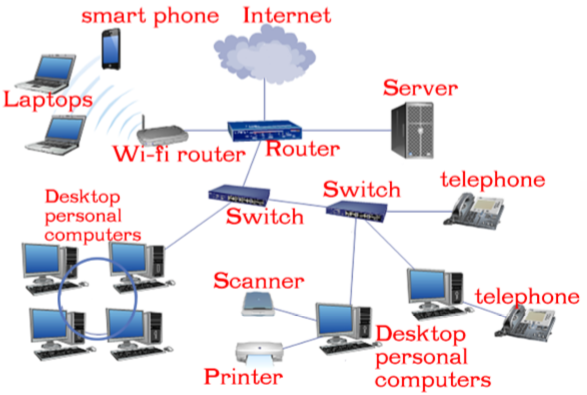
Figure 8.12: Computers connected to a network switch
In order for a switch to be able to perform its function, it has to keep records of the addresses of all the nodes in the network.
When a data signal is received, it goes through the records to confirm the address and transmits the signal directly to the device whose address matches the one in the signal.
8.6.3 Wireless Access Points (WAP)
In a wireless computer network, a wireless access point (WAP) is a hardware device that allows a Wi-Fi enabled devices such as tablets, laptops, and smartphones to connect to a wired network.
8.6.4 Router
It is a device that connects two different networks and sends data signals from one network to another. For example, it can connect a Local Area Network to a Wide Area Network.
A router performs a routing function. Routing is the process of moving data signals across a network from the source node to the destination node.
A router performs its function by listening to the entire network to determine the best path to route a data signal based on the destination address and the source.
Figure 8.13: A network using a Wireless Access Point (WAP)
Figure 8.14: A RouterWith Internet connectivity, computers can easily be connected to a network. Networking peripherals refer to hardware equipment, which enables computers to network.
Examples include hardware such as routers, switches, access points, network interface cards, and other hardware devices.
Hubs, switches, and routers are all devices that allow computers to be connected to other computers, other network devices, or even other networks. Each of the above peripherals has two or more connectors called ports. In connecting devices, the connecting cables are plugged in through the ports.
A network peripheral can also be a device that can be connected to a computer in the network either through the ports using data interface cables or using wireless media. Examples are: printers and scanners.
•Scanners:These are peripheral devices that input data by capturing the data directly from the source to the computer and convert it into a digital format. They are used for making turnaround documents. A turnaround document is a hardcopy output that has been taken back to softcopy for further processing. A scanner in a network can be used by several computers in a network, if it is shared.
•Printers:A printer is an output device that produces hardcopy output usually on a physical print medium such as paper. A printer in a network can serve many computers which submit their print jobs to it. If more than one computer sends a job to the printer at the same time, the submitted jobs are placed in a queue. The jobs in the queue are printed one after the other in the order in which they are admitted in the queue until they are completed.

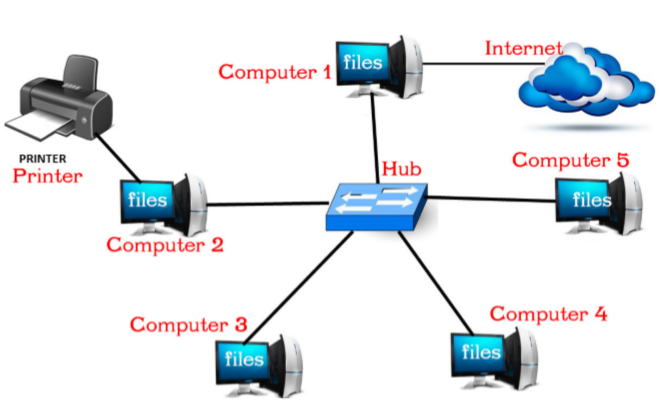
Figure 8.15: A peer to peer network
8.8 Social Media
Social media refers to Internet-based applications that enable users to create and exchange information, career interest ideas and other content such as images or videos. They enable people to participate in group networking.
8.8.1 Value of Social Media
The following are some of the values of social media:
• Clarity of information: The information should be clear and easy to understand in order to be very helpful.
• Effectiveness: Only write or talk about something when there is solid evidence that it is true.
• Interesting: One should not be boring. Ensure that the information is engaging and interesting.
• Respectful: One should be careful to be respectful and to appreciate diverse points of view with openness and inclusion.
8.8.2 Social Media Best Practices
The following are some of the social media best practices:
• Transparency: Being open builds trust among the social media members. It creates links to connect us with one another by always keeping in touch.
• Be genuine: Be the real person the members would have the pleasure to know.
• Be interested in others: Be a good listener. This shows that one takes an interest in other people.
• Follow back and interact: The interacting members should always be in contact. This creates a healthy goodwill for chatting with each other.
• Do not overshare: Always focus on sharing items that are of value to members.
• Respond to positive and negative comments: Do not only respond to positive comments; pay attention to negative comments as well and respond with maturity. Use good judgement to determine which ones to ignore.
• Keep it short: Some social media platforms, for example, Twitter limit the number of characters in a message Others such as Facebook and Google+ do not have this limit. Strive to keep your messages short.
8.8.3 Examples of Social Media
Some examples of social media include Facebook, Twitter, Google+, LinkedIn, YouTube, Blogging platforms, and Skype among others.Facebook
This is a popular free online social networking website that allows registered users to create profiles, share information such as messages, games, photos and video and keep in touch with friends, family and colleagues.

Figure 8.16: Facebook Logo
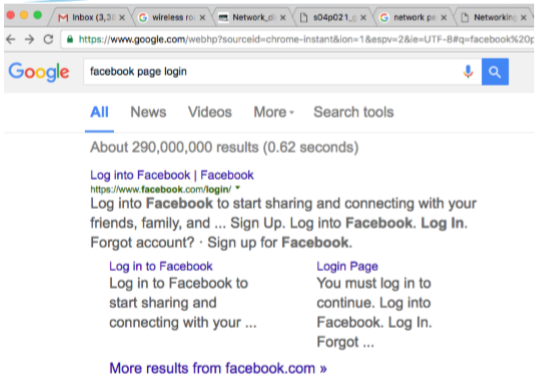
Figure 8.17: Logging in to Facebook
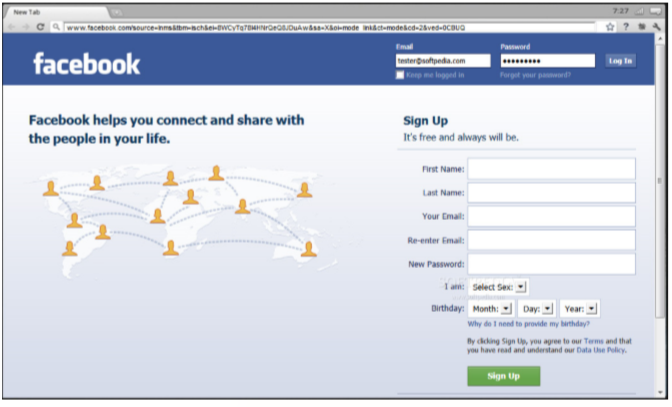
Figure 8.18: Log in to Facebook
Twitter This is a free online social networking service that allows registered members to send short messages or short posts referred to as tweets.
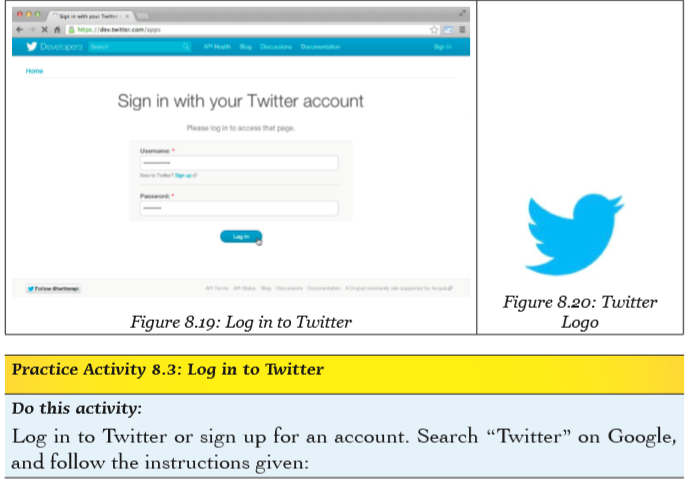
Google+
It is pronounced Google plus. This is a social networking site that is designed by Google to imitate the way people interact offline more closely as compared to other social networking services. It is also used to share other articles on other websites.
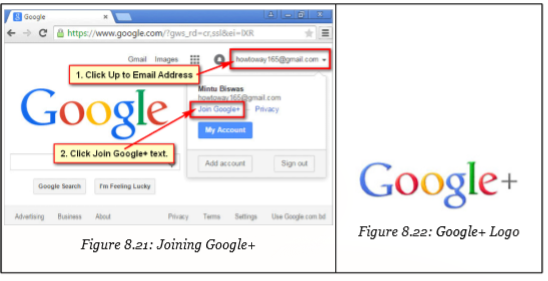

LinkedIn
This is a social networking site designed for professional networking. It allows registered members to establish and document networks of people they know and trust professionally. To log in to LinkedIn or sign up for an account, search “LinkedIn” on Google, and follow the instructions given.

Figure 8.23(a): LinkedIn Logo

Figure 8.23: Registering a LinkedIn account
YouTube
This is a free social media site that allows a user to upload, share or watch video content posted from other users. To log in to YouTube or sign up for an account, search “YouTube”on Google, and follow the instructions given.

Figure 8.24: YouTube Logo
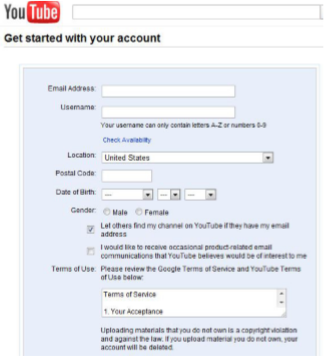
Figure 8.25: Registering a YouTube account
Blogging
A blog is a website that contains online personal content such as opinions, reflections, comments and experiences provided by the writer. It usually has images and links to other websites.
Blogging is the act of posting content on a blog or posting content on another person’s blog. Examples of blogging platforms are Wordpress, Blogspot, Tumblr, Weebly, LiveJournal, and Blogger.
Skype
Skype is a social media service that enables file transfers, texting, calling and video conferencing. It is a service that can be accessed using desktop computers, laptop/notebooks or tablets and other mobile devices, such as mobile phones.

Figure 8.26: Skype Logo
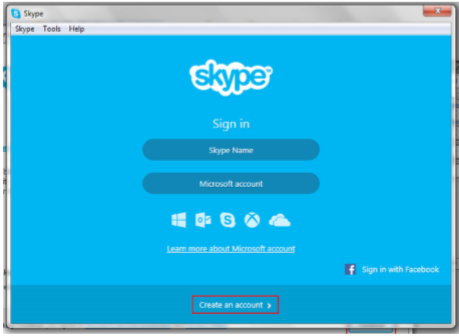
Figure 8.25: Registering a YouTube account
8.9 Definition of Key Words in this Unit
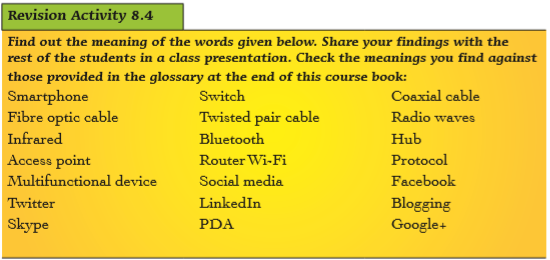
Revision Exercise 8
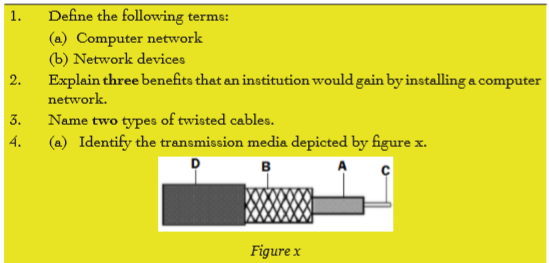
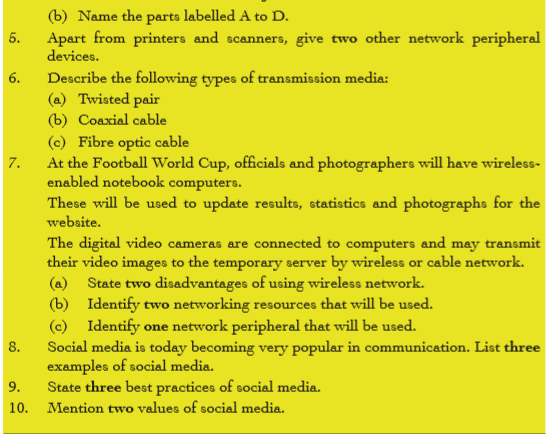
Unit 9:Game Programming (Scratch)
Key Unit Competency: By the end of this unit, you should be able to:
Design a game, collect data in a table and add game rules.
Introduction
Game programming is the process of writing codes that make things happen in a video game. It involves taking the design specifications of the game designs, combining the art and sound and translating it all into a playable game.
The educational value of game programming in Scratch extends beyond providing an easy and interesting introduction to programming.Programming requires logical thinking, critical reasoning, problem identification and solving skills and persistence.
9.1 Game Concepts
To create a basic game, the student must have an idea of the game name, list of sprites, sprite interaction, backgrounds and the counter rule and level advancement rule. The following stages are involved when creating a game to ensure clarity and greater understanding:
(i) Design the game.
(ii) Create game sprites.
(iii) Add game rules to game sprite(s).
(iv) Change background when the sprite moves.
(v) Manage scores and levels.
9.1.1 Game Name
When creating a game, it is important to assign a unique name to it. This is done in order to be able to retrieve and play the game easily. It is good practice to have the name of the game related to the nature of the game.
For example:
When creating a Cat and Mouse game a favourable name would be: Cat_Mouse Game.
9.1.2 List of Sprites
Designing a Game This involves creating a basic table that can be filled in as shown below:
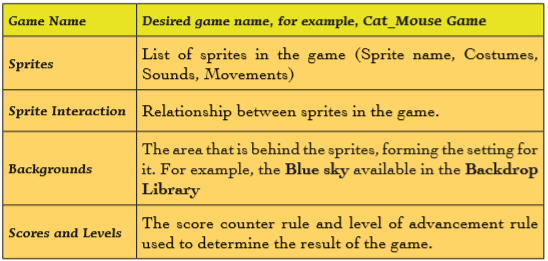
Table 9.1: Aspects of a game
After creating a basic table, it can be expanded by placing each item to its own table as shown in the Cat-Mouse-Cake Game example below:
Example 9.1
(i) The Cat moves back and forth across the screen and keeps moving in one direction. When it hits the edge of the stage, it bounces back. When the Cat touches the Mouse, it produces the sound, Meow2 and the thought bubble Meow!!! is displayed. The background switches to Brick Wall1 when the Cat eats the Mouse.
(ii) The Mouse reappears after four seconds.
(iii) The Mouse chases the mouse-pointer in steps and when it touches the Cat sprite, it disappears. The Mouse reappears after a certain period of time.
(iii) The Cake disappears when it is touched by the Mouse; that is, it is eaten. The background switches to Garden Rock when the Cake is eaten and the Cake keeps changing between Cake-a and Cake-b costumes. The following are the relevant tables that can be associated with this game.
(a) Game Name Table

Table 9.2: Game name table for the Cat_Mouse table.
(b) Sprites Table
The table below provides a list of the sprites in a project with details about the name, costumes, sounds and movements.
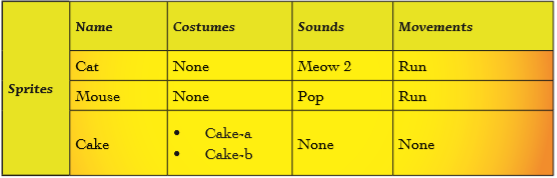
Table 9.3: List of sprites in the Cat_Mouse_Cake game
(c) Sprite Interaction Table The table below lists all the relevant interactions between various sprites in the project.
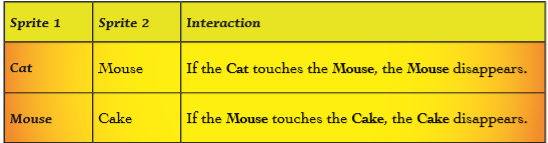
Table 9.4: Interaction of sprites in the Cat_Mouse_Cake game
(d) Backgrounds Table The table below lists the relevant backgrounds in the project.
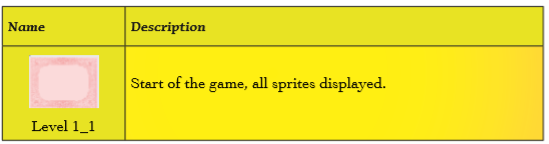
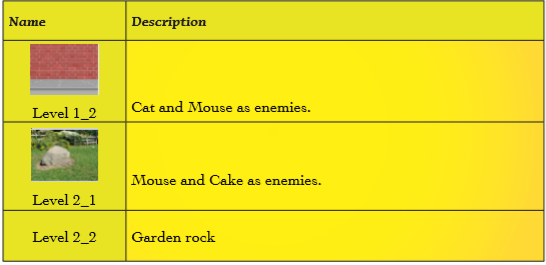
Table 9.5: Backgrounds table
(e) Levels Table
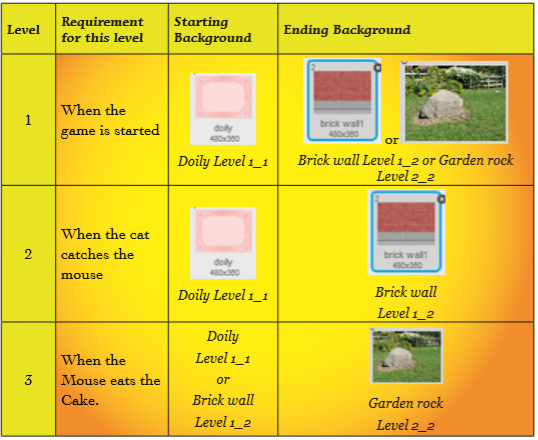
Table 9.5: Levels table
Costumes
Sprites can have different costumes. Once a sprite has been inserted in a game, its appearance can change to any of the available costumes. The game designer can also draw a costume for a sprite.
However, some sprites do not have costumes. In the Cat_Mouse_Cake game, the cake has two costumes, namely cake-a and cake-b. The mouse and cat do not have costumes. To switch between costumes, do the following:
(i) Select the sprite if already inserted, otherwise insert the sprite.
(ii) Click on the costume tab.
(iii) Select the desired costume from the available thumbnails displayed. Figure 9.1 shows the available Cake costumes in this game.
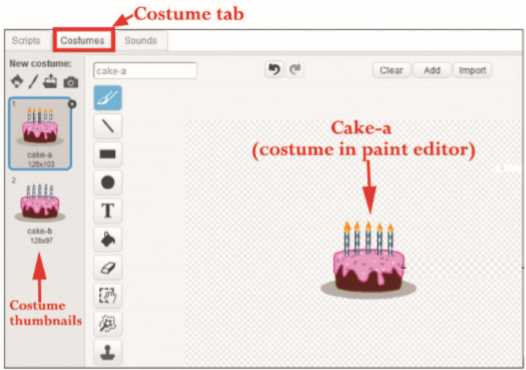
Figure 9.1: Cake costumes
Sounds
A sprite existing in a game can be assigned a sound. By default, some sprites do not have sounds assigned to them. The designer can choose sound from the sounds library, record new sound or
upload a sound from file. In the Cat_Mouse_Cake game described above, the Cat has the Meow sound.To assign a sound to a sprite, do the following:
(i) Select the Sprite.
(ii) Click on the Sounds tab.
(iii) Select the sound from the thumbnail displayed. If no sound is displayed in the thumbnail area, click on the Speaker icon to choose sound from library, click the Record button icon to record new sound or click on Folder/ Import button to select the sound file from the computer.
Figure 9.2 shows the available Cat sound.
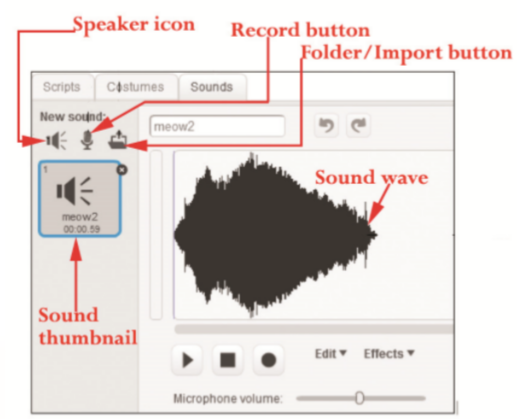
Figure 9.2: Sounds tab displaying selected sound
Movement
Sprite movement is also referred to as sprite action. The Motion block palette contains the commands for assigning controlling movement to a sprite. There are seventeen Motion blocks categorized into two namely Motion Stack blocks and Motion Reporter blocks with fourteen and three blocks respectively.
Figure 9.3 shows the Motion Stack blocks.

Figure 9.3: Motion Stack blocks
• Move () steps: Moves the sprite in the direction it is facing the amount of steps specified.
• Turn () degrees: Turns the sprite either clockwise or anti-clockwise by the specified amount of degrees.
• Point in direction (): Points the sprite in the direction specified.
• Point towards (): Points the sprite towards the mouse-pointer or the selected sprite.
• Go to x: () y: (): Moves the sprite to the specified x and y positions.
• Go to (): Moves the sprite to the mouse-pointer or the selected sprite.
• Glide () secs to x: () y: (): Moves a sprite smoothly to an x y position on the stage by the amount of time specified.
• Change x by (): Changes the x position of the sprite by the amount specified.
• Set x to (): Sets the x position of the sprite by the amount specified.
• Change y by (): Changes the y position of the sprite by the amount specified.
• Set y to (): Sets the y position of the sprite by the amount specified.
• If on edge, bounce: This means that if the sprite is touching the edge of the screen, its direction turns over quickly or reverses.
• Set rotation style (): Determines the manner in which the sprite rotates. The following are Motion Reporter blocks:
• X position: Displays the X position of the sprite.
• Y position: Displays the Y position of the sprite.
• Direction: Displays the direction of the sprite.
The following are Motion Reporter blocks:
• X position: Displays the X position of the sprite.
• Y position: Displays the Y position of the sprite.
• Direction: Displays the direction of the sprite.
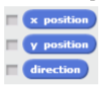
Figure 9.4: Motion Reporter blocks
Check-marking the Reporter block option displays a counter at the stage area.
9.1.3 How Sprites Interact in this Game
In a game different sprites interact with each other for the success of the game. In the interaction class, there are different commands which are used when creating a game. In the example of Cat_Mouse_Cake game, the sprites name Cat, Mouse, and Cake relate with one another as shown earlier in Table 9.4.
9.1.4 List of Backgrounds
The term background refers to those things that can be seen behind the main things. There are various backgrounds in Scratch and can be accessed through the backdrop pane. The user can choose a backdrop from library, paint a new backdrop, upload a backdrop from file or get a new backdrop from camera. To apply a background in a game, do the following:
(i) Click on the icons under New backdrop and select the desired option.
(ii) To choose backdrop from library, click the Choose backdrop from library
icon. This displays the Backdrop Library.
(iii) Scroll to view all backdrops available in Scratch or click on each folder under the Backdrop Library pane to view the backgrounds underneath.
(iv) Select the desired background.
(v) Click OK to apply.
The following are some of the available backgrounds in Scratch 2.0.
Table 9.7: Examples of backgrounds in Scratch 2.0 From
From example 9.1, the following scripts apply to the sprites: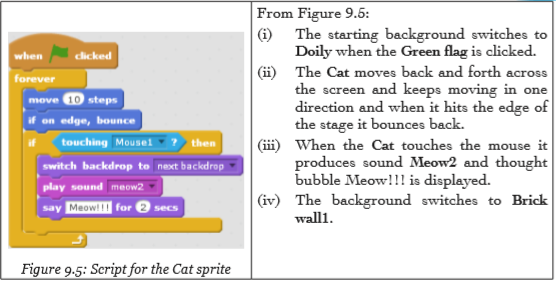
From Figure 9.6 below, the mouse chases the mouse-pointer in steps and when it touches the Cat sprite, it disappears; that is, it is eaten. The Mouse reappears after four seconds.From Figure 9.7 below, the Cake disappears when it is touched by the Mouse; that is, it is eaten and reappears after two seconds. The background switches to Garden rock when the Cake is eaten and the Cake keeps changing between Cake-a and Cake-b costumes.
Figure 9.6: Script for the Mouse sprite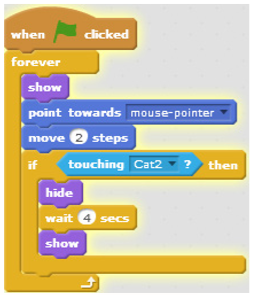

Figure 9.7: Script for the Cake sprite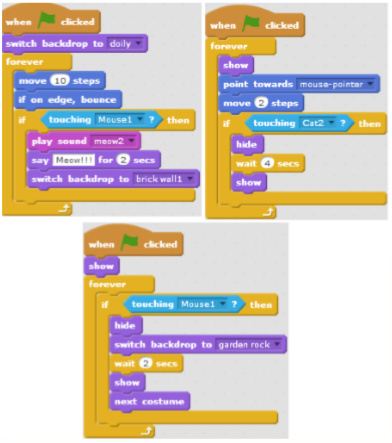
Figure 9.8: Final Scripts for the Cat_Cake-Mouse game
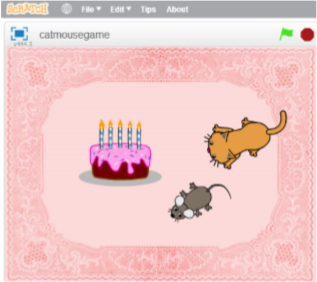
Figure 9.8: Cat_Mouse_Cake game
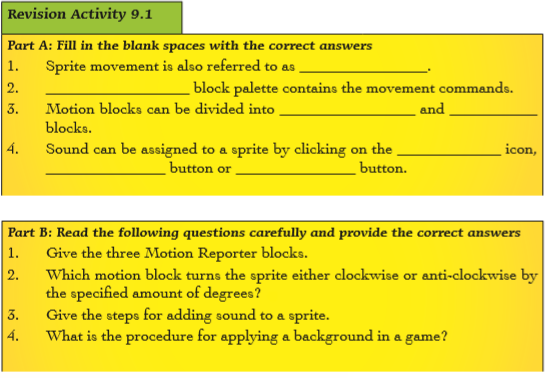
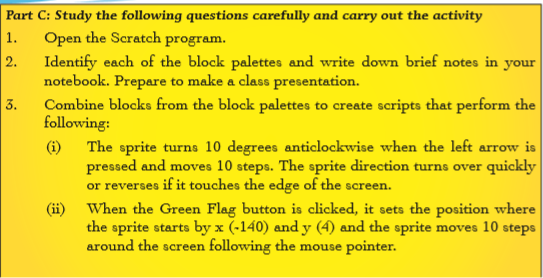
9.2 Commands to Set Game Rules
The following are some of the commands used in setting game rules: Switch to costume, forever, if, touching colour, broadcast, when I receive, go to, change by, show, repeat, hide, wait, stop all, point in direction, round pick random, if on edge bounce, turn and if else among others.
To use these commands, do the following:
(i) Click on the Scripts tab.
(ii) Select the desired block palette.
(iii) Click and drag the desired block to the script area.
The above commands have been categorised under the various block palettes they are found as discussed below;
9.2.1 Looks Block palette
Switch costumes to: Changes to a specified sprite or stage costume.

Figure 9.9: The Switch costumes to block
Show: Displays the sprite.

Figure 9.10: Show block
Hide: Hides the sprite.

Figure 9.11: Hide block
Other commands under the Looks block palette include the following:
• Say
for
• Say
• Think
• Think
• Next costume: Changes the sprite's or stage's costume to the next one in the costume list.
• Switch backdrop to
• Change
• Set
• Clear graphic effects: Removes all graphic effects on the sprite.
• Change size by
• Set size to
• Go to front: Puts a sprite in the front.
• Go back
9.2.2 Control Block Palette
Forever – Runs the blocks inside over and over.

Figure 9.12: Forever block
If – Activates the blocks inside it if the condition is true.
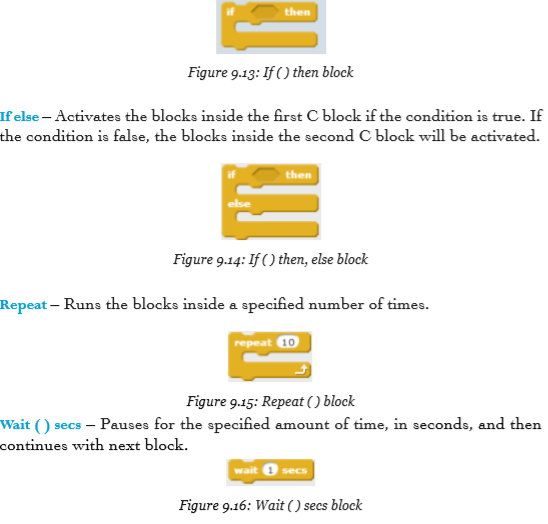

Other commands under the Control block palette are:
• Create clone of
• Repeat until
• Delete this clone: Erases a specified clone.
• When I start as a clone: It is activated whenever a clone is created and will only be run by that clone
9.2.3 Sensing Block Palette
Touching colour – Reports true if sprite is touching specified colour.

Figure 9.19: Touching colour
Other commands under the Sensing block palette are:
• Ask
• Reset timer: Sets the timer to zero.
• Turn video
• Set video transparency to
• Set video transparency to
• Answer
• Mouse x
• Mouse y
• Loudness
• Timer
• Video
• Video
• Current
• Days since 2000; and
• Username
9.2.4 Events Block Palette
Broadcast – Sends a message to all sprites and activates When I receive

Figure 9.20: Broadcast
When I receive – The script activates when the specified broadcast message is received.
Figure 9.21: When I receive
9.2.5 Motion Block Palette
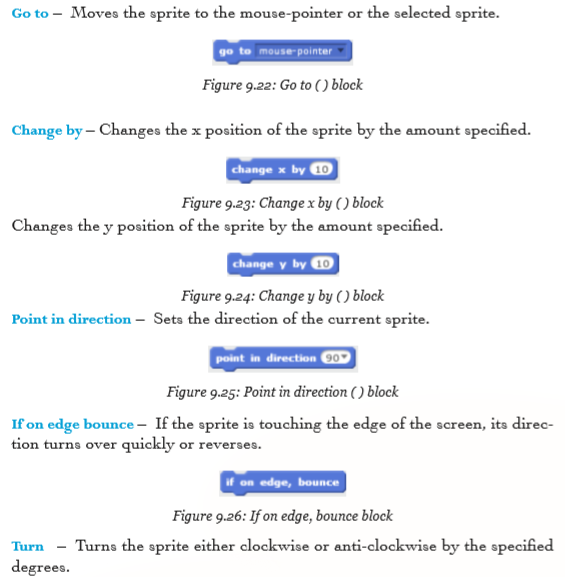
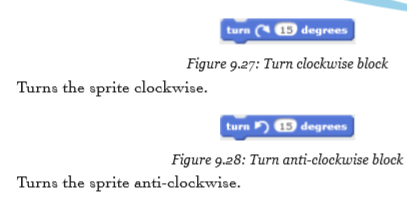
9.2.6 Operators Block Palette


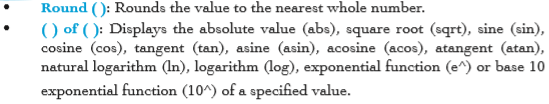
Example 9.2: Creating a game
Collect detailed data in the table The following are the two relevant tables that can be associated with this game.
Game Name Table

Tables 9.8: Game Name table for the Car Racing game
Sprites Table
There is only one sprite for this game, that is, the Car.
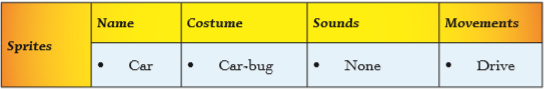
Tables 9.9(a): Car sprite table
Background Table
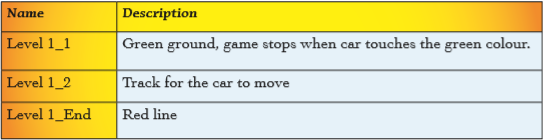
Tables 9.9(b): Background table
Score Management Table
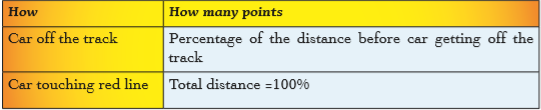
Table 9.9(c): Scores table
Sprite Interaction Table
The sprite interacts with the backgrounds; that is, the Track (black colour) and the Grass (green colour). This is shown in the table below.

Table 9.10: Sprite Interaction table
Game rules
(i) The car goes back to the beginning of the track after 2 seconds if it touches the grass and a message “You are off track” is displayed.
(ii) If the car gets to the end of the track by touching the Red line, a message “Congratulations” is displayed for 2 seconds followed by a timer showing how long it took for the car to get to the finish line.
To create the game:
(i) Delete the Cat sprite.
(ii) Create background. Go to the Stage backdrop pane and click Fill with colour. Click the Scripts area to apply the preferred background colour. The background colour for this game is green to signify green grass.
(iii) Paint a road running across the screen and draw a coloured line at one end to mark the finish line. To paint a road and line, use the Brush and Line icons respectively. The road is black and the finish line is red.
(iv) Add a new sprite. The sprite for this game is a Car. Go to Choose sprite from library and click Transportation. Select Car-Bug.
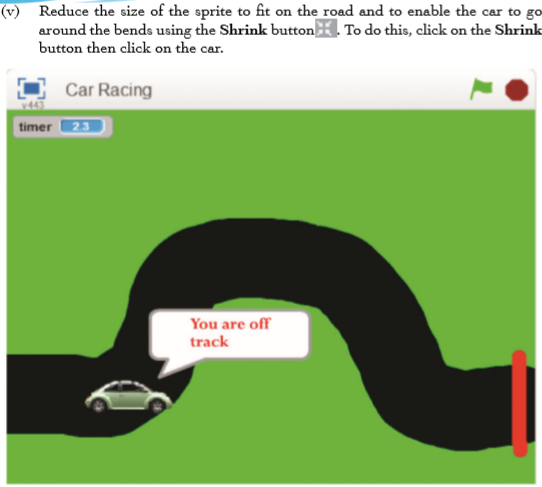
Set game rules
(i) Program the arrow keys to move the car using the following scripts:
(ii) Rule: If the car touches the grass
The Car continually moves 1 step when the Green flag is clicked. If the Car touches green colour (grass), a message “You are off track” will be displayed for two seconds and it goes back to the starting point. The game is won if the Car gets to the finish line as explained in figure 9.32.
Note: To get the correct colour, click in the colour box of the
 block. The arrow turns into an eyedropper. Move the eyedropper over the area of the stage containing the desired colour and click to reflect the new colour.
Figure 9.32: Scripts to move the Sprite

Figure 9.33: Script to control the Sprite if it touches grass
Note: To get the correct colour hold the dropper over the area of the stage containing the desired colour.
(iii) Rule: If the car gets to the end of the road.
A message “Congratulations” is displayed for 2 seconds each time the car touches the Red line, followed by a timer that takes 10 seconds showing how long it took for the car to get to the finish the line.
(iv) Combine the if conditions

Final Script for the Car racing game
The above scripts can be combined using the if
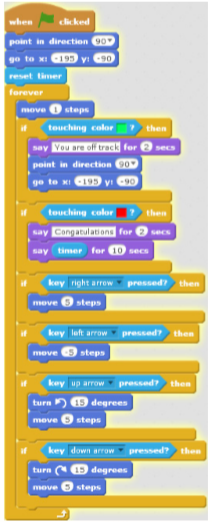
Figure 9.36: Final Script for the Car racing game
Example 9.3: Creating a simple game after observing the Mario game
In this game, the Mario sprite has been replaced with Anna sprite from the Sprite Library

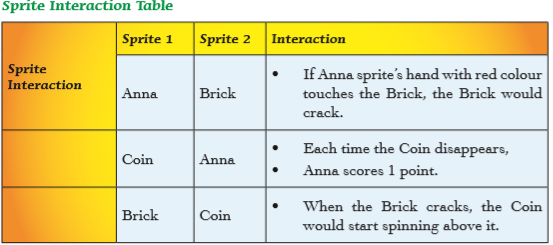

Rule: How Anna can Score
• If Anna sprite’s hand with red colour touches the Brick,the Brick would crack.
• When the Brick cracks, the Coin would start spinning above it.
• Anna will get one point each time she collects the Coin.
To create the game:
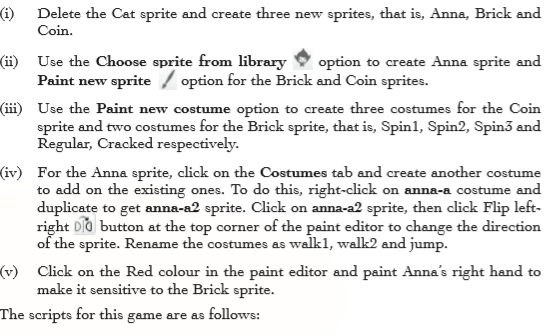
(i) Scripts for the Anna Sprite
• The first script takes Anna to the starting location when the game starts.
• The two that follow enable Anna to switch between costumes while moving both left and right when the left and right arrows are pressed.
• When space key is pressed Anna sprite switches to jump costume and changes its Y position by 50 and -50 after a wait of 0.5 seconds.
• The score increases by 1 when Anna sprite receives the coin_collected message.

Figure 9.37: Scripts for the Anna Game
(ii) Scripts for the Brick Sprite
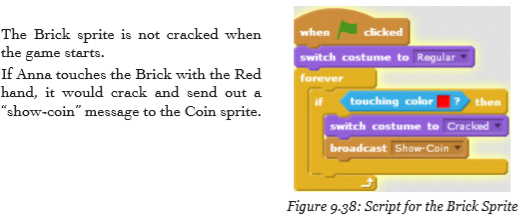
Note:
• A colour, for example, Red used in this game is known as a sensitive colour and the Brick is known as a colour-sensitive sprite of the Red colour.
• A sensitive colour of a colour-sensitive sprite is a colour to which the sprite is sensitive and responds when touched.
• A good sensitive colour for a colour-sensitive sprite is a colour that has not been used by any sprite in the project.
• Any colour can be used as a sensitive colour.
(iii) Scripts for the Coin Sprite
• The first script creates a spinning effect such that the Coin would forever turn switching between costumes at intervals of 0.2 seconds when the Green Flag button is clicked.
• The second script displays avari able named Coins_left set to 1. The Coin is hidden when the game starts.
• The third script checks if Coins_left is greater than 0 when it receives a show coin message from the Brick sprite.
• If the answer is Yes, then the coin will be displayed spinning five times and then be hidden.
• A “coin_collected” message will be sent out, reduce coins_left by 1 and finally stop
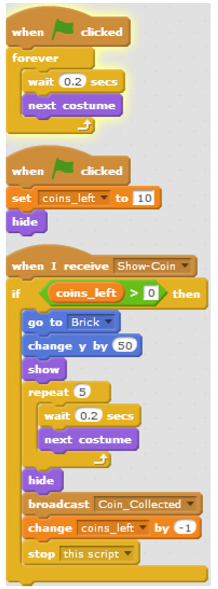
Fig. 9.39: Scripts for the Coin Sprite

Figure 9.40: Stage area showing Anna Game
Figure 9.40 shows a Brick that has cracked after being touched by Anna’s hand that contains Red colour. The Coin spins above the brick by switching between costumes and disappears when touched by Anna, thus increasing the score by 1 and reducing coins_left by 1
Example 9.4: Creating a ping pong game
The following is an example of a Ping-Pong Game. In this game, there are two sprites that interact to control the game.

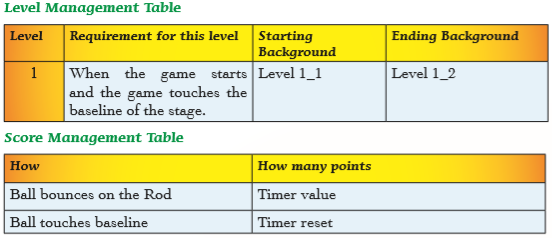
Note that in this game, a timer has been used instead of a variable to display the score and continuously counts until the game is restarted by pressing the Green Flag button.
Game rules
(i) The paddle controls the ball from touching the base line of the stage.
(ii) The game stops if the ball touches the base line of the stage.
To create the game
(i) Delete the Cat sprite.
(ii) Go to the Stage backdrop pane. Click on Backdrops. Add the preferred base line using the paint brush or line. For this game, a thick red line has been used.
(iii) Add a new Sprite called Rod. For this game, a black line has been used.
(iv) Add another Sprite called Ball. Either draw the ball or select it from the Sprite Library.
Set game rules

(iii) Rule: If the ball does not touch the base line of the stage, the game continues.
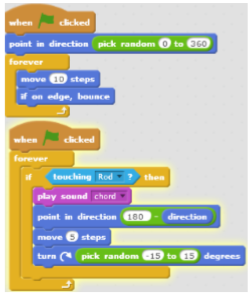
Figure 9.43: Scripts to control the Game
Final Scripts for the Ping Pong game
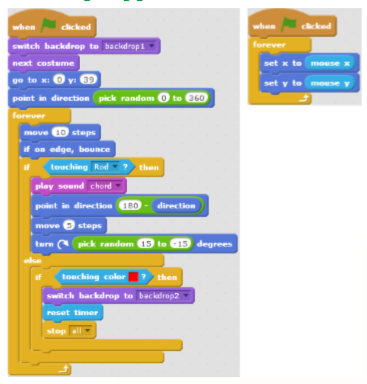
Figure 9.44: Scripts for the Ping Pong game
The first script controls the movement of the Ball and the other script controls the Rod.
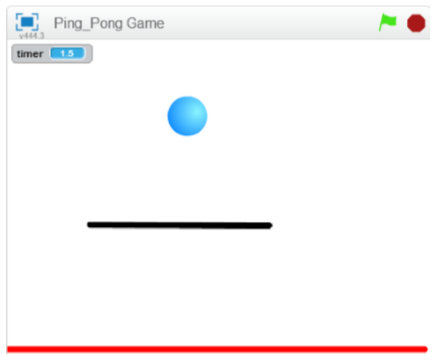
Figure 9.45: Stage area showing the Ping-Pong Game

Figure 9.46: Starting background for the Ping pong game
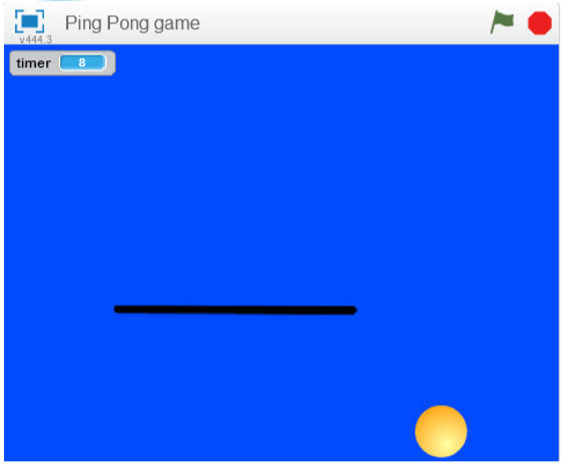
Figure 9.47: Ending background for the Ping pong game
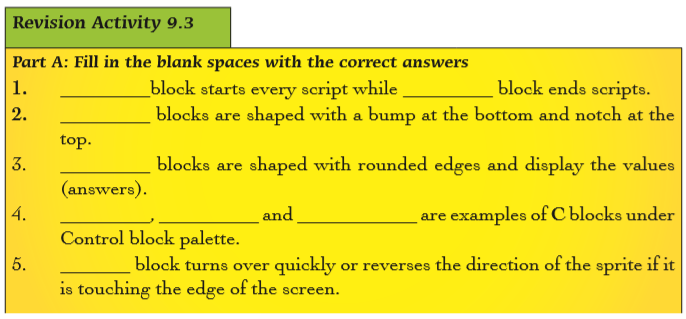
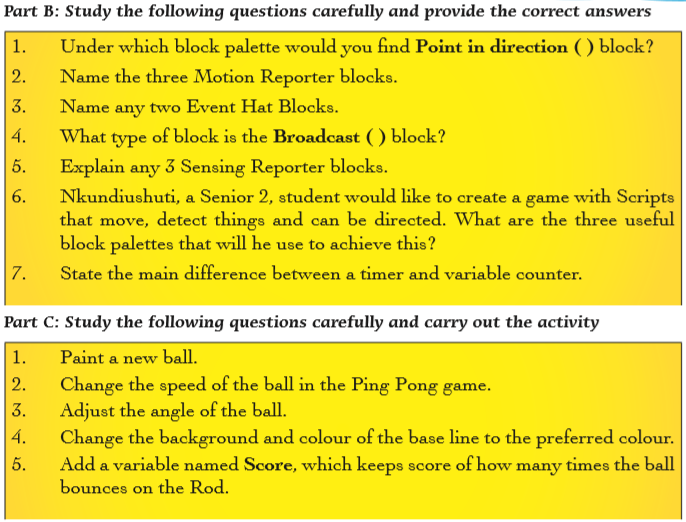
9.4 Projects in Game Programming
Project 1: Helicopter Game
Create a game which can be used to pilot a helicopter in a cave with the following requirements:
1. Paint a cave.
2. Add a script to control the rising of the helicopter and simulate gravity.
3. Provide feedback to tell the user that the Game is over or Game is won. The game is won when the x position of the helicopter is greater than 205 and is over when it touches the edges of the cave.
4. Switch between costumes when the Game is over or when it is won.
5. Add sound using Audacity to signal the helicopter passing and crashing.
Project 2: Moving Eyes Game
Create a game with a set of moving eyes that follow the mouse. Required:
1. Paint a person’s face.
2. Create 2 sprites for the eyes and add scripts to move the eyes.
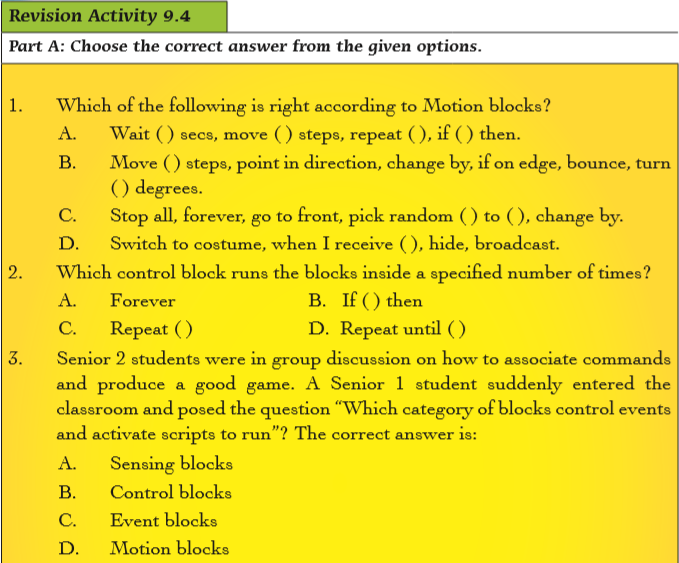
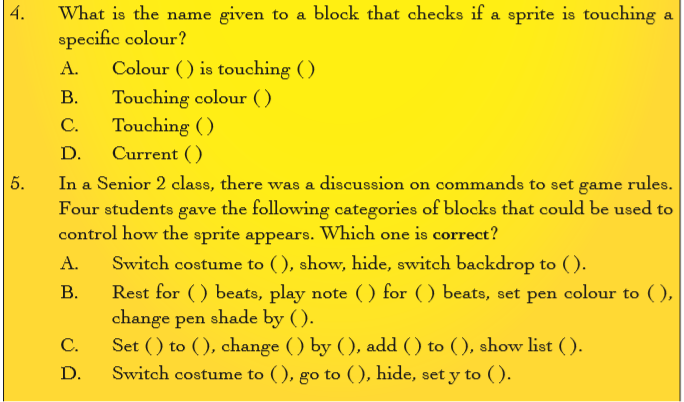
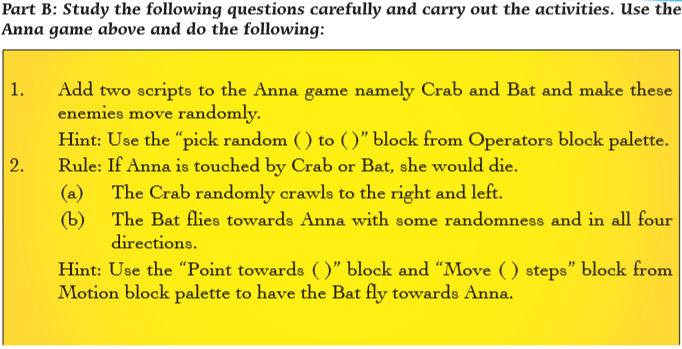
9.5 Definition of Key Words in this Unit