UNIT 4: BUSINESS RESEARCH

Key Unit Competency: To be able to identify a business problem and carry out an investigation to solve it.
Introduction
In the present fast track business environment is marked by competition; many organizations rely on business research to gain a competitive advantage and greater market share. A good research study helps organizations to understand processes, products, customers, markets and competition, to develop policies, strategies and tactics that are most likely to succeed.
For example, if you are planning to start a video library in the neighborhood, you need to ask yourself many questions including the following:
•How many households possess television set?
•How many households access this center?
•What kind of movies do people generally enjoy watching?
•How much does an average household spend on movies?
•What is the current source of movies for these household?
Generally, such questions are in the mind of every business man. However, appropriate answers to such questions will be obtained through market research because the right information is important for the success of every business activity. The need of information makes research an important component of every business activity.
This unit is therefore designed to guide you answer the above questions and will help to equip you with appropriate research knowledge of identifying a business problem and carry out an investigation to solve it. Through this unit, you will gain competency that will help you demonstrate ability to interpret and use research findings in business decision making. Under this unit, you will also learn how to develop a critical thinking approach to problem solving in business.
Introductory activity:
Kamaliza’s Case Study
Read Kamaliza’s Case Study and answer the questions below.
Kamaliza is a senior five students at UBWOROHERANE secondary school. Having enough competencies in some senior four units among others, initiation to entrepreneurship, career opportunities and market research, she decided to start a small orange juice processing factory and her main market was the restaurants located in UBUMWE village. Two years later, she found that the level of sales was extremely declining and started wondering why? Thereafter, she decided to gather all relevant information regarding the likely causes of such a decline.
Questions
Referring to the above text, answer the following questions:
a. Why do you think it is very important for Kamaliza to gather information related to her sales decline?
b. What is the meaning of business research?
c. Why do you think it is important to carry out research in business?
d. Explain the different sources of data that Kamaliza can use to obtain the relevant information.
4.1. Meaning of research, business research and the importance of research in business
Activity 4.1
Analyse the photos below and answer the questions that follow; 1. What do you think is this person busy doing?2. From the photo above, what do you understand by terms research and business research?3. Why is business research important for any business?
4.1.1 Meaning of research and business research
Research is a systematic process of collecting, logically analyzing and interpreting data for some purpose. John W. Creswell, states that “research is a process of steps used to collect and analyze information to increase our understanding of a topic or issue”. It consists of three steps: pose a question, collect data to answer the question, and present an answer to the question.Business research is the process of collecting and analyzing information for the purpose of initiating, modifying or terminating a particular business activity. Business research can be brought in the context of research as doing a feasibility study about a business before it is actually started.Aims or objectives of conducting a business research include:i. To find out the nature and type of products that is preferred by customers/clients at a given time.ii. To find out quality of the products that consumers desire to buy.iii. To determine the quantity or volume of the products to be put on the market i.e. finding out how much is to be bought presently and in future.iv. To find out consumer’s reactions on the ruling prices in the market regarding the entrepreneur’s products.v. To increase turnover (sales). This results into subsequent increase in the profit margin of the entrepreneur.4.1.2. The role or importance of research in business
Usually people do business research in order to get the best business choice which can help in maximizing profits. Many people go into business ventures when they have not carried out the appropriate study leading to different businesses ending up closing sooner than they had expected.To understand the importance of research in business, consider a case where business customers are reducing. Someone may come up with a theory that people are generally poor and so their purchasing power has reduced. In this scenario, there is a need to conduct a systematic investigation to discover what the truth is, that is, you need to carry out research in order to establish, discover, and interpret behaviors and theories to come up with a definite answer.The roles of research in business include but are not limited to the following:1. Research, being a fact-finding process, significantly influences business decisions. The business management must choose the course of action which is most effective in attaining organization goals. Research not only provides facts and figures to support business decisions but also enables the business to choose the best one.2. Research plays a significant role in the identification of a new project, project feasibility and project implementation.3. Research helps the business management to discharge its managerial functions of planning, forecasting, coordinating, motivating, controlling and evaluating effectively.4. Research facilitates the process of thinking, analyzing, evaluating and interpretation of the business environment and of various business situations and business alternatives so as to be helpful in the formulation of business policy and strategy like where to buy, when to buy, how much to buy, and at what price to buy etc.5. Testing of new products. Business research helps in testing the possible success of fresh products. Businesses need to know what kind of services and products consumers want before they produce them. Research can help design a new product or service, figuring out what is needed and ensure that the development of a product is highly targeted towards demand.Application Activity 4.1
Think about at least 2 people doing business in your home locality. Do they carry out research in their businesses?1. If not, explain the challenges they are likely to encounter in their businesses.2. Describe the challenges or obstacles to effective business research?4.2. Types of business research
Activity 4.2
Read the following case study about Mugabe and answer the questions below;Mugabe is a businessman in Kazi village. After recognizing increase in price of one of his preferred commodities “ibirayi bya Kinigi”;he decided to carry out a research to help him answer some questions like:•What are the causes of price increase for “Ibirayi bya Kinigi”?•How do you think will that research impact his business?While conducting a research, data was collected from MINICOM’s report showing the figures, observations, opinions and descriptions on the reasons for the increase in prices of “Ibirayi bya Kinigi”. Also, MUGABE collected some other data from different respondents (cultivators in Kinigi, Musanze District) using interviews and questionnaires.a. Describe the different types of research used by MUGABE.b. What was the purpose of using the different types of research you identified in the above question?The types of business research include the following:
1. Quantitative research: This is the gathering and analysis of data that can be expressed in numerical form. E.g. Collecting data about prices, amount of money people earn, etc.Quantitative research: is a formal, objective, systematic process in which numerical data are used to obtain information about the situation. This research method is used: to describe variables; to examine relationships among variables; to determine cause-and-effect interactions between variables. . Qualitative research: This deals with the collection and analysis of non-numerical data.). Qualitative data describes items in terms of some quality or categorization that may be ‘informal’ or may use relatively ill-defined characteristics such as warmth and favour.For example, to find people’s opinions on a new product launched cannot be measured numerically, because they are just opinions based on an individual’s perception and beliefs.Qualitative research can also be referred to as a type of social science research that collects and works with non-numerical data and that seeks to interpret meaning from these data that help us understand social life through the study of targeted populations or places. Qualitative data can include well-defined aspects such as gender, nationality or commodity type, qualities of a good leader, etc.
 3. Primary research (field research): This is the collection and use of original data from the field. The researcher gathers information directly from the target groups. It involves the collection and use of data that does not already exist. It is the collection and use of original data.
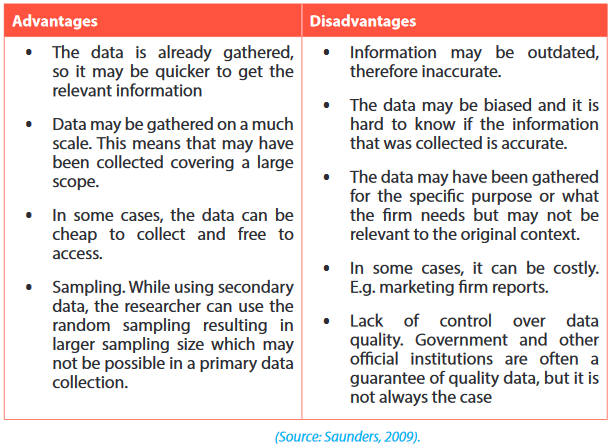
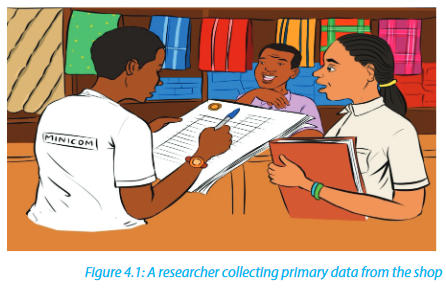
Some advantages and disadvantages of primary research
 4. Secondary research (desk research): This is the analysis and use of existing data and information. The information is available to the researcher from textbooks, magazines, newspapers, directories, trade publications, internal and external reports, government and its ministries, etc.For example, if you want to start a school in Ntarabana Sector in Rulindo District and you need the data about population, you can get statistics from the National Institution of Statistics of Rwanda (NISR) about population density, number of school going children in Ntarabana Sector, number of boys and girls, number of existing schools, sources of income and other data. You can use this data to analyse and make your own conclusion but using existing data.
Some Advantages and disadvantages of secondary research
Application Activity 4.2
i. Examine the advantages of primary research over the secondary researchii. Imagine, you have a business you want to start, treating your class as a market; referring to the most pressing needs of your classmates, conduct a research to determine which product could be more feasible and profitable for you. Also be specific about which type of research you will have used.4.3. Key steps in research
Activity 4.3
Read the following case study clearly and answer the questions that follow;When Mr. MUHIRE completed his secondary school studies, he started a business dealing in trading of beans in Gasabo District. Six months later, he decided to carry out a research aiming at discovering which types of beans are preferred in the District as many of his loyal customers claimed on the type of beans delivered to them during the previous month. He took time to clearly decide on the objectives of the research and ways of collecting helpful information. He also scheduled how activities will be following each other. After getting the research funding, he started gathering information, intensively studying his data and came up with useful information from the data collected.Required:
1. Suggest and describe the steps that MUHIRE should follow throughout his research process.2. Go out in a nearby market or trading center and collect information about a specific product of your choice offered by different companies and find out what the users say about them.Steps that are involved in carrying out a business research
1. Finding the topic of the research study. This is the title of all the research work that has to be done in the field. E.g. an evaluation of the influence of income levels of consumers to the growth of a business.2. Defining the research problem. This enables the entrepreneur to find out how to deal with prevailing situation which consequently enables him to achieve his/her target.3. Setting of objectives. Specifically show what the research wants to achieve at the end of the study. They should always be brief and SMART (systematic/specific, measurable, achievable, realistic, time bound).4. Selection of the basic data collection methods. (Observation, interview, questionnaire, field experiments, focus group etc.)5. Determine the scope. The researcher determines the limitations of his/her study. That is to say, areas to be covered and what to be included or excluded. (sample/population).6. Designing a clear schedule for conducting the research or coming up with a clear plan of the whole research process. Consider the example below;An example of a research schedule of activities on a topic of study “Customer perception towards a new brand of product from a given company”Customer perception towards a new brand of product 7. Collecting data: The researcher collects data on a number of things such as price, product, promotion, target market etc. This is normally done in the real field study.8. Analyzing data: This is done during and after the real field study. It enables the researcher to know how the market will be especially in terms of demand.9. Presenting data: After data analysis, the researcher presents his findings to the relevant authorities for action. The researcher should ensure that he presents empirical data and not estimates or hypothetical figures to those who are supposed to take the action.
Application Activity 4.3
Read the story below and answer the questions that follow.AKEZA is a diary firm that heavily relies on production of yoghurt for their profits. They have been in this business for 5 years now. However, other firms have joined the industry and yoghurt is no longer profitable for AKEZA diary. The firm is contemplating about the introduction of new products; ghee and powder milk because no other firm is currently producing them for the market. The research and development department has been tasked to carry out a study on how the new products will help the firm to regain its profits.Questions
1. Suppose you are the researcher for AKEZA diary, what essential things would you consider before you carry out research to find out whether the 2 new products will help the firm to regain profits?2. What challenges are you likely to face when carrying out the research and how would you overcome them?4.4. Data collection
Activity 4.4
a. What do you understand by data collection?b. MAHORO, a trader in Rugwiro trading center carried out research for the problem of her “decrease of business’s monthly turnover” during eight consecutive months. While collecting data to find out the likely cause, MAHORO read the report of National Bank and discovered that one of the causes was the measures applied by the National Bank to reduce money in circulation.In the process of collecting data she used interviews and questionnaires as research tools.i. Describe the main sources of data used by MAHORO while conducting her researchii. Formulate five questions MAHORO would administer to collect the required dataiii. Explain the types of data used by MAHORO in her research.iv. Differentiate between primary and secondary data and explain how they help in business research.4.4.1. Sources of Primary and Secondary data
Data refers to all information a researcher gathers for his or her study. The word data comes from a Latin word“datum” which means a single piece of information. “In research, data is defined as recorded factual material commonly retained by and accepted in the scientific community as necessary to validate research findings; although the majority of such data is created in digital format, all research data is included irrespective of the format in which it is created.” The sources of data may be classified into: Primary data and Secondary data sources.Primary sources of data
Primary sources are original sources from which the researcher directly collects data that have not been previously collected. The major sources of primary data include respondents, analogous case situations and research experiments.Respondents: As noted earlier, one of the sources of primary data is respondents; this is the very important source of first-hand information while conducting any research. In business research, the type of information that may be collected from respondents may include data on past behavior, intentions of likely behavior, extent of knowledge, attitudes and opinion and socio-economic characteristics and lifestyle data.Primary data from Analogous situations - Case Study: Evolved from the behavioral sciences, case study or case history is in extensive use in marketing research today. Using analogous situations to or relevant to the problem situation, an in- depth investigation is carried out to thoroughly study the case situation.Experimentation: Experimentation also represents a fairly rich source of primary data and is used mostly to study cause-effect relationships among research variables. For example, an experiment may be done to find out how sales will be affected when the colour of the product is changed by making sample products with the new colour, putting them on the market and observing customer reactions.Secondary sources of data
These are sources containing data that have been collected and compiled for another purpose. It means that the data here is already in existence. Secondary data may be internal or external. Internal sources are within the organization while external sources are sources of secondary data that originate from outside the organization.These include the following:•The government and its ministries: For example, the ministry of education has data on schools, enrolment, distribution of tertiary institutions etc.•Trade publications especially industry magazines.•Bureau of statistics: (Data centers). The bureau of statistics has the important information used for research. In Rwanda the bureau of statistics the “National Institute of Statistics of Rwanda”.•Competitors: Company reports and websites are easily accessible and contain a limited amount of information.•The general media (newspapers, radio and television).•Company records and files.•Textbooks and other published sources.•Publications.•Other researchers’ information.•Internal and external reports.•Associations, Databases and Directories.4.4.2. Methods of data collection
Data collection techniques are means by which a researcher obtains data. There are various methods of data collection to choose from. In some instance, it is useful to use more than one method to collect the required data. Using more than one method to test a hypothesis is called triangulation or mixed method.Methods of collecting primary data
The researcher directly collects primary data from their original sources. In this case, the researcher can collect the required data precisely according to his research needs, he/she can collect it when he/she wants it and in the form he/she needs it. But the collection of primary data is costly and time consuming.•Interviews: Interview as a source of research data refers to systematic talking and listening to people. The person asking questions is the interviewer while the person answering is called the interviewee or respondent. Interviews may be face to face or over a telephone.•Face to face interview: These are interviews where the interviewer and the interviewee face each other and talk directly to each other. The interviews have the advantages of allowing the researcher to establish some rapport with the respondents and in the process gain their confidence and trust. •Telephone interviews: Telephone interviews are conducted over a telephone line. The researcher and respondent do not meet face to face but questions are asked and answered over the telephone.
 •Computer Assisted Personal Interview (CAPI) is relatively new but modern method. Instead of respondents answering questions on paper, the researcher enters the information into the computer as respondents answer.
Types of interviews
There are different types of interviews and these include the following:•Structured (standardized) interview: With structured interviews, respondents are asked the same questions. The questions are the same and administered in the same order for all the respondents. If possible, they should even be read by the same person in the same tone.•Semi-structured interviews: These are non-standardized interviews. The researcher has a list of issues, topics and themes around which questions are asked. The nature and order of questions may be changed depending on the trend of the interview. Where possible, additional questions may be asked and the interviewer is free to rephrase and explain the questions.•Unstructured interview: This form is non-directed and casual. There is no interview guide. Each interview is different and each respondent may be asked their own questions.•Non-directive interviews: The interviewee leads the process and freely discusses a topic. There are no pre-planned questions.Advantages of using the interview method
The advantages of using the interview method include:•Allow for more in-depth data collection and comprehensive understanding•Body language and facial expressions are more clearly identified and understood•The interviewer can probe for explanations of responses•Stimulus material and visual aids can be used to support the interview•Interview length can be considerably longer since the participant has a greater commitment to participateDisadvantages of using the interview method include;
•Interviews are more time consuming to conduct•As a result of timing and travel, face to face interviews can be expensive•Interviews can deliver biased responses etc.•Observation
Observation may be defined as a systematic viewing of a specific phenomenon in its proper setting for the specific purpose of gathering data for a particular study. Observation as a method includes both “seeing” and “hearing.” It is accompanied by perceiving as well. Using observation of customers, the researcher can observe peak days, time, age and sex of buyers, etc.For example, if you want to find out which age group buys most from Musanze market, observation method would be simple and straight forward to find out. The researcher positions him/herself in a strategic position near the market main entrance gate, counts and records the most age group of all the buyers entering the market. At the end of the research period, this data can be analysed to get the information required, that is which age group (male or female) shops most from Musanze market.Advantages of using observation method
•Very direct method for collecting data or information and best for the study of human behavior.• Data collected is very accurate in nature and also very reliable.• Improves precision of the research results.• Helps in understanding the verbal response more efficiently.•Observation is less demanding in nature, which makes it less bias in working abilities.•By observation, one can identify a problem by making an in depth analysis of the problems.Disadvantages of using observation method include
•Problems of the past cannot be studied by means of observation.•Having no other option, one has to depend on the documents available.•As observations require some special instruments or tools for effective results, this can be very much costly.•One cannot study opinions by this means.•Attitudes cannot be studied with the help of observations etc.Field experiments
Field experiment relates to finding out what happens as a result of an action. For example, an experiment may be done to find out how sales are affected when the size of a given product is changed by simply making sample products with the new size, putting them on the market and observing customer reactions.Advantages of field experiments
•Field experiments are conducted in everyday natural environment of participants, promoting high ecological validity. The experimenter still controls the IV (independent variable)•There is a much lesser risk of demand characteristics as participants may not be aware that they are being studied.•This method of research includes a real life situation and so the results are more realistic.•Decisions are made with lots of confidence which makes them accurate.Disadvantages of field experiments
•It is expensive and takes a long time because the product must be produced and sold.•The sample market may differ substantially from the general market and so the result obtained in the experimental market may not apply in the other markets. For example, a sample cake produced and experimented within a local restaurant may not work out exactly the same way as in open markets.•External factors like weather, government policy, location and social trends may affect the results of the experiment.•If experiment is not controlled, it may lead to inaccurate results. For example, if you change the colour of a product during political campaigns, people may buy the product by associating it with the colour but the same behavior may not be observed during normal non-political times, etc.Focus groups
A focus group is a small, but demographically diverse group of people and whose reactions are studied especially in market research or political analysis in guided or open discussions about a new product or something else to determine the reactions that can be expected from a larger population. It is a form of qualitative research consisting of interviews in which a group of people are asked about their perceptions, opinions, beliefs, and attitudes towards a product, service, concept, advertisement, idea, or packaging.Questions are asked in an interactive group setting where participants are free to talk with other group members. During this process, the researcher either takes notes or records the vital points he or she is getting from the group. Researchers should select members of the focus group carefully for effective and authoritative responses.Advantages of using the focus group method include
•Through interaction, the researcher is most likely to learn more through non-verbal communication by observing gestures and body language.•They encourage participation of people who cannot read or write.•They enable people use different forms of communication that they use in their day to day interaction.•They encourage participation of those who may not feel comfortable with one on one interview.•Focus groups also allow the respondent to share experience and come up with more informed responses.Disadvantages of using the focus group method include
•Groups are more difficult to manage than one individual; interviewer must keep track of what is going on in the group.•Unexpected conflicts, power struggles, and other group dynamics may inhibit discussion.•Shy persons may be intimidated by more assertive persons.•One person may dominate to the exclusion of others.•Data may be more difficult to analyze.•Moderators need to be skilled in working with groups.•The environment can have an impact on the responses.Case studies
The term case study usually refers to a fairly intensive examination of a single unit such as a person, a small group of people, or a single company. Case studies involve measuring what is there and how it got there. In this sense, it is historical. It can enable the researcher to explore, unravel and understand problems, issues and relationships. It cannot, however, allow the researcher to generalize, that is, to argue that from one case study the results, findings or theory developed apply to other similar case studies. The case looked at may be unique and, therefore not representative of other instances. It is, of course, possible to look at several case studies to represent certain features of management that we are interested in studying. The case study approach is often done to make practical improvements.Case studies help researchers to analyse complex issues by studying and analyzing a limited number of events or situations.Advantages of using case study method include but not limited to:
•Case studies allow detailed information to be collected that would not normally be easily obtained by other research designs. The data collected is normally a lot richer and of greater depth than can be found through other experimental designs.•Case studies tend to be conducted on rare cases where large samples of similar participants are not available.Disadvantages of using the case studies method include:
•One of the main criticisms is that the data collected cannot necessarily be generalized to the wider population. This leads to data being collected over longitudinal case studies not always being relevant or particularly useful.•Case studies are easier and cheap to conduct.Using case studies method, the selection of the case and how wide it is may determine how applicable the collected data may be represented. A poorly selected case may lead to wrong conclusions.The Questionnaire
A questionnaire is a pre-determined set of questions used to get information from a client. These questions are presented in a written form and taken or given to the respondent. Questionnaires can be fact or opinion based. Respondents are expected to return the filled questionnaire to the researcher for analysis. The questionnaires should be well planned and carefully formulated if it is to generate the right data.Questionnaire questions
Questionnaire questions can either be open ended or closed ended questions.Open-ended questions:Open-ended questions are questions that allow someone to give a free-form answer. These questions are asked to encourage a meaningful and full answer using the respondent’s own knowledge. Examples;a. What do you think about the new product?b. How is your relationship with your loyal customers?Closed ended questions: These questions require the respondent to respond by choosing from a limited range of responses pre-determined by the researcherExamples:a. What is your gender?•Female•Maleb. How are you likely to transact with our business this month?•Very likely•Likely•UnlikelyThere are several basic principles to remember when developing such questions.•The question should match the research objectives: You must know why you want to conduct the survey in order to be able ask the right questions.•Understand the participants: It is important to remember that it is your respondents (and not you the researcher) who will be answering the questions. Compose questions that they understand and not those that you understand because it is them (the respondents) answering and not you the researcher.•Use familiar and natural language: Use the language level that is understandable by your respondents. Consider their level of education and age. Also consider your religious, social, political and cultural background in phrasing the questions.
•Sampling

Meaning of sampling
Sampling refers to the process of selecting units (e.g. people or organization) from a large population. By studying the sample, we may fairly generalize our results about the population from which the sample was chosen.Population, as used in research, refers to as a collection of all the items about which we would like to know some characteristics. Examples of population include the people in a market. The population that we are interested in is the target population.A sample is the subset or segment of a population that is used to represent the entire group as a whole. When doing research, it is often impractical to survey every member of a particular population because the sheer/total number of people is simply too large. To make inferences about characteristics of a population, researchers can use a Random sample. For example, 500 buyers in a market.Different types of sampling methods
Sampling methods are mainly divided into two; these are:a. Probability samplingb. Non probability samplinga. Probability sampling
The following sampling methods are examples of probability sampling:i. Simple random sampling. This is obtaining data by choosing elementary units in such a way that each unit in the population has an equal chance of being selected. Simple random sampling should be free from bias.ii. Stratified sampling. Using this method, the population is divided into separate groups basing on some variable/ characteristics such as income or age. These groups are referred to as strata. Select from each stratum a given number of units which may be based on to draw conclusions.iii. Cluster sampling. This is obtained by selecting clusters from the population on the basis of simple random sampling. A cluster may be something like a village, a school, a class or a hospital.b. Non-probability sampling
The following sampling methods are examples of non-probability sampling:i. Convenient sampling. Where the researcher questions whoever is available. This method is quick and cheap. However, we do not know how representative the sample is and how reliable the results are.ii. Quota sampling. Using this method, the sample elements are made up of potential purchasers of your product. For example, if you feel that your typical customers will be females between the age of 19-25, then some of the respondents you will interview should be of this age group. In this case quotas are given.iii. Judgmental sampling/ purposive sampling. This sample is obtained by basing on the idea that people who are deemed to be having more relevant information are sampled out especially if they have the relevant characteristics of the target population.iv. Snowball sampling. This is a method in which the researcher identifies one member of the target population, speaks to him/her and asks that person to identify others in the target population that the researcher might speak to. This method has an interesting application to group membership.Importance of sampling
Sampling is important in all kinds of research for the following reasons:i. Sometimes, research involves “testing”, “measuring” or some form of demonstration that may result in the destruction of the subject. For example, to see the quality of an orange, a trader splits one orange to see the inside.ii. It is cheaper to deal with a sample than dealing with the entire population. In example of buyers in a market used earlier, it is cheaper to interview a sample of 500 buyers rather than looking for every individual buyer throughout the market. Sometimes, it is not possible to access all units of the population. Some units of the population may not be obtainable at the time of the research. For example, to find the quality of bread, you cannot access all the loaves of bread and so you resort to a sample. To test the rate of air pollution, you cannot collect all the air molecules from an entire province, so you collect and test samples.Application Activity 4.4
Imagine a situation when you have finished your secondary school studies and one of your family members learns that you studied entrepreneurship and so accepts to grant you capital to start your own business. But before he gives you that money he asks you to first carry out market research for the feasible business.He then asks you to first carry out the following business research task after which you prepare report and present it to him for you to obtain the promised capital.•What products (goods or services) that people in your community would like to have but are currently not being provided?•Choose one product that you would be interested in dealing with.•Who from your community can give you information about the product you identified?•Decide the population sample (the number of people identified in no. 3 above) to ask•Formulate questions that you will use to collect the data that you require about the product that you chose in no. 2 above)•Make a plan of how you will collect the data and how you will analyze it.•Proceed to collect the information/data.•Methods of collecting secondary data
Activity 4.5
Suggest at least five sources of secondary dataSecondary data collection
Secondary data refers to the data which have already been collected and analysed by someone else. When the researcher utilizes secondary data, then s/he has to look into various sources from where s/he can obtain them.Collection of secondary data majorly uses documentary method: documents are an important source of data in many areas of investigation. Review of the documents shows that the researcher is aware of the available functions of research. In documentary analysis, the following may be used as sources of data records: various published or unpublished data, books, magazine, newspaper, trade journals, reports, printed forms, letters, diaries, compositor’s themes or other academic work, pictures films and cartoonsUnpublished data may be found in: letters, diaries, unpublished biographies or work.Before using secondary data, you need to consider the following;Reliability of data: Who collected the idea? From what source? Which methods? Time? Possibility of bias? Accuracy?Suitability of data: The object, scope and nature of the original inquiry and studies and then carefully scrutinize the data for suitability.Adequacy: The data is considered inadequate if the level of accuracy achieved in data is found inadequate or if they are related to an area which may be either narrower or wider than the areas of the present enquiry.Application Activity 4.5
Discuss the advantages and disadvantages of using secondary data in business research.4.5. Data Analysis
Activity 4.6
Observe and analyse these photos and answer the questions below. In any research project, the researcher goes through a given process to obtain usable and useful information from the data collected.a. Identify the research stage illustrated aboveb. Explain the process of the research stage identified in (a) when using qualitative data.The purpose of analysing data is to obtain usable and useful information. The analysis, irrespective of whether the data is qualitative or quantitative, may:i. Describe and summarize data.ii. Identify relationships between variables.iii. Compare variables.iv. Identify the difference between variables.v. Forecast outcomes.Data that is not sorted and analysed is of no value. When it is sorted, arranged and analysed it generates useful information. Data analysis comes after data has been collected. You have to analyse the data collected to come up with the conclusions. Without analysis, data alone does not provide meaningful and useful information.The research process at this stage may have generated two types of data, qualitative (non-numeric) data and quantitative (numeric) data.
Analysis of qualitative data
Qualitative data is data that consists of words, observations and descriptions but not numbers. Analyzing qualitative data is also called content analysis. Analyzing qualitative data is rather a tricky process since each respondent gives a unique response.Qualitative data comes in varied forms. This may include short answers from open ended questions, long answers from interviews and in many other different forms. Qualitative data may be produced from any of the following:•Open ended questions and comments from questionnaires. Such questions may generate single words, short phrases or even complete sentences and paragraphs.•Discussion groups. These may generate qualitative data in form of notes and observations recorded by the group moderator or leader.•Interviews. These generate data in form of brief notes or recordings.•Other sources like case studies, documents and reports also generate qualitative data.The qualitative data analysis process
Step 1:Understand your data. Under this stage, the researcher tries to understand the data by reading the data over and over again. If the data is recorded, the researcher listens to it as many times as possible to understand the quality of data.Step 2:Focus on the analysis. At this stage, the researcher reviews the purpose of the research and what he/she wants to find out, what questions he/she wants answered and what he/she wants to use the findings for.Step 3:Categorization of data. This stage may be called coding data or indexing data. The researcher identifies themes and patterns in the data and organizes the data in groups. This involves reading and re-reading over the data to identify similarities in responses.Step 4:Sort and organize the data. Here, the researcher identifies patterns and relationships within the data. This includes identifying relative importance of particular response (what percentage shop from boutiques), relationship between the data (people who say they buy shirts from shops also prefer long sleeved shirts).Step 5:Interpret the data. Use the interpretations, themes and connections between data to explain your findings.Analysis of quantitative data
Quantitative data analysis is a systematic approach to investigations during which numerical data is collected and the researcher transforms what is collected or observed into numerical data. It often describes a situation or event; answering the ‘what’ and ‘how many’ questions you may have about something. This research involves measuring or counting attributes (i.e. quantities). The quantitative data is subjected to various tests and measures namely:•Measures of central tendency (mean, median and mode)•Measures of variability (range, standard deviation).Manual data analysis
Before the computers and specialized computer programs were developed, research was always done and the data collected was analysed. People used manual methods to analyse data. This is very tiresome, slow and at times difficult altogether because more errors are likely to be committed and difficult to detect.Electronic data analysis
There are various computer programs that are specifically made to analyse data collected from research and present results. There are also several statistical packages that can be used to analyse data.Data analysis using software
Nowadays many computer applications that can be used to analyse research data are available. When choosing which software to use, the following are taken into consideration:•The cost of the software•The volume and nature of data available•The skills of the researcher and the kind of analysis required.The common software for research data analysis includes: METLAB, SPSS, STATA and Microsoft Excel. Microsoft Excel is the most common and basic program that can be used for research data analysis.Entering data into excel
You need to get familiar with the basic features of MS Excel workbooks, worksheets, formula and functions before you start using MS Excel to enter and analyse data. Like a book with many pages, an excel file is called a workbook and in each workbook, there are several sheets called worksheets. Different data may be entered in different worksheets in the same workbook. You can enter and edit data from worksheets. Different kinds of data may be entered in different worksheets in the same workbook. Excel helps a researcher analyse data. It is important to understand that before thinking of using Microsoft Excel to analyse research, the important thing is to have useful and relevant data and then excel will sort and analyse it.The researcher must plan on how data will be arranged in a systematic way that will allow sorting and analysis. The researcher must decide on what goes into the columns and the rows. For example, data that involves names of sellers, sex, age, sales in January, February, March and April may be arranged in the following way using excel.
 Entering the data into a spreadsheet is always a three step process, which are:•Click in the cell where you want the data to go•Type the data into the cell•Press ENTER key on the keyboard or click on another cell with the mouse.Using Microsoft excel, research data can be analysed using bar graphs, pie chart and line graphs. Having completely entered the data, the data can be graphed by selecting the data, then the type of graph and excel will generate a graph on the selected data. It is important to be as accurate as possible when entering data for analysis.
Graphical analysis and presentation of data in excel
For example, a producer who wants to introduce a new product in the market carries out a research using a single multiple question that follows: The questionnaire is administered to 500 buyers in the market. When the questionnaires are collected and tabulated, the following is obtained:
 You have to first of all correctly enter the data in excel and use excel graphing functions to analyse and display the information graphically.
 The same data may be presented graphically as a pie chart. A pie chart is a type of graph in which a circle is divided into sectors that each represents a proportion of the whole.From the same data, we used to draw a bar graph, we can also use excel to make a pie chart.
Frequencies and percentages
Frequency is the number of times something has occurred. A frequency table shows the number of times a given event has happened. For example, for a statement that requires a YES or NO response (selecting one of the options).Question
Have you at least transacted with our business one time?YES NOYou may get something like this after tabulating the data from the responses. The above data can be expressed in percentage form as follows:If 162 respondents transacted with the business.162/520× 100= 31.15%, so 31.15% transacted with the business at least one time.Out of 520 respondents, 358 didn’t transact with the business.358/520× 100= 68.84%, so 68.84% never transacted with the business.
Measuring central tendencies in data
A measure of central tendency is a single value that attempts to describe a set of data by identifying the central position within that set of data. As such, measures of central tendency are sometimes called measures of central location. They are also classed as summary statistics. The mean (often called the average) is most likely the measure of central tendency that you are most familiar with, but there are others, such as the median and the mode.The mean, median and mode are all valid measures of central tendency, but under different conditions, some measures of central tendency become more appropriate to use than others. In the following sections, we shall look at the mean, mode and median, and learn how to calculate them.What is the mean?
The mean is the sum of the value of each observation in a data set divided by the number of observations. This is also known as the arithmetic average.Looking at the retirement age distribution again: 54, 54, 54, 55, 56, 57, 57, 58, 58, 60, 60The mean is calculated by adding together all the values (54+54+54+55+56+57+57+58+58+60+60 = 623) and dividing by the number of observations (11) which equals to 56.6 years.There are specific functions for calculating the mean of a data set using excel. Considering the monthly expenses of the following people, determine the mean: To find the mean,•Add up all the incomes= 18,000+200,000+50,000+100,000= 368,000Frw•Divide by the total number of elements(people) in data set= 4•The mean = 368,000/4= 92,000
What is the median?
The median is the middle value in distribution when the values are arranged in order of magnitude (smallest first).The median divides the distribution in half (there are 50% of observations on either side of the median value). In a distribution with an odd number of observations, the median value is the middle value.Looking at the retirement age distribution (which has 11 observations), the median is the middle value, which is 57 years: 54, 54, 54, 55, 56, 57, 57, 58, 58, 60, 60When the distribution has an even number of observations, the median value is the mean of the two middle values. In the following distribution, the two middle values are 56 and 57 like:52, 54, 54, 54, 55, 56, 57, 57, 58, 58, 60, 60Therefore, the median equals (56+57)/2 which give56.5 years:Using the previous example of income, we have to first sort the data (income) in descending order and then determine the median. The median is 50,000; there are 2 data items before the median and 2 data items after the median.
What is the mode?
The mode is the most commonly occurring value in a distribution.Consider this data set showing the retirement age of 11 people, in whole years: 54, 54, 54, 55, 56, 57, 57, 58, 58, 60, 60This table shows a simple frequency distribution of the retirement age data. The most commonly occurring value is 54; therefore, the mode of this distribution is 54 years.
Application Activity 4.6
Mr. HABINEZA needs to start a business in Rulindo district at the end of his secondary studies. After making a research in his district, he realized that people in his district consume products per month as stated in the following table:
Required:
i. Use the bar charts to present the consumption of those goods in rural area.ii. What is the most needed product in rural and urban area?iii. According to the above mentioned data, which kind of business can be started in both areas?iv. Use the pie chart to graphically present the consumption of those goods in urban area.Skills Lab Activity 4.7
Given the questions below, carry out a survey in your community and thereaf-ter make a report according to the findings from the research.Interview questions:
1. What do you like most about the products that you normally buy and why? If you have a business club at the school, ask them what they find interesting about the club products2. What changes would you propose to the above product (ones they normally buy?)3. What do other products similar to the above product differ from others?4. As aspiring entrepreneurs, advise us on how can we best extend our products to bigger markets outside our community?5. Name other products we could make from locally available resources that can be most competitiveEnd of unit 4 assessment
1. Choose the best answer for the following statementsi. Having no research questions or poorly formulated research questions will lead you to poor research findings because:a. You will only consider epistemological queriesb. Marks are allocated for having a research question and without them my project will be penalized.c. You won’t know what data analysis method used.d. Your research is likely to be unfocused and you are likely to be unsure what data to collect.ii. What is data collection?a. Collecting the research question and objectives togetherb. Gathering the information (data) which will help you address your research questionc. Reviewing the literature reviewd. Outlining how you will gather the information for your research question.2. Using the knowledge obtained from this unit, outline the essential things to put in consideration when conducting an interview.3. As an entrepreneur, you are planning to initiate a new product “Made in Rwanda sandals” in the market. This is an activity that requires deep and serious research so as you produce a product that will be appreciated by the buyers. You particularly want to find out the following:•Characteristics of a good sandal•Size of the market•Appropriate priceRequired:
i. Identify the sampleii. Design a questionnaire to be used while collecting dataiii. Administer and collect the filled questionnairesiv. Using Microsoft Excel, analyse and interpret the data collected.4. Explain how research can help the marketing department of a business in achieving its target.