Topic outline
UNIT1: ADVANCED SPREADSHEET II
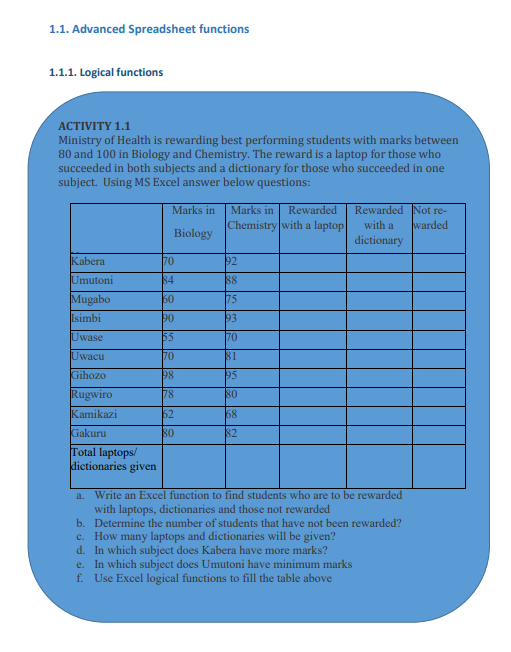 The If function takes as arguments the logical test, checks if it evaluates to true and ifA condition is an expression that either evaluatesto true orfalse. The expression couldbe a function that determines if the value entered in a cell is of numeric or text datatype, if a value is greater than, equal to or less than a specified value, etcLogical Function is a feature in Excel that allows excel users to introduceautomated decision-making when executing formulas and functions.The role of functionsin thisisto check if a condition istrue orfalse. It combines multipleconditions together and comes up with a result depending on the result of theevaluation of the condition.a. IF FunctionThe If function checks whether data in a cell meets a certain condition and returnsone value which can be True or False• Syntax: = IF(Logical_test, Value_If_True, Value_If_False )
so returns as a result the content of the second argument and if false the content ofthird argument is returned
• Example 1:
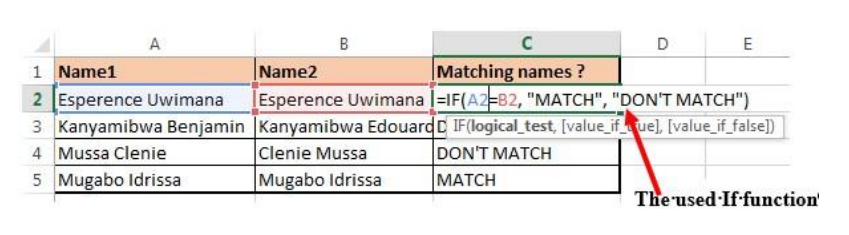 Figure 1. 1. The use of If function to compare namesIn the above example the If function with its arguments is entered in the cell wherethe result is to appear.To apply that function in other cells proceed like this:1. Place the cursor in the bottom corner of the cell2. Hold down the left key, scroll down to other cells and release the leftbuttonThe If function in the above examples checks if the two names are alike and if yes,the function writes MATCH in the cell, if not the function writes DON’T MATCH• Example 2:Considering the marks obtained by Irasubiza, Karenzi, Byukusenge and Shyaka in ICT,Maths and English. The If function checks if the marks are greater than87 and gives to the candidate the Very Good note else the Good note is given.
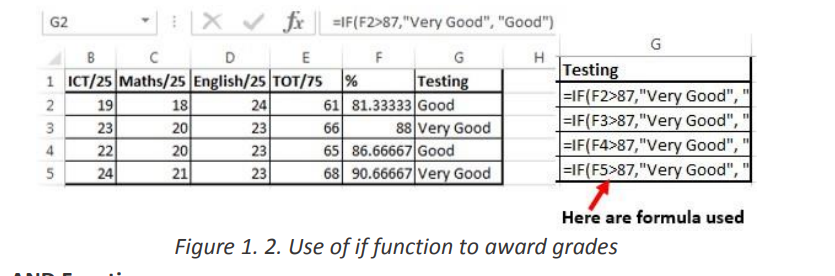 Interpretation of the results:b. AND FunctionThe Excel AND function is a logical function used to test if two or many conditions aretrue. The result is TRUE if all the conditions are true else the result is FALSE• Syntax: =AND (Logical1, Logical2, logical3,…)• Example:In the table below the And function checks if people in the table studiedEducation and that their age is greater than 18
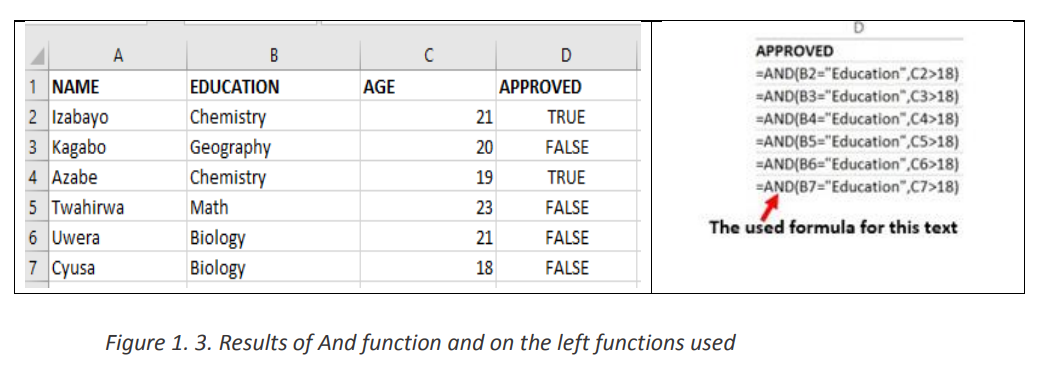 Note: the And function may have more than two arguments and for the results to beTrue all the arguments must evaluate to TRUE and if one of the arguments is false allthe result is FALSE
The second, fourth, fifth and seventh rows evaluate to True as the education for all
those rows is Education and the age is greater than 18 while the remaining rowsc. FALSE Functionevaluate to FALSE as they don’t meet the two criteria.
The FALSE function takes no arguments and generates the Boolean value FALSE. It is
used to compare the results of a condition or function that either returns true or false
• Syntax: =False
The false function takes no argument but just returns the logical value False
•Example: The False function used in the example below returns FALSE if the ageInterpretation:entered in C2 is less than 20 (C2<10)
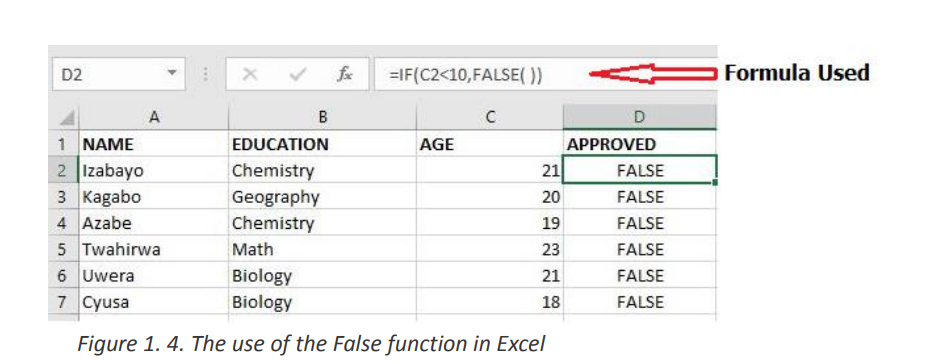
The used function “=IF(C2<10,FALSE)” will check if the C2 cell data is less than 10, if
so it will return False as a result else it will return True. The same function will bed. NOT Functionapplied to other cells by changing the cell position
The Excel NOT function returns the opposite of a given logical or Boolean value. When
given TRUE, NOT returns FALSE. When given FALSE, NOT returns TRUE. Use the NOT
function to reverse a logical value.
• Syntax: =NOT(Logical)
The not function takes one logical expression as an argument. It returns an error if• Examplemore than one argument is used.
The table below will have all its content returned to True by the use of the NOT
function. If the results to reverse were got by using a formula the Not function can be
put in front of the function/formula to make the latter an argument of the NotNote: If the results in column D2 were got by using the function “=IF(C2<10,FALSEfunction.
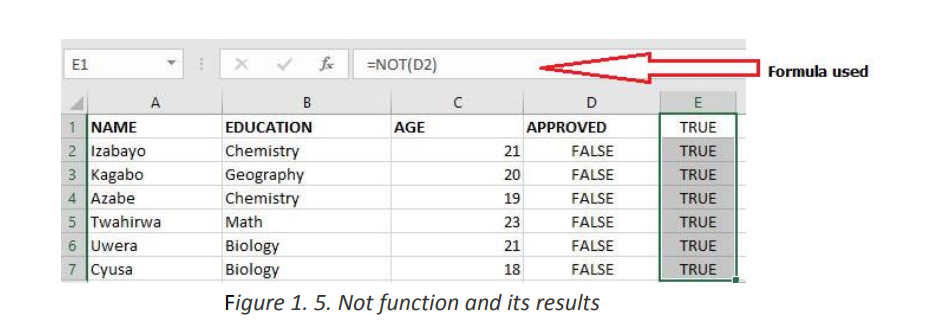
the result in column E2 can be got by using the function “=NOT(IF(C2<10,FALSE
As always the formula/function in one cell can be applied to other cells by pasting it in
those cells
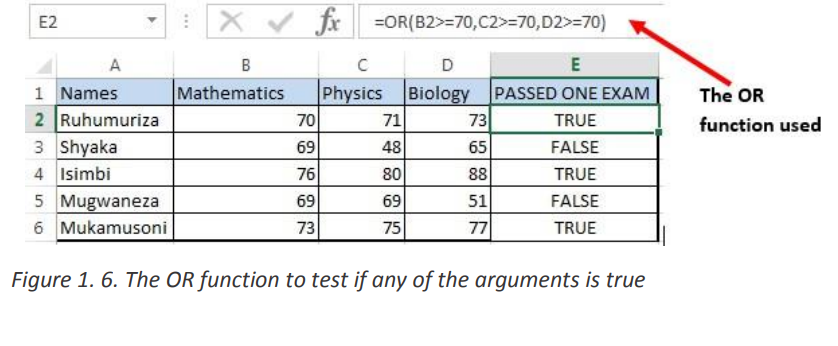
e. The OR function
The OR function is a logical function to test multiple conditions at the same time. OR• Syntax: = OR(logical1, Logical2, …)returns either TRUE or FALSE.
• Example:
The OR function in the screenshot below checks for students who got more than 70%Mathematical functions are used to calculate values basing on what is in cells, performas the Pass mark in anyone of the three tests.
operations on a cell content, fetch values after an operation based on the search
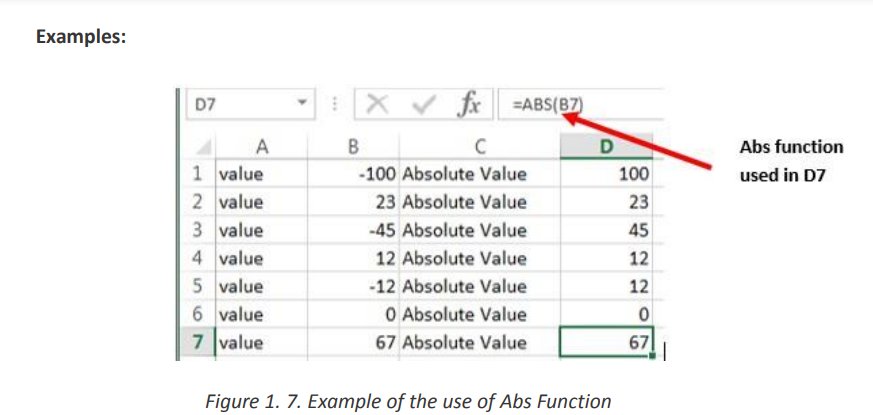
criteria and much more. Some of the functions to be seen here are Absa. ABSRoman
The Excel ABS function returns the absolute value of any provided number.Where the numerical argument is the positive or negative numeric value for whichThe syntax of the function is: ABS (number)
the absolute value is to be calculated.
 b. ARABIC
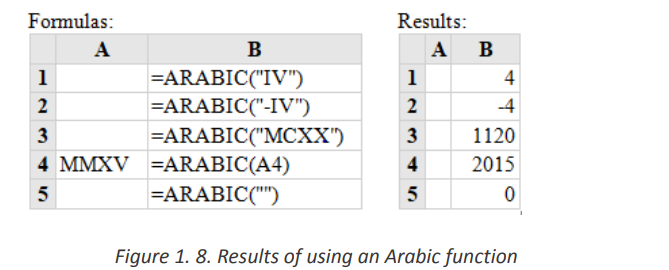
The Excel Arabic function converts a Roman numeral into an Arabic numeral. The
syntax of the function is: ARABIC (text)
Where the text argument is a text representation of a Roman numeral not
exceeding 255 characters.
Note that:
• If supplied directly to the function, the text argument must be encased in
quotation marks;
• If an empty textstring is supplied, the Arabic function returnsthe value 0;
• The Arabic function was only introduced in Excel 2013 and so is not
available in earlier versions of Excel.c. ROMANBelow are five examples of converting ARABIC to NUMBERS
The Excel ROMAN function converts an Arabic number to a Roman number. This
means that if a function is supplied with an integer, the function returns a text string
showing the Roman numeral form of the number.
The syntax of the function is: ROMAN (Number, [form])
• Where Number is any Arabic number and the form specifies the presentation
format of the Roman number to be calculated. The formats to choose from are
displayed after writing the number to convert and writing the comma but the default
(classic) is used.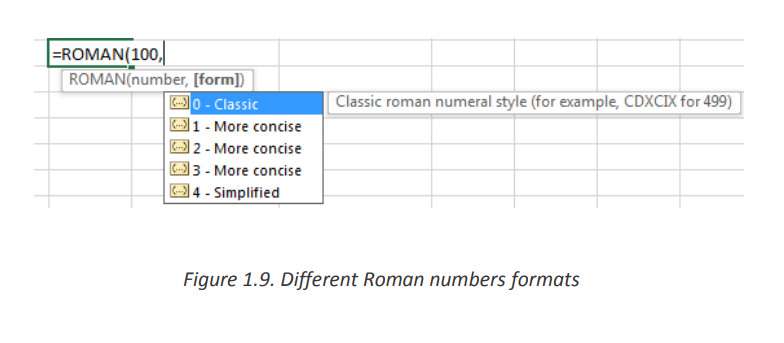
• Roman Function use examples
In the following spreadsheet, the Excel Roman function is used to convert thenumber 1999 to different forms of Roman numerals.
d. BASE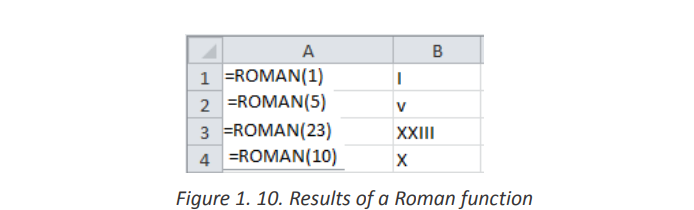
The Excel Base function converts a number into a supplied base and returns a text
representation of the calculated value. The Base function was introduced in Ms Excel
2013 and therefore, it is not available in earlier versions of Excel.
The spreadsheet below shows three examples of the Excel Base Function.
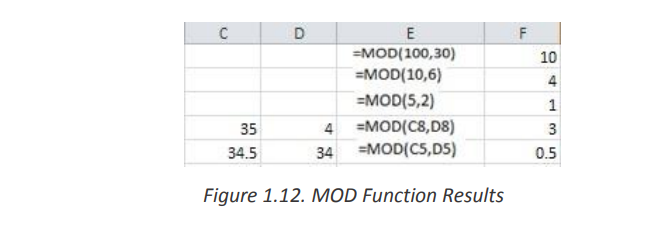
e. MOD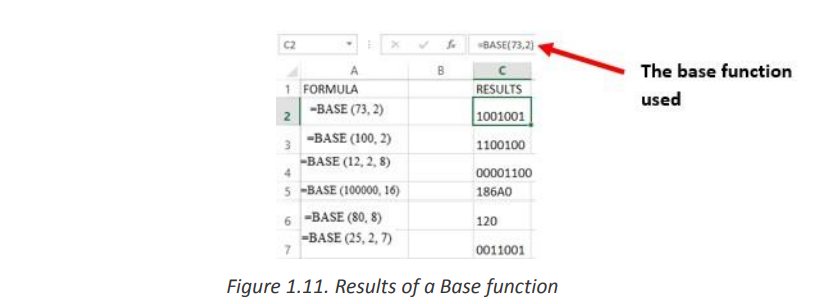
The Excel MOD function returns the remainder of a division between two
supplied numbers.
The syntax of the function is: =MOD (number, divisor)f. SQRTThe spreadsheet below shows four simple examples of the Excel Mod function.
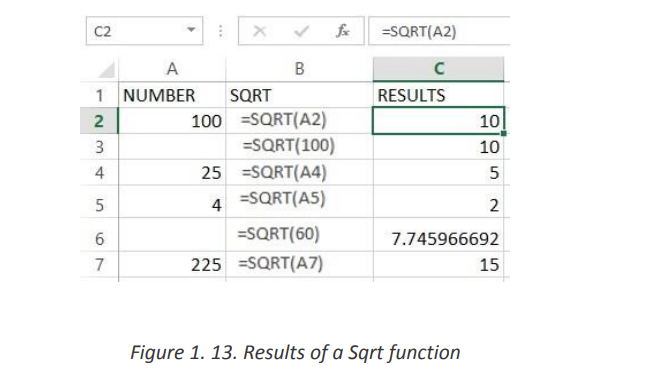
The Excel SQRT Function calculates the positive square root of a supplied• Where the number argument is the numeric value for which the squarenumber.
The syntax of the function is: SQRT (number)
root is to be found.• Excel Sqrt Function ExamplesIf the supplied number is negative, the Sqrt function returns the #NUM! Error.
The following spreadsheet shows three simple examples of the Excel Sqrta. AVERAGEfunction.
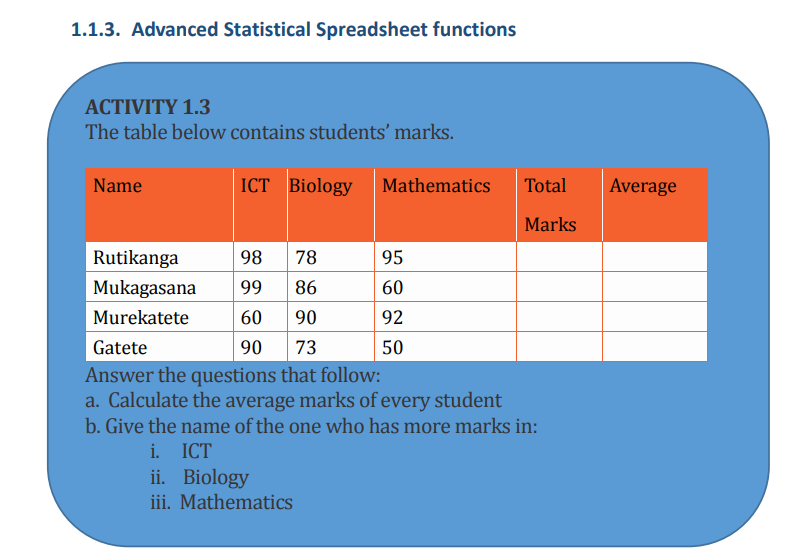
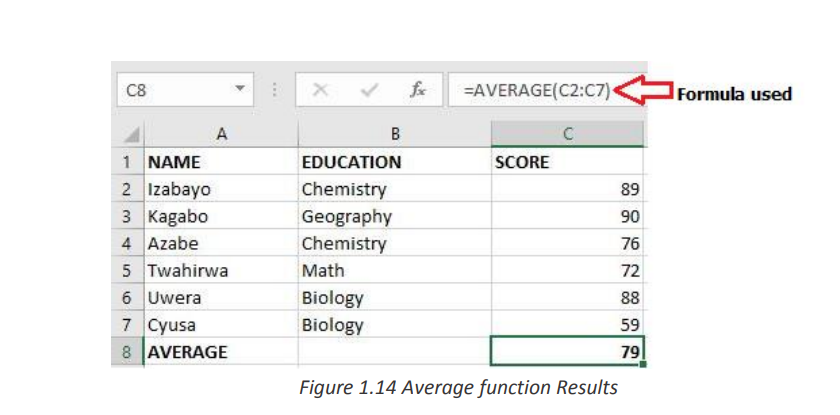
The AVERAGE function in Excel returns the arithmetic mean of a list of supplied
numbers, where the number arguments are a set of one or more numeric values, or• Syntax of AVERAGE Function in Excelarrays of numeric values, for which the average is to be calculated.
= Average (Number1, Number2, …)b. AVERAGEIFAn example of how Average function is used is displayed in the screenshot below:
AVERAGEIF Function in Excel finds and returns the average of array that meets the
specific condition. The AVERAGEIF function in Excel supports logical operators (>, <,• Syntax of AVERAGEIF Function in Excel:<>, =)
=AVERAGEIF (range, criteria, [average_range]) Where:
• Range: An Array of range to be tested against the supplied criteria.
• Criteria: The criteria or condition on which average has to be calculated.
• [average_range]: An optional array of numeric values for which the
average is to be calculated.
Example of AVERAGEIF Function in Excel
In the Excel screenshot below the averages of cells meeting certain conditions have
been calculated. Those conditions are: cells with scores greater than 70, average for
Irasubiza and average for science courses.c. LARGE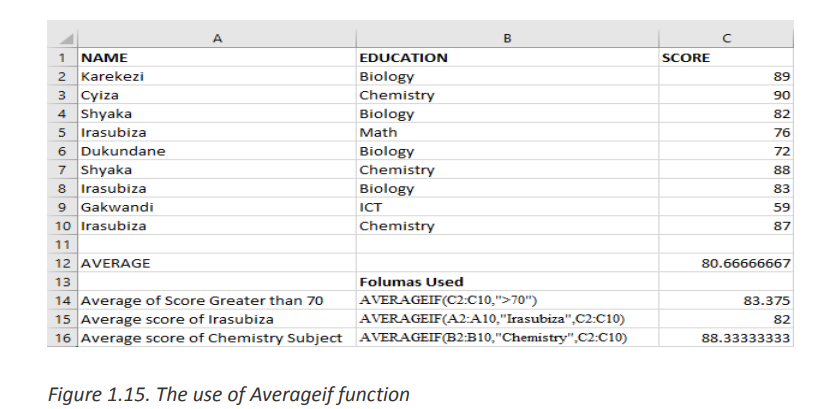
The LARGE Function in Excel returns the largest value from an array of numeric values.
• The syntax of LARGE Function isWhere:=LARGE (array, k)
• Array – An array of numeric values from which to find the Kth largest
value.
• K- The index. Value of K that is passed to find the Kth largest value.Interpretation:Example of LARGE Function in Excel:
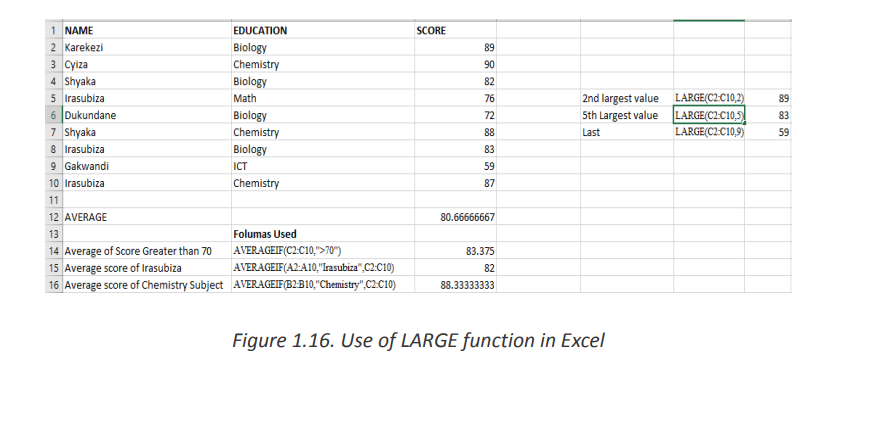
• First Example finds the 2nd Largest Value as 89
• Second Example finds the 5th Largest Value as 72
• Third Example finds the 7th Largest Value as 55
d. MEDIAN
MEDIAN function in Excel returns the statistical median or middle value of a list of
supplied numbers.
Syntax of MEDIAN Function in Excel is: = MEDIAN (number1, [number2], …) Where
the number arguments are a set of one or more numeric values forAn example of how the Median function is used in Excel is shown in the tablewhich to calculate the median
below:
• When the total number of supplied values is odd, the median is calculated as the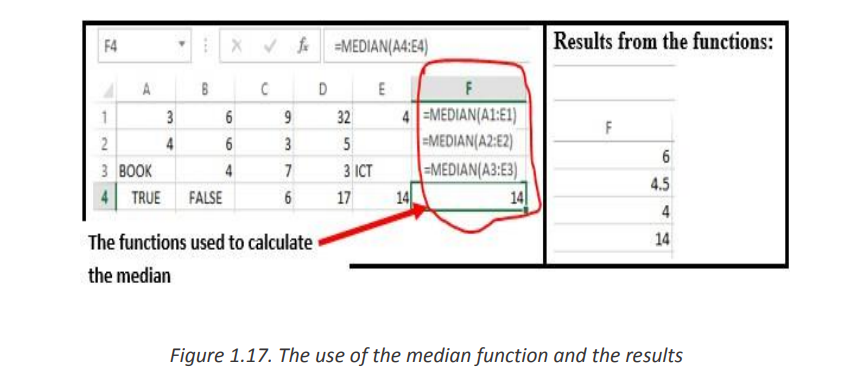
middle number in the group.
• When the total number of supplied values is even, the median is calculated
as the average of the two numbers in the middle.e. MODE Function• Cells containing Text values, logical values, or no value are ignored.
MODE function in Excel returns the mode which is themost frequently occurring
number in a group of supplied arguments.
The Syntax of MODE Function in Excel is =MODE (number1, [number2],…)
Where the number of arguments are a set of one or more numeric values forCells containing Text values, logical values, or no value are ignored.which you want to calculate the mode.
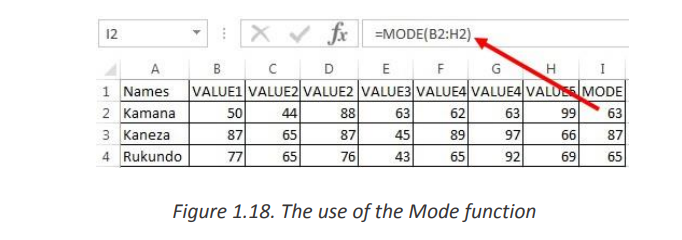
• Mode (most frequently occurring value) is calculated row wise in above example.
 Excel has functions which facilitate an automatic manipulation of text which would
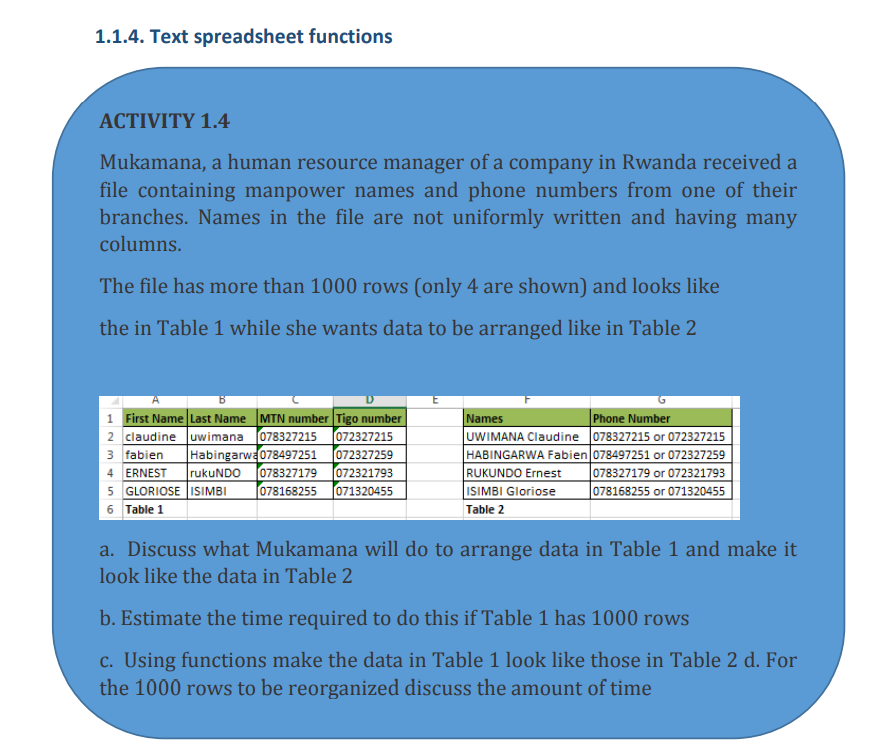 For example in the case presented in the activity above if one has to combine data
take too much time if it was done manually.
from two rows into one for a total of 1000 rows by copying data from one row and
pasting it next to data in the other row and if one can do one row in
2 seconds, the whole exercise would take up to 33 minutes. Considering that some
names which are in upper case must be in lower case and some in lower must be in
upper which would require rewriting the names the whole exercise can take up to anThat is where Excel ingeniosity comes in by providing functions which can allow onehour.
to do this in less than one minute. The section below explore the functions that cana. CHARbe used to do such a task
The CHAR function returns the character based on the ASCII value. The CHAR function
is a built-in function in Excel that is categorized as a String/Text Function.The ASCII value is used to retrieve the character.The syntax for the CHAR function is:

Example: Explore how to use the CHAR function as a worksheet function inMicrosoft Excel:
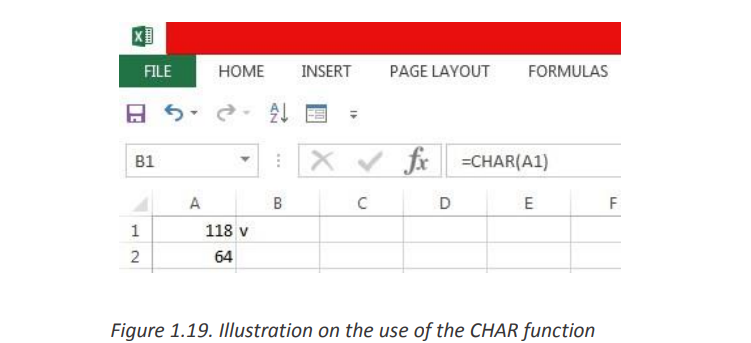 Based on the Excel spreadsheet above, the following use of the CHAR function
would return:
=CHAR(A1) : Gives Result: “v”
=CHAR(A2) : Gives Result: “@”
=CHAR(72) : Gives Result: “H”b. CONCATENATE=CHAR(109) : Gives Result: “m”
The CONCATENATE function in Excel is designed to join different pieces of text
together or combine values from several cells into one cell.
The syntax of Excel CONCATENATE is as follows:Where text is a text string, cell reference or formula-driven value.CONCATENATE (text1, [text2], …)
Below is an example of using the CONCATENATE function in Excel in which data
from two cells has been combined.
The simplest CONCATENATE formula to combine the values of cells A1 and B1 is as
follows:c. UPPER=CONCATENATE(A1, B1)
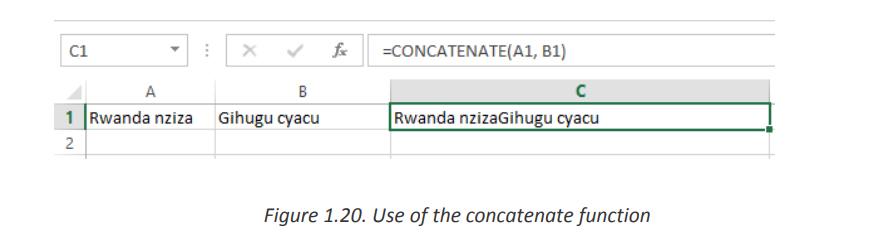
Figure 1.20. Use of the concatenate function
The UPPER function is a built-in function in Excel that is categorized as a String/ Text
Function. It converts a text (String) into uppercase
Example:
A1==” better technology for the best future”
=UPPER(A1)d. LOWERResult: “BETTER TECHNOLOGY FOR THE BEST FUTURE”
The LOWER function is used to convert text (String) into small cap text
Example: B1=”EXCEL SCIENCES THROUGH TECHNOLOGY”
=LOWER (B1)When the workbook has many sheets there is a possibility to get data from one sheetResult: excel sciences through technology
into another by using formula or functions.
Example 1:
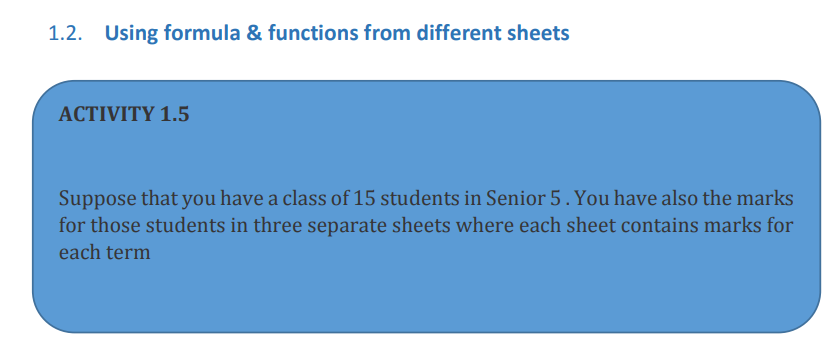
Consider the example below which are data from two different sheets named Sheet1
and Sheet2. These sheets contain marks for ICT and for Biology. The teacher wants to
make totals for each student for the two subjects and keep those totals in a separatesheet “Sheet3”
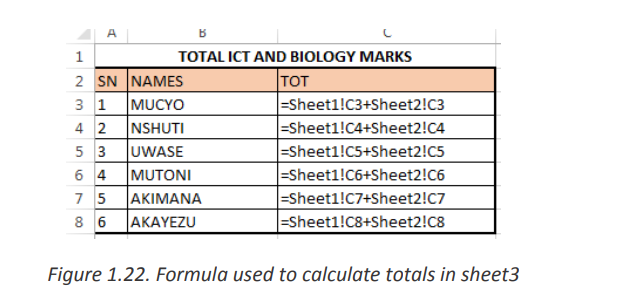
To achieve this go to the table in Sheet3 where totals of data from the two sheets has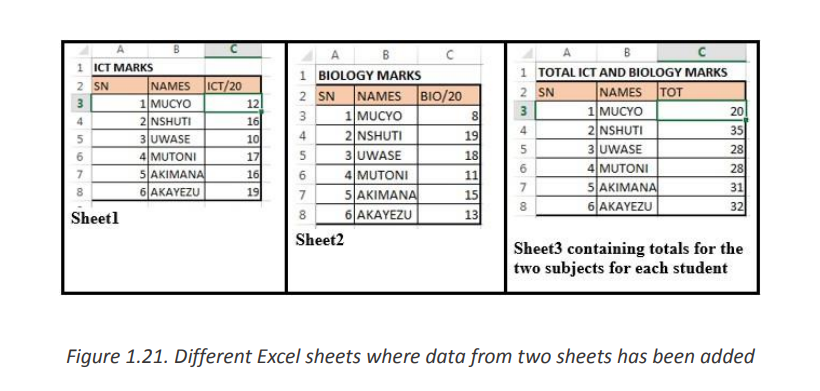
to be done then in the TOT column cell C3 write the formula to use which is
=Sheet1!C3+Sheet2!C3
Meaning that data from cell C3 of Sheet1 is added to data from cell C3 of sheet2
You can do this by writing formula from scratch or by:
• Writing the equal sign in the cell where total is to be written
• Going to the cell containing the first data to be added and selecting it
• Writing the + sign
• Selecting second data to be added by going to the sheet containing that data
and selecting the right cell and lastly hitting enter
The formulas used to calculate the totals for the example above are in the imageExample 2:below:
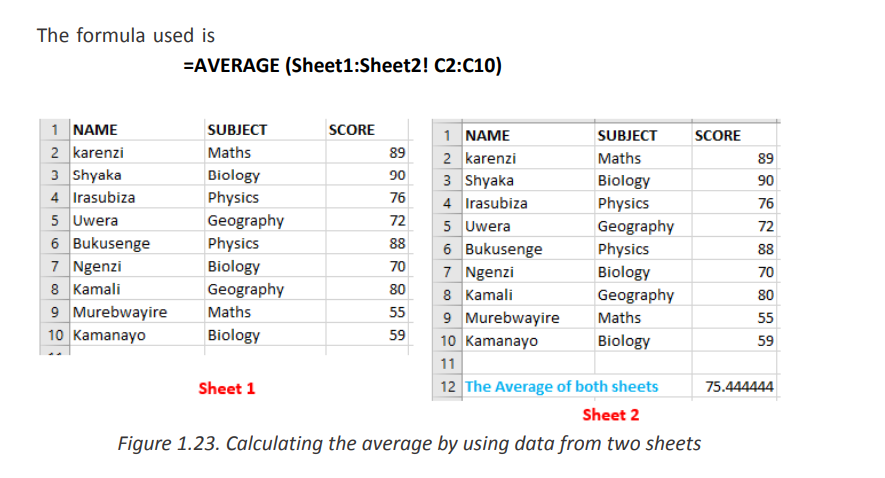
Consider another example in which two sheets Sheet1 and Sheet2 contains data
(score) on different subjects. The average of marks contained in the two sheetsis going to be calculated and kept in Sheet1.
 Worksheet protection is to prevent other users from accidentally or deliberately
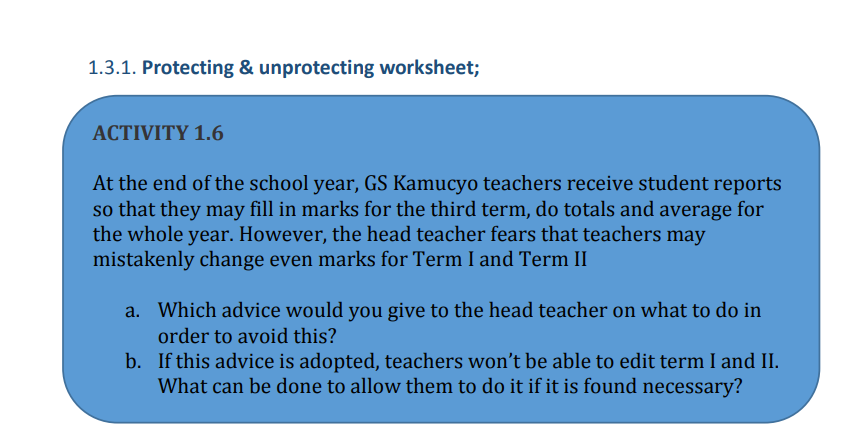
changing, moving, or deleting data in a worksheet, you can lock the cells on your Excel
worksheet and then protect the sheet with a password.
With worksheet protection, you can make only certain parts of the sheet editable and
users will not be able to modify data in any other region in the sheet.
Rules to follow for protecting worksheets with strong protectiona. Protect your sheets with strong passwords that include different types of
alpha numeric characters and special symbols. At that, try to make passwords
as random as possible
b. Protect the workbook structure to prevent other people from adding, moving,
renaming or deleting the sheets.
c. For workbook-level security, encrypt the workbook with different passwords
from opening and modifying. If possible, store your Excel files with sensitiveinformation in a secure location, e.g. on an encrypted hard drive.
To protect a sheet in Excel 2019, 2016, 2013 and 2010, perform the following steps.When a sheet is protected, anyone will be able to read data but will not be able to
a. Under the Review tab click on Protect Sheet.
b. Type the password and click on Okc. Reenter password and click on Ok
modify it and once data in that sheet is modified this message below will be displayed1.3.2. Lock &unlock cells, style, contents and other elements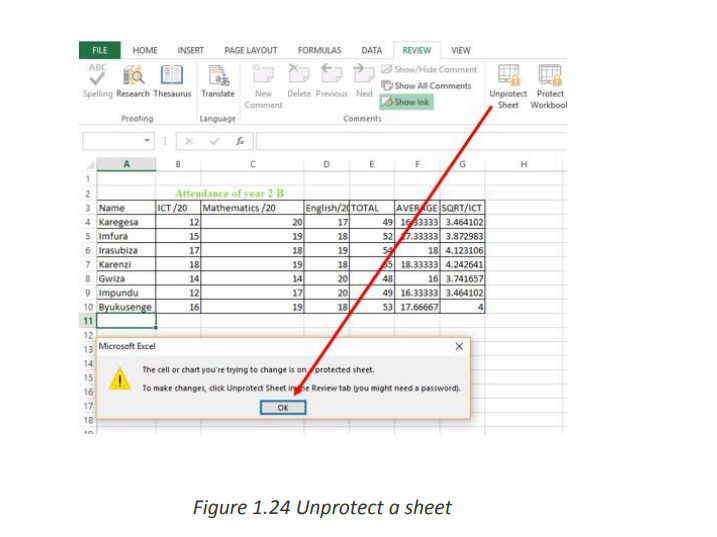
a. How to Lock Cells for Editing and Protect Formulas
When a sheet is shared while some sheet cells must not be modified some rules have
to be set so that data can be modified by anyone who wants it but not modified by
someone who does not have the right to do so. In the table below a list of products
will be sent to the customers. Customers will be able to modify some product records.The great news is that you can lock cell, or a whole range of cells, to keep your work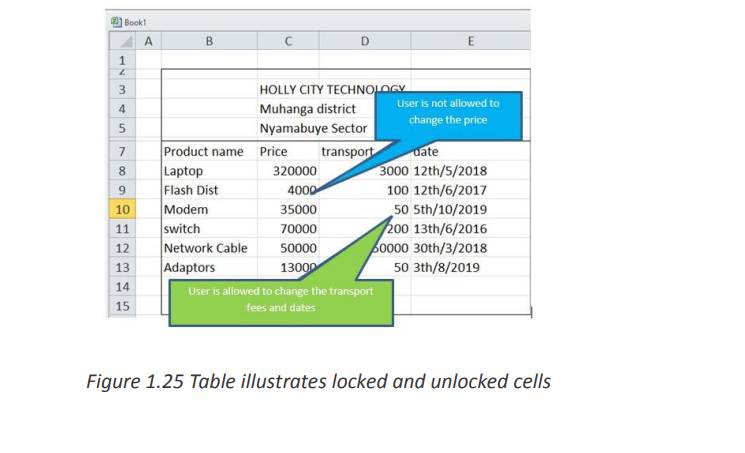
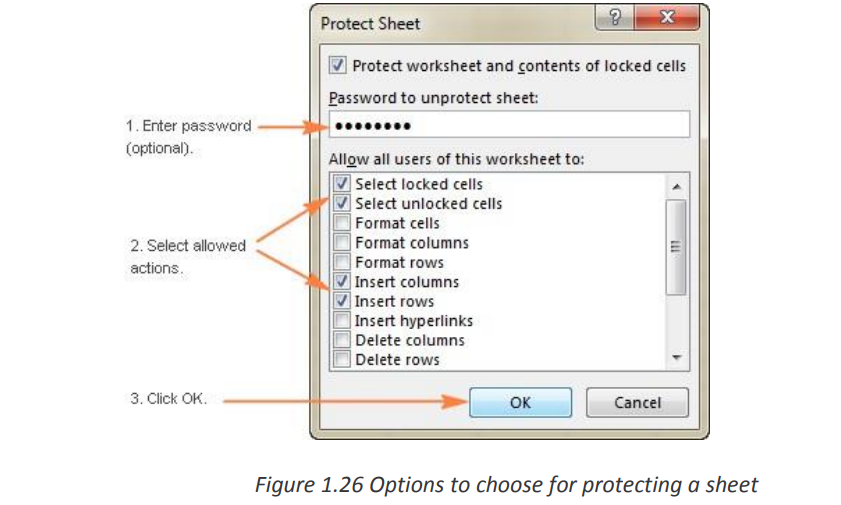
protected.Here’s how to prevent users from changing some cells. Type a password in the corresponding field.
 Be sure to remember the password or store it in a safe location because you
will need it later to unprotect the sheet.
Select locked cells .
If only these two options are selected, the users of your sheet, including yourself, will
be able only to select cells (both locked and unlocked).If the worksheet protection is nothing more than a precaution against accidental
modification of the sheet contents by yourself or by the members of your local team,you may not want to bother about memorizing the password and leave the password
field empty
Select the actions you allow the users to perform.
b. How to unprotect Excel sheet with password
To lock only specific cells and ranges in a protected worksheet
Follow these steps:1. Select the cells you want to lock.
2. On the Home tab, in the Alignment group, click the small arrow to
open the Format Cells popup window.
3. On the Protection tab, select the Locked check box, and then click
OK to close the popup.
4. Right-click the sheet tab, and select Unprotect Sheet from the
context menu.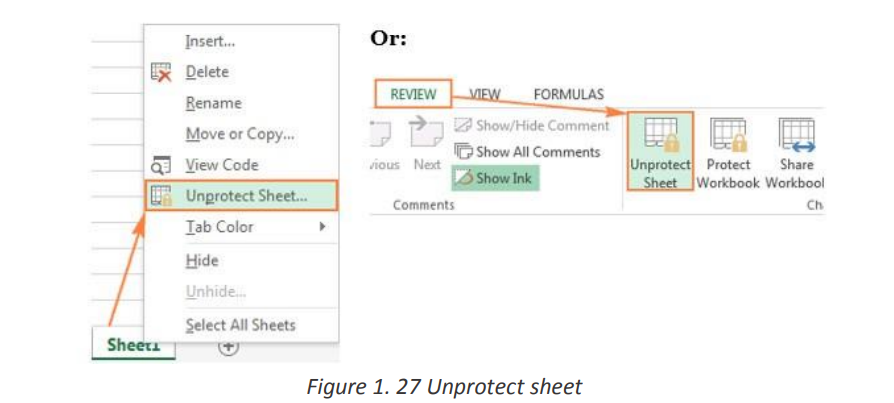 On the Review tab, in the Changes group, click Unprotect Sheet.
• On the Home tab, in the Cells group, click Format, and select Unprotect
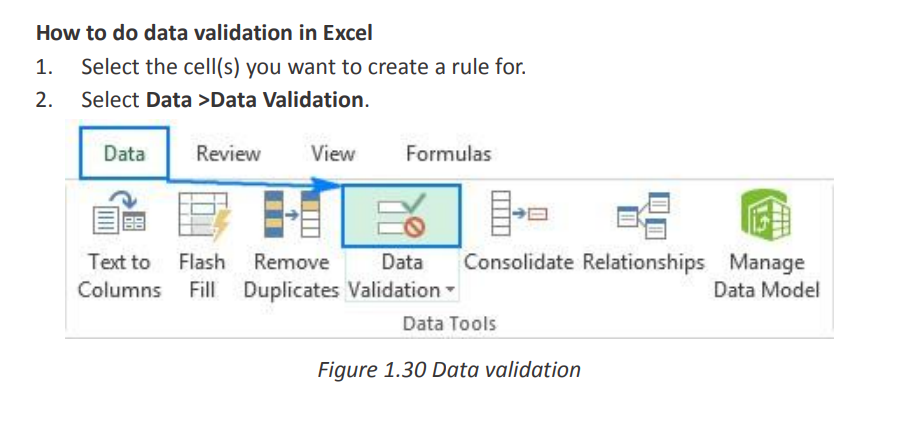
Sheet from the drop-down menu.Excel Data Validation is a feature that restricts (validates) user input to a worksheet.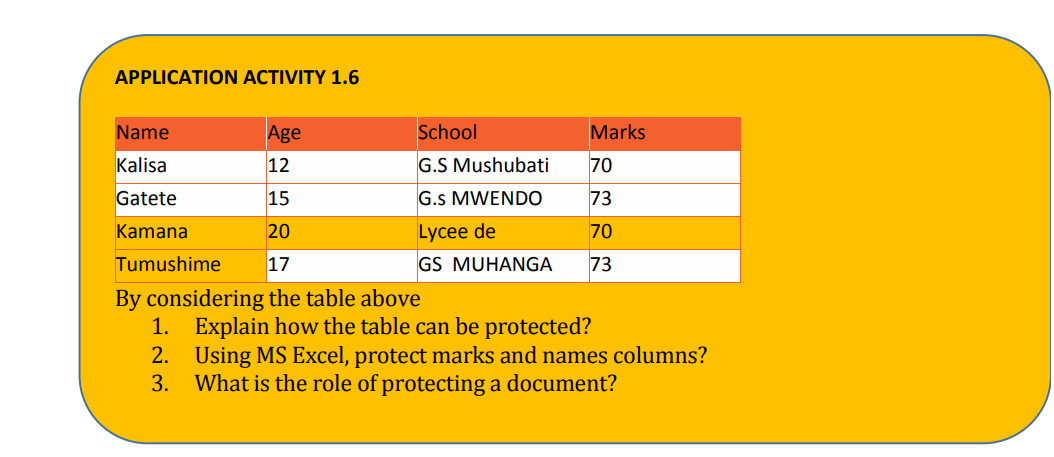
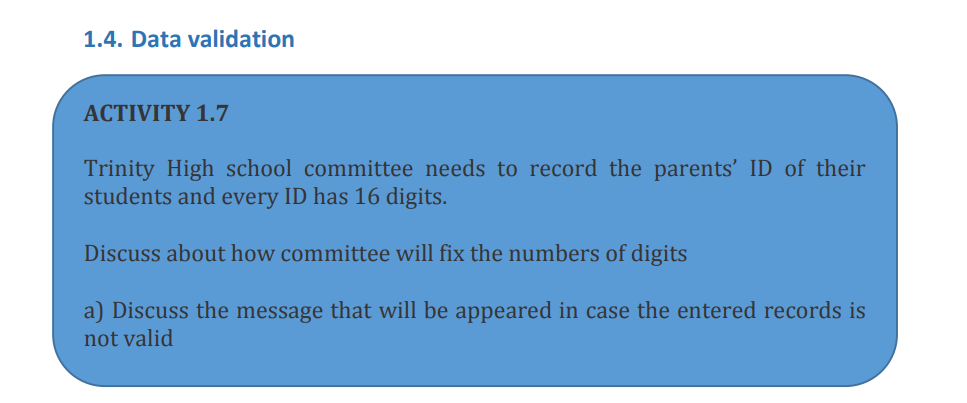
Technically, you create a validation rule that controls what kind of data can be enteredinto a certain cell.
Here are just a few examples of what Excel’s data validation can do:• Allow only numeric or text values in a cell.
• Allow only numbers within a specified range.• Allow data entries of a specific length.
• Restrict dates and times outside a given time frame.
• Restrict entries to a selection from a drop-down list.
• Validate an entry based on another cell.
• Show an input message when the user selects a cell.
• Show a warning message when incorrect data has been entered.
• Find incorrect entries in validated cells.For instance, you can set up a rule that limits data entry to 4-digit numbers between
1000 and 9999. If the user types something different, Excel will show an error alert
explaining what they have done wrong. The window below shows a warning message
that appears when data outside of the range (1000-9999) is entered.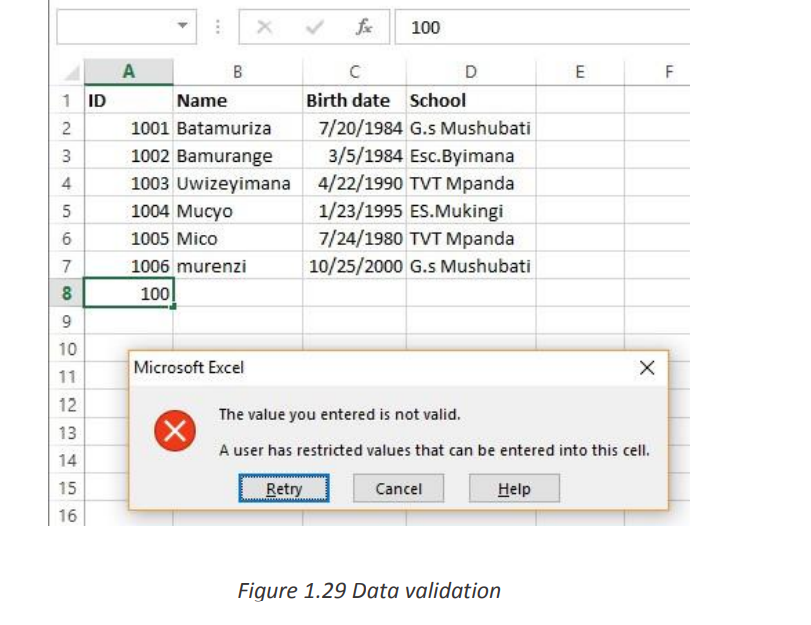
283. On the Settings tab, under Allow, select an option.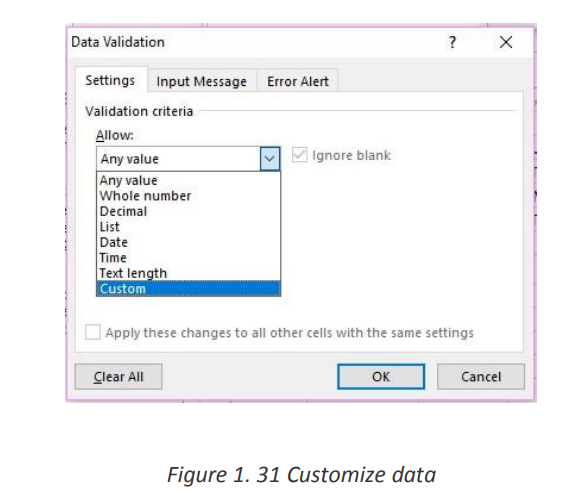
4. Under Data, select a condition:
5. On the Settings tab, under Allow, select an option: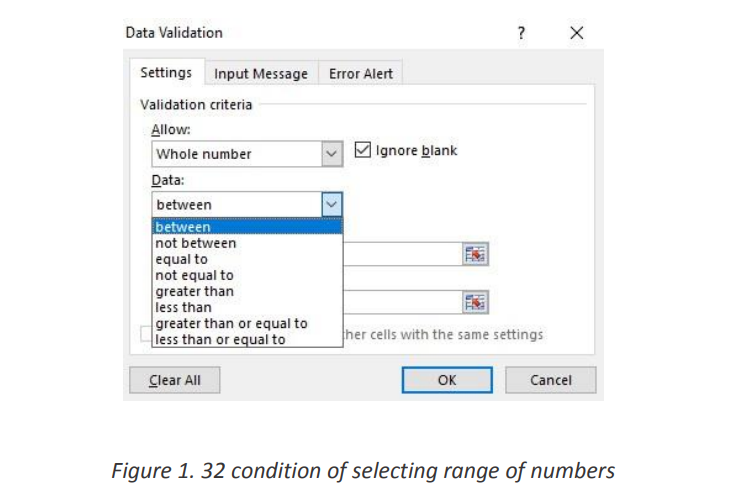
6. Set the other required values, based on what you chose for Allow and Data.
For example, if you select between, then select the Minimum: and maximum:
values for the cell(s)
7. Select the Ignore blank checkbox if you want to ignore blank spaces.
8. If you want to add a Title and message for your rule, select the Input
Message tab, and then type a title and input message.
9. Select the Show input message when cell is selected checkbox to display the
message when the user selects or hovers over the selected cell(s).
10. Select OK.
As an example, let’s make a rule that restricts users to entering a whole numberbetween 1000 and 9999:
With the validation rule configured, either click OK to close the Data Validation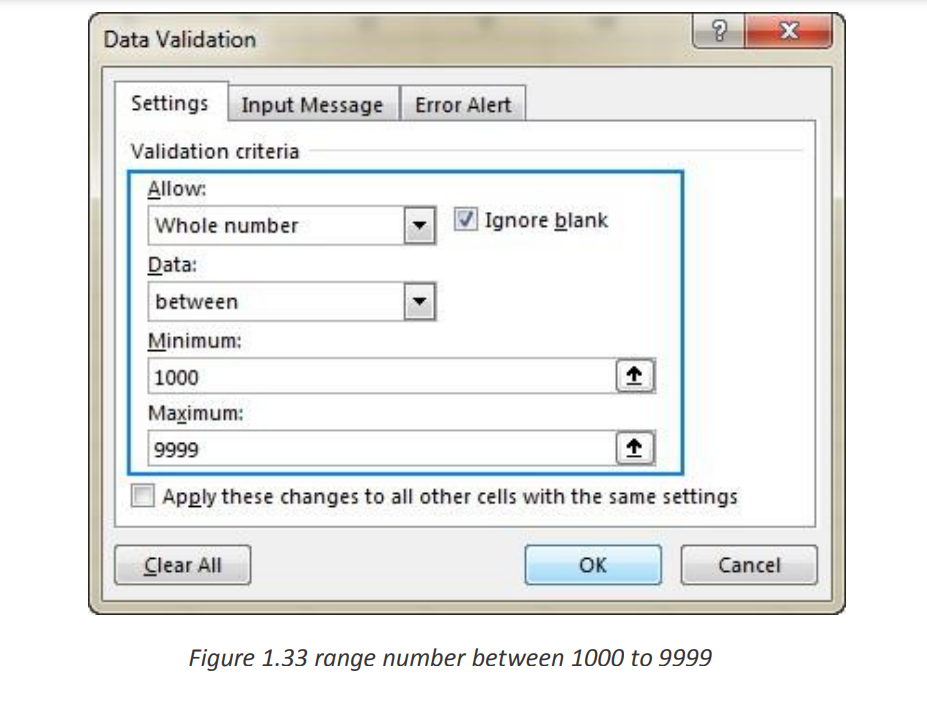
window or switch to another tab to add an input message or/and error alert.
3. Add an input message (optional)
If you want to display a message that explains to the user what data is allowed in a
given cell, open the Input Message tab and do the following:
• Make sure the Show input message when cell is selected box is checked.
• Enter the title and text of your message into the corresponding fields.• Click OK to close the dialog window.
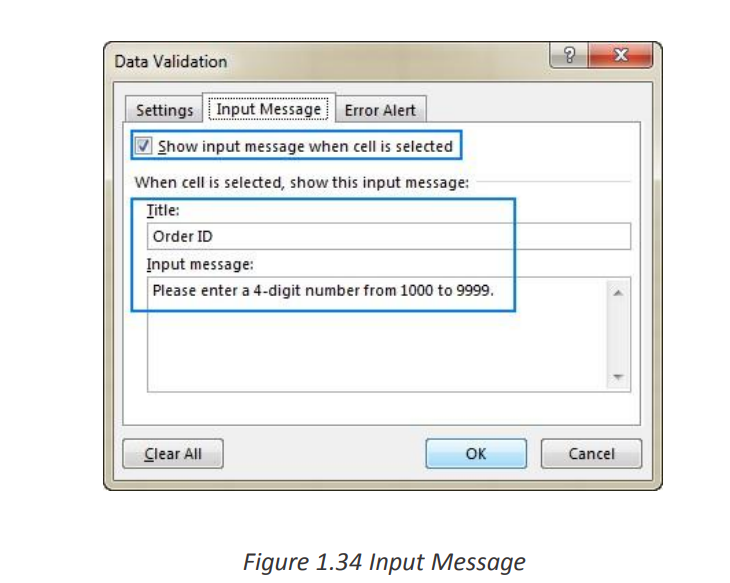
As soon as the user selects the validated cell, the following message will show up:
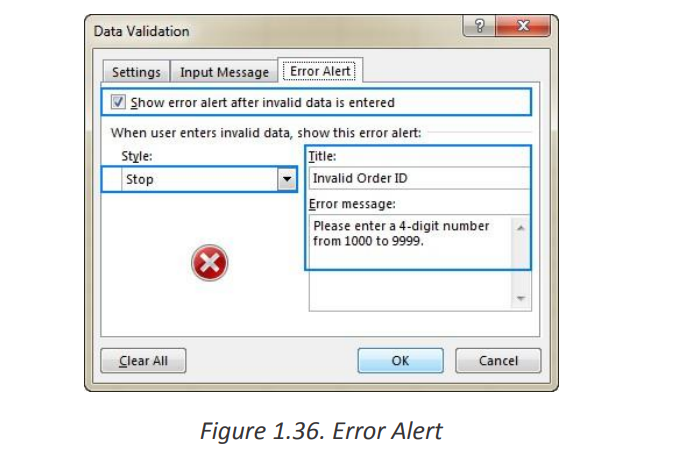
4. Display an error alert (optional)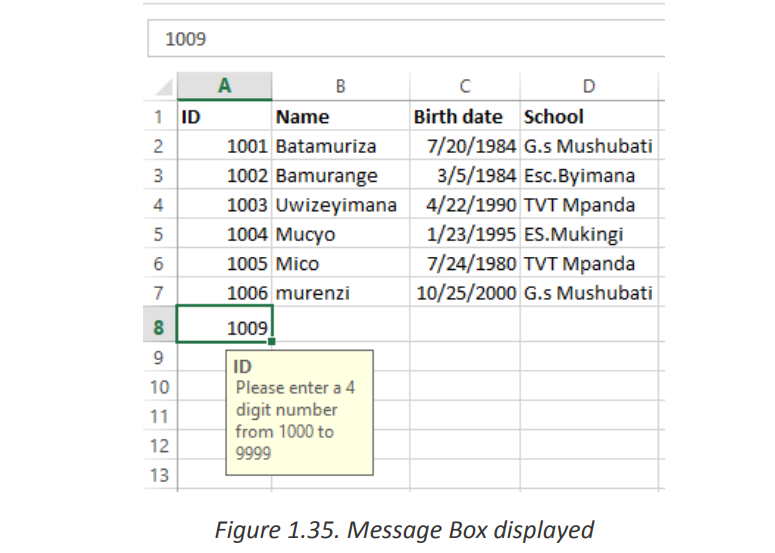
To configure a custom error message, go to the Error Alert tab and define the
following parameters:
• Check the Show error alert after invalid data is entered box (usually
selected by default).
• In the Style box, select the desired alert type.
• Enter the title and text of the error message into the corresponding boxes.• Click OK.
21.5. Using other Excel templates
Microsoft Excel templates are a powerful part of Excel experience and a great way to
save time. Excel templates can also help you create consistent and attractive
documents that will impress your colleagues or supervisors.
Templates are especially valuable for frequently used document types such asExcel calendars, budget planners, invoices, inventories and dashboards.
a. Creating a workbook from an existing Excel template
Instead of starting with a blank sheet, you can quickly create a new workbook based
on an Excel template. The right template can really simplify your life since it makes the
most of tricky formulas, sophisticated styles and other features of Microsoft Excel that
you might not be even familiar with.
To make a new workbook based on an existing Excel template, perform the following
steps.
• Switch to the File tab• Click New
Templates provided by Microsoft displayed.
1.Topreviewa certaintemplate,simply clickonit.Apreviewoftheselected template will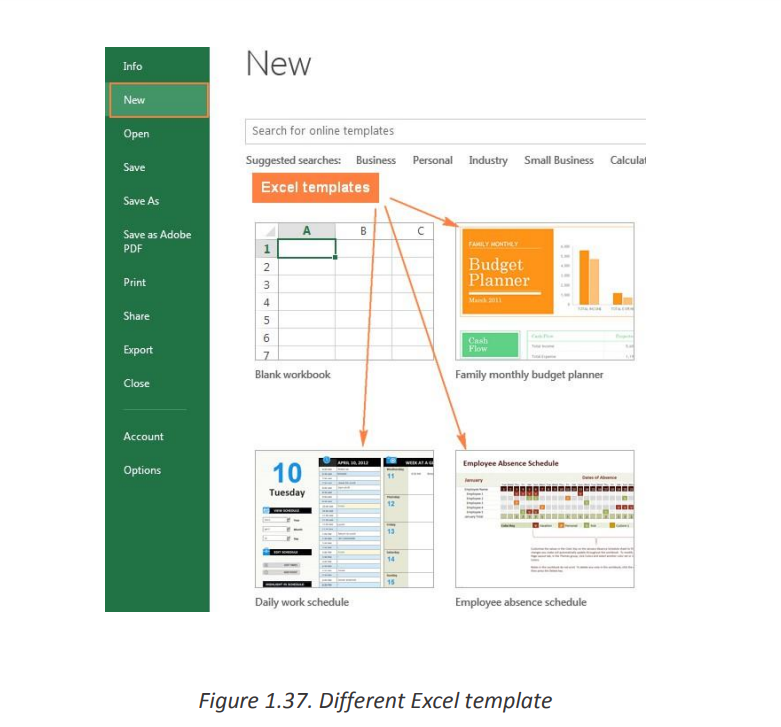
show up along with the publisher’s name and additional details on how to use the
template.
2. If you like the template’s preview, click the Create button to download it.For example, I’ve chosen a nice mini calendar template for Excel:
b. Finding more templates
To get a bigger selection of templates for your Excel, type a corresponding
keyword in the search bar:
That’s it - the selected template is downloaded and a new workbook is created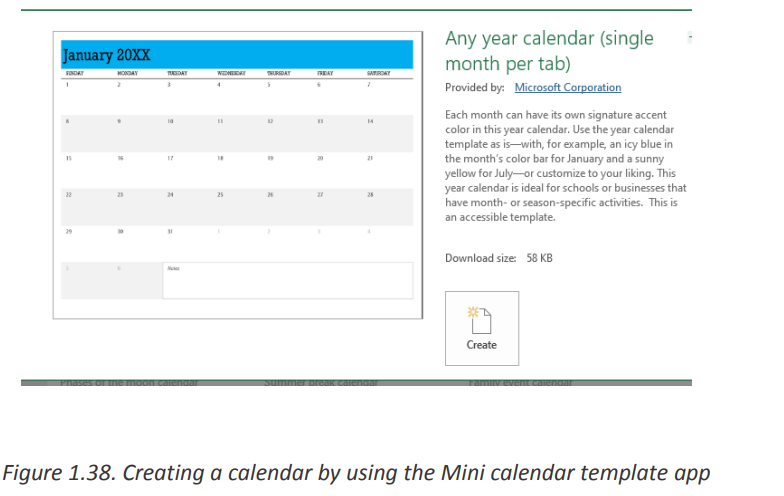
based on this template right away.
b. Finding more templates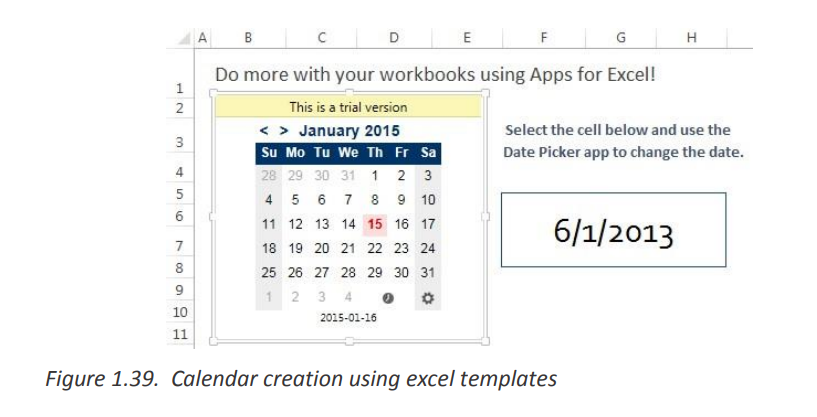
To get a bigger selection of templates for your Excel, type a correspondingkeyword in the search bar:
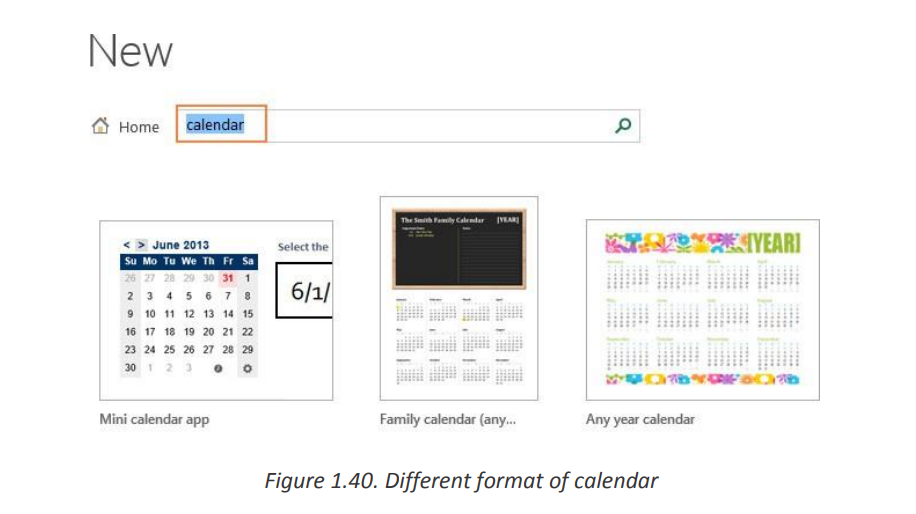
Note. When you are searching for a certain template, Microsoft Excel displays
all relevant templates that are available on the Office Store.
c. Making a custom Excel template
Making your own templates in Excel is easy. You start by creating a workbook in the
usual way, and the most challenging part is to make it look exactly the way you want.
It is definitely worth investing some time and effort both in the design and contents,
because all formatting, styles, text and graphics you use in the workbook will appear
on all new workbooks based on this template.
In an Excel template, you can use save the following settings:• The number and type of sheetsNote: Once you’ve created the workbook, you just need to save it as a .xlt or .xltx
• Cell styles and formats
• Page layout and print areas for each sheet
• Hidden areas to make certain sheets, rows, columns or cells invisible
• Protected areas to prevent changes in certain cells
• Text that you want to appear in all workbooks created based on a given
template, such as column labels or page headers
• Formulas, hyperlinks, charts, images and other graphics
• Excel Data validation options such as drop-down lists, validation messages
or alerts, etc.
• Calculation options and window view options.
• Macros and ActiveX controls on custom formsfile (depending on which Excel version you use) instead of usual .xls or .xlsx.
If you need the detailed steps, here you go:
• In Excel 2019,2016,2013, click File
• In the Save As dialogue, in the File name box, type a template name.
• Under Save as type, select Excel Template (*.xltx) if you are using Excel
2019,2016,2013, 2010 or 2007. In earlier Excel versions, select Excel 97-2003Template (*.xlt).
If your workbook contains a macro, then choose Excel Macro-EnabledTemplate (*.xltm).
When you select one of the above template types, the file extension in the File
Name field changes to the corresponding extension.
1.Click the Save button to save your newly created Excel template. Where to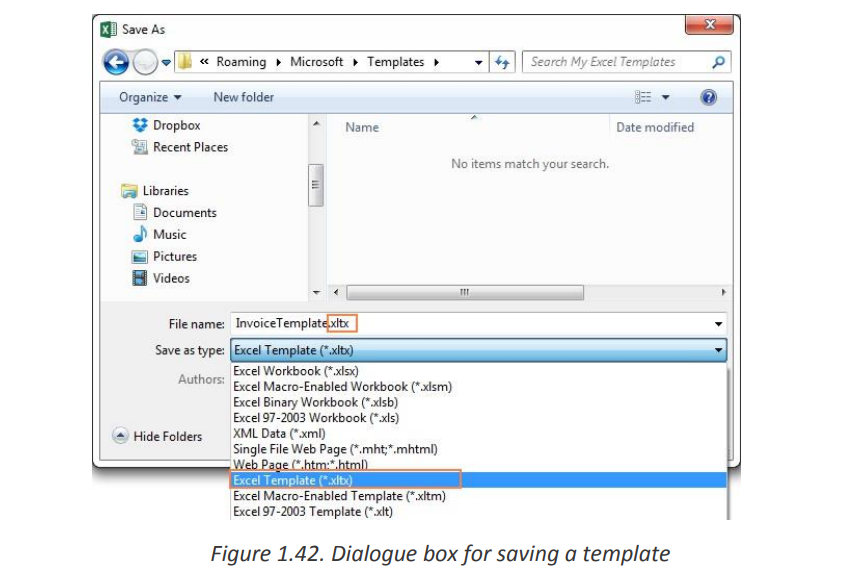
download Excel templates
As you probably know, the best place to look for Excel templates from Microsoft
Office website ( w w w . Office. com). Here you can find a great lot of free Excel
templates grouped by different categories such as calendar templates, budget
templates, invoices, timelines, inventory templates, project management templatesand much more.
Figure 1.45. Download a template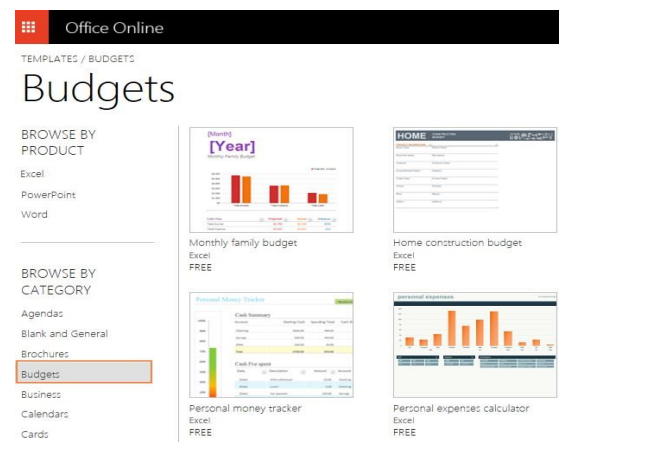
To download a particular Excel template, simply click on it. This will display a briefdescription of the template as well as the Open in Excel Online button
 Files: 3URLs: 2Assignments: 2Quizzes: 2
UNIT2: ADVANCED POWER POINT
POINT 2.0 INTRODUCTORY ACTIVITY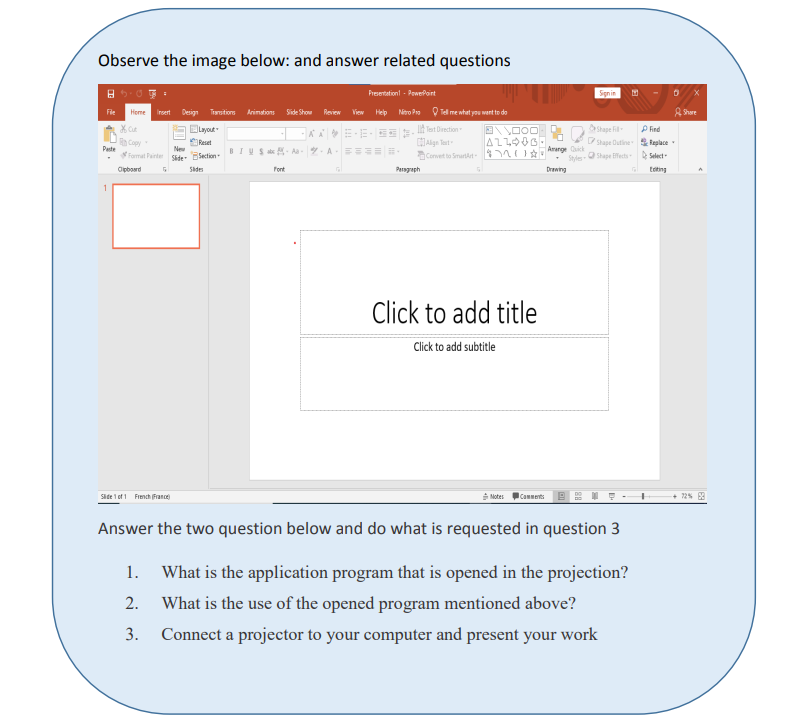 2.1. Create and Manage Presentations
 A presentation is an organized report or message prepared as a talk before anaudience, with the help of a computer program.A presentation software is a program used to create slide shows for presentation onscreen to an audience. Example of programs/software which can be used to createpresentations are the following:• Harvard Graphics,• Corel Presentations,• Lotus Freelance Graphics• Microsoft PowerPointThe role of Presentation applications is to help the presenter convey the messageeasily.Microsoft PowerPoint is presentation software commonly used when planning to givea talk as a presentation. The purpose of the talk may be to inform, create awareness,present strategies or to sell a product or service.A PowerPoint presentation is made by slides and it can be done on computer screenif the audience is very small and if the audience is large the computer can beconnected to a projector that projects the image onto a large screen or a wall.2.1.1 Starting PowerPoint PresentationTo start Microsoft PowerPoint 2013, 2016 & 2019 go through these steps:• Click to the start icon• Select and click on PowerPoint 2013 located on the startup menu• Click on one of the PowerPoint templates.In the new slide write the slide title and write the content in the appropriate zone.Here click on Blank Presentation. The PowerPoint screen appears as in the imagebelow:
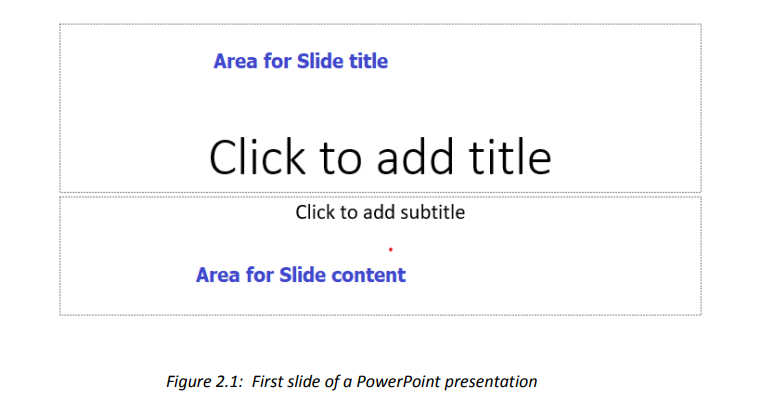
Resize the writing zones accordingly to make the title area small and the content area
bigger.
2.1.2 Creating and inserting a slide in a presentation
The opened PowerPoint presentation has now one slide and each slide has to have its
title set and have the content. Once this is finished a need to have more slides may
arise. To create a slide in an existing presentation, click on the Insert tab then click on
New Slide then choose the slide theme to apply.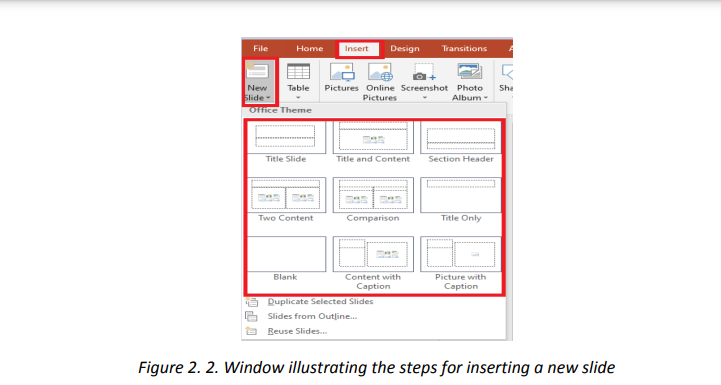
A new slide can also be inserted by selecting the slide behind which a new one is to
be inserted and hitting the Enter key.
The created presentation will be saved by clicking on the Save icon then choose thelocation where to save and specifying the name of the presentation.
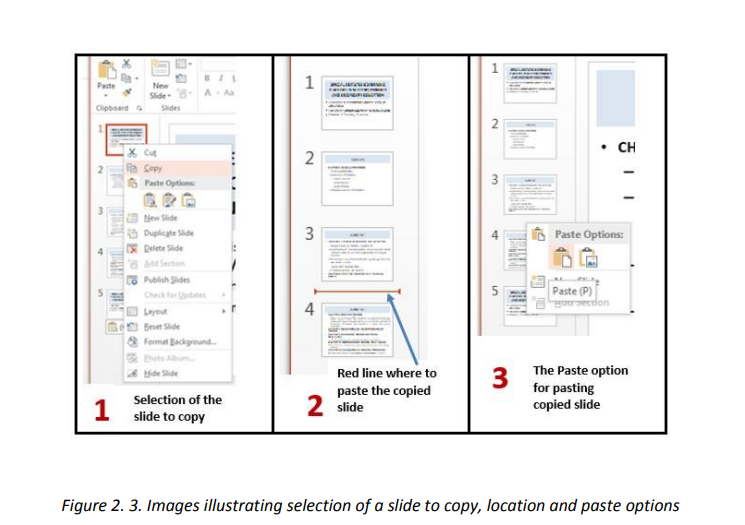
2.1.3 Copying a slide
A slide can be copied in the same presentation or copied to a new presentation in
order to avoid rewriting that presentation from scratch.
To copy a slide, do the following:
• Open the presentation containing the slide to copy
• In the left pane outlining the slides select the slide to copy
• Do a Right click and click on copy
• In the left pan click in the location where to put the copied slide so as to havea red line and do a right click and click Paste
2. 2. Managing Slides
Once the slides are created, one needs to know how to manipulate them by hiding
some slides, moving in slides, rearrange slides, delete some slides, dividing slides intosections, etc.
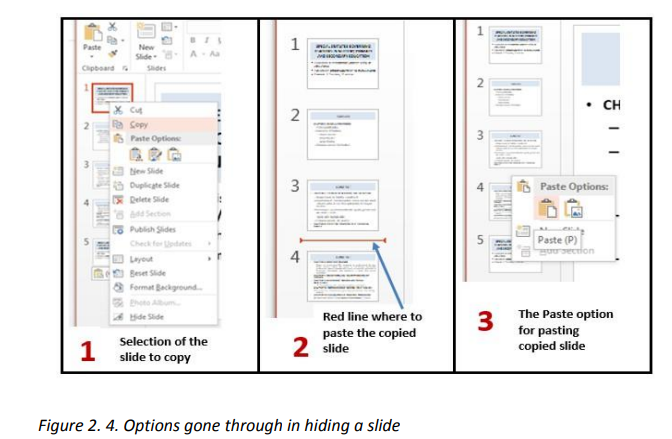
a. Hiding a slide
When a slide is not currently needed it can be hidden by selecting it then doing a Right
click and clicking on Hide Slide. The hidden slide will continue to appear in the slide
pane and can be opened by double clicking it but it won’t appear if the presentation
is opened in the Slide Show mode. To unhide the hidden slide go through the sameprocess.
b. Moving in slides
A slide that will be displayed on the computer screen or on the projector is the onewhich is selected.
In the Normal view to move from one slide to another use the Arrow keys found on
the keyboard. The Up key will move to the previous slide while the Down key will
move to the next slide. One can go to any slide without needing to serially go through
all slides by just clicking the slide to go to.
In the Slide Show view also use the same keys but not that the Escape Key can be used
to end the presentation in the Slide Show View mode and switch to the Normal view.Once the last slide is reached hitting the Down key will switch to the Normal View.
c. Rearranging slides
Slides are not stationary, they can be moved and rearranged making for example the
first slide be the third. To rearrange slides, select the slide, hold down the left buttonand move the slide by moving the mouse up or down.
d. Deleting slides
A slide that is no longer needed can be completely deleted by selecting it and hittingthe Delete key or selecting that slide, doing a Right click and clicking on Delete Slide.
e. Dividing slides into sections
Sections are subdivisions in a PowerPoint presentation slides used preferably for
bigger presentations that can be logically grouped. Slides in the same group should
be logically related so as to facilitate their understanding during presentation or while
reading them.
Putting slides into sections can also be done when slides are to be presented by
different people thus each person presents his/her section.
• Creating a section
To create a section in a PowerPoint presentation, do the following:1. Select in between the slides where to insert the section or the slide
behind which to insert the section
2. Do a right click and click on Add Section in the provided options
3. Rename the section by selecting it and clicking on Rename. The default
name of a section is Untitled Section.4. Write the new name and click Rename
A created section can be removed by selecting it, doing a right click and choosing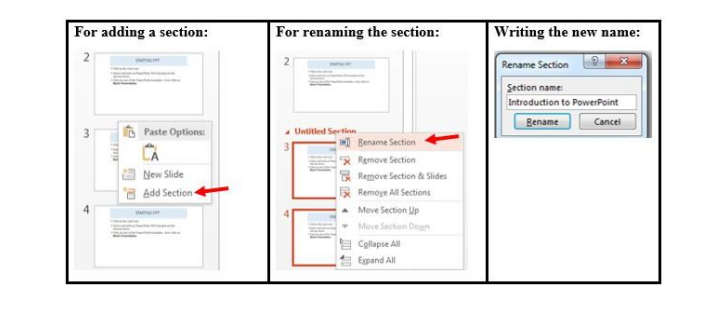
Remove Section. It can be moved by choosing the Move Section Up or Move Section
Down option.
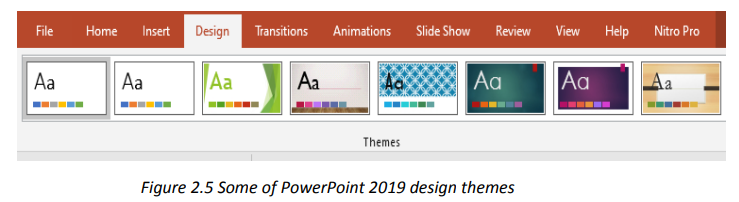
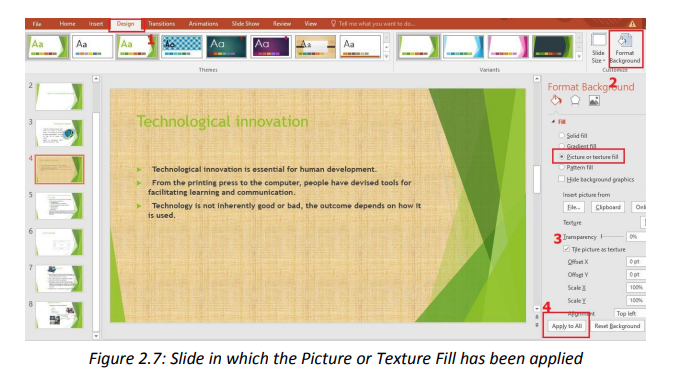
2.3. Apply Design Themes and Format Background
a. Design theme
PowerPoint provides a variety of design themes which are predefined colors, fonts
and visuals that can be applied to slides to make them have a beautiful look withoutThe Themes gallery can be reached by clicking the DESIGN tab and themes willdoing a lot of formatting work.
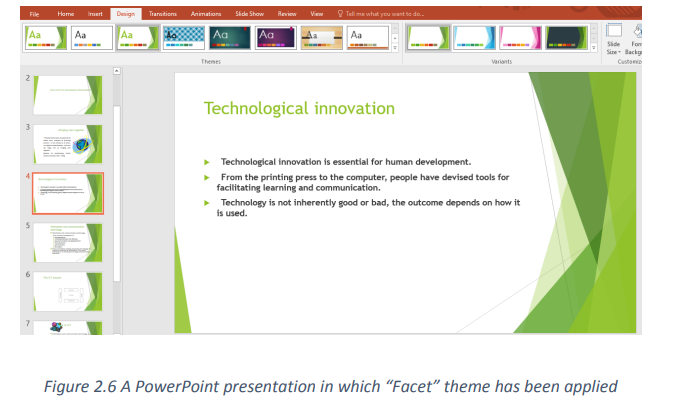
To apply a given theme to a presentation just open that presentation and select theimmediately be viewed.
 b. Format background
desired Theme. In the image below the Theme “Facet” has been applied.
A background is an object which can be just a color, an image behind whatever text,To set a presentation’s background follow these steps:charts, images in a PowerPoint presentation.
• Open the presentation for which the background is to be set
• Under the DESIGN tab Click on Format Background
• Choose o n e o f t h e p r o v i d e d o p t i o n s and customize those optionsaccordingly
 a. Adding comment
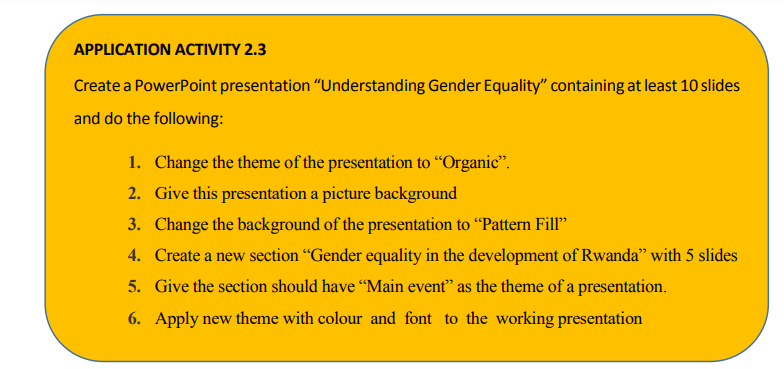
2.4. Adding Notes and Comments, Inserting Header and Footer
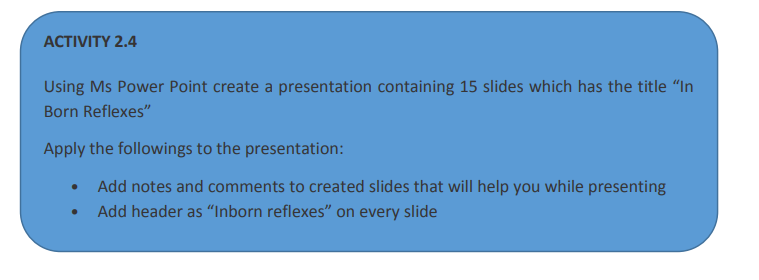
In PowerPoint presentation, a comment is an explanation that is attached to a text
or an object on a slide, or to an entire slide.Step 2. Write the comments in the provided space as visible in the zone No 3 of theTo add a comment in a slide go through the following steps:
Step 1. On the Review tab, click New comment
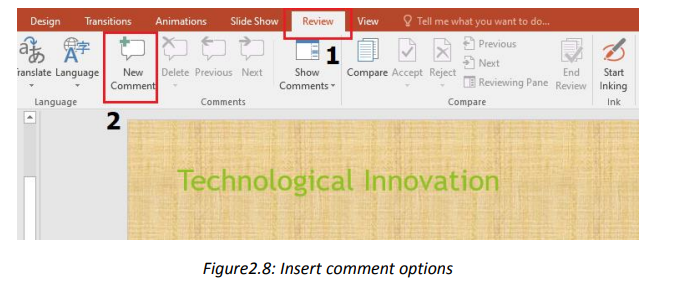
above image
Note: Comments can be added to a PowerPoint presentation by using a simpler
method of clicking at the Comment option located at the bottom middle of an openedPowerPoint window.
b. Adding notes
In a PowerPoint presentation Notes are words/text added to a presentation as
reference and only visible to the one presenting the slides. They serve as additional
information for the presenter that can be read for guidance as the presentation goesTo add notes to a presentation, do the following:on.
1. On the View menu, Click Normal
2. Select the thumbnail of the slide to add notes to
3. The notes pane will appear under the slide. Click where it says Click to addnotes and type whatever notes depending on your choice
Note: A simple way to add notes is to use the Notes option located at the bottom middle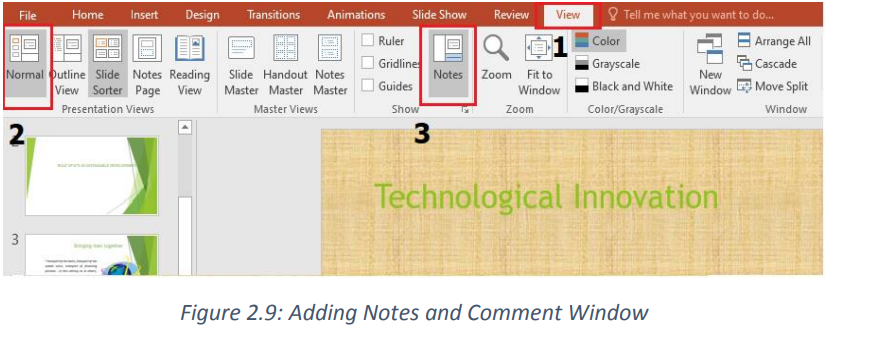
of an opened PowerPoint window
c. Insert header and footer
Header and footer in a presentation is the top and bottom parts of the slides. These
include the slide number, text footer and date.
To add a header or footer follow these steps:1. Click Insert then go to Header & Footer
2. In the box below Footer, type the text to use as footer such as the
presentation title
3. Check Date and time to add that to the slides
4. Check Slide number to add to the created slidesa. Inserting pictures5. Click on Apply or Apply to all if all slides are to have the same header orfooter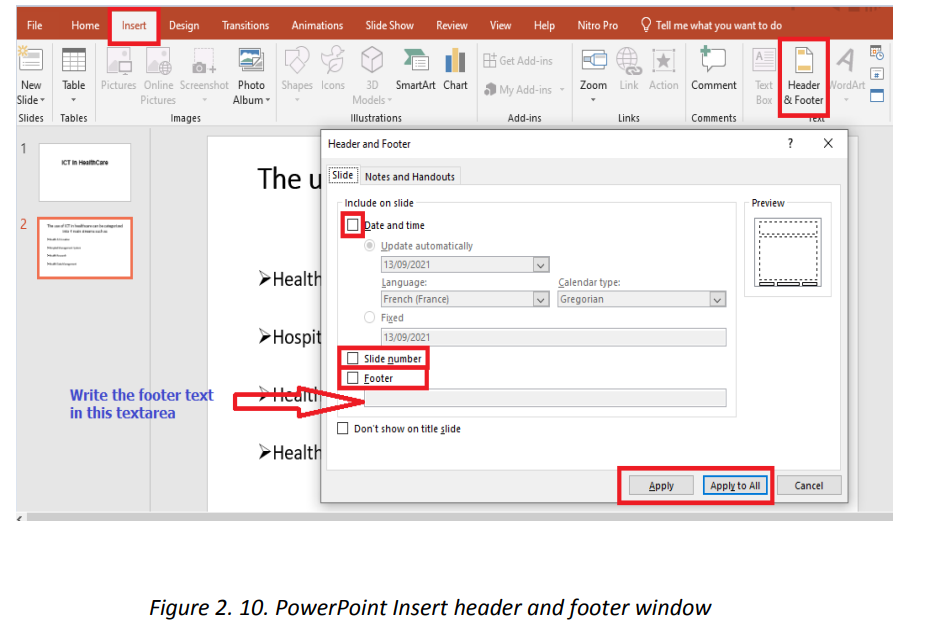
 2.5. Add Sound and Animation to Slides
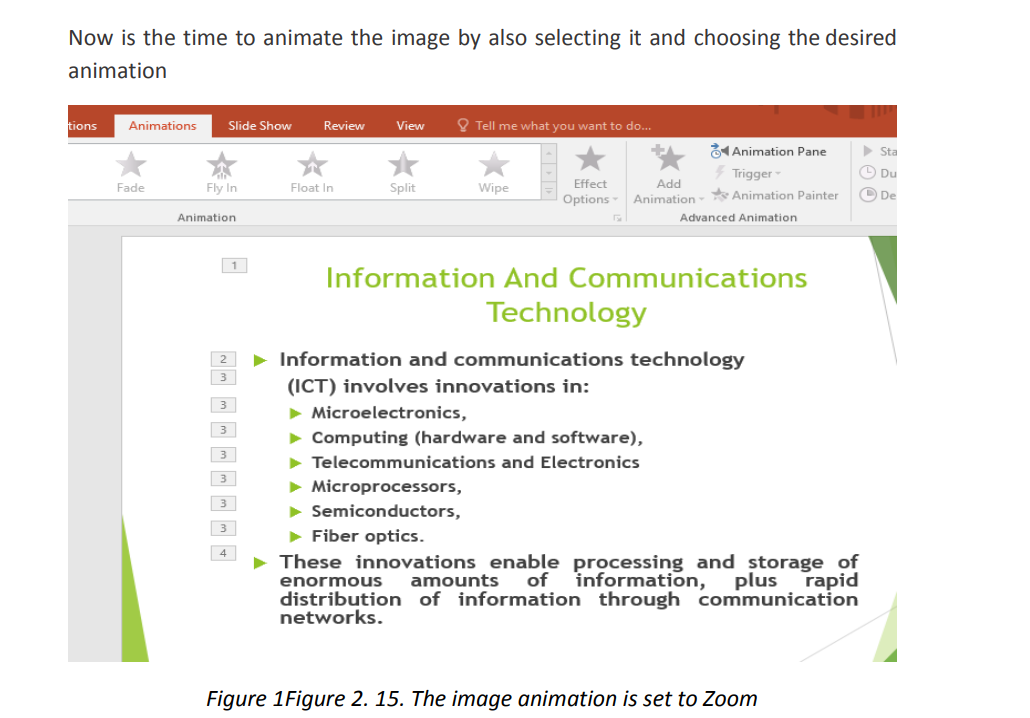
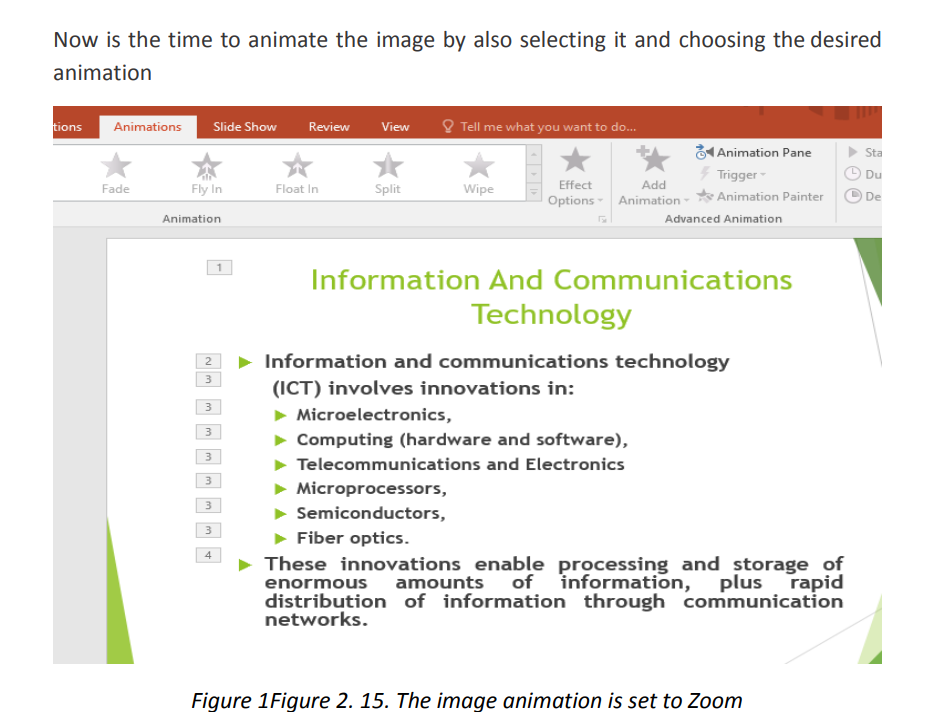
 2.5.1. Animate text and picture in slidesIn PowerPoint, it is possible to animate text and objects such as clip art, shapes andpictures on the slide. Animation or movement on the slide can be used to draw theaudience’s attention to specific content or to make the slide easier to read.
To insert pictures in a slide, select the Insert tab, and then click the Pictures command.
Browse where the images are located and select one image and click Insert.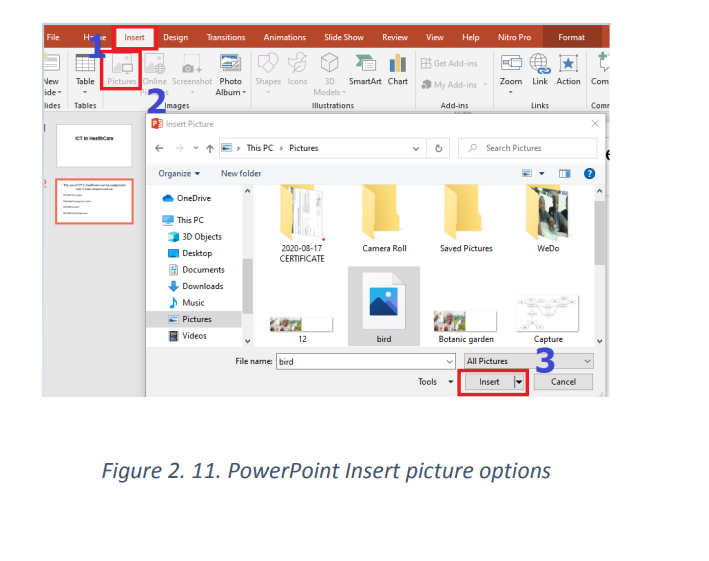 \
\
b. Animating a text or a picture.
When a text is written in a slide or an image inserted they can be animated using the
options available in PowerPoint. There are many types of animations available and
each is used for different reasons like making the message come to the screen in a
certain way (entrance animation) or bringing an emphasis to that message (emphasis
animations). The image below shows some of the animations available in PowerPoint2013.
For animating a text or an image do this: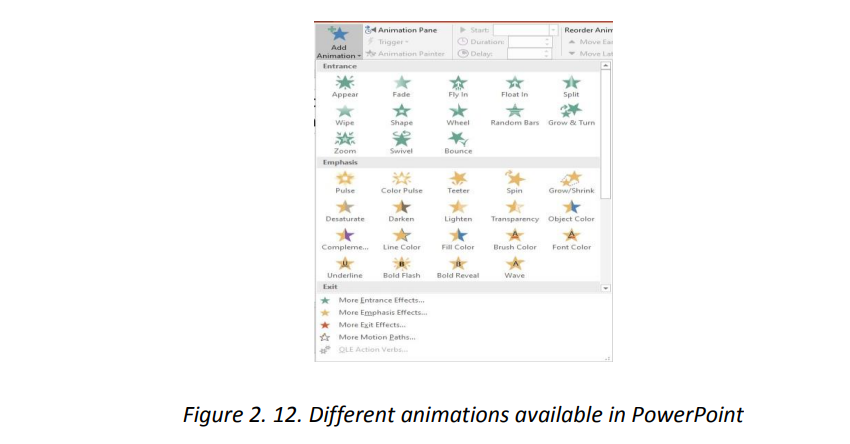
a. Select the text or picture to animate
b. In the Animation tab choose one of the available options like Float In, Split,
etc. The selected animation is immediately applied
In the next images below the title has been animated with “Fly In” animation, the text
is animated with “Split” and the image is animated with “Zoom”. When the whole
slide is opened in Slide Show mode each element has its own animation which helps
attract more the attention of the audience.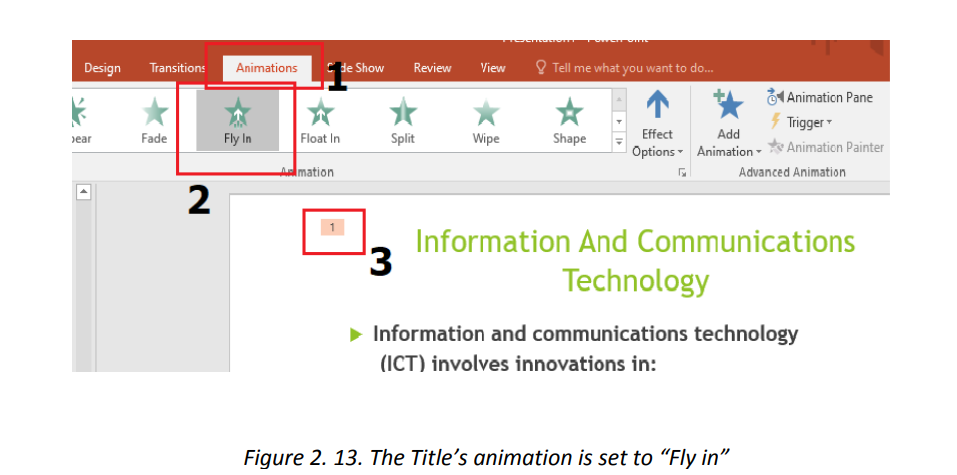 PowerPoint allows to use images, audio and video to have a greater visual impact.
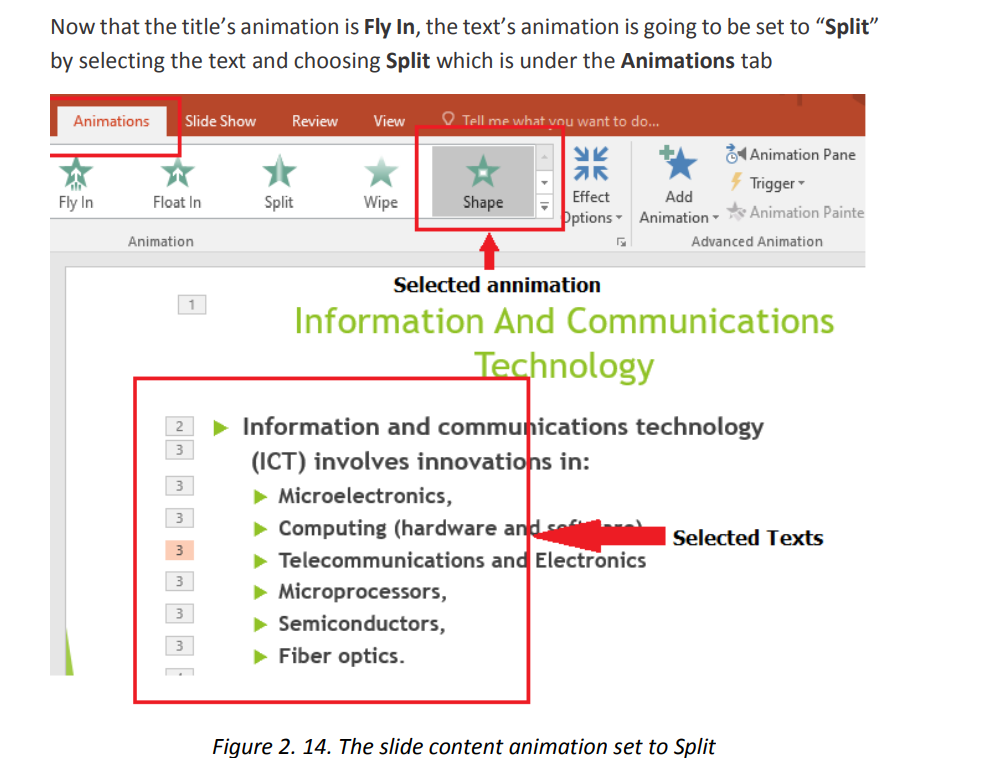
 Opening the above animated slide in Slide show mode will look like in thesequenced images below:
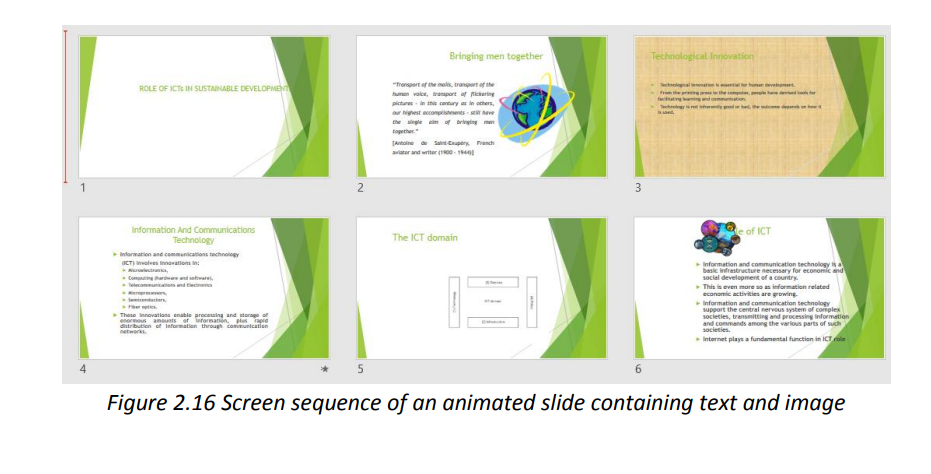 Interpretation :the above animated slide when opened in Slide view mode will show inthis way:a. A blank black screen will open and rapidly the black color will cede place tothe white background of a normal documentb. The text in the slide will come from left and right to meet in the middle c.The image will appear as a small image that will grow from the centerc. The title of the slide will appear from the bottom of the slide, slidingupwardB.1. Setting the delay of an animationThe default duration of a text or image animation can be changed to make theanimation slower or quicker. The delay cannot be greater than 59 seconds. To seta delay click on Animations tab and in the Timing group specify the duration and thedelay.
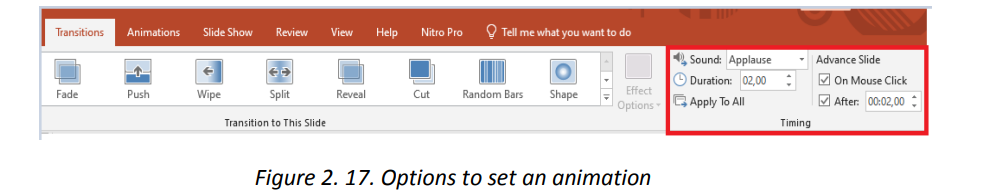 c. Customize animation effectsIt is possible to apply multiple animation effects to a text, an image or a picture. Whenworking with multiple animation effects, it helpsto work in the Animation Pane, wherea list of all the animation effects for the current slide is displayed.
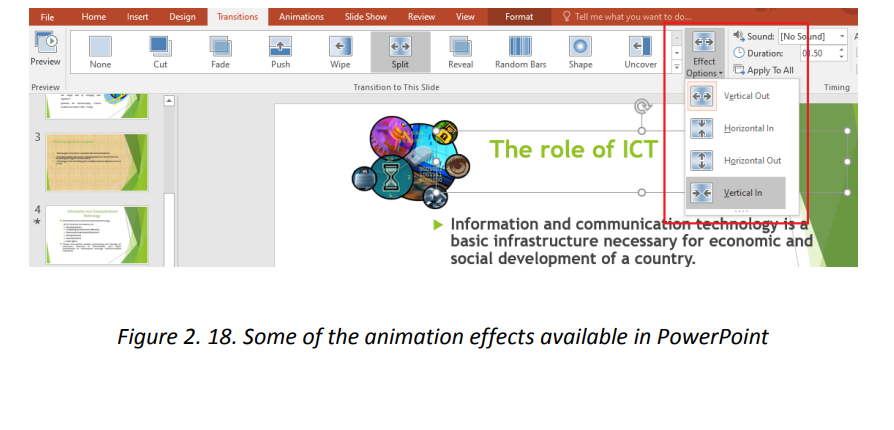
2.6 Add audio and Video Content to Slides
These visual and audio cues may also help a presenter be more improvisational andAnimation applied to text or objects in a presentation gives them sound or visualinteractive with the audience.
effects, including movement. It is possible to use animation to focus on important
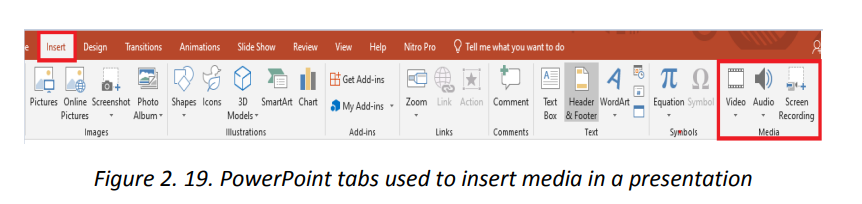
points, to control the flow of information, and to increase viewer interest in aa. Inserting an audio or a videopresentation.
To insert an audio or a video do the following:
1. On the Insert tab click on Media
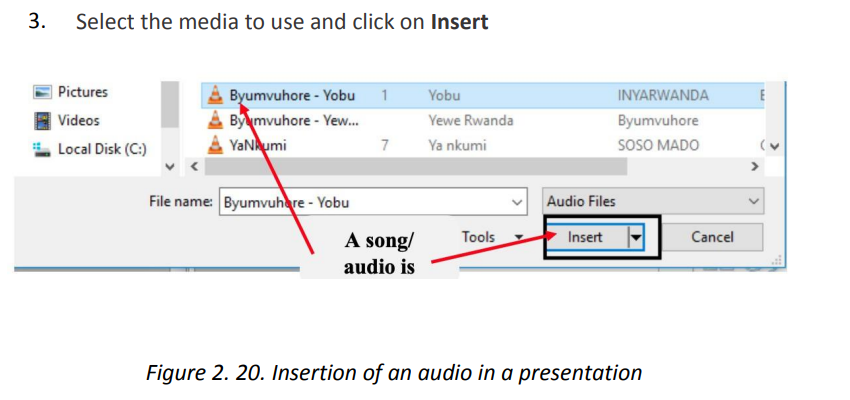
2. Choose the media to use which can be a video, an audio or a recording
which is taken using a computer
Browse the location where the audio or video to insert is located.
 c. Inserting a screen capture
The slide where audio has been inserted will have a graphic as shown in below. Playusing the media buttons displayed.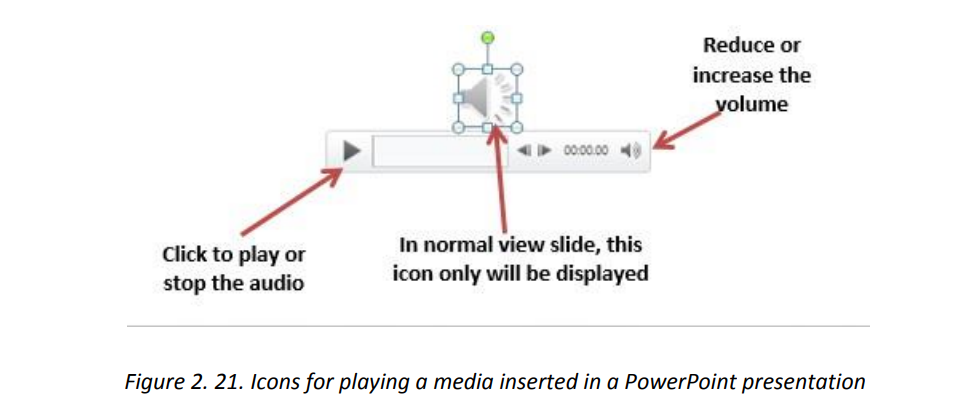 A media inserted in a PowerPoint presentation can have the role of providing moreclarification for efficient understanding, it can be the only content in the slide, it canbe a recording of the screen activity when for example one wants to show the steps todo a certain think using a computer. It can also be a readout of the slide’s text.b. Inserting a recordingA recording is taken using the computer microphone and is inserted much the sameway as other audio except that instead of browsing the audio to insert, the audio hasto be recorded. To insert a recording go through the following steps:1. Under the Insert tab click on Media2. Click on Audio then on Record Audio
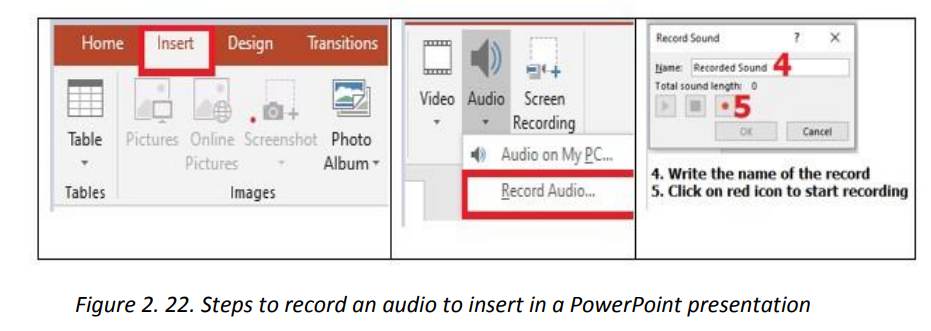 The recorded audio can be set to play as the slide is opened or to play whenclicked on. It can also be trimmed to fit in the desired time frame.To trim the recording:1. Click on the microphone icon then under the Audio tools go to Playback2. Click on Trim audio then on OK
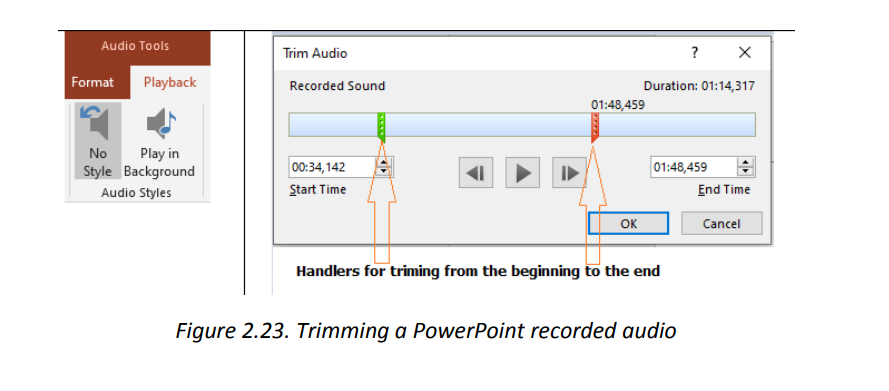
Capturing a screen can be very important for many reasons but the main is when you
want to make an instructional video that shows the steps that are being done on thescreen. This can be combined with capturing an audio describing what is being done.
Note: Thus, for future student teachers this functionality can prove very useful.
2. Choose among the available options in the dialog box that will appear, clickSteps to capture the screen:
1. Click on Insert then under the Media group go to Screen Recording
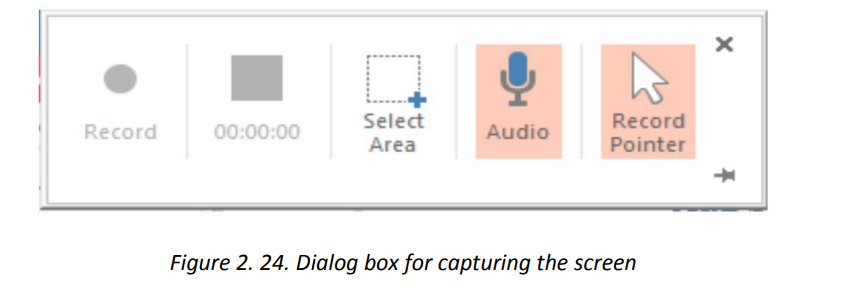
on Select Area to choose which portion of the screen to be recorded and click
on Record
3. To end the recording use the combination keys Window key with shift keyand Q
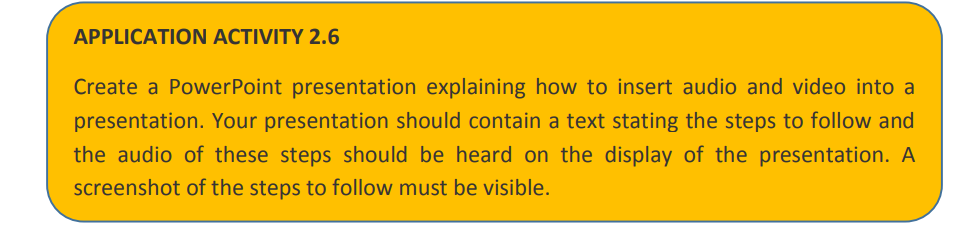 2.7. Slide Transitions
 A slide transition is the visual effect that occurs when moving from one Slide to thenext during a presentation. Hereby one can control the speed, add sound, andcustomize the look of transition effects.a. Types of transitions:In PowerPoint 2019 there are two main slide transitions namely subtle, exciting anddynamic contentIn Subtle transition simple transitions are used to move from one slide to another, forExciting additional visual effects are used to catch the eye of the audience while forDynamic content will move only the placeholders, not the slides themselves.
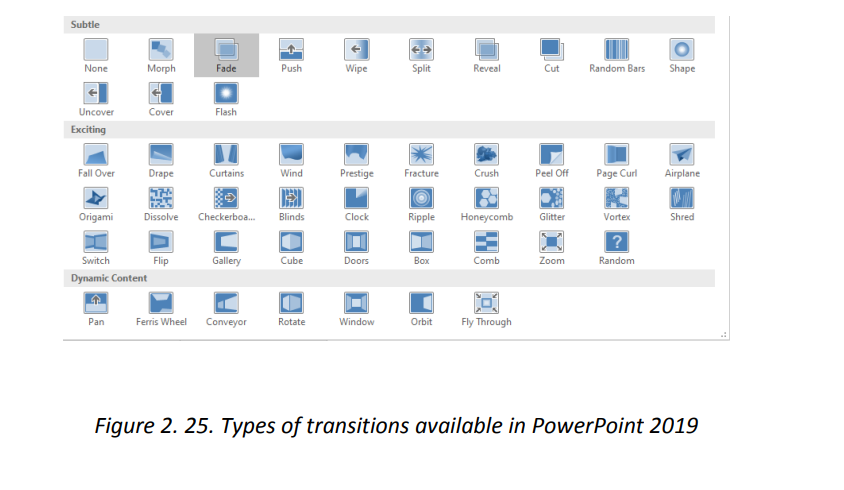 b. Using a transitionTo use the different transitions, do the following:• To select the text or image on which to apply the transitionOnce the transition has been set it can be modified by selecting the text having a• Click on the Transition tab then choose one of the transitions. In the imagebelow the chose n transition is “Dissolve”
particular transition and choosing the new transition to apply. It can also be removedby choosing the None transition.
2.8 Presenting Using PowerPoint
Microsoft PowerPoint can add a visual dynamic to a business meetings and
presentations. The best way to share a PowerPoint presentation with a large group is
to project slides on screen using a digital projector connected to the computer’s videooutput.
a. Presenting using a projector
A projector is an output device that can take images generated by a computer andproduce them by projection onto a screen, wall or another surface.
A projector is connected to the computer through the VGA port but newprojectors and computers can be connected using the HDMI ports
Steps for connecting a laptop to a projector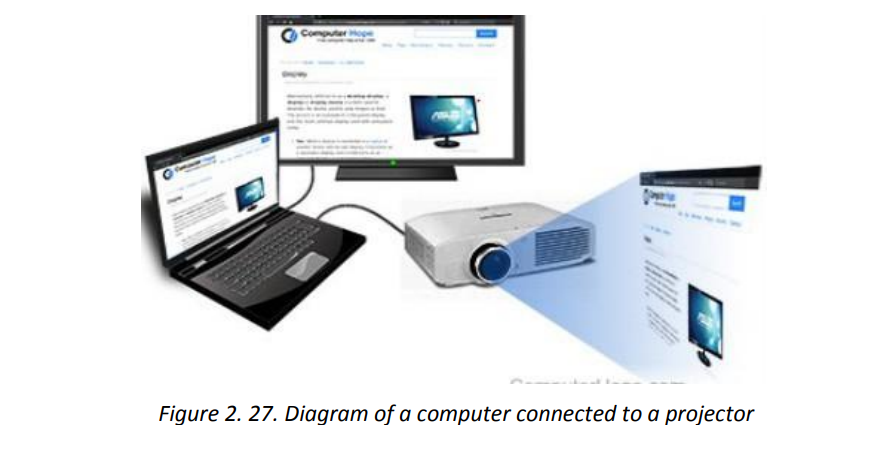
1. Make sure the laptop is turned off
2. Connect the video cable(VGA) from the laptop’s external video port to the
projector
3. Plug the projector into an electrical outlet and press the “power” button to
turn it ON.4. Turn on the laptop
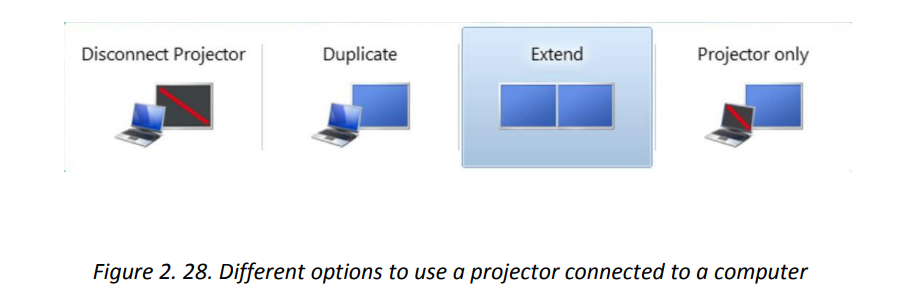
There are different presentation modes while using a computer connected to a
projector. One can use the Projector only, duplicate (both the projector andcomputer), Extend and Disconnect the projector.
b. Printing and distributing handouts
A handout is a piece of printed information provided to the audience so as to give asummarized information on a given topic.
Handouts are distributed to an audience so as to help them follow the presentationand take some notes on what is being presented.
It is a good practice to give the presentations to the audience at the end of the sessionso as to review what was presented to them.
c. Conducting the presentation
When everything is in order; the projector is properly connected and working, the
handouts have been distributed and everyone is properly seated it is then time to startthe presentation.
For a presentation to be effective, the PowerPoint document have to have these
qualities:• Make the PowerPoint presentation short. Slides will contain short and concise
sentences which are bulleted,
• Highlight important points by using animations and transitions wisely not
randomly as these are used with a purpose like attracting attention on certain
section, notifying of the change in the topic, etc
• For long slides provide short partial synthesis to make the audience keep track
of what is so far presented
• Rehearse the presentation and use scripts and notes to help you not forget the
important points to mention
• Be polite and use appropriate language.
UNIT 3: COMPUTER GRAPHICS TOOLS
3.0 Introductory Activity
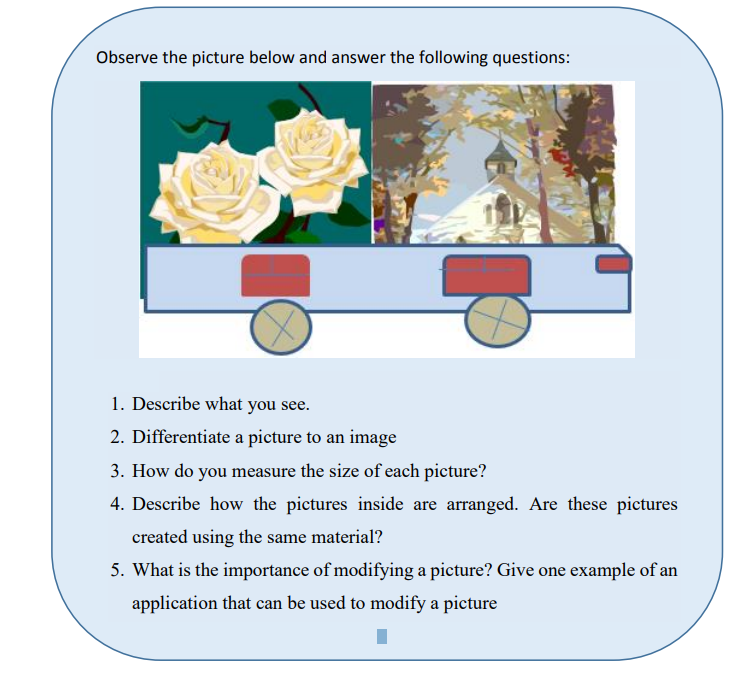
3.1. Introduction to Computer Graphics
Modifying a hard drawing can be hard, swapping colors or resizing a picture on such
a drawing is more complicated. That’s why it is more efficient to draw a picture on a
computer screen and the drawing is now a piece of digital information which is easyto modify.
Computer Graphics involves the ways in which images can be displayed, manipulatedand stored using a computer.
Computer graphics provides the software and hardware techniques or methods forgenerating images.
3.1.1. Definitions of Different Terms
Computer graphic: This is the use of a computer and specialized programs to produce
and manipulate pictorial images.
Pixel: is the smallest unit of a digital image or graphic that can be displayed and
represented on a digital displayed device. Is also known as a picture element. A pixel
can have different colors produced by mixing the three colors RGB (Red, Green and
Blue) and each of the three colors can take values ranging from 0 to 256.
2D (2Dimensional) images are objects that are rendered visually on paper, film or on
screen in two planes representing width and height (X and Y). Two-dimensionalstructures are also used in the construction of 3D objects.
3D computer graphics or three-dimensional computer graphics, (in contrast to 2D
computer graphics) are graphics that use a three-dimensional representation of
geometric data (often Cartesian) that is stored in the computer for the purposes ofperforming calculations and rendering 2D image.
Morphing: is a technique which involves using a computer to make an image on film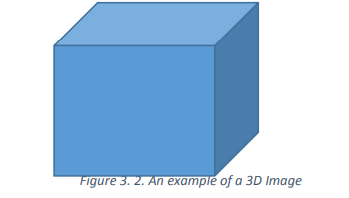
or television appear to change shape or change into something else. For example a
human face may be transformed into a lion one and the human eye will find it
unbelievable how the human has changed him/herself.
Random scan:
Random Scan System uses an electron beam which operates like a pencil to create a
line image on the CRT (Cathode Ray Tube) screen. The picture is constructed out of a
sequence of straight-line segments. Each line segment is drawn on the screen by
directing the beam to move from one point on the screen to the next, where its x & y
coordinates define each point. After drawing the picture. The system cycles back to
the first line and design all the lines of the image 30 to 60 time each second.
The process is shown in figure: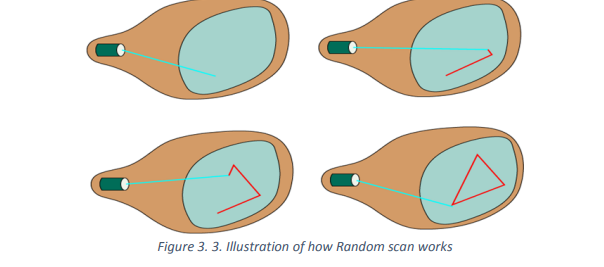
Source: : https://www.javatpoint.com/
Raster scan
A raster scan display is based on intensity control of pixels in the form of a rectangular
box called Raster on the screen. Information about On and Off pixels is stored in a
refresh buffer or Frame buffer. Televisions in homes are based on Raster Scan
Method. The raster scan system can store information of each pixel position, so it is
suitable for realistic display of objects. Raster Scan provides a refresh rate of 60 to 80
frames per second.
Frame Buffer is also known as Raster or bit map. In Frame Buffer the positions are
called picture elements or pixels. Beam refreshing is of two types. First is horizontal
retracing and second is vertical retracing. When the beam starts from the top left
corner and reaches the bottom right scale, it will again return to the top left side called
at vertical retrace. Then it will again more horizontally from top to bottom. The figure
below illustrates the process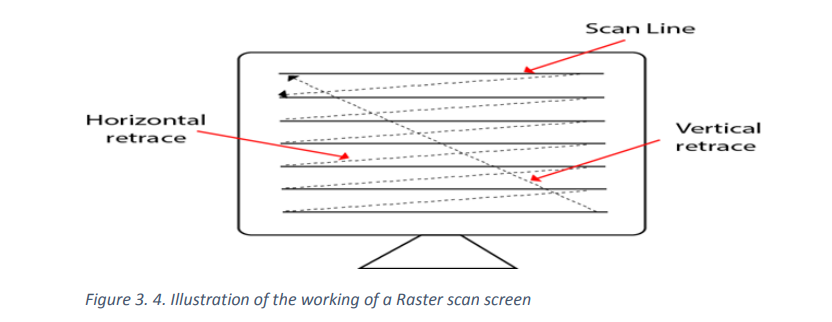
3.2.1. DEFINITION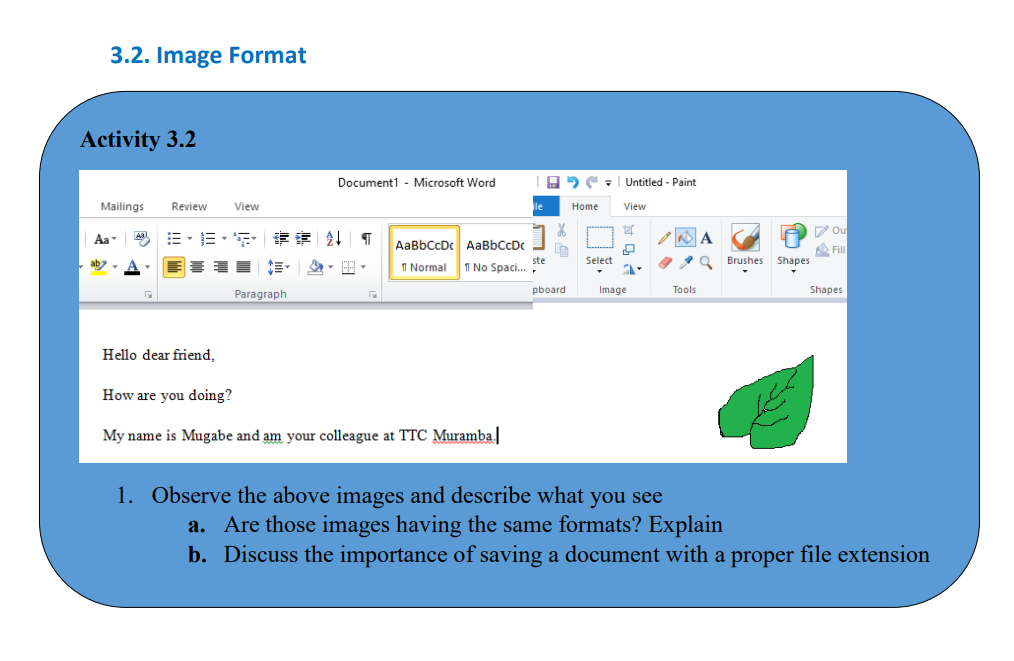
Image file formats are standardized means of organizing and storing digital images.
Image files are composed of digital data in one of the formats that can be rasterized
for use on a computer display or printer.
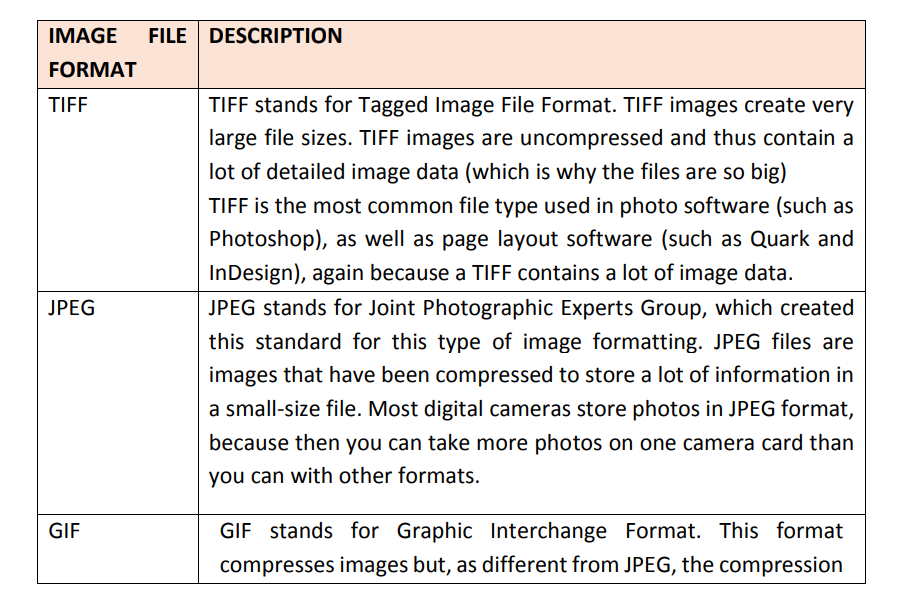
There are 4 main formats in which to store images including TIFF, JPEG, GIF and PNG.Their differences are given in the table below:
3.2.2 Image compression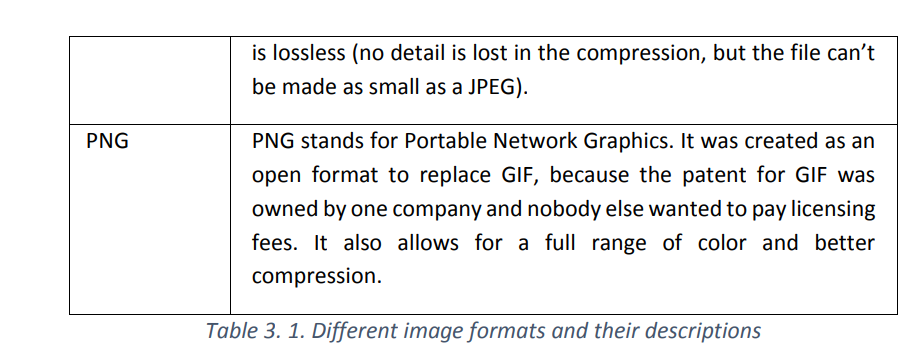
Image compression is minimizing the size in bytes of a graphic file without degrading
the quality of the image to an unacceptable level. The reduction in file size allows
more images to be stored in a given amount of disk or memory space. It also reduces
the time required for images to be sent over the Internet or downloaded from web
pages. Know an image’s file size and dimensions before or after uploading it into theLibrary
Image compression techniques Lossy and Lossless
Lossless: The compression technique where compressed data (byte) will be the same
replica of actual data. In this case, compressed file is required to be reproduced
exactly when get decompressed again.
Lossy: File compression results in lost data and quality from the original version. Lossycompression is typically associated with image files.
3.2.3 Viewing an image’s file size and dimensions
The determination of an image’s file size and dimensions depends on an Operating
System being used.
Open the image in Windows Explorer to check dimensions and file size by clicking the
Windows Start button on the taskbar.
Right clicking the icon of the image file,
In the pop up menu, click on property and details.
The result will look like below. The wanted information are circled with red line.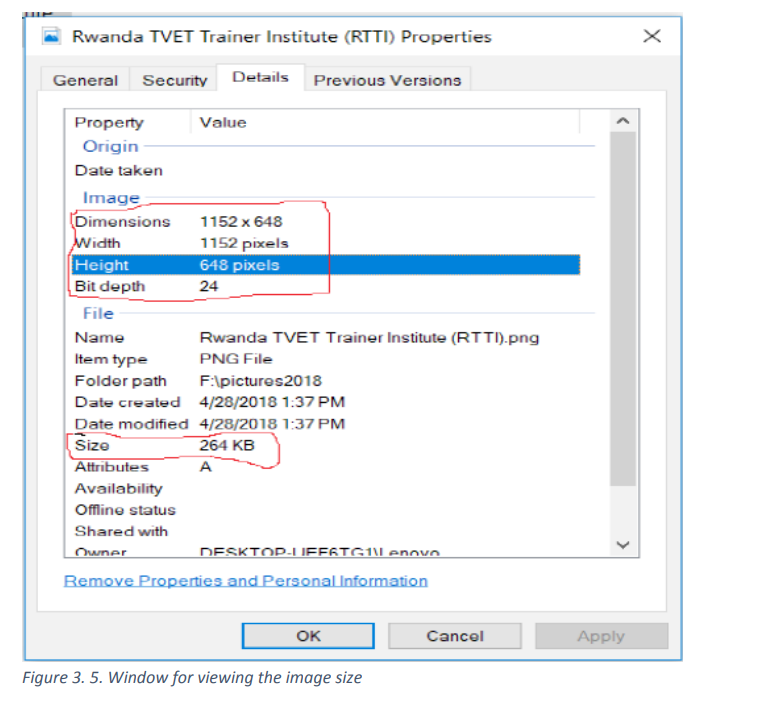
3.2.4 Calculating size of an uncompressed image file
Computer storage and memory is measured in Megabytes (MB) and Gigabytes (GB).
A bit is the smallest unit of measurement used to quantify computer data and byte is
a group of 8 binary digits.
Unit of memory size.
1Byte= 8bits
1KB= 1024Bytes
1MB = 1024 KB
1GB=1024 MB
1TB=1024 GB
It takes 2 to 3 bytes to store one pixel of a color image. The pixels in an image store a
color at a given point in the image, but it takes 2 to 3 bytes of storage to record this
value. If we consider 3 bytes of storage, the file size of a color image is equivalent to:
width * height * 3
Example: Let‘s consider an image whose Width is 1152 and height is 648.
If we consider 3 bytes of storage, the file size of a color image is equivalent to: width
* height * 3 which is =1152*648*3 = 2,239,458 which gives the file size in bytes. This
file size number is so big, it needs to be converted in Kilobytes or even megabytes.
There are 1,024 bytes in a kilobyte and 1,024 kilobytes in a megabyte which makes
this file have the size of 2.187 Kilobytes.
3.3 Image Capturing Tools
The process of obtaining a digital Image from a vision sensor, such as camera usually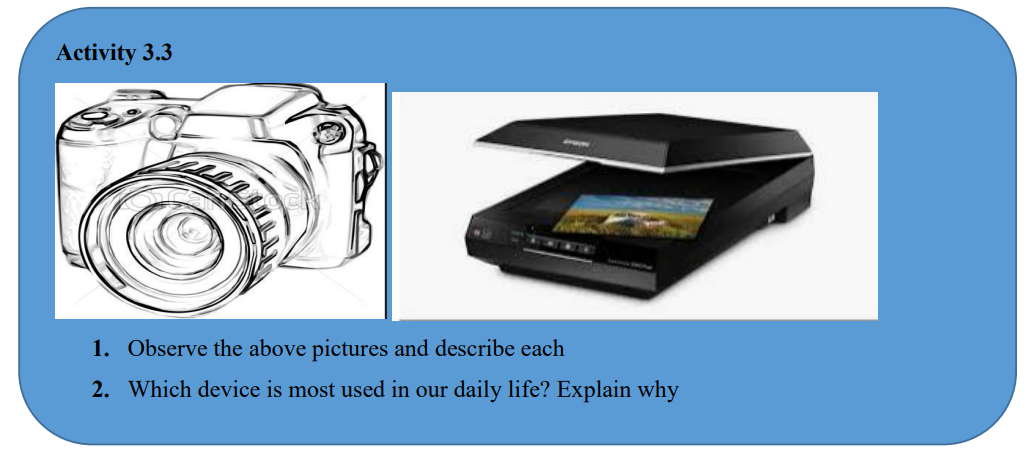
entails a hardware interface known as a frame grabber, which captures single frames
of video, converts the analogue values to digital, and feeds the results into thecomputer memory.
3.3.1. Digital Camera
The first digital camera was invented by STEVEN SASSON in 1975. Digital cameras are
normally used to capture pictures or video through the use of an electronic image
sensor.
There are two types:
3.3.1. Digital Camera
The first digital camera was invented by STEVEN SASSON in 1975. Digital cameras are
normally used to capture pictures or video through the use of an electronic image
sensor.There are two types:
a. Definition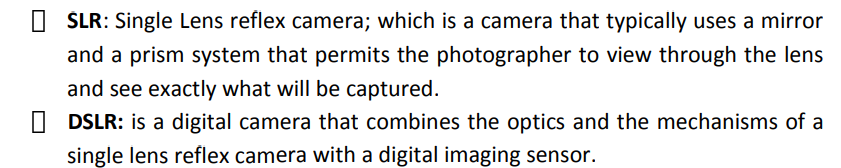
A digital camera is a camera which produces digital images that can be stored in a
computer and displayed on screen. It records and stores photographic images in
digital format.
These stored images can be uploaded to a computer immediately or stored in the
camera to be uploaded into a computer or printed later.Digital cameras use an image sensor instead of photographic film.
Digital camera parts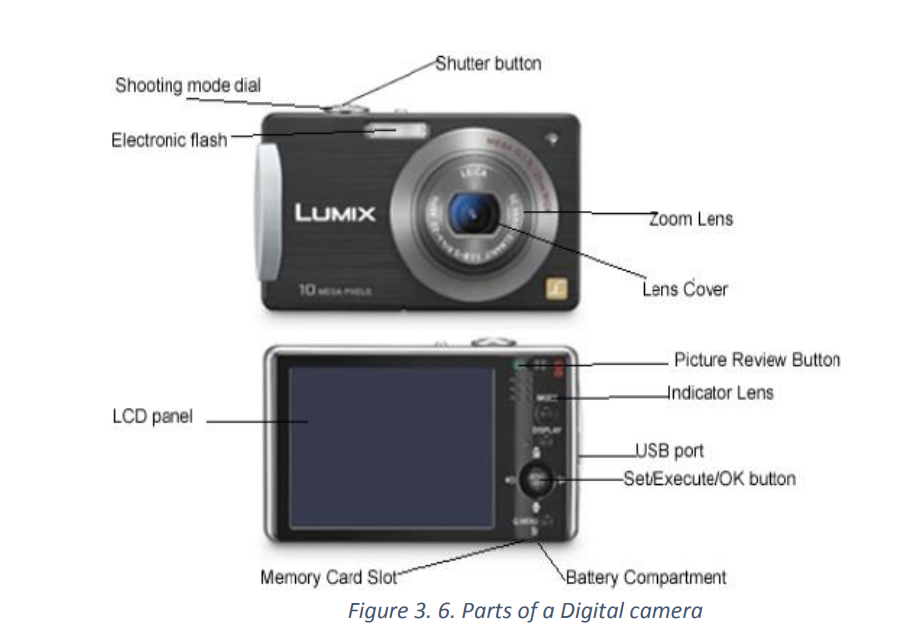
There are 10 basic camera parts to identify in today’s digital world. These parts will
inevitably be found on most cameras being digital compact or single-lens reflex
camera (SLR)
Lens
The lens is one of the most vital parts of a camera. The light enters through the lens,
and this is where the photo process begins. Lenses can be either fixed permanently to
the body or interchangeable. They can also vary in focal length, aperture, and other
details.
Viewfinder
The viewfinder can be found on all digital single-lens reflex cameras (DSLR) and some
models of digital compacts. On DSLRs, it will be the main visual source for image taking,
but many of today’s digital compacts have replaced the typical viewfinder with
Liquid Crystal Display (LCD) screen.
Body
The body is the main portion of the camera, and bodies can be in different shapes and
sizes. DSLRs tend to be larger bodied and a bit heavier, while there are other consumercameras that are a conveniently smaller size and even able to fit into a pocket.
Shutter Release
The shutter release button is the mechanism that “releases” the shutter and therefore
enables the ability to capture the image. The length of time the shutter is left open
Aperture
The aperture affects the image’s exposure by changing the diameter of the lens
opening, which controls the amount of light reaching the image sensor. Some digital
compacts will have a fixed aperture lens, but most of today’s compact cameras have
at least a small aperture range.
Image Sensor
The image sensor converts the optical image to an electronic signal, which is then sent
to the memory card. There are two main types of image sensors that are used in most
digital cameras: Complementary Metal-Oxide-Semiconductor (CMOS) and Charge
Coupled Device (CCD) Both forms of the sensor accomplish the same task, but each
has a different method of performance.
Memory Card
The memory card stores all of the image information, and they range in different size
and speed capacity. Memory cards can be taken out of the camera and inserted in a
computer memory card bay for reading.LCD Screen
The LCD screen is found on the back of the body and can vary in size. On digital
compact cameras, the LCD has typically begun to replace the viewfinder completely.
On DSLRs, the LCD is mainly for viewing photos after shooting, but some cameras dohave a “live mode” as well.
Flash
The on-board flash will be available on all cameras except some professional grade
DSLRs. It can sometimes be useful to provide a bit of extra light during dim, low light
situations.
User Controls
The controls on each camera will vary depending on the model and type. The basic
digital compacts may only have auto settings that can be used for different
environments, while a DSLR will have numerous controls for auto and manualshooting along with custom settings.
c. Importing pictures using USB cable
The images taken by using a camera are stored automatically in its memory. However,
for different purposes, the images can be printed or inserted in documents for
illustrations. The camera is then connected to the printer or the computer by using a
USB cable appropriately designed for such action. The fact of taking pictures from thecamera to the computer is called importing pictures.
The following steps are followed to successfully import a picture from camera to
computer by using a USB cable.
Step 1: Connect one end of the USB cable to the port in your camera.
Step 2: Connect the other end of the USB cable to the USB port in the computer. This
may be in the front or back of the computer.
Step 3: Turn on the camera
Step 4: A dialog box may appear on the screen. If it does, select “View Files” or “Open
Folder.” If the dialog does not appear, click the Windows “Start” menu, select“Computer” and then choose the drive labeled for the connected camera.
The pictures are probably located in a particular photo folder on the camera. Open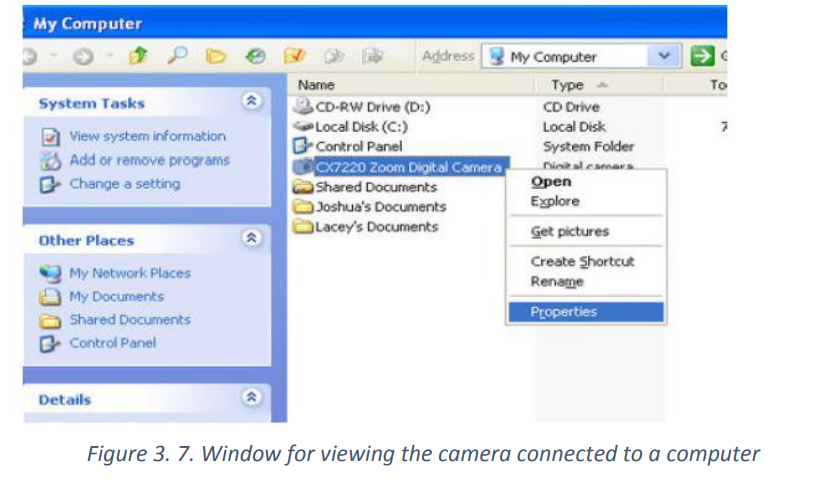
that folder. Drag individual photos from the folder to the desktop or some other folder
on the computer. All the photos can be selected by pressing “Ctrl-A” and then pastedinto a folder on the computer by pressing “Ctrl-V
3.3.2 Scanner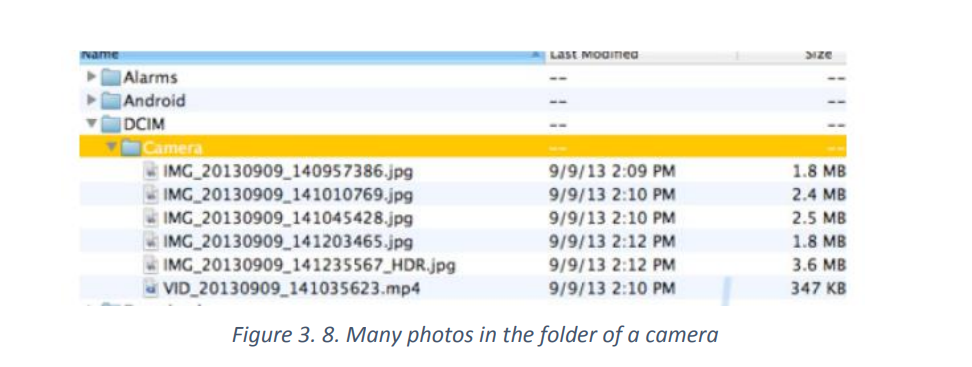
A scanner is an electronic device which can capture images from physical items
(printed text, handwriting, photographic prints, posters, magazine pages, and similar
sources) and convert them into digital formats, which in turn can be stored in a
computer and viewed or modified using software applications.
Very high resolution scanners are used for scanning for high-resolution printing, butlower resolution scanners are adequate for capturing images for computer display.
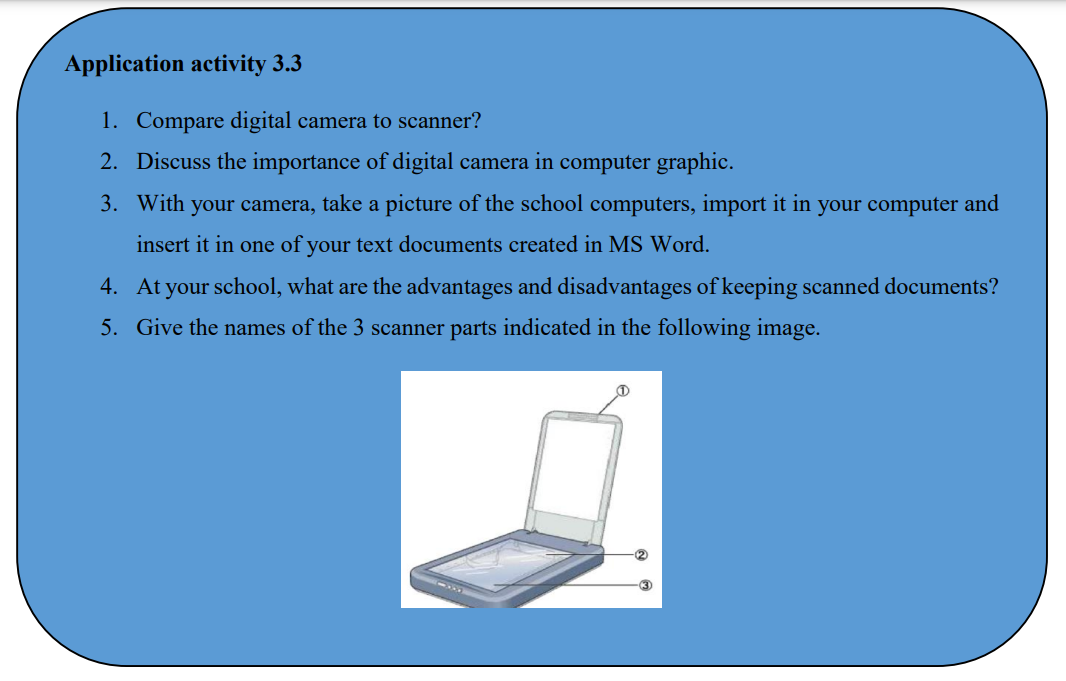
b. The different parts of scanner
A scanner has the following five parts visible externally:
(1)Start button, (2) Copy button, (3) Scan to E-mail button, (4) Scan to Web button, (5)Scanner cover
Note: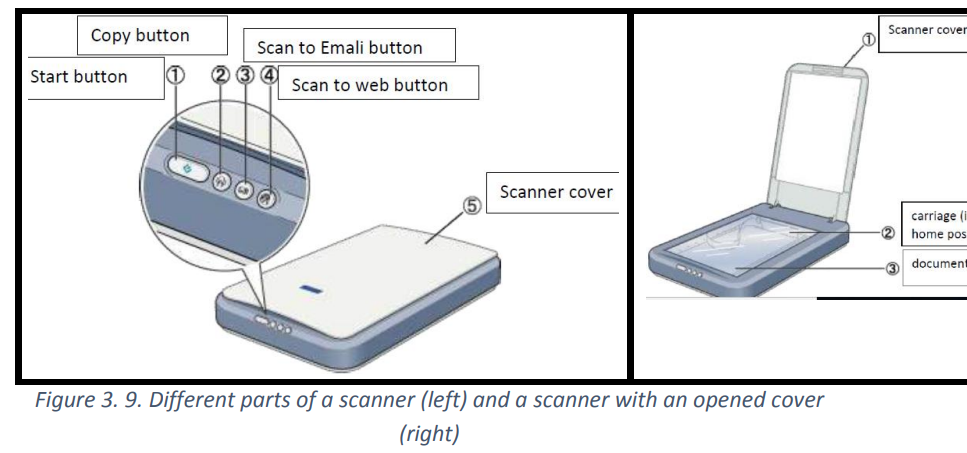
Parts, size and looks of scanners vary depending on the type of scanner and some scanning
and photocopying functionalities are combined in one physical device therefore some of the
parts mat not be visible
Some scanners have touch screen capabilities therefore they may not have some of thebuttons
3.4 Screenshots Capturing
A screenshot is an image of a computer desktop that can be saved as a graphic file. (The mouse
cursor is not included in the image). The main ways used to get the screen of computer is to
use the Print Screen key (PrtSc) or the Snipping Tool3.4.1. Use of Print Screen Key
A print screen is a computer key which is used to copy to the clipboard an image of the screen
and paste it in any other application for saving or manipulation
Steps to follow in screen shot capturing using Print screen key:
Open the screen that is going to be copied.
Press the Print Screen key
Paste (CTRL+V) the image into an Office program or any other application.
The taken image can be edited depending on the options provided by the program in which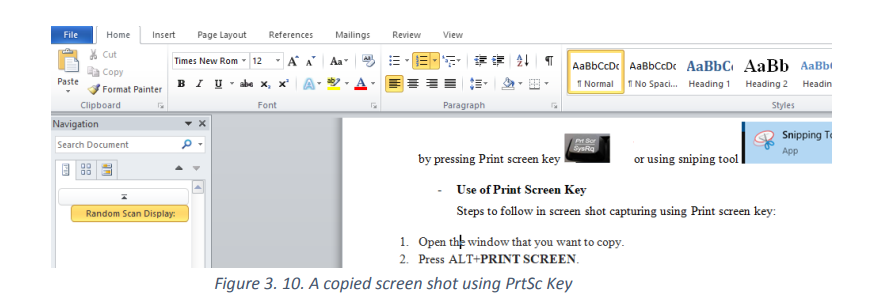
it is pasted.
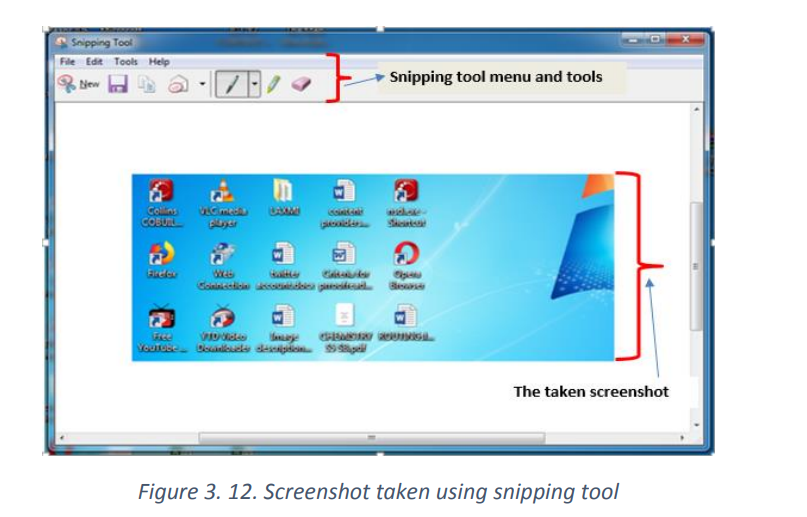
3.4.2 Use of Snipping tool
Snipping Tool is a Microsoft Windows screenshot utility included in Windows Vista and in
later versions. It can take still screenshots of an open window, rectangular areas, a free-formarea, or the entire screen.
To open the Sniping tool:
Click on Start
Write Snipping Tool in the search box and once found click on it to launch or click on All
Programs then click on Accessories and click on the snipping tool
An opened Sniping tool will look like in the image below:
To take a screenshot using Snipping tool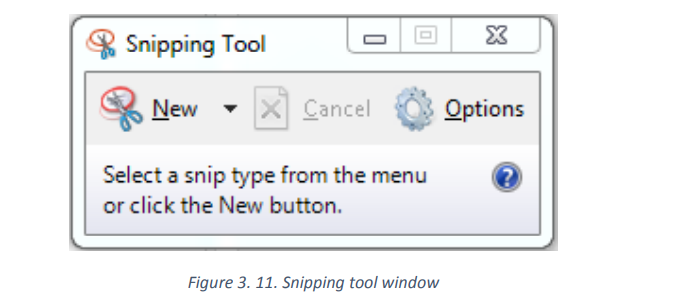
To take a screenshot in the opened Snipping tool
3.5. Graphic Software-Paint
In computer graphics, graphics software refers to a program or a collection of
programs that enable a person to manipulate images on a computer.Examples of such programs include Adobe Photoshop, Microsoft Publisher, Paint, Etc.
3.5.1. Starting and saving a Paint file
A paint program is a software graphics program that allows the user to draw or paint
bitmapped images on a computer.To start Paint go through the following steps:
Understand the canvas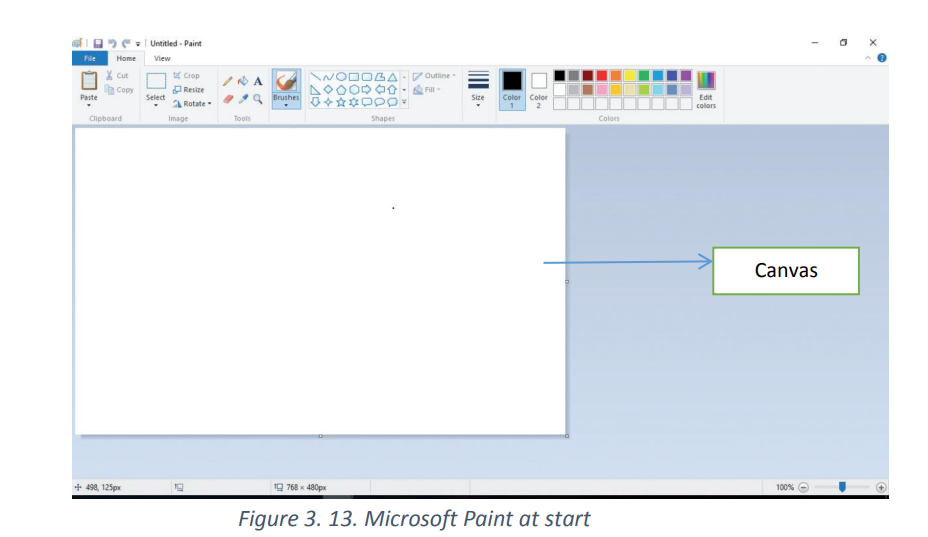
When Paint launches, the white “canvas” will appear on the screen. Imagine this
canvas as a piece of paper to draw or write on. The size of the canvas can be adjustedbefore starting to create images.
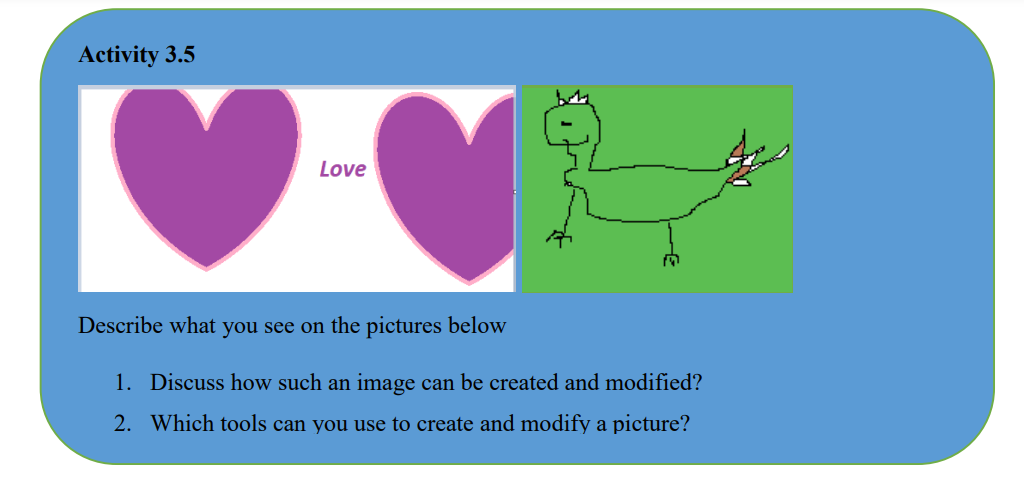
The flower above has been drawn using the Pencil tool which was used to draw lines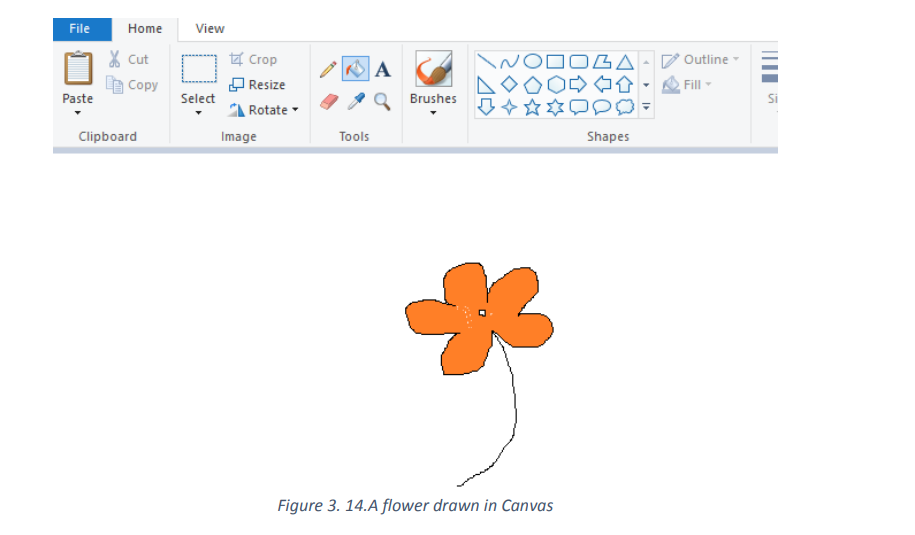
and the Fill with color tools was used to fill the red color on the leafy part of the flower.
Saving a paint file
 From File menu, choose Save as.
 From a dialog box, choose PNG picture or any other image file format
In the next window type the file name, choose file format then click on save button.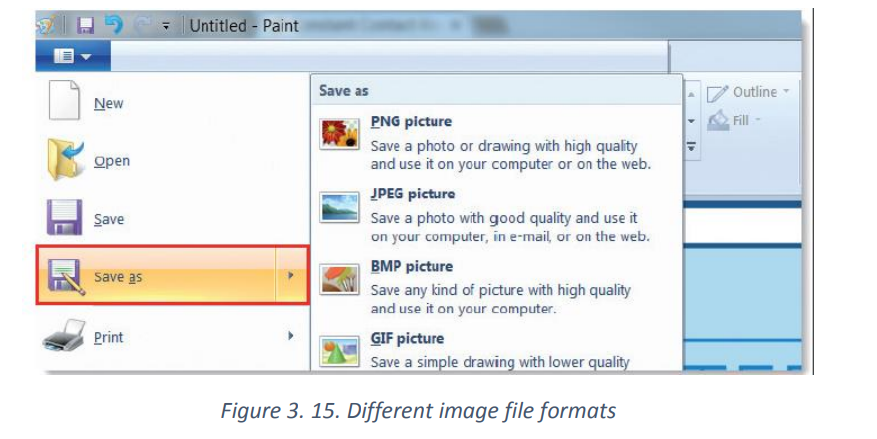
3.5.2. Paint tools
The paint program has got many tools which help its user manipulate images and do
any activity Paint is supposed to do. Some of the Paint tools are shown in the imagebelow:
Text tool: The tool allows text to be typed onto the current layer using the primary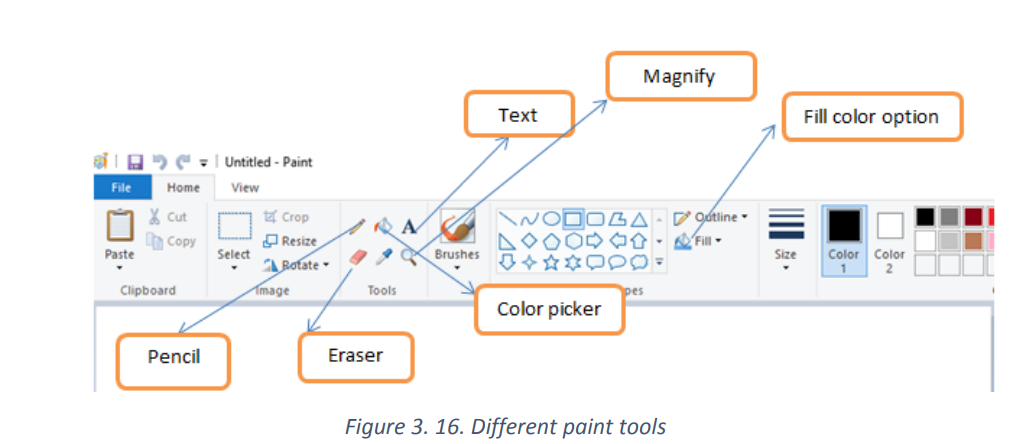
color. The text controls in the Toll Bar can be used to change the font, the size of thefont, formatting.
The pencil tool: is a freehand drawing tool, much like an actual pencil. The width of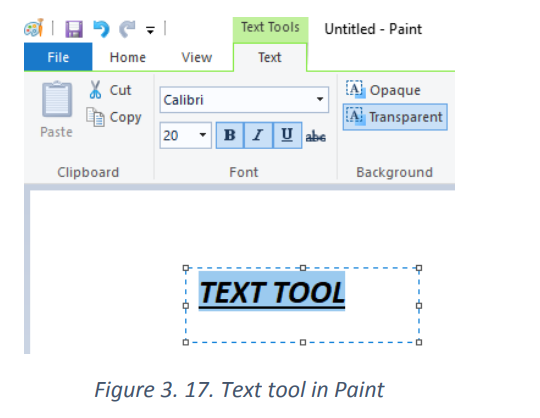
the line can be adjusted by clicking the Size menu and selecting a different line width.To draw, simply press the mouse button as you move the mouse on the canvas.
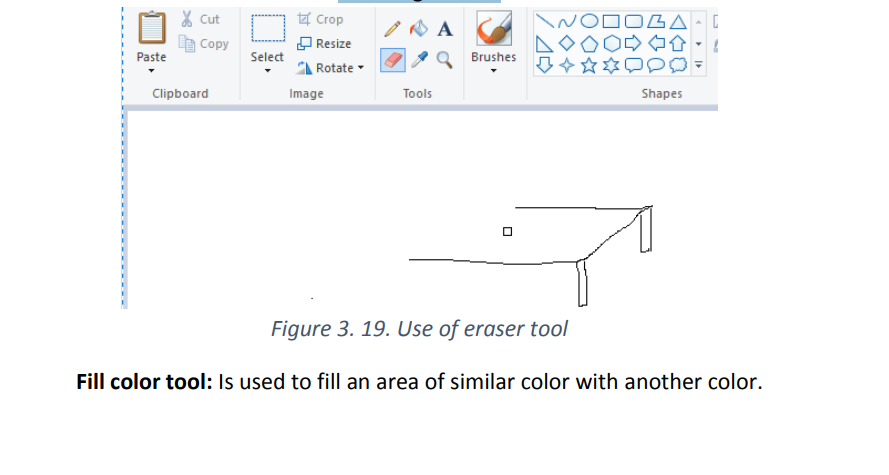
Eraser tool: This tool is used to remove parts of the active layer or selection like in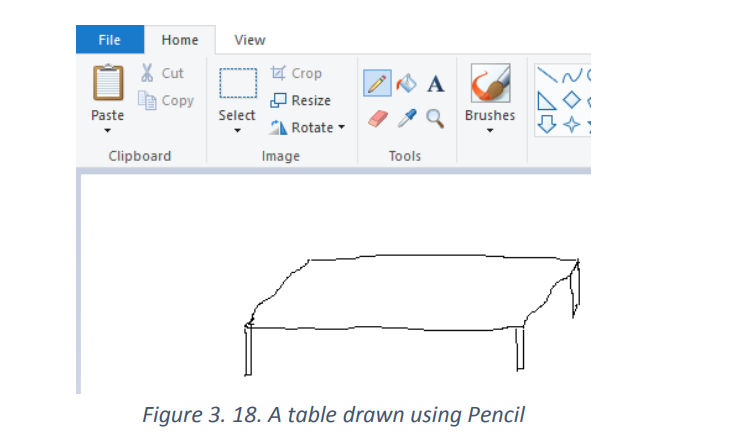
the image below
Color picker tool: is used to select a color on the active layer. By clicking a point on a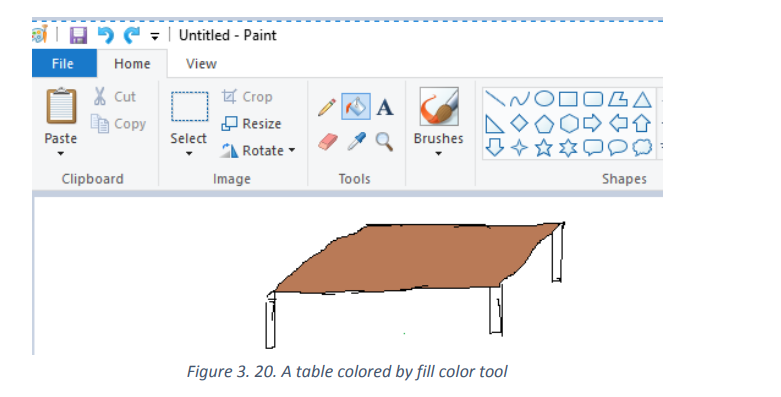
layer,
You can change the active color to that which is located under the pointer.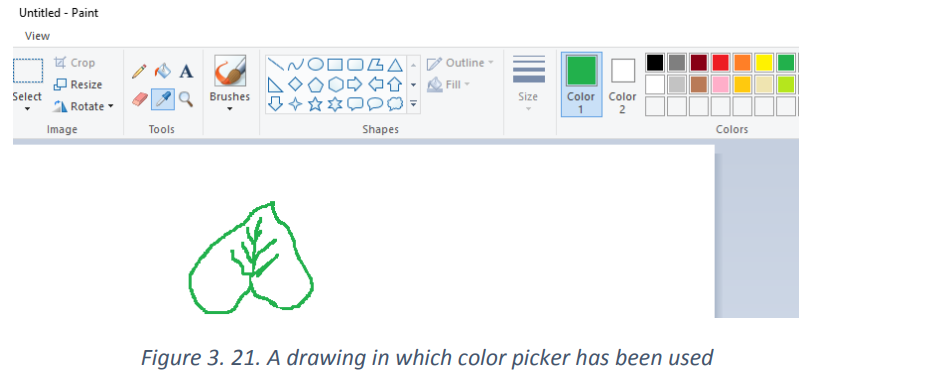
Magnifier: next to the “Pick color” button is the “Magnifier” button, which looks like
a magnifying glass. Selecting this tool will allow the user to zoom in and out of animage.
3.5.3. Insertion of Shapes
A shape is a geometric figure such as square, triangle or rectangle. Using illustrator’s
shape to draw can be an effective way to create smooth paths and predictable results.Below are different shapes in Paint:
Select any shape from the toolbar to draw that shape. Once you’ve chosen a shape,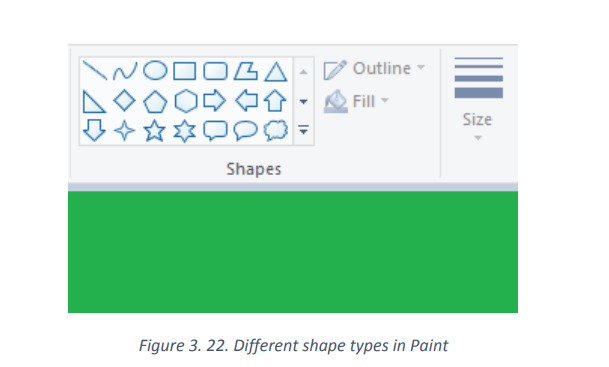
you’ll notice some options for the shape’s appearance.
Click the “Outline” and “Fill” menus to view your options.
Select your preferred outline and fill options,
Then, click the canvas where you’d like to place your shape.
Hold down the mouse button as you drag the cursor to enlarge the shape.
Let go of the mouse button when reach the desired shape size.
After choosing a shape with an outline, the color of the outline will be the current
foreground color. If the shape has a solid filling, the fill color will be the background
color.
3.5.4. Select, Cut, Copy, Paste and Crop
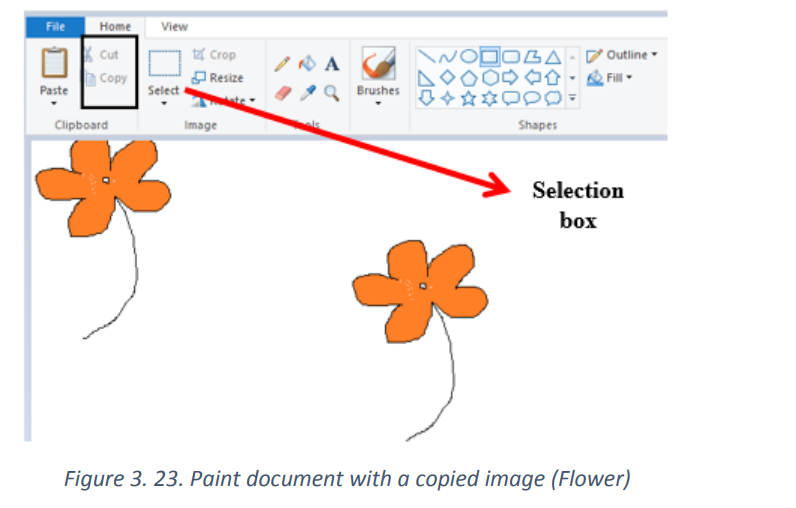
a. Copy and Paste
Press and hold down the left mouse button inside the selection box and move the
picture to relocate the image.If you wish to copy the image:
 Right-click inside the selection box
 And click "Copy."
 An image can be pasted to another paint document or in another program
b. Cut and Paste
Click on the area of an image you want removed, click and hold the mouse to dragthe box as far down and over as needed
 Press and hold "Ctrl" and "X" to cut the selection.
 Press and hold "Ctrl and "V" to paste the selection, either elsewhere in the
same document or in a separate document.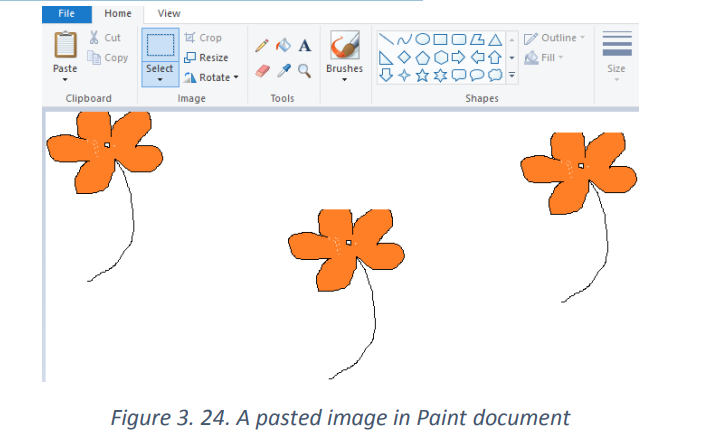
 Paste in Ms Office word
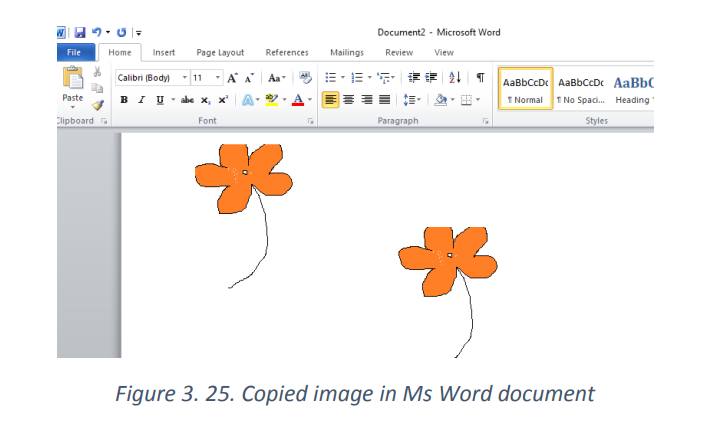
After cutting in Paint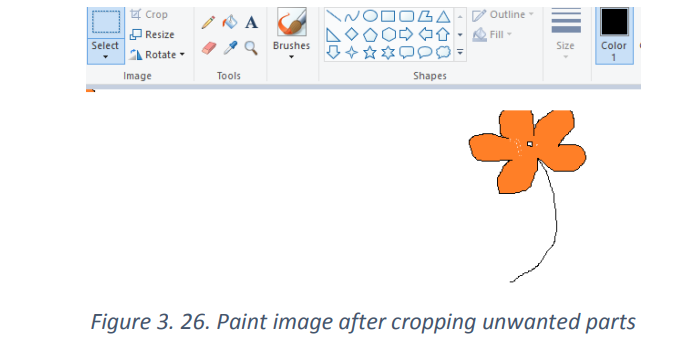
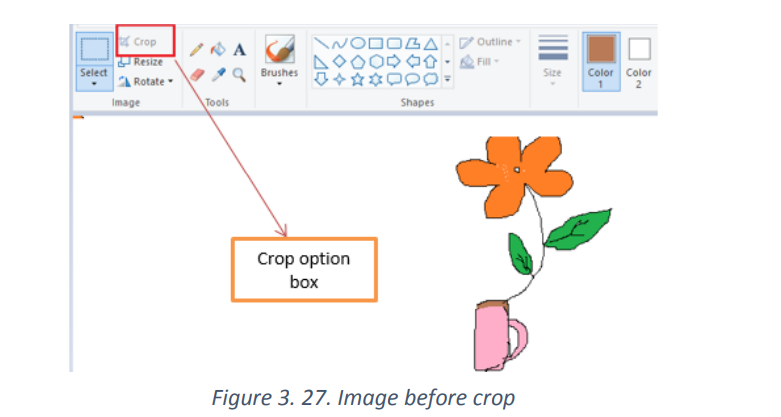
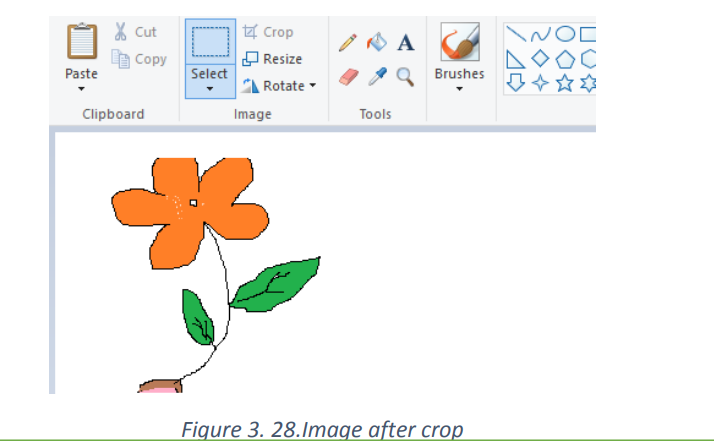
c. Crop
Select the portion of the image you want to crop using the Select tool.
Once selected right-click with the mouse anywhere in the image selection andselect Crop or go to Crop in tools bar.
 Quiz: 1
UNIT 4: E COMMERCE, SOCIAL MEDIA AND ONLINE SERVICES
4.0 INTRODUCTORY ACTIVITY
4.1. E- commerce
4.1.1. Understanding E -Commerce
a. History
E-Commerce or Electronic Commerce also known as e-Business, Is the buying and
selling of goods, products, or services over the internet using electronic means of
payment like credit cards. This commerce provides to buying parties physical goods
but also electronic materials (goods) where possible.
The history of ecommerce dates back to the invention of the very old notion of “sell
and buy”, electricity, cables, computers, modems, and the Internet. Ecommerce
became possible in 1991 when the Internet was opened for commercial use
At first, the term ecommerce meant the process of execution of commercial
transactions electronically with the help of the leading technologies such as
Electronic Data Interchange (EDI) and Electronic Funds Transfer (EFT) which gave an
opportunity for users to exchange business information and do electronic
transactions. The ability to use these technologies appeared in the late 1970s and
allowed business companies and organizations to send commercial documentationelectronically.
b. Some Ecommerce platforms
With ecommerce the buying and selling parties don’t need to meet at the same
location, the buyer does not go to the store but there is an electronic platform that is
used as a market where the buyer and the seller meet. An example of such a platformis amazon.com.
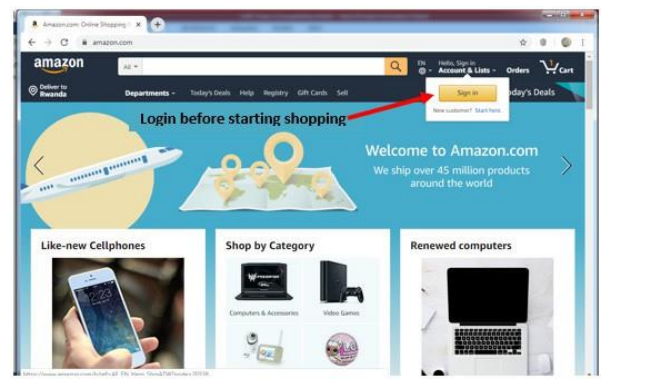
Figure 4.1. Amazon.com one of the most known Online shopping platforms
To buy goods on amazon.com or any other online chopping platform (ecommerce
website), the buyer must have an Amazon account, must log in using that account,
choose among the list of provided goods, choose location where the goods are to be
delivered and pay using acceptable payment means like Credit cards.
As of September 2021, the online shopping platforms available in Rwanda are among
others vubavuba.rw and kikuu.com. Through this platforms one can buy food (VubaVuba) or clothes (kikuu.com).
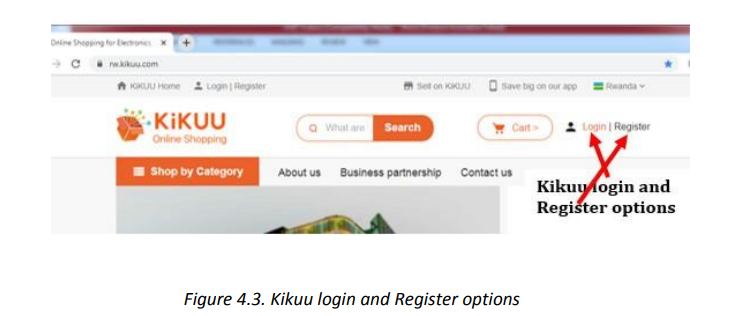
c. Buying on an e-commerce platform case of kikuu.com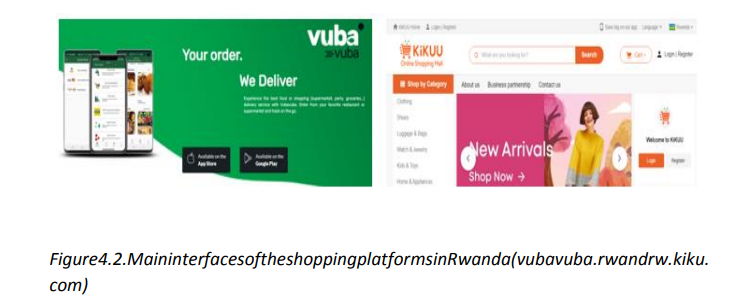
As stated earlier kikuu.com is one of the platforms available in Rwanda with which one
can buy available goods and have themdelivered to his/her preferred location in Kigali.
To buy with Kikuu, as it is a principle for other e-commerce the buyer has to have an
account. To create that account, go through these steps:1. In the address bar write kikuu.com and once the platform loads click on
Register to create a login account. Fill in the provided form the requested
details. Or2. If the user account is already created login
1. Once the login is successful choose goods to buy.
For most platforms goods have pictures and accompanying image and for
selecting the goods just click on its image. Select the goods specifications
carefully so as to get what is wanted. In the case of the shoes chosen like in the image
below the customer has to choose the shoe’s color and the size.
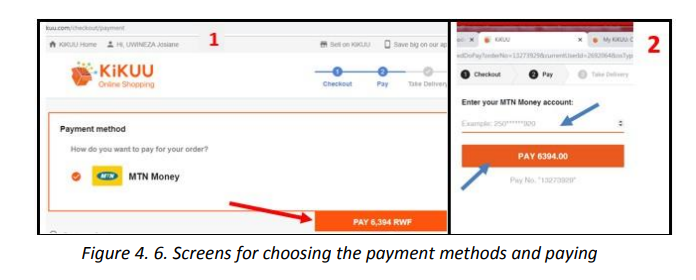
2. Pay the amount due by using the preferred payment method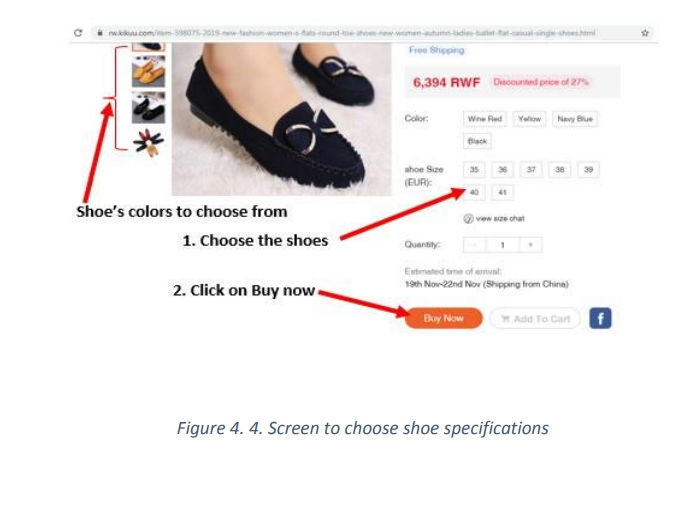
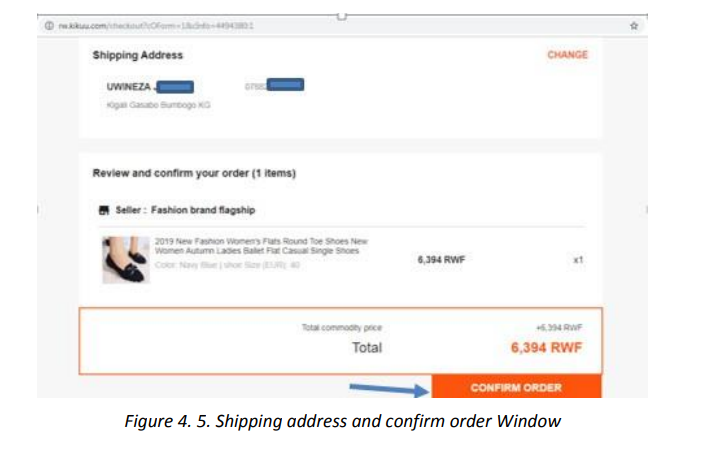
in the next two screens choose the payment method and click on PAY<Amount>. In
the other screen as MTN Money has been chosen as payment method fill the accountand click PAY <Amount>
There is no good thing without a bad side. Ecommerce presents to its users manyadvantages but has also disadvantages.
• Does not require physical displacement of the buyer hence saving money and
time
• Products and services are easy to find on the platform rather than moving in so
many stores, warehouses or supermarkets
• Transactions can be done all the time of the day and the week (24/7).
• No geographical limitations translate as a bigger customer reach.
• Higher quality of services and lower operational costs.
b. Disadvantages of E-commerce
• No guarantee of product quality as the product is not physically viewed
• Customer loyalty becomes a bigger issue as there is a minimal direct
customer-seller interaction.
• Anyone can start an online business, which sometimes leads to scam and
phishing sites.
• Hackers target web shops which may lead to disruption of service.
4.1.2. E-commerce models
Electronic commerce can be classified into four main categories. The basis for this
simple classification is the parties that are involved in the transactions. The four basicelectronic commerce models are:
a. Business to Business
In a business to business model companies are doing business with each other. The
final consumer is not involved. So the Online transactions only involve the
manufacturers, wholesalers and retailers, etc.
b. Business to Consumer
Here the company will sell their goods and/or services directly to the consumer. The
consumer can browse their websites and look at products, pictures, read reviews.
Then, they place their order and the company ships the goods directly to them.
c. Consumer to Consumer
Consumers are in direct contact with each other. No company is involved. It helps
people sell their personal goods and assets directly to an interested person.
d. Consumer to Business
The consumer provides goods or services to the company.
For example an IT freelancer who demos and sells his software to a company.
4.2. Online Payment Methods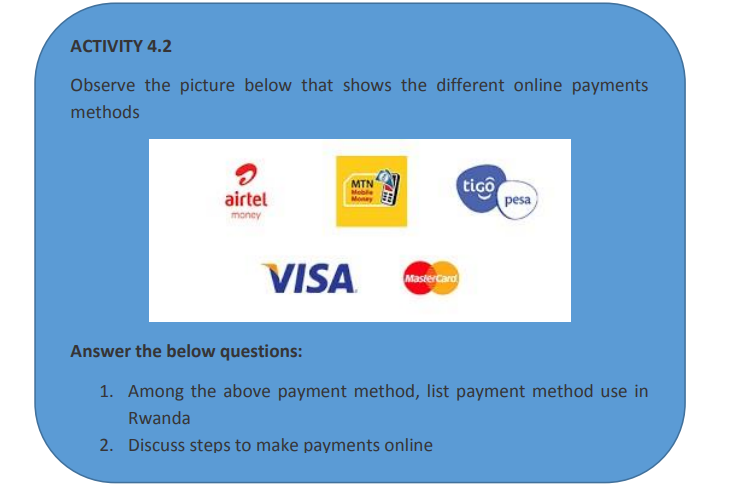
Is the way that a buyer chooses to compensate the seller of a good or service that is also acceptable to the seller. Typical payment methods used in a modern business context include cash, checks, credit or debit cards, money orders, bank transfers and online payment services such as PayPal.
Buying online requires using electronic means which are acceptable by the selling
companies for example as seen in previous sections buying with Kikuu requires using
MTN Money. Other online platforms may require special cards known as debit orcredit cards.
A debit/credit card is a plastic card normally issued by a financial institution to allow
its user to pay at Points of Sale in order to complete a purchase. They also allow thesame purchase on online shopping platforms.
them except when it is written on them. The main difference is where money is got
from: for the debit cards money is immediately got from the owner bank account whilefor the credit card money is charged to the customer’s credit line.
The image below shows the front and back side of a credit/debit card
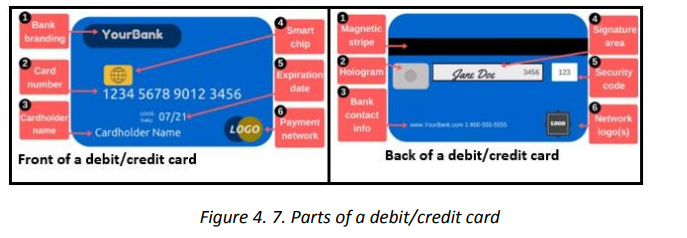 1. Bank branding which identifies the bank name that issued the cardNote: Keep the card number a secret as that number can be used by ill intentioned people
2. Card number which is unique and identifies the client with the bank.
The card number are the ones provided while purchasing online.3. Card holder name is the name of person authorized to use that card
4. Smart ship is the electronic circuit (processor) which stores some
information. The smart ship feature makes cards more secure than the
magnetic-stripe-card only
5. Expiration date is the date after which the card is no longer usable. The reasonfor this is mainly for the purpose of providing new cards which are more
technologically advanced. The expiry date is necessary while purchasing online
as most platforms require this information and when it is wrong the
transaction can’t be doneThe parts found on the back side of the credit card are:6. Payment network logo is the type of card and this can be MasterCard, Visa and Discover. Services specify which types they accept for payments and knowing the card’s type is very essential.
1. Magnetic stripe: the black strip contains information about the card and itsAn example of a typical debit card is found below:
owner, and specialized devices known as card readers gather that information
when the card is inserted
2. Hologram: is a mirror-like area showing a three-dimensional image that seems
to move as the viewing angle changes. Holograms are security features which help merchants identify valid cards
3. Bank contact information
4. Signature panel is the place where the user’s signature is put
5. Security codes is an additional code to help ensure that anybody using the
card number has a legitimate, original card
6. Network logos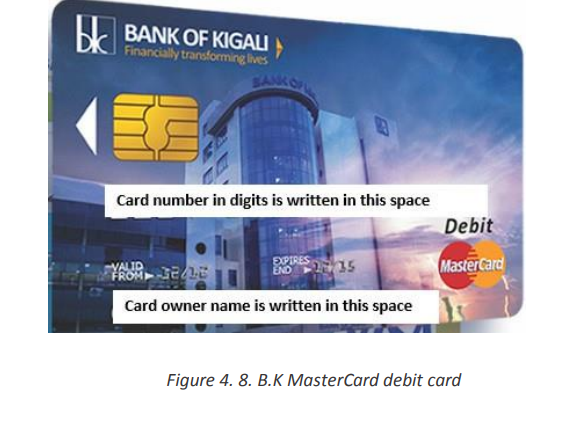
b. 1. Using a debit/credit card to purchase
The following are the steps of using a Debit/Credit card in online shopping:1. Enter the address of the website where to purchase from in theupon completing the transaction, and keep it until the item arrives.
address box of the browser’s window.
2. Select items to purchase and click the appropriate button used
for purchasing the item.
3. Enter the shipping, billing and debit/credit card details.
4. Click the appropriate button to complete the transaction.
5. Print the confirmation screen or proof of purchase receivedFor using debit cards at POS or ATMs insert the card and follow the prompts
c. Mobile Phone based Money
Also called Mobile money is a technology that allows people to receive, keep and
spend money using a mobile phone. It’s sometimes referred to as a ‘Mobile Wallet’ or
by the name of a specific service
There are more different mobile money services around the world. Although they are
most popular in Africa, Asia and Latin America. Mobile money is a popular alternative
to both cash and banks because it’s easy to use, secure and can be used anywhere
there is a mobile phone signal.
Mobile money keeps funds in a secure electronic account linked to a mobile phone
number. In some cases, the mobile money number will be the same as the phone
number. Mobile money is often provided by the same companies that run the mobile
phone services and it is available to both pre-pay and contract customers.
4.3. Facebook
Social media is the collective of online communications channels dedicated to
community-based input, interaction, content-sharing and collaboration which enable
users to create or share content or participate in social networking.Examples of social media are: Facebook, twitter, Instagram and WhatsApp
Facebook is one of the most popular free social networking websites. It allows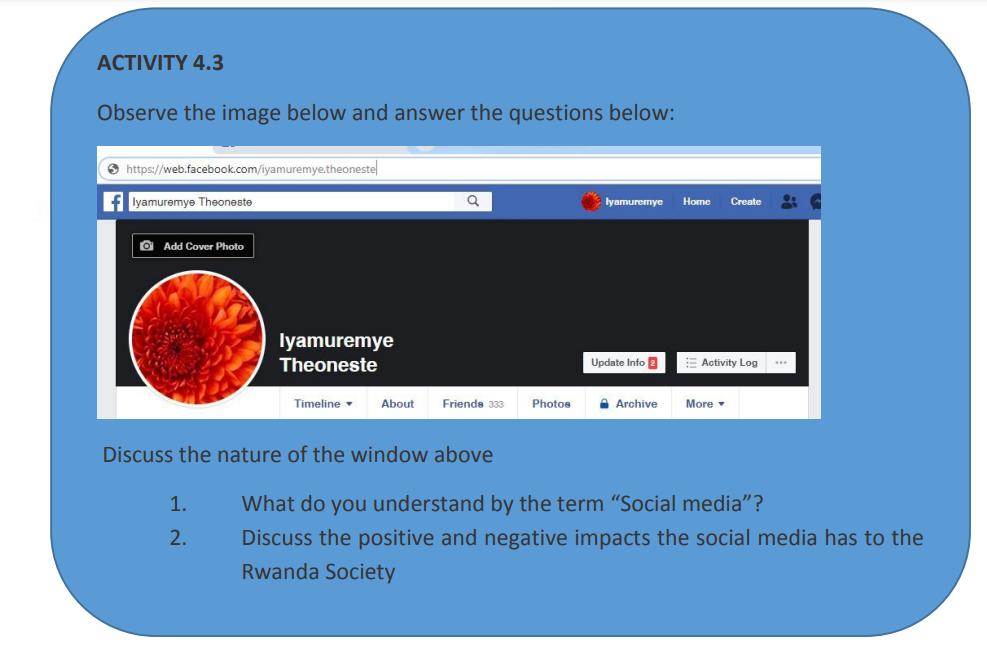
registered users to create profiles, upload photos and videos, send messages and stay
in touch with friends, family and colleagues.• Creating a Facebook accountFor most social media before using them an account must be created. An account
identifies the user as different from other users in the system.
The following steps are followed to create a Facebook account:
1. Open Facebook Home page by entering in the browser’s address bar the link
www.Facebook.com
2. The first page provides the option to login or sign up. Fill in the form the required
information and click on sign up
3. Enter personal information (First name, Last name, email or phone number,
Birthday and gender)4. Enter the code provided through SMS or the provided email
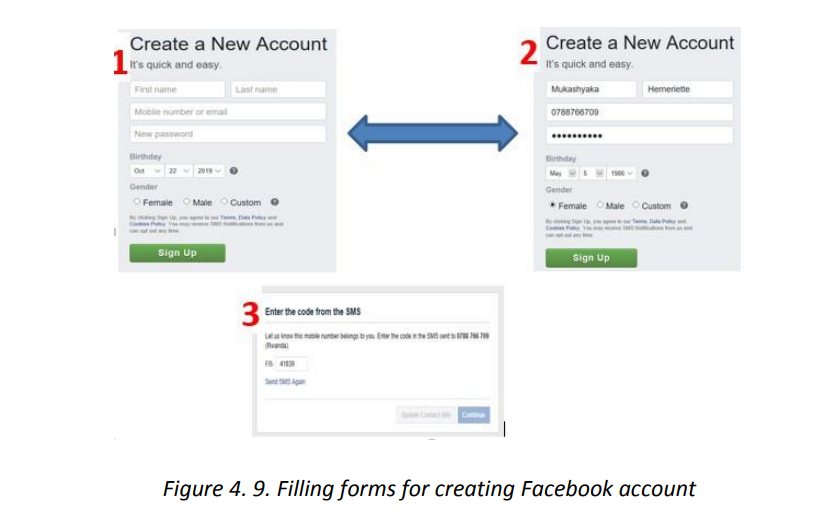
Open the verification email that is sent to the email provided while creating
the account
2. Edit the profile information by logging into the new account and clicking on Editprofile
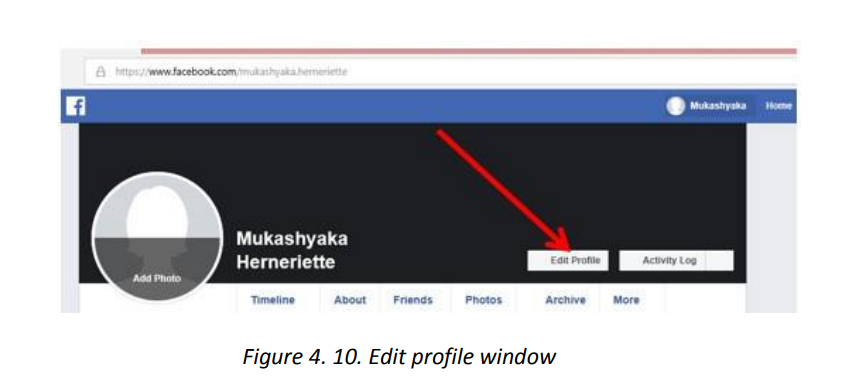
The following table will be appeared.
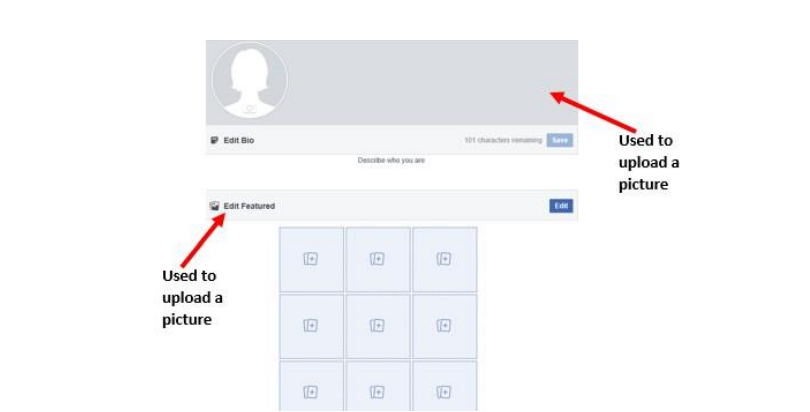
Note: The account has been created you are able to login into your Facebook
account:
Go to Facebook.com and in the top right form fill in the email and the passwordthen click on:
• Connecting with friends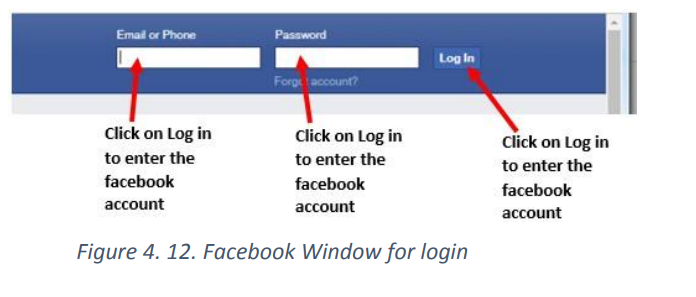 Facebook has millions of users, all users are in the public and appear like anonymous
to you. As a Facebook user you are allowed to search for other users, viewing their
profiles, friends, and photos. You can immediately message them inbox but once the
account owner sets some restrictions on his/her account a non-friend user may view
nothing among these.
In order to be able to fully communicate with another Facebook user, you just need to
be a Facebook friend.
To have a friend on Facebook go through this process:
• In the Facebook search box enter the account of the friend to be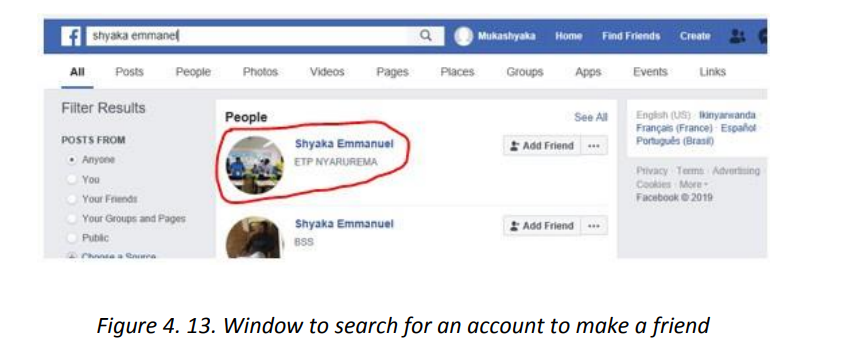
• Once the account is entered in the search box choose the correct Facebook
account among the many options and click Add Friend. In the image above
the account chosen is Shyaka Emmanuel• Sharing pictures
A Facebook account holder can upload pictures on his/her Facebook account, share
them or share pictures uploaded by others.
Steps to upload a picture in your account are:• In the menu click on Photo then on Add Photos/Video
In the new window that will appear browse for the picture to upload and open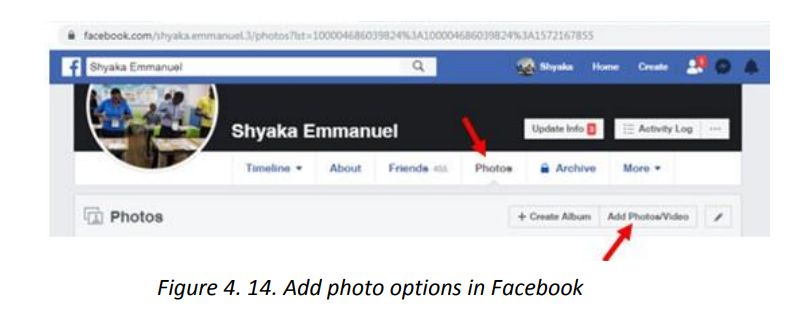
it so that it gets uploaded.
• Comment the picture, set who has rights to view it and click on Post like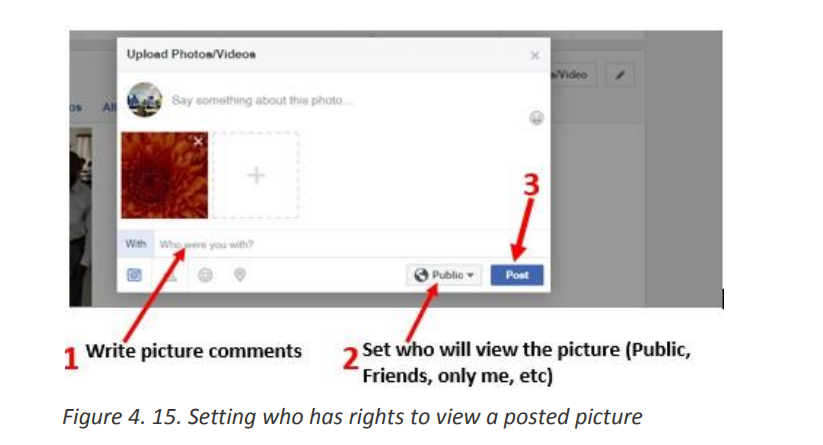
illustrated in the image above
The uploaded image can then be viewed by anyone (if right to view the image hasbeen set to Public) and they can like, share and comment this image.
d. Chatting
Facebook provides the option to converse with friends by using the chat option whose
window is available in the far down right zone of a Facebook page.
The content of the chat is text but can be also attachments in form of text files,images, GIF files, videos or a laptop camera taken picture/video
Twitter is a free microblogging service that allows registered members to broadcast
short posts called tweets. Twitter members can broadcast tweets and follow otherusers’ tweets by using multiple platforms and devices.
a. Creating an account• For creating a twitter account first go enter in the browser’s address bar
twitter.com
• In the first page that will appear click on Sign up. This same page is used forsign in when the user has already a twitter account
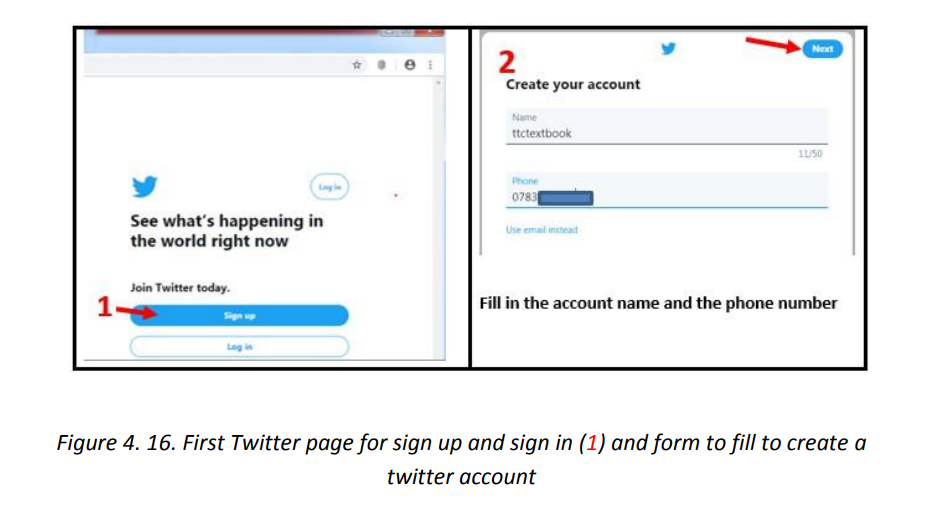
In the next screen that will appear also click on Next. Confirm thetelephone number so and use the sent code to continue to the next stage
• In the next screen enter the password for your twitter account and click on Next.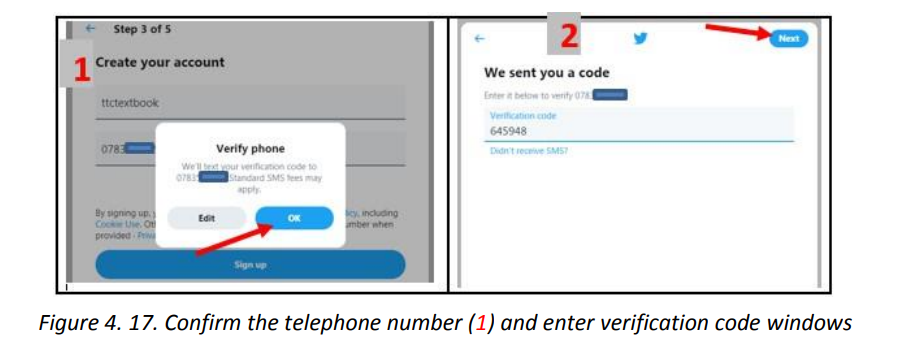
The screen that will thereafter appear will allow you to edit the twitter account profile
picture by clicking on the human head-and-body silhouette but this can be skipped tobe done later.
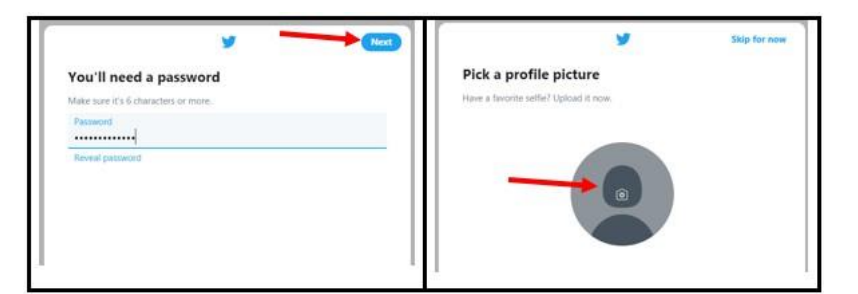
In the next screens that will appear follow the prompts. Those screens will allow
describing yourself, setting your interests, suggestions of accounts to follow, turningon notifications
In the steps given above the account creator may decide to go into additional steps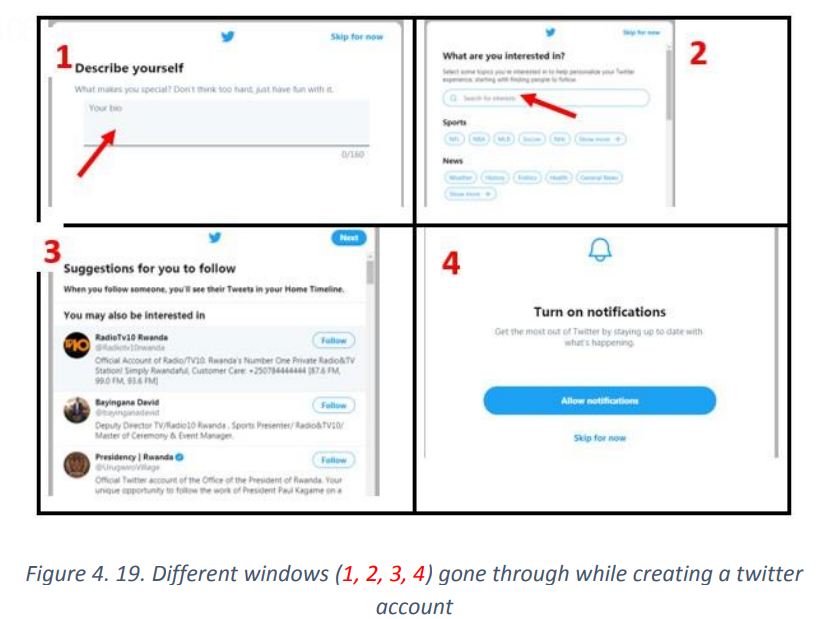
depending on which features to activate. Here most of the options have been skipped
or the default provided option was chosen. After going through all the steps the
account is created and is ready to be used. However the steps are subject to change
and screens may not look like the ones provided here depending on changes broughtin by Twitter.
b. Following a twitter account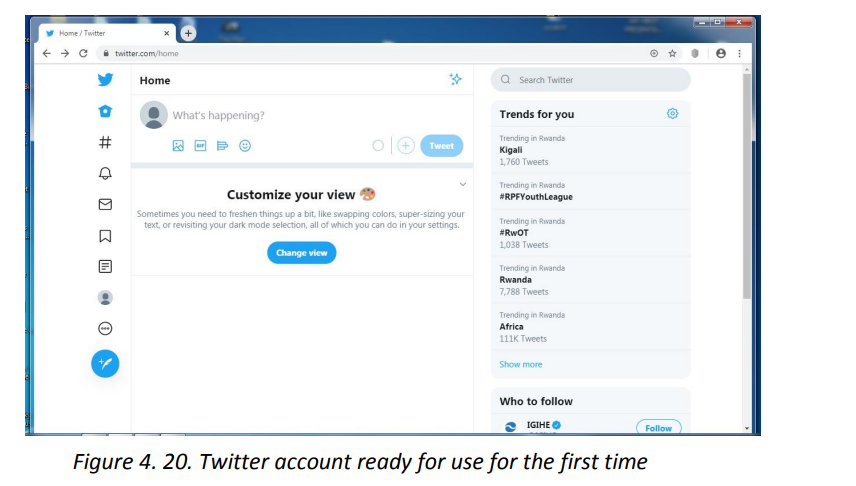
All social media provide better experience when one is acquainted with other
user in the same social media network. For a twitter user to have better experiencehe/she has to follow other accounts.
Following an account permits one to receive immediately prompts when the followed
account posts a tweet in form of text, image or video; updates the profilesimmediately after they are posted.
Following a twitter account is done in these steps:
1. Search for the account to follow using the twitter search box
2. Next to the searched account click on Follow. The Followimmediately change into Following
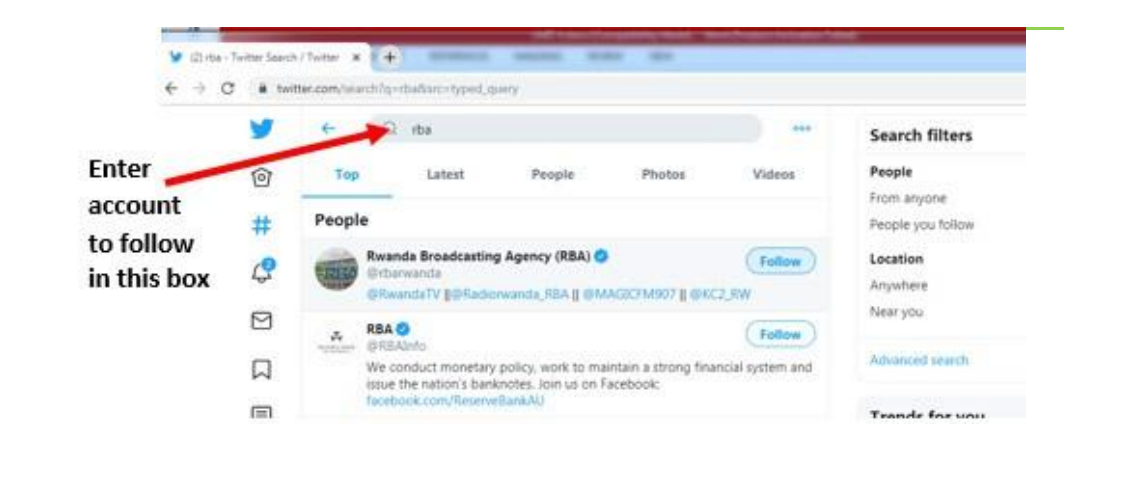
Figure 4. 21. Window to use to search for twitter accounts
c. Tweeting
Also known as tweeting is posting making a post on the social media Twitter. The
post can be just text, images and videos.
To post a tweet go through this process:1. In the Twitter Home page click on the twitter icon
2. In the text area that will appear write the tweet text. If images and videos are to be
used in the tweet click on the corresponding icons below the text area
3. Once the tweet isready click on Tweet. The tweet is now posted and can be viewedby the account followers and anyone who searches for it
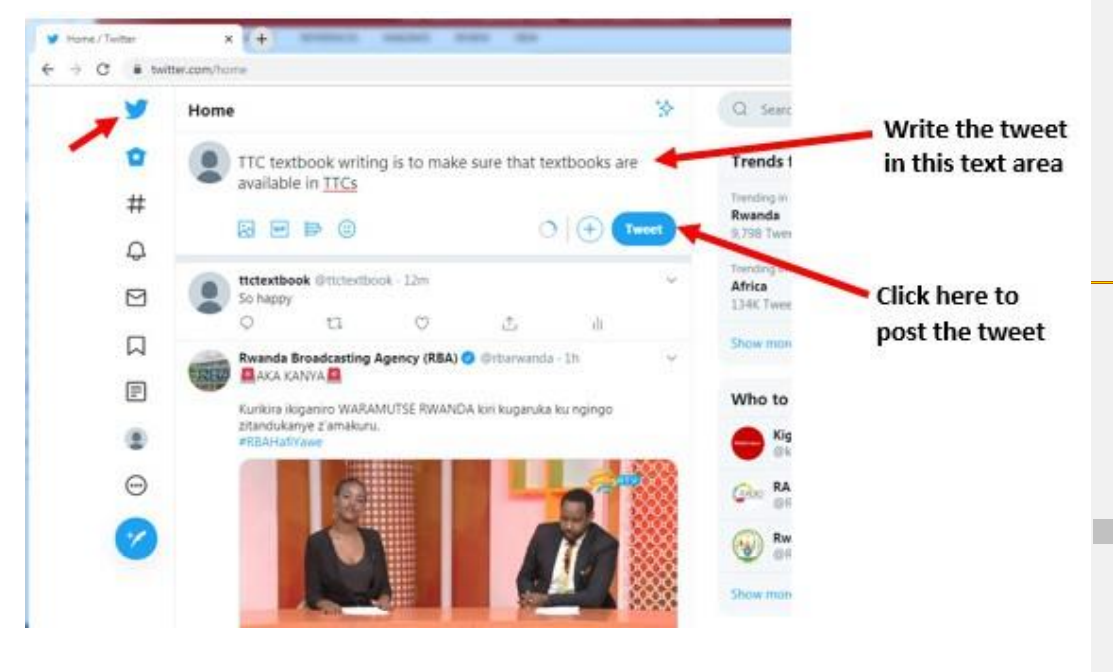
Figure 4. 22. Screen used to post a tweet
Note:• Twitter provides the option to delete the created tweet by clicking on the drop
down icon next to the tweet and clicking on Delete
• As one tweet is only of 280 character while tweeting choose properly the words
to use. For this reason tweets contain more shortened words
• Twitter users can create hashtags which are keywords preceded by the hash signand are easily searchable on twitter
d. Twitter menu icons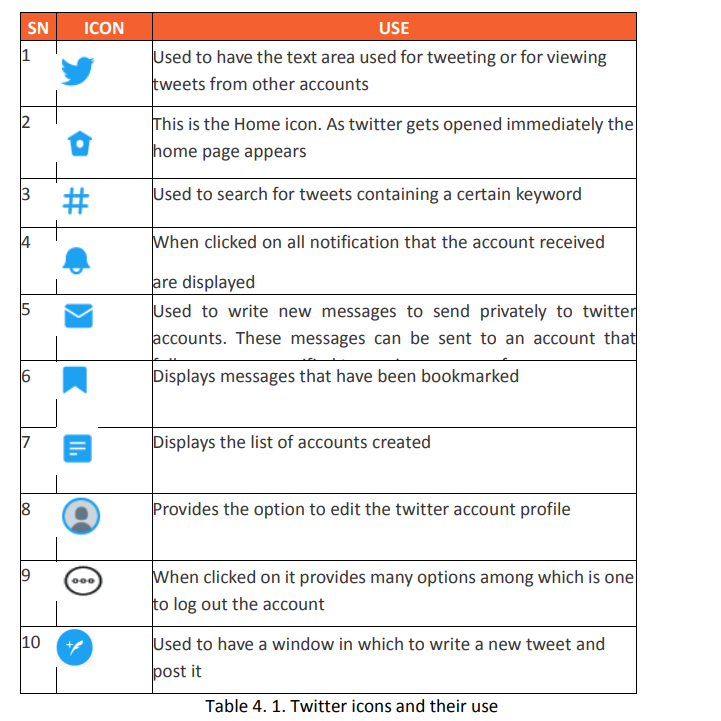
In the previous sections some of the available twitter options have been elaborated.
Those options can however be easily accessed by using the icons located at the left
side of a twitter account page. The table below represents those icons and their roles
4.5 Instagram
Instagram is a free social networking service built around sharing photos and
videos. It launched in October 2010 on iOS (iPhone Operating Systems) first, and
became available on Android in April 2012 and can be accessed via computer internetbrowsers.
Instagram is a free social networking service built around sharing photos and
videos. It launched in October 2010 on iOS (iPhone Operating Systems) first, and
became available on Android in April 2012 and can be accessed via computer internetbrowsers.
Just like other social networks, an account can interact with others on Instagram byfollowing them, being followed by them, commenting, liking, tagging.
a. Creating an Account on Instagram
Like other social media one cannot use Instagram without having an account created
and for that go through these steps:
1. Enter in the browser’s address bar the URL of the application (www.instagram.com)
2. In the form that appear to the right of the new page fill in the required detailsand click on Sign up
3. in the next screen click on Turn on (to turn on notification) or Not so as to be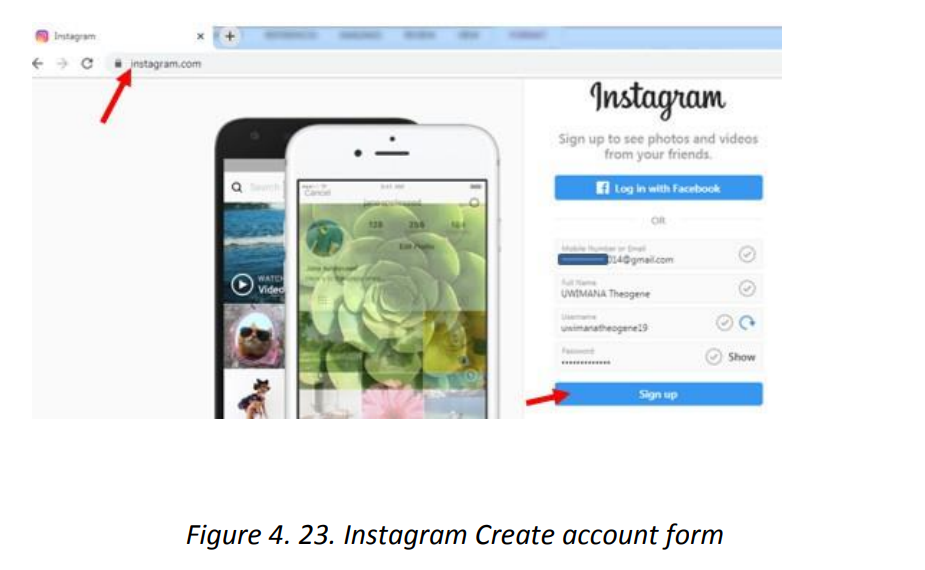
directed to the Instagram first page
b. Instagram main icons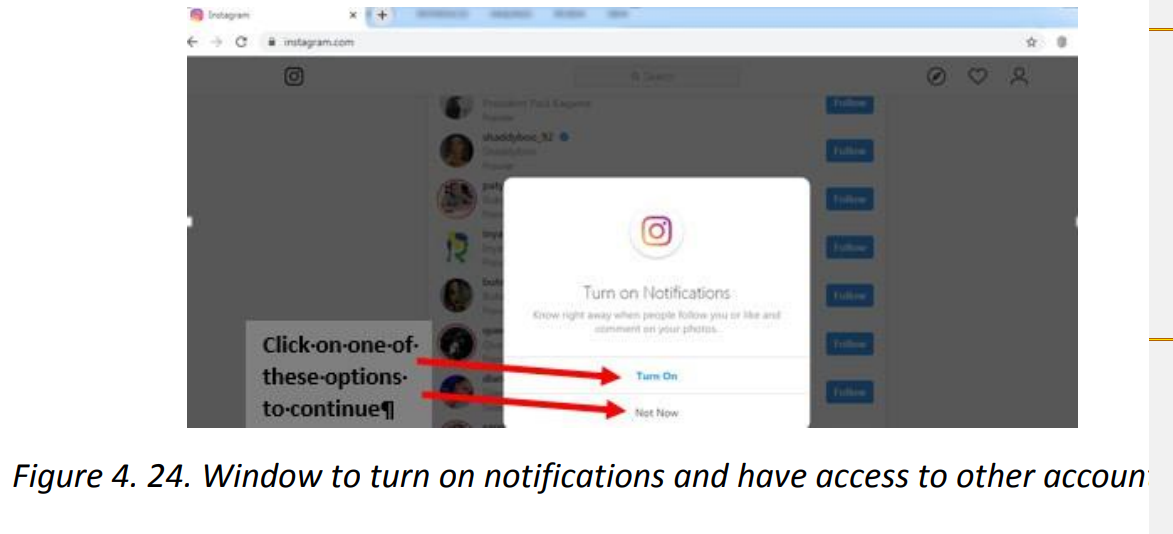
Instagram has got icons which help carry out the basic functions. Those icons areshown in the image below:

Figure 4.25. Instagram page with its icons
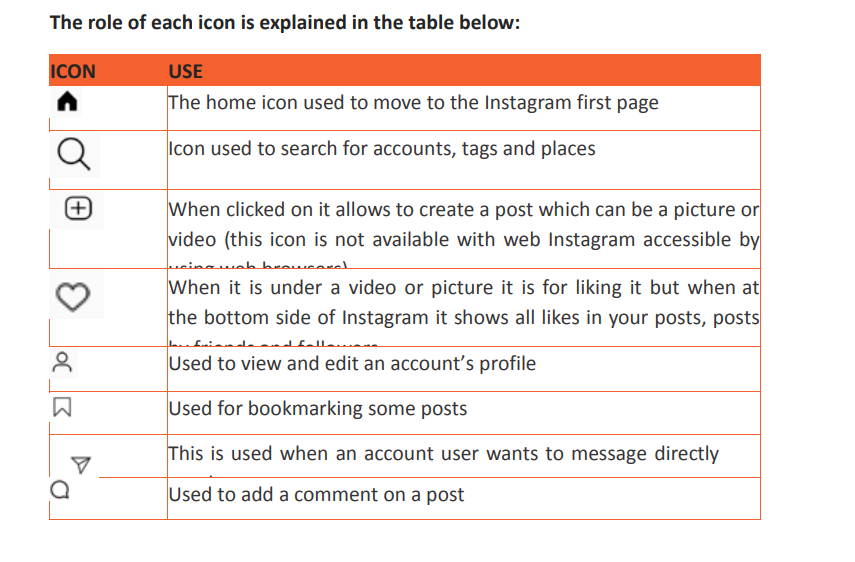
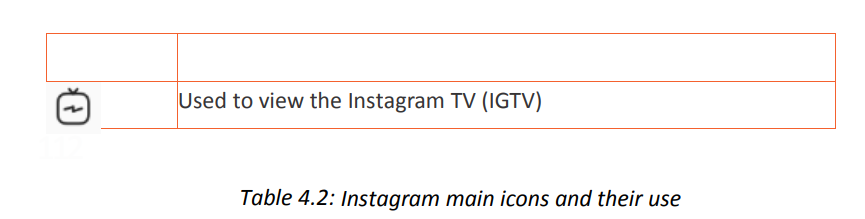
4.6. WhatsApp
WhatsApp is a popular messaging app with end-to-end encrypted instant messaging that can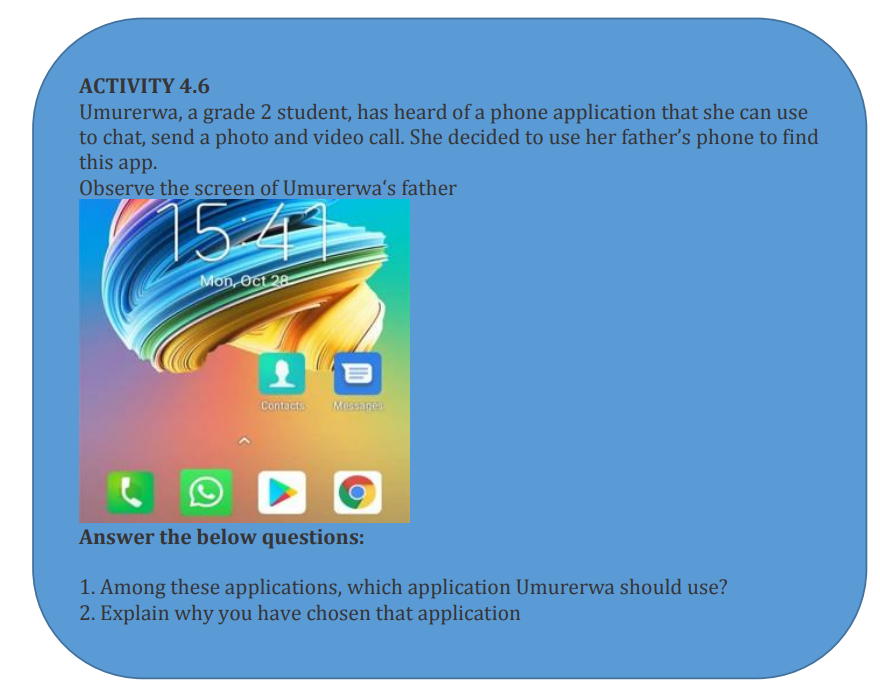
be used on various platforms, including Android, iPhone and Windows smartphones, and Macor Windows PCs.
For WhatsApp to be installed on PCs an auxiliary application is needed in order to create a
virtual environment resembling a Mobile Operating System in which WhatsApp will beinstalled. Such auxiliary applications are NOx Player and Blue Stack.
A. Installing WhatsApp
Installing WhatsApp first requires downloading it through the phone application for
downloading applications. For android that application is Play Store. Download WhatsApp bysearching for it in Play Store and install it by going through the prompts
In the next screen that will appear touch on Accept and let the application download. When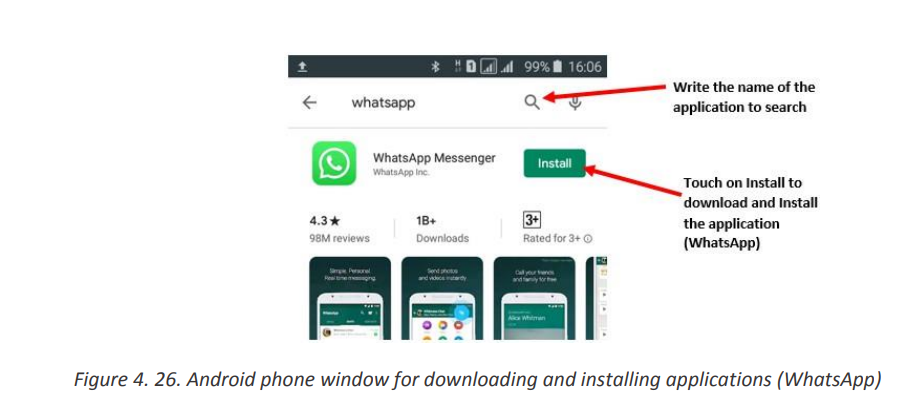
there is not enough space for downloading the application, it will be necessary to delete somefiles to liberate some space.
Downloading and installing WhatsApp will go through these steps shown in the screenshotsbelow
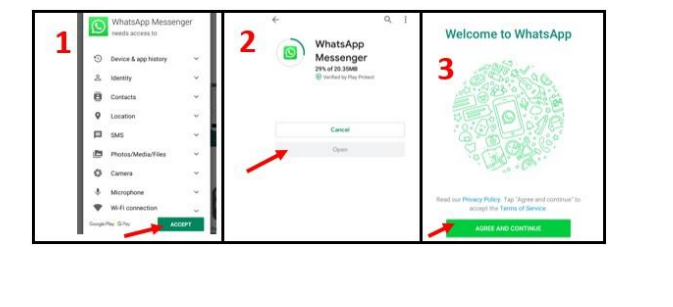
Interpretation of the screens: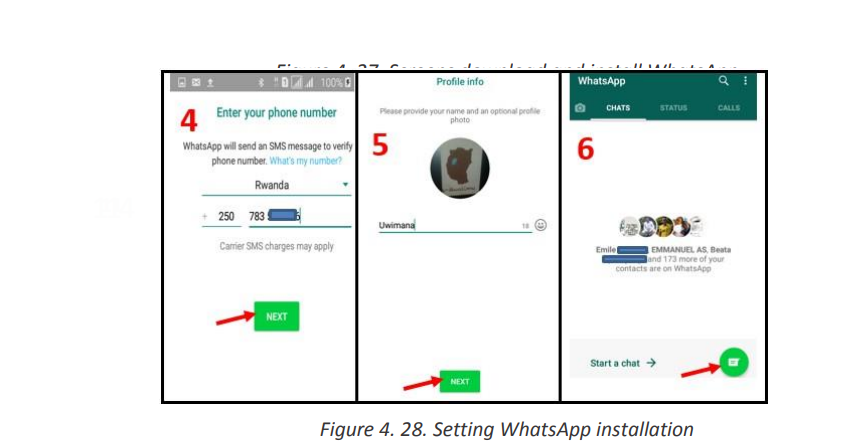 a. Screen One: The choosing of the application to download and install has already been
done now the person has to agree that WhatsApp will have rights to have access to
some of the resources in the telephone.
b. Screen Two: WhatsApp is now being downloaded and is at 26%. Once downloading is
over the application will install itself and when finished the user will touch on Open to
do further configurations.
c. Screen Three: Once the Open option is touched in the next screen touch on Agree and
Continue to agree to the terms of service.
d. Screen Four: In this screen fill in the phone number to use on WhatsApp and touch on
Next. A WhatsApp code message will be sent to your telephone. Enter it in the next
screen and continuee. Screen Five: Configure WhatsApp by uploading an image that will be used as a profileB. Adding a Status in WhatsApp for Android
picture to your account and set the account name.
f. Screen Six: WhatsApp is now installed. Start chatting by touching on the icon shown by
an arrow.
Similar to apps like Snapchat and Instagram, WhatsApp Status is a place for snapping pictures
of whatever you’re doing and then uploading them to your profile where they’re available for
your contacts to see for 24 hours. To get started with Status:• Tap the Status bar on the home screen.
• Tap the camera icon at the bottom-right.
• Take a picture or video.• Add any filters, stickers, text, or whatever else you’d like.• Tap the green circle at the bottom-right to add the post to your Status
4.7. E-Banking and E-Payment 4.7.1 Online ServicesAn online service refers to any information and services provided over the Internet. Theseservices not only allow subscribers to communicate with each other, but they also provide
unlimited access to information. Online services may include E Banking, E payment, etc
4.7.1 Online ServicesAn online service refers to any information and services provided over the Internet. Theseservices not only allow subscribers to communicate with each other, but they also provideunlimited access to information. Online services may include E Banking, E payment, etc
4.7.2 E-Banking and E-PaymentIt is an electronic transfer of money from bank account, usually checking account without theuse of the paper check. E-cash is a form of an Electronic payment system where a certainamount of money is stored on client’s device and made accessible for online transaction.
a. E BankingElectronic banking is a form of banking in which funds are transferred through an exchange ofelectronic signals rather than through an exchange of cash, checks, or other types of paperdocuments
It is also a method of banking in which the customer conducts transactions electronically viathe Internet.
Transfer of funds occur between financial institutions such as banks and credit unions.
They also occur between financial institutions and commercial institutions such as stores.
Whenever someone withdraws cash from an Automated Teller Machine (ATM) or paysfor services using a debit card, the funds are transferred via electronic banking.
E-banking is a safe, fast, easy and efficient electronic service that enables an access to a bank
account and to carry out online banking services, 24 hours a day, and 7 days a week.
With this service you save your time by carrying out banking transactions at
any place and at any time, from home or office provided there isinternet access.
E-banking enables the following:• Accurate statement of all means available in your bank account
• Statement of current account, credits, overdrafts and your deposits
• Execution of national and international transfers in various currencies
• Execution of all types of utility bill payments (electricity, water supply, telephone bills,
and many others)
• Carrying out customs payments
• Electronic confirmation for all transactions executed by E-banking• Management of your credit cards
DisadvantagesThe disadvantages presented by E-banking are linked to the fact that it is a new technology
which is not usable by anyone especially in countries where ICT literacy is still a problem.
Other disadvantages are also linked to weaknesses in the system that may be exploited byhackers who may steel money using weaknesses found in the system
b. E payment
An e-payment system is a way of making transactions or paying for goods and servicesthrough
an electronic medium, without the use of checks or cash. It’s also called an electronic payment
system or online payment system. E-payment includes the use of Debit/credit card, MobileMoney
Services done by mobile money
Services provided by Mobile Money include money transactions whereby money can be sent
from one telephone user to another who can then withdraw the money as cash or keep it anduse to pay for different goods and services.
Example
In Rwanda mobile money services are provided by TIGO Cash, MTN Mobile Money and Airtel
Money. They include money transfer and withdrawal from a mobile money account and fromeven a bank account, payment of different bills like water and electricity
Example
In Rwanda mobile money services are provided by TIGO Cash, MTN Mobile Money and Airtel
Money. They include money transfer and withdrawal from a mobile money account and fromeven a bank account, payment of different bills like water and electricity
4.8. Irembo Local Online Services
Irembo is an initiative by the Government of Rwanda aiming at improving its service delivery
to the citizens and businesses. Irembo is the one-stop portal for e-Government services.
Irembo as a platform has the role of the provision of Government services online with ease,efficiency and reliability.
How to create account from irembo• Type www.irembo.gov.rw in the address bar of your browser
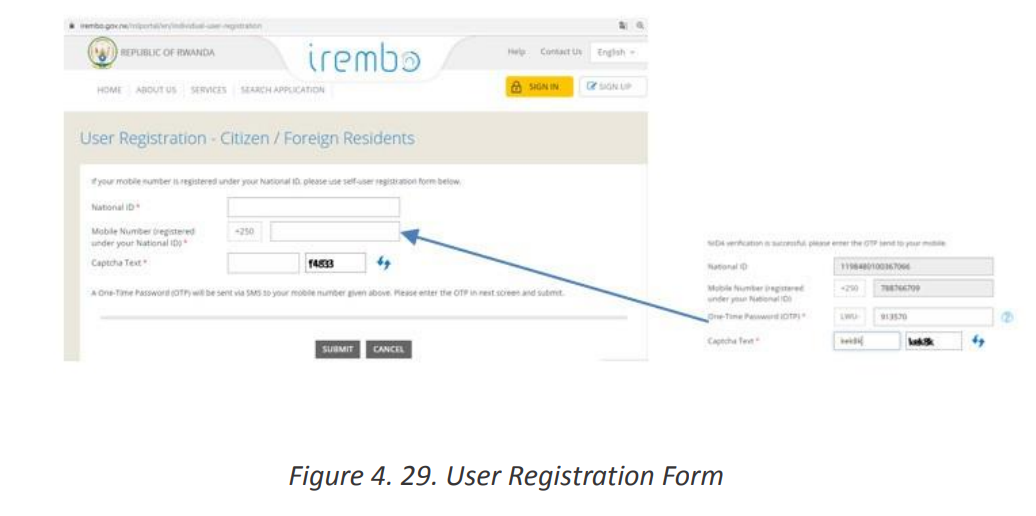 Fill in dialogue box black spacea. Password place
b. Confirm Password
c. Emaild. Captcha Text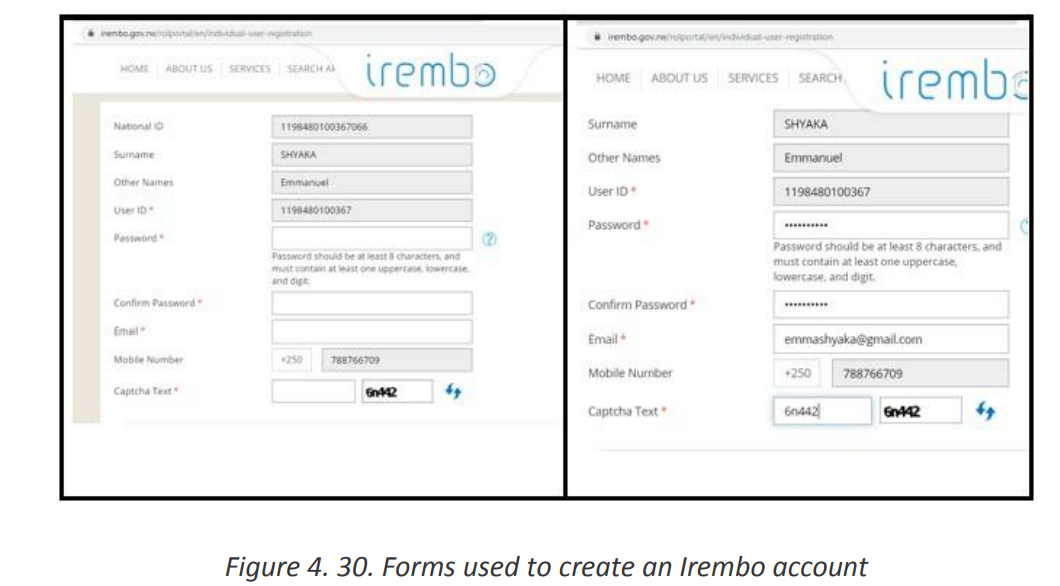
These services are subject to changes as some services can be added but the ultimategoals is to have all services offered through this platform.
a. Requesting for Irembo service
Requesting for services on Irembo requires first to have a username which isthe identity card number without the last three digits and a password
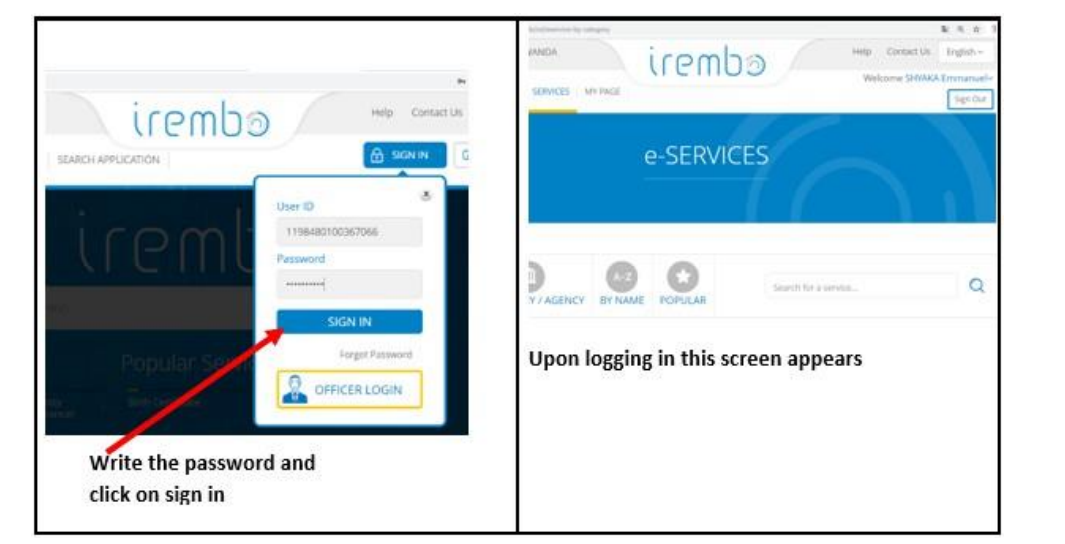
Figure 4. 31. Signing into an Irembo account
b. Current Irembo services
Currently, Irembo services are into these categories:
1. Immigration and emigration
2. Land
3. Local government
4. National ID
5. Notarization and Gazette services
6. Police
7. Rwandans living abroad
8. Media
9. Education10. Healthb. Current Irembo services
11. Ubudehe and mutuelle
12. Institutions of national meseum of Rwanda
13. Transportation14. Tourism
Currently, Irembo services are into these categories:
1. Immigration and emigration
2. Land
3. Local government
4. National ID
5. Notarization and Gazette services
6. Police
7. Rwandans living abroad8. Media
9. Education
10. Health
11. Ubudehe and mutuelle
12. Institutions of national meseum of Rwanda
13. Transportation
14. Tourism
Requesting for a criminal records clearance1. Open irembo website
2. Enter your ID and Password
3. Payment using VISA, MasterCard , MTN Mobile money(*182#), airtel (*182#),
Tigo(*310#) Mobicash or BK
4. After paying you send sms/email confirming that you have requested a service and
service paid5. Feedback of certificate must be sent to you after 3 days
Advantages of using irembo
1. Helps citizens to save a time
2. Save transport
3. People can request a service when he or she is at home4. Reducing corruption malpractices
5. It creates jobs
6. It simplifies access to the Government services7. Avoiding friendship
UNIT 5: DATABASE Basics
5.0 INTRODUCTORY ACTIVITY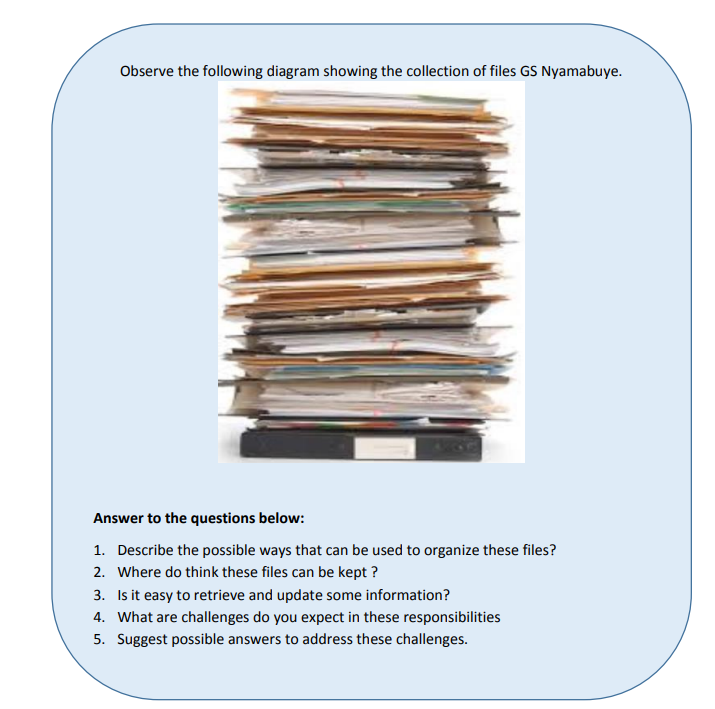 5.1: Introduction to Database
 5.1.1 Definition of Database
A database is an organized collection of related data.
It is considered to be organized because the data is stored in categories that are accessible in
a logical manner. A database is a collection of one or more relations, where each relation is atable made of rows and columns.5.1.2 Definition of Data and Information Data is commonly referred to as ‘raw’ data: a collection of text, numbers and symbols,images with no meaning.Data therefore has to be processed, or provided with a context, before it can have meaning.
 Information is the result of processing data, usually by computer.This results in facts, which enables the processed data to be used in context and havemeaning. Information is data that has meaning.Note: An information system is a combination of computer hardware and software that isdesigned to create, store, process and present information. The heart of all informationsystems is a database.
 5.2 Database Approach
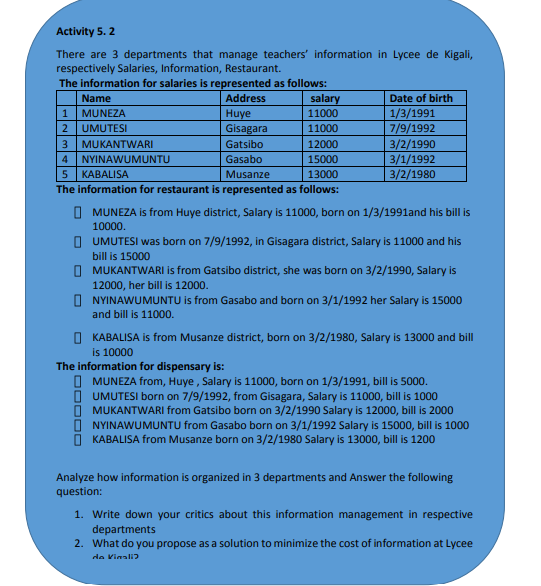 The most efficient way to store data is with the help of a database. A database is made up oftables that contain columns and rows. Each category is given its's own table.For example: a company may have a table for customer information and another for salesnumbers. You can think of a table somewhat like a spreadsheet. Inside a spreadsheet thereare columns and rows of data. For a database however each row is called a record and eachcell is called a field.5.2.1: Traditional File Processing Systems (TFP) approachThis is an approach which was used earlier, prior to DBMS. With this approach, users had towrite their application programs to store data in form of files on the computer permanentstorage device (Hard Disk). A user must have knowledge of programming languages but thisis not easy for a common computer user, even an experienced programmer would find itdifficult to write a program each time a new database was to be created. Each applicationprogram written by a user had to define and manage its own data.a. Advantages of the Traditional File ProcessingCompared to manual management of information, the Traditional File Processing presentsthe following advantages:
 Simplicity: the design of file processing is more simple than designing Database
 Efficiency: file processing cost less and can be more speed than Database
 Customization: you can customize file processing more easily and efficiently thanDatabase because files are related with the application and it have all the data neededfor that application.b. Disadvantages of Traditional File Processing System
 Separation and Isolation of Data: In file-based approach, data are isolated in separate
files.Hence it is difficult to access it.
Separation and Isolation of Data: In file-based approach, data are isolated in separate
files.Hence it is difficult to access it.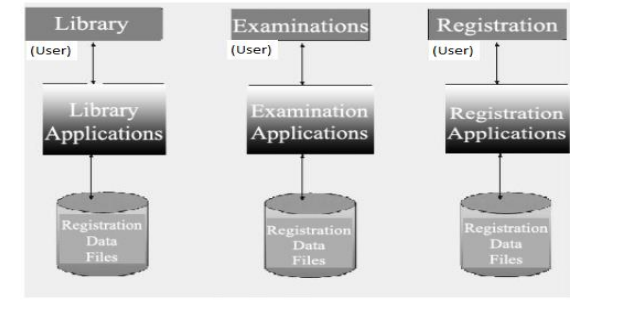

 Duplication of Data: Duplication of data means same data being stored more than
once. This can also be termed as data redundancy.
 Wastage of storage space: Duplication of data leads to wastage of storage space.
If the storage space is wasted it will have a direct impact on cost. The cost will increase.
 Loss of data integrity: Data integrity means that the data contained in the database is
both accurate and consistent (Data inconsistency means different copies of the same
data will have different values).
 Data Dependence: In traditional file processing, the structure of data files is
embedded in the application programs, so any changes to the structure of a file may
require changing all programs that access this file.
 Security problems: File based approach is not secured because different files are
stored in different locations
5.2.2 Database Management System (DBMS)
The Database Management system (DBMS) is a referred to as a software system that is used
to store, access, manage, organize, maintain, modify and delete data from databases. Some
of the most popular software include, Microsoft Access, Oracle, Microsoft SQL Server,
MySQL.
MySQL is, one of the most popular database management systems used by online
entrepreneurs.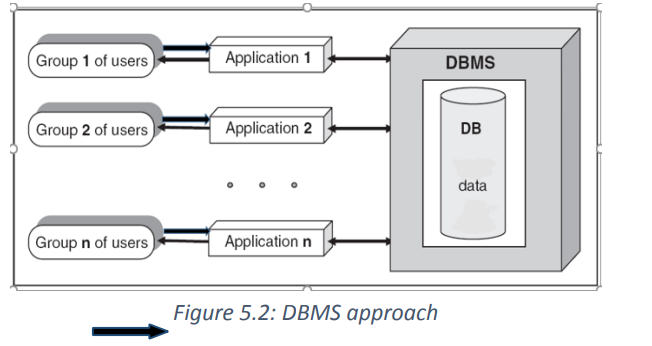 a. The advantages of database management systemThere are many advantages of database management system.
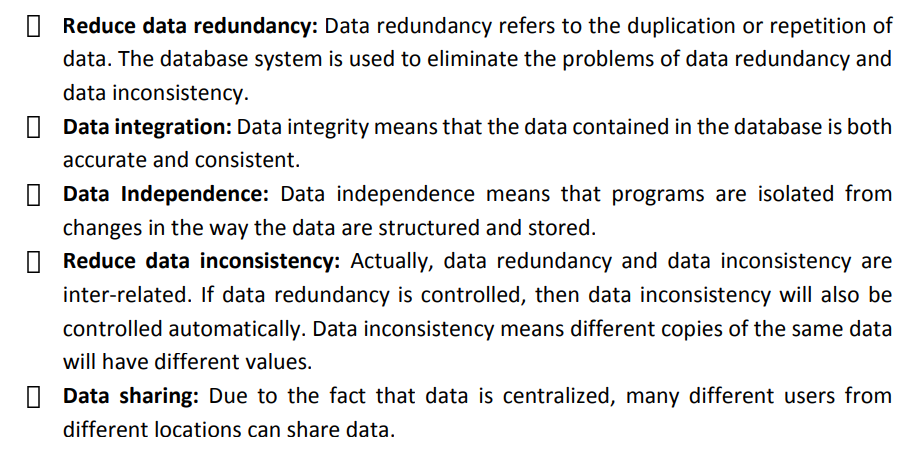
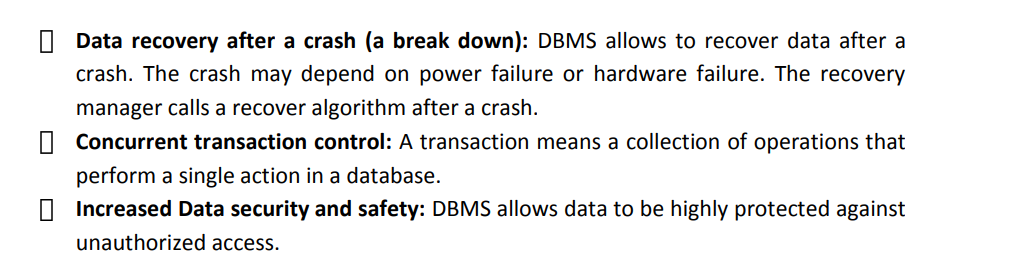
 5.3 Area where database can be applied
 The purpose of the three-level architecture is to separate the user application and the physicalThese days, the evolution of Database management systems has obliged governments, NGOs,and private companies to use databases in their daily basics. They are getting more from theirwork because they can keep records of everything.Database management systems make these organizations work faster to search forinformation and records about any people or products that make them more effective inwork. Below are some of the applications and uses of the database management system(DBMS).
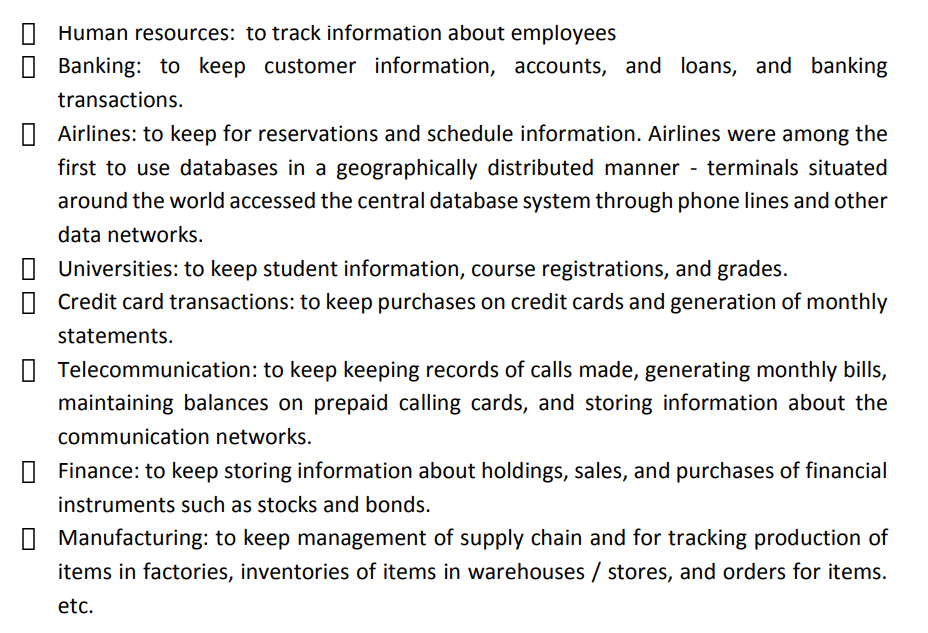
 5.4 Database Access Levels and Users
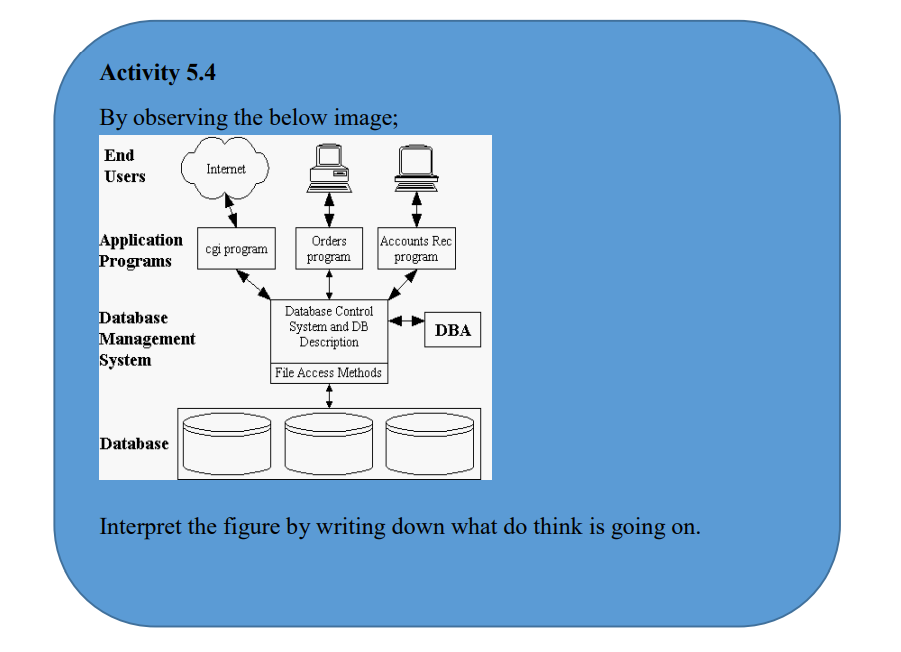 5.4.1 Database access levelsA major purpose of a database system is to provide users with an abstract view of the data.That is, the system hides certain details of how the data are stored and maintained.There are three-levels that form the basis of modern database architectures:a. The Internal LevelThe Internal level has an internal schema, which describes the physical storage structure ofthe database. The internal schema uses a physical data model and describes the completedetails of data storage and access paths for the database.b. The conceptual levelThe conceptual level has a conceptual schema, which describes the structure of the wholedatabase for a community of users.The conceptual schema hides the details of physical storage structures and concentrates ondescribing entities, data types, relationships, user operations, and constraints.Usually, a representational data model is used to describe the conceptual schema when adatabase system is implemented. This implementation conceptual schema is often based ona conceptual schema design in a high-level data model.c. The external or view level:The external view level is closest to the users. It is concerned with the way the data is viewedby individual users. A user can either be an application programmer or an end-user. Theexternal level consists of many different external views of database.At the view level, computer users see a set of application programs that hide details of thedata types.
5.4.2 Database users
database. The reasons of this separation are that different users need different views of the
same data.
1. Users should not have to deal directly with the physical database storage details.
2. The database administrator should be able to change the database storage structure
or storage device without affecting other user's views.
When considering users of a Database system, there are three broad classes to consider:
1. The database administrator (DBA): Responsible for authorizing access to the
database, for coordinating and monitoring its use, acquiring software and hardware
resources, controlling its use and monitoring efficiency of operations.
2. The database designer: Responsible to define the content, the structure, the
constraints, and functions or transactions against the database. They must
communicate with the end-users and understand their needs.
3. The end-user, who accesses: End-users, they use the data for queries, reports and
some of them update the database content.
5.4.3 Data Independence
Data Independence: The ability to modify a scheme definition in one level without affecting
a scheme definition in a higher level is called data independence.
There are two kinds:
1. Logical data independence
The ability to modify the conceptual scheme without causing application programs to be
rewritten.
Immunity of external schemas to changes in the conceptual schema usually done when logical
structure of database is altered.
2. Physical data independence
The ability to modify the internal scheme without having to change the conceptual or external
schemas.Modifications at this level are usually to improve performance.
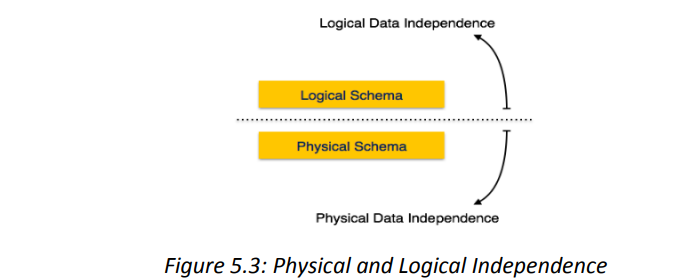
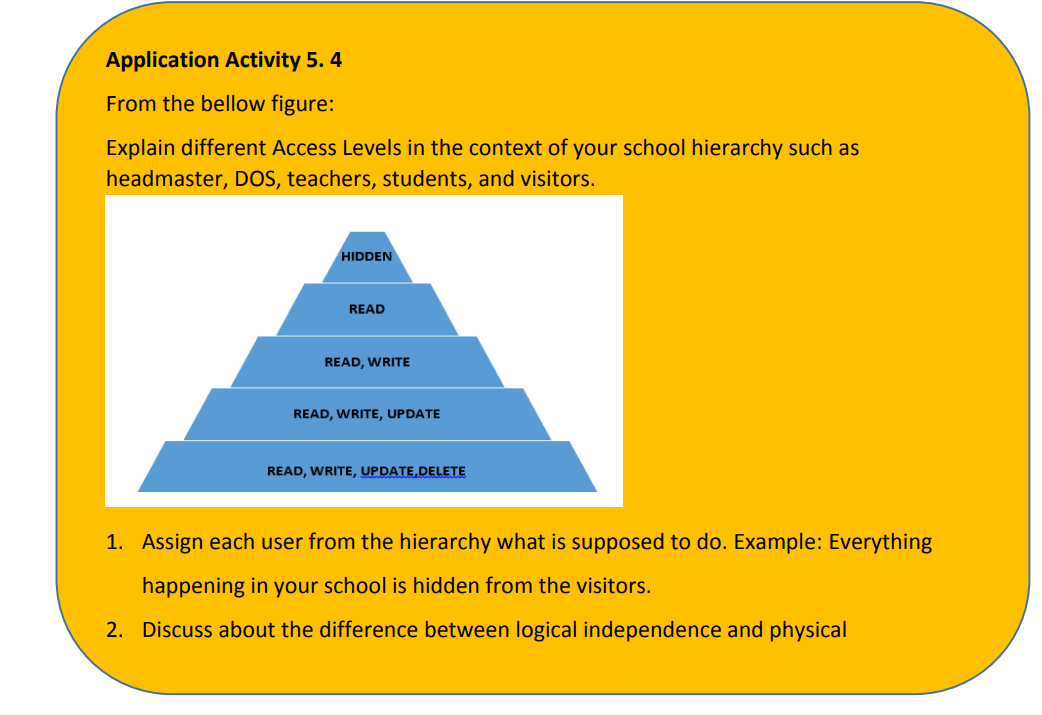
5.5 Relational Model
 5.5.1 Definition of Relational Database Model
The Relational Database Model represents the database as a collection of relations.A relation is nothing but a table of values.
 Every row in the table represents a collection of related data values.
 These rows in the table denote a real-world entity or relationship.
 The table name and column names are helpful to interpret the meaning of values ineach row. The data are represented as a set of relations. In the relational model, dataare stored as tables.5.5.2 Relational Model Concepts in DBMS
 Entity is a real-world object that has certain properties called attributes that definethe nature of the entity.
In Relational model an entity is considered as table. Entities are distinguishable, i.e., each
entity in a pair of entities has a property that makes one entity different from the other entity.
Entities consist of attributes that define their characteristic features/properties.
For example: if we consider a black piece entity on a chessboard and a white piece on a
chessboard, they are distinguishable since the color of the black piece and the white pieceare distinguishable.
 Primary Key is also called a primary keyword, is a key (column) in a relational database
that is unique for each record. Foreign Key is a set of attributes (columns) in a table that refers to the primary key of
another table.
 Alternate Keys is a column or group of columns in a table that uniquely identify
every row in that table.
A table can have multiple choices for a primary key but only one can be set as the primarykey. All the keys which are not primary key are called an Alternate Key.
A table has two properties rows and columns. Rows represent records and columns represent Table: In the Relational model, the relation is saved in the table format.
attributes. Table is a named relational database data set that is organized by rows andcolumns.
 Attribute: Each column in a Table. Attributes are the properties which define a relation.
  Constraint: In DBMS is the set of rules that ensures that when an authorized user
modifies the database they do not disturb the data consistency.
 Tuple: It is nothing but a single row of a table, which contains a single record.
 Degree: is the total number of attributes which in the relation is called the degree of
the relation.
 Cardinality: is the total number of rows present in the table.
 Column: The column represents the set of values for a specific attribute.