General
- Mathematics S3 SB File Uploaded 25/01/22, 13:19
- S3: Maths TG File Uploaded 3/08/22, 14:47
Unit 1: PROBLEMS ON SETS
Key unit competence: By the end of this
unit, the learner should be able to solve problems involving sets.
Unit outline
• Analysis and interpretation of problems using sets.• Representation of a problem using a Venn diagram.
Introduction
Unit focus Activity
Use your knowledge on sets to solve the following problem.
"For planning purposes, a Physical Education (P.E) teacher asked a Senior
3 class of 24 students to vote by raising of hands for the ball games they liked playing from among football, volleyball and basketball. After the voting, he
observed that each of the 24 students liked at least one game. 1 student liked all the three games. 2 students liked volleyball and basketball but not football. 2 students liked volleyball
and football but not basketball. In summary, he noted that 6 students liked
volleyball, 12 liked basketball and 15 liked football’’.The teacher went back to the staffroom and realised that he had not established
the number of students who liked football and basketball but not volleyball.
He has called you to help him determine that number using your knowledge, to avoid calling the whole class to vote again. Kindly, determine the number and give to the teacher.The knowledge of operations on set is very useful in solving some complex real life
problems that are not easy to solve through other analytical methods. In Senior 1 and
Senior 2, we learned some basic concepts and operations on sets. In this unit, we will
practice the application of those concepts and extend them to solve slightly more
challenging problems.1.1 Review of union, intersectionand complement of sets
Activity 1.11. Remind your partners what a set is.
2. Given that A = {East African
community countries}B = {countries bordering Rwanda}
C = {countries which share Lake
Victoria}:(a) With the aid of a map or an
atlas, list the members of:(i) Set A (ii) Set B
(iii) Set C
(b) Find: (i) n(A) (ii) n(B)
(iii) n(C)
(c) Find: (i) (A∩B) (ii) (A∩C)
(iii) (A∪B∪C)
(iv) (A∪B∩C)
3. Given that ε = {1, 2, 3, 4, 5, 6};
A = {2, 3, 5}; B = {3, 4, 5}, list the
members of:(i) A' (ii) B'
(iii) A'∩B (iv) A'∪B'
(v) (A∩B)' (vi) A'∩B'
The set of common elements which appear in two or more sets is called the
intersection of the sets. The symbol used to denote intersection of sets is ∩.
Intersection of sets is also represented by “and” in word statement. For example,
“sets A and B” means A∩B.
When the elements of two or more sets areput together to form a set, the set formed
is known as union of sets. The symbol forthe union of sets is ∪.
Union of sets is also represented by “or” in word statement. For example, “Sets A
or B” means A∪B that is the union of sets A and B.
Complement of a set is the set of all elements in the universal set that are not
members of a given set. The complement of set A is denoted by A'. A universal set contains all the subsets under consideration. It is denoted by the symbol ε.Example 1.1
Given the following sets A = {a, b, c, d, e, f}
and B = {a, b, c, h, i,} find:
(i) (A∩B) (ii) (A∪B)Solution
(i) (A∩B) = {a, b, c}
(ii) A∪B = {a, b, c, d, e, f} ∪ {a, b, c, h, i,}
= {a, b, c, d, e, f, h, i}Example 1.2
Given A = {1, 2, 3, 4, 5}, B = {2, 4, 6} and
C = {1, 3, 5, 7, 9}, answer the questions
below about the sets A, B and C.(a) List the set A ∩ B.
(b) Write down n(A).
(c) List the set A ∪ B.
(d) List the set A ∪ B ∪ C.
Solution
(a) A∩B={2,4}
(b) n(A)= 5
(c) A ∪ B = {1, 2, 3, 4, 5, 6}
(d) A ∪ B ∪ C = {1,2,3,4,5,6,7,9}
Exercise 1.1
1. If A = {2, 4, 6, 8}, B = {1, 2, 3},
C = {6, 8, 10 } and D = {2, 3, 6}find:
(a) n(A) (b) n (B) (c) n (C)(d) n (A) + n (B)
(e) n (A) + n (C) – n (B)
(f) A∪B∪C
(g) n(A∪B∪C)
n(A∪C∪D)
2. Find the union of the following sets:
A = {positive even numbers from 0 to 20}
B ={Integers greater than -2 but less than 9}
C = {Prime numbers between 1 and 7}
3. If P ={counting numbers from 1 to 15}
and Q ={Even numbers from 2 to14},find: (i) (P∪Q)' (ii) (P∩Q)'
(iii) ε (iv) n(ε)4. Given that A = {3, 5}, B = {7, 9, 11,13},
C = {3, 5, 7} and ε = {3, 5, 7, 9,11, 13},
find:
(i) A' (ii) (A∩B)' (iii) B'(iv) (A∪B) (v) (A∩C)'
(vi) (B∩C)'
1.2 Representation of problems using a Venn diagram
1.2.1 Venn diagrams involving two sets
Activity 1.2
A survey was carried out in a shop to find the number of customers who bought bread or milk or both or neither. Out of a total of 79 customers for the
day, 52 bought milk, 32 bought bread and 15 bought neither.(a) Without using a Venn diagram, find
the number of customers who:
(i) bought bread and milk
(ii) bought bread only
(iii) bought milk only
(b) With the aid of a Venn diagram,
work out questions (i), (ii) and (iii)in (a) above.
(c) Which of the methods in (a) and(b) above is easier to work with?
Give reasons for your answer.From the activity above, we clearly see that a Venn diagram plays a very important role
in analysing the set problem and helps in solving the problem very easily.
First, express the data in terms of set notations and then fill the data in the Venn
diagram for easy solution. Some important facts like “intersection”,
“union” and “complement” should be well considered and represented when drawing
Venn diagrams. Consider two intersecting sets A and B
such that A = {a, b, c, d, e, f} and
B = {a, b, c, d, g, i, j, k, l}.
We represent the two sets in a set diagram asshown in Fig 1.1 below.

The union of sets A and B is given by the number of elements.
n (A ∪ B) = n(A) + n(B) - n(A ∩ B)
In the Venn diagram in Fig 1.1,
n(A) = 6, n(B) = 9 and n(A ∩ B)=4
⇒ n(A∪B)= 6 + 9 - 4 = 11Example 1.3
Fig. 1.2 shows the marks out of 15 scored
by a number of Senior 3 students in groups
C and D.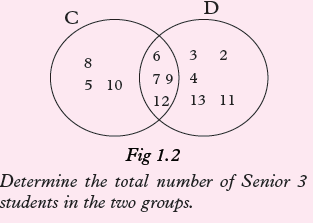
Solution
n(C∪D) = n(C) + n(D) - n(C∩D)
= 7 + 9 - 4
= 16 - 4
= 12Example 1.4
A survey involving 120 people about their
preferred breakfast showed that;55 drink milk at breakfast,
40 drink juice at breakfast and 25 drink both milk and juice at breakfast.(a) Represent the information on a Venn diagram.
(b) Calculate the following:
(i) Number of people who take milk only.
(ii) Number of people who take neither milk nor juice.
Solution
(a) Let A be the set of those who drinkmilk and B be the set of those
who drink juice, x be the numberof those who drink milk only,
y be the number of those who drink juice only and z represents number of
those who did not take any.
By expressing data in set notation;
n(A) = 55, n(B) = 40, n(A∩B′) = x,
n(A∩B) = 25, n(A′∩B)= y.
n(ε) = 120.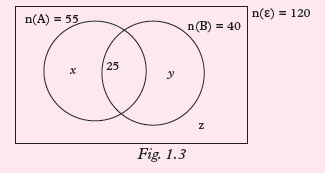
(b) (i) We are required to find the number of
those who take milk only.
x = 55 – 25 = 30
So, 30 people take milk only.(ii) To find the value of z;
30 + 25 + 15 + z = 120.
z = 120 – (30+ 15 + 25).
z = 120 – 70 ⇒ z = 50.
So, 50 people take neither eggs nor juice
for breakfast.Example 1.5
In a class of 20 pupils, 12 take Art (A) and
10 take Chemistry (C). The number that
take none is half the number that take both.(a) Represent the information on a Venn
diagram.(b) Use the Venn diagram to determine the
number that take:
(i) Both (ii) NoneSolution
We first extract the data and represent it in set notation.
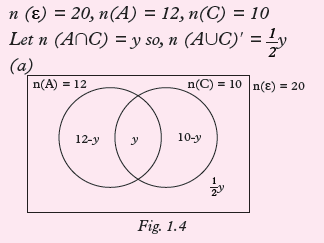
(b) By solving for the value of y;
12 – y + y + 10 – y + 1/2y = 20So, 22 – 1/2y = 20
Collecting like terms together,
we get, – 1/2y = 20 – 22
– 1/2y = –2
–y = –4y = 4
(i) Those who take both are equal to
4.
(ii) Those who take none
= 1/2 × 4 = 2Exercise 1.2
1. In a certain group of children, all of them study French or German or
both languages. 15 study French but
not Germany, 12 study German of
whom 5 study both languages.(a) Draw a Venn diagram to show
this information.(b) Calculate how many children are
there in the group.2. In a class of 30 students, students are required to take part in at least
one sport chosen from football and volleyball. 18 play volleyball, 22 play
football. Some play the two sports.(a) Draw a Venn diagram to show this information.
(b) Use your diagram to help
determine the number of students who play the two sports.3. In a group of 17 pupils, 10 offer Economics and 9 offer Mathematics.
The number that offer both Economics and Mathematics is twice the number
that offer none of the two subjects.(a) Draw a Venn diagram to represent
the information.(b) Calculate the number of pupils
that;
(i) Offer both subjects(ii) Offer only one subject
(iii) Offer none of the subjects.
4. Of 35 students in a class, 26 play football, 20 play volleyball and 17
play both games.(a) Represent the information on a Venn diagram.
(b) Calculate the number of students
who play neither of the games.5. In a school of 232 students, 70 are members of Anti-AIDS club, 30 are
members of debating club and 142 do not belong to any of the mentioned
clubs.
(a) Represent the information on the Venn diagram.(b) Use the Venn diagram to calculate
the number of students who belong to debating club only.DID YOU KNOW?
Being a member of Anti-AIDS club can help you to learn many methods
of keeping yourself safe and free from HIV-AIDS. Being a member
of debating club can also help you to become a good public speaker.6. The pupils of senior three class were asked about the sports they play. 17 of
them play football. 14 play tennis. 5 of them play both football and tennis.
There are 30 pupils in the class.(a) Draw a Venn diagram to show this information.
(b) How many play football but not tennis?
(c) How many play neither football nor tennis?
7. For the two events A and B,
we aregiven that, n(A∩B) = 5, n(A) = 11, n(A∪B) = 12 and n(B' ) = 8.
(a) Copy and complete the Venn diagram below.

b) Find:
(i) n(A∩B)′(ii) n(A′)
8. A group of 50 married men were asked if they gave their wives
flowers or chocolates on Valentine’s Day. Results revealed that 31 gave
chocolates, 12 gave flowers and 5 gave both flowers and chocolates.(a) Represent the information on aVenn diagram.
(b) Find the number of men who;
(i) Gave flowers only.
(ii) Gave Chocolates only.
(iii) Gave neither flowers norchocolates.
1.2.2 Venn diagrams involving three
setsActivity 1.3
A survey was done on 50 people about which food they like among rice, sweet
potatoes and posho. It was found out that 15 people like rice, 30 people like
sweet potatoes, 19 people like posho. 8 people like rice and sweet potatoes,
12 rice and posho, 7 people like Sweet potatoes and posho. 5 people like all the
three types of food.(a) Extract the data and represent it in set notation.
(b) Without using a Venn diagram;
(i) Find the number of people who like none of the foods.
(ii) Find the number of those who like posho and rice only.
(iii) Find the number of those who like sweet potatoes and rice only.
(c) With the help of a Venn diagram
find out the solutions for (b) (i), (ii) and (iii) above.
(d) Was it easy to do (b) (i), (ii) and
(iii) without a Venn diagram?
From the above activity, it is clearly seen that without a Venn diagram, the problems
involving three or more sets become complicated to handle.
A Venn diagram makes the problem easier because we can represent the data
extracted in each region and then calculate the values required.
Consider the venn diagram shown in Fig. 1.6
showing the numbers of students who take the foreign languages German (G),
Spanish(S) and French(F) in a college.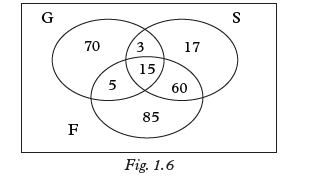
The total number of students taking languages is given by the union of the three
sets as shown by the following formulan(G∪S∪F) = n(G) + n(S) + n(F)
- {n(G∩S) + n(G∩F)+(S∩F)+n(G∩S∩F)}From the Venn diagram in Fig 1.6,
n(G∪S∪F) = 93 + 95 + 165
- (18 + 20 + 20 + 75) + 15
= 353 - 113 + 15
= 255Example 1.6
The students in Senior 3 class did a survey on their names regarding whether they
contained the letters B, C and D. The following Venn diagram shows the results of
the survey in terms of the number of names in each category: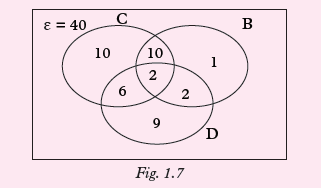
Use the Venn diagram to determine the
number student's names that contained in;(a) All the three letters
(b) Letter D
(c) Letters B and D but not C
(d) Only two of the letters
(e) The total number of students
Solution
(a) All the three letters
n(B∩C∩D) = 2
(b) n(D)= 9 + 6 +2 +2 =19(c) Letters B and D but not C
n(B∩D)-n(B∩C∩D)= 4 -2 = 2(d) Only two of the letters
= 6 +10 + 2 =18(e) The total number of students
n(B∪C∪D)= n(B) + n(C) + (C)
-{n(B∩C) + n(B∩D)+n(C∩D)} +n(B∩C∩D)
= 15 + 28 + 19 -{12 + 4 + 8} + 2
= 62 - 24 + 2
= 40 StudentsExample 1.7
A group of 40 tourists arrived in Rwanda and visited Akagera National park
(A), Nyungwe forests (N) and Virunga mountains (V). Results showed that 33
visited Akagera, 21 visited Nyungwe and
23 visited Virunga. 18 visited both Akagera and Nyungwe, 10 visited both Nyungwe and
Virunga, and 17 visited both Akagera and Virunga. All tourists visited at least one of
the places.
(a) Represent the information on a Venn diagram.(b) Find the number of tourists that visited:
(i) Akagera only.
(ii) Did not visit Nyungwe.
Solution
n(ɛ) = 40.
n(A) = 33, n(N) = 21, n(V) = 23.
n(A∩N) = 18, n(N∩V) = 10,
n(A∩V) = 17.
Let n(A∩N∩V) = y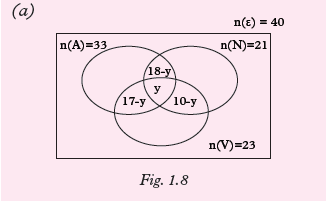
n(A) only = n(A∩N′∩V′).
n(A∩N′∩V′) = 33 – (18 – y + y + 17 – y).
n(A∩N′∩V′) = 33 – 35 + y = y – 2.
n(A∩N′∩V′) = y – 2.
n(N) only = n(A′∩N∩V′).
n(A′∩N∩V′) = 21 –(18 – y + y + 10 – y).
n(A′∩N∩V′) = 21 – 28 + y= –7 + y.
n(A′∩N∩V′) = y – 7.
n(V) only = n(A′∩N′∩V).
n(A′∩N′∩V) = 23 – (17 – y + y + 10 – y).
n(A′∩N′∩V) = 23 – 27 + y.
n(A′∩N′∩V) = y – 4.
The Venn diagram in Fig. 1.9 shows the
data in specific regions.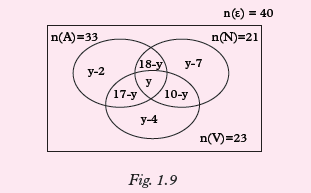
y – 2 + 18 – y + y- 7 + 17– y + y + 10 - y + y – 4 = 40
y + 32 = 40.
y = 8.(b) (i) Those who visited Akagera only
are y – 2 = 8 – 2 = 6.(ii) Those who did not visit Nyungwe
are y – 4 + 17 – y + y – 2
= 8 – 4 +17 – 8 + 8 – 2
= 19
Example 1.8The Venn diagram below shows the allocation of the members of the Board
of Directors of a school in three different committees;Academic (A), Production (P) and Finance (F).
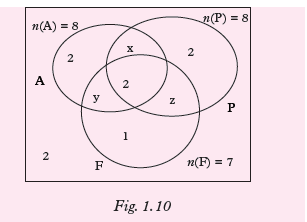
(a) Determine the values of x, y and z.
(b) What is the total number of members
in the Board of Directors?(c) Find the number of those who are not
members of the academic committee.(d) How many belong to at least two committees?
Solution
(a) For Academic,
2 + x + 2 + y = 8.
x + y = 8 - 4.
x + y = 4........(i)
For Production,
2 + x + 2 + z = 8.
x + z = 8 – 4.
x + z = 4................(ii)
For Finance,1+ y + 2 + z = 7.
y + z = 7 – 3.
y + z = 4..............(iii)
Make x the subject in equation (i)
x = 4 — y........(iv)
Substitute equation (iv) into (ii)
4 – y + z = 4.
–y + z = 0........(v)
Solving (iii) and (v) simultaneously
y + z = 4
+ – y + z = 02z = 4 ⇒ z = 2
So, y = 4 - z = 4 - 2 = 2
∴ y = 2.
x + y = 4 and so x = 4 – y = 4 – 2 = 2.
∴ x = 2.(b) Total number of members are
2 + 2 + 2 + 2 + 2 + 2 + 1 + 2 = 15
(c) Those who are not members of academic
committee are: 2 + 1 + z + 2
= 2 + 1 + 2 + 2 = 7
(d) Those who belong to atleast two
committees are: y + 2 + x + z
= 2 + 2 + 2 + 2 = 8Exercise 1.3
1. In a class of 53 students, 30 study
Chemistry, 20 study Physics, 15 study Mathematics. 6 study both
Chemistry and Physics, 4 study both mathematics and Chemistry, 5 study
both Physics and Mathematics. All
the students study at least one of thesubjects.
(a) Represent the information on a Venn diagram.(b) Find the number of students
who study all the three subjects.(c) How many study;
(i) Physics only.
(ii) Physics but not Mathematics
(iii) Two subjects only.
2. Out of 100 students in a school, 42 take English, 35 take Kiswahili and
30 take French. 20 take none of the subjects, 9 take French and English,
10 take French and Kiswahili, 11 take English and Kiswahili.(a) Represent the information on a Venn diagram.
(b) Find the number of students who
take three subjects.
(c) Find the number of students who
take English only.
(d) Find the number of students who
take Kiswahili and French.
3. A school has a teaching staff
of 22 teachers. 8 of them teach
Mathematics, 7 teach Physics and
4 teach Chemistry. 3 teach both
Mathematics and Physics, none
teaches Mathematics and Chemistry.
No teacher teaches all the three
subjects. The number of teachers
who teach Physics and Chemistry is
equal to the number of teachers who
teach Chemistry but not Physics.
(a) Represent the data on a Venn
diagram.
(b) Find the number of teachers who
teach;(i) Mathematics only.
(ii) Physics only.
(iii) None of the three subjects.
4. In a class of 60 students, 15 are members of debating club (D), 30
are members of never again club (A) and 20 are members of Science club
(S). 3 are members of debating and never again only. 4 are members of
never again and science club only while 1 is a member of debating and
science club only. 7 students do not belong to any of the clubs.(a) Represent the data on the Venndiagram.
(b) Find the number of students that belong to;
(i) Only one club.
(ii) Atleast two clubs.
(iii) Do not belong to debatingclub.
5. In a class of 45 students, 7 like Mathematics (M) only, 2 like Physics
(P) only, and 3 like Chemistry (C) only. 18 like Mathematics and Physics,
16 like Physics and Chemistry, 14 like Mathematics and Chemistry. The
number of students who like none of the three subjects is half the number
of those who like all the three subjects.(a) Show the above information in a Venn diagram.
(b) Determine the number of students who;
(i) Like none of the three subjects.
(ii) Who do not likeMathematics.
6. A survey involving 50 people was done to find out which religious
events they attend among Catholics,Protestants, and Muslim. It was
found out that 15 people attend Catholic event, 30 people attend
Protestant event, 19 people attend Muslim event. 8 people attend both
Catholic and protestant events, 12 people attend both Catholics and
Muslim events, 7 people attend both Protestant and Muslim events. 5
people attend all the three categories of religious events.(a) Represent the information onthe Venn diagram.
(b) (i) How many people attendCatholic event only?
(ii) How many attend Catholicand Protestant events, but
not at Muslim event?(iii) How many people do notattend any of these religious
events?BEWARE!!!
Religious differences should not cause divisionism. We should all
learn to value one another to stay together as peaceful Rwandans.Unit Summary
• A set - is a well-defined collection of distinct objects, considered as an object in its own right.
For example, the numbers 2, 4, and 6 are distinct objects when considered
separately, but when they are considered collectively, they form a
single set of size three, written {2, 4, 6}.• Union of a set: In set theory, theunion (denoted by ∪) of a collection
of sets is the set of all elements in the collection. It is one of the fundamental
operations through which sets can be combined and related to each other.
For example if A = {1, 2, 3, 4, 5} and
B = {4, 5, 6, 7, 8, 9}, then we have a
union set for A and B as:
A∪B = {1, 2, 3, 4, 5, 6, 7, 8, 9}• Intersection of sets: In mathematics, the intersection A∩B of two sets
A and B is the set that contains all elements of A that also belong to B
(or equivalently, all elements of B that also belong to A), but no other
elements. For three sets A, B and C,
we write A∩B∩C.
For example, if A = {1, 2, 3, 4, 5} and
B = {4, 5, 6, 7, 8, 9}, then we have an intersection set for A and B as
A∩B = {4, 5}• Compliment of a set. In set theory, the complement of a set A refers
to elements not in A. The relative complement of A with respect to a set
B, also termed the difference of sets A and B, written as B \ A, is the set of
elements in B but not in A. For example, consider universal set
U = {1, 2, 3, 4, 5, 6, 7}, and we will define our subset as A = {1, 3, 4}.
The complement of A is the set of all the elements in U that are not in A.
Therefore, the complement of A is
{2, 5, 6, 7}.• A Venn diagram. It is a diagram representing mathematical or logical
sets pictorially as circles or closed curves within an enclosing rectangle
(the universal set), common elements of the sets being represented by
intersections of the circles.Unit 1 Test
1. The following facts were discovered in a survey of course preferences of
110 pupils in senior six: 21 like engineering only, 63 like engineering,
55 like medicine and 34 like none of the two courses.(a) Draw a Venn diagram representing this information.
(b) (i) How many like Engineering or Medicine?
(ii) How many like Engineering and Medicine?
(iii) How many like only Medicine?
2. A survey was carried out in a shop to find out the number of customers
who bought bread or milk or both or neither. Out of a total of 79 customers
for the day, 52 bought milk, 32 bought bread and 15 bought neither.(a) Draw a Venn diagram to show this information and use it to
find out:(b) (i) How many bought bread and milk.
(ii) How many bought breadonly.
(iii) How many bought milk only.
3. Five members of Mathematics club
conducted a survey among 150 students of Senior 3 about which
careers they wish to join among Engineering and Medical related
courses. 83 want to join Engineering, 58 want to join medical related
courses. 36 do not want to join any of the careers.
Represent the data on the Venn diagram. Find the number of students
who wish to join both careers.4. A survey was done on 50 people about
which hotels they eat from among H, S and L. 15 people eat at hotel H, 30
people eat at hotel S, 19 people eat at hotel L, 8 people eat at hotels H and
S, 12 people eat at hotels H and L, 7 people eat at hotels S and L. 5 people
eat at hotels H, S and L.
(a) How many people eat only at Hotel H?(b) How many people eat at hotels H and S, but not at L?
(c) How many people don’t eat at any of these three hotels?
5. A survey involving 50 students was
carried out and research revealed that 21 of them like Kiswahili (K)
while 32 of them like Mathematics(M).(a) Represent the information inthe Venn diagram.
(b) How many students like only one subject?
6. A group of 50 people were asked about the sections they read very
keenly in a newspaper among politics, advertisements and
sports. The results showed that 25 read politics, 16 read advertisement,
14 read sports. 5 read both politics and advertisement, 4 read both
advertisement and sports, 6 read both politics and sports, and 2 read all the three sections.(a) Represent the data on the Venn diagram.
(b) Find the number of people who read;
(i) At least one of the three sections.
(ii) Only one of the three sections.
(iii) Only politics.
7. Given that, n(A∪B) = 29, n(A) = 21,
n(B) = 17, n(A∩B) = x.
(a) Write down in terms of the elements of each part.
(b) Form an equation and hence find the value of x.
8. In a school, each student takes atleast one of these subjects; Mathematics,
Physics and Chemistry. In a group of 60 students, 7 take all the subjects,
9 take Physics and Chemistry only, 8 take Physics and Mathematics, 5 take
Mathematics and Chemistry only. 11 students take Mathematics only,
2 take Physics only and 15 students take Chemistry only.(a) Draw a Venn diagram for the information above.
(b) Find the number of those who do not take any of the subjects.
(c) Find the number of students who take Mathematics.
- S3 : Matematics SB File Uploaded 22/07/21, 15:31
- S3: Mathematics TB File Uploaded 27/10/21, 13:26
- ASSESSMENT File Uploaded 24/04/20, 15:24