Topic outline
General
- Mathematics S5 SB Core File Uploaded 28/01/22, 14:24
Unit 1:Trigonometric Formulae, Equations and Inequalities

Introduction
As we saw it in senior 4, trigonometry studies relationship involving lengths and angles of a triangle. The techniques in trigonometry are used for finding relevance in navigation particularly satellite systems and astronomy, naval and aviation industries, oceanography, land surveying and in cartography (creation of maps). Now, those are the scientific applications of the concepts in trigonometry, but most of the mathematics we study would seem (on the surface) to have little real-life application. Trigonometry is really relevant in our day to day activities.
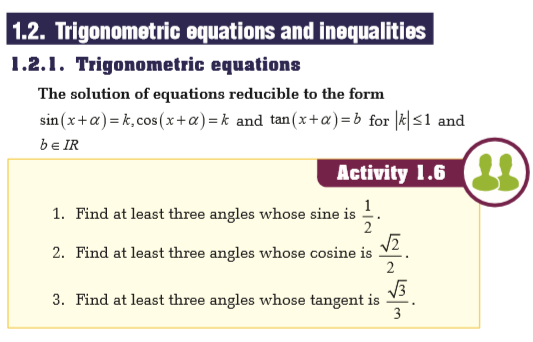
1.1. Trigonometric formulae

1.1.1. Addition and subtraction formulae
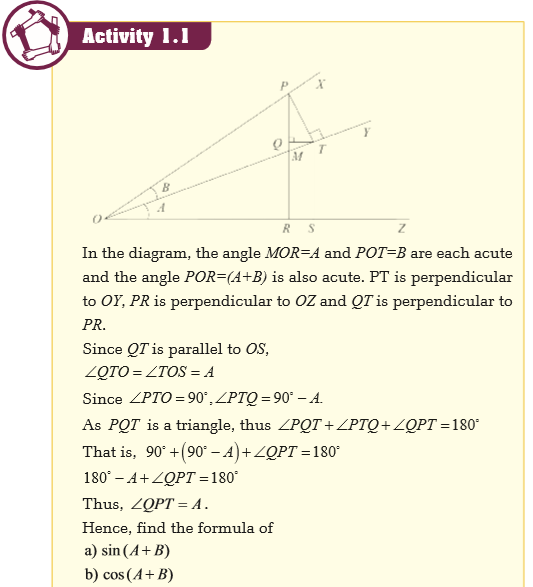
From Activity 1.1, the addition and subtraction formulae are:

Addition and subtraction formulae are useful when finding trigonometric number of some angles.


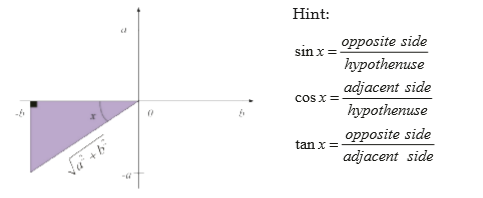
The given information produces the triangle shown below.
Note the signs associated with a and b. The Pythagorean Theorem is used to find the hypotenuse.


 Files: 2
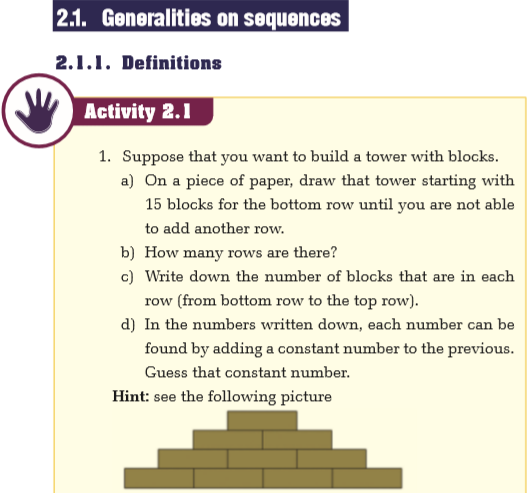
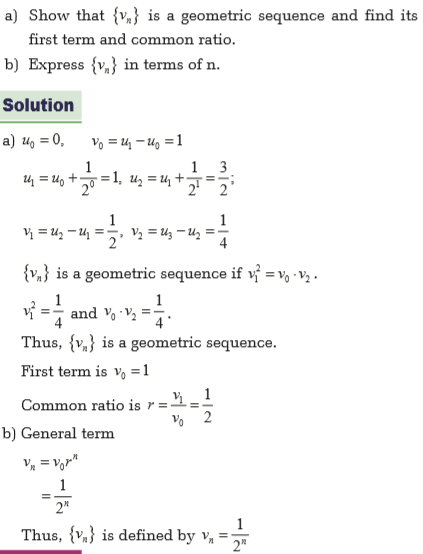
Unit 2:Sequences

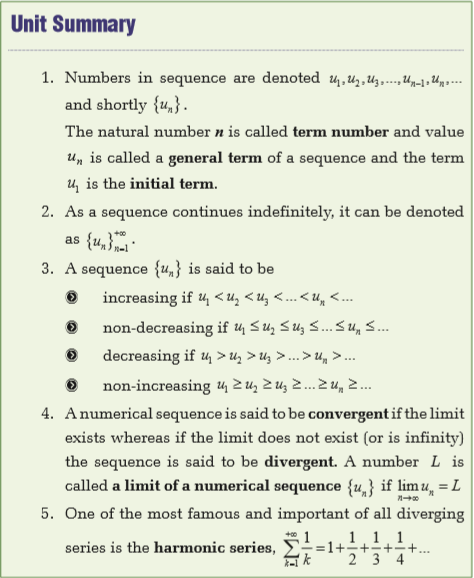
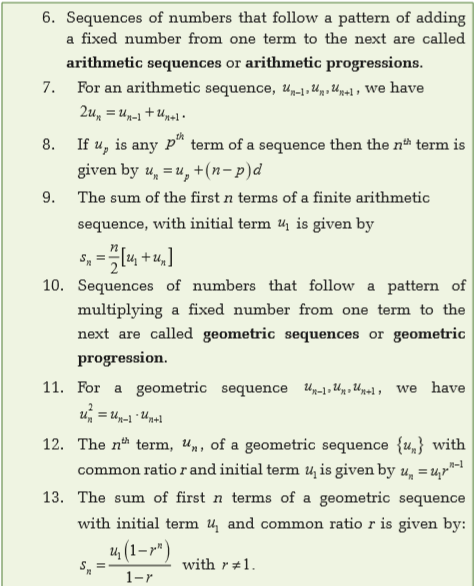
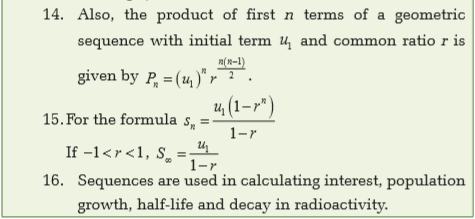
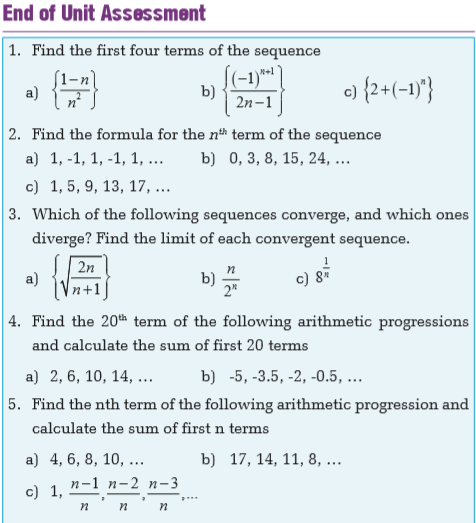
Introduction
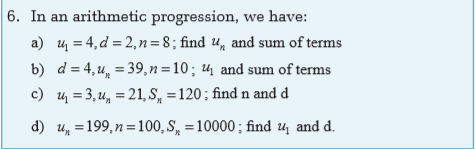
Consider a scientist doing an experiment; he/she is collecting data every day. Let 1 u be the data collected the first day, 2 u be the data collected the second day, be the data collected the third day, and so on…, and n u be the data collected after n days. Clearly, we are generating a set of numbers with a very special characteristic. There is an order in the numbers; that is, we actually have the first number, the second number and so on. A sequence is a set of real numbers with a natural order.


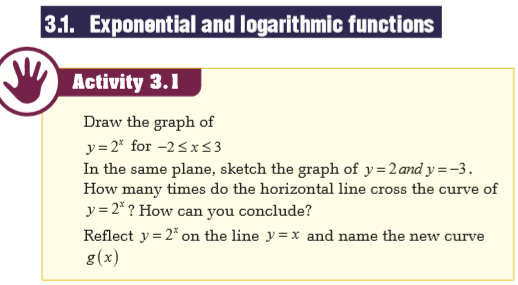
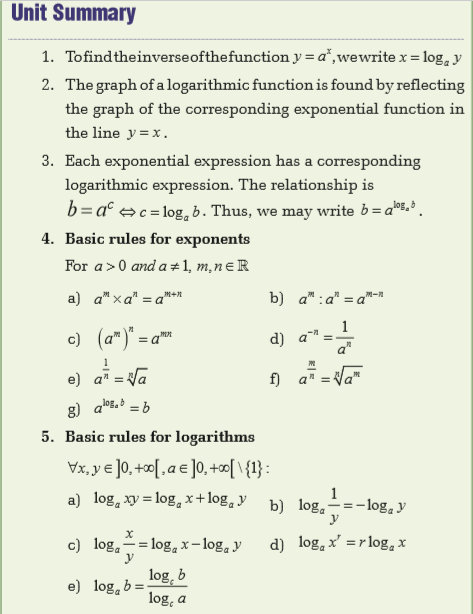
Unit 3:Logarithmic and Exponential Equations

Introduction
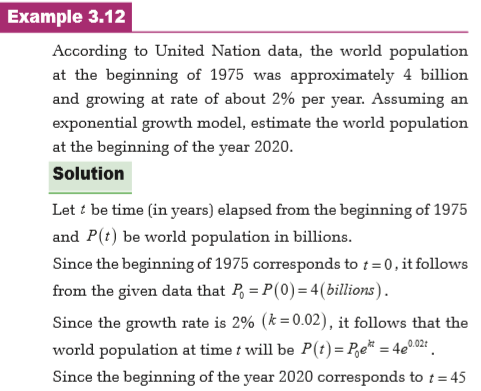
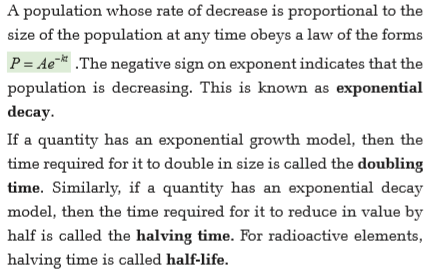
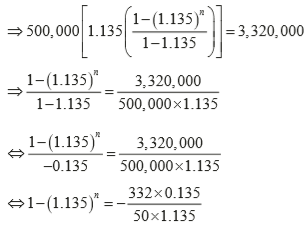
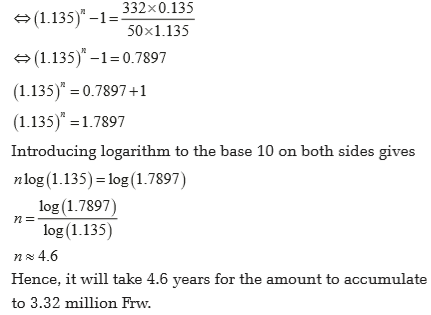
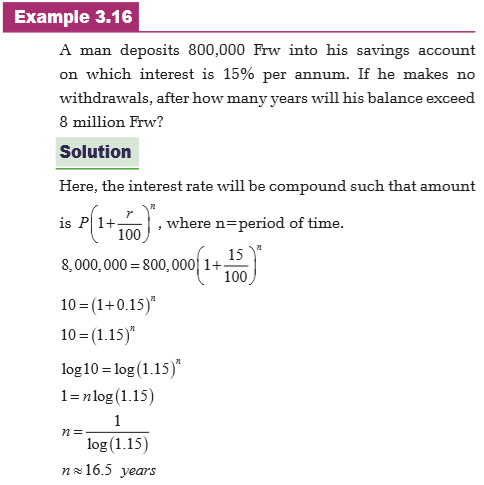
People such as scientists, sociologists and town planners are often more concerned with the rate at which a particular quantity is growing than with its current size. The director of education is more concerned with the rate of at which the school population is increasing or decreasing than with what the population is now, because he/she has to plan for the future and ensure that there are enough(and not too many) school places available to meet demand each year. The scientists may need to know the rate at which a colony of bacteria is growing rather than how many of the bacteria exists at this moment, or the rate at which a liquid is cooling rather than the temperature of the liquid now, or the rate at which a radioactive material is decaying rather than how many atoms currently exist.
One thing that each of these populations has in common is that their rate of increase is proportional to the size of the population at any time. Exponential and logarithmic equations are really relevant in our day to day activities. The above events show us the areas where this unit finds use in our daily activities.


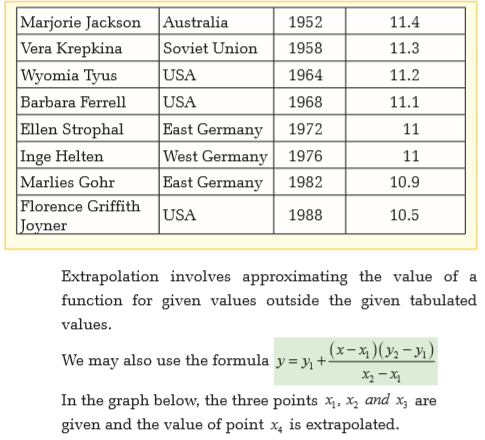
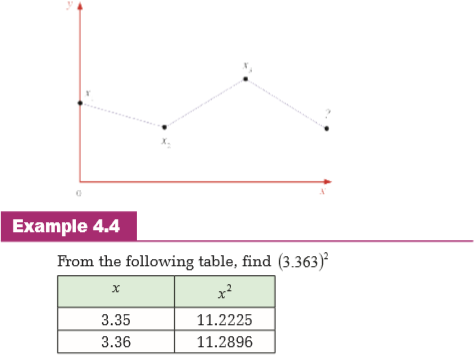
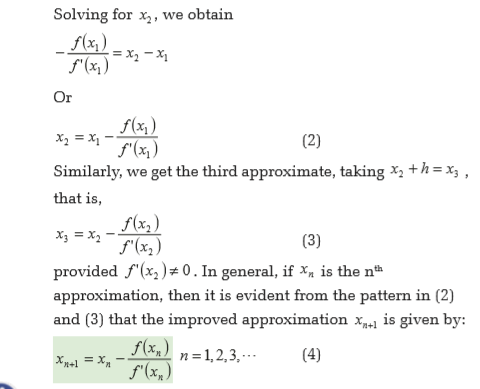
Unit 4:Solving Equations by Numerical Method
Introduction
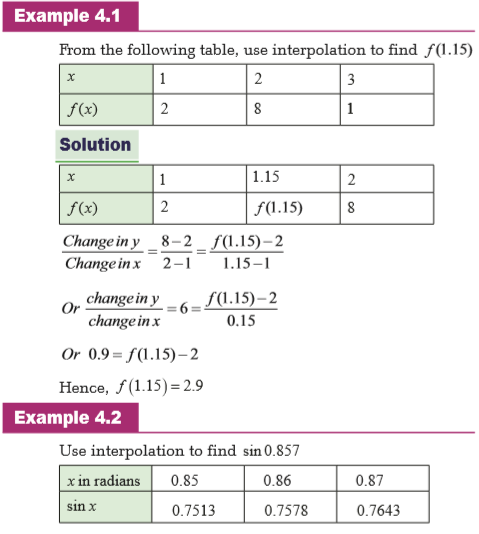
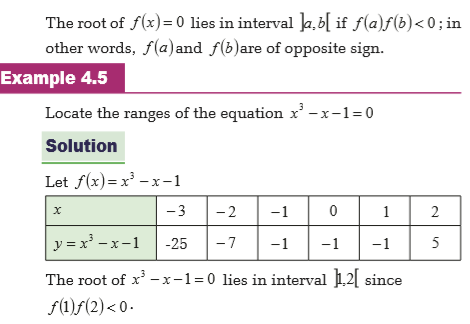
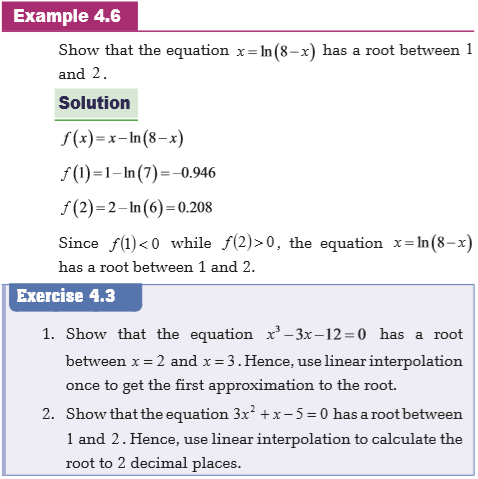
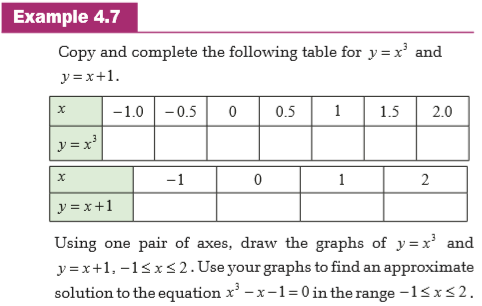
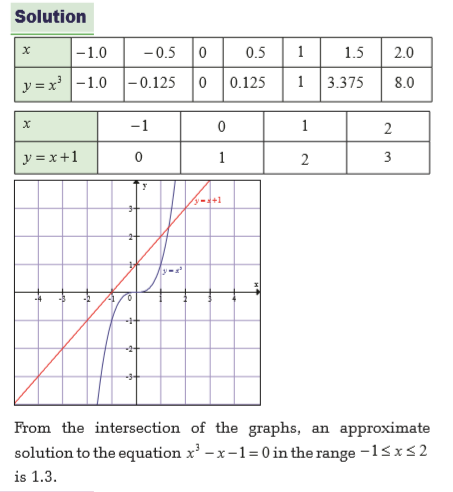
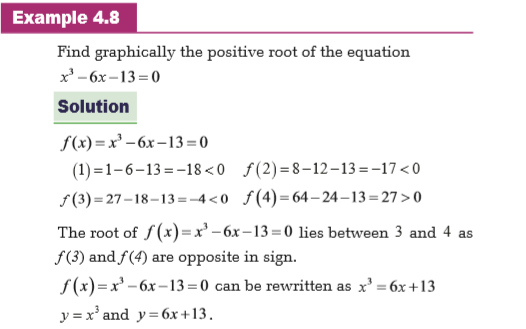
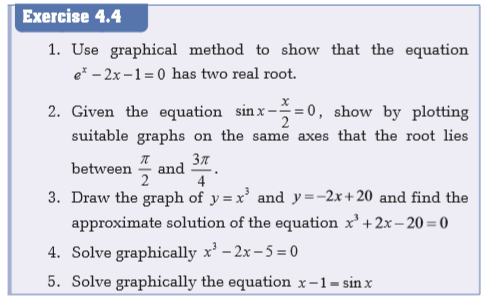
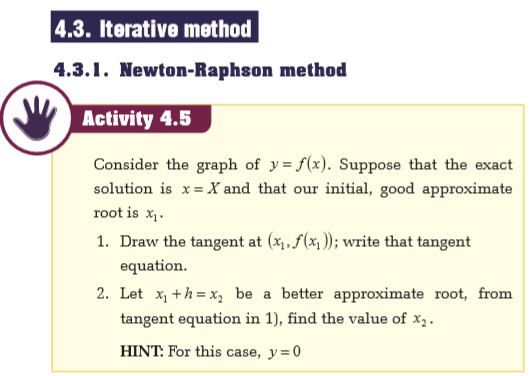
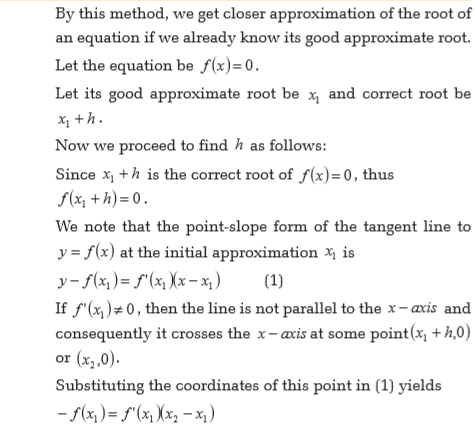
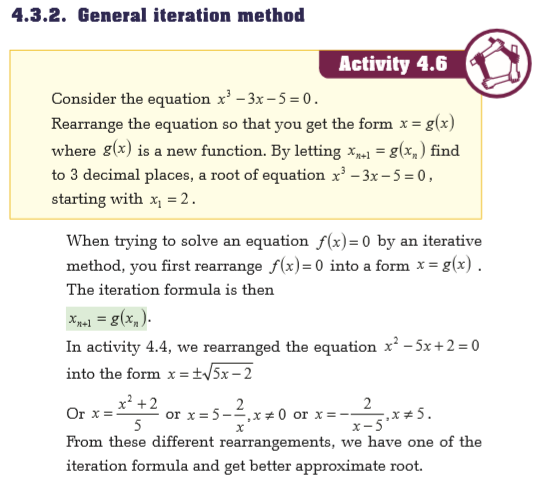
We know how to solve linear equations and quadratic equations, either by factorising, by formula or by completing the square. In some instances, it may be almost impossible to use an exact method to solve an equation for example, 0 sin1 = −− θθ precisely. In such cases, we may be able to use other techniques which give good approximations to the solution. In this unit, we reconsider such approximations in a more formal way.


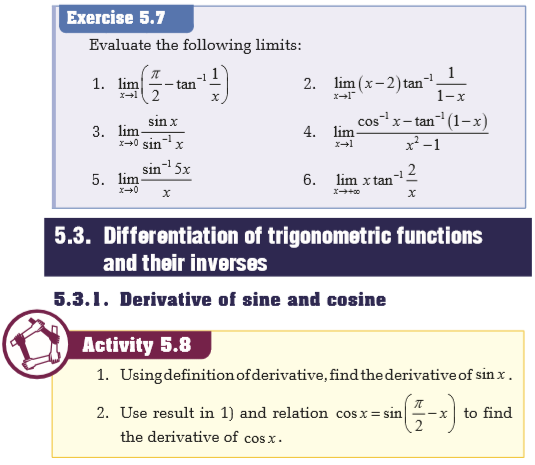
Unit 5:Trigonometric Functions and their Inverses

Introduction
The techniques in trigonometry are used for finding relevance in navigation particularly satellite systems and astronomy, naval and aviation industries, oceanography, land surveying, and in cartography (creation of maps). Now those are the scientific applications of the concepts in trigonometry, but most of the mathematics we study would seem (on the surface) to have little real-life application. Trigonometry is really relevant in our day to day activities. In this unit, we will see how we can use trigonometry to resolve problems we might encounter.


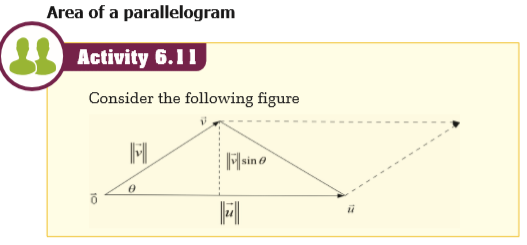
Unit 6:Vector Space of Real Numbers

Introduction
A vector space (also called a linear space) is a collection of objects called vectors, which may be added together and multiplied by numbers, called scalars in this context.
To put it really simple, vectors are basically all about directions and magnitudes. These are critical in basically all situations.
In physics, vectors are often used to describe forces, and forces are added in the same way as vectors.
For example, in Classical Mechanics: Block sliding down a ramp, you need to calculate the force of gravity (a vector down), the normal force (a vector perpendicular to the ramp), and a friction force (a vector opposite the direction of motion).


Unit 7:Matrices and Determinant of Order 3
Introduction
A matrix is a rectangular arrangement of numbers, expressions, symbols which are arranged in rows and columns.
Matrices play a virtual role in the projection of a three dimensional image into a two dimensional image. Matrices and their inverse are used by programmers for coding or encrypting a message. Matrices are applied in the study of electrical circuits, quantum mechanics and optics. A message is made as a sequence of numbers in a binary format for communication and it follows code theory for solving. Hence with the help of matrices, those equations are solved. Matrices are used for taking seismic surveys.


Unit 8: Points, Straight Lines, Planes and Sphere in 3D
My goals
By the end of this unit, I will be able to:- plot points in three dimensions.
- find equation of straight lines in three dimensions.
- find equation of planes in three dimensions.
- position of lines and planes in space.
- find equation of sphere.
Introduction
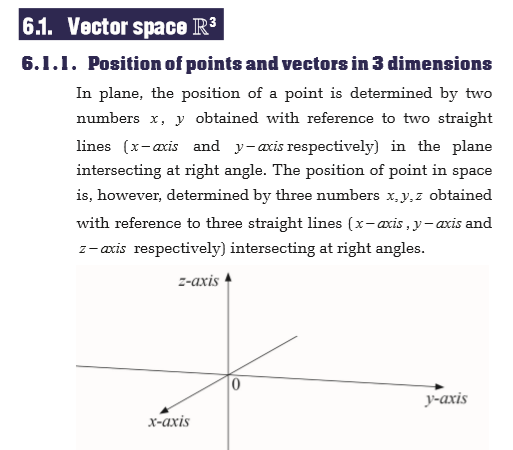
In 2-Dimensions, the position of a point is determined by two coordinates x and y. However, in 3-Dimensions the position of point determined by three coordinates x, y, z obtained with reference to three straight lines (x-axis , y-axis and z-axis respectively) intersecting at right angles.
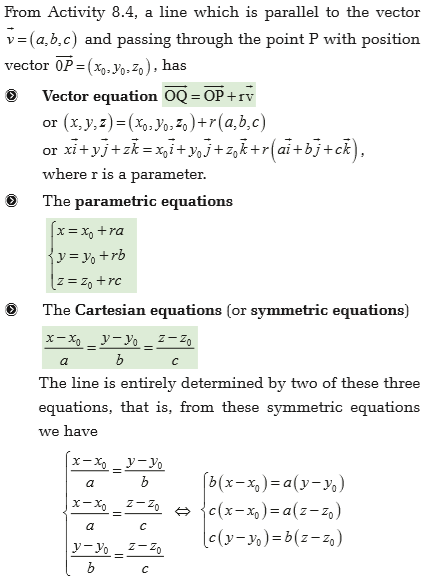
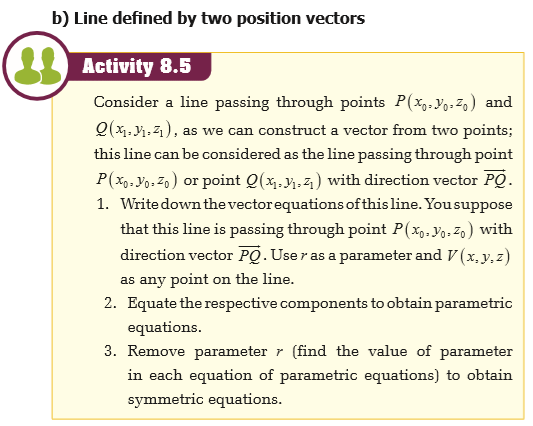
In the plane, a line is determined by a point and a number giving the slope of the line. However, in 3-dimensional space, a line is determined by a point and a direction given by a parallel vector, called the direction vector of the line.
In a 2-dimensional coordinate system, there were three possibilities when considering two lines: intersecting lines, parallel lines and the two were actually the same line but in 3-dimensional space. There is one more possibility: Two lines may be skew, which means they do not intersect, but are not parallel.
In space, a plane is determined by a point and two direction vectors which form a basis (linearly independent vectors).
Advanced Mathematics Learner’s Book Five
Sphere is the locus of a point in space which remains at a constant distance called the radius from a fixed point called the centre of the sphere.
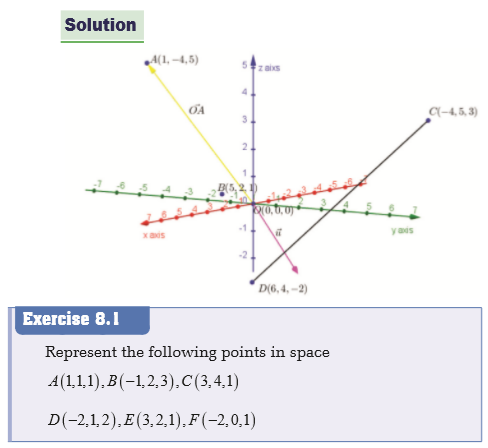
8.1. Points in 3 dimensions
8.1.1. Location of a point in space
Activity 8.1:
Consider the point ()2,3,5A in space, on a piece of paper
1. Copy the following figure
2. From x-coordinate 2, draw a line parallel to y-axis.
3. From y-coordinate 3, draw another line parallel to x-axis.
4. Now you have a point of intersection of two lines, let us call it P. From this point, draw another line parallel to z-axis and another joining this point and origin of coordinates which is line OP.
5. From z-coordinate, draw another line parallel to the line OP.
6. Draw another line parallel to z-axis and passing through point P.
Suppose that we need to represent the point
2,3,5A in space. From Activity 8.1, we have

Let us see it using a box


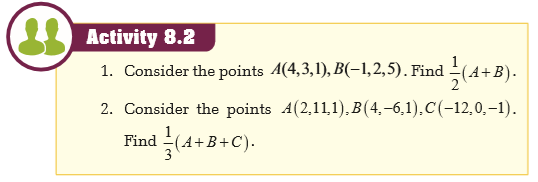
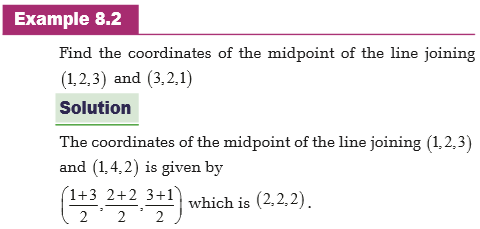
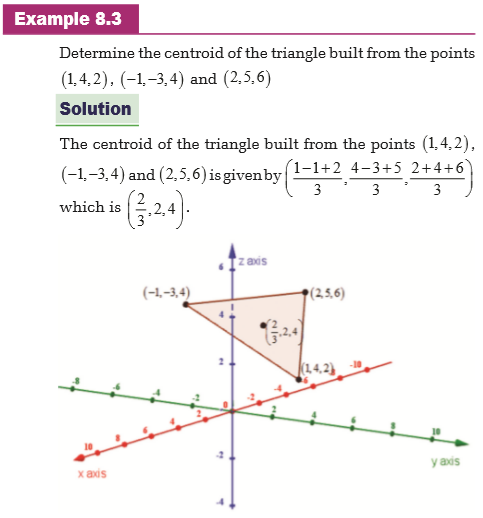
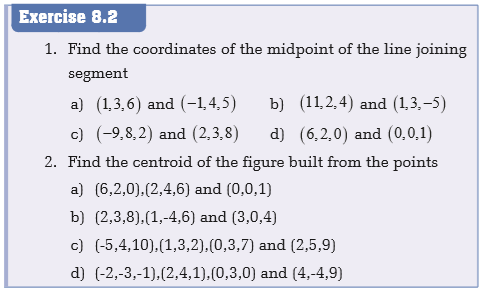
8.1.2. Coordinates of a midpoint of a segment and centroid of a geometric figure


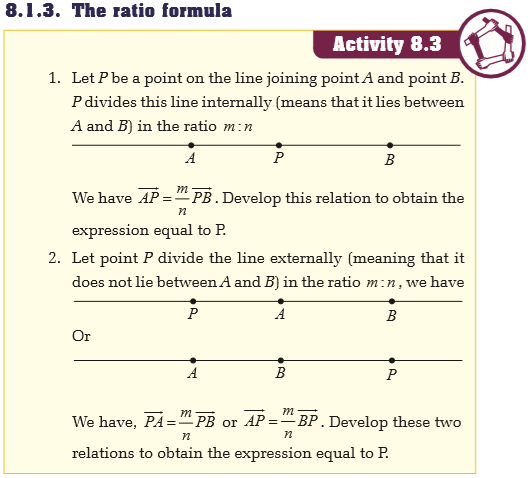
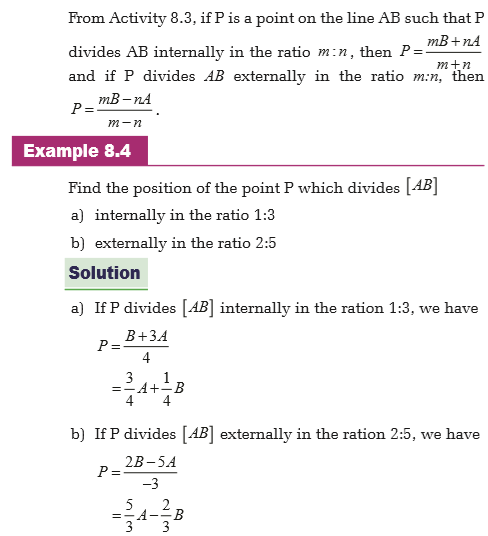

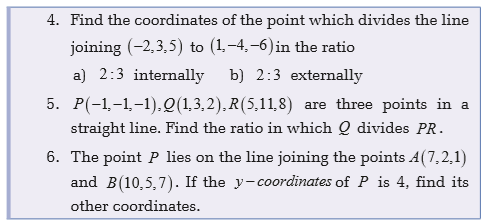
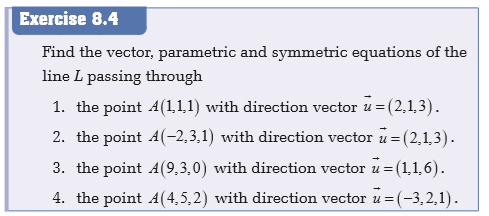
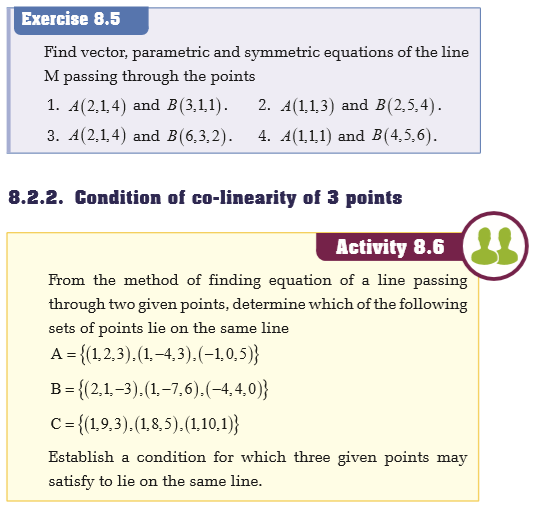
8.2. Straight lines in 3 dimensions
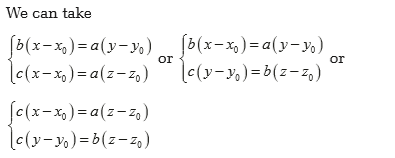
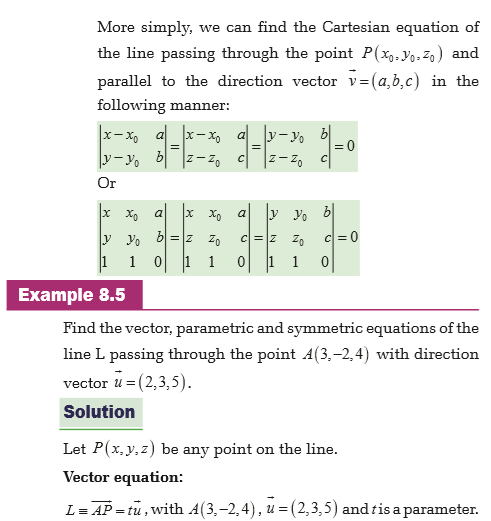
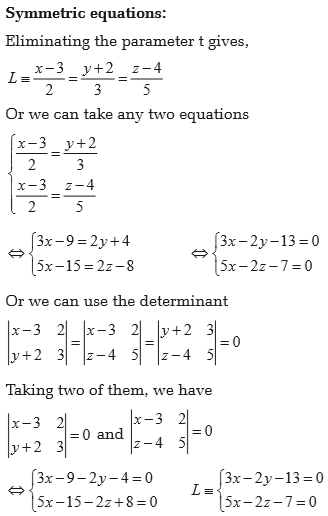
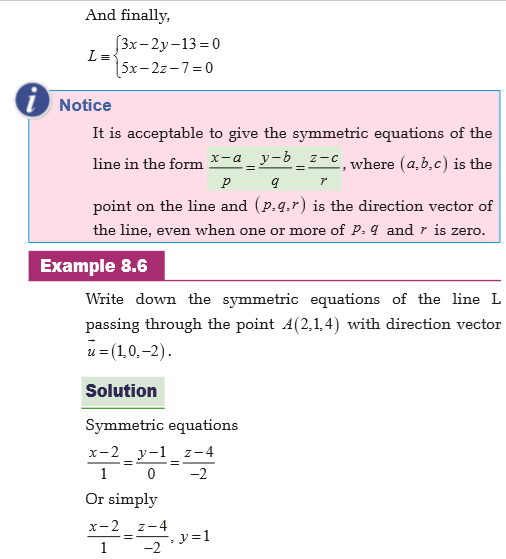
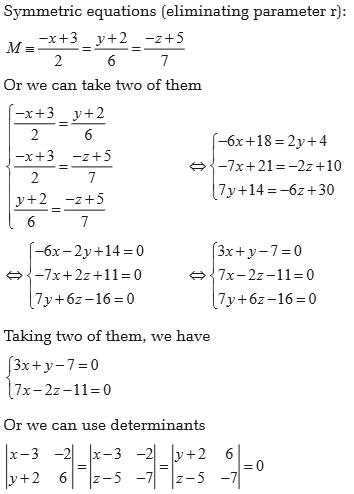
8.2.1. Equations of lines
In the plane, a line is determined by a point and a number giving the slope of the line. In 3-dimensional space, a line is determined by a point and a direction given by a parallel vector, called the direction vector of the line. We will denote lines by capital letters such as L, M,...


One of the methods of finding this shortest distance is to write the parametric form of any point of each given line. Next, find the vector joining the points in parametric form which will be the vector in the direction of the common perpendicular of both lines. Now, the dot product of this vector and the direction vector of each line must be zero. This will help us to find the value of parameters and hence two points (one on the first line and another on the second line). The common perpendicular of the two lines passes through these two points. Then, the distance between these two points is the required shortest distance between the two lines.
Using this method, we can find the equation of the common perpendicular since we have two points where this common perpendicular passes.
Note that if two lines intersect (not skew lines), the shortest distance is zero.


A line L is perpendicular to plane α if and only if each direction vector of L is perpendicular to each direction vector of α or the scalar product of direction vector of the line and the direction vector of the plane is zero.
In this case, the direction vector of the line is perpendicular to the plane and is said to be the normal or orthogonal vector of the plane.
Note that the normal vector of the plane can be found by finding the vector product of its two non proportional direction vectors.


Thus, the angle between the given plane and the given line is 67.8 degrees.
b) Angle between two planes
It is important to choose the correct angle here. It is defined as the angle between two lines, one in each plane, so that they are at right angles to the line of intersection of the two planes (like the angle between the tops of the pages of an open book).


When finding the image of a point P with respect to the plane α , we need to find the line, say L, through point P and perpendicular to the plane α .
The next is to find the intersection of line L and plane α , say N. Now, if Q is the image of P, the point N is the midpoint of PQ. From this, we can find the coordinate of Q.
Similarly, if we need the image of a line, we will need the parametric form of any point on the line and then find its image using the same method. The image will be in parametric form.
Now, replacing the parameter by any two chosen values in the obtained image, we will get two points. From these two points, we can find the equations of the line which will be the image of the given line.


UNIT 9 : Bivariate Statistics
My goals
By the end of this unit, I will be able to:
- find measures of central tendency in two quantitative variables.
- find measures of variability in two quantitative variables.
- determine the linear regression line of a given series.
- calculate a linear correlation coefficient
Introduction
Descriptive statistics is a set of brief descriptive coefficients that summarises a given data set, which can either be a representation of the entire population or sample. Data may be qualitative such as sex, color and so on or quantitative represented by numerical quantity such as height, mass, time and so on.
The measures used to describe the data are measures of central tendency and measures of variability or dispersion. Until now, we know how to determine the measures of central tendency in one variable. In this unit, we will use those measures in two quantitative variables known as double series.
In statistics, double series include technique of analyzing data in two variables, when focus on the relationship between a dependent variable-y and an independent variable-x. The linear regression method will be used in this unit. The estimation target is a function of the independent variable called the regression function which will be a function of a straight line.
Descriptive statistics provide useful summary of security returns when performing empirical and analytical analysis, as they provide historical account of return behavior. Although past information is useful in any analysis, one should always consider the expectations of future events. Some variables are discrete, others are continuous. If the variable can take only certain values, for example, the number of apples on a tree, then the variable is discrete. If however, the variable can take any decimal value (in some range), for example, the heights of the children in a school, then the variables are continuous. In this unit, we will consider discrete variables.
9.1. Covariance
Activity 9.1
Complete the following table

What can you get from the following expressions:

In case of two variables, say x and y, there is another important result called covariance of x and y, denoted (x,y)
The covariance of variables x and y is a measure of how these two variables change together. If the greater values of one variable mainly correspond with the greater values of the other variable, and the same holds for the smaller values, i.e. the variables tend to show similar behavior, the covariance is positive. In the opposite case, when the greater values of one variable mainly correspond to the smaller values of the other, i.e. the variables tend to show opposite behavior, the covariance is negative. If covariance is zero, the variables are said to be uncorrelated, meaning that there is no linear relationship between them.
Therefore, the sign of covariance shows the tendency in the linear relationship between the variables. The magnitude of covariance is not easy to interpret.

Developing this formula, we have

Example 9.1
Find the covariance of x and y in the following data sets

Solution
We have

Thus,

Example 9.2
Find the covariance of the following distribution

Solution
Convert the double entry into a simple table and compute the arithmetic means

