General
- Economics S4 SB File Uploaded 28/01/22, 13:13
- S4: Economics TG File Uploaded 11/08/22, 22:20
UNIT 9 CONSUMER THEORY
Key unit competence: By the end of this unit, you should be able to discuss the concept of utility and how it influences consumer’s choice in the allocation of their spending.
9.1 INTRODUCTION
Activity 9.3
With the guidance of your teacher, visit a market near your school. Identify at least eight products sold in that market. Interact with different buyers in this market and inquire from them what they have come to buy and why.
Make a list like the one below in your exercise books.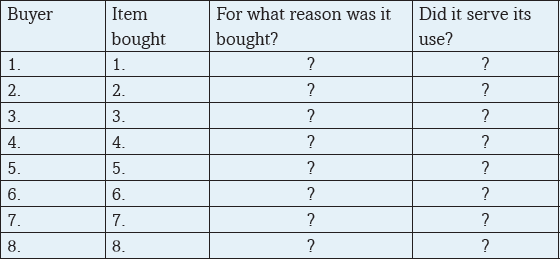
Fill in the table using the findings from the market.
From your table, identify needs and show how they were satisfied.
Compare your table with that of other students. Find out if there were consumers, retailers or wholesalers in the market.Discovery
A market has several groups or parties. We have those who come to sell commodities or offer services, those who buy, those who offer transport, those who offer security services, government representatives, potential investors, potential buyers and the commodities being exchanged. Hence a market is a diverse place.It should be noted that the most important party however is the buyer. All other parties work towards serving or fulfilling the needs of the buyer. This buyer is also called a customer or a consumer.
Facts
The consumer
Producers create goods and services, which are bought by consumers to satisfy their needs. In the chain of distribution, commodities move in various channels from the producer till they eventually reach the consumer. This can be illustrated as shown below.
A consumer is a buyer who purchases a commodity for his or her own use. The consumer purchases a good or service to satisfy a personal need. The consumer is the last person in the chain of distribution.
9.2. UTILITY
Activity 9.4
In pairs, visit the following website www.wikipedia.org. and carry out research on the following:
(a) Utility
(b) Total utility
(c) Marginal utility
Make short notes and present to the class.Different people have different needs. These needs have to be satisfied. Consumers do not buy commodities for the sake of buying them. They purchase commodities to use them to satisfy their needs. The satisfaction that one derives from the consumption of a good or service is what is called utility.
9.2.1 Total utility
Individual Activity 9.5
Using the knowledge derived from the previous units, use the formula given bellow to fill the table.

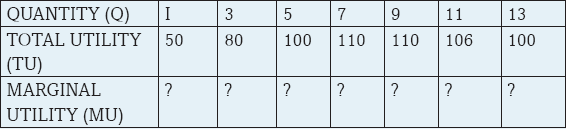
(a) Fill the table.
(b) Use the figures in your table to illustrate the TU and MU curves.
(c) Study your curves and explain the relationship between TU and MU.Discovery
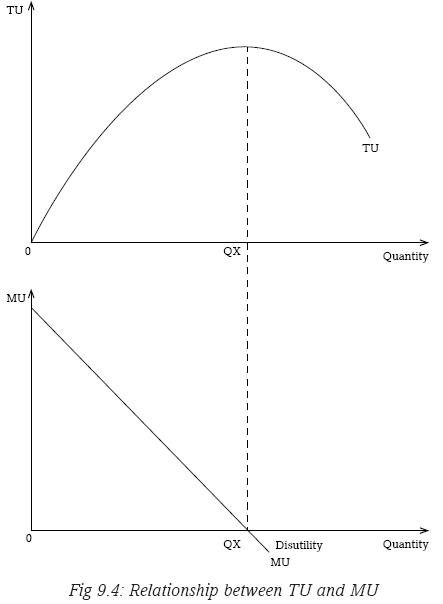
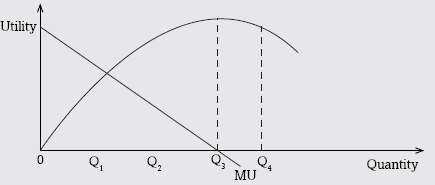
When you consume a certain amount of a commodity, you derive a certain amount of satisfaction. This satisfaction is also called utility. Each unit of a commodity consumed gives you a certain amount of utility. Total utility (TU) is the satisfaction that is derived from the consumption of all units of a commodity. For instance, if one person takes one bottle of a coke and another takes two bottles, the two may not get the same utility. As you take more and more units of a commodity, total utility goes on increasing, reaches a maximum and then starts to reduce.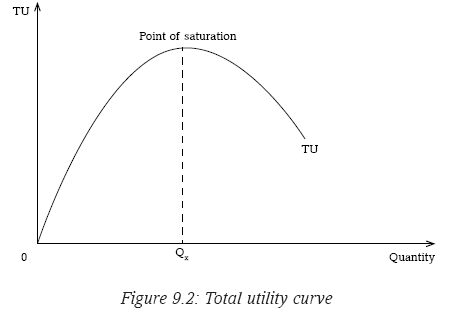
In the above illustration, total utility increases upto point OQx. This point (OQx) is called the point of saturation.
As consumption goes beyond output OQX, total utility starts to reduce. The consumer gains no more utility for consuming a given product. Consumption of the commodity beyond total satisfaction (point of saturation) leads to disutility.
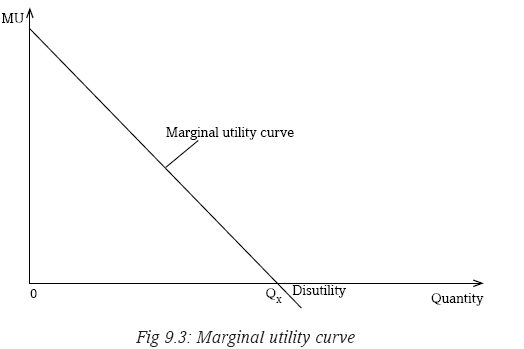
9.2.2 Marginal utility
Marginal utility (MU) is the additional satisfaction or utility that is derived from the consumption of an additional unit of a commodity. When more and more units of a commodity are consumed, the additional utility from each extra unit consumed keeps reducing and even goes into a negative. That is: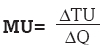
9.2.3 Relationship between TU and MU
Individual Activity 9.6

Referring to the above illustration, state the nature of MU at:
(a) Q1
(b) Q2
(c) Q3The relationship between TU and MU is such that:
• When TU is increasing, MU is decreasing.
• When TU is at the maximum, MU is zero.
• When TU is decreasing, MU is in negative. (Disutility)This relationship can be illustrated as below:
Disutility is the negative or dissatisfaction that is derived from the over consumption of a good or service. For instance, if you consume too much soda to the extent of vomiting you will have gone into dissatisfaction.
9.2.4 The law of diminishing marginal utility
Activity 9.7
On a hot afternoon, you are given five bottles of soda. You are asked to take one bottle after the other until you are satisfied and cannot take any more. Draw a table similar to the one shown below in your exercise books.
Record in your table, the time taken to finish each of the bottles you have taken.
(a) Which bottle took less time to finish and why?
(b) Can you explain the difference in the time spent while taking each
bottle?
(c) Which bottle did you enjoy most?
(d) If you were asked to pay differently for the bottles, which one would
you pay highly?The law of diminishing marginal utility states that as more and more units of a commodity are consumed, the satisfaction from each extra unit goes on reducing. Assuming that the consumer’s taste for the commodity remains constant, and that aims at maximising satisfaction, when more and more units of a commodity are consumed in succession, the marginal utility from each extra unit diminishes. Refer to the table you filled in Activity 9.5 and study the marginal utility figures. As the quantity of the commodity increases,
marginal utility reduces, becomes zero and goes to the negative.This law explains why the demand curve slopes downwards from left to right. When a consumer derives high marginal utility from a unit of a commodity he will be willing to pay a high price for it. As quantity consumed increases and marginal utility reduces, the consumer will be ready to pay a lower price.
9.2.5 Marginal rate of substitution
Activity 9.11
In groups of five, visit the following website, www.khanacademy.org and www.wikipedia.org as well as any other source, conduct a research of the meaning and calculation of marginal rate of substitution.
It should be noted that when consumption of one commodity is increased, then consumption of the other reduces. Satisfaction from one commodity is increased at the expense of the other. Consumption of one commodity is substituted with the other. The amount of one commodity that has to be foregone in order to obtain an extra unit of the other is what is called marginal rate of substitution.
For instance, in Figure 9.10 to increase consumption of commodity Z from Z1 to Z2, one reduces consumption of commodity X from X1 to X2. That is, units X1X2 of commodity X are substituted with units Z1Z2 of commodity Z.

9.3 BUDGET LINE
Activity 9.8
Use the formula below to answer the following questions.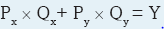 (price of x times its quantity plus price of y times its quantity = income).
Given that the price of commodity X is 1,000 FRW per unit while commodity Y costs 500 FRW per unit. John has a fixed income of 20,000 FRW, which he wants to spend on the two commodities X and Y.(a) Find how many units of each commodity he will purchase if:
(i) He spends 10,000 FRW on each commodity.
(ii) He spends 12,000 FRW on commodity X.
(iii) He spends 15,000 FRW on commodity X.
(iv) He spends all his income on commodity X.
(v) He spends all his income on commodity Y.(b) Illustrate your findings on a curve.
(c) What will happen to the amount of each commodity purchased if John’s income doubled?Illustrate your findings.
(d) Do the same investigation with the doubling of prices at constant income.Facts
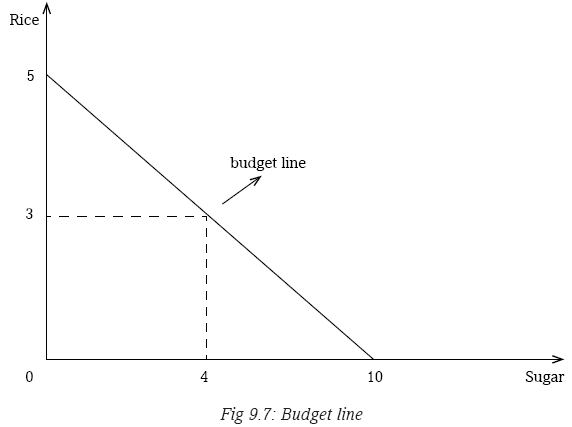
Consumers purchase commodities to satisfy their needs. They aim at maximising utility. The quantity that they buy depends on the level of their incomes and the price of the commodities. A budget line is a line that shows various combinations of two commodities that a consumer can purchase using his or her fixed income.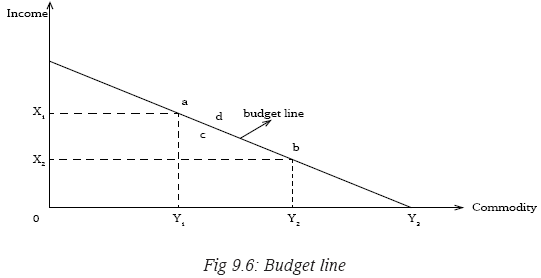
Using the fixed income, the consumer can purchase Y1 units of commodity Y and X1 units of commodity X (combination Y1X1, point a). The consumer can also purchase Y2 units of commodity Y and X2 units of commodity X (combination Y2X2, point b) and all the income is used up.
All combinations that lie along the budget line (such as points a and b) show what can be purchased when the consumer’s income is used up.
Points below the budget line (such as point c) show that some income will not be used. Points outside the budget line such as point d, are unachievable with the same level of income.
For instance, if one’s income is fixed at 10,000 FRW and the price for sugar and rice is 1,000 FRW per kilogram and 2,000 FRW per kilogram respectively, then the consumer can purchase 4kgs of sugar and 3kgs of rice and all the income will be used up. Alternatively, the consumer can buy 10kgs of sugar alone or 5kgs of rice alone with the same level or amount of income. From these figures, the following budget line can be derived.
A change in the consumer’s income at constant prices shifts the position of the budget line. Increase in consumer’s income shifts the budget line to the right while a decrease in consumer’s income shifts the budget line to the left.
A change in the price of the two commodities when the consumer’s income is constant also shifts the position of the budget line. Increase in the price of the two commodities shifts the budget line to the left while a decrease in the price of the two commodities shifts the budget line to the right.Activity 9.9
Referring to Activity 9.8 part (c) and (d), discuss in your groups your findings. Plot on a graph to represent the findings above.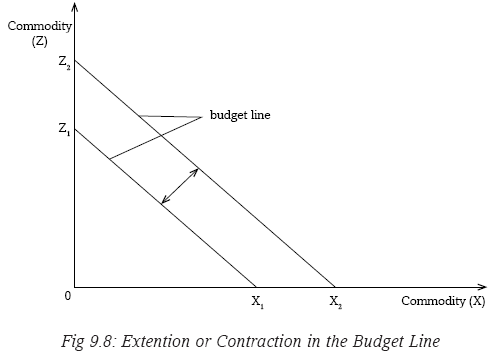
A change in price of one commodity shifts the budget line on one side. This is the same when the increase in income is used on one commodity.
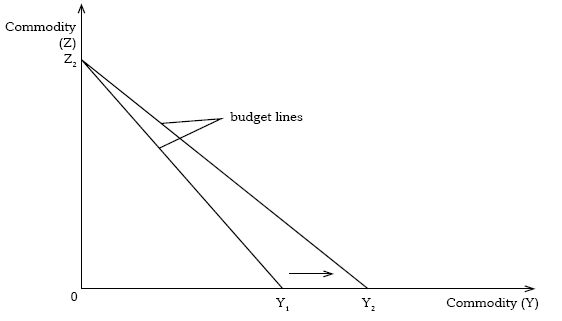
Fig 9.9: A shift in the budget line on one side
A decrease in the price of commodity Y means that with the same income, the consumer can now buy more of commodity of Y and the budget line shifts to the right on the side of commodity Y from Y1 to Y2.
9.4. INDIFFERENCE CURVES
Activity 9.10
In groups of five, carry out research from the internet and library books, on the indifference curve and features of indifference curves. Illustrate your findings on a graph.
Discovery
An indifference curve is a curve that shows various combinations of two commodities that give the consumer equal satisfaction. An example is shown below. The consumption of any combination of the two commodities that lie along the curve gives the same units of utility.
Features of indifference curves
Indifference curves have the following features:
• Indifference curves are convex to the origin.
• Indifference curves are parallel to each other for example two indifference curves cannot meet.
• Indifference curves do not touch the X or Y-axis except when the two commodities X and Zare complete substitutes.
Many indifference curves on the same graph make up an indifference map.
All combinations along the indifference curve give the same satisfaction.At point a, the consumer takes Z1 units of commodity Z and X1 units of commodity X (combination Z1X1).
At point b, the consumer takes Z2 units of commodity Z and X2 units of commodity X (combination Z2X2). In this case, the utility gained at point a is equal to what is gained at point b.
Increase or decrease in satisfaction means that the consumer has increased or decreased consumption of both commodities. This will lead to a shift in the indifference curve. Increase in satisfaction shifts the indifference curve to the right. Decrease in satisfaction shifts the indifference curve to the left.
Drawing many indifference curves on one graph gives an indifference map.
9.5. CONSUMER EQUILIBRIUM
Activity 9.12
In groups of five, conduct a research on:
(a) The meaning of consumer equilibrium.
(b) How to determine consumer equilibrium using both the indifference curve approach and the marginal utility approach.The consumer aims at maximising satisfaction at the lowest possible cost. The consumer has to ensure that he or she uses less of the available income but enjoys maximally. Consumer equilibrium occurs when the consumer gets maximum equal satisfaction from each unit of his or her income spent on consumption. This can be explained by two approaches:
a) The utility approach.
b) The indifference curve approach.a) The utility approach
In this approach, the consumer is in equilibrium when the marginal utility derived from spending a unit of his or her income on a unit of commodity X is equal to the marginal utility got from spending his income on commodity
Where,
• MUX is marginal utility from commodity X.
• MUY is marginal utility from commodity Y.
• Px is price for commodity X.
• Py is price for commodity Y.
• MUn is marginal utility from any other commodity consumed.
• Pn is price of any other commodity consumed.If the above situation is fulfilled, then the consumer is in equilibrium.
b) The indifference curve approach
In this approach, consumer equilibrium occurs at appoint where the indifference curve is tangent to the budget line. Consumer equilibrium is achieved when the budget line meets the indifference curve.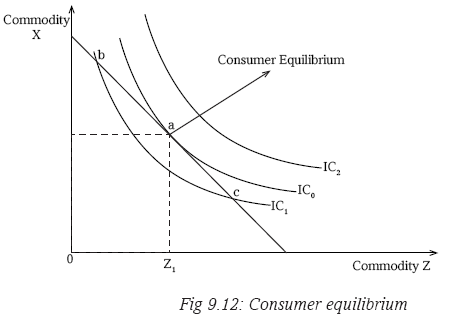
Points a, b, and c lie on the budget line. This implies that the consumer’s income is enough to acquire any combination of the two commodities at any of the points.
Of the three indifference curves:
• Indifference curve IC2 is higher but it lies outside the budget line. This implies that the consumer’s income is not enough to afford any combination along this curve.
• Indifference curve IC1 is lowest and therefore all points that lie on it give the lowest utility i.e. points b and c lie within the consumer’s budget line but give the lowest satisfaction.
• Point a lies along the highest indifference curve that is within the consumer’s budget line and therefore gives maximum satisfaction that is affordable to the consumer.
• At point a where the indifference curve IC0 is tangent to the budget line, is where the consumer is in equilibrium.9.6. CONSUMER SURPLUS
Activity 9.13
When you visit a market place, you find sellers and buyers negotiating about prices.
(a) In relation to your knowledge of utility, discuss why the buyer negotiates for a lower price.
(b) Using the formula given, calculate the consumer surplus.
Consumer’s surplus = Total utility - Total expenditure
(c) Using 100 as market price find the consumer surplus.
Facts
Consumer surplus refers to the difference between the price that the consumer is ready and willing to pay for a commodity and what he actually pays. It is a difference between the total utility that a consumer derives from the consumption of a commodity and the utility that he or she pays for.In the earlier unit, we stated that the price for a unit of a commodity depends on its marginal utility (MU). When marginal utility is high, the consumer is willing to pay a high price for the unit of the commodity.
For instance, if a consumer goes to the market to buy sugar and he is willing to pay 500 FRW for a kilogram, it implies that the consumer knows that he or she will get utility equivalent to the amount paid. If the consumer considers that utility from the commodity bought is less, he or she will not be willing to pay the 500 FRW for it.
Suppose the above consumer reaches the market and finds the price for a unit is 300 FRW and pays it. This implies that the consumer will still enjoy the utility expected at first. So, there will be a surplus of 200, that is, 500-300 =200.
By illustration, the consumer’s surplus is the area below the demand curve and above the equilibrium price.

Fig 9.13: Consumer’s surplus
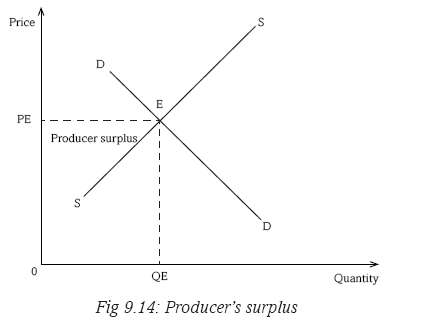
9.7. PRODUCER SURPLUS
Individual Activity 9.14
Using the given formula, find the Producer’s surplus.
Producer’s surplus = Total income – expected income.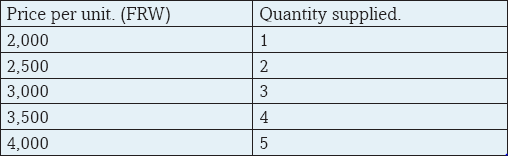
Using 4,000 as the market price, determine the producer’s surplus when 5 units are supplied
Producer surplus refers to the difference between the price that the producer is ready and willing to accept for his or her commodity and what he or she actually receives. The producer usually has a particular price at which he is ready to offer his product for sale.
The producer surplus is illustrated as shown below. It is the area below the equilibrium price and above the supply curve.
9.7.1 Real income effect
Activity 9.15
Consumer A has 20,000 FRW as her fixed money income. She intends to spend it on sugar. The price of sugar is 1,000 FRW per kilogram.
(a) How many kilograms of sugar will she purchase?
(b) What will happen to the kilograms she can purchase if the price:
(i) Increases to 2,500 FRW per kg.
(ii) Reduces to 500 FRW per kilogram.Real income is the amount of goods and services that a consumer can purchase using a unit of his or her money income. It is the purchasing power of a unit of money income. Real income depends on price level. When price increases and money income remains unchanged, real income reduces. The reverse is also true. (Refer to Activity 9.15 above and consider your answer in part (i)). Then examine the changes that took place in real income when price changed in part (ii).
9.7.2 Substitution effect
Activity 9.16
Commodities that serve the same use are called substitutes.
(a) List the various commodities that are substitutes to each other.
A consumer bought Colgate and Close up. These commodities were retailing and both of them were selling at the same price of 1,500 FRW per unit.
(b) Explain what will happen to the amount of Colgate sold if the price of Close up reduces to 700 FRW but the price of Colgate remains at the same price.
(c) What will happen if Close up increases its price to 2,000 FRW and that of Colgate remains constant?Substitution effect is the response of consumers to the commodity whose price has changed while that of its close substitute remains constant. In Activity 9.16 above, decrease in the price of Close up from 1,500 FRW to 700 FRW per unit makes it cheap compared to Colgate whose price has remained constant at 1,500 FRW. The effect will be that some consumers will shift their demand from Colgate, which is expensive to Close up which has become cheap. If that is the case, quantity demanded of Close up shall increase while that of Colgate shall reduce.
Recall
Consumer equilibrium takes into account the consumer’s income level, price level and utility. Households need to maximise utility from their expenditure. Total consumption expenditure increases with increase in total population. It is important to maintain a manageable expenditure by keeping household populations very low through family planning.In groups of four, suggest methods that the government can use to reduce the rate of population growth rates and make class presentation.
Unit Summary
• Utility: The satisfaction that one derives from the consumption of a good or service.
• Total utility: The satisfaction that is derived from the consumption of all units of a commodity.
• Marginal utility: The additional satisfaction that is derived from the consumption of an additional unit of a commodity.
• The law of diminishing marginal rate of substitution: States that as more and more units of a commodity are consumed, the satisfaction from each extra unit goes on reducing.
• Budget line: Is a line that shows various combinations of two commodities that a consumer can purchase using his or her fixed income.
• Indifference curve: This is a curve that shows various combinations of two commodities that give the consumer equal satisfaction.
• Marginal rate of substitution: The amount of one commodity that has to be foregone in order to obtain an extra unit of the other.
• Consumer equilibrium: This occurs when the consumer gets maximum equal satisfaction from each unit of his income spent on consumption.
• Consumer surplus: The difference between the price that the consumer is ready and willing to pay for a commodity and what he or she actually pays.
• Producer surplus: The difference between the price that the producer is ready and willing to accept for his or her commodity and what he or she actually receives.
• Income effect: The amount of goods and services that a consumer can purchase using a unit of his or her money income.
• Substitution effect: The response of consumers to the commodity whose price has changed while that of its close substitute remains constant.Unit Assessment 9
1. Distinguish between marginal utility and total utility.
2.

(i) Copy the table above in your exercise books. Fill in the blanks (The third column of MU).
(ii) Using the figures from your table above, illustrate the relationship between TU and MU.3. Use the figure below to answer the questions that follow.
Explain the state of TU:
(i) Between Q1 and Q2.
(ii) At Q3
(iii) Between Q3
and Q44. What do you understand by the term disutility?
5. Distinguish between a budget line and an indifference curve.
6. Given that the price of meat is 2,000 FRW per kg and that of sugar is 2,500 FRW per kg. The income of the consumer is fixed at 50,000 FRW. Derive a budget line for this consumer.
7. Give the main features of an indifference curve.8.
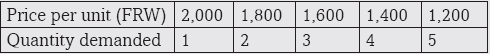
Using 1,600 FRW as the market price, calculate the consumer surplus when 3 units are purchased.
9. Explain the meaning of substitution effect and income effect.
10.

Using 1,000 as the market price, determine the producer surplus.
With the help of illustrations, differentiate between producer surplus and consumer surplus.