Topic outline
General
- Economics S4 SB File Uploaded 28/01/22, 13:13
- S4: Economics TG File Uploaded 11/08/22, 22:20
UNIT 1 BASIC ECONOMIC CONCEPTS AND THE IMPORTANCE OF ECONOMICS
Key unit competence: By the end of the unit, you should be able to:
(a) Use the basic concepts of Economics appropriately.
(b) Appreciate the role of Economics in the society.Activity 1.1
In groups of five, do the following.
(a) Read through the sentences below.
(i) Fewer farmers raising cattle can result in inadequate supply of milk and cheese.
(ii) After poor weather, corn crops failed to grow, resulting in inadequate supply of food for people and animals, and ethanol for fuel.
(iii) Those without access to water experience a shortage of water.
(iv) Depletion of forests in Thailand has led to limited supply of wood. This has forced individuals to take wood from demolished buildings in order to build new ones.
(v) Waste of water through long showers or allowing water to run while brushing one’s teeth can contribute to shortage of water.
(b) Identify a major economic problem raised by each of the above sentences.
(c) Discuss the field of study you would put the economic problem you have identified.From the activity above, it is evident that Economics is about choices and impact of those choices. It is connected to our lives, from the decisions we make as individuals, families, firms and governments.
Activity 1.2
In groups of five, go to the library and research on the following:
(a) Origin of Economics
(b) Importance of Economics
(c) Basic terms used in Economics.
Note down your findings on a piece of paper, flip chart or powerpoint. Make your presentations to the whole class.
N/B: The following websites may also be useful: www.wikipedia.org and www.economicsnetwork.ac.uk.1.1 MEANING, ORIGIN AND SCOPE OF ECONOMICS
1.1.1 Meaning of EconomicsActivity 1.3
(a) Form groups of five. Let each one of you write down on a piece of paper at least three sentences explaining what you understand by the term Economics. Exchange the pieces of paper amongst your groups and compare what you have written. Thereafter, read out the agreed definition to the whole class.
(b) In a class discussion, select any three definitions you would consider appropriate.Give reasons for your answer.
(c) Read through the definition of Economics from the teaching resources provided by the teacher and compare it with what you had selected as the appropriate definition.Several economists have defined Economics differently. Here are some of their definitions:
1. Economics is the study of mankind in the ordinary business life. (Alfred Marshall)
2. Economics refers to the study of nature and causes of wealth of nations. (Adam Smith)
3. Economics is a science which studies human behaviour as a relationship between ends and scarce means which have alternative uses. (Robbins)From the above definitions, many economists consider Robbins’ definition the most appropriate.
This is because:
• It gives the fundamental causes of the economic problems such as unlimited human needs,limited means to satisfy man’s needs, the alternative uses for the resources and the different importance
of wants.
• Robbins’ definition emphasises scarcity as a foundation of Economics, otherwise without scarcity,there would be no Economics.
• Man’s problem is not accumulating wealth, but satisfaction of human needs.1.1.2 Origin and scope of Economics
The modern word “Economics” has its origin in the Greek word “Oikonomos” meaning a steward. This word can be decomposed into two parts, “Oikos”, meaning a house and “nomos”, meaning a manager.
The sum up of the two words is what economics is all about. Literally, Oikonomos means house manager.There is an economic aspect to almost any topic we mention – education, employment, housing, transport, defence. Economics has developed into a comprehensive theory of how the society works. But as such, it is difficult to define. Economics developed as a separate discipline from moral philosophy in an attempt to understand how man undertook decisions on production and consumption so as to maximise profits and utility respectively. In the 17th century, Economics was referred to as study of political economy and lacked its own unique methods of analysis.
The classical economists, especially Alfred Marshal defined economics as the “Study of man in the ordinary business life”. This definition appears too vague based on what Economics is concerned with. Any definition should take account of the guiding idea in Economics, which is scarcity. The great American economist Paul Samuelson thus defined it as: “The study of how people and society choose to employ scarce resources that could have alternative uses, in order to produce various commodities and to distribute them for consumption, now or in future amongst various persons and groups in society.
The study of Economics basically revolved and still revolves around the problem of scarcity. All resources are scarce. The resources are not enough to fill everyone’s wants to the point of satiety. Therefore, the concern of Economics is on how man can utilise the scarce resources to meet his unlimited needs.
We therefore have limited resources and the economist’s job is to evaluate the choices that exist for the use of these resources. Thus we have another characteristic of Economics; choice.
The study of Economics begins with the understanding of human “wants”. Scarcity forces us to economise. We weigh up the various alternatives and select those particular bundles of goods which yield the highest return from our limited resources. Modern economists use this idea to define the scope of their studies.
Although Economics is closely connected with social sciences such as ethics, politics, sociology, psychology and anthropology, it is distinguished from them by its concentration on one particular aspect of human behaviour, choosing between alternatives in order to obtain the maximum satisfaction from limited resources.
Economics is thus based on four fundamental characteristics of human existence and investigating what happens when they all exist together. First, the needs of human beings are without limit. Second, those needs vary in value or importance. Third, the resources available for satisfying those needs are limited. Fourth, the resources have alternative uses. As a result, a decision has to be made on what goods to produce and which needs to satisfy and which ones to forego.
1.2 IMPORTANCE OF STUDYING ECONOMICS
Activity 1.4
In groups of five, attempt the following:
(a) Identify the possible professions you would pursue after your Economics course in high school.
(b) Explain how Economics prepares you to pursue those professions in future.
(c) Identify the major economic events that have taken place in your country.
(d) Explain how studying Economics helps you to interpret the effects such events haveon you and your country.
(e) Identify the major economic problems existing in your country.
(f) Explain how studying Economics helps you to identify those problems.
(g) Discuss how you can find solutions to the problems identified above.It is noted that Economics,
• Is a career subject. It prepares students for further academic and professional qualifications in fields like Commerce, Statistics, Mathematics and Environmental Sciences, among others.
• Equips learners with the knowledge regarding what takes place in the world of business.
• Makes it possible for learners to understand and appreciate economic problems existing in their countries, regions and the world, thereby finding solutions to those problems.
• Equips learners with the knowledge and skills required for them to fully participate in the economic activities aimed at developing their economies.
• Enables students understand the scarcity of resources and get knowledge on how the available resources can be utilised maximumly.
• Enables students to understand the basic economic concepts and principles of Economics and how to apply them in daily life.
• Prepares students for employment in various fields such as policy makers and economic planners, hence improving their livelihoods.1.3 BASIC TERMS USED IN ECONOMICS
Activity 1.5
In groups of five, go to the library and undertake research on the following:
(a) Meaning and types of price, commodities and goods.
(b) Meaning, forms and characteristics of services and wealth.
(c) Welfare needs and wants.
(d) Resources
(e) Household, firms government and foreign sector economic agents.
(f) Economic activities.
(g) Meaning, roles, types, characteristics, advantages and disadvantages of economic systems.
Write down your research findings.
Present your findings to the whole class.1.3.1 Wealth
Wealth refers to the stock of assets held by an individual, a firm, an organisation or a country, at any particular moment of time.Characteristics of wealth
(a) It has value: Wealth can be expressed in monetary terms.
(b) It is relatively scarce: Wealth is not found easily.
(c) It is transferable: Wealth can change ownership and possession from time to time.
(d) It possesses utility: Wealth gives satisfaction to the owner.Forms of wealth
(a) Social wealth: This refers to all public assets such as public roads, public libraries and public hospitals.
(b) Business wealth: This refers to the wealth of business organisations at any particular time.
(c) Individual wealth: This refers to the assets or wealth held privately by an individual.
1.3.2 Resources
This refers to all productive inputs used to create or produce goods and services. Resources are divided into natural resources, manmade resources, human resources, renewable resources and non-renewable resources.a) Natural resources
These are resources that occur naturally within the environment. We cannot produce natural resources. They are used by human beings to produce goods and services. Examples include air, land, mineral resources, water and sunlight.b) Human-made resources
These are resources created through the action of human beings. They include equipment and machinery such as computers, cars, houses and all forms of machines and tools used in the production process.c) Human resources
This is a set of individuals who make up the workforce of an organisation, business sector or the economy. They help in the production of goods and provision of services. They include organisational managers, supervisors and other employees. Some of these people are employed on permanent and pensionable terms, some are employed on contract and some are employed as casuals. Others work on internship programmes.Recall
Most companies prefer employing staff on contract than on permanent basis. Discuss.d) Renewable resources
These are resources that can be used over and over without being depleted. They are unlimited in supply. They can be replaced as fast as they are used up. Examples include solar energy, biomass energy, wind energy, geothermal energy and hydropower energy.e) Non-renewable resources
These are resources that once used they cannot be replaced. Their quantities are limited. This is because they get depleted. Examples include coal, petroleum, natural gas and minerals such as gold and diamond.Remember!
Since natural resources exist within the environment, they should be used properly and sparingly. Overexploitation of resources has negative effects on the environment. It is therefore advisable and a necessity to carry out environmental impact assessment in the area before any activity. This helps to ensure proper use of resources for sustainable development and protection of the environment.1.3.3 Price
Price refers to the rate at which a commodity is exchanged in the market. It can also be defined as the relative value of a commodity expressed in monetary terms.Types of prices
(a) Market price: This refers to any price existing in the market at a particular period of time, regardless of how it is determined.
(b) Equilibrium price: This is the price established in the market when quantity demanded is equal to quantity supplied. Such prices change from time to time as determined by the market forces of demand and supply.
(c) Normal price: This refers to the long run established price after a long period of price fluctuations.
(d) Reserve price: This refers to a minimum price acceptable to a producer or a seller in order to part with a commodity.1.3.4 Economic agents
Economic agents are the major decision making units in an economy. They include:
(a) The household: This refers to a group of individuals under one roof who take joint decisions on their own economic ventures.
(b) The firm: A firm is the smallest unit of production which employs factors of production to produce goods and services.
(c) The state: This refers to an institution that has both political and economic powers to influence resource allocation and distribution. It is this agent that regulates the activities of the households and firms.
(d) Foreign sector (X - M): This comprises of exports and imports. It includes everything outside the political boundaries of the economy. It is responsible for the expenditures on gross domestic product.1.4: DIFFERENCE BETWEEN NEEDS AND WANTS AND BETWEEN GOODS AND SERVICES
Activity 1.6
Case study
Mr. Gato has a list of desires that he wants to satisfy with his monthly earning. His monthly income is 100,000 Rwf. From his income, he wants to pay rent, food, school fees for his kids, medication and a bank loan. He wishes to buy a car. He is also planning to fly out with his family during the school holidays.
(a) Based on this scenario, identify Mr. Gato’s needs and wants.
(b) Which ones (from (a) above) should he satisfy first?1.4.1 Needs
Needs are those human desires whose satisfaction is necessary to sustain life. They are also called basic needs. They include food, shelter and clothing.Recall
1. Identify the various types of food that human beings need.
2. Explain why human beings must eat a balanced diet daily.
3. Why do people fall sick?
4. Discuss why many people want to live in permanent houses.
5. Identify the various types of clothes.Which ones are specifically for ladies and which ones are for men? Why do you think so?
1.4.2 Wants
Wants are those human desires whose satisfaction makes life more comfortable, enjoyable, relaxed and pleasant. They are also called luxuries. They are not necessary for sustaining life.NOTE: Some of these wants are derived from the basic needs. They include luxurious vehicles, expensive suits and clothing, personal airplanes and mansion buildings.
Note also that some of these wants are no longer luxuries, but part of the basic needs. Many people for instance, now own vehicles to enable them carry out their daily duties faster and with ease. People also own television sets to be aware of what takes place elsewhere, to be informed, educated and entertained.
Characteristics of wants
1. They are re-current in nature.
2. They are unlimited.
3. They are complementary.
4. They have different degrees of urgency.Remember!
Given that human wants are unlimited, yet the resources to satisfy them are limited, there arises the need for proper use of resources. This requires us to make budgets when making financial decisions; it also requires us to learn a culture of saving as well as prioritising in order to make use of money properly.
1.4.3 Welfare
Welfare is the provision of minimal level of wellbeing and social support for all citizens. The level of individuals’ welfare is indicated by the quantity and quality of goods and services they can access.1.4.4 Commodities
These are products that are produced or created by use of factors of production. People use these commodities to satisfy their desires. Commodities are categorised as either goods or services.1.4.4.1. Services
Services are intangible items or things that satisfy non-material wants.Forms of services
a) Direct services
These are services that directly benefit the individual person. Examples include education, medical care and sports and games.b) Indirect services
These are services the individual benefits from indirectly or commercially. Such services facilitate business activities. They include banking, insurance, advertising, transport and communication.Characteristics of services
(i) They are intangible. Services can neither be seen, felt nor touched.
(ii) Provision of services requires use of the service providers such as teachers and doctors,physical tools such as textbooks or equipment such as communication masts or boosters.
(iii) They are consumed as they are provided. Services cannot be stored for future use.
(iv) Services cannot be transported from one place to another.Only the service providers can move or be transported to other areas or places.
1.4.4.2 Goods
These are tangible items that satisfy human desires. For example food, clothing, vehicles and furniture.Types of goods
Activity 1.7
In groups of five, carry out research on types of goods.
(a) From your research findings, discuss types of goods and make presentations.
(b) Discuss the characteristics of the different types of goods identified above.(a) Free goods: These are goods which are abundant in supply. People use these goods without paying for them. Most of these goods are provided freely by nature. Examples of such goods include air, water and land.
Recall
If water and land are free goods, why do people sell land and bottled water?(b) Economic goods/commercial goods: These are goods which are scarce in supply, require payment and yield satisfaction to the consumer. Examples include manufactured goods.
Characteristics of economic goods
(i) They are relatively scarce.
(ii) They have monetary value.(iii) They have opportunity cost, consuming economic goods necessitates sacrificing others.
(iv) They yield satisfaction or utility to the consumer.
(v) They are marketable.(c) Public goods: These are goods that are owned and enjoyed collectively. Examples include public roads, public hospitals and public schools.
Characteristics of public goods
(i) They are provided by the state or government.
(ii) They are owned collectively. One’s consumption of a public good does not exclude others.
(iii) They cannot be exhausted.
(iv) They involve indirect payment.Payment for public goods is made collectively and indirectly through taxation.
(d) Private goods: These are goods which are owned and enjoyed individually. One’s consumption of these goods excludes others. These goods involve direct payment. An example is buying a car for personal use.
(e) Merit goods: These are goods which are considered to be essential to the society. Examples include education, health and water.
(f) Economic bads: These are goods which are harmful and dangerous to the society. The government must (g) Producer goods: These are goods used in the production of other goodscontrol their production. Such goods include alcohol and drugs.Recall
List examples of producer goods.(h) Final goods: These are goods ready for consumption by the final user. Examples include manufactured goods such as foodstuffs and clothes.
(i) Complimentary goods: These are the type of goods that are used together. To get the full utility of one good, the other complementary good must be used along with it. For example, car and petro are two complementary goods.(j) Substitute goods: These are goods which can be used as alternatives. One good can be used as an alternative to the other. Examples of substitute goods include, LG and Samsung TVs, Coca-Cola and Pepsi sodas.
(k) Inferior goods: These are goods whose demand falls with an increase in the consumer’s level lf income. It is a type of good that people do not consume when their income increase, because they shift their consumption to more prestigious goods. A good example is a second-hand cloth. When the income of people increases, people avoid buying second-hand clothes and shift to more expensive clothes.
(l) Luxury goods: These are types of goods whose demand and consumption increases as type income of the consumers increase. a good example of a luxury good is the HD Television sets. When the incomes of people increase, the demand for such TV sets increases, because people can afford to buy them.
(m) Giffen goods: These are goods whose increase in price tends to increase their demand and consumption by consumers. This happens when consumers cannot afford the alternative goods, therefore stick on these types of goods. For example, low quality rice is a good example of a giffen good. As the price of the low quality rises, the peasant consumers cannot afford other alternatives because all their income is depleted on the low quality rice. Therefore, they consume more of the rice rather than buy alternatives like meat.
1.5 ECONOMIC ACTIVITIES AND ECONOMIC SYSTEMS
1.5.1 Economic activities
Activity 1.8
In groups of five,
(a) Discuss and make presentations on the definition of economic activities.
(b) Identify and discuss the major economic activities in the country.Economic activities are the activities that involve the production, distribution and consumption of goods and services at all levels within the economy. Economic activities exist in the following major production sectors of the economy:
1. Primary level of production
2. Secondary level of production
3. Tertiary level of production1. Primary level of production
Primary production involves extraction of raw materials from their natural source. The major economic activities under primary production include farming, mining, fishing, forestry and lumbering.2. Secondary level of production
Secondary level involves transforming raw materials into finished goods that can satisfy human wants. It comprises of all the activities in the construction, processing and manufacturing industries.3. Tertiary level of production
Tertiary level involves provision of services. Examples of economic activities under tertiary sector include transport, banking, insurance, tourism, advertising and communication.1.5.2 Economic systems
Case study
In different countries, the way resources are owned, controlled, allocated and the general distribution of goods and services is different. In U.S.A for example, resources are owned and controlled by individuals with limited government intervention. In China, resources are owned, controlled and distributed by the government. Rwanda and Kenya have a mixed economy. In other countries, both the private individuals and the government own resources and participate in resource allocation.
In groups of five,
(a) Explain the meaning of an economic system, using the above case study.
(b) Identify the major economic systems that exist in the world.
(c) In small groups discuss the characteristics of the economic systems discussed above and identify the economic system in which your country belongs.
(d) Discuss the advantages and disadvantages of the above economic systems.An economic system refers to the general organisation and structure of an economy. It deals with the ownership of resources, control and allocation of resources and the general distribution of goods and services. There are three major economic systems:
(a) The free enterprise/laissez-faire/capitalist economy.
(b) The command/planned/socialist economy.
(c) The mixed economy.(a) The free enterprise/capitalist economy
This is an economic system where producers engage in economic activities with a high degree of freedom. In this economy, prices are determined by forces of demand and supply with no or limited government intervention.Features of a free enterprise economy
1. There is private ownership of property and factors of production.
2. There is no government intervention in the economic decisions. This implies that the major economic decisions such as what, when, where and how to produce are made by market forces of demand and supply, through price mechanism.
3. There is profit motivation in the production process. People engaged in the production process do so with the main aim of getting profit out of the business.
4. There is a lot of competition in the economy. This is because production is profit oriented.
5. There is freedom of choice and enterprise in the economy, since the government has limited control.
6. There is presence of social classes in the economy. The high social class (the rich) own factors of production. The low social class (the poor) are the majority. They are the workers who do not own factors of production.
7. The market forces of demand and supply determine prices.Advantages of a free enterprise economy
1. In a free enterprise economy, there is competition. This improves efficiency in production of goods. This in turn leads to production of better quality products.
2. Free enterprise economy promotes consumer sovereignty. Consumers influence the production process.3. It encourages people to work hard for a better living and resource accumulation.
4. There is increased output since producers produce and supply more goods and services in order to earn more profits.
5. Efficient firms in a free enterprise economy increase the level of employment because of increased investment.
6. There is optimum allocation of resources. Resources are allocated where they are highly demanded. As a result, inefficient firms are driven out of the industry.
7. It reduces the burden of government participation in resource allocation.Disadvantages of a free enterprise economy
1. It creates income inequalities in a society. This is because the few who own the means of production will become richer as the majority becomes poorer.
2. Free enterprise economy tends to encourage capital intensive technology. This leads to unemployment.
3. It leads to creation of monopoly as a result of inefficient firms being driven out of production, due to competition.
4. It leads to misallocation of resources. It may encourage production of luxurious products that are demanded by the rich.
5. Production in a free enterprise economy is profit motivated which lead to exploitation of consumers in form of high prices.
6. Due to absence of government intervention, there is a high degree of duplication of goods and services.(b) Command/planned economy
This is an economic system where resources are owned, allocated and distributed by a central planning authority (government) on behalf of the citizens. The government, on behalf of the citizens, takes all economic decisions.
Features of a planned economy
1. There is public ownership of all productive resources such as land.
2. A central planning authority carries out all decisions on production, resource allocation and distribution.3. There is no freedom of individuals to operate their own enterprises.
4. The major economic activities in the economy aim at offering services to the citizens.
5. The state owns and operates the means of production in the economy.Advantages of a planned economy
1. It is easy to implement government policies, as the government is in direct control of production.
2. It reduces income inequalities. A planned economy eliminates private ownership of property and competition.
3. It can lead to efficiency in production. This is because production is directed by the state in order to achieve social objectives.
4. It promotes social welfare. The objective of production is not profit maximisation, but achieving the best for the community.
5. It promotes economic stability. All economic decisions are carried out by the central planning authority.
6. Consumers are protected from exploitation. Essential services are cheaply provided by the stateDisadvantages of a planned economy
1. Planned economy is characterised by production of poor quality products. This is due to absence of competition from the private sector and failure to respond to consumers’ demands. A planning authority sets out production targets.
2. There is lack of motivation and individual initiative. This leads to limited innovation in the production process.
3. Central planning under a planned economy results into bureaucracy. This leads to delays in decision making, thereby wasting time and promoting inefficiency.
4. There is lack of consumer sovereignty in a planned economy. The right of a consumer to determine the process of resource allocation does not exist in a planned economy. Freedom of choice is also limited.
5. It increases administrative costs on the part of the government. Government agencies will be actively involved in resource allocation and distribution, all of which increases costs to the government.
6. This system tends to be characterised by mismanagement of resources. This is because corruption and nepotism are always rampant.(c) Mixed economic system
This is an economic system in which both the state and the private sector own resources and participate in resource allocation.Features of a mixed economy
1. There is co-existence of the private sector and the public sector. Thus both the government and the private sector own resources.
2. There is existence of both the planning authority and price mechanism in resource allocation.
3. There is equal existence of social welfare objectives and profit maximisation objectives. In the public sector, production aims at the wellbeing of the society. In the private sector, production aims at profit maximisation.
4. In a mixed economy, the government sets guidelines for the private to follow as they engage in the production process.
5. There is freedom of enterprise, with some minimal level of government interference.Advantages of a mixed economy
1. A mixed economy offers more employment opportunities from both the government and the private sector.
2. A mixed economy promotes fair distribution of resources due to government intervention in the allocation of resources.
3. It promotes regional balance in development since government intervention reduces the influence of price mechanism in resource allocation4. There is control of monopoly tendencies in the economy by the anti- monopoly policies set by the government.
5. It promotes stability in prices because of the price control measures that governments put in place in mixed economies.
6. There is increased investment in mixed economies because the private sector is promoted.
7. There is proper allocation of resources due existence of the central planning authority. This body ensures that resources are allocated in the most efficient manner.
8. Under a mixed economy, the government provides public goods and services, which would not be provided by the private sector alone.Disadvantages of a mixed economy
1. Government interference may undermine the private sector.
2. Government participation in production may result into state monopolies.
3. The participation of both the private sector and the state may lead to duplication of services.
4. Due to the participation of the government and the private sector in the production process, there may be over exploitation of resources.Unit Summary
In the just concluded unit the following were discussed:
• The meaning of Economics, which was defined differently by many economists such as Adam Smith, Robbins and Alfred Marshal. Basing on their definitions, Economics can be defined as a science which studies man’s attempt to satisfy his unlimited wants/desires using scarce resources that have alternative uses.
• Importance of studying Economics was also highlighted. For instance, some of the points were: preparing students for further studies in the area of commerce, enabling learners to actively participate in their countries’ development process and preparing students to get employment in various fields related to Economics.• Various concepts in Economics were also discussed. Price was defined as the rate at which a commodity is exchanged in the market.
• Factors such as haggling, auctioning, market forces and government intervention, which influence price determination, were discussed.
• Wealth as the stock of assets held by an individual, a firm or an organisation at any particular moment of time is another concept that was discussed.
• Goods as tangible items that satisfy human desires were discussed. The types of goods such as free goods, economic goods, private goods and public goods were discussed too.
• Resources, which are the inputs used to create or produce goods and services was discussed.
• Wants was another concept that was discussed.
• Economic agents such as the household, the firm, the government and the foreign sector were also discussed.• Economic systems such as the free enterprise/capitalist economy, the command/planned/ socialist economy and the mixed economy were discussed.
• Free enterprise economy is an economic system where resources are owned, controlled and allocated by private individuals without government interference.
• A command economy is one where resources are owned, controlled and distributed by a central planning authority on behalf of the citizens.
• A mixed economic system on the other hand is the one where both the government and the private individuals participate in the ownership, allocation and distribution of resources.Unit Assessment 1
1. (a) Economics was defined by many economists differently. Outline their definitions and suggest which one is more appropriate and why.
(b) Explain the reasons why studying Economics is important.
2. (a) Explain the following concepts as used in Economics: price, wealth, wants, goods, commodities and economic agents.
(b) What is an economic system? List the major economic systems that you know indicating their characteristics.
3. Explain the advantages and the disadvantages of the following economic systems:
(a) Free enterprise economy
(b) Command economy
(c) Mixed economyURL: 1Files: 3UNIT 2 FUNDAMENTAL PRINCIPLES OF ECONOMICS
Key unit competence: By the end of the unit, you should be able to:
(a) Demonstrate a good understanding of the fundamental economic principles.
(b) Demonstrate the applicability of the fundamental economic principles in daily life.2.1: DEFINITION OF THE FUNDAMENTAL PRINCIPLES OF ECONOMICS
Case study
Budgeting
Human beings hardly get satisfied in life. Those who are unemployed wish one day to be employed. The employed on their part, wish to get a promotion and a salary increase. Those with small vehicles desire to own bigger vehicles like Toyota Prados. Those owning bigger vehicles wish they could own jets. People living in rural areas want to move to urban areas, while those in urban areas want to own land in rural areas. Countries too desire to own some assets but they cannot access them.
(a) Identify other scenarios showing that human beings, families or governments are never satisfied.
(b) Why is this always the case?
(c) Suggest any solutions to the above scenarios.Human wants are unlimited and the resources to satisfy them are limited. As a result, the basic principles of Economics explain this concept. These principles further show the fundamental problems of human beings in their bid to try and use the scarce resources to satisfy the unlimited wants. These principles are:
(a) Scarcity
(b) Choice
(c) Opportunity costa) Scarcity
This refers to the limited supply or insufficiency of resources in satisfying the needs of an individual, family or state, in relation to the unlimited wants. Due to the problem of scarcity, one has to make rational choices by satisfying the most pressing wants first and then the least pressing ones last.As a result, there is need to prioritise by making a list of one’s wants in order of satisfaction. In the list, the most pressing needs are put at the top to be satisfied first, then the less pressing ones are put last on that list. This list is known as the scale of preference.
b) Choice
Choice refers to the act of making the right decision at the right time so as to use limited or scarce resources to satisfy the unlimited wants. For instance, a student who has a fixed amount of money can opt to buy a textbook to use in the classroom, rather than buying sports shoes to be wearing over the weekends.c) Opportunity cost
This refers to the second best alternative foregone when a choice is made. It can be illustrated using the opportunity cost curve, which shows the amount sacrificed on one commodity in order to get more of another.2.2: PRODUCTION POSSIBILITY FRONTIER (PPF)
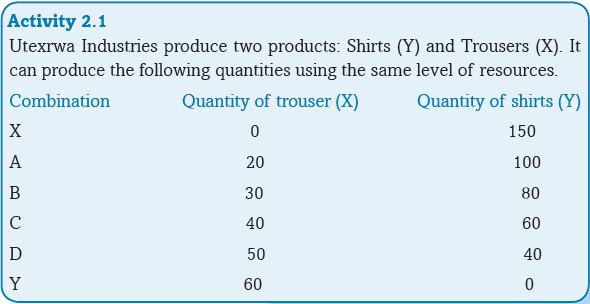
(a) Refer to the table on page 23. Discuss (in groups of five) what the firm can do to increase on production of Trousers (X).
(b) Derive the production possibility frontier (PPF) by plotting the quantities of Y on the y-axis and the quantities of X on the x- axis. Later, join the points.
(c) Carry out research on the assumptions on which the PPF is based and the importance of the PPF. Make a power point presentation.A production possibility frontier (PPF) is a locus of points showing the possible combinations of two commodities that can be produced when all the resources are fully utilised. It is also called the transformation curve or the opportunity cost curve.
(a) Assumptions of the PPF
• It assumes that only two commodities are produced.
• It assumes that the level of technology is fixed and constant.
• It assumes that all resources are fully utilised.
• It assumes that similar resources will be used to produce either or both of the two goods.(b) Importance of the PPF
• The PPF shows whether there is economic growth or decline in the country. An outward shift indicates economic growth. An inward shift indicates economic decline.
• The PPF shows the rate of unemployment by showing the rate at which resources are employed or utilised. Points along the PPF show full employment and utilisation of resources. Points inside the PPF show the unemployment and underutilisation of resources.
• The PPF shows the combination of goods and services that can be produced in an economy.
• It indicates technological advancement within an economy. When the level of production increases, the PPF shifts outwards. This indicates technological advancement.The hypothetical possibility schedule

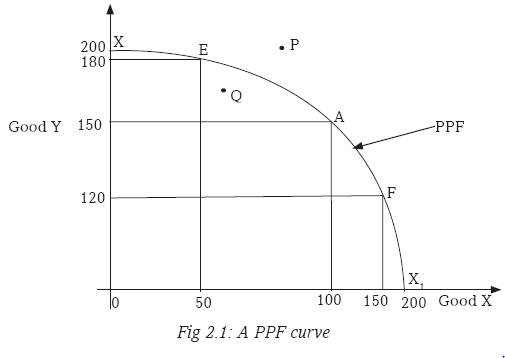
In the above illustration, X and X1 are the possibilities in which the producer can produce either 200 units of Good Y only or 200 units of Good X only with given resources. However, the assumption is that both are produced. There are therefore various combinations E, A and F that can be produced.
On combination E, 180 units of Good Y are produced and 50 units of Good X are produced. On combination A, 150 units of Good Y are produced and 100 units of Good X are produced. At combination F, 120 units of Good Y and 150 units of Good X are produced.
The PPF shows that when more units of Good X are produced, less units of Good Y are produced. This implies that the producer withdraws some resources from the production of Good Y and uses them in producing more units of Good X. This transforms resources producing Good Y into production of Good X. It is for this reason that the curve is also called a transformation curve.
As resources are moved from production of Good X to production of Good Y, the efficiency is lost hence same level of output is not achieved as the trade off is not proportional. This explains why the PPF curve is convex.
Point Q inside the PPF, indicates that the level of output is attainable but undesirable. This is because rationality requires that one prefers more to less. Point P outside the PPF, is not attainable using the available resources. However, it may be attained should the available resources be increased.2.3 THE RELATIONSHIP BETWEEN SCARCITY, CHOICE AND OPPORTUNITY COST
Activity
In groups of five, discuss the relationship between scarcity, choice and opportunity cost, using the PPF above. Make presentations after the discussion.The PPF indicates what is attainable and what is not attainable given the level of resources. Due to scarcity of resources, a producer cannot produce the maximum level of output for both the two goods at once. The producer makes a choice to either produce more of Good X and less of Good Y and vice- versa. If the producer produces more of Good X he foregoes units of Good Y (opportunity cost) as shown by the PPF.
2.4 SHIFTS IN THE PPF
Activity
(a) In groups of five, visit the library and carry out research on the shifts in the PPF.
(b) After undertaking the research, discuss inward and outward shifts of the PPF.
(c) Explain the reasons why the PPF may shift inwards or outwards.The PPF may shift inwards or outwards. A shift of the PPF inwards indicates economic decline while a shift outwards indicates economic growth.
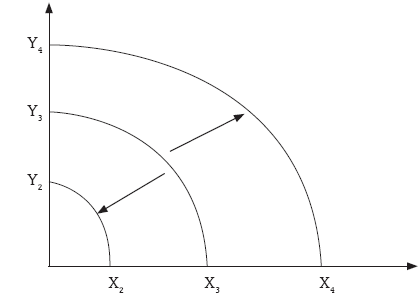
An outward shift from Y3X3 to Y4X4 indicates economic growth. This may be due to any of the following reasons:
• Discovery of new natural resources.
• Advancement in technology that leads to production of more goods and services.
• Expansion of markets that encourage production of more goods and services.
• Improvement in the skills of labour that results into efficiency in production.
• Increased investment as a result of improved entrepreneurship skills.An inward shift from Y3 X3 to Y2 X2 indicates an economic decline. Similarly, there is a reduction in the quantity produced of both Goods Y and X. This may be due to any of the following reasons:
• Lack of new natural resources.
• Decline in the invention and use of technology that leads to production of poor quality and fewer goods and services.
• No new markets that encourage production of more goods and services.
• Decline in the availability of trained manpower, through retrenchment of workers. This results into less output and inefficiency in production.
• Decreased investment as a result of poor entrepreneurship skills.2.4.1 Types of PPF
1. Common PPF: This is a PPF where there is an increase in opportunity cost as the production of one good is increased.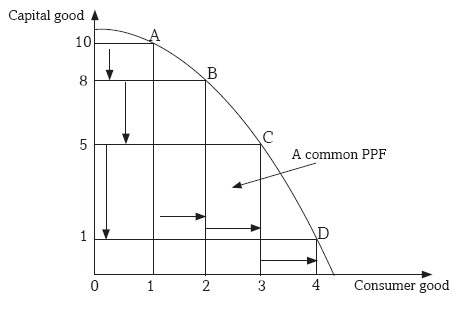
Fig 2.3: A common PPF
From the above PPF, in order to produce an additional unit of consumer good, two units of capital goods have to be foregone. But additional unit of consumer good, will cause three units of capital goods to be foregone and another additional unit of consumer good will cause four units of capital good to be foregone. A common PPF is also known as a concave PPF.
2. Inverted PPF: This is a PPF where the opportunity cost is decreasing with each of one good
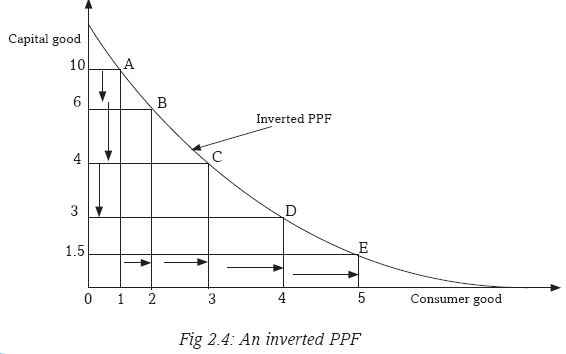
From the above PPF, to produce an additional unit of consumer good, four units of capital good are foregone. But another additional unit of consumer good will cause two units of capital good to be foregone. Any further additional unit of consumer goods will cause one unit of capital goods to be foregone. Opportunity cost will continue to decrease with any additional unit of consumer goods being produced. An inverted PPF is also known as a convex PPF.
3. A straight line PPF: This is a PPF where the opportunity cost is constant with an increase in the production of one good.

From the above PPF, an increase in production of one unit of consumer goods causes an opportunity cost of two units of capital goods. Each subsequent production of one additional unit of consumer goods will have a constant opportunity cost of two units of capital goods. A straight line PPF is also known as a constant PPF.
4. Biased PPF: This is a PPF that shifts outwards in favour of one commodity only. In this case, the PPF shifts outwards more in one direction than the other. This is caused by improvement in technology and increased factors of production that are in favour of one commodity.
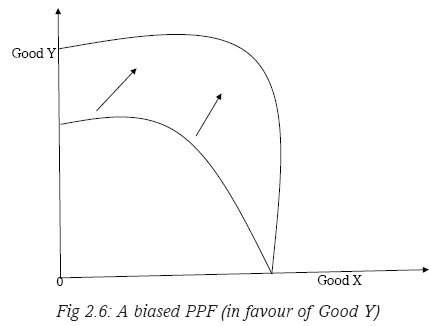
The above illustration shows an increase in production of Good Y while there is no increase in production of Good X. This implies that the improvement in technology and increase in resources caused increase in production of Good Y only.

The above illustration shows an increase in production of Good X with no increase in production of Good Y. This implies that the improvement in technology and increase in resources was in favour of production of Good X only, causing an increase in production of Good X.
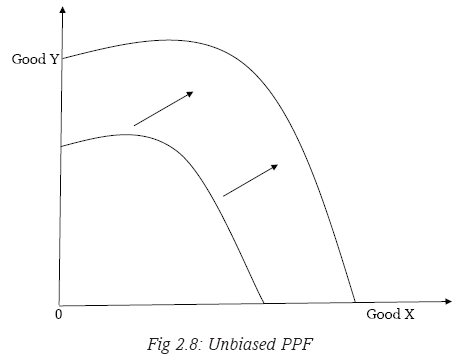
5. Unbiased PPF: This is the PPF that shifts evenly such that, there is an increase in production of both goods. This therefore implies that an improvement in technology and increase in resources favours both goods, thereby causing an increase in production of both Goods X and Y.
2.5: ECONOMIC QUESTIONS
Case study
Inyange Industries Ltd is a firm that deals in production of milk, ghee, juice and bottled water. In starting the firm, proprietors made a number of choices concerning its location, the tools and human resources to employ, the time to engage in production, and the kind of goods to produce. They also identified the consumers of their products.
In groups of five, identify and discuss the various economic questions, using the above case study.In allocating resources in the production of goods and services, countries and production firms face a number of fundamental economic questions. These fundamental economic questions include:
a) What to produce
Here the firm needs to decide on the nature of the goods to produce. The firm may decide to produce capital goods or consumer goods.b) How to produce
The producer has to decide on the methods and techniques to be used in the production process. The producer may decide to use capital intensive techniques of production or labour intensive techniques of production. The technique of production minimises costs while at the same time maximises the level of output.c) When to produce
The producer is required to decide whether to produce now or to produce in future. The producer is normally guided by the demand for the products in the market. The best time for production is when the demand for the goods or services is the highest.d) Where to produce
The producer has to determine on the location of his or her firm or industry. The location will depend on availability of the market, the source of raw materials, security and transport and communication networks. All in all, a thorough assessment of the impact of that firm to the environment must be carried out and evaluated.e) For whom to produce
The producer considers the target consumers that will use the goods to be produced. The produce may be for the young, the rich, the poor, the rural people or for the urban people.Unit Summary
The following fundamental economic principles were discussed:
• Scarcity; the limited supply of resources in relation to the unlimited wants.
• Choice; the act of making the right decision at the right time so as to use limited/scarce resources to satisfy unlimited wants.
• Opportunity cost; the second best alternative foregone when a choice is made.
• Production possibility frontier (PPF), or transformation curve or the opportunity cost curve; the locus of points showing the possible combinations of two goods that can be produced when all resources are fully utilised.
• Assumptions of the PPF such as:
(a) Assumes that only two commodities are produced.
(b) Assumes that the level of technology is fixed.
(c) Assumes that all resources are fully utilised.
• Economic questions such as:
(a) What to produce
(b) How to produce
(c) when to produce
(d) where to produce
(e) For whom to produceUnit Assessment 2
1. What are the fundamental economic principles?
2. With the help of the PPF, explain the relationship between the fundamental economic principles mentioned above.
3. How does the PPF explain economic growth or decline in the country?
4. Discuss the major economic questions that an entrepreneur has to answer as he or she prepares to engage in production. Present a report to your class.UNIT 3 NATURE AND SCOPE OF ECONOMICS
Key unit competence: By the end of the unit, you should be able to describe the nature and scope of Economics as applied in various domains.
3.1. NATURE OF ECONOMICS
Activity 3.1
(a) In groups of five, debate why you would call History an arts subject and Biology a science subject.
(b) Using the knowledge derived from the debate in (i) above, discuss why Economics is an arts and a science subject.
(c) Make a presentation to the whole class after the discussion.In this unit, we are concerned with the question: ‘Is Economics an arts subject or a science subject?’ We shall look at the methodologies used by economists to arrive at their conclusions so as to answer this question. The unit is also concerned with the substance of Economics.
Scholars such as Lionel Robbins, J. B. Says and J. S. Mill, in their definitions of Economics, look at Economics as a science.
J S Mill defines Economics as ‘a practical science of production and distribution of wealth and problems involved in production and distribution.’
Lionel Robbins defines Economics as ‘a science that studies human behaviour as ends and scarce means which have alternative uses.’J B Say talks of Economics as ‘a science of production, distribution and consumption of wealth.’
From the above, we can conclude that Economics is a social science subject. It falls in the same category as Psychology, Political Science and Sociology.
As a social science (arts), Economics studies human beings and the decisions they make to influence the economic environment of the society they live in. It uses scientific inquiry based on observation, and deductions to build models that can explain phenomena.As a science subject, Economics uses scientific approaches when establishing truths about an economic event. Economics defines concepts and quantifies them for purposes of evaluation and testing.
Hypotheses are developed from the scientific approach used, which stand periods of time to become laws, principles, and theories that explain economic behaviours of individuals, groups, and societies. It uses data into the theories developed to test and predict behavior.
3.2 POSITIVE AND NORMATIVE ECONOMICS
Activity 3.2
In groups of five, read through the following statements:
(a) (i) Workers are paid good salaries.
(ii) HIV/AIDS kills many people in Sub Saharan Africa.
(b) (i) Workers should be paid good salaries.
(ii) Everybody should learn how to save and invest.
What is the difference(s) in the above statements?
Identify the statements that are objective and give what actually happens on the ground.
What can you say about the other statements?Positive Economics is a branch of Economics that studies variables the way they are, that is, the way they exist in real life. Positive economics is factual and can be verified. It uses objective explanations. For instance, a statement like ‘Prices for agricultural products fluctuate frequently’ is a positive statement.
Normative Economics is a branch of Economics that studies variables the way they ought to be, as a desirable condition. It uses subjective explanations. For instance, a statement like, ‘Prices in the market should be stable,’ is a normative statement.
3.3. ECONOMIC VARIABLES
Activity 3.3
Twahirwa is a commercial Irish potato farmer in Musanze District. His target is to produce high quality potatoes in large quantities.
In groups of five:
(a) Explain how the following will affect his anticipated yields.
(i) A favourable season.
(ii) Use of improved seeds and firm tools.
(iii) The price of Irish potatoes.
(iv) Government legislation.
(b) On which of the above variables does Twahirwa have control?
(c) Analyse and find out whether a change in the amount of output
produced can have an influence on the four variables.A variable is a factor that can change. A variable is measurable. Examples of variables include prices of the commodities, government policies and amount of output produced.
These variables can either be endogenous (dependent) or exogenous (independent).Endogenous factors originate from within the system. Exogenous factors originate from outside the system. Changes in the exogenous factors affect the endogenous factors. Changes in the endogenous factors may not influence the exogenous factors. The amount of Irish potatoes produced (in the above activity) is an endogenous variable. It is influenced by seasonal changes. Factors that originate within the economy and affect it but can be controlled are endogenous.
Exogenous factors are not affected by changes in the endogenous factors. For instance in the above activity, change in season is an exogenous variable. It is not influenced by change in output. Factors that originate from outside the economy and are beyond the economy’s control are exogenous.
3.4. BRANCHES OF ECONOMICS
Activity 3.4
In groups of five:
(a) List the different parts of the body.
(b) Brainstorm and explain how each part functions independently.
(c) Discuss how all parts of the body work together to make the body function.
(d) Relate the discussion to Economics and its branches: microeconomics and macroeconomics.Microeconomics is a branch of Economics that studies individual units of the economy. Such units may be households, firms or prices of commodities, among others. It looks at how these single units function individually. It looks at areas such as household decisions on consumption, the firm’s production and profit maximisation decisions, market prices and their regulations.
Macroeconomics is a branch of Economics that studies all units of the economy as an aggregate. It looks at the economy as a single functioning unit. This is because the different individual units of the economy are interrelated. It looks at areas like the causes of economic growth, changes in interest rates and their effects on the economy, effects of monetary and fiscal policies.
Activity 3.5

(a) Do you like the view in the picture above?
(b) Name the natural features identified in it.
(c) How important are the features in today’s economic world?
(d) What can be done to protect such features?Unit Summary
In this unit, the following were discussed:
• Economics as an art subject.
• Economics as a science subject.
• Positive economics.
• Normative economics.
• Economic variables such as endogenious and exogenious factors as variables.
• Branches of economics as mircoeconomics and macroeconomics.Unit Assessment 3
1. Differentiate between the following:
(i) Positive economics and normative economics.
(ii) Endogenous factors and exogenous factors.
(iii) Microeconomics and macroeconomics.
2. Read through the following and classify each statement as either microeconomics or macroeconomics.
(i) Study of the functioning of prices in an economy.
(ii) Rwanda’s economy is growing at a fast rate.
(iii) Study of employment levels and unemployment levels in the economy.
(iv) Study of the operation of firms.
(v) Taxation
(vi) Every member of labour force in the country should be employed.UNIT 4 EQUATIONS AND FRACTIONS IN ECONOMIC MODELS
Key unit competence: By the end of this course unit, you will be able to describe economic phenomenon using mathematical tools
4.1 EQUATIONS IN ECONOMICS
4.1.1 Linear equations and linear graphs
(a) Linear EquationsActivity 4.1
The table below shows the sales revenues and advertising expenditures of Quality Supermarket.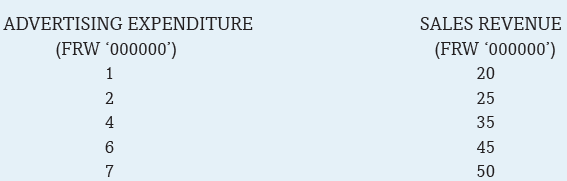
In groups of five,
(a) Explain the relationship between advertising and sales as reflected in the above table.
(b) Determine the sales revenue generated at FRW 9 million and FRW 10 million levels of advertising.
Give reasons for your answer.Facts
From the table given in the question above, we can see that the supermarket makes more sales as a result of higher advertising. This shows a relationship between advertising expenditure and sales revenue. We can say that the higher the advertising expenditure, the higher the sales by the supermarket.Sales revenue therefore depends on advertising. In this case we call sales revenue a dependent variable while advertising an independent variable. This is because sales depend on advertising. Advertising is independent because it is not being affected by sales or any other factor. We will come across such cases in Economics and Mathematics more often.
This relationship can be expressed as an equation, as follows:
Y =a +b x, Where
y is the dependent variable (sales revenue in this case).
x is the independent variable (advertising in this case).
a is a constant figure. It represents the amount sold without any form (at zero level) of advertising i.e. If x=0, y =a. In the case on page 41, Activity 4.1, sales made without advertising are lower than 20,000,000 FRW. (Assuming advertising begins at 1 million FRW).
b is a coefficient. It shows how much y will change every time x changes by one unit.
The above case is an example of a linear equation. Linear equations are referred to as first degree polynomials.
From the table above, following advertising and sales figures of Quality Supermarket, we can see that sales increase by 5 million from 1 million advertising expenditure.
Therefore, at zero advertising expenditure, sales would be 20m-5m=15 million.
Therefore our equation, y =a+bx
Would be y= 15+5x.Given this equation, we can be able to find out:
The amount of sales arising from a given expenditure in advertising.
The amount of advertising necessary to generate a desired amount of sales revenue.Example 1
The sales revenue generated by 10 million advertising expenditure would be:Y=15 +(5x10)
=15 +50 =65mExample 2
If Quality Supermarket targeted sales revenue of 75 million FRW, determine the advertising expenditure that it would have to incur.Solution
y = a + b x
75 =15+5x
60=5x
X=12
Therefore the amount of advertising needed to yield 75 million FRW would be 12 million FRW.(b) Sketching linear graphs
The data from the table on sales and advertising for Quality Supermarket (Activity 4.1) can be plotted on a graph.The graph has two sides called axes. The upright side (side having an arrow pointing up) represents the vertical axis. The bottom side (side having an arrow pointing to the right) represents the horizontal axis.
The values of the dependent variable (sales revenue in this case) will be represented on the horizontal axis. The values of the independent variable (advertising expenditure in this case) will be represented on the vertical axis.
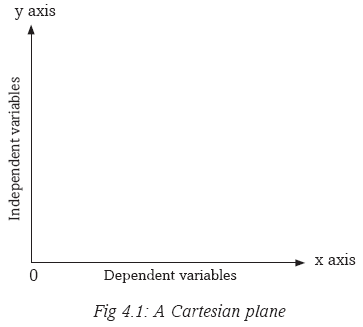
Values on the horizontal axis increase as we move to the right, from the point of origin. Similarly, values on the vertical axis increase as we move upwards, from the origin.
In the case of Quality Supermarket, y stands for sales while x stands for advertising.
Each row of the table gives us a pair of numbers, or a combination of x and y.
We have 1 and 20, 2 and 25 and so on.These pairs are written as (1, 20), (2, 25)...
To plot the pair (x,y) begin at the origin where the two axes meet. Count rightward x units on the horizontal axis and then count y units above this level, parallel to the vertical axis. Mark this spot. Continue with the process for the different pairs of x and y. After identifying and marking all the pairs, then connect the pairs. This can be done by drawing a line that passes through all the points.Using the example of Quality Supermarket, all the pairs are along the same straight line.
From our equation y= a+bx, ‘a’ represents the point at which the line joining the paired points cross the dependent line. In economical and mathematical terms, we say the derived line intercepts the vertical axis at point a. ‘a’ is therefore referred to as the vertical or y intercept.
‘b’ on the other hand is the slope of the line.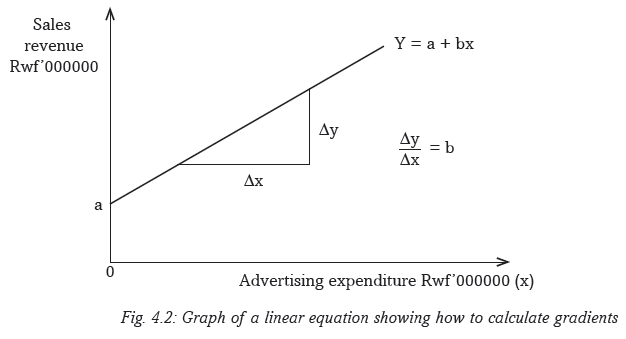
The slope ‘b’ tells us the rate at which the y variable changes with a unit change in x.
Recall
What do we call ‘b’ in Mathematics?Note that ‘a’ has no effect on the slope of the graph.
Let us point out that the value of ‘a’ can be either positive, negative or zero.
When the value of ‘a’ is positive, the graph will intercept the vertical axis above the origin.
When the value of ‘a’ is negative, the graph will intercept the vertical axis below the origin.
When the value of ‘a’ is zero, the graph will intercept the axis at the origin.
Examples of linear equations in economics
There are several types or examples of linear equations as used in Economics.
The main examples are:
1. The production possibility frontier; a graph that shows combinations of goods and services that can be produced with a given level of resources.
2. The demand function; an equation showing the various quantities of goods purchased by customers at given prices.
3. The supply function; an equation showing the various quantities of goods brought to the market by suppliers at a given market price.
4. Isocost line; a graph showing different combinations of labour and capital that can be purchased by a given firm.The demand curve
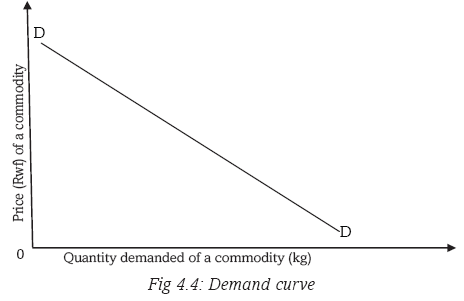
The demand curve shows the relationship between the quantity demanded of a commodity and the price of that commodity. This is a negative slope. It shows that an increase in the independent variable (price) leads to a decrease in the dependent variable (quantity demanded).
The supply curve

The supply curve shows the relationship between the quantity supplied of a commodity to the market by suppliers and the price of the commodity. This has a positive slope. It shows that both the price (the independent variable) and quantity supplied (the dependent variable) change in the same direction.
4.1.2 Non linear equations and non linear graphs
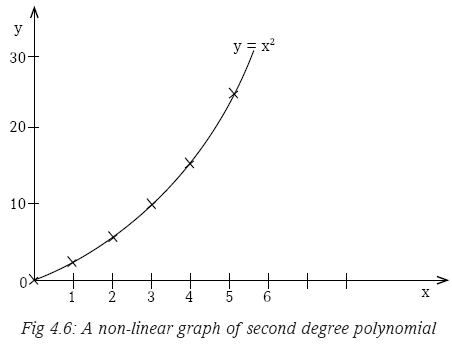
Non-linear algebraic equations are polynomial equations of a degree that is greater than one. They are mathematical relationships that describe non linear graphs. They take various types. For instance, we have the following main non- linear equations:
(a) Polynomials
(b) Logarithmic equations
(c) Conic equations
(d) Exponential equationsActivity 4.2
The following tables show the changes in variable Y as a result of changes in variable X.Table 1
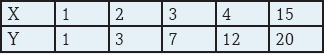
Table 2
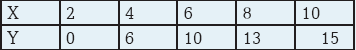
(a) Sketch the information given in Tables 1 and 2 in their respective charts.
(b) In groups, discuss the relationship between the two variables as revealed by the charts.4.1.2.1 Features of non linear equations
1. In non linear equations, the independent variable has a certain power to it. If we have y as the dependent variable and x as the independent variable, the relationship could be: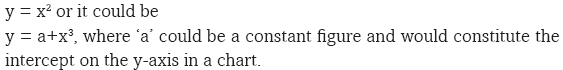
2. The features of non linear equations vary, depending on the gradient or slope of the curve.
3. Where there is one independent variable whose power is greater than one,the dependent variable will increase at an increasing rate as the power of the independent variable rises.
For example if

The graph from the equation above would curve upwards. As y increases at a faster rate than x. This is shown below.
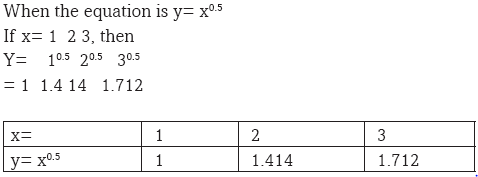
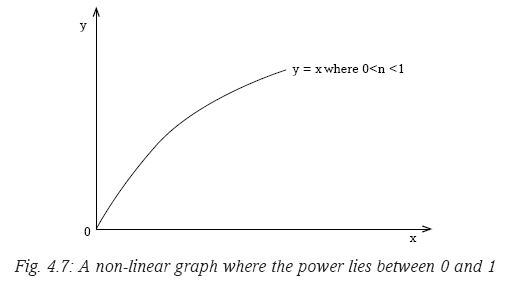
4. Where the power of the independent variable (x) lies between 0 and 1, then the value of y will also be increasing as x increases.
Example
5 Where the power of x is negative with the value of x being positive, the graph derived would slope downwards. This graph would take a convex curve shape.
In this case, the dependent variableincreases as the independent variable (x) decreases.
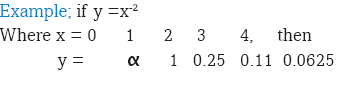
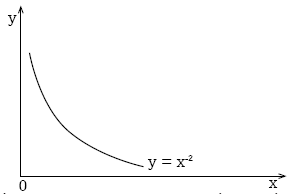
Fig. 4.8: A non-linear graph where the power is negative (less than zero)
4.1.3 Simultaneous equations
Specific objectives
By the end of this sub-unit, you should be able to:
(a) Identify different methods of solving simultaneous linear equations.
(b) Solve simultaneous linear equations.Activity 4.3
The following table shows the demand and supply conditions relative to the change in the price of commodity x.

(a) In groups of five, discuss the relationship between:
(i) The price and the demand for the commodity.
(ii) The price and the supply for the commodity.
(b) Sketch the demand and supply relationships in a chart.4.1.3.1 Necessary conditions for simultaneous equations
These conditions include that:
(i) There should be more than one functional relationship, between a set of specified variablessuch as x and y or q and p.
(ii) That all the functional relationships are in linear form.It is then that we try to find the value of the unknown variables in the equations.
In the case where we have only two variables in the equations, it is then possible to subject the equations to graphical solutions.
Simultaneous equations can be solved using various methods.4.1.3.2 Methods used in solving simultaneous equations
a) The substitution methodThis method entails representing one unknown in terms of the other unknown.
Example
Find the values of x and y in the following equations using the substitution method.
20 x + 6 y =500…………….. (i)
10x – 2 y = 200……….......... (ii)If we arrange equation (ii) so as to define or represent y in terms of x, we get:
10x - 200=2y
Dividing through by 2, we get:
5x-100 =yWe then substitute the new value of y (obtained in equation (ii)) in equation (i) as follows:
20x +6y=500 .....(i) now becomes
20x +6(5x-100) =500 ........(iii)
On opening the brackets, we get:
20x +30x -600=500
On collecting like terms, we get:
50x=1100
x=22We would then substitute the value of x in equation (ii) to get:
220-2y=200
220=200 +27
20= 2y
y =10b) Row operation method
We can also use the row operation to get the same result. Using the above example,
Where 20x + 6y =500 and ………..(i)
10x – 2 y =200……….. (ii)
Multiplying equation (ii) by 3, we get:
30x - 6y=600………… (iii)
Adding equation (iii) to equation (i), we get
50x =1100
x =22We then substitute for x in any of the equations to get y=10.
We can apply the concept to solve for demand and supply relationships, when given the demand and supply functions.Note: Unlike in the usual linear relationship between the dependent and independent variables, in this case, our relationships are expressed in a reversed manner. For example, p=f(q) and not q=f(p). The dependent variable is on the horizontal axis while the independent variable is on the vertical axis. This is because price is normally measured on the vertical axis. The principle is the same and the idea is to get the true relationship of the variables.
Therefore, if we are given the following demand and supply equations:
p=840—0.4q as a demand schedule
And p =120+0.8 q as a supply schedule,
We can solve for both p and q
(i) Multiplying demand schedule by 2, we get:
2P+1680 -0.8q
(ii) Adding the new demand schedule to the supply schedule, we get:
3P=1800
P=600(iii) Substituting for P in any of the equations, we get:
600=120+0.8q
0.8q=480
8 q =4800
q=600We could also use the equation method to solve for the demand and supply quantities such that:
840-0.4q=120+0.8q
720+1.2 q
q=600Substituting for q in any of the two equations, we get:
P=600
Fig. 4.9: Graph showing equilibrium price and equilibrium quantity
Activity 4.4
Taking P for price and the other unknown for quantity, solve the simultaneous linear equations. They represent the various demand and supply functions we come across in our daily lives. Illustrate your findings on graphs. Make class presentations.Group A
1. Q = 3P + 2, Qs = 2 - P
2. 3P + 7Q = 10, 4P - Q = 3
3. 5P + 10Q = 10, 2P - Q = 1
4. 2P + Q = 7, 3P + Q = 10Group B
5. 5P + 3Y = 7, 4P - 5Y = 3
6. 4P + 6Q = -13, 3P - 5Q = 14
7. 6P + 3Q = 1, 4P - 2Q = 2
8. 3P + 5Q = 12, 6P - 4Q = 3Group C
9. 6P + 3Q = 2P + Q = 1
10. 2P + Q = 7, 4P + Q = 11
11. 5P + 7Q = 12, 6P - 3Q = 3
12. 2P + 3Z = 2, 6P - 12Z = 13Note: You can use any of the above methods earlier learned, or any of these methods.
(a) Elimination method
(b) Matrix method
(c) Graphical method
(d) Crammer’s method
(e) Inverse methodOther examples of non linear graphs in Economics
a) Average cost curve
The average cost curve (AC) shows the relationship between the output produced and the variable cost spent on producing each unit of this output.
b) The average product curve
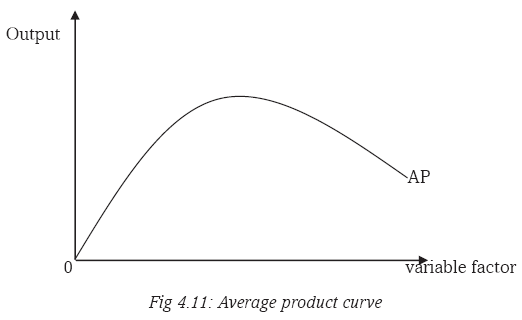
The average product curve (AP) shows the relationship between the variable factor employed and the output produced from each unit of the variable factor.
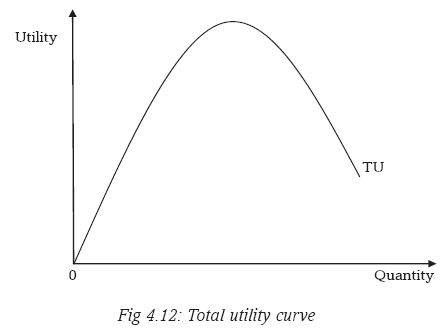
c) Total utility curve
4.1.4 Differential equations and graphs
A differential equation is a mathematical equation that relates some function with its derivatives. Functions are usually represented by physical quantities. Derivatives represent the rates at which the physical quantities change. Thus differential equations define the relationship between the two.
Differential equations have types. For instance:
• Ordinary differential equations.
• Partial differential equations.An ordinary differential equation (ODE) is an equation that contain a function of one independent variable and its derivative. These equations can either be linear or non linear. For instance,
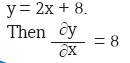
A partial differential equation (PDE) is a differential equation that contains unknown multivariable functions and their partial derivatives. These equations are used to formulate problems involving functions of several variables. For instance,
y = 2x∂x + 84.1.4.1 Linear and non-linear differential equations
Maxima and minima pointsMaximum (maxima) and minimum (minima) points have an important application in Economics.

Economic application

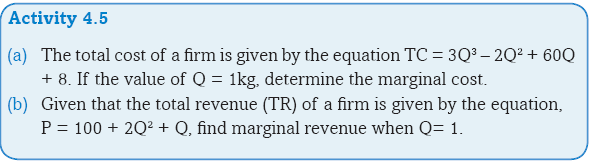
Example
Given A total revenue function
TR = 120Q-2.5Q2
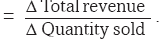
Find marginal revenue function.The derivative is denoted dy or f(x) and is given by dividing the change in y
dx
variable by change in change in x variable.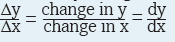
Rules of differentiation (Elementary level/basic level)
1. Constant rule
if given a function y=k where k is a constant, then
2. Power function rule
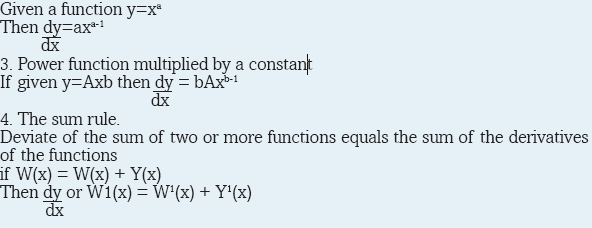
5. The difference rule
The derivative of the difference of two or more functions equals the difference of the derivatives of the functions.The derivative of the difference of two or more functions equals the difference of the derivatives of the functions.
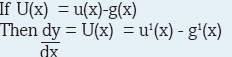
Both ordinary and partial differential equations are broadly classified as linear and non linear equations. A differential equation is linear if and only if the unknown function and its derivative appears to be power 1. Otherwise it is non linear. For instance,
dy = 8 is a linear differential equation.
dx
y = 8x + C is a non linear differential equation.In Economics, differential equations are essential in computing marginal values of a nature

Marginal revenue
 This is the additional revenue accruing to the firm from the sale of an additional unit of output.
Marginal product
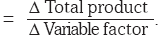 This is the additional/extra units of output that are derived from the employment of an additional unit of a variable factor.
Marginal cost
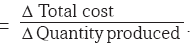 This is the additional cost of producing and extra unit of output.
4.2 FRACTIONS IN ECONOMICS
Specific Objectives
By the end of this sub - unit, you should be able to:
(a) Express the ratios of quantities of various items or variables in Economics.
(b) Determine the proportions of given quantities of an item relative to the whole amount of the item.
(c) Calculate the percentages of given quantities of economic variables.
(d) Derive the reciprocals of given numbers of economic variables.
(e) Calculate averages and index numbers from given economic data.
(f) Derive absolute values from given values.Activity 4.6
The annual budget for country X was 550b US $. It was allocated as shown below.Sectoral budgetary allocation
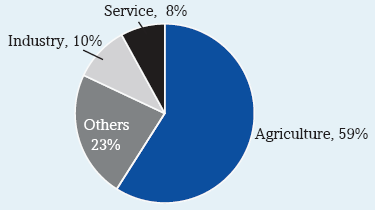
Use the figures above to answer the questions that follow.
(a) Determine how much was allocated to the service sector.
(b) Express the agricultural allocation in billions as a ratio of the total budget.
(c) What fraction of the budget went to other sectors?
(d) What proportion of the 550b $ was allocated to the industrial sector?
(e) Agriculture was allocated a lion’s share of the budget. In your own view, why do you think could have been the reason for this.
(f) Identify the sectors that may be included in the ‘others’.
(g) Would you take the above to be a good budgetary allocation to suit your country? Support your answer.Facts
Fractions are numbers that are expressed with numerators and denominators. The numerator represents part of a whole unit. In a class for instance, if you are forty students and half of them are boys, then we will say 20 out of 40 or half the class are boys.Activity 4.7
Simon, a large scale farmer, has the following livestock on his farm:
1) 50 dairy cattle, 40 of which are currently being milked;
2) 100 beef cattle, 60 of which are cows;
3) 200 goats, 40 of which are he- goats.Required:
(a) Determine:
i) The total number of livestock that the farmer has.
ii) The total number of male livestock.
iii) The total number of cattle.
(b) In groups, discuss the reasons that may have made Simon to:
i) Keep more goats than cattle on his farm.
ii) Keep more beef cattle than dairy cattle.4.2.1 Ratios
Activity 4.8
In groups of five, work out the following:
(a) For a sugar-producing firm, the ratio of total fixed costs to total costs is 4:10. Determine value of its total variable costs if it spends 40 millions FRW as fixed costs.
(b) In a class, the ratio of girls to boys is 7:3 and the ratio of day scholars to borders (both girls and boys) is 2:8. If the number of boarders is 400 students, determine the number of and girls in this class.
(b) Christine works with Rwanda Environment Authority and consumes 400000 FRW of her net salary per month. If the ratio of her savings to net salary is 6:20, determine how much she saves.Facts
The question that we need to answer here is, what is a ratio?
Simply stated, a ratio is a number representing a comparison between two things that are in a way related. For example, if we look at the farm of Simon in the activity given at the beginning of this unit, we see that there are 40 dairy cattle that are being milked out of 50. Therefore, the number of dairy cattle that is not being milked is 10. From this information, we can derive the following ratios:i) The ratio of the number of cows being milked to the total number of dairy cattle is 40:50. This can also be expressed in the form of a fraction as 40/50.
ii) The ratio of the dairy cattle that are not being milked to those that are being milked is 10:40. This ratio can also be expressed as 10/40.
iii) The ratio of the number of the cattle that are not being milked to the total number of the dairy cattle is 10:50. This ratio can also be expressed as 10/50.
The ratio derived can be further simplified to the lowest form possible such that in i), we would get a ratio of 4:5, in ii) we get 1:4, while in iii), we get 1:5.Recall
From the information given in the activity at the beginning of this unit, determine:
(a) The ratio of beef cattle to the total number of cattle in the farm.
(b) The ratio of bulls to cows in the case of the case of the beef cattle in the farm.
(c) The ratio of cattle to goats in the farm.
(d) The ratio of the hegoats to the shegoats.4.2.2 Proportions
A proportion is the quantity of a given item that is part of the whole amount or number of that item. For example, supposing Juma who earns $200 a month saves $50 every month. Then the proportion of income saved by Juma is 50 out of 200, or 5 out 20 or further simplified to 1 out 4. We can therefore say that out of every $1 that Juma earns, he saves $0.25. This is the marginal rate of saving by Juma.At the macro level, we could also be able to determine the proportion of the total budget that the Government spends on either education or on health or on armament. In this way, we could be able to gauge whether resources are being optimally allocated or not.
Activity 4.9
Visit the National Institute of Statistics Rwanda website [statistics/] and write short notes after discussion on the following:
(a) Contribution of each of the following sector to cross domestic product (in percentage) of ratio.
- Agriculture
- Industry
- Services(b) Percentage of population living below poverty line.
(c) Economic growth for year 2013, 2014.
(d) Population growth, fertility rates.
(e) Gender composition of total population.
(f) Literacy levels.4.2.3 Percentages
Activity 4.10
In groups of five, work out the following:
(a) Umuhoza Patience spent 20000 FRW of her monthly salary on transport. Express this as a percentage of her salary if she earns 250000 FRW monthly.
(b) In a class of 40 students, 25 are girls. Express the number of boys as a percentage of the whole class.
(c) Given that the price of commodity X increased from 500 FRW to 850 FRW per unit, what is the percentage change in price of commodity X?
(d) Twahirwa John and Muhoza Patience work for KSW Ltd. Their salaries were increased last month. Twahirwa now earns 200000 FRW up from 100000 FRW. On the other hand, Muhoza now earns 500000 FRW up from 370000 FRW. Compare their increments and discuss who got a bigger increase. Explain your answer.Percentage is a way of expressing the magnitude of a given quantity in relation to 100 such quantities. It shows the amount, number or rate of something as part of a total of 100.
In the case of the firm of Simon in Activity 4.7 given at the beginning of this unit, we saw that the ratio of the dairy cattle being milked to the total number of dairy cattle was 4:5 or 4/5. This is because, out of the total 50 dairy cattle, 40 were being milked. To find the percentage of these cattle being milked to the total number, we would divide 40 by 50 and then multiply by 100 for example 40 or 40/50 then multiply the result by 100. This would give us a figure of 80. We would then say that 80 percent of the dairy cattle on the farm are being milked. This is written as 80%.
This concept of percentages is of great significance in economic analysis. This is because it gives a quick glimpse of the magnitude of a given variable in relation to a total. For example, if we are told that the youth of country X constitute 60% of the total population of that country, this gives us an immediate and clear idea of the magnitude of the population problem.
At the work place, it would also be more meaningful to talk of the number of female employees in percentage terms as a way of determining the extent of equity in employment. It is also more meaningful to the common person when changes in certain economic parameters are expressed in terms of percentages rather than in absolute terms. We are therefore more comfortable when told of a 10% increase in the cost of living or a 20% increase in the level of wages.
In microeconomics, percentage is mainly used to determine the degree of changes in:
• Price
• Quantity
• Elasticity
• Costs
• ProfitIn macroeconomics, calculation of percentages is mainly done to determine macroeconomic indicators like:
• Gross domestic growth (GDP)
• Inflation rates
• Unemployment ratesActivity 4.11
Refer to Activity 4.7 of this unit.
Determine:
(a) The percentage of the he-goats to total number of goats on the farm.
(b) The percentage of the bulls to the total number of beef cattle on the farm.
(c) Interpret the percentages calculated in (a) and (b) above4.2.4 Reciprocals
The reciprocal of a number would be given by dividing 1 by that number. For example, the reciprocal of 4 would be 1/4. In the case of fractions, the reciprocal would be derived by inverting the fraction. Thus the reciprocal of 2/5 would be 5/2.The concept of reciprocals is widely applied in economic analysis. For example, it is used in the calculation of the multiplier in banking and investment decisions. In such a case, the multiplier is determined by calculating the reciprocal of the marginal propensity to save. This is based on the assumption that people’s income is spent on either consumption or saving. The proportion of the income that would be spent on saving is what would be referred to as the marginal propensity to save.
4.2.5 Averages and index numbers
4.2.5.1 Averages
When loosely stated, the average refers to the centre of a series of data. It is one of what is commonly referred to as measures of central tendency. It is found by adding the values of the data provided and then dividing by the total number of values. For example, if we are given the weekly sales of a shopkeeper as follows:
Then the average sales for the shopkeeper would be: $103.3.
(Obtained by adding the daily sales, then dividing the sum by six, the number of days).
We would then say that the average daily sales for the shopkeeper is $103.3.
This concept is used in various ways as an aid to decision making. It could be used to determine the average level of wages earned by a given group of workers, or to determine the average sales made by a team of salespersons. In Economics, the concept of the average is very important. For example, economists use the concept in analysing investment and production decisions. They will therefore talk about the average cost of production which is the total production divided by the number of units produced, as opposed to the average revenue which is the total revenue divided by the number of units sold. Comparison of the two averages can indicate the direction in which a business is going.Average is similar to arithmetic mean. It is calculated as the sum of items divided by number of items. It measures how much does a single variable contribute to a total. i.e
In Economics we are interested in variables like
a) Average costs (AC)
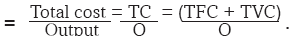 This is the cost per units of output. How much expense does producing each unit of output take.
b) Average product (AP) =
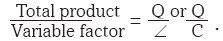 This is output per unit of the variable factor. For instance if you employ ten workers (units of labour) and all together carry 1000 bricks in an hour. How many bricks will each person have carried.
c) Average revenue (AR) =
 This is revenue per unit of output sold. How much income does each unit of output produced and sold bring to the firm.
4.2.5.2 Index Numbers
Activity 4.12

Index numbers in Economics are usually used to establish changes in the cost of living of the people. They are usually constructed to show the difference in the price of a commodity from one period to another. In constructing such index numbers, we select one year which we belief to have been relatively stable, and call it the base year. We give this year an index value of 100. For example, if the price of sugar in 2010 was $1.00 while in 2014 it rose to $1.2, then the price would have risen in the period by 40%.
If we take 2010 to be the base year, then the index value for 2014 would be 140. The figure 140, which relates the two prices for the two years, is called the price relative. If this was true for a wide range of commodities, then we could assert that the cost of living has risen by 40% between 2010 and 2014.
To determine such change in the cost of living, we construct what is called a consumers cost of living index. In this case, we consider a range of commonly used consumer products and get their relative price changes in the period under review. We then get the average of this price changes so as to determine an overall change in the cost of living.
In Economics, index numbers are used in prices of commodities to arrive at simple price index, especially to determine the consumer price index.
They are also used to determine the rate of human development to derive human development index.4.2.6 Absolute values
In making calculations, it is usual to come up with a figure that has either a plus or a minus sign. However, such a sign may not be of any importance for making the desired decision. What may be important is the magnitude of the number without any consideration of the sign. We would therefore ignore the sign. This is the idea behind the concept of absolute numbers. The absolute number is the actual number without any consideration of the sign. Thus if we have the absolute number would be 3. Same case for a sign.In Economics, when we talk about elasticity of demand, the coefficient of elasticity could be either positive or negative. However, for decision-making purposes, it is the absolute number that is considered.
Unit Summary
In this unit, the following were covered:
• Linear equations and graphs
• Non-linear equations and graphs
• Simultaneous equations
• Differential equations and graphs
• Rations, proportions and percentages
• Reciprocals
• Averages and index numbers
• Absolute valuesUnit Assessment 4
Every year, our country prepares an annual budget. The allocations for every sector are always in percentages or some estimated amount.
Using the last annual budget,
(a) Represent the information on a graph.(b) Suggest reasons why some sectors get a higher share of the budget than others.UNIT 5 THEORY OF DEMAND
Key unit competence: By the end of this unit, you should be able to determine the consumption habits in the market.
In unit 1, we looked at economic systems. We also looked at how they differ in decision making on resource allocation and production. In Rwanda, part of what is produced goes to the market. The producer consumes the other part. In this unit, we shall see how prices are determined and what influences them.
5.1. INTRODUCTION TO PRICE THEORY
Activity 5.1
In groups of four:
(a) Identify and list the different commodities used in your daily life.
(b) Suggest the current market prices for each commodity identified.
(c) How would you react if the prices of the commodities listed above doubled?
(d) In groups, discuss and explain how the above prices are determined in a market.
(e) Compare your findings with those of other members in other groups.In a market place, there are many different groups of people. Each group has its own reason for being into the market. There are those who have brought commodities for sale. There are others who have come with their money to purchase commodities to satisfy their needs.
Standardisation Culture!
We should be very keen and alert when purchasing commodities in the market. Ensure you purchase products that have the Rwanda standardisation mark of quality. Standardised products last longer than unstandardised products.
A market is generally a meeting point between buyers and sellers. It can be a physical place or online. It is also a mechanism that facilitates buyers and sellers to meet with an aim of exchanging a particular commodity. Commodities have to be exchanged at a price. Price refers to the relative value of a commodity expressed in some monetary terms. Different commodities in a market have different market values or prices expressed in monetary terms.
Financial Education!
Always remember to make a budget before going to the market to do some shopping. This is because money will never be enough. As a buyer, purchase only those commodities needed most to satisfy the basic needs before purchasing other commodities that are needed, but not very necessary.
5.1.1 Meaning and types of price
Activity 5.2
In groups of five, organise yourselves into buyers and a seller. Biro pens, exercise books, textbooks, pencils and foolscaps as items to be sold. As a seller, ask for or quote a higher price. As a buyer, quote or offer a lower price. Through bargaining, come up with an agreeable amount that both parties will be satisfied.Attempt the following questions:
(a) Why did the seller reduce the price from the one he or she had quoted earlier?
(b) Suppose the buyer walked away from the seller, could he or she have found another place to purchase the products? Explain.
(c) What happens if the seller in the market practices monopoly? (The seller is the only one providing the given items in the market).There are different types of prices that can be looked at this level.
Reserve price. The producer makes a commodity for purposes of sale. During the production process, the producer incurs expenses. These expenses are called costs of production. When the producer takes his commodity to the market, there is a starting price on which the commodity will be sold. This minimum price that the supplier or producer can accept in exchange for the commodity is what is called the reserve price.Activity 5.3
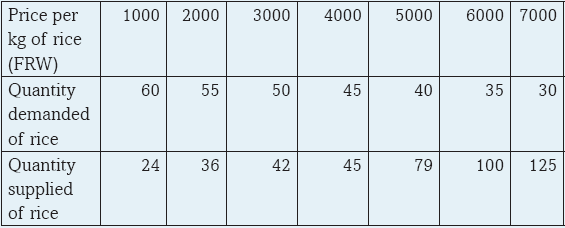
Use the figures in the table to illustrate the supply and demand curve on the same graph and determine a point where they meet. What is the price and the quantity at that point.
Equilibrium price: This is the price ruling in the market at which the buyers wholly clear what has been brought to the market by suppliers. At this price, quantity demanded is equal to quantity supplied. There is no excess or shortage in the market at this price. Equilibrium price (Pe) can be illustrated as shown below:
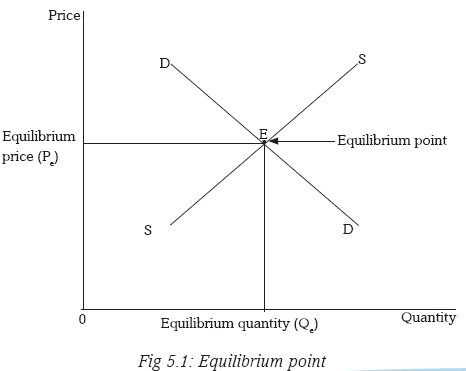
At Qe, (equilibrium quantity) quantity demanded is equal to quantity supplied. At Pe, all the commodities that have been brought to the market are bought by the available buyers. At equilibrium point, everybody gets what he or she wanted and goes home satisfied.
Market price. This is a short run price at which goods and services are sold in the market during a given period of time. When you visit a market, you find different commodities selling at different prices, depending on the demand and supply of each commodity. Each commodity thus has its own market price.
Normal price. This is an equilibrium price that has remained stable for a long period of time. It is a long run equilibrium price attained after all adjustments in the market forces have taken place.
5.1.2 Meaning and types of market
Activity 5.4
In groups of five, study the illustrations below and categorise them under the types of markets given below.
Commodity market, Capital Market, Factor market, Foreign Exchange market.
Can you explain how prices are determined in the markets you have identified?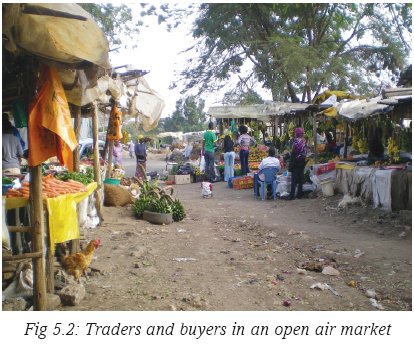

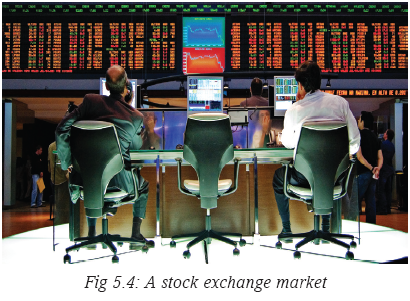

As defined earlier, a market is a mechanism that facilitates buyers and sellers to meet with the aim of exchanging a particular commodity at a price. In a market, there are commodities that are sold and bought. Thus the function of a market is to bring together sellers and buyers and enable the exchange of goods and services to take place.
5.1.2.1 Types of markets
Markets may be differentiated depending on the commodity that is sold. Therefore, we may have the following categories of markets.(a) Commodity market
This is a market that is involved in the exchange of consumer goods. Producers of such goods meet with consumers and they negotiate the exchange. Some of the goods sold on a commodity market include foodstuff, clothes and shoes of all types, books and all stationery, furniture and kitchenware items such as cutlery.Environment, Climate Change and Sustainability!
A clean environment enables sellers and buyers to exchange their commodities with ease. We should always remember to keep our environment clean. A dirty environment is a source of waterborne and airborne diseases. Sickness reduces the productivity of sellers and buyers. In addition, money budgeted for basic needs will be converted to buying medicine and general care of the sick.
(b) Capital market
This is a market that deals with the buying and selling of financial products. The commodities sold on a capital market are basically financial products usually called securities. They include shares, debentures, private and government bonds. Capital markets help firms to raise investment capital that is essential for expansion of the firms’ activities. Transactions on a capital market are done through intermediaries called agents, brokers or dealers. An example of a capital market is Rwanda Stock Exchange.(c) Factor market
In a factor market, the commodities traded are factors of production. Buyers and sellers meet to negotiate exchange of factors of production at a factor price. Factor prices are payments or rewards for factors of production like rent or wage.(d) Foreign exchange market
In this era of globalisation, regional integration and free trade, there is global movement of people, goods and services worldwide. This calls for transactions that involve currencies of different countries. Currency or foreign exchange market is a market where currencies are traded. The major players in this market are banks, importers and exporters, currency centres and forex bureaus.(e) Free market
This is a market where the forces of demand and supply operate freely without any interference in determining the resource allocation. There are no controls enforced by other forces like the government. Free market prices for goods and services are set freely by consent between sellers and buyers without any interference by a government, price-setting monopoly, or other authority.(f) Open market
An open market is an economic system where the economic actors are left to trade without persistent external constraints. In this market, buyers and sellers enjoy free access as the entry and exit is only regulated by competition. This is made possible by having reduced or non-existent state regulation on the market. In this market, the scope of government regulation is low or less stringent. In an open market, the presence or absence of the government regulation does not get in the way of free trade and trading operations of the market. However, the reality is that there are few markets that can be left to operate in such an ideal manner, since the government plays a role in the regulation of virtually all markets. This is because every market is subject to certain legal restriction and expectations by the government. These legal regulations are responsible for controlling contractual agreements, financial obligations and guide transactions within a market system.Conspicuous features of an open market
• Absence of government regulations
• Little or no licensing requirements
• Absence of taxes, subsidies and customs
• There is no unionization or structured state control
• No barriers to entry and exit of the market5.1.3 Price determination in the market
Activity 5.5
(a) Identify commodities traded, buyers and sellers in each of the following markets.(i) Commodity market
(ii) Capital market
(iii) Factor market
(iv) Foreign exchange market
(b) Discuss the ways that may have been used by the parties involved in the above markets to arrive at the price they sold or bought at.In a market, there are different ways through which prices are determined. Prices may be determined by producers, or through negotiations between buyers and sellers, or by the government. The following are the ways through which prices are determined:
1. Demand and supply: The interaction between the forces of demand and supply determine the price in the market. When demand exceeds supply, there is a rise in the price level. When supply exceeds demand, there is a fall in the price level. When the market forces of demand and supply are allowed to interact without interference, equilibrium is attained in the market where quantity demanded is equal to quantity supplied.
2. Sales auction (bidding): This is where there is one seller and many buyers competing for the available commodity. Each buyer offers the price he or she is willing to pay for the commodity. The one offering the highest price (normally called the highest bidder) takes the commodity. Such a method is usually used in awarding contracts in the construction industry.
3. Price legislation: This is where the government fixes the price. The government can either fix the maximum price or minimum price. In many cases the government fixes or sets the maximum or highest price. It becomes illegal for one to buy or sell above the legislated price.
4. Haggling/bargaining: This is a negotiation between the buyer and the seller. The seller demands for a higher price while the buyer offers a lower price. Each of them keeps adjusting until they reach a price upon which they both agree to exchange.
5. Resale price maintenance: This is where the producer fixes the price. Examples of goods whose price is fixed by the producer include newspapers, magazines and airtime cards. Most of these goods have the price branded on them.
6. Treaties (agreements): These are agreements between buyers and sellers or sellers alone on prices at which they should buy or sell a particular commodity. This is usually done to avoid sellers selling at very low prices to counter the competition.
7. Price leadership (Imperfect collusion): This is where the biggest and low cost firm in the industry sets the price for a commodity for other firms in the industry to follow. Such a firm (also called price leader) may be the oldest firm (barometric price leader). Such firms enjoy large economies of scale. They have a wide experience in the market, thus are market leaders.
8. Cartel arrangements (perfect collusion): This is where firms in the industry, usually producing a homogeneous product, come together in an arrangement to fix a price for their commodity. The major reason behind such an arrangement is to avoid stiff price competition that may lead to losses by increasing costs on advertising. An example of a cartel is the Organisation of the Petroleum Exporting Countries (OPEC).
5.1.4 Factors determining price in the market
Activity 5.6
In groups of five, read the following passage and answer the questions that follow.
In the past years, the number of trucks carrying fuel from the port of Mombasa in the Republic of Kenya into Rwanda reduced. It was said that the cause of this was some barrier along the route that disrupted production of crude oil in producer countries like Libya and countries in the Middle East. At pump stations countrywide, there was scarcity of fuel.
If the government had not acted quickly to address the situation, pump prices would have shoot up tremendously.
(a) Discuss the effect of scarcity of fuel on:
(i) The pump price of fuel.
(ii) The price of commodities in the markets countrywide.
(iii) The amount of goods and services that people can be able to purchase.
(b) Read the last sentence again in the above text. Explain ways in which the government may have used ‘to address the situation’.
(c) From your group discussions, make a class presentation.Discovery
The following are the factors that determine the price of a commodity in the market:
1. Cost of production
2. Level of competition in the market
3. Government policy
4. Demand and supply of the commodity
5. The type of productFacts
1. Cost of production: Producers incur expenses during the production process. They pay workers (human labour), buy raw material, incur insurance and security costs, pay for power and rent. Such expenses constitute costs of production. The producer’s aim is to recover the amount spent during production and earn some profit after the sale of the product. The pricing decision must take into account the cost of producing each unit of output (average cost).2. Level of competition in the market: In a market where there are many producers of a similar product, competition is normally high. Many producers opt for a price reduction so a to sell their commodities easily and faster. This may be in the form of a discount, buying more goods for a less price, or offering free gifts upon purchase of a certain amount. Thus through price reduction of the selling price of a commodity, customers are be motivated to purchase their goods. Producers also use other forms of non-price competition like advertising, offering after sales services and even free transport to the customers’ premises.
3. Government policy: The government through price legislation influences the level of commodity prices. This is especially so when the commodity is an essential but scarce or strategic to the economy. Prices for such commodities like fuel, water and power (electricity) are usually under the control of the government.
4. Demand and supply of the commodity: In taking decisions on price for a commodity, the producer considers the numbers and capacity of his or her customers, and the amount of output that has been produced. When demand for the product seems higher than the output, the price is slightly raised. If the output is more than the demand, then in order to capture the market, the price is slightly reduced.
5. The type of product: Manufactured or processed commodities have a higher price than unprocessed commodities. Similarly, branded commodities are usually priced higher than unbranded products.
Standard products have quality!
It is not guaranteed that all products are of high quality. When some prices of the commodities are extremely low, think twice before purchasing such a product. Good quality products are a bit expensive. Beware of counterfeit products in the market. Report any of such products to the local authorities within. We should always have value for our money.
5.2 DEMAND
5.2.1 Meaning of demandActivity 5.7
In groups of five, make research on the meaning of the following terms using the following sources:
(i) School library
(ii) Economic textbooks
(iii) Dictionary
(iv) Internet www.khanacademy.org, www.economicsonline.co.uk, www.wikipedia.org
(a) Demand
(b) Quantity demanded
(c) Effective demand
(d) Aggregate demandFacts
Demand refers to the desire and willingness backed by the ability to purchase a particular good or service at a given time. It implies that the buyer has a need that can be satisfied by the commodity in question, and he is able to pay the price at which that commodity is selling.Quantity demanded is the amount of the commodity that a buyer is willing and able to purchase at a given price over a given period of time. Buyers shall be willing to purchase different amounts of a commodity at different prices.
Effective demand is the desire backed by the ability to purchase a given commodity at a given price and the actual buying of the commodity. Effective demand means that the consumer wants the commodity, has the required amount of money to buy it, the commodity exists in the market, and the consumer actually buys the commodity.
Market demand
This refers to the total demand for all consumers of a particular commodity in the market at a particular time.Activity 5.8
In your groups, visit the following websites and carry out research on aggregate demand. www.khanacademy.org, and www.economicsonline.co.uk. You can also use reference material such as textbooks, magazines and journals.
Write down your findings. After the research, make group presentations.Facts
An economy is composed of different sectors: the household sector, the business sector, the government sector and the foreign sector. All these sectors purchase commodities for various purposes. Aggregate demand therefore is the summation of the demand of all purchasing units in all sectors of the economy.
Aggregate demand = C + I + G + (X-M)Where,
C = Consumer expenditure (total consumption by households on consumer goods and services.
I = Private investment expenditure by firms (expenditure on capital goods/services).
G = Government expenditure (total purchases by the government).
X = Exports (foreign expenditure on locally produced goods and services).
M = Imports (local expenditure on foreign goods and services).
Government expenditure includes all expenses the government incurs on health, education, transport, law, defence and security sectors.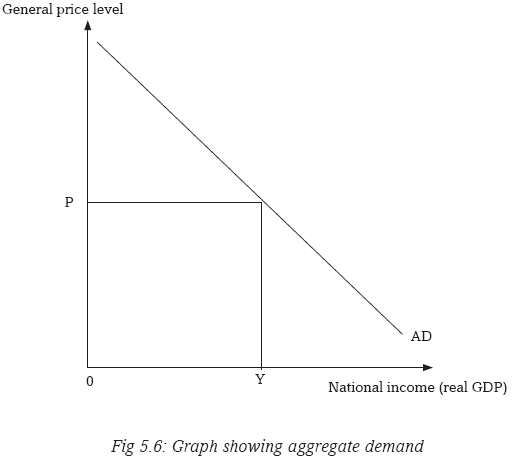
5.2.2 Factors determining demand
Activity 5.9
The price of household goods such as kitchen utensils in Kigali markets remained constant in a certain period, but the quantity demanded doubled. In your groups, discuss the factors that may have caused this increase in quantity demanded of the household goods. After the discussion, present to the class your group findings.Discovery
I have realised that the following factors determine the demand for good or commodity.
1. Price of the commodity
2. Income of the consumer
3. Price of other commodities
4. Weather
5. Government policy
6. Tastes and preferences
7. Population
8. Past levels of income
9. Future price expectationsFacts
1. Price of the commodity: Price changes in the market influence the amount of a commodity that buyers can purchase. When the price of the commodity increases, buyers’ ability to purchase reduces. This in turn reduces the quantity demanded. When its price reduces, the quantity demanded increases. This is because the ability of the buyer increases.How changes in income influence quantity demanded
Activity 5.10
Case study
Mutoni works in a tea company and earns 100,000 FRW per month. At this level of income, she has the following monthly budget.
One kilogramme of salt, one kilogramme of meat, 2 litres of milk, 1 kilogramme of sugar, 2 loaves of bread and her normal rent. On the other days, she consumes beans.In your groups, discuss how Mutoni’s consumption of the above commodities may change if her salary was raised to 500,000 FRW per month.
What will happen if her salary was reduced to 500,00 FRW per month?
Advise Mutoni concerning her expenditure and savings.2. Income of the consumer: Income of the consumer influences the amount of a commodity that can be purchased at a time. Assuming that the price of the commodity in the market remains constant, increase in the consumer’s income raises his or her ability to purchase more of the commodity. Similarly, a fall in income reduces the ability of the consumer to purchase the commodity. However, the nature of the commodity and the buyer’s consumption preference has an effect on it.
Thus, increase in the income of the consumer increases the quantity of goods demanded by the consumer and vice versa. This applies to normal goods. In cases where increase in the income of the consumer reduces quantity of goods demanded and vice versa, such goods are called inferior goods. If increase (or decrease) in income of the consumer does not largely affect quantity of goods demanded, such goods are called necessities.
How change in prices of other related commodities influence quantity demanded of a commodity
Activity 5.11
Read through the following statements.
(a) The price of Colgate remained constant at 1000 FRW while that of Close-up decreased from 1200 FRW to 800 FRW.
(b) The prices of cars doubled while that of fuel remained constant,
(c) The price of STI drugs remained constant but that of vacuum flasks increased.
In your groups, study the above cases and discuss what would be their effect on the market for the 2nd commodity in each case.
Make class presentations of your discoveries.3. Price of other commodities
Goods or commodities that serve the same purpose are termed as substitutes. For instance, Close-up and Colgate are substitutes. Increase in the price of one of the substitutes (such as Colgate in the above example) will lead to increase in quantity demanded of other substitute goods (such as Close-up). Similarly, decrease in the price of one of the substitutes will lead to increase in the quantity demanded for that good and decrease in demand for other substitute goods.Goods or commodities that are used together at the same time like a car and fuel are called complimentary goods. Increase in the prices of complementary goods reduces the quantity demanded of the other good and vice versa.
There are commodities however such as beans and electric tubes that are not related at all in consumption. Increase in the price of one such commodity does not affect quantity demanded of other unrelated commodities.
4. Seasons
Certain goods are demanded more during certain weather conditions. For instance demand for gumboots and raincoats increases during the rainy season. Demand for examination success cards and Christmas cards go with their respective seasons too.How the government influences quantity demanded of a commodity
Activity 5.12
In your groups, discuss how the government influences;
(a) The amount of computers the public can purchase from the market.
(b) Family planning kits and contraceptives the public can use.5. Government policy
The government influences quantity demanded of a commodity through taxation, offering subsidies and price legislation. Taxes, both direct and indirect reduces quantity demanded of a commodity. Direct taxes reduce consumers’ disposable incomes while indirect taxes increase the costs of production and prices of goods and services. Subsidisation of consumers by the government increases quantity demanded of a commodity by making the commodities cheap. Subsidisation of producers reduces their costs of production, which keeps producers’ prices low. Minimum price legislation reduces quantity demanded because the price is fixed above the equilibrium price. Maximum price legislation increases quantity demanded because the price is fixed below the equilibrium price.6. Tastes and preferences
Changes in fashion, education, religion, habit and general lifestyle affects the consumption patterns of the population. This in turn influences demand for a particular commodity. For instance, if a large proportion of the population converts to Islam, demand for pork reduces.7. Population
This affects aggregate demand by increasing consumption. As the population of the country increases, total consumption is also affected. Demand in an area increases if that area receives immigrants. Similarly, if people move out of an area (migrate) demand of goods for that area will go down.8. Past levels of income
The higher the past level of income, the higher the demand and vice versa. This is because the consumer will be used to high spending.9. Future price expectations
When prices are expected to increase in the future, quantity demanded increases in the current period. This is because buyers tend to make more purchases and stock for fear of paying higher prices in the days to come. This however depends on the nature of the commodity in question. Similarly if there is an anticipation of decrease in prices of commodities in future, then the current demand for such commodities will reduce.5.2.3 Law of demand
Activity 5.13
In Musanze market, the amount of irish potatoes bought was recorded against the price in a table as shown below.
(a) Using the information in the table above, draw a graph plotting the above figures.
From the graph drawn.
(b) Describe the slope of the graph.
(c) Comment on your answer.Discovery
From the activity above, I have discovered that the curve on the graph slopes downwards from the top left to the bottom right. In other words, it has a negative slope. There is an inverse relationship between price of the commodity and its quantity demanded.From the graph, it is easy to see that at higher prices, less is demanded. Similarly, at lower prices, more is demanded.
Facts
The law of demand states that “the higher the price of a commodity, the lower its quantity demanded and the lower the price, the higher its quantity demanded, ceteris paribus.” Ceteris paribus simply means holding all other factors (except price) that affect demand constant. The law of demand assumes the changes or the effect of other factors. When the price of the commodity increases, buyers purchase less of the commodity. When the price reduces, buyers shall be willing and able to purchase more of the same commodity.
Fig 5.7: The law of demand
Ceteris paribus helps to make economic analysis accurate and derivation of economic laws and principles easy. In the demand theory, when the other factors that may influence quantity demanded are assumed constant, then quantity demanded relies on price.
5.2.4. Demand schedule
Activity 5.14
Re arrange the price figures in the table in an ascending order in such a way that each price figure goes with its corresponding figure of amount of sacks.
Study your table. Make a comment relating price to the quantity of sacks bought.
Compare your comment with the one you gave in the previous activity.Facts
A demand schedule is a table showing different quantities of a commodity that can be purchased at different prices per period of time. It can be illustrated as shown above.Recall
Prepare demand schedules showing the different sizes and amounts per size using the following information. The first one has been done for you.
(a) Water from 250ml bottles
(b) Milk from 200ml packetsc) Sugar from 50gram packs
d) Soda from 300ml bottles
e) Identical clothes of different sizes from small size.
5.2.5 Demand curve
Activity 15
From the demand schedules derived above, use any one of them to plot a graph of price against the other variable. Use the figures to illustrate a curve.
(a) Comment on the shape of your curve.
(b) Compare your comments with those of others and make a conclusion.Facts
A demand curve is a graph that shows different quantities of a commodity that can be demanded at different prices at a given period of time. It is a graphical representation of the law of demand. A demand curve slopes downwards from top left to bottom right. This shows that as the price increases, quantity demanded reduces and when the price reduces, quantity demanded increases.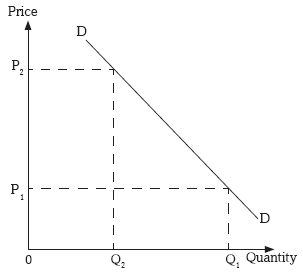
Fig 5.8: Demand Curve

5.2.6 Individual demand schedule and demand curve
Activity 5.16
Using the figures in the table, illustrate the demand curve for commodity X for individual A.
An individual demand curve shows a graph of price of a given commodity against the quantities purchased by a given consumer. It shows the consumption of a single consumer in the market. This means each individual consumer has his or her own demand schedule and demand curve.
Individual A’s demand curve Individual B’s demand curve
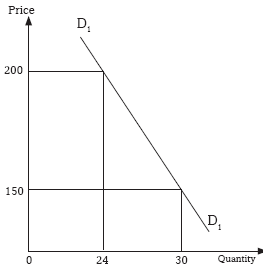
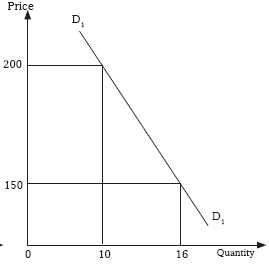
Fig 5.9: Individual demand curves
5.2.7 Market demand schedule and demand curve
Activity 5.16

A market demand schedule is a table showing the various quantities that individuals can purchase at given prices. The table in Activity 5.16 is an example of a market demand schedule.
A market demand curve shows a summation or summary of quantity demanded by all individual households in the market for a particular commodity. It is a summation of different individual demand curves. A market demand curve is more elastic than an individual demand curve. From the table in Activity 5.16 above, we can derive the following market demand curve.
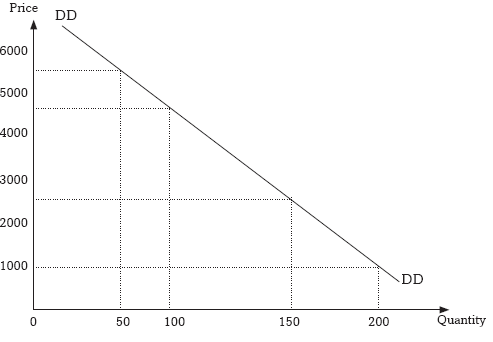
Fig 5.10: Market demand curve for individuals A, B and C
Market demand curve is obtained by plotting a graph of price against the total quantity demanded. Total quantity demanded is the sum or total of individual quantities at given prices.
5.2.7.1 The demand function
This is a technical statement that displays the relationship between the quantity demanded of a commodity and the factors that influence its quantity demanded. Thus,
In summary, the demand function has the quantity demanded on one side and all the factors that affect demand (price of the commodity, income of consumers, price of substitute and complementary goods, seasons, government policy, changes in tastes, preferences and fashion) on the other side.
5.2.8 Slope of the demand curve
5.2.8.1 The law of diminishing marginal utility and the slope of the demand curveActivity 5.17
On a very hot today, you are given bottles of soda and asked to take one by one successively until you are satisfied and cannot take any more. Draw a table similar to the one shown below in your exercise book. Record in your table the time you would take to finish each of the bottles you have taken.

Attempt the following questions:
(a) Which bottle of soda took less time to finish and why?
(b) Can you explain the difference in the time spent while taking each bottle?
(c) Which bottle did you enjoy most? Why?
(d) Which bottle did you enjoy less? Why?
(e) If you were asked to pay differently for the bottles, which one would you have paid highly and which one would you have paid less. Explain your answer.
(f) Redraw this table and attach a price to each of the bottles consumed in your table.
(g) Draw a graph to represent the information in the table above.Comment on the shape of your curve.
(i) Compare your curve with the one you drew in Activity 1.15 and derive a conclusion.Discovery
A normal demand curve slopes downwards from left to right. This curve shows or satisfies the law of demand. It shows that at high prices, quantity demanded reduces and at low prices, quantity demanded increases. When the price of a commodity increases, buyers purchase less of that commodity and vice versa.Facts
In the above activity, the consumer consumes more and more of the commodity at the beginning than as they proceed on. With time, the satisfaction derived from each extra unit consumed reduces. If the consumer were to be allowed to price the commodity, then the quantities consumed at the beginning could be priced higher than the quantities consumed later. This is because the consumer derived more satisfaction at the beginning than towards the end. All these explain the law of diminishing marginal utility.This law states that as an individual consumes more of the quantity of a commodity, the marginal utility got from consuming an extra unit of a commodity keeps on decreasing. Marginal utility refers to the extra satisfaction a consumer gets from consuming an extra unit of a given commodity. In Economics, satisfaction is also called utility. In Activity 5.17 above, the first bottle of soda consumed has more utility or satisfaction to the consumer than the extra bottles. Hence the consumer will be willing to pay a high price at the beginning because the marginal utility will be high and a lower price for each extra unit consumed. As quantity increases, satisfaction derived from each unit consumed reduces. Marginal utility therefore determines the price of the commodity.
5.2.8.2 Reasons for a normal demand curve
Activity 5.18
Akanyana is an employee of Inyange Industries Ltd. She earns 200,000 FRW per month. Assume she spends all her income on cloth. One piece of cloth costs 10,000 FRW.
(a) Determine how many pieces she will purchase at this price.
(b) How many pieces will she purchase if the price of cloth decreased to 5000FRW per piece?
(c) What will happen if the price increased to 25,000 FRW per piece?
Find out what will happen if the price remains constant but the income increases to 300,000 FRW.Facts
1. Change in the real income of the buyer: Assuming the money income of the consumer remains constant, when the price increases, the amount of goods that one’s income can purchase reduce. At higher prices, the ability of the buyer to purchase commodities reduces. The ability however increases at lower prices.2. Presence of substitutes: When the price of a commodity increases, and that of its substitute remains constant, consumers substitute goods whose prices have increased with those whose prices have remained constant (substitution effect). So less of the commodity will be purchased when its price increase. Consumers shift their consumption to the commodity with low prices.
3. Consumption behaviour of low-income earners: Low-income earners usually buy less when the price is high and buy more when the price is low. This is because the income is not enough to cover the amount of a commodity they would wish to purchase especially when prices increase.
5.2.9 Types of demand
Activity 5.19
(a) The price of commodity X decreased from 3,500 FRW per unit to 1,000 FRW per unit leading to a decrease in quantity demanded of commodity Z from 80kgs to 30kgs.
How is the demand for X related to the demand for Y?
Give examples of such commodities.
(b) The price of commodity Y doubled leading to a decrease in the quantity demanded of commodity W.
How is the demand for Y related to the demand for W.
Give examples of such commodities.Discovery
The following are the main types of demand.
1. Independent demand
2. Joint/complementary demand
3. Competitive demand
4. Composite demand
5. Derived demandFacts
1. Independent demand
There are commodities whose demand is not influenced by the demand for other commodities. Consumption of one commodity is not related to the consumption of another. The demand for these commodities is not related at all. A change in demand for one commodity does not affect the demand for the other. Such commodities are said to have independent demand. An example is sugar and a mattress. The two goods are not related at all, neither are their functions.2. Joint/complementary demand
This is demand for commodities that are used together. Increase in demand for one commodity leads to increase in demand for another. Examples of such commodities include cars and fuel, leather shoes and shoe polish, guns and bullets. For instance, when the price of cars reduces, many people will buy cars. As quantity demanded of cars increase, more of fuel (petrol) will also be demanded. Such commodities that are consumed together are called complements. Their demand is thus called joint or complementary demand.3. Competitive demand
These are commodities that serve the same purpose. Examples include airtime cards from companies such as Airtel and TIGO, or newspapers from companies such as New Times Rwanda or Inyarwanda. Increase in demand for one of the commodities reduces the demand for the other. MTN voice and data communication service can for instance, be substituted with similar services from Airtel and TIGO. If MTN increases the price of its services, it is likely to lose customers to Airtel and TIGO. As a result quantity demanded of MTN services will reduce.4. Composite demand
Some commodities are used in different ways. For instance, electricity can be used for lighting, cooking, industrial purposes and ironing. Demand for electricity is a combination of all these uses. Thus composite demand is demand for a commodity that has many uses such that demand for such a commodity sums up all the uses it servers.5. Derived demand
The demand for factors of production comes as a result of demand for the goods and services that these factors help to produce. For instance, when demand for sugar increases, it will require Kabuye Sugar Works (KSW), the producers of sugar, to increase production. This makes KSW Ltd to demand for more factors. Derived demand therefore is the demand for a commodity not for its own sake but because of demand for another commodity (demand for factors of production).5.2.10 Abnormal demand curves
Activity 5.20
Use the information in the table below to illustrate a demand curve.
Answer the following questions:
(a) Comparing your curve with the demand curve in activity 5.15, what do you notice on your curve?
(b) Does your curve respect the law of demand? Give reasons for your answer.
(c) Discuss the market conditions that may lead to the shape of your curve.
(d) Can you identify other conditions that may make a demand curve violate the law of demand?
(e) Illustrate other kinds of demand curves that do not follow the law of demand.Discovery
In the above activity, the curve does not comply or rhyme with other curves that obey the law of demand. The graph does not respect the law of demand. Further research shows that the following market conditions or conditions may lead to such graphs and other unique graphs that do not obey the law of demand.
1. When there is a depression.
2. When there are goods of ostentation (luxuries).
3. When consumers expect prices to change in future.
4. When there are giffen goods.
5. When consumers are ignorant of the market conditions.
6. If commodity is a necessity.Facts
1. When there is a depression
An economic depression is a downturn in economic conditions of a country or region. This happens when the level of economic activities slows down, incomes reach their minimal levels, unemployment is high, aggregate demand is low and the volume of production is at its lowest. During such periods, even if the price for a particular commodity reduces, its quantity demanded may not increase. This is because consumers’ capacity to purchase is limited.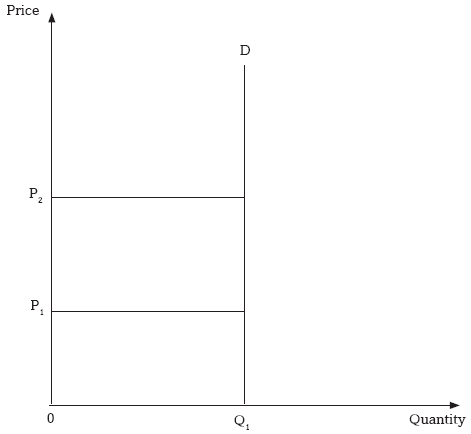
Fig 5.11: A perfectly inclastic demand curve
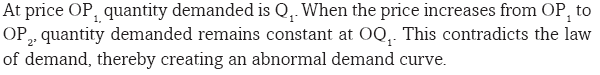
2. When there are goods of ostentation (luxuries)
These are goods that have a conspicuous consumption. They are consumed to emphasise or determine the level or status of the consumer. When their prices increase, the consumer buys more of them in order to illustrate his or her status in society. When the price reduces, the consumer abandons them to buy something else which is expensive. Demand for expensive I Pads, smart phones, jewelleries and expensive cars like Range Rovers demonstrate this effect. This violates the law of demand.
Fig 5.12: The demand curve for goods of ostentation
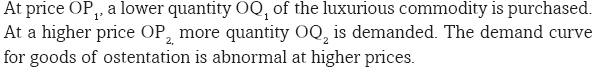
3. When consumers expect prices to change in future
When prices of commodities are expected to increase further in future, the consumer will buy more of the commodities even when there is an increase in the current price of the goods. This is because the consumerfears to buy the same commodities at much higher prices in future. Similarly, when prices are expected to decrease further in the coming days, consumers buy less in the current period waiting for prices to reduce further.
4. When there are giffen goods
Giffen goods are those goods where less is purchased at low prices and more is purchased at higher prices. The consumption behaviour of low-income earners presents us with a Giffen paradox. These goods take a large portion of their income. An example is the cheap or easily accessible foodstuffs. At very low prices, low-income earners are able to make their usual purchases and remain with some income. The remaining balance can afford the consumers to purchase another commodity they could not think of. As a result, consumers will buy less of what they usually buy as its price falls. They spend the remaining portion of their income on the other commodities they could not afford before. When prices of such commodities increase, low-income earners forget about the other commodities, and buy more of the giffen good.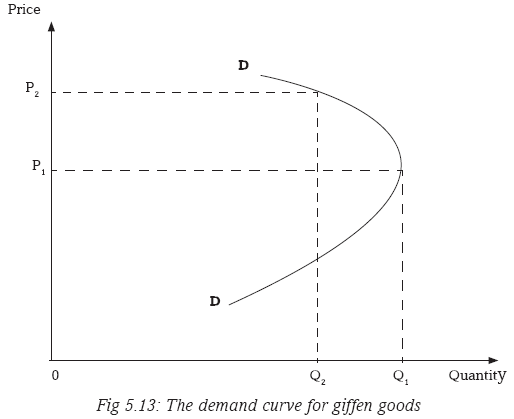
5. When consumers are ignorant of the market conditions
When consumers are ignorant of the price, quality, packing and labelling of the commodity and other market conditions, demand curve may be abnormal. An increase in price of a commodity may be taken to mean increase in quality, making the consumer to buy more of it. A consumer who is not aware of the existence of substitute goods may be forced to purchase a good at a high price irrespective of the existence of a substitute, which is cheap.6. If the commodity is a necessity
The demand for such commodities is perfectly inelastic. An example of such goods is medicine. Its demand remains high despite the increase in its price. For instance, a patient shall be willing and ready to pay any price for the subscribed medicine as long as he or she has the ability to pay.Check your pocket!
At times we are forced by situations or circumstances to buy things just for the sake. It is not a crime for you not to have some luxuries. Therefore, do not be influenced by your peers in purchasing the commodities. We are not equal financially.
5.2.11 Change in demand (shifts in the demand curve)
Activity 5.21
The price of a commodity remained constant in a market but its quantity demanded reduced by 50%. Analyse the factors that may have brought about this event.Activity 5. 22
In your groups, use the information provided below and draw the respective
graphs and answer the questions that follow.A.

B

C.

In your groups, discuss the factors that may bring about the events
illustrated by your curves.
Discuss in your groups the factors that may explain the shifts in your
demand curves.Change in demand. This refers to increase or decrease in the amount of a commodity demanded at a particular time at a constant price. The price of the commodity does not change, but because of changes in the other factors that influence demand, the quantity demanded either increases or reduces.
In a change in demand, the price of the commodity remains constant, the demand curve shifts either to the right (indicating an increase in demand) or to the left (indicating a decrease in demand), quantity demanded changes.
A change in demand may be an increase in demand. In such a case the demand curve shifts to the right. It may also be a decrease in demand where the demand curve shifts to the left.
5.2.11.1 Increase in demand
Activity 5.23
The price of mineral water remained constant in the market but its quantity demanded doubled.
Using your imagined figures, illustrate the event on a curve. Discuss the factors that may have been responsible for this event.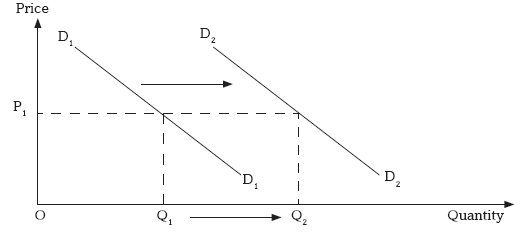
Fig 5:15: Increase in the demand
At price P1, quantity demanded is Q1. This price remains constant at P1 even when quantity demanded increases to Q2. This is an increase in demand. It may be due to increase in the size of the population, increase in consumers’ income, government subsidising consumers, reduction in both direct and indirect taxes, reduction in the price of a complementary good, increase in the price of a substitute good, favourable changes in the buyers’ tastes and preferences, or a favourable change in seasons.
5.2.11.2 Decrease in demand
Activity 5.24
The price of Jeans trousers remained constant in the market but the quantity demanded reduced by a half. Using figures generated by your group, illustrate this on a curve and determine the factors responsible.

5.2.12 Change in quantity demanded
Activity 5.25
The price of commodity X increased from
 As a result, there was a decrease in its quantity demanded from
 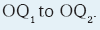 Illustrate this on a curve.
Change in quantity demanded refers to an increase or a decrease in quantity demanded of a commodity as a result of changes in its price. Change in quantity demanded leads to change in prices as well. These changes result into a change in the demand curve. Movement along the same demand curve either downwards to the right, indicates an increase in price. Movement along the same demand curve either upwards or to the left, shows a decrease in the price of the commodity.

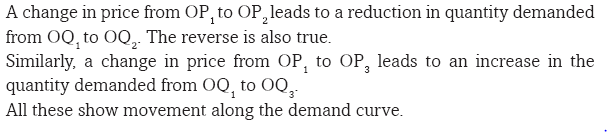
All these show movement along the demand curve.
Contraction in demand is as a result of decrease in quantity demanded due to increase in price.
Expansion in demand is as a result of increase in quantity demanded due to decrease in price.
In summary we can say that:
1. Movement along the demand curve is ONLY affected by change in price of the commodity.
2. Shift in the demand curve is caused by all factors affecting demand EXCEPT price.REMEMBER !!!!!!!!!!!!! :
Consumption is a function of income. Efficient use of our scarce resources both financial and non financial,is essential to maximising our consumption and resource sustainability.
Unit Summary
The following were discussed in this topic
TYPES OF PRICES
Reserve price.
Equilibrium price.
Market price.
Normal price.PRICE DETERMINATION
Demands and supply.
Sales auction.
Price legislation.
Haggling.
Resale maintenance.
Treaties.
Price leadership.
Cartel arrangement.DETERMINANTS OF DEMAND
Price of the commodity.
Income of the consumer.
Price of other commodities.
Seasons.
Government policy.
Tastes and preferences.
Past level of income.
Price expectations.TYPES OF DEMAND
Independent demand.
Complementary demand.
Competitive demand.
Composite demand.
Derived demand.Unit Assessment 5
1. Define the following terms as used in Economics.
(i) Demand
(ii) Quantity demanded
(iii) Effective demand
(iv) Market demand
2. (i) What do you understand by the term price?
(ii) Explain the different methods of price determination in a market.
3. Distinguish between capital market and commodity market.
4. (i) State the law of demand.
(ii) Explain the factors that influence the level of demand for a commodity in a market.5. The price of commodity Z reduced from 26,000 FRW to 15,000 FRW. This resulted into an increase in its quantity demanded from 60kgs to 134 kgs. Illustrate this information on a demand curve. What appropriate term can you use to refer to the above case?
6. (i) Distinguish between giffen goods and goods of ostentation.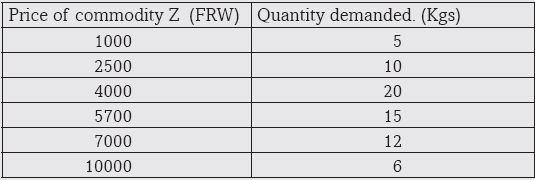
Use the figures in the table above to illustrate a demand curve. For which kind of goods does your curve represent?
7. Using examples, distinguish between competitive demand and joint demand.8. The diagram below shows different quantities demanded of beans in a market. Use it to answer the questions that follow.
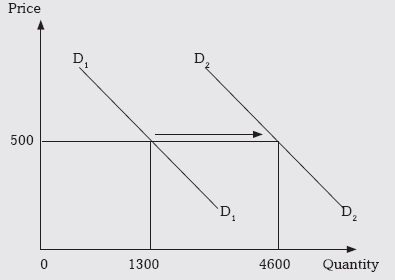
(i) What kind of the behaviour in demand is illustrated in the figure above?
(ii) Explain the factors that may have been responsible for the above event.9. Given that 2P=24-Qd and 12+2P=Qs, where Qd is quantity demanded and Qs is quantity supplied. Determine the equilibrium price and the equilibrium quantity.
10. Discuss the factors that explain the slope of a normal demand curve.UNIT 6 THEORY OF SUPPLY
Key unit competence: By the end of the unit, you should be able to analyse the determinants of supply in the market.
6.1 MEANING OF SUPPLY
Activity 6.1
Study the following passage and answer the questions that follow.
Malaria has been identified as one of the killer diseases in Africa. In trying to find a solution to completely curb this disease, our government managed to get both curative and preventive measures. Some of these measures were: sleeping under a treated mosquito net, draining all stagnant water, using insecticides specifically the ones used to kill mosquitoes and using drugs upon permission by the medical practitioners, for the sick.A company was given the mandate to supply mosquito nets and drugs countrywide. It was later realised that some areas did not get the drugs nor the mosquito nets. In addition, some areas had plenty of these facilities, others had less and other areas had nothing at all. Prices also differed from one area to another.
(a) Which other ways can be used to prevent malaria?
(b) Discuss why some areas had plenty of the materials than others.
(c) Do you think the company was justified in supplying the materials the way it did? Give reasons to defend your answer.
(d) Analyse the different factors that may influence the distribution of the materials brought into the market by producers.In the previous unit, we analysed the relationship between price and quantity demanded. The two have an inverse relationship. In the supply theory, we are going to analyse the relationship between price and quantity supplied. There is a direct relationship between demand and supply. What is supplied by producers in the market is demanded by consumers.
In the chain of distribution of goods and services, there are different parties and activities involved. The parties involved include the producer/manufacturer, the wholesaler, the retailer, and then the consumer. Goods are transported from production centres to storages facilities or warehouses and then to the market.
Most important of the above parties is the producer. He or she combines resources to come up with finished products. In today’s monetary economies, most of this output is offered for sale in markets. The study of Supply Theory helps us understand how the producers handle their supplies in the market to achieve their basic aim of profit and sales maximisation.
Supply refers to the amount of goods and services that are available in the market. Quantity supplied refers to the amount of a particular commodity that producers/suppliers are able and willing to bring to the market for sale at a certain price in a given period of time. The ability to produce commodities requires resources. The willingness to supply commodities is majorly influenced by price.
6.2. FACTORS THAT INFLUENCE SUPPLY
Activity 6.2
Millennium Bakery Ltd, a producer of bread in Rwanda, uses wheat flour and sugar as the main ingredients. In your groups, examine what will happen to the price and amount of bread in markets in Rwanda if the following events took place.
(a) Because of the East African Common Market protocol, Hot Loaf Bakery Ltd from Uganda and Super Loaf Ltd from Kenya enter the Rwandan market.
(b) Pembe Rwanda Ltd, importers of wheat into Rwanda gets access to cheaper sources of wheat.
(c) As a result of environmental degradation like deforestation and silting of water bodies, there are long spells of drought that affect wheat and sugar plantations.
(d) The parliament passes a bill that imposes a very high minimum wage.
(e) There is introduction of new and more efficient machines in the bakery industry.
(f) Taxes on inputs are reduced.(g) Because of government efforts on encouraging and promoting young entrepreneurs, more youth form their cooperatives and start up their own bakeries.
(i) The demand for cakes, a substitute of bread reduces.Activity 6.3
In a recent visit to INYANGE INDUSTRIES LTD in Kigali city, we found that their output has more than doubled in the last two years.
In your groups, discuss the factors that may have made INYANGE INDUSTRIES LTD, produce and supply to the market more of its products.Discovery
The following are the main factors that influence supply of a commodity:
1. Price of the commodity
2. Cost and availability of factors of production
3. Goals of the firm
4. Level of technology
5. Change in prices of relates goods
6. Government influence
7. Seasonal changes
8. Number of producers
9. Freedom of entry of new firms into the industry
10. Gestation period
11. Demand for the commodityFacts
1. Price of the commodity
The higher the price, the higher the quantity supplied and vice versa, ceteris paribus. When the market price for a commodity increases, it becomes more profitable to supply such a commodity. Therefore, the supplier will be willing to produce and supply more which increases quantity supplied of such a commodity.
2. Cost and availability of factors of production
In order to produce and supply, producers require resources like labour, raw materials, power, land, storage facilities etc, all of which are called factors of production. When factors of production are cheap and readily available, producers are able to produce more and supply increases. When factors of production are scarce and expensive, the capacity of producers to produce becomes low and supply reduces.3. Goals of the firm
The producer aims at profit maximisation. Profits can be maximised either by selling less output at high prices or by selling more output at low prices. Profit maximisation through sales maximisation lowers profit per unit but increases profit through high sales. Thus it increases the quantity supplied. Profit maximisation through high prices increases the profit margin per unit but reduces the quantity supplied.4. The level of technology
When firms use advanced and more efficient methods of production, the amount of commodities produced and brought to the market increases. For instance, in the agricultural sector, the use of tractors, combine harvesters, irrigation, spraying pumps and other machines increases quantity supplied. The use of inefficient, slow and poor methods of production keeps quantity supplied very low e.g use of a handhoe.5. Change in prices of related products
When commodities are jointly supplied, a change in price of one influences the supply of another. For instance, increase in the price of beef may lead to increase in the supply of skins because the two commodities are supplied together. A change in the price of commodities that use the same resources to be produced also affect the supply of each other.6. Government influence
Activity 6.4
With reference to question (f) in Activity 6.2, in your groups, examine the many ways that the government may use to influence the quantity supplied of a commodity in a market. Make class presentantions.The government may influence the supply of a commodity in different ways. Some of these ways are:
(a) Imposing high taxes on production: This reduces production and supply by increasing the costs of production. Production becomes expensive when taxes on it are increased.
(b) Offering subsidies: The government can offer subsidies to producers. This increases their production capacity. This increases supply by reducing costs of production.
(c) Protecting local industries: The government can protect and motivate local producers of commodities by stopping the importation of similar products in the market. The government can also impose very heavy unseen costs on imported goods, so that the importers are unable to make profit from the sale of the imported goods, thereby giving up along the way.
(d) Quota system: The government, through this system, ensures that at no time, the level of imports exceeds the required quantities. In addition the government ensures that imported goods do not eliminate locally manufactured goods in the market.7. Seasonal changes
In the agricultural sector, production, especially in developing economies largely depends on physical conditions. When seasonal/ natural factors are favourable supply increases. When they are unfavourable, supply decreases.8. The number of producers
When producers are many, their capacity to produce is high and strong. When producers are few, supply remains low.9. Degree of freedom entry of new firms into the industry
Activity 6.5
Refer to question (a) in Activity 6.2. Analyse the effect of the following in relation to the supply and price of bread:
(a) Entry of Super Loaf Ltd from Kenya and Hot Loaf Ltd from Uganda into the Rwandan bread market.
(b) If the above firms and many others withdrew from the Rwandan market.
Make class presentations after your analysis.Some industries have entry barriers in form of start up costs, patents, technology, and/or limit pricing by the already existing firm. When there is freedom of entry of new firms into the industry supply increases. Restricted entry of new firms keep supply low.
10. Gestation period
This is the duration between the time when the decision to produce and supply a commodity is taken and the time when output is actually produced and supplied. A long gestation period reduces supply in the current period. A short gestation period increases supply in the current period.11. Demand for the commodity
There is a direct relationship between demand for a commodity and its supply. Increase in demand for a commodity makes it more profitable as it will increase its price. This increase in demand encourages producers to produce more output to satisfy the available demand. On the other hand, a decline in demand for a commodity discourages its production and supply.6.3. LAW OF SUPPLY
On a recent visit to Nyarugenge market, we carried a survey of the price of rice and the amount of rice brought into the market by the suppliers and derived the following table.

Studying the table above, how do you relate price to the amount of rice supplied to the market? Give reasons for your answer.

The law of supply states that the higher the price, the higher the quantity supplied and the lower the price, the lower the quantity supplied, ceteris paribus. When other factors that may influence supply are held constant, when the price increases, producers produce and supply more. The reverse is true.
Recall
Why do suppliers or producers bring more qunatities to the market at high prices than at lower prices?6.4. THE SUPPLY SCHEDULE
Activity 6.7
Using the information in Activity 6.6, draw a table showing respective price levels and their amount supplied in their ascending order.
Study your table and derive a comment. Compare your comment and the comments you made in the previous activity and those of the other students.Facts
A supply schedule is a table that shows different quantities of a commodity that a producer can supply at different prices per period of time. It shows the relationship between price and quantity supplied of a commodity. It can be illustrated as shown in Activity 6.6.6.5 THE SUPPLY CURVE
Activity 6.8
(a) Using the information in Activity 6.6, draw a supply curve.
(b) Comment on the shape of your curve.
Compare the comments you have made in the three activities and make a conclusionThe supply curve is a graph that shows different quantities of a commodity that suppliers/ producers are able and willing to bring to the market at different prices over a given period of time. It is a graphical representation of the supply law. It is upward sloping from left to right illustrating the supply law.
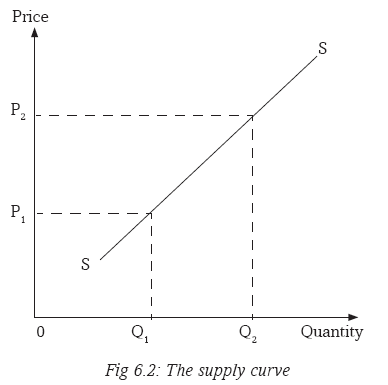
When the price increases, and production costs remain constant, production becomes more profitable. Profits per unit supplied increase. Thus the producer gets an incentive to produce and supply more to make more profits. Profit enjoyed by the existing firm motivates it to produce more.
When prices increase, firms enjoy profits, new entrants are attracted to enter into the industry and reap the available profit chance assuming there are no entry barriers. This in the end increases output produced and supplied on the market. The two events give the supply curve its upward sloping shape.
On the other hand however, when prices reduce, production becomes less profitable. Producers tend to curtail their production. Some firms exit the industry. This therefore reduces the quantity produced and supplied.
6.6: INDIVIDUAL AND MARKET SUPPLY SCHEDULES AND THE CURVES
Activity 6.9
(a) In your groups, using the knowledge acquired from the lessons on demand, generate your own figures and illustrate three individual supply schedules.
(b) Using the figures from the individual supply schedules generated by your group, present an illustration of a market supply schedule and a market supply curve.Facts
1. A supply schedule as explained above is a table showing the different quantities supplied by to the market at given prices.
2. An individual supply schedule is a table showing the various quantities of a given commodity supplied in the market by a specific producer at the given prices. It represents a single supplier in the market. This means if the market has more than one supplier, then every supplier will have his or her own supply3. A market supply schedule is a table that shows a total of different quantities of a commodity that different producers can supply to the market at different prices at a given period of time. It represents all suppliers for a particular commodity in a market.
4. An individual supply curve is a graph that shows the various quantities supplied by the individual supplier at the given prices. This graph normally has a curve moving upwards from the bottom left to the top right.
5. A market supply curve is a graph that shows the amount of a commodity that different suppliers can offer at different prices. It shows the total amount that different suppliers will be able to supply at different prices.chedule.
Table 6.1: The supply schedule

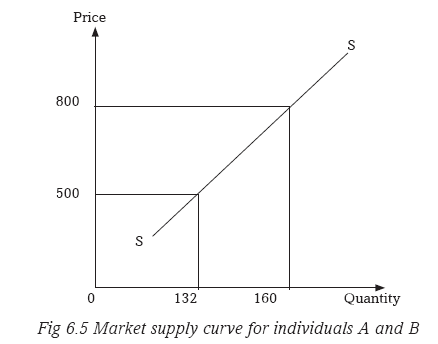
The above market supply curve shows the different quantities supplied by the two suppliers A and B at different prices
6.7 ABNORMAL SUPPLY CURVES
Group activity 6.10
1
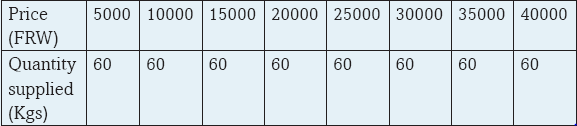
(a) Draw a graph using the information above.
(b) What is the shape of your curve?
(c) Compare your curve with the curve you illustrated in Activity 6.7. What is the difference?2
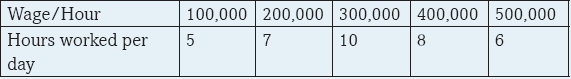
(a) Illustrate the data in the table above on the supply curve.
(b) Study the slope of your curve and compare it with the one you drew in (1) above.
(c) Compare the two curves with the one in Activity 6.7. Comment on the shape of the curves.Normally, when the price of a commodity in the market increases, the quantity supplied in the market also increases. However, under certain conditions, the price of a commodity may increase but quantity supplied either remains the same or even reduces. This will result into a curve that does not obey the law of supply. Curves that do not obey the law of supply are called abnormal or regressive supply curves. Such curves appear under the following conditions.
6.7.1. Fixed supply in the short run
Group activity 6.11
Using question one of Activity 6.10, explain the factors that may explain the slope of the curve that you drew.
Make a class presentation.Facts
Production and supply of a commodity requires time. The producer has to organise resources with which to produce and supply. When the time available is not enough to allow the producer organise and increase production and supply, quantity supplied may remain constant despite the increase in price of the commodity. In this case, the curve may appear as shown below.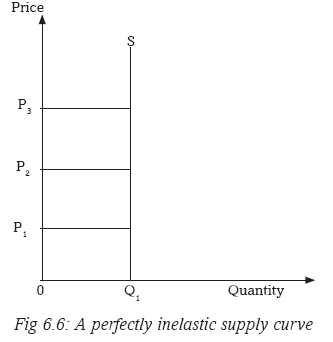
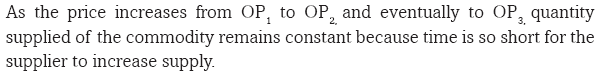
6.7.1.1 The supply of land in the short run
Land as a factor of production refers to all God made resources above, on, and under the surface of the earth that are used in the production process. It includes soils, minerals, even rain. In the short run, the supply of land is fixed and its supply curve is perfectly inelastic as shown in the figure above.6.7.2. The backward bending supply curve of labour
Activity 6.12
Use the information in Question 2 in Activity 6.10 to draw a curve. Compare the slope of your curve and the slope of the curve you drew in Activity 6.6.
In your groups, discuss and identify the factors that may have made the curve to appear the way it is.Labour has an abnormal supply curve. The supply curve of labour bends backward at high wages. When labour is paid a high wage, there is a tendency for workers to reduce the number of hours worked per day.
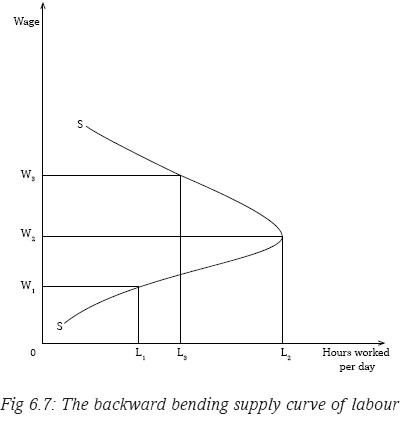

The supply curve of labour bends backwards when wages are increased because of the following reasons:
(i) Increase in wages stimulates a strong preference for leisure to work. At high wages, workers tend like more of leisure than work so they work for less hours.(ii) Presence of target workers. When the wage is increased, workers achieve their targets quickly and start working for less hours after achieving their targets.
(iii) When there is insecurity in the area where the job is located. This threatens workers who may reduce their hours of work irrespective of the increase in wages.6.8: CHANGE IN SUPPLY
Activity 6.13
‘In December last year, the price of milk in Kigali remained constant at 400 FRW per litre. However the amount of milk brought to the city rose from 100,000 litres to 180,000 litres per day. In groups;
(a) Discuss and make a presentation of the factors that may have brought about this increase in the amount of milk supplied to the city.
(b) Illustrate the above phenomenon on a curve.A change in supply refers to increase or decrease in the amount of a commodity supplied in the market at a particular time at a constant price.
The price of the commodity does not change, but because of changes in the other factors that influence supply, the quantity supplied either increases or reduces. In a change in supply, the price of the commodity remains constant, the supply curve shifts either to the right (indicating an increase in supply) or
to the left (indicating a decrease in supply), quantity supplied changes.
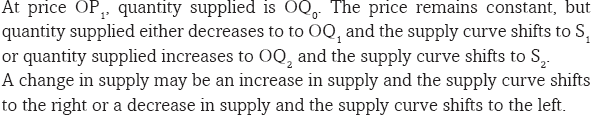
6.8.1: Increase in supply
Activity 6.14
The price of AGASHYA juice in Kigali markets remained constant. However, the quantity of the AGASHYA juice supplied by Urwibutso Nyarangarama-Sina Gerard Enterprises Ltd increased by 65%.
Explain the factors that may have been responsible for this increase. Make a presentation to the class thereafter.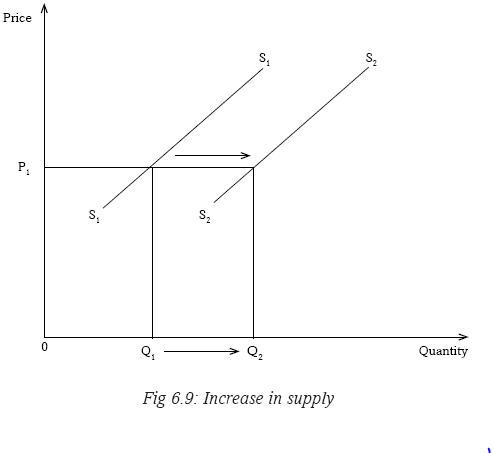
An increase in supply of a commodity may be brought about by an increase in the number of producers, improvement in technology, entry of new firms into the industry, decrease in taxes on producers (which reduces their production costs), favourable natural factors, increase in demand for the commodity, change in goals of the firm, decrease in prices of factors of production, increase in price of jointly supplied commodities or government support.
6.8.2 Decrease in supply
Activity 6.15Refer to the previous activity and analyse how the factors that you advanced can be responsible for a reduction in the amount of juice produced by the same firm.

A decrease in the supply of a commodity may be a result of decrease in the number of producers, decline in technology exit of some firms from the industry, increase in costs of production due to increase in taxes on producers, unfavourable natural factors, decline in demand for the commodity, change in goals of the firm, increase in prices of factors of production, increase in the price of a competing commodity, decrease in prices of jointly supplied commodities or government influence.
6.9: CHANGE IN QUANTITY SUPPLIED
Activity 6.16The price of rice doubled from 1000FRW per kilogram to 2000FRW leading to increase in the quantity supplied of rice from 240 bags to 400bags of rice per day.
(a) Illustrate the above on a curve.
(b) Identify the factor that was responsible for this change in the quantity supplied of rice.Change in quantity supplied refers to increase or decrease in the amount of a commodity supplied to the market as a result of changes in its price. In a change in quantity supplied, there is a price change which results into a change in the amount supplied. There is a movement along the same supply curve either downwards to the left which indicates a decrease or upwards to the right which shows an increase.
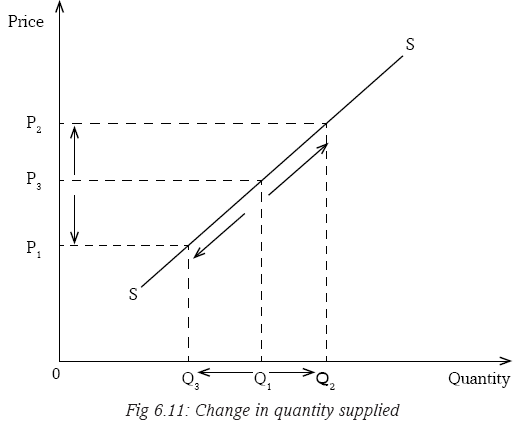

6.10. TYPES OF SUPPLY
Activity 6.17‘Inyange industries Ltd are the producers of Inyange Packed Milk and Inyange Fruit Juice. They have hectares of land which they use in the production of the two products.’
(a) Discuss how increase in the price of milk will affect the production and supply decisions of Inyange Industries Ltd in regard to juice production.
(b) If Inyange Industries Ltd diversified its production to include beef production, and used the piece of land to produce beef, explain what would happen to the supply and price of skins.1. Competitive supply
This is the supply of two commodities that use the same resources such that increase in the production and supply of one reduces the resources available for the production and supply of another. For instance, in the activity given above, when Inyange Industries Ltd decides to allocate more of its resources to the production of milk, the supply of fruit juice will reduce because more of the land will go to cow rearing.2. Joint supply
Activity 6.18Assume Inyange Industries Ltd has taken a decision to diversify its production by entering the beef production industry.
In your groups, discuss how this decision by Inyange Industries Ltd will affect the following:
(a) The supply of beef.
(b) Price of beef.
(c) The supply of skins.
(d) Price of skins.This is the supply of two commodities that are produced together such that increase in supply of one leads to increase in supply of another for instance the supply of beef and skins.
Remember !!
Efficient use of resources to produce and supply commodities require good production practices that can ensure environmental sustainability.
High financial and budgetary discipline is essential for the growth and expansion of private and public savings and investments.Unit Summary
The following aspects were covered in this unit:• Supply
• Quantity Supplied
• Price
• Gestation Period.
• Supply Curve
• Abnormal Supply Curves
• Backward Bending Supply Curve Of Labour.
• Change In Supply
• Change In Quantity Supplied.
• Competitive Supply.
• Joint Supply.Unit Assessment 6
1. Distinguish between supply and quantity supplied.
2. The price of commodity X remained constant at 700 FRW per kilogram but the quantity supplied of it in the market reduced by 40%. Explain the factors that may have caused this decline in supply.3.
Use the data in the above schedule to illustrate a market supply curve.
4.
Use the information in the table above to illustrate the supply curve.
UNIT 7 EQUILIBRIUM AND PRICE DETERMINATION
Key unit competence: By the end of the unit, you should be able to determine the equilibrium position in the market.
7.1: MEANING OF EQUILIBRIUM PRICE AND EQUILIBRIUM QUANTITY
Activity 7.1
Study the diagram above and give the reasons for the inclination.
(a) What can be done to bring about a balance between the two objects?
(b) Supposing object A represented the number of kilogrammes brought by suppliers and object B represented the number of kilogrammes demanded by buyers of a particular commodity in a market, explain what would happen to the price of such a commodity.
(c) What would you do to bring the two sides to balance?Discovery
We have so far looked at demand and supply in the previous units. We looked at how quantity demanded and quantity supplied relate to price. We explained how each of the two changes and what happens to the curves whenever there is a change in any of the two variables. In this unit, we shall see how interaction of demand and supply brings about a point of stability in the market where the two forces are equal. We shall also look at how a change in one or both of them affects the price in the market.Equilibrium is a point of stability where the forces that exist tend to remain constant without any tendency to change. Equilibrium occurs when different forces acting on the centre tend to be equal. There is a balance between the two forces. In Economics, we may look at different kinds of equilibria. For instance, there is equilibrium price and equilibrium quantity, equilibrium level of national income, equilibrium of an industry, equilibrium of a firm and unemployment equilibrium.
In Unit 5, we looked at how prices are determined in the market by the forces of demand and supply. Buyers meet with sellers in the market and each negotiates to satisfy his or her interest. Buyers want to maximise satisfaction at the lowest possible price. Sellers want to maximise profits by selling at the highest possible price. When the market forces are left to operate freely without any interference, there will be continuous adjustments until a point where stability is attained.
Activity 7.2
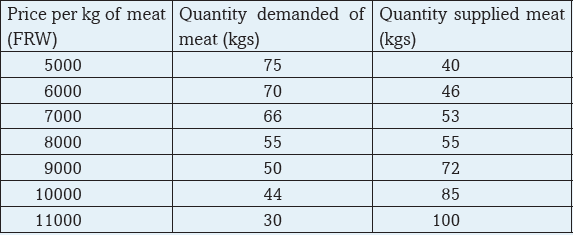
Basing on the knowledge you derived from the previous two units, use the information in the table above to illustrate the supply and demand curve on the same graph.
On your graph, identify the equilibrium point, equilibrium price and equilibrium quantity.Activity 7.3
Given that when the price of meat is 2000 FRW, quantity demanded is 190kg and quantity supplied is 130 kg. For any 100 FRW increase in price, quantity demanded reduces by 4kgs while quantity supplied increases by 8kgs. In groups of four, derive a demand and supply schedule using the above information. Use it to determine the equilibrium price and quantity in the market. Illustrate your findings on a graph.Discovery
Equilibrium price is that price ruling in the market where quantity supplied is equal to quantity demanded. At that price, the amount of commodities brought to the market by suppliers is wholly bought by the buyers, leaving no excess or shortages in the market.Equilibrium price and quantity occur when quantity demanded is equal to quantity supplied.
From the table in the activity above, as the price keeps increasing, buyers are willing to purchase less of the kilogrammes of meat. On the other hand, suppliers are ready to bring more and more to the market as the price increases. When the price reaches 2500 FRW for a kilogramme, the quantity demanded by buyers is equal to what is supplied by the sellers at 170 kilogrammes. At this point, the market is said to be in equilibrium.
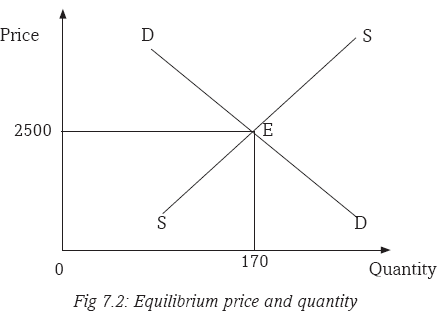
Where
E = Equilibrium point where quantity demanded is equal to quantity supplied.
2500 = Equilibrium price.
170 = Equilibrium quantity.
At the equilibrium point (E), quantity demanded and quantity supplied are equal.However, there could be disequilibrium where the two forces are not equal. Disequilibrium may be either a shortage (excess demand) or a surplus (excess supply).
When quantity demanded is greater than quantity supplied, then, there is a shortage of commodities in the market. In the figure 7.3, quantity demanded is Q2 but quantity supplied is Q4 at price P1. A shortage of commodities in the market implies that buyers will compete for the available few commodities. This scenario leads to an excess demand. They will be ready to pay a high price. This excess demand will lead to price increase.
When quantity supplied is greater than quantity demanded, there is a surplus of commodities in the market. In the figure 7.3, quantity demanded is Q1 while quantity supplied is Q2 at price P2. Suppliers have a lot of commodities to sell. Buyers are ready to purchase less quantities compared to what the sellers have to offer. This scenario leads to an excess supply. This excess supply of commodities will force the price to go down. Suppliers will be ready to reduce the price of their commodities so that they can attract buyers.
In the long-run, once excess demand and excess supply have been dealt with, the market will remain in a state of equilibrium.

7.2: EQUILIBRIUM EQUATIONS
Activity 7.4

Use the functions in the table to determine whether there is equilibrium in each set of equations. Illustrate your findings.
7.3: EFFECTS OF CHANGES IN DEMAND AND SUPPLY ON EQUILIBRIUM
Activity 7.5
Increase in transport costs reduced the supply of milk by 60% at constant prices. Decrease in consumer’s disposable incomes reduced milk demand by 30%. Examine the above market conditions in relation to demand and supply of milk and the equilibrium point and provide an illustration.In Units 5 and 6, we looked at changes in demand and changes in supply and what may bring about the two. A change may be an increase or a decrease.
An increase or decrease in demand is brought about by changes in the factors that influence demand, other than the commodity’s price. An increase or decrease in supply is caused by changes in factors that influence supply, other than the price of the commodity.In this unit we shall analyse how changes in demand or supply will affect the equilibrium. These changes may lead to the extension or contraction of the equilibrium.
7.3.1 Increase in demand
Increase in demand shifts the demand curve to the right. It may be due to increase in the size of the population, increase in consumers income, government subsidising consumers, reduction in both direct and indirect taxes, reduction in the price of a complementary good, increase in the price of a substitute good, a favourable change in the buyers’ tastes and preferences, or a favourable change in seasons.When the demand curve shifts to the right, the equilibrium is extended. This leads to an increase in the equilibrium price and equilibrium quantity.
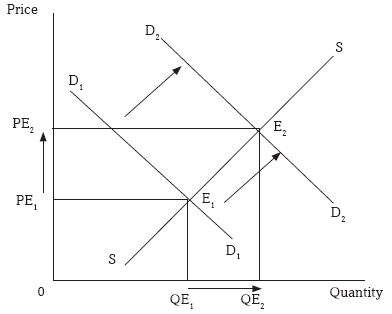
Fig 7.4: Increase in demand and extension of equilibrium
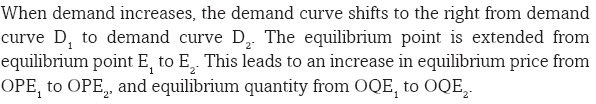
7.3.2 Decrease in demand
A decrease in demand makes the demand curve to shift to the left. It may be due to decrease in the size of the population, decrease in consumers income, reduction in government subsidies to consumers, increase in both direct and indirect taxes, increase in the price of a complementary good, decrease in the price of a substitute good, unfavourable changes in the buyers’ tastes and preferences, or unfavourable change in seasons.When the demand curve shifts to the left, the equilibrium is contracted. This leads to a decrease in the equilibrium price and the equilibrium quantity.

Fig 7.5: Decrease in demand and contraction of equilibrium
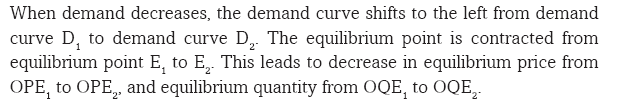
7.3.3 Increase in supply
Increase in supply shifts the supply curve to the right. This will lead to increase in the equilibrium quantity and decrease in the equilibrium price.An increase in supply of a commodity may be brought about by an increase in the number of producers, improvement in technology, entry of new firms into the industry, decrease in taxes on producers which reduces their production costs, favourable natural factors, increase in demand for the commodity, change in goals of the firm, decrease in prices of factors of production, or increase in price of jointly supplied commodities.
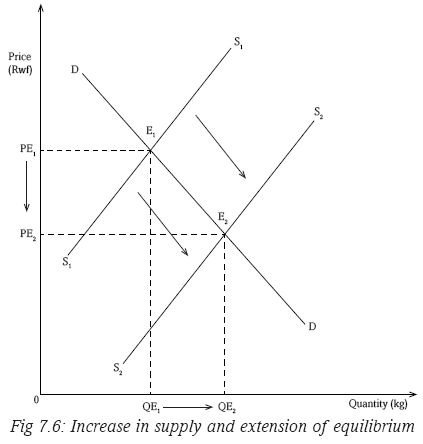

7.3.4 Decrease in supply
Decrease in supply shifts the supply curve to the left. The equilibrium point contracts to the left. This will lead to decrease in the equilibrium quantity and increase in the equilibrium price.A decrease in supply of a commodity may be brought about by a decrease in the number of producers, decline in technology, exit of new firms from the industry, increase in taxes on producers which increases their production costs, unfavourable natural factors, decrease in demand for the commodity, change in goals of the firm, increase in prices of factors of production, or decrease in price of jointly supplied commodities.
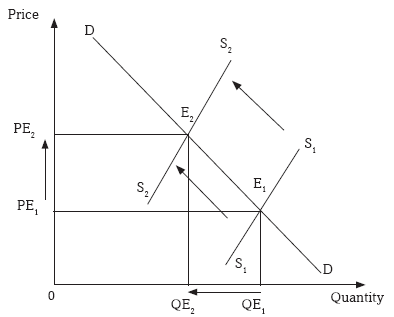
Fig 7.7: Decrease in supply and contraction of equilibrium.
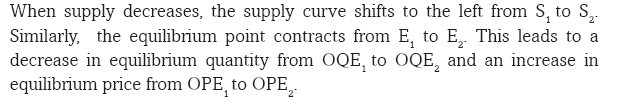
7.3.5 Change in demand and supply by the same margins
When both demand and supply change by the same margins and in the same direction, the equilibrium point changes. However the equilibrium price remains almost the same. The equilibrium quantity either increases or decreases.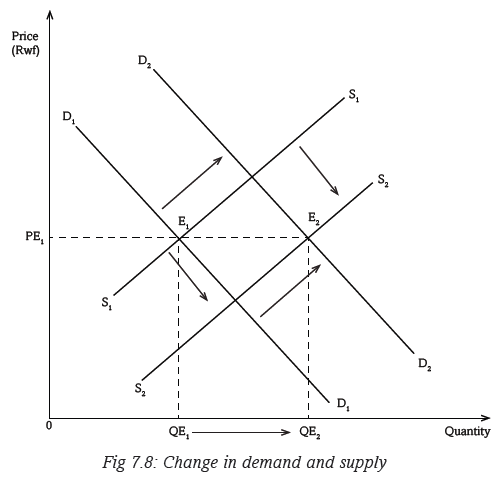
Due to the factors that influence both variables, the two may change by either increasing or decreasing. If the two change in the same direction and by the same degree, the equilibrium price remains constant.
Recall
In a market place, different people with different backgrounds, behaviour, character, and interests meet as either buyers or sellers. In this era of HIV/AIDS which advice can you give to such congregation as an Economics student?Unit Summary
In the whole unit, the following were covered:
• Equilibrium
• Equilibrium price
• Shortage in a market
• Surplus in a market
• Equilibrium quantity
• Change in demand and supply
• Effects of change in demand and supply or equilibrium.Unit Assessment
1. Distinguish between equilibrium price and equilibrium quantity.
2. Given the schedule below, derive a curve illustrating the equilibrium price and equilibrium quantity.
3. Given the functions that Qd-4p=136 and Qs=6p+124,
(i) Determine equilibrium price and equilibrium quantity.
(ii) Illustrate your findings on a curve.
4. Increase in transport costs reduced the supply of milk by 20% at constant prices while a decrease in consumer’s disposable incomes reduced milk demand by 10%. Illustrate the above market condition in relation to equilibrium price and equilibrium quantity of milk.UNIT 8 ELASTICITY
Key unit competence: By the end of this unit, you should be able to interpret the variations in percentages of quantity demanded and supplied due to changes in their determinants.
8.1 INTRODUCTION
Activity 8.1
In your groups, carry out research in the library, read through business newspaper articles, business magazines and journals, Economics textbooks and from the Internet, the meaning of the following words:
(a) Elasticity
(b) Elasticity of demand
(c) Elasticity of supply
(d) Price elasticity of demand
(e) Income elasticity of demand
(f) Cross elasticity of demand
(g) Price elasticity of supplyActivity 8.2
Demand Schedule A
Demand schedule B
Demand schedule C
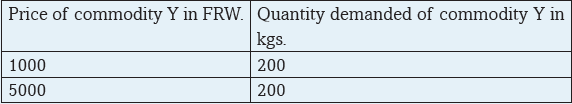
Demand schedule D
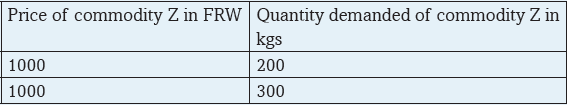
(a) Study the demand schedules A, B, C and D. Compare how quantity demanded relates to change in price in each of the above demand schedules. What do you derive from your comparison?
(b) Use the demand schedules above to illustrate an appropriate demand curve for each schedule. Compare the slopes of your demand curves and make a clear comment on each.
(c) Identify and discuss the market conditions that can explain why quantity demanded may respond to changes in price as shown in each of your curves.
(d) With your knowledge of the supply law, change the above demand schedules into supply schedules.
(e) Repeat the same activity as in (i), (ii), (iii) above using your supply schedules derived in (iv) above.Discovery
In Units 5 and 6, we showed that quantity demanded changes when there are changes in price. We also looked at how sellers vary their quantities supplied when market prices change. We showed that quantity demanded and quantity supplied increase or decrease when other factors that influence them change.Under certain conditions, the consumer may not vary much of a commodity he or she purchases, irrespective of changes in the price or other factors. In other conditions, the supplier may supply almost the same quantity of a commodity irrespective of the increase or decrease in price.
In this unit, we shall look at how quantity demanded or supplied responds to change in price or other factors that influence it.
Facts
The degree of reaction of dependent variables to changes in independent variables is what is called elasticity. An independent variable is a factor that has an influence on another associated factor (that is called a dependent variable). Price of a commodity, income of the consumer and price of related commodities are examples of independent variables. These independent variables have a direct influence on dependent variables such as quantity demanded or quantity supplied.8.2. ELASTICITY OF DEMAND
Activity 8.3
From the research you made in Activity 8.1, explain the forms of elasticity of demand. Show how different they are.Facts
Elasticity of demand is a measure of the degree of responsiveness of quantity demanded of a commodity to changes in factors that affect demand. When factors that influence quantity demanded such as price of the commodity, income of the consumer, or price of related commodities change, the quantity demanded of a commodity responds. However, our main concern is the percentage of this response. Elasticity of demand thus measures the percentage of such response.In your study of the demand schedules in the group activity at the beginning of this unit, you discovered that quantity demanded of commodities V, X, Y and Z responded differently to price changes. The difference in their response shows these commodities have a difference in their price elasticity of demand.
In this unit, we shall categorise elasticity of demand into:
• Price elasticity of demand.
• Income elasticity of demand.
• Cross elasticity of demand.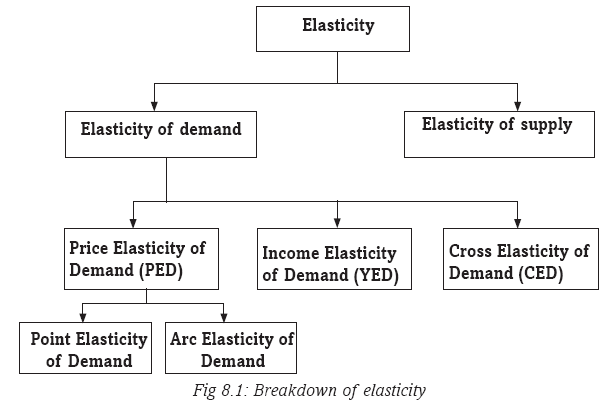
8.2.1 Price elasticity of demand (PED)
Activity 8.4
With reference to the research you made in Activity 8.1, explain to your classmate seated next to you the meaning of price elasticity of demand.Price elasticity of demand refers to a measure of the degree of the responsiveness of quantity demanded of a commodity to changes in its own price. When the price of a commodity increases or decreases, its quantity demanded reacts to a certain extent. Quantity demanded may reduce, increase or even remain constant. Price elasticity of demand therefore measures the extent of this reaction.
Price elasticity of demand is measured as a percentage change in quantity demanded to the percentage change in price.
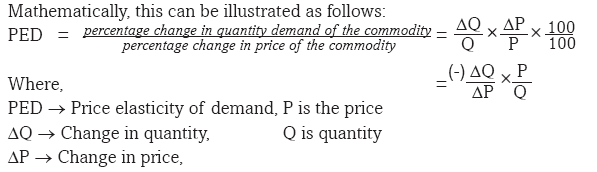
Activity 8.5
Using the formula given below, solve the following questions.
Formula.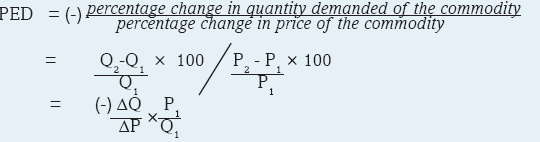
(a) The price of commodity X increased from 200kgs to 300kgs as a result of a 20% decrease in its quantity demanded. Determine its price elasticity of demand.
(b) Given that the price of commodity Y reduced from 600 FRW to 450 FRW as a result of increase in its quantity demanded from 120kgs to 200kgs. Determine its price elasticity of demand.
(c) The price of commodity Z increased from 10,000 FRW to 50,000 FRW leading to a decrease in its quantity demanded by 50%. Find the price elasticity of demand.
(d) The price of a commodity remained constant at 2,500 FRW per unit but its quantity demanded increased from 100 litres to 300 litres. Determine its price elasticity of demand.
(e) The price of commodity S increased from 15,000 FRW to 20,000 FRW but its quantity demanded remained constant. Find its price elasticity of demand.Price elasticity of demand may be categorised into:
• Perfectly inelastic demand.
• Inelastic demand.• Unitary elastic demand.
• Elastic demand.
• Perfectly elastic demand.8.2.1.1 Perfectly inelastic demand
Activity 8.6
Refer to question 5 in Activity 8.5 and analyse your answer. Use it to interpret and categorise the price elasticity of commodity S.When demand is perfectly inelastic, then PED = 0
A change in price results into zero change in quantity demanded. Consumers do not respond to changes in price. As the price changes, consumers continue to buy the same amount of a commodity that they have been buying before the price changed.
Fig 8.2: Perfectly inelastic demand

8.2.1.1 Inelastic demand
Activity 8.7
Refer to question 1 in Activity 8.5 and analyse your answer. Use it to interprete and categorise the price elasticity of commodity X.When demand is inelastic, then PED>0<1
A change in price results into a proportionately smaller change in quantity demanded. Consumers do not vigorously respond to changes in price. There is a bigger change in price leading to a smaller change in quantity demanded. As the price changes, consumers continue to buy almost the same amount of a commodity that they have been buying before the price changed.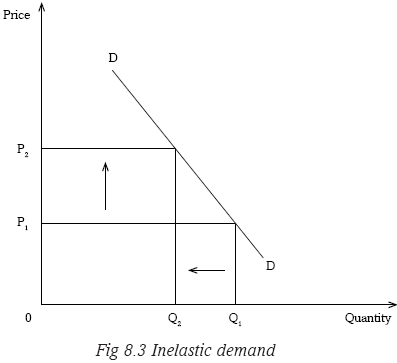

8.2.1.3 Unitary elastic demand
Activity 8.8
Refer to question 3 in Activity 8.5 and analyse your answer. Use it to interpret and categorise the price elasticity of the commodity Z.When demand is unitary elastic, then PED = 1
A change in price results into a proportionately equal change in quantity demanded. Consumers respond to changes in price. A change in price leads to a relatively equal change in quantity demanded.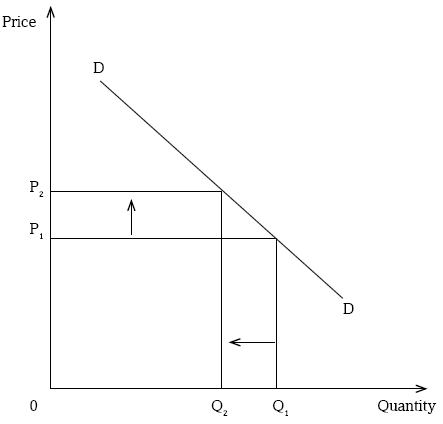
Fig 8.4: Unitary elastic demand
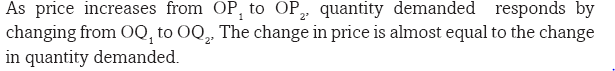
8.2.1.4 Elastic demand
Activity 8.9
Refer to question 2 in Activity 8.5 and analyse your answer. Use it to interpret and categorise the price elasticity of the commodity Y.When demand is elastic, then PED>1<∝
A change in price results into a proportionately bigger change in quantity demanded. Consumers vigorously respond to changes in price. There is a smaller change in price leading to a bigger change in quantity demanded. As the price changes, consumers buy much less of the commodity.
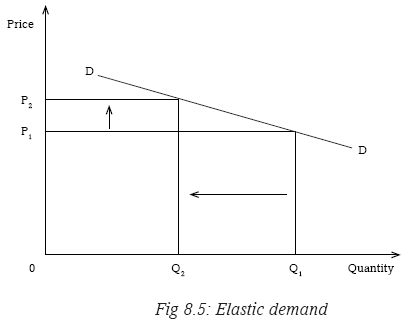

8.2.1.5 Perfectly elastic demand
Activity 8.10
Refer to question 4 in Activity 8.5 and analyse your answer. Use it to interpret and categorise the price elasticity of the commodity.When demand is perfectly elastic, then PED =∞.
There is a constant price. Quantity demanded changes. At a constant price, consumers vary the amounts of a commodity they buy.

Point elasticity: This is the price elasticity at a point on the demand curve. It gives price elasticity with a complete accuracy at a point. It can be calculated using the below formula:
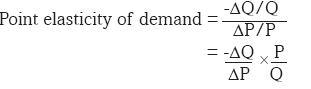
Arc elasticity: This represents the coefficient of price elasticity between two points on the demand curve. It is an estimate of the elasticity along a range of the demand curve. It is calculated using the below formula:
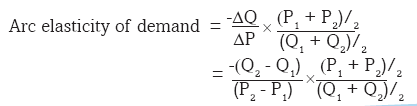
8.2.2 Determinants of price elasticity of demand
Activity 8.11
Refer to question (iii) in Activity 8.2 and base on the knowledge you have so far gained from this unit to make further discussion and make class presentation.Discovery
The following are the determinants of price elasticity of demand:
1. Consumer income.
2. Price expectations.
3. Price of the commodity.
4. Degree of urgency involved.
5. Consumers’ ignorance.
6. Habit forming commodities.
7. Advertising.
8. Durable products.
9. Several uses of the commodity.Facts
1. Consumer’s income: Generally consumers with high incomes have inelastic demand. At any price, they will purchase the commodity they want because their purchasing capacity is high. Low-income earners have elastic demand. When the price increases, their purchasing capacity is affected and so they purchase less of the commodity.2. Availability of substitutes: Commodities with close substitutes have elastic demand. This is because when their prices increase and those of their substitutes remain constant, consumers shift to substitutes. Commodities with no close substitutes have inelastic demand.
3. Price expectations: When prices are expected to increase in future, demand for such commodities becomes inelastic. When there is an increase in price in the current period, consumers may not cut on their purchases because they expect prices to increase further in the coming days.
4. Price of the commodity: Cheap commodities have inelastic demand. Commodities like matchboxes, razor blades, needles are really cheap. The price of a matchbox is around 50 FRW. Even if there is 100%
increase in its price, still it remains cheap and affordable. Its demand thus becomes inelastic. However expensive commodities have elastic demand.
5. Degree of urgency involved: Urgently needed commodities have inelastic demand. A sick person will be ready to pay any price for medicine that the doctor has prescribed. Necessities have inelastic demand, such that even if their prices increase or reduce, consumers have to buy almost the same quantities. Luxuries however have elastic demand. If consumption of a commodity can be postponed, its demand becomes elastic.
6. Consumer’s ignorance: When consumers are ignorant of the market conditions, demand becomes inelastic. For instance, a commodity may have substitutes. But the consumer is not aware. So when its price increases, the consumer will continue to purchase it not knowing that there is a close substitute, which is even cheaper.
7. Habit forming commodities: Commodities whose consumption develops habit tend to have inelastic demand. Even if their prices change, consumers consume the same quantities. Drug addicts will be ready to pay any price to acquire the commodity.
8. Advertising: Promotional advertising may make demand inelastic. Consumers may be made to buy a commodity at high price because of persuasive advertising.
9. Durable commodities: Highly durable commodities have inelastic demand. A flat iron box for instance, is durable and lasts for over a year. Even if the price of the iron box reduces by a bigger percentage, the customer may not buy another iron box.
10. Several uses of the commodity: Commodities that serve many functions have elastic demand. When their prices increase, consumers only buy them for the most important of their uses. Their quantity demanded so reduces. Commodities with single functions have inelastic demand.
8.2.3 Practical applications of price elasticity of demand
Activity 8.12
Using your knowledge of elasticity of demand, discuss and identify real life situations where you can apply elasticity of demand. Make class presentations of your discoveries.The concept of price elasticity of demand is essential to:
• The government.
• The producer.
• The consumer.Price elasticity of demand enables the producer to decide whether to increase or decrease the price in order to increase total revenue.
If price elasticity of demand is elastic, producers’ total revenue increases when the price is reduced.
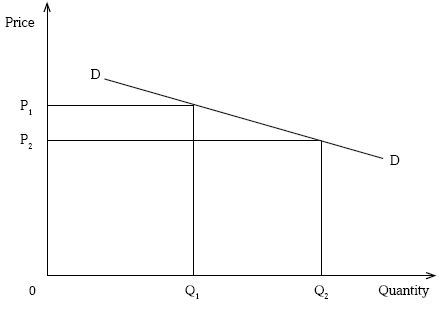
Fig 8.7: Total revenue

When price elasticity of demand is inelastic, producers’ total revenue increases when prices are increased.
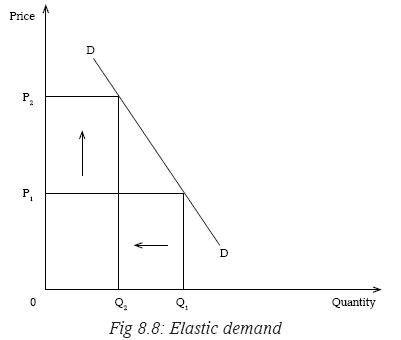
At price OP1, total revenue (TR) is OP1 × OQ1. When the price is increased to OP2, total revenue becomes OP2 ×OQ2. It can easily be identified that total revenue OP1 × OQ1 is smaller than total revenue OP2 ×OQ2. Thus, in order to increase total revenue, the seller should increase the price if the commodity has inelastic demand.
Price elasticity of demand is helpful to the monopolist when practising price discrimination. A low price should be charged in a market where price elasticity of demand is high/elastic. Similarly, a high price should be charged in a market with a low/inelastic price elasticity of demand.
Price elasticity of demand helps the producer to determine the wage level for his or her workers. When demand is inelastic, wages should be increased as the price increases. Producer’s incomes will be high when the price rises. So, the producer can increase workers’ wages.
The government sometimes devalues its currency. This is done to increase the volume of exports by making them cheap in a foreign currency. Devaluation also reduces the volume of imports by making them expensive in the domestic currency. In order for devaluation to succeed elasticity of demand and supply for both imports and exports should be elastic.
Price elasticity of demand helps government to decide which commodities to tax. Government levies taxes with various objectives. Taxes may be used as sources of revenue, or used to reduce consumption of particular commodities. In order to increase tax revenue, the government should tax more commodities with inelastic demand. For reduction of consumption of a commodity, the government should target commodities with elastic demand.
The consumer’s expenditure is equal to seller’s income. Thus increase in producer’s income due to increase or decrease in producer prices, implies that the consumer’s expenditure has increased proportionally. Thus price elasticity of demand helps the consumer to determine his expenditure by looking at price changes.
Price elasticity of demand helps the government to determine the tax incidence. The tax incidence is the final resting of tax, that is, who actually bears the burden of a tax? Is it the producer, the consumer or both? If both, who bears more tax burden than the other? This depends on the price elasticity of the commodity involved.
Taxes on production increase the costs of production. When costs of production increase, the scale of production and supply reduces. Increase in costs of production and decrease in supply increases the price of commodities.
When demand is elastic, the tax burden is shared by both the consumer and the producer. However, the producer bears the biggest proportion of the tax burden as illustrated in the diagram below.
a-b represents the tax borne by the consumer and b-c, the proportion of the tax that is borne by the producer. a-b is smaller than b-c.
When demand is inelastic, both the consumer and the producer share the tax burden. However, the consumer bears the biggest proportion of the tax burden as illustrated in the diagram below.
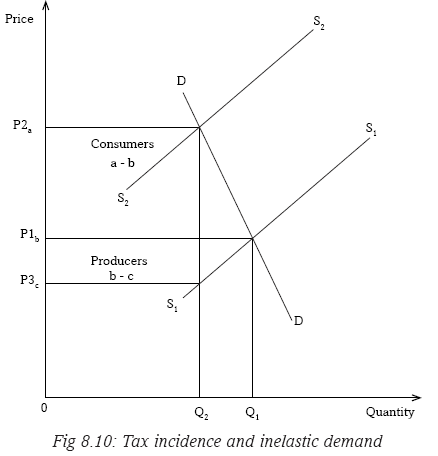
a-b represents the whole tax that is borne by the consumer alone.
When demand is perfectly inelastic, the tax burden is borne by the consumer alone.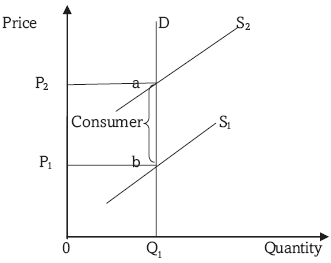
Fig 8.11: Tax incidence and perfectly inelastic demand
a-b represents the whole tax that is borne by the consumer alone.
When demand is perfectly elastic, the tax burden is borne by the producer alone.
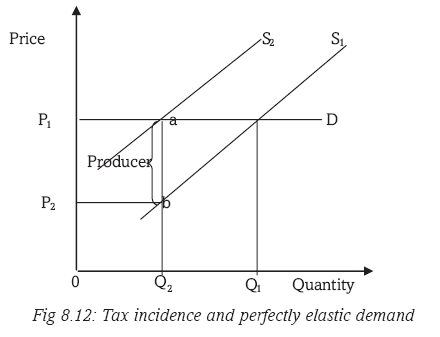
a-b represents the whole tax that is borne by the producer alone.
8.2.4 Income elasticity of demand (YED)
Activity 8.13
With your knowledge of price elasticity of demand, use the formula given to answer the questions below.
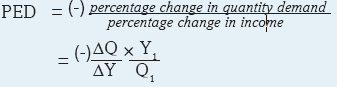
(a) Given that the income of the consumer increased from 50,000FRW to 70,000FRW, leading to a reduction in the quantity demanded of commodity X from 70 kgs to 40kgs,
(i) Find the income elasticity of demand.
(ii) What kind of commodity is X?
(b) The quantity demanded of commodity Y increased from 200 litres to 450 litres as a result of a 40% increase in consumer’s income. Determine the income elasticity of demand and the type of commodity Y.
(c) The income of consumers changed by 25% but the quantity demanded of commodity Z remained constant at 46 kgs. Find the elasticity of demand and state the type of the commodity.Income elasticity of demand is a measure of the degree of responsiveness of quantity demanded of a commodity to change in consumer’s income. When the income of the buyer increases or decreases, quantity demanded reacts to a certain extent. Quantity demanded may reduce, increase or even remain constant. Income elasticity of demand therefore measures the extent of this reaction.
Income elasticity of demand is measured as a percentage change in quantity demanded to the percentage change in income.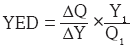
Income elasticity of demand may be:
• Positive, which implies that the commodity is a normal good/service.
• Negative, which shows that the commodity is an inferior good/service.
• Zero, which implies that the commodity is a necessity.8.2.5 Cross elasticity of demand (CED)
Activity 8.14
With your knowledge of price elasticity of demand and income elasticity of demand, use the formula given to answer the following questions.
(a) Given that the price of commodity Y increased from 2,000 FRW to 7,000 FRW leading to a reduction in the quantity demanded of commodity X from 50 kgs to 30 kgs,
(i) Find the cross elasticity of demand.
(ii) State the relationship between commodity Y and X.
(b) The quantity demanded of commodity X increased from 400 litres to 750 litres as a result of a 20% increase in price of commodity Y. Determine the cross elasticity of demand and the relationship between commodity X and Y.
(c) The price of commodity Y changed by 55% but the quantity demanded of commodity X remained constant at 1000 litres. Find the cross elasticity of demand and state the relationship between the two commodities.Cross elasticity of demand is a measure of the degree of responsiveness of quantity demanded of one commodity X to changes in price of another commodity Y. When the price of one commodity increases or decreases, quantity demanded of other related products reacts to a certain extent.
Quantity demanded may reduce, increase or even remain constant. Cross elasticity of demand is measured as a percentage change in quantity demanded of one commodity to the percentage change in price of another.
Cross elasticity of demand can be:
• Positive; this implies that the two commodities X and Y are substitutes.
• Negative; this shows that the two commodities X and Y are compliments.
• Zero; this implies that the two commodities X and Y are unrelated.Activity 15
Using the knowledge of the research you made in activity 1 of this unit, repeat parts (iv) and (v) of activity 2, and exchange your findings amongst your groups.Elasticity of supply refers to a measure of the degree of responsiveness of quantity demanded of a commodity to changes in factors that affect supply.
Quantity supplied of a commodity is influenced by a number of factors like cost and availability of factors of production, goals of the firm, the level of technology, change in prices of related products, government policy, seasonal changes, the number of producers, degree of freedom entry of new firms into the industry, gestation period, or demand for the commodity.
Elasticity of supply measures the extent to which quantity supplied responds to changes in these variables.8.3.1 Price elasticity of supply (PES)
Activity 8.16
Basing on the knowledge gained in elasticity of demand, and using the
formula given, answer the following questions.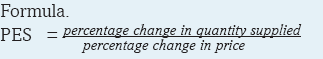

a) The price of commodity X increased from 100kgs to 300kgs as a result of a 20% increase in its quantity supplied. Determine its price elasticity of supply.
(b) Given that the price of commodity Y reduced from 600 FRW to 450 FRW resulting into a decrease in its quantity supplied from 800kgs to 200kgs. Determine its price elasticity of supply.
(c) The price of commodity Z increased from 1000 FRW to 1,300 FRW leading to an increase in its quantity supplied by 30%. Find the price elasticity of supply.
(d) The price of a commodity remained constant at 2,500 FRW per unit but its quantity supplied increased from 100 litres to 300 litres. Determine its price elasticity of supply.
(e) The price of commodity S increased from 3,000 FRW to 4,500 FRW but its quantity supplied remained constant. Find its price elasticity of supplyPrice elasticity of supply refers to a measure of the degree of responsiveness of quantity supplied of a commodity to changes in the price of the commodity.
Price elasticity of supply is measured as a percentage change in quantity supplied to the percentage change in price.
8.3.2 Interpretation of price elasticity of supply
Price elasticity of demand may be categorised as follows:
• Perfectly inelastic supply.
• Inelastic supply.
• Unitary elastic supply.
• Elastic supply.
• Perfectly elastic supply.8.3.2.1 Perfectly inelastic supply
Activity 8.17
Refer to question 5 in Activity 8.16 and analyse your answer. Use it to interpret and categorise the price elasticity of supply of the commodity.When supply is perfectly inelastic, then PES = 0
A change in price results into zero change in quantity supplied. Consumers do not respond to changes in price. As the price changes, sellers continue to supply the same amount of a commodity that they have been buying before the price changed.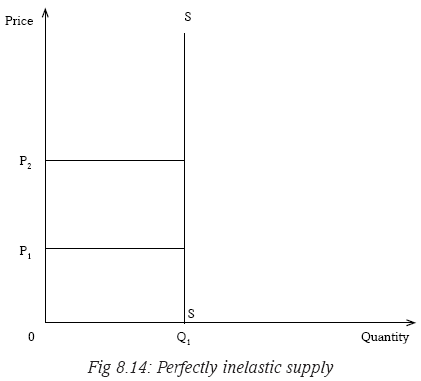
As price increases from OP1 to OP2 (a bigger change), quantity supplied remains constant at OQ1.
8.3.2.2 Inelastic supply
Activity 8.18
Refer to question 1 in Activity 8.16 and analyse your answer. Use it to interpret and categorise the price elasticity of supply of the commodity.When supply is inelastic, then PES>0<1
A change in price results into a proportionately smaller change in quantity supplied. Suppliers do not vigorously respond to changes in price. There is a bigger change in price leading to a smaller change in quantity supplied. As the price changes, sellers continue to supply almost the same amount of a commodity that they have been buying before the price changed.
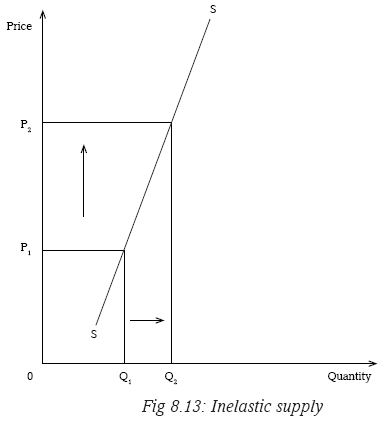
As price increases from OP1 to OP2 (a bigger change), quantity supplied slightly reacts by changing from OQ1 to OQ2 (a smaller change).
8.3.2.3 Unitary elastic supply
Activity 8.19
Refer to question 3 in Activity 8.16 and analyse your answer. Use it to interpret and categorise the price elasticity of supply of the commodity.When supply is unitary elastic, then PES = 1
A change in price results into a proportionately equal change in quantity supply. Suppliers respond to changes in price. A change in price leads to a relatively equal change in quantity supplied.
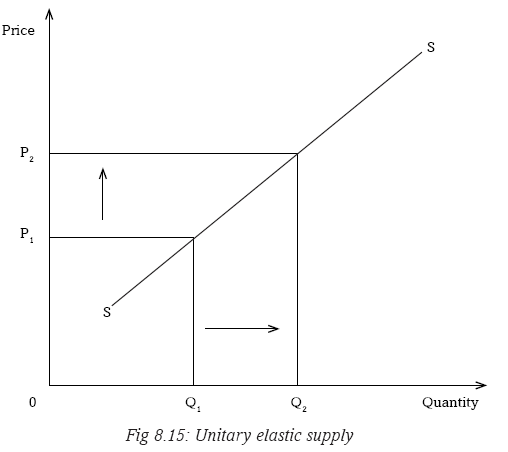
As price increases from OP1 to OP2, quantity supplied responds by changing from OQ1 to OQ2. The change in price is almost equal to the change in quantity supplied.
8.3.2.4 Elastic supply
Activity 8.20
Refer to question 2 in Activity 8.16 and analyse your answer. Use it to interprete and categorise the price elasticity of supply the commodity.When supply is elastic, then PES>1<∞
A change in price results into a proportionately bigger change in the quantity supplied. Suppliers vigorously respond to changes in price. There is a smaller change in price leading to a bigger change in quantity supplied. As the price changes, sellers supply more of the commodity.
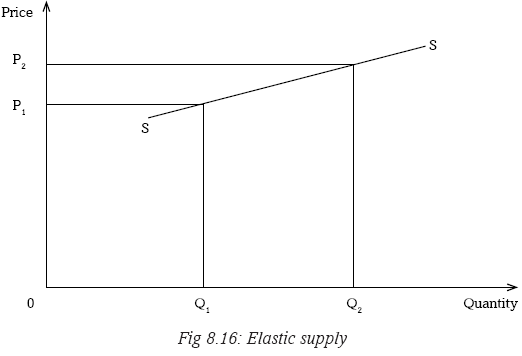
As price increases from OP1 to OP2 (a smaller change), quantity supplied responds by changing from OQ1 to OQ2 (a bigger change).
8.3.2.5 Perfectly elastic supply
Activity 8.21
Refer to question 4 in Activity 8.16 and analyse your answer. Use it to interprete and categorise the price elasticity of supply for the commodity.When supply is perfectly elastic, then PES =∞
There is a constant price. Quantity supplied changes. At a constant price, suppliers vary the amounts of a commodity to be supplied.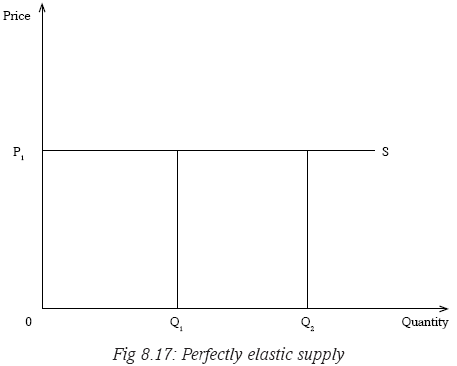
Price remains constant at OP1, but quantity supplied changes from OQ1 to OQ2.
8.3.3 Determinants of price elasticity of supply
Activity 8.22
In groups of five, discuss and identify the factors that may influence the price elasticity of supply of a commodity to be elastic or inelastic.Discovery
The following are the determinants of price elasticity of supply:
1. Cost and availability of factors of production
2. Nature of the commodity
3. Gestation period
4. Time
5. Method of production used
6. Government policy
7. Freedom of entry of new firms into the industry
8. Mobility of factors of productionFacts
1. Cost and availability of factors of production: When factors of production are scarce and expensive, supply cannot be easily increased even if the price of the commodity rises. Thus it becomes inelastic. But when they are readily available and cheap, supply becomes elastic.2. Nature of the commodity: Perishables have inelastic supply such that when prices reduce, almost the same quantity will be supplied. This is because they cannot be stored to be supplied in future when prices are favourable. Durables have elastic supply. As a result, they can be stored and supply varied depending on the price level.
3. Gestation period (maturity period): This is the time lag between when the decision to supply a commodity is taken and when it is actually supplied. Commodities with a short maturity period have elastic supply. Their supply can be increased quickly and easily when prices increase. Those with long gestation periods have inelastic demand.
4. Time: In the short run, supply becomes inelastic because it cannot be increased easily even if prices increase. In the long run, supply becomes elastic since time is enough to allow supply to increase with increase in prices.
5. Method of production used: Advanced methods of production make supply elastic. This is because it is easier and quicker to produce and increase supply. Use of traditional, inefficient and past methods of production slows down the rate of production, making supply inelastic.
6. Government policy: Rigid, bureaucratic tendencies, unattractive policies or high tax rates backslide production, making supply inelastic. Subsidisation of producers reduces costs of production and makes it easy to increase supply and so make it elastic.
7. Freedom of entry of new firms into the industry: Freedom of entry of new firms into the industry makes supply elastic. Restricted entry makes supply inelastic.
8. Mobility of factors of production: Mobility of factors of production both occupational and geographical quickens and simplifies production. This makes supply elastic. Immobility of factors makes supply inelastic
Recall
Consumers and suppliers respond differently to changes in prices. Analyse public response towards billboard adverts about HIV/AIDS.Unit Summary
The following have been covered in this unit:
• Elasticity
• Elasticity of demand
• Elasticity of supply
• Price elasticity of demand
• Income elasticity of demand
• Cross elasticity of demand
• Perfectly elastic demand
• Elastic demand
• Unitary elastic demand
• Inelastic demand
• Perfectly inelastic demand
• Elastic supply
• Inelastic supply
• Perfectly elastic supply
• Perfectly inelastic supply
• Unitary elastic supplyUnit Assessment 8
1. Distinguish between elasticity of demand and elasticity of supply.
2

Using figures from the table:
(i) Calculate the price elasticity of demand for commodity Z.
(ii) What category of price elasticity of demand does commodity Z have?3. The quantity demanded of commodity Y reduced from 70kgs to 65kgs as a result of a 20% increase in the price of another commodity X from 2,000 FRW to 4,000 FRW.
a) Determine the cross elasticity of demand between commodities Y and X
b) State the relationship between commodities Y and X.
c) Give two examples of such commodities.4. The income of the consumer increased by 60% leading to a decrease in the quantity demanded of commodity S from 100 units to 70 units. Find the elasticity of commodity S and its type.
5. Explain the relevancy of price elasticity of demand to government’s taxation policy.
6. How important is the knowledge of price elasticity of demand to the producer.
7. Given that the price of a commodity reduced from 3,000 FRW to 1,500 FRW leading to a decrease in its quantity supplied from 100kgs to 50kgs, determine the elasticity of supply for this commodity and give its category.
8. What is measured by the following?
i) Elasticity of supply.
ii) Cross elasticity of demand.
iii) Price elasticity of demand.
iv) Income elasticity of demand.
v) Elasticity of demand.UNIT 9 CONSUMER THEORY
Key unit competence: By the end of this unit, you should be able to discuss the concept of utility and how it influences consumer’s choice in the allocation of their spending.
9.1 INTRODUCTION
Activity 9.3
With the guidance of your teacher, visit a market near your school. Identify at least eight products sold in that market. Interact with different buyers in this market and inquire from them what they have come to buy and why.
Make a list like the one below in your exercise books.
Fill in the table using the findings from the market.
From your table, identify needs and show how they were satisfied.
Compare your table with that of other students. Find out if there were consumers, retailers or wholesalers in the market.Discovery
A market has several groups or parties. We have those who come to sell commodities or offer services, those who buy, those who offer transport, those who offer security services, government representatives, potential investors, potential buyers and the commodities being exchanged. Hence a market is a diverse place.It should be noted that the most important party however is the buyer. All other parties work towards serving or fulfilling the needs of the buyer. This buyer is also called a customer or a consumer.
Facts
The consumer
Producers create goods and services, which are bought by consumers to satisfy their needs. In the chain of distribution, commodities move in various channels from the producer till they eventually reach the consumer. This can be illustrated as shown below.
A consumer is a buyer who purchases a commodity for his or her own use. The consumer purchases a good or service to satisfy a personal need. The consumer is the last person in the chain of distribution.
9.2. UTILITY
Activity 9.4
In pairs, visit the following website www.wikipedia.org. and carry out research on the following:
(a) Utility
(b) Total utility
(c) Marginal utility
Make short notes and present to the class.Different people have different needs. These needs have to be satisfied. Consumers do not buy commodities for the sake of buying them. They purchase commodities to use them to satisfy their needs. The satisfaction that one derives from the consumption of a good or service is what is called utility.
9.2.1 Total utility
Individual Activity 9.5
Using the knowledge derived from the previous units, use the formula given bellow to fill the table.
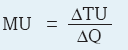
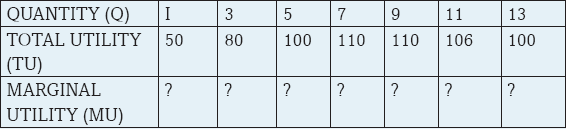
(a) Fill the table.
(b) Use the figures in your table to illustrate the TU and MU curves.
(c) Study your curves and explain the relationship between TU and MU.Discovery
When you consume a certain amount of a commodity, you derive a certain amount of satisfaction. This satisfaction is also called utility. Each unit of a commodity consumed gives you a certain amount of utility. Total utility (TU) is the satisfaction that is derived from the consumption of all units of a commodity. For instance, if one person takes one bottle of a coke and another takes two bottles, the two may not get the same utility. As you take more and more units of a commodity, total utility goes on increasing, reaches a maximum and then starts to reduce.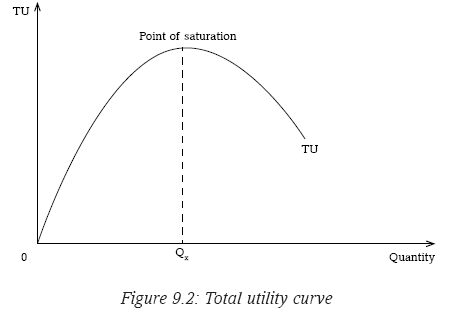
In the above illustration, total utility increases upto point OQx. This point (OQx) is called the point of saturation.
As consumption goes beyond output OQX, total utility starts to reduce. The consumer gains no more utility for consuming a given product. Consumption of the commodity beyond total satisfaction (point of saturation) leads to disutility.
9.2.2 Marginal utility
Marginal utility (MU) is the additional satisfaction or utility that is derived from the consumption of an additional unit of a commodity. When more and more units of a commodity are consumed, the additional utility from each extra unit consumed keeps reducing and even goes into a negative. That is: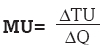
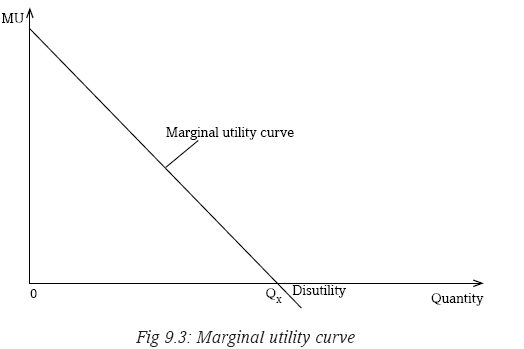
9.2.3 Relationship between TU and MU
Individual Activity 9.6

Referring to the above illustration, state the nature of MU at:
(a) Q1
(b) Q2
(c) Q3The relationship between TU and MU is such that:
• When TU is increasing, MU is decreasing.
• When TU is at the maximum, MU is zero.
• When TU is decreasing, MU is in negative. (Disutility)This relationship can be illustrated as below:
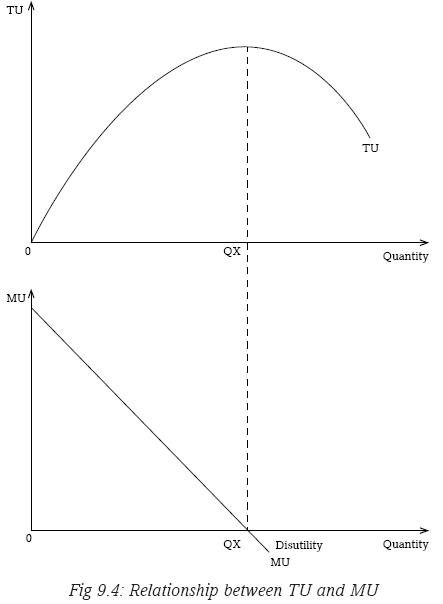
Disutility is the negative or dissatisfaction that is derived from the over consumption of a good or service. For instance, if you consume too much soda to the extent of vomiting you will have gone into dissatisfaction.
9.2.4 The law of diminishing marginal utility
Activity 9.7
On a hot afternoon, you are given five bottles of soda. You are asked to take one bottle after the other until you are satisfied and cannot take any more. Draw a table similar to the one shown below in your exercise books.
Record in your table, the time taken to finish each of the bottles you have taken.
(a) Which bottle took less time to finish and why?
(b) Can you explain the difference in the time spent while taking each
bottle?
(c) Which bottle did you enjoy most?
(d) If you were asked to pay differently for the bottles, which one would
you pay highly?The law of diminishing marginal utility states that as more and more units of a commodity are consumed, the satisfaction from each extra unit goes on reducing. Assuming that the consumer’s taste for the commodity remains constant, and that aims at maximising satisfaction, when more and more units of a commodity are consumed in succession, the marginal utility from each extra unit diminishes. Refer to the table you filled in Activity 9.5 and study the marginal utility figures. As the quantity of the commodity increases,
marginal utility reduces, becomes zero and goes to the negative.This law explains why the demand curve slopes downwards from left to right. When a consumer derives high marginal utility from a unit of a commodity he will be willing to pay a high price for it. As quantity consumed increases and marginal utility reduces, the consumer will be ready to pay a lower price.
9.2.5 Marginal rate of substitution
Activity 9.11
In groups of five, visit the following website, www.khanacademy.org and www.wikipedia.org as well as any other source, conduct a research of the meaning and calculation of marginal rate of substitution.
It should be noted that when consumption of one commodity is increased, then consumption of the other reduces. Satisfaction from one commodity is increased at the expense of the other. Consumption of one commodity is substituted with the other. The amount of one commodity that has to be foregone in order to obtain an extra unit of the other is what is called marginal rate of substitution.
For instance, in Figure 9.10 to increase consumption of commodity Z from Z1 to Z2, one reduces consumption of commodity X from X1 to X2. That is, units X1X2 of commodity X are substituted with units Z1Z2 of commodity Z.

9.3 BUDGET LINE
Activity 9.8
Use the formula below to answer the following questions.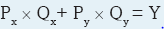 (price of x times its quantity plus price of y times its quantity = income).
Given that the price of commodity X is 1,000 FRW per unit while commodity Y costs 500 FRW per unit. John has a fixed income of 20,000 FRW, which he wants to spend on the two commodities X and Y.(a) Find how many units of each commodity he will purchase if:
(i) He spends 10,000 FRW on each commodity.
(ii) He spends 12,000 FRW on commodity X.
(iii) He spends 15,000 FRW on commodity X.
(iv) He spends all his income on commodity X.
(v) He spends all his income on commodity Y.(b) Illustrate your findings on a curve.
(c) What will happen to the amount of each commodity purchased if John’s income doubled?Illustrate your findings.
(d) Do the same investigation with the doubling of prices at constant income.Facts
Consumers purchase commodities to satisfy their needs. They aim at maximising utility. The quantity that they buy depends on the level of their incomes and the price of the commodities. A budget line is a line that shows various combinations of two commodities that a consumer can purchase using his or her fixed income.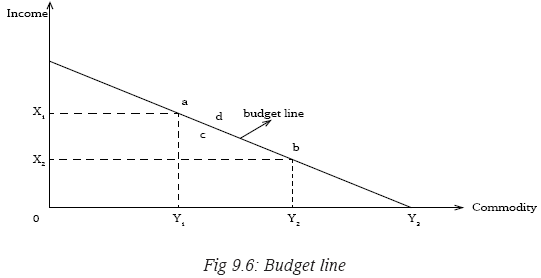
Using the fixed income, the consumer can purchase Y1 units of commodity Y and X1 units of commodity X (combination Y1X1, point a). The consumer can also purchase Y2 units of commodity Y and X2 units of commodity X (combination Y2X2, point b) and all the income is used up.
All combinations that lie along the budget line (such as points a and b) show what can be purchased when the consumer’s income is used up.
Points below the budget line (such as point c) show that some income will not be used. Points outside the budget line such as point d, are unachievable with the same level of income.
For instance, if one’s income is fixed at 10,000 FRW and the price for sugar and rice is 1,000 FRW per kilogram and 2,000 FRW per kilogram respectively, then the consumer can purchase 4kgs of sugar and 3kgs of rice and all the income will be used up. Alternatively, the consumer can buy 10kgs of sugar alone or 5kgs of rice alone with the same level or amount of income. From these figures, the following budget line can be derived.
A change in the consumer’s income at constant prices shifts the position of the budget line. Increase in consumer’s income shifts the budget line to the right while a decrease in consumer’s income shifts the budget line to the left.
A change in the price of the two commodities when the consumer’s income is constant also shifts the position of the budget line. Increase in the price of the two commodities shifts the budget line to the left while a decrease in the price of the two commodities shifts the budget line to the right.Activity 9.9
Referring to Activity 9.8 part (c) and (d), discuss in your groups your findings. Plot on a graph to represent the findings above.
A change in price of one commodity shifts the budget line on one side. This is the same when the increase in income is used on one commodity.
Fig 9.9: A shift in the budget line on one side
A decrease in the price of commodity Y means that with the same income, the consumer can now buy more of commodity of Y and the budget line shifts to the right on the side of commodity Y from Y1 to Y2.
9.4. INDIFFERENCE CURVES
Activity 9.10
In groups of five, carry out research from the internet and library books, on the indifference curve and features of indifference curves. Illustrate your findings on a graph.
Discovery
An indifference curve is a curve that shows various combinations of two commodities that give the consumer equal satisfaction. An example is shown below. The consumption of any combination of the two commodities that lie along the curve gives the same units of utility.
Features of indifference curves
Indifference curves have the following features:
• Indifference curves are convex to the origin.
• Indifference curves are parallel to each other for example two indifference curves cannot meet.
• Indifference curves do not touch the X or Y-axis except when the two commodities X and Zare complete substitutes.
Many indifference curves on the same graph make up an indifference map.
All combinations along the indifference curve give the same satisfaction.At point a, the consumer takes Z1 units of commodity Z and X1 units of commodity X (combination Z1X1).
At point b, the consumer takes Z2 units of commodity Z and X2 units of commodity X (combination Z2X2). In this case, the utility gained at point a is equal to what is gained at point b.
Increase or decrease in satisfaction means that the consumer has increased or decreased consumption of both commodities. This will lead to a shift in the indifference curve. Increase in satisfaction shifts the indifference curve to the right. Decrease in satisfaction shifts the indifference curve to the left.
Drawing many indifference curves on one graph gives an indifference map.
9.5. CONSUMER EQUILIBRIUM
Activity 9.12
In groups of five, conduct a research on:
(a) The meaning of consumer equilibrium.
(b) How to determine consumer equilibrium using both the indifference curve approach and the marginal utility approach.The consumer aims at maximising satisfaction at the lowest possible cost. The consumer has to ensure that he or she uses less of the available income but enjoys maximally. Consumer equilibrium occurs when the consumer gets maximum equal satisfaction from each unit of his or her income spent on consumption. This can be explained by two approaches:
a) The utility approach.
b) The indifference curve approach.a) The utility approach
In this approach, the consumer is in equilibrium when the marginal utility derived from spending a unit of his or her income on a unit of commodity X is equal to the marginal utility got from spending his income on commodity
Where,
• MUX is marginal utility from commodity X.
• MUY is marginal utility from commodity Y.
• Px is price for commodity X.
• Py is price for commodity Y.
• MUn is marginal utility from any other commodity consumed.
• Pn is price of any other commodity consumed.If the above situation is fulfilled, then the consumer is in equilibrium.
b) The indifference curve approach
In this approach, consumer equilibrium occurs at appoint where the indifference curve is tangent to the budget line. Consumer equilibrium is achieved when the budget line meets the indifference curve.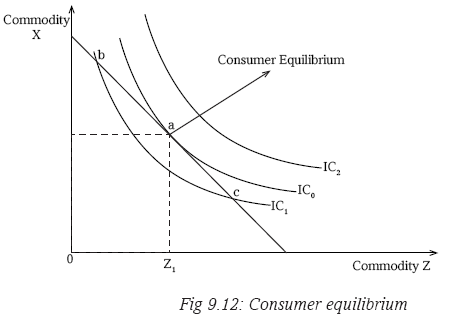
Points a, b, and c lie on the budget line. This implies that the consumer’s income is enough to acquire any combination of the two commodities at any of the points.
Of the three indifference curves:
• Indifference curve IC2 is higher but it lies outside the budget line. This implies that the consumer’s income is not enough to afford any combination along this curve.
• Indifference curve IC1 is lowest and therefore all points that lie on it give the lowest utility i.e. points b and c lie within the consumer’s budget line but give the lowest satisfaction.
• Point a lies along the highest indifference curve that is within the consumer’s budget line and therefore gives maximum satisfaction that is affordable to the consumer.
• At point a where the indifference curve IC0 is tangent to the budget line, is where the consumer is in equilibrium.9.6. CONSUMER SURPLUS
Activity 9.13
When you visit a market place, you find sellers and buyers negotiating about prices.
(a) In relation to your knowledge of utility, discuss why the buyer negotiates for a lower price.
(b) Using the formula given, calculate the consumer surplus.
Consumer’s surplus = Total utility - Total expenditure
(c) Using 100 as market price find the consumer surplus.
Facts
Consumer surplus refers to the difference between the price that the consumer is ready and willing to pay for a commodity and what he actually pays. It is a difference between the total utility that a consumer derives from the consumption of a commodity and the utility that he or she pays for.In the earlier unit, we stated that the price for a unit of a commodity depends on its marginal utility (MU). When marginal utility is high, the consumer is willing to pay a high price for the unit of the commodity.
For instance, if a consumer goes to the market to buy sugar and he is willing to pay 500 FRW for a kilogram, it implies that the consumer knows that he or she will get utility equivalent to the amount paid. If the consumer considers that utility from the commodity bought is less, he or she will not be willing to pay the 500 FRW for it.
Suppose the above consumer reaches the market and finds the price for a unit is 300 FRW and pays it. This implies that the consumer will still enjoy the utility expected at first. So, there will be a surplus of 200, that is, 500-300 =200.
By illustration, the consumer’s surplus is the area below the demand curve and above the equilibrium price.

Fig 9.13: Consumer’s surplus
9.7. PRODUCER SURPLUS
Individual Activity 9.14
Using the given formula, find the Producer’s surplus.
Producer’s surplus = Total income – expected income.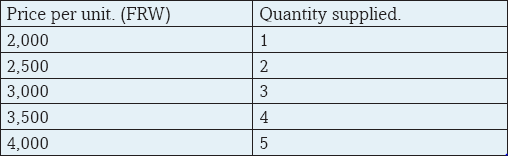
Using 4,000 as the market price, determine the producer’s surplus when 5 units are supplied
Producer surplus refers to the difference between the price that the producer is ready and willing to accept for his or her commodity and what he or she actually receives. The producer usually has a particular price at which he is ready to offer his product for sale.
The producer surplus is illustrated as shown below. It is the area below the equilibrium price and above the supply curve.
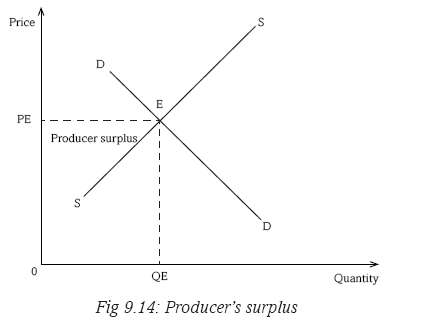
9.7.1 Real income effect
Activity 9.15
Consumer A has 20,000 FRW as her fixed money income. She intends to spend it on sugar. The price of sugar is 1,000 FRW per kilogram.
(a) How many kilograms of sugar will she purchase?
(b) What will happen to the kilograms she can purchase if the price:
(i) Increases to 2,500 FRW per kg.
(ii) Reduces to 500 FRW per kilogram.Real income is the amount of goods and services that a consumer can purchase using a unit of his or her money income. It is the purchasing power of a unit of money income. Real income depends on price level. When price increases and money income remains unchanged, real income reduces. The reverse is also true. (Refer to Activity 9.15 above and consider your answer in part (i)). Then examine the changes that took place in real income when price changed in part (ii).
9.7.2 Substitution effect
Activity 9.16
Commodities that serve the same use are called substitutes.
(a) List the various commodities that are substitutes to each other.
A consumer bought Colgate and Close up. These commodities were retailing and both of them were selling at the same price of 1,500 FRW per unit.
(b) Explain what will happen to the amount of Colgate sold if the price of Close up reduces to 700 FRW but the price of Colgate remains at the same price.
(c) What will happen if Close up increases its price to 2,000 FRW and that of Colgate remains constant?Substitution effect is the response of consumers to the commodity whose price has changed while that of its close substitute remains constant. In Activity 9.16 above, decrease in the price of Close up from 1,500 FRW to 700 FRW per unit makes it cheap compared to Colgate whose price has remained constant at 1,500 FRW. The effect will be that some consumers will shift their demand from Colgate, which is expensive to Close up which has become cheap. If that is the case, quantity demanded of Close up shall increase while that of Colgate shall reduce.
Recall
Consumer equilibrium takes into account the consumer’s income level, price level and utility. Households need to maximise utility from their expenditure. Total consumption expenditure increases with increase in total population. It is important to maintain a manageable expenditure by keeping household populations very low through family planning.In groups of four, suggest methods that the government can use to reduce the rate of population growth rates and make class presentation.
Unit Summary
• Utility: The satisfaction that one derives from the consumption of a good or service.
• Total utility: The satisfaction that is derived from the consumption of all units of a commodity.
• Marginal utility: The additional satisfaction that is derived from the consumption of an additional unit of a commodity.
• The law of diminishing marginal rate of substitution: States that as more and more units of a commodity are consumed, the satisfaction from each extra unit goes on reducing.
• Budget line: Is a line that shows various combinations of two commodities that a consumer can purchase using his or her fixed income.
• Indifference curve: This is a curve that shows various combinations of two commodities that give the consumer equal satisfaction.
• Marginal rate of substitution: The amount of one commodity that has to be foregone in order to obtain an extra unit of the other.
• Consumer equilibrium: This occurs when the consumer gets maximum equal satisfaction from each unit of his income spent on consumption.
• Consumer surplus: The difference between the price that the consumer is ready and willing to pay for a commodity and what he or she actually pays.
• Producer surplus: The difference between the price that the producer is ready and willing to accept for his or her commodity and what he or she actually receives.
• Income effect: The amount of goods and services that a consumer can purchase using a unit of his or her money income.
• Substitution effect: The response of consumers to the commodity whose price has changed while that of its close substitute remains constant.Unit Assessment 9
1. Distinguish between marginal utility and total utility.
2.

(i) Copy the table above in your exercise books. Fill in the blanks (The third column of MU).
(ii) Using the figures from your table above, illustrate the relationship between TU and MU.3. Use the figure below to answer the questions that follow.
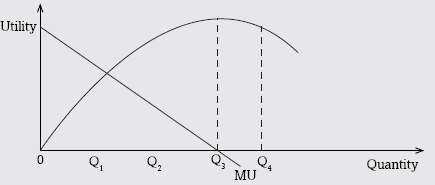
Explain the state of TU:
(i) Between Q1 and Q2.
(ii) At Q3
(iii) Between Q3
and Q44. What do you understand by the term disutility?
5. Distinguish between a budget line and an indifference curve.
6. Given that the price of meat is 2,000 FRW per kg and that of sugar is 2,500 FRW per kg. The income of the consumer is fixed at 50,000 FRW. Derive a budget line for this consumer.
7. Give the main features of an indifference curve.8.
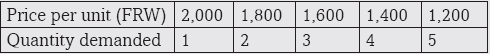
Using 1,600 FRW as the market price, calculate the consumer surplus when 3 units are purchased.
9. Explain the meaning of substitution effect and income effect.
10.

Using 1,000 as the market price, determine the producer surplus.
With the help of illustrations, differentiate between producer surplus and consumer surplus.UNIT 10 PRICE MECHANISM
Key unit competence: By the end of the unit, you should be able to analyse the role of price mechanism in the allocation of resources.
10.1 INTRODUCTION
In Unit 7, we looked at how the forces of demand and supply operate freely to determine equilibrium in the market. This happens when there is no interference from other forces. In this unit we shall continue to analyse how the system works, and its outcomes. We shall also look at the means the government can use to improve the operation of the market forces in allocation of resources.Activity 10.1
Case study
(a) In groups of five, carry out research on the objectives and functions of Rwanda Bureau of Standards (RBS) and Rwanda Utilities Regulatory Authority (RURA).
(b) From your research, discuss what would happen to the goods and services either produced or imported into the country if RBS and RURA were disbanded.
(c) What does RURA and RBS share in common?10.2 PRICE MECHANISM
Activity 10.2
In groups of five, carry out research from the library and internet sources, on the meaning of price mechanism and how it operates.
Note down your findings. Later, make a presentation to the class.Facts
Price mechanism is a system in a free enterprise economy in which resources allocation and prices are determined by forces of demand and supply with little or no government interference. This depends on the forces of demand and supply. It can also be called the price system.Under price mechanism, demand and supply determine resource allocation. There is no government intervention in the production decisions of producers, for instance in form of price legislation. Decisions of producers are influenced by the interests of the consumers. There is private ownership of resources.
Profit maximisation is the main objective of production. Consumers aim at utility maximisation. There are many competing firms in different industries.
Under the price system, the market forces operate freely. When demand increases and exceeds supply, prices increase. When supply increases and exceeds demand, prices reduce automatically.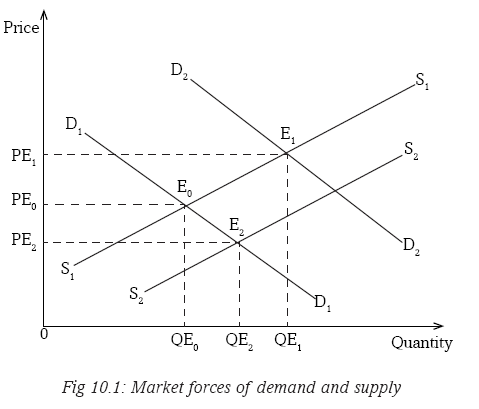
When the forces of demand and supply are left to interact freely in the market, equilibrium is attained in the market where quantity demanded is equals to quantity supplied. In the above diagram, E0 is the equilibrium point. Price OPE0 is the equilibrium price determined by the market forces. Quantity OQE0 is the equilibrium quantity.
Let us assume that demand increases and supply remains constant at S1. This implies that demand is greater than supply. The demand curve will shift from D1 to D2. A new equilibrium point is attained at E1. Equilibrium price increases from OPE0 to OPE1.
When supply increases and demand remains constant at D1, the supply curve shifts from S1 to S2. Supply exceeds demand. A new equilibrium is attained in the market at E2. Equilibrium price reduces from OPE0 to OPE2.
10.2.1 Advantages of price mechanism
Activity 10.3
With reference to Unit 1 on economic system, revisit your notes. Find out the merits and demerits of price mechanism.1. Price mechanism promotes efficient allocation and use of resources. Due to competition and desire to maximise profits, resource owners allocate them more efficiently to avoid wastages.
2. Under price mechanism, producers aim at maximising profits. The desire to maximise profits encourages research, invention and innovation. This leads to an increase in production and improvement in technology, resulting into economic growth.
3. There is competition between producers. Competition leads to efficiency in production. Producers will cut on origination or costs so as to compete favourably in the market.
4. There is speculation under price mechanism. Speculators ensure steady supply of commodities. Consumers are offered a chance to access commodities all the time throughout.
5. Price mechanism encourages acquisition and distribution of commodities from areas where supply is high to areas where there is little or no supply. This also ensures a ready supply of commodities to the consumers.6. Price mechanism answers the following economic questions:
(a) What to produce: Producers produce commodities that fetch high profits.
(b) How to produce: The method of production used should be cost effective.
(c) For whom to produce: Producers manufacture or produce commodities when they are assured of a ready market for the goods.
(d) When to produce: Commodities are normally produced when needed.7. It encourages effective distribution and redistribution of resources. Resources are distributed to areas where they are rewarded favourably depending on their demand and prices. Land is used in areas where rent is high, labour goes to where wages are high and capital where interest is maximum.
8. Price mechanism works automatically. It therefore does not require the government to put in a lot of resources for implementation. This makes it cheap to operate. It is the responsibility of the government and gives it a chance to concentrate on other areas.
10.2.2 Disadvantages of price mechanism
1. Price mechanism promotes income inequality. Resource owners earn more incomes than those without. Those with more earn more and those with less earn less.2. The high cost and inefficient firms are pushed out of business by the most efficient ones. This kind of competition may result into a monopoly in the long run.
3. The desire to maximise profits is high under price mechanism. This profit-oriented motive can make producers to supply us with sub standard or counterfeit products, or exploit consumers who have little information about the market.Standardisation culture
RBS has developed sector standards to avoid associated dangers and also prevent wrong practices in the industry.
Ref.: The Standards Journal, Volume 1, Issue No: 08. April 22 20144. Since there is no government control in price mechanism, there may be introduction of harmful and illegal products to the market.
Standardisation culture
Always purchase products that have been approved by RBS. RBS certified products are good for use by consumers.5. Too much competition may eliminate upcoming and small firms from the market. This may lead to unexploitation of some resources.
6. Unprofitable but essential commodities may disappear from the market. Private producers aim at making profits and not providing satisfaction or essential commodities. Private producers of much more benefits may overrun public benefits. Producers aim at satisfying their individual interests and not public interest.7. Price mechanism is slow and may not bring about enhanced structural changes and growth in the economy. The market forces of demand and supply cannot quickly drive the economy to desired levels of growth.
8. The price system cannot provide public goods some of which are not profit making. For instance street lights may not be provided by the private sector which aims at profit making.
9. Price mechanism may bring about price fluctuations. Change in demand and supply result into price changes in the market. When demand exceeds supply, price increases. When supply exceeds demand, price lowers.
10.2.3 Methods used to reduce problems caused by price mechanism
The disadvantages of price mechanism can be rectified through the following means:
(a) Taxation: Differences in incomes created by price mechanism can be corrected through taxation. In this case, the rich may be taxed more than the poor. As a result, the negative outcomes of price mechanism may be reduced.
(b) Price control: Private producers in most cases cheat consumers by increasing prices. As a result, price control measures are put in place to curb this problem. This is done mainly by the government, through setting the minimum and maximum prices for the commodities. This prohibits producers with monopoly powers from increasing prices unnecessarily so as to maximise profits.
(c) Economic planning: The government carries out short term and long term economic planning. This planning ensures provision of services and utilities that cannot be provided by private entrepreneurs. This also helps to bring about quick structural changes that price mechanism cannot enforce.
(d) Formation of consumer associations: This protects consumers against exploitation by the profit motivated private producers. It increases the negotiating capacity of consumers. Consumer associations also provide market information to consumers.
(e) Government support: The government may subsidise weak firms. This helps the upcoming or weak firms to grow, expand and compete with other firms in the market. Competition improves the quality of products.
(f) Using anti monopoly/Anti Trust laws: Such laws remove the basis of monopoly created through price system. These prevent firms from merging to become monopolies.
(g) Nationalisation: The government may take over private firms as a way of controlling the private sector. This reduces private interest that could overrun the public interest in the price system.
10.3 PRICE FLUCTUATIONS
Activity 10.4
Make a visit to Institute of Statistics of Rwanda, or its website, and gather information on the prices of different agricultural commodities in the last years. In groups of five, discuss the following questions.
(a) Were there frequent changes in the prices of the commodities?
(b) If yes, identify the reasons and solutions for such changes in prices.In the agricultural sector usually during the planting seasons, prices for agricultural products are high. After harvest, prices reduce. This rise and fall in prices of commodities in different periods of time is called Price fluctuation. This scenario is common without government intervention. In periods when supply for agricultural products is high, prices are low. When supply reduces, prices increase. Therefore, the differences between supply and demand in the agricultural sector and failure to regulate supply basically explain the constant price fluctuations. Such fluctuations in the agricultural sector can be elaborated by the cobweb theorem.
10.3.1 Cobweb theorem
Activity 10.5
In groups of five, visit the following website www.econ-pol.unist.it and do a research on cobweb theorem. Make notes and make presentations in class.The cobweb theorem is an economic model used to explain how small economic shocks can become amplified by the behaviour of producers. The amplification is, essentially, the result of information failure, where producers base their current output on the average price they obtain in the market during the previous year.
10.3.1.1 Assumptions of the cobweb theorem
This theorem is based on the following assumptions:1. Planned output is not always equal to actual output.
2. Production depends on factors that are beyond the control of producers.
3. There is a time lag between the time when decisions to produce are taken and the time when products are produced.
4. Demand in the current period depends on the prevailing market prices (Dt = f (Pt).5. Supply in the current period depends on the prices in the previous production season.
(St = f(Pt-1).The assumptions above suit favourably in agricultural production. There are basically three types of cobweb theorem.
1. The convergent/ damped cobweb with a stable equilibrium.
2. The divergent/ explosive cobweb with an unstable equilibrium.
3. The regular equilibrium.1. Convergent/damped cobweb
Convergent cobweb occurs when price fluctuations tend towards the equilibrium. It happens when demand is more elastic than supply. Demand responds more to price changes than supply. Fluctuations in price tend towards the equilibrium.
Price OPE is the equilibrium price and quantity OQE is the equilibrium quantity. Producers expect to produce output OQE and sell at price OPE. There will be neither excess nor shortage in the market.
However, due to unfavorable natural factors, production is affected. Supply reduces to quantity OQ1. As a result of low supply, prices increase to OP1 in the current period.
When planning for the new season, producers base their plans on the current market price OP1 that is high. They plan to produce more. When they produce in the new season, supply increases to OQ2. Because of this high supply, prices reduce to OP2. As a result, quantity produced in the new season is OQ2 and is sold at a low price OP2.
This low price OP2 discourages producers such that they plan to produce less in the coming season. Basing on a low price OP2, they produce low output OQ3. Because of this low output produced, in the following season, prices increase to price OP3. Thus output OQ3 is sold at a high price OP3 in the current period.
This relatively high price encourages producers to produce more in the forthcoming season. Basing on price OP3, producers plan to increase supply. In the next season, they produce a high output OQ4, which then pushes the price downwards to OP4.
This variation of increase and decrease in output and prices according to seasons, produce equilibrium in the long run.
Divergent cobweb occurs when price fluctuations tend to move away from the equilibrium. This happens when supply is more elastic than demand. Supply responds more to price changes than demand. Fluctuations in price tend to move away from the equilibrium.

Price OPE is the equilibrium price. Quantity OQE is the equilibrium quantity. Producers expect to produce output OQE and sell at price OPE. There will be no excess or shortage in the market.
However, due to unfavorable natural factors, production is affected. As a result, supply reduces to quantity OQ1. As a result of low supply, prices shoot to OP1 in the current period.
When planning for the following season, producers base their plans on the current market price OP1 which is high. They plan to produce more. When they produce in the next season, supply increases to OQ2. Because of this high supply, prices reduce to OP2. So quantity produced in this following season is OQ2 and it is sold at a low price OP2.
This low price OP2 discourages producers such that they plan to produce less in the coming season. Basing on a low price OP2, they produce low output OQ3. Due to this low output produced, in this next season prices increase to price OP3. Thus output OQ3 is sold at a high price OP3 in the current period.
This relatively high price encourages producers to produce more in the forthcoming season. Basing on price OP3, producers plan to increase supply. In the next season, they produce a high output, OQ4, which then pushes the price downwards to OP4.This alternating increase and decrease in output and prices according to seasons recurs in the next seasons. Price and quantity keep moving away from the equilibrium.
3 Regular cobweb
Regular cobweb occurs when there is unitary elastic demand. The elasticity demand and supply are equal. Fluctuations in prices are constant between two points.
Price OPE is the equilibrium price. Quantity OQE is the equilibrium quantity. Producers expect to produce output OQE and sell at price OPE. There will be no excess or shortage in the market.
However, due to unfavorable natural factors, production is affected. Supply reduces to quantity OQ1. As a result of low supply, prices shoot to OP1 in the current period.
When planning for the next season, producers base their plans on the current market price OP1 which is high. They plan to produce more. When they produce in the next season, supply increases to OQ2. Because of this high supply, prices reduce to OP2. As a result, quantity produced in this new season is OQ2 and it is sold at a low price OP2.
This low price OP2 discourages producers such that they plan to produce less in the coming season. Basing on a low price OP2, they produce low output OQ1 again. Because of this low output produced, in the next season, prices increase to price OP1. Thus output OQ1 is sold at a high price OP1 in the current period.
This relatively high price encourages producers to produce more in the forthcoming season. Basing on price OP1, producers plan to increase supply. In the following season they produce a high output, OQ2 which then pushes the price downwards to OP2.
This cycles continues in that manner season in, season out. Price and quantity keep on fluctuating between the two points.
10.3.2 Causes of price fluctuations of agricultural products
Activity 10.6
Referring to the research you made in Activity 10.4, in groups of 5, share your findings. As a group, make class presentations on the causes of price fluctuations in the agricultural sector.Price fluctuation is the continuous alternate rise and fall in prices of commodities. This is mostly common in the agricultural sector. Usually during the planting seasons, prices for agricultural products are high. After harvest, prices reduce. Without government interventions, in periods when supply for agricultural products is high, prices are low. When supply reduces, prices increase. Therefore, the differences between supply and demand in the agricultural sector and failure to regulate supply basically explain the constant price fluctuations. These differences can be as a result of:
a) Perishable commodities: Most agricultural products are perishable. They cannot be kept for long. Before harvest, supply is down. At this time, demand is greater than supply. This forces the prices to rise. After harvest, supply is high. It exceeds demand. This forces prices of commodities such as tomatoes, bananas, onions and vegetables to fall, failure to which the goods may rot and fail to be sold.
b) Long gestation periods: There is usually a long time lag between planting season and harvesting period. Immediately after planting, supply remains very low. Because of low supply, prices are high. When harvesting season sets in, supply increases. As supply keeps increasing, prices of agricultural products keep on reducing.
c) Difference between planned output and actual output. Agricultural production mostly in developing economies largely depends on natural conditions or factors. These include the amount of rainfall received, effects of pests and diseases, and changes in weather conditions. These factors affect agricultural output either positively or negatively. As a result, farmers’ expected output may vary from what is actually harvested, depending on how favorable or unfavorable these natural conditions were.
When the natural factors are favourable, agricultural harvest may be higher than what was planned. This may lead to a decrease in the price, as there is more supply. On the other hand, when natural conditions become hostile, agricultural harvest reduces. Consequently, prices will rise due low supply in the market.
d) Agriculture in developing economies is practiced by many, small-scale producers. Most producers use old methods of production. Regulating output to equate it with demand is difficult. This causes fluctuations in prices.
e) Agricultural producers in developing countries produce similar products. They compete for the available market. Thus in case of surplus output, it may not be absorbed by the market which in turn forces selling prices to go down.
f) Absence of effective commodity programs. Most developing economies lack programs that can be used to regulate supply and then stabilise prices.
g) Agricultural products have low market in industrial production. This reduces the market for surplus output in developing countries. Discovery of new technologies in developed countries reduced the demand for agricultural products. Thus excess agricultural output cannot be easily disposed off. This forces prices down.
h) Agricultural products have inelastic demand. This is because most of them are food stuffs. For instance, even if the price for food reduces, the amount of food eaten by an individual almost remains constant. When there is excess supply, disposing it off becomes difficult and this price is forces the price down. On the other hand, food is a necessity, irrespective of the price, people have to consume food. Thus a reduction in supply forces the price to go up.
i) Regulating supply of agricultural products through arbitrage is difficult. This is because agricultural products are bulky. Transporting them from areas of excess supply to areas of scarcity is costly. In most developing countries, infrastructures connecting production areas to areas of scarcity are poor. Therefore, marketing surplus output becomes expensive.
10.3.3 Effects of price fluctuations
Activity 10.7
In your groups formed in Activity 10.5, and basing on the findings you got from the market, discuss the effects of price fluctuation. Share your points with the rest of the class.Price fluctuations in the agricultural sector lead to fluctuations in farmer’s incomes. This affects their activities in the long run. The effects include:
1. Planning becomes difficult. This is because of fluctuation in farmer’s incomes and government revenue. Implementation of government plans is affected.
2. Agricultural production is a source of revenue to the government. This is especially so in developing economies like RwandaMoney matters!!!
Agriculture is the backbone of our country. As a result, it forms the biggest percentage of economic activity.3. Agricultural production is discouraged. Some producers are discouraged and may abandon agricultural production in favour of other sectors. This will result into fluctuations in employment in agricultural sector.
4. Modernisation of agriculture becomes difficult. This is because it becomes difficult to rely on agricultural revenue to improve agriculture.
5. Price fluctuation may result into fluctuation in foreign exchange earnings from agricultural exports. This may lead to Balance of Payment (BOP) deficits when prices of exports reduce.10.3.4 How to control price fluctuations
Activity 10.8
With the help of your teacher, listen to the guest speaker (District Agricultural Officer or any other agricultural officer). In a discussion with him or her, identify the policies the government can use or has put in place to address the problem of price fluctuation in the agricultural sector in the country. Take notes and discuss as a class.The following can be done to reduce price fluctuations in agricultural sector:
1. Price fixation: This can be done by the government through maximum and minimum price legislation.2. Improving storage systems: Stable prices in the agricultural sector can be ensured by improving storage systems. This will help to regulate supply by storing the excess output during periods of bumper harvests. The excess will be used to stabilise prices in periods of scarcity.
3. Improve transport systems: This facilitates the movement of commodities from areas of plenty to areas of scarcity, quickly and cheaply. This also helps to regulate supply.
4. Diversification of the agricultural sector: This creates a variety of commodities supplied to the market. It also reduces competition among sellers especially in foreign markets.
5. Improvement in technology: Technology reduces dependence on natural conditions. This increases the quality of output which makes it competitive.
6. Processing agricultural products: This adds value to agricultural products and makes them competitive.
7. International commodity agreements: These agreements can be used to stabilise prices on the international market. These help to stabilise prices of agricultural products by regulating production in the member countries.
8. Stabalisation of process: Prices can be stabilised through establishment of farmers associations to regulate supply. These associations may help to fix quotas and regulate supply. Farmers would produce according to the fixed quotas.
10.3.5 Buffer stock system
Activity 10.9
In groups of four students each, carry out research from your library and internet on meaning and operation of buffer stock and stabilisation fund. Using your findings and illustrations, make class presentations on the same.Buffer stock is a system where the government buys excess output from producers, stores it and supplies it to the market in periods of shortage. It is used to stabilise producers’ incomes and prices.
The buffer stock system operates on the assumption that:
1. Farmers planed output is not always equal to actual output.
2. Agricultural production depends on natural factors that are beyond the control of farmers.3. There is a time lag between the time when decisions to produce are taken and the time when products are produced.
4. All prices determined along the demand curve D (PED=1) give the same total revenue.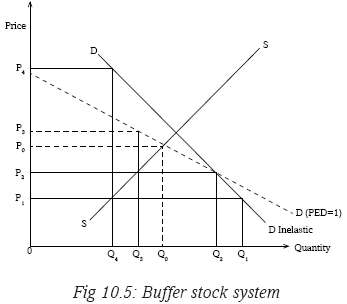
Farmers expect to produce output OQ0 and sell it at price OP0 that is determined by the market forces. So the expected total revenue (TR) is OP0 × OQ0.
Due to favourable natural conditions, farmers’ actual output increases to OQ1. As a result of excess harvest, prices reduce to price OP1.
However, government wants to stabilise farmers’ incomes and prices.It comes in through marketing boards, buys the excess output. This intervention by the government leads to increase in price to OP2 which is determined along demand curve PED=1.
Farmers sell output OQ1 at price OP2 and their total revenue (TR) is OP2× OQ1 which is equal to the expected revenue OP0 × OQ0. Thus farmers’ incomes are stabilised irrespective of the bumper harvest.The output that was bought by government is Q2. It is then stored in government designated warehouses to be used during periods of shortage.
In the following season, the natural conditions become unfavourable.Farmers’ harvest reduces to output OQ4. Because of low harvest, there is shortage which pushes the prices up to price OP4. Government comes in to stabilise prices and farmers incomes. It draws from its warehouses the excess output bought in the previous season and supplies it to the market.
This increases market supply to OQ3. As a result price reduce to OP3 which is determined along the demand curve D (PED=1).
Farmers sell output OQ4 at price OP3 and get total revenue (TR) = OP3× OQ4 which is equal to expected revenue OP0 × OQ0
It is noted that prices determine along the demand curve D (PED=1) give the same total revenue.
i.e. OP2× OQ1 = OP0 × OQ0.
OP3× OQ4 = OP0 × OQ0.Therefore, whether there is excess production or shortage, farmers get the same income equivalent OP0 × OQ0 that they expected.
Advantages of Buffer Stock
• The buffer stock system helps to stabilise producer’s incomes. Irrespective of seasonal changes, producer’s incomes remain almost constant.
• The consumer is assured of a steady supply. When producers output is low, the government draws from its stores to supplement what the producers have put to market. This increases market supply and offers a chance to consumers to get what they require.
• Because of a steady income from production, producers are encouraged to keep producing. This is helpful to the economy.Problems faced by the buffer stock system
• Perishability of agricultural commodities. Most commodities are highly perishable. This makes storage difficult.
• Effects of inflation which affect the stabilisation funds as the money kept in the funds lose value.• Most developing countries lack efficient storage facilities to keep the surplus output.
• Lack of sufficient funds by marketing boards to run the activities of buying and handling the surplus output. The activities of buffer stock system involve high administrative costs to run.
• Mismanagement and corruption in marketing boards by board members and staff. This affects the proper functioning of buffer stocks.
• The buffer stock system increases government responsibilities. The government directly involves itself in actual buying and selling of commodities. This may have an effect on efficiency in other strategic areas like security.
• The system requires alt of market research. Decisions on how much, when to buy and /or sell require much of research. This makes it costly.10.3.6 Stabilisation fund
A stabilisation fund is a mechanism set up by a government or central bank to insulate the domestic economy from large influxes of revenue, as from commodities such as oil.
Stabilisation fund system also works on the same assumption as buffer stock system. i.e.1. Farmers planned output is not always equal to actual output.
2. Agricultural production depends on natural factors that are beyond the control of farmers.
3. There is a time lag between the time when decisions to produce are taken and the time when products are produced.
4. All prices determined along the demand curve D (PED=1) give the same total revenue.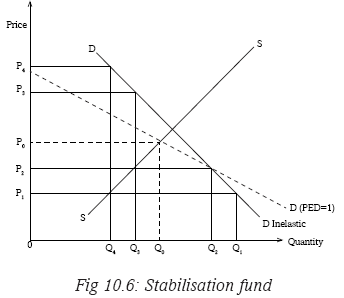
Farmers expect to produce output OQ0 and sell it at price OP0 that is determined by the market forces. So the expected total revenue (TR) is OP0 × OQ0.
Due to favourable natural conditions, farmers’ actual output increases to OQ1. As a result of high harvest, prices decreases to price OP1.
However, government wants to stabilise farmers’ incomes and prices. It comes in through marketing boards, fixes a price that is determined along demand curve PED=1 and buys the output at price OP2.Farmers sell output OQ1 at price OP1 and their total revenue (TR) is OP1× OQ1 which is equal to the expected revenue OP0 × OQ0. Thus farmers’ incomes are stabilised irrespective of the low harvest.
The output that was bought by government is Q1 and it is sold to markets at a market price OP1.
In the next season, the natural conditions become unfavourable. Farmers’ harvest decreases to output OQ4. Because of this low harvest, there is a deficit which pushes the prices up to price OP4.
Government comes in to stabilise prices and farmers incomes. It fixes price OP3 which is determined along the demand curve D (PED=1). It uses the profits made in the previous season to buy output from farmers.
Farmers sell output OQ2 at price OP3 and get total revenue (TR) is OP3× OQ4 which is equal to expected revenue OP0 × OQ0.
It is noted that prices determined along the demand curve D (PED=1) give the same total revenue.
i.e.
OP2× OQ1 = OP0 × OQ0.
OP3× OQ4 = OP0 × OQ0Therefore, whether there is excess production or shortages, farmers get the same income equivalent OP0 × OQ0 that they expected.
10.4 PRICE CONTROL
Activity 10.10
From the case study on Rwanda Utilities Regulatory Authority (RURA) you carried out at the beginning of this unit, arrange your class into two groups of proposers and opposers and hold a debate on the motion on page 208.
“Price regulation by Rwanda Utilities Regulatory Authority (RURA) is better than the Price system.”Price control refers to the methods that can be used to interfere with the forces of demand and supply in determining prices. Price mechanism is not allowed to influence prices in the market. It can also be called price administration.
• Maximum price legislation (price ceiling).
• Minimum price legislation (price floor).
• Resale price maintenance.
• Rent control.
• Rationing.
• Use of international commodity agreements.Activity 10.11
In your groups, using internet and economics materials in the school library, discuss the different forms of price control and examine the merits and demerits of each.10.4.1 Maximum price legislation (price ceiling)
This is the highest price fixed by the government below the equilibrium point above which it is illegal to buy or sell the commodity. Sellers and buyers are required by law not to buy or sell above the fixed price.As it is fixed below the equilibrium, consumers are willing and ready to buy more commodities since the prices are affordable. On the other hand however, sellers are discouraged by the low price. Quantity supplied reduces.
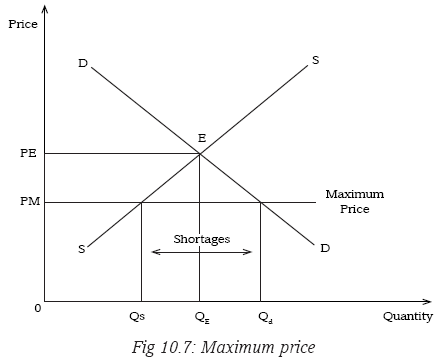
OPE is the equilibrium price and OQE is the equilibrium quantity. The equilibrium point is at E. The government fixes the maximum price below the equilibrium point at OPM.
When the maximum price is fixed, quantity supplied reduces from the equilibrium quantity determined by the market forces OQE to OQs. OQs is the quantity supplied at the maximum price.
When the maximum price is fixed, quantity demanded increases from the equilibrium quantity determined by the market forces OQE to OQd. OQd is the quantity demanded at the maximum price.
The difference between quantities demanded OQd and quantity supplied OQs shows the shortage of commodities that is created by the maximum price.
The government fixes the maximum price to:
• To protect consumers from being cheated by the profit oriented sellers who exorbitantly increase the prices.
• To maintain stability of prices and avoid fluctuations.
• To control monopoly tendencies of increasing prices.
• To encourage consumption of particular commodities.• To improve on the welfare of the population by keeping prices low.
• To control inflation.Did you know !!!
There is only one boss in the business. The customer. And he can fire everybody in the company from the chairperson on down, simply by spending his money somewhere else.10.4.2 Minimum price legislation (Price floor)
This is the lowest price fixed by the government above the equilibrium point below which it is illegal to buy or sell commodities. For instance a minimum wage for workers or minimum price set by the government for agricultural products to protect farmers from being cheated by the profit oriented traders/middlemen.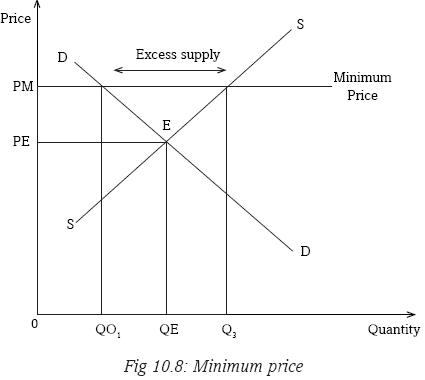
OPE is the equilibrium price and OQE is the equilibrium quantity. The equilibrium point is at E. The government fixes the minimum price above the equilibrium at OPM.
When the minimum price is fixed, quantity supplied increases from the equilibrium quantity determined by the market forces OQE to OQs. OQs is the quantity supplied at the minimum price.
When the minimum price is fixed, quantity demanded reduces from the equilibrium quantity determined by the market forces OQE to OQd. OQd is the quantity demanded at the minimum price.
difference between quantity demanded OQd and quantity supplied OQs shows the excess supply that is created by the minimum price.
The government fixes the minimum price to:
• To protect producers and workers in case of a minimum wage from being cheated by the profit motivated buyers and employers respectively.
• To increase producers earnings as a way of encouraging production.
• To stabilise prices by limiting price fluctuations.10.4.3 Resale price maintenance
This is where the producer fixes the price of his products up to the retail level i.e. retailers sale at a constant price fixed by the producer. For instance:
• Prices of Newspapers.
• Prices of Airtime cards.
• Prices of Text books etc.10.4.4 Rent control
This is where the government intervenes to fix prices of housing facilities especially in urban areas where their demand is always high as a way of protecting consumers (tenants).10.4.5 Rationing
This is where the government takes control of the supply channel of a scarce commodity and distributes it to consumers equally at a constant price. It is aimed at ensuring supply of the scarce commodity to all consumers.10.4.6 Positive effects of price controls
Activity 10.12
With reference to the debate you made in Activity 10.10, while you are in still the same groups, discuss the benefits and demerits of price control.• Resale price maintenance stabilises producer’s incomes i.e. whether demand is greater or less than supply, producer prices and incomes remain the same.
• Maximum price controls monopoly power. Monopolists usually cheat buyers by charging high prices. Thus maximum price legislation will control price increases by monopolists.
• Price controls maintain price stability. Prices are kept constant and this favours consumers. It keeps the real value of their incomes stable.
• Price control protects consumers from being exploited by profit motivated producers. In periods of scarcity, consumers are protected from high prices.
• Minimum wage increases purchasing power of workers. This improves their general standard of living, aggregate demand and production in general.
• The minimum wage protects workers from exploitation by employers by paying them low wages. Producers usually aim at increasing their profits by reducing total costs.
• Price control protects producers from being under paid by profit motivated middlemen. Traders buy from producers like rural farmers at very low prices.
• Minimum wage maintains industrial peace. It avoids the occurrence of strikes by trade unions when demanding wage increments.
10.4.7 Negative effects of price controls
• Maximum prices lead to black markets. Commodities are sold to willing buyers at higher prices behind counters. This is because of shortages in the markets.• Minimum wage legislation may increases the supply of labour by reducing voluntary unemployment and so creates unemployment.
• Maximum prices increase demand creating shortages. When the price is fixed below the equilibrium, supply is discouraged but quantity demanded widens.
• Minimum prices like minimum wages increase the cost of production. This reduces the volume of production. Production becomes expensive through a high wage bill.• Rent control reduces the supply of housing facilities. It discourages landlords from expanding housing facilities.
• A minimum price creates storage problems of the surplus output produced. Supply increases with a minimum price but quantity demanded reduces.
10.5 INTERNATIONAL COMMODITY AGREEMENTS
Activity 10.13
As an individual, visit the school library or use internet. Make findings on the meaning and role of international commodity agreements. Take notes and share with the rest of the class.These are associations of producer and/or consumer countries of certain commodities formed for purposes of regulating supply and stabilising their prices. They are arrangements by member countries to stabilise trade, supplies, and prices of a commodity for the benefit of all member countries. These agreements usually involve a consensus on the amount of a commodity to be traded, price, and management of stock.
Examples include the International Coffee Agreement (ICA) that established the International Coffee Organisation (ICO), the International Tropical Timber Agreement (ITTA) from which the International Tropical Timber Organisation (ITTO) was established.
Remember: The basic objective of International Commodity Agreements is to stimulate a dynamic and steady growth & ensure reasonable predictability in the real export earnings of the developing countries.
10.5.1 Role played by international commodity agreements
• Commodity agreements are essential in stabilising the international economy and strengthening the Balance of Payment (BOP) status in producer countries.• International prices for especially primary products are usually low. They usually fluctuate frequently. Commodity agreements thus help to reduce price fluctuations of commodities on the international market.
• They increase the bargaining capacity of their members. Producer countries work as a group in marketing their products and negotiating for prices of their products.
• They increase the prices of their products. By working as one group, member countries may negotiate for better prices than if each country was to go it alone.
• They raise and stabilise export earnings of member countries. This comes after negotiating for better prices on international markets.
• International commodity agreements avoid competition among member countries producing a homogeneous commodity. Countries producing a homogeneous product usually compete for the market which puts them on a disadvantage.
• They employ the quota system to regulate supply as a way of stabilising prices. This avoids excesses and shortages in production.
• Commodity agreements help to stabilise prices of importing countries. Importing countries also benefit as they are assure of stable prices.
10.5.2 Factors that limit the success of international commodity agreements
• Different countries have different economic interests and difficulties. Conflicting interests of members especially producers against consumers limit the successful functioning of commodity agreements.
Sometimes member countries agree on a fixed quota that each member should produce. Some countries however produce beyond the fixed quotas.
• Countries do not produce proportionately equal amounts. Members that produce large amounts dominate others. The agreements tend to favour large producers than small ones.
• Different countries are endowed differently with resources. This brings about differences in costs of production which may bring about disagreements on prices.
• If members contribute a small share of the world output, they cannot influence the price on the world market. This comes when some producers of a particular commodity are not members.
• The functioning of these agreements requires independent organs to effectively operationalise them. There is lack of effective supervision to implement the established quotas. Some countries may violet the established quotas.
Activity 10.14
As an individual, visit the website of Retroreflective Equipment Manufacturers Association (REMA) and study its objectives and activities.
Discuss how the activities of REMA are related to what you studied in this unit.Unit Summary
Price mechanism: Is a system where resource allocation and utilisation is determined by prices depending on the forces of demand and supply.
Price controls: Refers to the methods that can be used to interfere with the forces of demand and supply in determining prices.
Maximum price legislation: This is the price fixed by the government below the equilibrium above which it is illegal to buy or sell the commodity.
Minimum price legislation: This is the lowest price fixed by the government above the equilibrium below which it is illegal to buy or sell commodities.
Rent control: This is where the government intervenes to fix prices of housing facilities especially in urban areas.
Resale price maintenance: This is where the producer fixes the price of his products up to the retail level.
Rationing: This is where the government takes control of the supply channel of a scarce commodity and sells it equally to the citizens.
Price fluctuation: This is the continuous alternate rise and fall in prices of commodities.Buffer stock: This is a system where the government buys excess output from producers, stores it and supplies it to the market in periods of shortages.
Stabilisation fund: This is a mechanism set up by a government or central bank to insulate the domestic economy from large influxes of revenue.
International commodity agreements: These are associations of producer and/or consumer countries of certain commodities formed for purposes of regulating supply and stabilising their prices.Unit Assessment 10
1. What do you understand by the term price mechanism?
2. Explain the dangers associated with price mechanism.
3. Explain the merits of the price mechanism.
4. Explain the factors that limit the success of international commodity agreements.
5. Explain the factors that limit the success of buffer stock systems in Lesser-Developed Countries (LDCs).UNIT 11 INTRODUCTION TO THE THEORY OF PRODUCTION
Key unit competence: By the end of the unit, you should be able to assess the role of factors of production in the economy.
Activity 11.1
With the guidance of your teacher, visit a market near your school. Identify at least any five products sold in that market. In groups of five, discuss how those products were made. Make presentations in class.11.1: MEANING AND PURPOSE OF PRODUCTION
Activity 11.2
In groups of five, discuss and answer the following questions.
(a) Why is Inyange Industries famous in Rwanda?
(b) List the products from Inyange Industries.
(c) Discuss why Inyange Industries was formed.
(d) Basing on the above presentations, explain the meaning of production and the purpose of production.Discovery
Inyange Industries is very famous in Rwanda and even beyond because of its unique products. Some of these products produced by Inyange Industries are Inyange Water, Inyange Juice, Inyange Yorghut and Inyange Milk.This industry specialises in production of liquid products. This therefore tells us that there was need or a gap in the market for the above products. As a result therefore, the founders of the industry met and agreed on starting up this industry to supply or provide the required products.
Recall
1. Identify other firms or industries in Rwanda.
2. List the products or services offered by each industry identified above.Facts
Production is the process through which resources are converted into intermediate or final goods. Intermediate goods are goods, which can be used to produce other goods and services. Final goods are goods ready for consumption. The main purpose of production is to satisfy the needs and wants of an individual. This is done through provision of goods and services.Purpose of production
The purpose of production is consumption. With a market system firms specialise in producing particular types of capital goods and consumer good. Their direct motivation for producing these goods is to sell them for a profit.11.2: LEVELS OF PRODUCTION
Activity 11.3
With the guidance of your teacher, visit a factory near your school and observe the stages that the product undergoes till its completion. Write down your findings.
From your observation from the field study, in groups of five, identify and explain the levels of production.
Make presentations in the class.Discovery
Every product we see in the market undergoes several processes. In a sugar factory for instance, there is need for the raw material (sugarcane) to be harvested first, and then transported to the factory, before commencing the production process. The same process applies to all other products.Facts
In all these products, production takes the following three main levels:11.2.1 Primary level of production
This is the first stage or level of production. It is also called the extractive stage because it involves extraction of raw materials. All activities at this level are concerned with the provision of raw materials. This level involves extraction of raw materials from land or their natural location and form. Goods produced at this level are called primary goods. Activities such as farming, mining, fishing, quarry working and lumbering fall in this category. This level entails use of both human and capital labour and capital to produce the primary goods and services.
Fig 11.1: A farmer harvesting maize, farming is an example of primary level of production
11.2.2 Secondary level of production
This is the second stage or level of production. It involves the use of primary goods (or raw materials) obtained from primary production to make other goods. The primary goods or raw materials are transformed or converted into finished or semi finished goods. The process of converting raw materials into other goods is called manufacturing. Thus secondary industries are also known as manufacturing industries or processing industries. Goods produced at this level are called manufactured or processed goods.Examples include:
(a) Conversion of cotton or wool into cloth.
(b) Conversion of sugarcane into sugar.
(c) Conversion of trees (wood) into paper.
(d) Refining petroleum or crude oil into petrol, paraffin and diesel.
(e) Processing milk to obtain butter, ghee and yoghurt.
(f) Processing fruits to obtain fruit juices and canned fruits.
Fig 11.2: Sugarcane after processing becomes sugar
11.2.3 Tertiary level of production
This is the third and final stage or level of production. The main focus at this level is the production and provision of services. These services can be categorised into commercial and direct services.(a) Commercial services are activities related to trade and the services that support trade. Trade involves distribution and sale of goods. Examples of commercial services that support trade include banking, transport, insurance, mail services and communication.

Fig 11.3: A banking hall; banking is an example of a commercial service
(b) Direct services are services provided or offered by professionals. Examples include medical services, teaching, legal services, entertainment, security services and hair dressing.

Fig 11.4: A barber serving a client; an example of a direct service
11.3 TYPES OF PRODUCTION
Activity 11.1
Case study: FarmingKayonza village has two farmers. The first farmer grows several food crops and rears cattle, pigs, goats and sheep, on a large piece of land. This farmer does not treat his animals regularly, neither does he weed nor apply fertiliser to his crops.
The second farmer only rears dairy breeds of cattle on a very small piece of land. She put up enough facilities and sheds for her cattle. She has a borehole to draw water from. She regularly treats her cattle and supplies her cattle with different types of feeds, as instructed by the veterinary officers. She practices zero grazing.
Upon harvesting, the first farmer only manages to harvest what is enough for his home consumption together with his family. Very little is left in excess. This farmer also incurs great losses because at times some of his animals die due to poor nutrition and lack of medication. The crops too do not yield in plenty as expected.
On the other hand, the second farmer has really developed. From the sale of the milk obtained from her cattle, she has managed to put up a bungalow, bought a car and a 5 acre piece of land. She has also increased her cattle from ten, to more than a hundred.
From the above case study, discuss, in groups of five, the differences between the two farmers. Which of the farmers would you like to be if given a chance? Explain.
Discovery
In the above case study, we can see clearly that the first farmer practices mixed farming while the second farmer does not. We can also see that the second farmer with the guidance of veterinary officers practises modern methods of farming, as compared to the first one. This therefore means that the farmer who uses the modern methods of farming yields more than the farmer using the traditional farming methods.Facts
There are two main types of production. These are:
1. Direct production.
2. Indirect production.11.3.1 Direct production
This is the production of goods and services for one’s own consumption. It is also known as subsistence production. It entails production wholly or mainly for home consumption. However, if there is an extra production, the farmer or producer can sell in the market. In the above case study for instance, the first farmer was practising this type of production.11.3.1.1 Characteristics of direct production
1. All activities in production are carried out by oneself or with the help of family members, friends or relatives.
2. Quality of goods produced may be poor if the person is unskilled.
3. Since the goods are produced when needed, the skills used may not be improved.
4. Tools used are simple.
5. Rate of production is low, since there is no competition.
6. The quality of goods produced may be poor, leading to poor standards of living.
7. Trade is not encouraged since production is for home consumption.11.3.2.1 Indirect production
This is the production of goods and services mainly for sale in the market. It is also known as commercial production. In the above case study, the second farmer was practising indirect production. This is because all her output (milk) was being sold to the market.Characteristics of indirect production
1. It encourages specialisation.
2. It aims at producing in plenty (surplus).
3. It entails production for sale in the market or to customers.
4. It enhances skill development as a person gains more knowledge when doing the same activity over and over again.
5. The rate and speed of production is faster than in direct production.6. It creates employment opportunities.
7. Production is normally on large scale.Recall
What are some of the advantages and disadvantages of indirect production?11.4 FACTORS OF PRODUCTION
Activity 11.5
Case studyIn a school, there are several commodities that ought to be supplied. Assume as students, you would like to start supplying school uniforms.
(a) What are some of the things you will consider before starting the business of supplying uniforms?
(b) Do you think the business can grow? Explain your answer.
(c) Identify the requirements that you will need to have before starting the business.Discovery
In the above case study, we can say that a school has students of various sizes and categories. We have short, medium and tall students. The students can also be male students or female students. Similarly, we have slim and fat students. From these comparisons, we can then move on prepare the uniforms basing on each student, if given an order. We can start off by measuring the sizes of every student, so as to avoid oversize or undersize clothes.
The business can grow only if some of the necessities are provided. Some of these include availability of capital, labour and a place to be carrying out the functions.Facts
Factors of production refer to all productive inputs used in the production of goods and services and the major ones are capital, labour, land and entrepreneurship.
The following are the main factors of production.1. Land
2. Labour
3. Capital
4. Entrepreneurship11.4.1: Land as a factor of production
Activity 11.6
In groups of five, discuss the following questions:
(a) What is land?
(b) Why is land considered a factor of production?Facts
Land refers to all the free gifts of nature, which are found on earth, beneath or above. It includes soil, forests, mountains, oceans, rivers, minerals and air. The reward to land for its contribution in the production process is rent or rates.11.4.1.1 Characteristics of land
1. Land has fixed supply: The size of land does not undergo any change. Land cannot be increased nor decreased.
2. Land is a free gift of nature: Land existed long before human beings came in existence. Land is not as a result of human effort.
3. Land is permanent: Unlike other factors of production, which are perishable, land cannot be destroyed. It is non-perishable.
4. Land is a primary factor of production: Any production process starts with land.
5. Land is immobile: Land is geographically and occupationally immobile. Land cannot move from one place to another.
6. Land has inelastic supply: The supply of land cannot be adjusted according to its demand.
7. Land is differentiated: Land differs in productivity. Some pieces of land are more productive than others. As a result, lands different prices.Remember!! Land as a natural resource is a primary factor that is necessary for production to take place. That is why it should be conserved and protected using all possible measures such as mulching, afforestation and reforestation and intercropping, to avoid soil erosion, deforestation and land depletion.
The reward for land is rent and depending rates.
Types of rent include:
(a) Quasi rent: This is the payment to a factor of production that has inelastic supply in the short run and elastic supply in the long run.(b) Commercial rent: This refers to the payment for hiring and the use of durable assets like a house.
(c) Scarcity rent: This refers to the payment to land due to an increase in its demand.
(d) Site rent: This refers to the payment to a factor of production according to its location.
(e) Economic rent: This is payment to a factor of production that is over and above its supply price (transfer earning).
(f) Transfer earnings: This is the minimum payment to a factor of production necessary to maintain its present form of employment.11.4.1.2 Determinants of rent
• Size of rental property: The size of the rental property determines the rent to be paid. If the rental property is big then rent will be high and if it is small then rent will be low.• Location: Rental properties that are located in areas that strategically located in areas that have access to roads, communication network and other social economic infrastructures, will attract high rent than those located in remote areas that have no access to such infrastructures.
• Amenities: properties that have more facilities will attract high rent than those that have less facilities
• Demand and supply: When the demand for rental property is high, rent will also be high but if demand is low as compared to supply, rent will be low.
• Ability: The ability of the customers will also determine the rent to be charged. When their ability to pay is high, high interest will be charged but if their ability is low, low rent will be charged.
• Competitors: The degree of competition influences the rent to be charged. If competition is high, rent will be low but if competition is low, rent will be high.
• Prevailing market conditions: The existing economic conditions such as level of inflation, government policies, taxes and subsidies among others determine the rent to be charged. If these conditions are favourable, rent will be low and if they are unfavourable rent will be high.
Example:
Given that the transfer earning of a factor of production is 500,000 FRW and the economic rent is as twice as its transfer earning, calculate the factor’s actual earning.Actual earning = Economic rent + transfer payment
= 2(500,000) + 500,000
= 1,000,000 + 500,000= 1,500,000 FRW11.4.2: Capital as a factor of production
Activity 11.7
One of the inputs required in the production process is money and non-money resources like equipment, buildings, furniture, machines, motor vehicles and human resources. All these constitute capital.
In groups of five, identify the types of capital (basing on the above examples). Discuss the role capital plays in the production process. Make presentations to the class.Facts
Capital refers to all manmade resources used in the production process of goods and services. Capital can be categorised as follows:
(a) Fixed capital
(b) Liquid capital
(c) Human capital(a) Fixed capital
This refers to the stock of all real assets in a business. This capital is fixed in nature. It contributes to the production of goods and provision of services indirectly. Fixed capital is the capital used by the company for a longer period of time. It is not intended for resale. Examples of fixed include buildings, equipment, vehicles, furniture and fittings. Fixed capital is also called fixed assets.(b) Liquid capital
This refers to the capital of a business, which is in monetary form or near liquid assets, like government securities. Liquid capital can easily be turned into cash.(c) Human capital
This is the productive qualities found in human beings that are used in the production of goods and services. These productive qualities are acquired through education and training. Human capital therefore constitutes the skills acquired through education and training by human beings, which they use in the production of goods and services.The reward for capital is interest, whose rate depends on the demand and supply of capital.
Remember !!! In order to get capital to start a business, it is important to think about saving part of our earnings and making proper use of our financial resources.
11.4.2.1 Determinants of interest
• Inflation: When there is inflation in the country interest rate will be high but when there is a deflation interest rate will be low.
• The degree of risk: When the degree of risk is high Interest will also be high but if the degree of risk is low interest will also be low.
Government monetary policy: If the monetary policy is restrictive interest rates will be high in order to discourage money in circulation but if it is expansionary monetary policy interest rate will be low.
• Demand of credit: When the demand for credit is high interest rate will also be high and the demand for credit is low interest rate will also be low. In addition an increase in supply of credit reduces interest rate while a decrease in supply of credit increases interest rate.
Duration of the credit: Long term loans attract high interest while short term loans attract low interest.
• The amount of credit (loan): Big loans are charged high interest rate while small loans are charged lower interest.
11.4.2.2 The role of capital in production
Capital as a factor of production plays a major role in the production process and therefore in the development process. The following are some of the roles:1. Promotion of technological progress
Capital enables transition from primitive to modern methods of production. This is enhanced through importation of modern technology and equipment, hiring technical experts and labour, and purchase of inputs and machinery.2. Facilitates economic growth
The presence of capital in an economy increases the rate of economic growth. This is because capital increases the rate of resource exploitation, thereby promoting simultaneous investment in all sectors.3. Promotes factor mobility
Capital increases occupational and geographical mobility of other factors of production. This results into efficient distribution of resources and an increase in the quantity of resources available.4. Facilitates industrialisation
Physical capital in form of industrial equipment facilitates quick industrialisation of the economy. Industrialisation is the creation of industries in an area.5. Facilitates employment creation
Capital leads to increased productivity and investment. This creates more employment opportunities.6. Promotes research and innovation
Capital makes it possible for an organisation to undertake research. The research aims at improving its operations. This therefore enables organisations to become innovative and more competitive in the market.7. Promotes specialisation in the production process
Capital enables labour to specialise in operating different tasks. These tasks done by the workers, in turn lead to the acquisition of more skills by the workers (labour). Workers therefore, improve their ability to handle different types of machinery. This leads to increased labour efficiency and production of more goods and services.8. Produces quality goods and services
Capital facilitates production of high quality goods and services. The use of capital equipment such as computers leads to improvement in the quality of goods and services produced.9. Facilitates resource renewal
The presence of capital enables a producer to renew his or her resources, to avoid resource exhaustion and also maintain high levels of output.10. Reduces dependence
Availability of capital enables a country to create capacity to produce all its requirements and hence reduced dependence.11.4.2.3 Capital accumulation
Activity 11.8
In groups of five, visit the library or the internet and carry out research on capital accumulation. From your findings, explain the meaning of capital accumulation and the factors that influence the level of capital accumulation in an economy.
Facts
Capital accumulation refers to the process of increasing a country’s stock of capital assets over a given period of time. Capital accumulation can either be gross capital accumulation or net capital accumulation (net investment).Gross capital accumulation refers to the total profits on capital assets. This includes replacement of worn out capital assets plus purchase of new capital assets that a company uses to increase its capital base. Net capital accumulation (net investment) refers to the addition to the existing volume of capital or expenditure on new assets only.
11.4.2.4 Determinants of capital accumulation
1. The level of income in an economyWhen income increases and other factors remain constant, the level of investment also increases. Hence there is more capital accumulation. Low level of income however discourages savings and investment. This in turn leads to low levels of capital accumulation.
2. Political climate in the country
The maintenance of law and order, and security of life and property promotes stable business and investment conditions in an economy leading to higher capital accumulation.3. Government policies on saving and investment
When government policy favours saving and investment, capital accumulation increases. On the other hand, if government policy does not favour investment, the level of capital accumulation becomes low.4. Rate of capital inflows and outflows
High levels of capital inflows lead to an increase in capital accumulation. This occurs especially when this capital is invested in development projects. High level of capital outflow however reduces the amount of capital that would be invested to increase on capital stock, hence reduced capital accumulation.5. The level of development of financial institutions
When a country has well developed financial and economic institutions, it becomes easy to mobilise resources. This can be done in form of savings, which in the end can be turned into investments. Hence this increases the level of capital accumulation. On the other hand, if financial institutions are less developed, the level of savings will be low. As a result, capital accumulation will be low.6. Population structure in terms of growth rate and age
A high population growth rate and a population with very many dependants discourage savings and investment. This is due to high marginal propensity to consume. This leads to reduced capital formation. A low population growth rate with many people in the working class encourages savings, investment, more output hence increased capital formation.Advise this man having many wives.

Comprehensive sexuality education should be thoroughly taught to all people. An educated society is a healthy and wealthy society. Reproductive health education should also be taught to all families so as to control the population.
7. The size of the market
The existence of well organised and expanding markets encourage production of goods and services and generates more incomes. This leads to more savings for re-investment, leading to increased capital accumulation. When the size of the market is small, production will be low, leading to low incomes, low savings, low investment and less capital accumulation.8. The level of entrepreneurship
When there are many people in the economy with good entrepreneurship skills and ready to begin new enterprises, the level of investment and capital formation will be high. In case entrepreneurship skills are inadequate, the level of investment will be low hence low level of capital formation.11.4.3: Labour as a factor of production
Activity 11.9
Taking an example of your school, identify the work done by the different workers ranging from administration, teachers and casual workers.
Basing on your observation, what can you say is the meaning of labour? In addition, identify also the characteristics and the role labour plays in the production process. Read out your findings in class.Discovery
On a daily basis, people move up and down doing ‘something’. At times they are busy to an extent that they are not available in their offices. This is because they are working.People have different types of work. There are those who teach, cook, guard us, drive and clean our environment. From their distinct duties, we have teachers, security guards, chief chefs, garden keepers, nurses, drivers and administrators. Some of this people use more energy than others. Similarly, some of them work as they move from place to place while others are within.
Facts
Labour refers to any physical or mental effort directed towards production of a good or a service. Labour can either be skilled, semi- skilled or unskilled.(a) Skilled labour
Skilled labour refers to labour that is well trained. The skilled workers have trained and achieved the relevant knowledge and skills in their specific fields. In most cases, they are called experts. Those who have worked in the field for some time have gained even more experience. Skilled labour is the most desired labour in the economy. This is because it has practical knowledge and its productivity is high. Some examples of skilled labour include teachers, doctors, lawyers, engineers and veterinary officers.Remember!!! We should educate our children to enable them be experts in their fields they would like to be in future. Give equal education to both the boy and girl child.
Remember
The Rwandan economy will be more productive when all women and men are full participants. When the needs of all groups with special needs are addressed, mainstream gender and family in planning, budgeting and in all development programmes/projects at national and local levels. Reduce poverty levels among men and women and reduce gender-based violence, malnutrition and other related conflicts at both family and community level.EDPRS2 Ministry of Finance and Economic Planning (MINECOFIN), May 2013
Comprehensive sexuality education... Reproductive health education.
Remember
“…contribute to the national efforts to halt the spread of HIV and AIDS by 2015 through education of individuals and families about HIV/AIDS, providing motivation for counselling, distribution of condoms, and making sure that all patients with HIV/AIDS or Tuberculosis receive and adhere to treatment and support. Key intervention include regular sensitisation regarding HIV, voluntary counselling and testing, prevention of mother to child transmission, condom distribution etc” EDPRS2 Ministry(b) Semi skilled labour
Semi-skilled labour is labour that has some little education and little working experience. In most cases, semi skilled labour has the practical and vocational skills. Their productivity is higher than that of unskilled labour. Most of them gain the knowledge and skills as they perform their duties, under the guidance of their supervisors. Some of these semi skilled labourers are carpenters, mechanics, plumbers and artisans.
Fig 11.5: Capentry; an example of a semi skilled labour
(c) Unskilled labour
Unskilled labour is labour in its raw form. It is labour that is not educated. It is labour that has no practical experience in any particular job. Work done by unskilled labour need no specific skills or training. However, if guided, output can be great. Most of the unskilled labour perfom the caual jobs such as cleaning the compound, washing a car, looking after cattle, weeding in a farm and fetching water. At times training such people is necessary to increase output.Recall
1. Why should unskilled labour be trained?
2. Identify the equipment or machines that unskilled labour ought to have some knowledge before operating11.4.3.1 Determinants of wages
• Price level: When the price for a firm’s products is high, more revenue will be realised by the firm and therefore high wages are paid other factors remaining constant.
• Cost of living: When the cost of living is high, high wages are paid and if the cost of living is low, wages will be low as other factors remaining constant.
• Demand and supply of labour: When the demand for a particular type of labour is high compared to its supply, wages paid to that labour will be high but if the supply is high compared to its demand, wages will be low.
• Government legislation: Government policies on wages will influence the wages to be paid. If government legislation favours high wages then the wage rates will be high than when the legislation favours low wages.
• Employer’s ability to pay: If the employer has the ability to pay high wages then wages will be high. But if the employer’s ability to pay is low then wages will be low other factors remaining constant.
• Profits earned by the company: If a company earns high profits then wages paid to its workers will be high than when the company earns low profits.
• Trade unions: Trade unions may influence the level of wages to be paid to their members. If the trade unions are strong, they may successfully advocate for higher wages to their member but if they are weak with low bargaining power then wages will be low.
• Education and experience: High wages are paid to the highly educated and experienced workers while low wages are paid to less educated and inexperienced workers.
• Productivity of labour: High wages are paid to more productive workers but low wages are paid to less productive workers.
11.4.3.2 Characteristics of labour
Labour has the following characteristics, which distinguish it from other factors of production:
1. Labour is perishable. It cannot be stored, postponed or accumulated for the next period or for future.
2. Labour cannot be separated from the owner or labourer. Labour and the provider are the same.
3. Labour has weak bargaining power. As a result, its payment is usually low compared to other factors of production. Since labour cannot be stored, it is less organised and lacks reserve funds to support it when there is no work.
4. Labour is human. Every labourer has his or her own tastes, habits and feelings which must be put into consideration by the employer.
5. Labour supply is regressive. An increase in wages may reduce the supply of labour. This is because achievement of targets may reduce and more time set aside for leisure.
6. Labour is both the beginning and the end of production. Production can only start if labour is applied to land and capital while the end of production is consumption of final goods and services, which is done by labour.
7. Labour is heterogeneous. There are differences in labour efficiency. Some labourers are more efficient than others. This can be due to differences in skills, experience gained, natural ability and level of training.
8. Labour is geographically and occupationally mobile. Labour can easily be transferred from one occupation to another or from one geographical location or area to another.
11.4.3.3 Labour mobility
Labour mobility is the ease with which labour can move from one occupation to another or from one geographical area to another. The movement of labour from one occupation to another is known as occupational mobility of labour. The movement of labour between geographical areas is known as geographical mobility of labour.It should be noted that labour can move within the same occupation either vertically or horizontally, or in different occupations.
Vertical mobility of labour is the movement of a worker from one position (or job group) to another, but within the same occupation. This involves change of status. It may be a promotion or a demotion. For example, a teacher may be promoted from being a classroom teacher to a Senior Teacher, a deputy or a head teacher.
Recall
Identify reasons why a person can be demoted from the current position to a lower positionHorizontal mobility is the movement of labour from one job to another at the same level in a given industry. A secretary for instance, can be moved from finance department to the human resource department, within the same firm or industry.
Recall
Identify reasons why a labourer can opt to move from one job to another in a given industry.11.4.3.4 Labour efficiency
Labour efficiency is the ability of labour to produce the greatest quality and quantity of output within the shortest time possible. It is the productivity of a unit of labour per unit of time.11.4.3.5 Division of labour and specialization
Activity 11.10
In primary school, a teacher can teach different subjects in different classes. A teacher can also teach all subjects in one class in primary level. In secondary schools, a teacher is allowed to teach a maximum of two subjects in all classes.(a) Apart from the school setting, identify other places, firms or industries where workers either work specifically on a certain job, or work on several jobs.
(b) In your opinion, would you like to work on a specific duty or across in a given firm? Explain your answer.
(c) Discuss the advantages and disadvantages of working on a given duty all the time and working across on a given job. Make presentations to class.Discovery
It is true teachers in primary schools teach more subjects than teachers in secondary schools. In the transport industry, a driver strictly is assigned to his or her task of driving, while a conductor can collect the fare, open the door for passengers, alight to look for change outside and issue change to passengers. A daytime guard can also apart from opening the gate for visitors, he or she can direct visitors to where they are supposed to go, acknowledge reception of some documents and keep watch of the building or compound, as directed.We can therefore say that a labourer can work on several duties well, depending on the type of work being done, the expected quality and quantity, and the time frame. There are however, some duties, which need an individual (labourer) to master the skill and keep on working on the same skill so as to improve on it. A driver for instance has to master driving the vehicle, parking, reversing, starting and stopping the car. Repetition of such driving skills will enable the driver master the driving skills. With time, the driver will be in position to drive with ease.
Facts
Specialisation refers to an economic situation where a labourer concentrates in the production of one or very few commodities in a more effective and efficient way. In this case, resources are concentrated in production of relatively few commodities. Labour specialisation refers to the allocation of tasks among workers so that each worker concentrates on the task he or she is most effective and efficient.11.4.3.6 Adam Smith’s Law of specialisation
Adam Smith’s law of specialisation suggests that the bigger the market the higher the level of specialisation. It also states that specialisation leads to the greatest improvement in the productive powers of labour and its productivity since each worker gains expertise by repeating the same task and that saves time.11.4.3.7 Division of labour
Division of labour is a situation where the production process is divided into a series of repetitive tasks. Each worker is responsible for a particular task where he or she can perform better.11.4.3.8 Forms of specialisation
a) Specialisation by craft: This is a form of specialisation where particular groups of people concentrate on particular crafts or activities. These particular groups of people include farmers, carpenters, ironsmiths and tailors.b) Specialisation by process: This is a form of specialisation where different people specialise at different stages in producing a particular commodity in the production process. In a printing industry for example, we have people who have specialised in typing, others in binding, others in printing and photocopying, others in repairing machine and others in packaging.
Regional specialisation: This is where different regions specialise in what they can produce most efficiently and exchange it with other regions.
International specialization: This where different countries specialise in the production of different commodities where they incur the least opportunity cost which enables them to participate in international trade.
Advantages of specialisation and division labour
(a) It increases efficiency and the ability of labour. This is because there is repetition of a task, which results into efficiency at operation of that single task. Remember, practice makes perfect.(b) It saves time. Time that would have been wasted in moving from one job to another is converted into another productive activity. The time can also be used in perfecting the quality of the product being produced, since with specialisation one concentrates on a particular job or task.
(c) It increases production. When a worker concentrates on production of a given product, his or her productivity increases. This increases output, thereby reducing costs of production. As a result, the price of the good in the market may reduce, enabling many to access the product. This in turn improves the standard of living.
(d) Specialisation leads to creation of more employment opportunities. Many occupations and tasks are created for the different diverse skills.
(e) Specialisation leads to production of better quality goods and services. Workers become perfect in performance of their tasks.
(f) International specialisation results into development of international trade. This is because countries produce commodities where they have a comparative advantage and import other commodities, which other countries can produce with a better comparative advantage.
(g) Specialisation promotes commercial production. Workers produce commodities for exchange. This further leads to growth of the economy.
(i) It increases occupational mobility of labour. Workers become more professional in their tasks, which increase their mobility.
(j) It makes the use of machines and other tools possible. When a job is divided into a series of occupations, the use of machines becomes possible since most machines are specialised in nature.
Disadvantages of specialisation and division of labour
1. It leads to monotony and boredom. Performing the same task all the time makes the work monotonous and boring. This reduces pleasure on the job, leads to job dissatisfaction, reduces efficiency and affects production.2. Division of labour increases industrial interdependence. This results into delays in production, inefficiency and losses in case of a breakdown in the process of production.
3. Over specialisation increases the risk of unemployment in case a specialised worker is laid off. This is because the worker only knows a small part of how to produce goods but not the whole process.
4. There is loss of creativity and responsibility. This is because many workers join hands to produce a commodity. If production is not up to the required quality, none of the workers is held responsible since everybody’s responsibility is nobody’s responsibility.
5. It can result into the rise of monopoly. When a worker specialises in performance of a given task, he or she may become a monopolist in that field and may end up cheating customers.
6. It reduces mobility of labour. This is because a worker is trained to handle only part of the whole task. This makes it hard for the worker to find a similar job in another place.
7. Specialisation leads to loss of craftsmanship. This is because it results into increased use of machines. As a result, labour becomes machine attendant hence low skill utilisation.
8. There is a possibility of overproduction. Due to specialisation, there is large scale production which creates excess supply. This leads to losses to the producers.
11.4.4: Entrepreneurship as a factor of production
Activity 11.11
In groups of five, identify people who have successfully started businesses and are still running the businesses.
(a) List down the types of businesses they run.
(b) How do they manage to run the busineses?
(c) Identify the characteristics that they have that enable them manage their businesses.
(d) Discuss too the factors that affect their businesses.Facts
An entrepreneur is a person who organises and co-ordinates other factors of production to produce goods and services. An entrepreneur hires labour and land and looks for capital. The entrepreneur then combines these factors in appropriate proportions to produce goods and services. The entrepreneur is rewarded profit for his contribution in the production process.11.4.4.1 Determinants of profit
• Nature of competition: The nature of competition will determine profit to be earned by a firm either in the long run or short run. If it is perfect competition abnormal profits will realised in the short run but in the long run normal profits will be realised. If it is monopoly it earns abnormal profits in the short run and the long run.
• Price level: When the price for a firm’s products is high, the firm will earn high profits but if the price is low, profits will be low.
• Cost of production: If a firm’s cost of production is high, its profits will be low but the cost of production is low profits will be high.• Size of the market: When the size of the market for a firm’s products is big, its sales will be high and there its profits will also be high. But if the size of the market is low, its sales will be low and profits will also be low
• The level of taxes: High taxes on profit reduce the firm’s profits while lower taxes on profit increase the firm’s profit.
• Production efficiency: When a firm uses production techniques that are efficient, its cost will reduce thereby increasing its profits. But if its production techniques are inefficient, its cost will increase thereby reducing its profit.
11.4.4.2 Characteristics of entrepreneurs
An entrepreneur has the following characteristics:(a) Initiative: Does things before asked for or forced to by events. An entrepreneur acts faster to expand the business to new areas, products or services.
(b) Perceives opportunities: Identifies business opportunities and mobilises necessary resources to invest in the identified opportunities.
(c) Persistence: Takes repeated or different actions to overcome obstacles. An entrepreneur always gives another chance for the business before making a conclusion.
(d) Gathers information: Consults experts for business and technical advice. An entrepreneur seeks information on client’s or supplier’s needs. An entrepreneur personally undertakes market research and makes use of personal contacts or information networks to obtain useful information.
(e) Problem solving: Conceives new ideas and finds innovative solutions. An entrepreneurship is always ready and willing to look for a solution to the existing problems affecting the business.
(f) Self-confident: Makes decisions on his own and sticks to them inspite of challenges or initial setbacks.
(g) Self-critical: Aware of personal limitations but tries to improve upon by learning from past mistakes or experiences of others. An entrepreneur is never complacent with success.
(i) Assertive: Committed to outcome. An entrepreeneur instructs,reprimands and disciplines self for failing to perform.
(j) Risk taker: Takes risks without fear after calculating the estimated impact on business. An entrepreneur has the ability to take risks in business and finds out ways and techniques of reducing or minimising them for their benefit.
11.4.4.3 Functions of an entrepreneur
1. Organises other factors of production.
2. Undertakes risks and bears the burden of uncertainties of the business.
3. Co-ordinates other factors of production. An entrepreneur sets goals and co-ordinates other factors of production to produce goods and services.
4. Is a decision maker. The entrepreneur undertakes all the decisions of the business.
5. Directs the development of the enterprise. An entrepreneur develops concrete plans for the development of the enterprise.
6. Is an initiator. The start of any business enterprise is as the result of the initiative of the entrepreneur.
7. Is an innovator. An entrepreneur introduces new methods of production to improve the quality and quantity of output.11.4.4.4 Barriers to entrepreneurship development
Barriers are the factors that hinder or limit the development of entrepreneurship. Barriers can prevent an entrepreneur from accessing customers or sources of getting more capital for the business. Barriers also hinder entrepreneurs from exploiting their potential. Some of these barriers include the following:
(a) Poor entrepreneurship skills
Most entrepreneurs and potential entrepreneurs have little or no entrepreneurship skills. They lack creativity, innovativeness, endurance, flexibility and other entrepreneurship characteristics.(b) Lack of business and technical skills
Marketing, accounting and management skills are some of the skills required by all practicing entrepreneurs to effectively manage their ventures. Many ventures also require specialised technical know how to set up, operate and manage. Lack of these skills and high rates of illiteracy at times limits the capacity of entrepreneurs to effectively exploit the full potential of their ventures.(c) Lack of mobility and exposure
Exposure of entrepreneurs normally offers them biggest revelation for new ideas that shape their creativity and innovativeness as entrepreneurs. However, many of them do not travel, research nor explore widely. This limits the creativeness and innovativeness of potential and practicing entrepreneurs.(d) Lack of business ethics
Many entrepreneurs have failed to run and sustain their businesses because of unethical behaviour. In most cases, there are problems of unpaid loans, debts and accumulated expenses. At times, entrepreneurs evade paying tax and registering their businesses legally, while others engage in corruption, smuggling and drug trafficking. Such tendencies are illegal and should be stopped immediately.(e) Career dependency
Most people in our country especially the learned, depend wholly on their careers for their livelihoods. Entrepreneurship has long been regarded as a last resort, considered only after failure to secure a white-collar job. Entrepreneurship is regarded as a job for the less educated. Although this attitude is rapidly changing, its effects remain a big barrier to entrepreneurship in Rwanda.(f) Lack of role models in entrepreneurship
Rwanda has few role models in the field of entrepreneurship. This limits the number of people who willingly aspire for careers in entrepreneurship. The available few cannot fully meet the demands of the many upcoming entrepreneurs.(g) Inadequate finance
Banks and micro finance institutions charge high interests on their loans. As a result, entrepreneurs fear seeking for loans to advance in their businesses. In additions the conditions set for one to access a loan may not favour upcoming entrepreneurs. The terms of credit are unreasonable, requiring difficult collateral securities to secure loans and charge high interest rates.
Low incomes and high rates of unemployment limit the purchasing power of the population. This makes it hard for businesses in general and entrepreneurs in particular to acquire the necessary economies of scale.Unit Summary
In this unit the following were discussed:
• Production, which was defined as the process of transforming raw materials into finished products that can satisfy human needs.
• Types of production; such as direct production and indirect production. Direct production is the production of goods and services for one’s own consumption. Indirect production is the production of goods and services mainly for sale to the market.
• Levels or stages of production; such as primary level of production, secondary level of production and tertiary level of production.
• Factors of production; such as land, labour, capital and entrepreneurship.
• Specialisation and division of labour were also discussed. Division of labour is the allocation of tasks among workers so that each worker concentrates on the task where he or she is most efficient. Specialisation is a situation where resources are concentrated in production of relatively few commodities in which one is most efficient.
• Advantages of division of labour and specialisation were also discussed. These include increased efficiency and ability of labour, higher production, time saving, minimising costs and time of training, improvement of workers’ skills, production of better quality products, increased use of machines and increased mobility of labour.
• Disadvantages of division of labour and specialisation were also discussed. Thee include; monotony and boredom, loss of craftsmanship, low mobility of labour, creation of unemployment, overdependence, low skill development and danger of overproduction.
• The role of capital in production; for instance, promoting technological progress, promoting factor mobility, facilitating economic growth, facilitating industrialisation, promoting employment and facilitating resource renewal.
• Capital accumulation was defined as the process of increasing a country’s stock of real assets.
• Determinants of capital accumulation; such as level of income, level of savings, interest rates, the level of taxation, government policy, political stability, level of investment and profit levels.
Remember !!! For a country to attain high levels of output from production, the government and other stakeholders should provide an equal opportunity to all citizens (men and women) to participate in the production process.
Placing the family at the centre of development, the care and protection of children and gender equality are pre-requisite to achieving equitable and sustainable development for girls and boys, women and men.Unit Assessment 11
1 (a) Define the term production.
(b) Explain the advantages of division of labour in the production process.2 (a) What are the functions of an entrepreneur as a factor of production?
(b) What are the barriers to entrepreneurship development in Rwanda?3 (a) State the factors of production and indicate their rewards in the production process.
(b) Explain the factors that influence the level of capital accumulation in an economy.UNIT 12 INPUT – OUTPUT RELATIONSHIP (THE PRODUCTION FUNCTION)
Key unit competence: By the end of this unit, you should be able to describe and illustrate the production function.
Input-output relationship
Input- output relationship expresses a functional relationship between quantities of inputs and outputs. It shows how and to what extent output changes with variations in inputs during a specified period of time.12.1 PRODUCTION FUNCTION
12.1.1 Definition and the forms of expressing the production functionActivity 12.3
The relationship between output and input is expressed as:
Output (Q) = function of/f (Inputs).
Select an enterprise of your choice and find out its output in a given period of time. Find out too the inputs that were used in that period.
In groups of five, explain the meaning of the production function (basing on your findings). Illustrate the ways in which the production function can be expressed.Production function is an expression of the relationship between physical quantities of inputs and output. It shows the maximum output that can be obtained from a given quantity of physical inputs.

Fig 12.1: The relationship between inputs and outputs
a) As a statement Q = f(L,K,N,M,T).
The relationship can be expressed mathematically as follows:
Q= f (L, K, N, M, T). Where Q is output, K is capital, N is land, M is organisation, T is technology and L is labour. f stands for function. The left hand side (Q) represents the dependent variable while the right hand side represents the independent variables. Thus output is the dependent variable while input is the independent variable.b) As an equation Y = a + bx.
Where Y is output, a and b are constants and x is variable input.c) As a graph.
Using a graph, it can be represented as follows:
The above mentioned are forms in which the production function can be expressed. However, it is important to note that the standard economic assumption, which affects the shape of the production function, is the law of diminishing returns.
12.1.2: The law of diminishing returns and returns to scale
Activity 12.4
(a) In groups of five, visit the library and carry out research using the Internet or from textbooks in the library, on the law of diminishing returns and returns to scale.(b) In your groups discuss the laws of diminishing returns and returns to scale, their assumptions and illustrations. Make presentations in class.
The law of diminishing returns states that “ As more of a variable input X is added to a fixed factor, total output increases at an increasing rate and later decreases at a decreasing rate until a point is reached where additional quantities of input X will yield diminishing marginal returns, assuming all other factors remain constant.” This law is also called the law of variable proportions.
12.1.2.1 Assumptions of the law of diminishing returns
1. Existence of a variable factor of production and other factors are constant.
2. All units of the variable factor are homogeneous.
3. The price of the product is given and constant.
4. It assumes a short run period.
5. It assumes that technology is constant.
6. It is possible to change the proportions in which various inputs are combined.12.1.3: The law of returns to scale
The law of returns to scale is an expression of the relationship between output and the scale of inputs in the long run when all inputs are increased in the same proportion. Returns to scale, in physical or money terms can be of three types:• Constant returns to scale: This is a situation where an increase in inputs results in an exactly proportional increase in output.
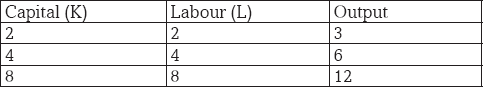
Under constant returns to scale, when inputs double, output also doubles.
• Increasing returns to scale: This is a situation where an increase in inputs results in a more than proportional increase in output.
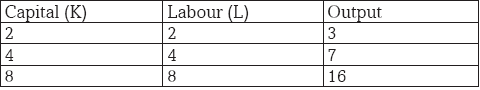
Under increasing returns to scale, when inputs double, output more than doubles.
• Decreasing returns to scale: This is a situation where an increase in inputs results in a less than proportional increase in output.
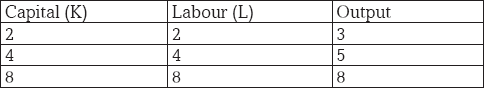
Under decreasing returns to scale, when inputs double, output less than doubles. Output increases at a decreasing rate.
12.1.3.1 Assumptions of the law
i) It assumes that all factors are variable.
ii) It assumes constant technology.
iii) It assumes that the product can be measured in physical quantities.
iv) It assumes perfect competition conditions.12.1.4: The products of the firm
Activity 12.5
Given the following information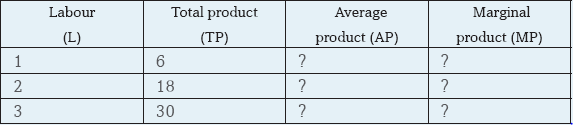

• Using the above case of input-output ratios and in groups of four, calculate AP and MP and illustrate the relationship between TP, AP and MP and make presentations.
12.1.4.1 Total product
This refers to total output resulting from the employment of all the factors of production.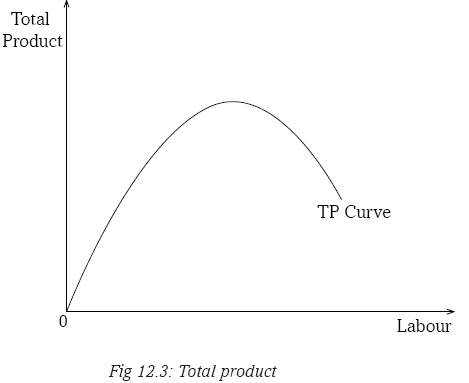
12.1.4.2 Average product (AP)
This is the output per unit of a variable factor employed. It is the total product divided by the total units of a variable factor. As more of a variable factor is employed, AP increases fast, then it falls and the point where AP is at maximum is referred to as the point of diminishing average productivity.

12.1.4.3 Marginal product (MP)
This is the additional output produced by an extra unit of a variable factor. It is the change in total product as a result of a unit change in the variable factor. It is that output that results from employment of an addition of a variable factor.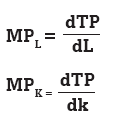
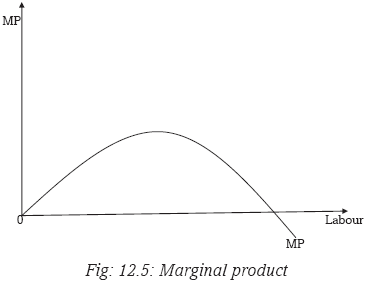
12.1.4.4 Production function MP & AP schedule
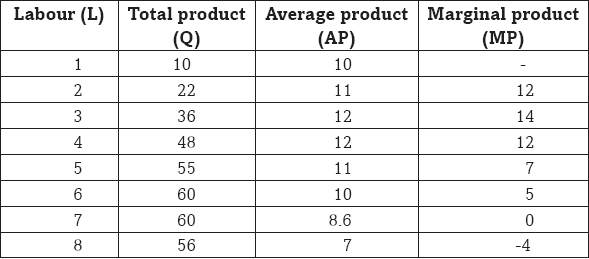
The table above shows the variable factor labour being combined with fixed factor land and the resultant output is obtained. The production function is revealed in the first two columns i.e. (1) and (2). The AP and MP columns are derived from the total product column. The AP is obtained by dividing column (2) by a corresponding unit in column (1). The MP is the addition to total product by an extra worker.
12.1.4.5 The relationship between TP, MP and AP
The analysis of the table shows that the total, average and marginal product increase at first, reach a maximum and then start declining. The TP reaches its maximum when 6 units of labour are employed and it declines. The AP continues to rise till the 4th unit while the MP reaches its maximum at the 3rd unit of labour, then they also fall.
Fig 12.6: Total, Marginal and Average product curves
Note: The point of falling output is not the same for total, average and marginal product curves. The MP starts declining first, then AP follows and lastly, the total product (TP).
The TP curve rises at an increasing rate up to its highest point T and then starts falling. The MP curve and the AP also rise with the total product.
The MP reaches its maximum point V and declines while the AP reaches its maximum point Z and starts falling. When the TP starts declining, the MP curve becomes negative. It is only when the TP is zero that the average product also becomes zero.
The rising, falling and negative phases of the TP, MP and AP are the different stages of the law of variable proportions. The boundary between stage II and III shows the level at which all resources are fully utilised. However, it would be irrational to limit production to stage I because a variable input will not be fully utilised for example the AP is still increasing.
In stage III it is rational to limit operation because you cannot continue adding an input when the TP is decreasing and the MP is negative, unless the input is bought at a negative cost. It is also irrational to continue adding variable inputs when fixed inputs are fully utilised. Therefore the best stage of production is stage II. It is the only stage when production is feasible and profitable.
12.2: ISOQUANTS AND ISOCOSTS
12.2.1: IsoquantsActivity 12.6
1. Below is a table showing how a firm can vary units of capital and labour to produce the same level of output of 200 units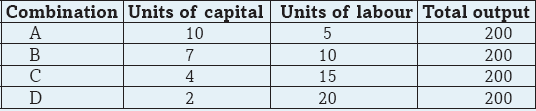
Given that the producer’s income to spend on capital and labour is FRW 200,000.
In groups of five, represent the above data on a graph. Discuss the properties of the graph.Make a presentation in class.
Facts
An isoquant is a locus of points joining different input combinations, capable of producing the same level of output. An isoquant is also referred to as the production indifference curve. The slope of an isoquant is known as the marginal rate of technical substitution since it shows the rate at which one input is substituted for another while maintaining the same level of output. It can be illustrated from the hypothetical isoquant schedule below.12.2.1.1 Hypothetical isoquant schedule

The table shows that a firm can produce 100 units of output at point A by having a combination of 10 units of capital and 4 units of labour. Similarly point B shows a combination of 8 units of capital and 9 units of labour. Point C, 6 units of capital and 14 units of labour and point D, 4 units of capital and 19 units of labour to yield the same amount of 100 units.
When labour units are measured along the X- axis and capital units along the Y- axis, the first, second, third and fourth combinations are shown as A, B, C and D respectively. When we connect all these points, we get the isoquant curve.
12.2.1.2 Properties of isoquants
Isoquants possess certain characteristics, which are similar to those of indifference curves:
1. Isoquants are negatively inclined. That is to say as the amount of capital decreases, that of labour increases so that output remains constant.
2. An isoquant lying above and to the right of another represents a higher output level.
3. No two isoquants can intersect each other, that is, the point of intersection combination would bear less and more output at the same time which is not possible.
4. In between two isoquants, there can be a number of isoquants showing various levels of output.
5. No isoquant can touch either axis. If an isoquant touches the X- axis, it would mean that the product is being produced with the help of labour alone without using any capital.
6. Each isoquant is convex to the origin. As more units of labour are employed to produce 100 units of a product, lesser and lesser units of capital are used. This is because the marginal rate of substitution between the two factors diminishes.
12.2.2: Isocosts
An isocost is a line of points joining different input combinations, which exhaust the producer’s income. It represents the different combinations of two inputs that a firm can buy for a given sum of money at the given price of each input. Isocosts are straight lines because factor prices remain the same whatever the outlay of the firm on the two factors.Hypothetical table
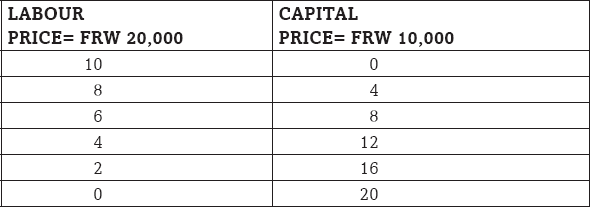
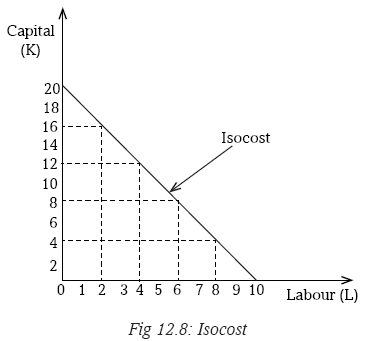
12.2.2.1 Isocost curve
The Isocost curve represents the locus of all combinations of the two factor inputs which result from the same total cost. If for example the unit cost of labour (L) is w and the unit cost of capital (k) is r, then the total cost is: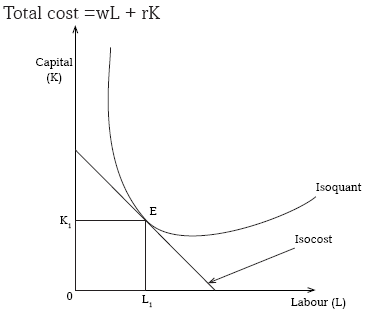
Fig 12.9: Cost minimisation of the firm
The firm will be in equilibrium when the highest isoquant curve becomes tangent to the isocost line. At point E, the equilibrium position of the firm is defined as the level of maximum output, subject to the cost constraint. This point is always shown where the isoquant curve is tangent to the isocost.
The point of tangency represents the least cost combination of the two factors for producing a given output.
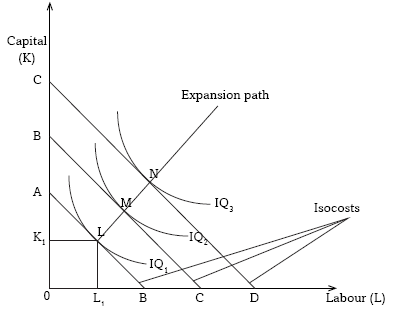
Fig 12.10: Cost minimisation and expansion path of a firm
If all points of tangency like L, M and N are joined by a line, that ‘joining’ line is known as the expansion path or the output factor curve. It shows how the proportions of the two factors used might be changed as the firm expands.
Remember!!! Producers should not compromise standard and quality of goods as they try to increase the firm’s product.
Unit Summary
The unit discussed:
• The production functions as the expression of the relationship between output and inputs.• The planning periods, that is, the short run period as the period during which some factors of production are variable while others are fixed; and long run period as the period when all factors of production are variable.
• Products of the firm were also discussed. Total product is the total amount of goods produced by the firm, average product is the output per unit of the variable factor and marginal product is the additional output got by employing an extra unit of a variable factor.
Unit Assessment 12
1 (a) What is meant by the production function?
(b) Describe the different forms in which the production function can be expressed.2 (a) Define the terms total product, average product and marginal product.
(b) Explain the relationship between total product, average product and marginal product.3 (a) State the law of diminishing returns.
(b) List the assumptions of the law of diminishing returns.4. (a) State the law of returns to scale
(b) Distinguish between constant returns to scale, increasing returns to scale and decreasing returnsto scale.
5 (a) Distinguish between an isoquant and an isocost.
(b) Explain the properties of isoquantsUNIT 13 THEORY OF THE FIRM
Key unit competence: By the end of this unit, you should be able to assess the impact of location and localisation of firms in an area.
Activity 13.1
Using internet, visit any economic journal and carry out research on micro economics. As an individual, discuss your findings with other students in class.
Activity 13.2
In class discussion with the help of your teacher, explain the concept of the production theory clearly indicating its composition.13.1: MEANING OF A FIRM, INDUSTRY AND PLANT
Activity 13.3
In two groups as directed by your teacher, one group should choose and visit an industrial setting which is near your school. And the other group to visit where there are scattered firms. On each firm, check the facilities which are used. Make notes on your findings.
(a) Following the findings, in your own opinion as an individual student, how can you differentiate between a firm, a plant and an industry?
(b) In your groups, show examples of firms from your country and make presentations in class.Discovery
Rwandan economic development and the attainment of the goals set out in the Vision 2020 rely to a large extent on industrial development. For industrial development to be realised, the government of Rwanda must encourage investment on firms. There are big firms and small ones. Different firms use different facilities during production depending on the objectives of the firm.Facts
13.1.1 A firm
A firm refers to a single business unit or enterprise under one ownership, management and contact. It is an independently administered business organisation that makes decision on how to use resources to produce goods and services in order to make profit.13.1.2 A plant
A plant is a particular facility or building that is used to manufacture a product or produce a substance. Different firms have different plants.13.1.3 An industry
An industry is made up of several firms that compete in the production of the same product or service. It can be made of a single firm, two firms or very many firms. For example, transport industry in Rwanda is made up of very many vehicles operators such as buses, matatus, airplanes and many others.Remember!!! The Industrial Revolution is one of the extraordinary jumps forward in the story of civilisation.
13.1.4 Objectives of the firm
Activity 13.4
Basing on the discussion and findings in Activity 13.3, identify some similarities the firms you visited have. In small groups, discuss the objectives of those firms and the factors that influence their long term decisions. Make class presentations.Different firms have different objectives depending on the size and location. All firms must make an appropriate choice when deciding on which good or service to produce in order to achieve its objectives. But in general, firms have the following objectives:
i. Profit maximisation is one of the major objectives of firms.
ii. Firms have an objective of increasing their share of the market.
iii. They have an objective of increasing their sales revenue.
iv. They have an objective of limiting entry of new firms in the industry.v. The objective of a firm is to improve the social and economic welfare of its employees.
vi. Firms have an objective of long run survival in the market.Remember !! The heart and soul of the firm is creativity and innovation.
13.1.5 Factors influencing long term decisions of the firm
Every firm must put into consideration a number of factors when deciding on which good or service to produce for sale in order to make a maximum profit. This is because the resources available are scarce and every choice made has an opportunity cost. Some of the factors that should be considered include:
i. The objective of the firm: A firm will take decisions that are in line with its objectives such as profit maximisation, sales maximisation, long run survival among others.
ii. The level of competition: The level of competition will determine the decisions of the firm. For example a firm operating under perfect or pure competition cannot take the same decisions as a monopolistic firm.
iii. Cost of production: A firm has to consider the costs of production in taking its decisions. For example a firm has to consider its average costs when taking decisions concerning determining price for its output.
iv. Government policies on business: Policies like those on taxation, subsidisation influence a firm’s decisions. For example increased taxes on the firm’s products may influence a firm to increase prices or even reduce wages of employees in order to cut cost and remain profitable.
v. Location of the firm: Firms that operate in urban areas will take decisions that are different from those of firms operating from rural areas as the nature of their business environment is different.
vi. Economic conditions: The economic condition the firm is operating in influences its decisions. Such macro economic conditions such as inflation, unemployment, business cycle will influence the decision taken by the firm.
vii. Business expectations: What a firm expects in terms of return on its investment affects its decisions regarding planning, marketing and investment decisions among others.
Case study
One Saturday afternoon, five senior four students of Kagarama secondary school visited Utexrwa Textiles, a large tailoring workshop in the market close to their school. This is the shop where their uniforms are bought. They were surprised by the number of customers that came in and out.Questions
(a) Would you classify Utexrwa Textiles as a firm or an industry? Explain your answer.
(b) The firm sells a wide variety of clothes. Explain the factors that the firm considers before settling on the production of particular clothes.13.2: LOCATION AND LOCALISATION OF FIRMS
Activity 13.5
As an individual student, make a visit to any firm of your choice in any District near your school. Observe the activities that are carried out in the firm. Interact with workers in the firm and if possible ask for a tour around the firm under guidance.(a) On your own opinion, what do you think influenced the construction of the firm where it is?
(b) In groups of not more than five students each, discuss the factors that you think could have influenced the location of the firm you visited.Discovery
From the activity above, we find that firms are located in different places. The location of a firm becomes a real challenge for entrepreneurs in terms of management strategy. Some firms are located in rural areas while others are in urban centres.Facts
Location of a firm refers to the physical place where the business operates. Entrepreneurs choose a location that gives the lowest cost but highest profits.13.2.1: Factors influencing location of a firm and an industry
i. Availability of raw materials: A firm should be located in an area where raw materials are especially when the raw materials are heavy and it would be costly transport them from distant places.
ii. Availability of the market: Firms should be located in areas where the market for its finished products is available as this reduces the firms expenditure to market its products and hence an increase in firm sales and profits.
iii. Government policy: The policy of the government concerning industrialisation influences location of firms. For example government may have the goal of regional balance in development and therefore my dictate where to locate certain firms in order to realise this goal.
iv. Transport and communication network: Firms should be located in areas where the transport and communication infrastructure is developed. This eases transportation of the firm’s products to market and the raw materials to the firm as well as keeping in touch with its partners through efficient communication network.
v. Availability of power: Firms should be located in an area where power is available and less costly. This is because every firms need power in the production process and therefore its absence implies that the firm cannot undertake production.
vi. Availability of labour: A firm should be located in an area where there is availability of abundant labour, with the required skills that the firm can employ to facility its production process.
vii. Availability of land: Availability of enough land which the firm can acquire at a low cost and also where it can expand its scale of operations in future influences the location the firm.
viii. Political stability: Firms should be located in an area where there is political stability since it will be sure of the security of its investments.
ix. Commercial institutions: Presence of developed commercial institutions such as banks, insurance companies and advertising companies. They facilitate the firm to acquire credit and promote its products in case of advertising companies influence location of firms.

13.2.2: Localisation of firms
Activity 13.6
Compare these two cases. In Kigali Rwanda, there are many industries that produce different products. Some of the industries include; Limosa ltd that deals in accountancy and management services, UNICOOPAGI deals in agriculture and agri-processing, Gihamya deals in multimedia and graphic designs and many others.In Nyamagabe a small urban center in Rwanda has only one major industry that is Tea Industry. In your own assessment;
(a) Why do you think there are many industries in Kigali as compared to Nyamagabe?
(b) In small groups of not more than five students each, discuss the benefits industries get from one another when they are closely located.In today’s economy, firms depend on one another. One firm’s waste material may be used by another firm as a raw material. Due to this interdependency among firms, most entrepreneurs decide to construct their firms near the ones that may provide raw materials. This helps in cutting down the transportation and disposal of waste costs for the firms. A situation where many firms are concentrated/ located in a particular area is known as localisation of firms.
Fig 13.2 Concentration of firms in a place
13.2.3: Merits of localisation of firms
i. Creation of employment: Localisation leads to creation of more employment opportunities to the population in the area as firms in the area will require workers with varying skills.ii. Development of infrastructure: Localisation results into improvement of infrastructure by the government such as roads and telecommunications to cater for the firm’s needs.
iii. Urbanisation: Concentration of firms in a particular area results into urbanisation. With its advantages like improvement of cultures and attitudes, encouraging hard work hence promotion of economic development.
iv. Improved quality: Concentration of firms in area results into production of high quality products due to competition among many firms.
v. Improved reputation: Localisation enables the area to gain reputation and the same will apply to the goods produced from that area which creates wider markets for its products.
vi. Supply of skilled labour: Concentration of firms in an area attracts skilled labour to that area which in the long run promotes specialisation and division of labour in the production process with its associated advantages.
vii. External economies: Concentration of firms in an area results into generation of various external economies like transport economies, marketing economies, labour economies, research economies and many others which reduce the production costs of the different firms.
viii. Industrial expansion: Localisation of firms results into growth of subsidiary industries to supply raw materials, machine tools, component parts etc hence expansion of the industrial sector.
13.2.4: Demerits of localisation of firms
i. Regional imbalances: As a result of localisation, some regions grow faster than others leading to regional imbalances in development. This can lead to friction, social conflicts and other political.ii. Development of slums: Localisation results into development of slums due to lack of adequate housing facilities to house the large number of people in the localised area.

Fig 13.3: Houses in a slum
iii. Rural-urban migration: Due to localisation, many people move to urban centers in search of employment. This results into high crime rates and other social problems in urban areas.
iv. Social problems: Concentration of firms in an area results into social problems like congestion, overpopulation, traffic jams and accidents which reduce labour efficiency and industrial production.
v. Over-straining infrastructure: As a result of localisation, infrastructures like roads are excessively used which increases wear and tear, costs of replacement hence constraining the government budget.
vi. Diseconomies: Due to concentration of many firms in an area, diseconomies of scale arise such as high cost of labour, transport problems, failure to secure credit, competition for raw materials resulting into high costs of production.
vii. Increased cost of living: Concentration of firms in an area results into shortage of essential commodities in the area due to increased demand for those products, hence resulting into increased cost of living.
viii. Increased dependence: Localisation results into overdependence on a particular area for a particular product which is dangerous in case of war, natural disasters or in an economic crisis.
ix. Exhaustion of resources: Concentration of firms in an area leads of over exploitation of resources in the area resulting into exhaustion of the resources which deprives the future of access to those resources.
13.2.5: Survival of small scale firms alongside large scale firms
Activity 13.7
In Gikongoro market, Josiane and Family Company have processed fruit juice for the last 10 years. The company has employed Nazou and Manasse only to help them run the business. They can manage to attend to as many clients as possible per day within the market.In the same county, there is Inyange Industries that manufactures fruit juice. It employs many people from all over Rwanda. It produces over 10000 litres of juice per day. It has also opened up many branches in different cities in Rwanda.
(a) In your own opinion, identify the reasons why there is a big gap between the amounts of the output produced by the two firms.
(b) In a class discussion, explain the reasons why Nadege’s firm continues to exist alongside large scale firms like Josiane and Family Company.Remember!! Small business are the backbone of our economy. I’m for big business, too. But small business are where the jobs are generated.
Although large scale firms enjoy various advantages over small scale firms, small firms continue to established and exist alongside large scale firms. The following factors explain the continued existence and survival of small scale firms alongside large scale firms:
i. Management: Small scale firms are easier to manage. They make decisions very fast and efficiently since it is done by few people.
ii. Fear of rising costs: Some small scale firms simply fear the rising costs associated with large scale production. When small scale firm expands, the owners may start experiencing an increase in cost. This may force them to retain the business as small scale.
iii. Market limitation: Some firms remain small in the long run due to small size of the market for their products that cannot them to expand.
iv. Distance between producers: When a firm is separated from its rivals by a long distance it may continue to exist despite its small size.
v. Subsidiary industries: Small firms may continue to exist alongside large ones if they act as subsidiaries of the large firms for example repairing machines, using by products and providing other services to the firm.
vi. Personal services: Firms providing personal services where there is need for personal contact with customers usually remain small in the long run in order to maintain relations with customers such as medical firms, legal firms and many others.

Fig 13.4: A lady attending to her customer
vii. Desire for independence: Where there is shortage of capital, individuals will continue with small firms where little capital is needed rather than integrating to form large ones due to desire for independence.
viii. Banding together: Small firms continue to survive alongside large firms by working as a group while maintaining their independence which enables them to realise economies of large scale production.
ix. Sub-contracting: Small firms may continue to survive alongside large firms by sub-contracting from the large ones which enables them to get access to markets e.g. construction firms.
x. Government policy: In some countries, the laws governing expansion of business are very strict. Small scale firms may fail to meet the conditions hence they remain small.
Unit Summary
• A firm was defined as the smallest unit of production under one control which employs factors of production to produce goods and services.
• Objectives of the firm were also discussed and they include, profit maximisation, sales maximisation, production of quality products, improvement of social economic welfare of employees among others.
• Factors influencing long term decisions of the firm were discussed such as cost of production, business expectations, objective of the firm, government policy, level of competition, planning period, economic conditions among others.
• Factors that influence location of a firm was discussed and they include among others; availability of raw materials, availability of market, government policy, transport and communication network, labour availability among others.
• Localisation was also discussed as the concentration of firms in an area.
• Advantages and disadvantages of localisation were also discussed. The advantages include; production of quality products, increased output, creation of employment opportunities, development of infrastructure, economies of scale etc.
• The disadvantages of localisation include; rural urban migration, development of slums, high cost of living, unemployment, social costs like high crime rates, prostitution, over dependence, diseconomies of scale, over straining infrastructure, exhaustion of resources, limits employment opportunities among others.
• Factors for survival of small scale firms alongside large ones were also discussed such as limited capital, limited market, long distance between producers, sub-contracting, fear of risks, subsidiary industries, case of personal services, desire for independence, banding together among others.
Unit Assessment 13
1. (a) Distinguish between a firm and an industry.
(b) Explain the factors that influence location of a firm.
2. (a) What is meant by localisation of firms?
(b) Discuss the advantages and disadvantages of localisation of firms.
3. Discuss the factors that explain the survival of small scale firms alongside large scale firms.UNIT 14 THEORY OF THE COST
Key unit competence: By the end of this unit, you should be able to describe production costs of the firm in the short run and long run.
Activity 14.1
With the help of your teacher, identify a resource person on Economics and invite him/her to your school. Listen to his or her speech and teachings on microeconomics as you take notes on the main issues. Ask questions related to individual behavior in the economy as he or she answers.(a) In your own opinion, did the resource person talk about all that you expected on microeconomics?
(b) As a class, discuss the branch of Economics concerned with the behavior of individuals and firms in the economy.Activity 14.2
Radio Salus broadcasts 24 hours a day, seven days a week and its programmes reach the entire population of Rwanda. It has a variety of news on education and many others. It broadcasts in Kinyarwanda, Swahili, English and French.
As an individual, listen to economic programmes on the radio Salus and analyse the status of manufacturing in Rwanda. Use this information to discuss production theory as an area of study in Economics.
14.1: COSTS
14.1.1: Meaning and types of costsCase study
Nyirangarama enterprise is a firm that produces a variety of products. In order for the firm to meet its obligations it makes a number of expenditures. At its inception it incurred initial expenditures which included;
Land for 5,000,000 FRW, registration for 50,000 FRW, construction of firmbuildings for 20,000,000 FRW and advertising expenditure 2,000,000 FRW. The proprietors had earlier borrowed 100, 000,000 FRW for which the firm will be paying 18% interest annually.
After beginning operations, the firms incurs expenditures on raw materials for 4,000,000 FRW, salaries for staff for 1,500,000 FRW monthly and for administration 2,000,000 FRW, transport for 1,000,000 FRW.
(a) After studying the case study, in groups of not more than five students,
discuss the concept of costs and identify the types of costs in the case study.
(b) Using your internet, explain which of the above costs implicit costs are and whichones are explicit costs and make presentations.
Every firm spends on their daily activities. These expenditures come in different forms and way. For any firm to realise its main objective of maximising the profit, it must incur some costs during production and sales. Not all costs incurred during production must involve the exchange of money.
14.1.1.1 Costs
These are expenses of a firm incurred during production process. Costs consist of payments to factors of production and therefore closely linked to the theory of production. Costs are derived from the production function. Costs are divided into two:1) Implicit costs: These are basically social costs. They are costs that cannot be included in the computation of the firm’s profits. This is because such costs cannot easily be monetised. They include noise, time wasted, and opportunity cost.
2) Explicit costs: These are costs for items for which the firm can make specific payments on. It is the actual expenditure of a firm incurred when purchasing the input factors.
These include costs of raw materials, labour, transport, energy and many others. They include both fixed and variable costs.14.1.2: Short run costs of the firm
Short run is a period in which the firm cannot change its plant, equipment and the scale of operations. To meet increased demand, it can only raise output by hiring more labour and raw materials or asking the existing labour force to work overtime. The short- run total costs are divided into:i. Total fixed costs (TFC).
ii. Total Variable costs (TVC).14.1.2.1 Total fixed costs (TFC)
These are costs that do not change as output changes. They include payment for rent, interest on borrowed money, insurance charges, wages and salaries of permanent staff and maintenance expenditure. They are also called overhead costs, supplementary costs and indirect costs. The total fixed cost curve is therefore horizontal and parallel to the X- axis.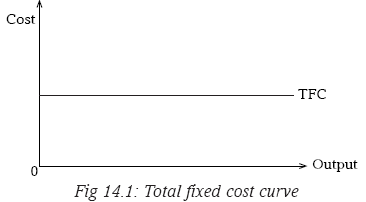
14.1.2.2 Total variable costs (TVC)
These are costs which change directly with output. They include expenses on raw materials, power, taxes, and advertising. They are also known as direct costs, prime costs or operating costs.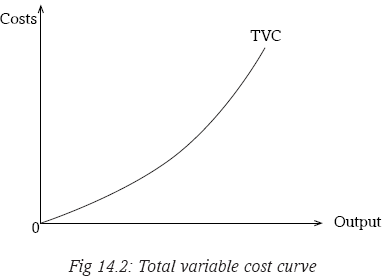
14.1.2.3 The total cost (TC)
This is the total sum of the total fixed costs and the total variable costs in the business.
TC = TFC + TVCWhen output is equal to zero, total cost will equal fixed costs since variable costs will be zero. When production begins to increase, total costs will continue to rise as variable costs increase since variable costs must increase as output expands.
14.1.2.4 Hypothetical Total Cost (TC), Variable Cost (VC) and Fixed Cost (FC) Schedule
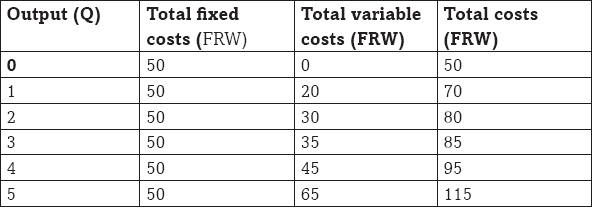
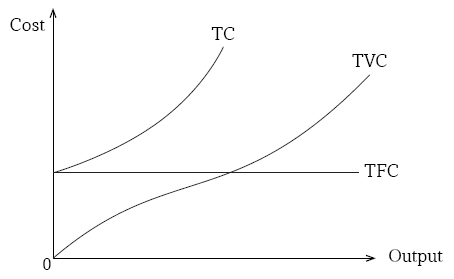
Fig 14.3: Total cost and fixed cost curves
The total cost curve cuts the vertical axis at a point above the origin and rises continuously from left to right. This is because even when no output is produced the firm has to incur fixed costs. The TVC curve starts from the origin (0) because when output is zero, the variable costs are also zero. They increase as output increases.
14.1.3: Variation of costs in the short run
Activity 14.3
Basing your discussion on the schedule in Activity 14.2, in your groups, create same table like the above but with additional columns of; average fixed cost, average variable cost, average total cost and marginal cost.
Carry out research on average fixed costs (AFC), average variable costs (AVC), average total costs (ATC) and marginal costs (MC) from the library, internet regarding their meaning and calculation. Make the notes on the same.In your groups, discuss the meaning of average fixed costs, average variable costs, average total costs and marginal costs and show how they are calculated. Fill in the columns you created.
As an individual, what is the relationship between the average costs named above?In the short run analysis average costs are more important than total costs. The units of output that a firm produces do not cost the same amount to the firm, but they must be sold at the same price. Therefore the firm must know per unit cost or the average cost.
The short run average costs of a firm are the average variable cost (AVC), the average fixed cost (AFC) and the average total cost (ATC).
14.1.3.1 The average fixed cost (AFC)
This is the total fixed cost at each level of output divided by number of units produced. That is: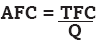

The average fixed cost diminishes continuously as output increases. This is because when a constant figure such as the TFC is divided by a continuously increasing unit of output, the result is a continuously diminishing average fixed cost, thus the AFC curve is down ward slopping but does not cross the
quantity or output axis because if it did then, AFC would be zero in which case TFC would be zero which cannot be the case14.1.3.2 The average variable costs (AVC)
This is the total variable cost at each level of output divided by the number
of units produced. That is:

Fig 14.5: Average variable cost curve
The curve is U- shaped because of the law of diminishing marginal returns. The AVC first declines with the rise of output as larger quantities of variable factors are applied to fixed factors but eventually they begin to rise due to the law of diminishing marginal returns.
14.1.3.3 The average total cost (ATC)
This is the average cost of producing any given output.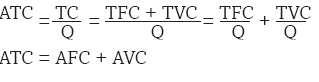
14.1.3.4 The marginal cost (MC)
A fundamental concept for the determination of the exact level of output of a firm is the marginal cost (MC). Marginal cost is an additional cost that is incurred to produce an extra unit of output.
14.1.3.5 Relationship between short run costs curves
Activity 14.4

Using the knowledge obtained from activity 14.3 and the formulas discussed above, in groups of not more than five students each, copy the table above in your exercise book and calculate; TC, AVC, ATC, AFC and MC.
(a) With the help of your teacher, illustrate the relationship between short run MC, AC, AVC and AFC. Also illustrate the relationship between short run MC and short run ATC.
The relationship between short run cost curves
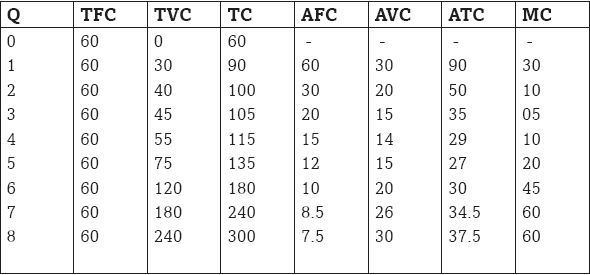
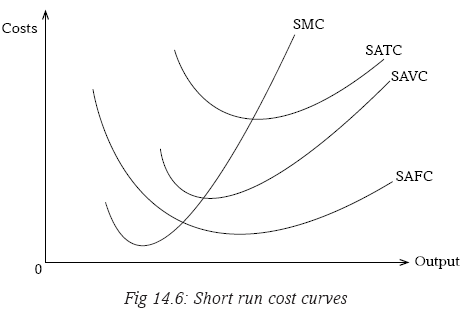
The AFC declines continuously and is asymptotic to both axes that is, it never touches either axes.
The AVC curve first declines, reaches minimum at point A and rises thereafter.
The ATC first declines, reaches a minimum point P and the MC = ATC.14.1.3.6 The relationship between MC and ATC
There is a direct relationship between the ATC and the MC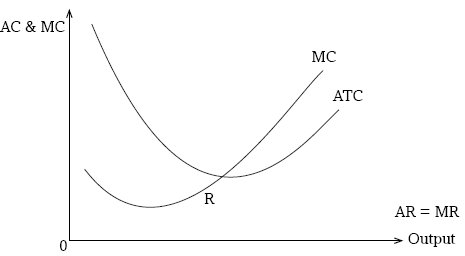
Fig 14.7: Marginal cost and Average total cost curves
Both curves are U- shaped and when the ATC falls MC is less than the ATC. This is because a fall in MC is related to one unit of output while in case of ATC; the same decline is spread over all units of output.
When the ATC is at minimum, it’s equal to the MC. The MC curve cuts the ATC curve from below at its minimum point R.
When the ATC rises, MC is greater than ATC. The MC curve is above ATC when ATC is rising i.e. MC is greater than the ATC.
14.1.4: The long run cost curves
Activity 14.5
Use internet and your library as an individual. Find out how a long run average cost curve is derived from a series of short run average cost curves. Discuss your findings with the rest of the students.In the long run, all inputs (factors of production) are variable and firms can enter or exit any industry or market. Consequently, a firm’s output and costs are unconstrained in the sense that the firm can produce any output level it chooses by employing the needed quantities of inputs (such as labour and capital) and incurring the total costs of producing that output level.
In the long run, the law of diminishing marginal returns does not operate and do not guide production and cost. Instead long run average cost is affected by increasing and decreasing returns to scale, which translates into economies of scale and diseconomies of scale.
14.1.4.1 Long run average cost curves (LAC)
The Long-run Average Curve (LAC) of a firm shows the minimum average cost of producing various levels of output from all possible short run average cost curves (SAC), thus the LAC is derived from the SAC curves that is the LAC can be viewed as a series of alternative short run situations into any one of which the firm can move.Each Short-run Average Curve (SAC) curve represents a plant of a particular size which is suitable for a particular range of output. The firm will therefore make use of the various plants up to that level where the short run average costs fall with an increase in output. The firm will not produce beyond the minimum short run of producing various outputs from all the plants used together.
14.1.4.2 Deriving the long run average cost curve (LAC)
Let us assume that we have five plants represented by their short run average cost curves SAC1, SAC2, SAC3 up to SAC5 where each curve represents the scale of the firm.The long run average cost curve is shown as smooth curve fitted to the short run average cost curves so that it is tangent to each of them at some point as shown in the illustration below:
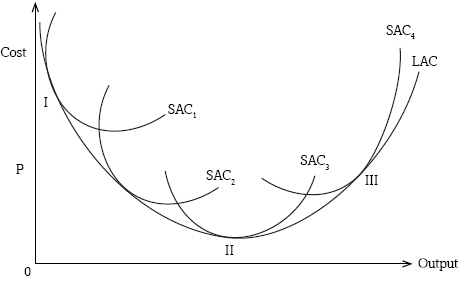
Fig 14.8: Long run average cost curves
The LAC is U- shaped due to economies and diseconomies of scale. These are the advantages and disadvantages of producing on a large scale respectively. The LAC curve can be divided into three parts.
Part I shows that the costs of the firm are falling while output is increasing. In this region there are increasing returns to scale. In part II LAC is constant but output is increasing, there are constant returns to scale in this region. The factor inputs increase by the same proportion as the increase in factor output.
In part III output is increasing at increasing costs and this is due to the diseconomies of scale thus there are diminishing returns to scale in this region.
14.2: SCALE OF PRODUCTION
Activity 14.6
Case StudyIn Kibuye City there are different business persons carrying out their businesses. For example Nadege, Manasse and Nazou are among the prominent business people in this city. They deal in domestic products all of them. Nadege’s business has been doing well until she has opened another branch in Gasarende City. She gets many customers than Manasse and Nazou. Manasse’s and Nazou’s businesses are not doing well and they cannot clear some of their bills like rent, electricity, water and cannot hire employees to help them. They lose customers to Nadege who had better services as compared to them.
Manasse and Nazou decided to dissolve their individual businesses and form a partnership between two of them. They gave it the name Manazou Enterprises. After one year of operation, they started getting many customers and they could now pay all their bills as well as employ people to help them. They opened up other branches in other cities like Gikongoro.
(a) In your own assessment why do you think Nadege’s business was doing well than Manasse’s and Nazou’s?(b) In pairs, discuss the benefits that firms experience when they come together and continue with the production activities.
It’s every firm’s goal to achieve the set objectives. One of the objectives of every firm is to grow and open up to many markets in the country and even outside the country. Some firms can achieve this on their own while others cannot and they have to come together so that they can expand and compete effectively with big firms in the market.
14.2.1: Growth of firms
The steady physical increase in a firm’s productive capacity which is identifiable by a sustained increase in a firm’s real output of goods and services over time is what is called Growth of the Firm.Remember!!! Did you know that: “Growth depends upon activity? There is no development physically or intellectually without effort, and effort means work.”Now you know.
Firms grow so that they can realise their goals and objectives such as increasing sales, profit maximisation, expanding the market share. This growth may either be natural growth or internal expansion and external growth or mergers.
Natural growth
Natural growth is related to the increase in output which leads to the increase in profits and later expansion or increase in size of the firm.To grow naturally, a firm will need to retain enough profits in order for it to purchase new assets and new technology. As time goes on, the total of a firm’s resources will increase which provides collateral security to enable it to borrow to fund further projects for expansion.
14.2.2: External growth/ merging
Another way in which a firm can grow is to integrate with other firms through mutual agreement or through acquisitions.14.2.2.1 Mergers
A merger refers to the amalgamation/coming together of firms to form an entirely new firm for different economic objectives. Mergers are of the following types:1. Vertical merger
This refers to a type of merger where firms at different stages of production integrate. A vertical merger can either be forward merger or backward merger.a) Backward merger: This is where a firm at a higher stage of production decides to merge with a firm at a lower stage of production. This can take place for the following reasons:
• To control supply of raw materials.
• Ensure quality and quantity of supplies.
• Establish a monopoly by controlling the source of raw materials.b) Forward merger: This is where a firm at a lower stage of production decides to merge with a firm at a higher stage of production. For example a business making furniture merge with a retail outlet selling the furniture. Reasons for such a merger include:
• Control of the market by eliminating middlemen.
• To realise economies of scale.
• Accelerating development of new discoveries.
• Controlling the quality and quantity of output.2. Horizontal merger
This is where firms at the same stage of production and producing the similar products decide to integrate. For example two hair dresses join together. The reasons for such a merger include:
• Elimination of competition.
• Rationalisation of capacity.
• Increase specialisation.
• Realisation of internal economies of scale.3. Conglomerate merger
This is where firms which produce commodities which are not related integrate. Such a merger is also known as a diversifying merger. The major reason for such integration is insurance against risks in case a firm anticipates a decline in future.4. Lateral merger
This is where a business merges with another business who makes similar goods to it but who are not in competition with each other. For example when a sugar manufacturing company merges with a sweet manufacturing company.Advantages and disadvantages of mergers
Activity 14.7
Through debates, as a class divide yourself into two groups. Basing your discussions on the case study of Nadege, Manasse and Nazou in Activity 14.6;
(a) Discuss the benefits Manasse and Nazou got when they came together as partners.
(b) What problems do you think are associated with the coming together of firms? Explain.There are some benefits that firms cannot enjoy when operating alone. These can only be enjoyed when they come up together and work as one in their production activities. These benefits include:
• International competition: Mergers can help firms become more competitive and able to face the threat of multinational companies and compete on an international level.
• Economies of scale: Mergers enjoy economies of scale since it increases their capacity. The merged firms are able to enjoy marketing economies. They can purchase in large quantities and enjoy discounts among others.
• Research and development: Mergers are able to invest in research and development and therefore improve on the methods of production, thereby leading to development of new products.
• Increased efficiency: When firms merge they are able to combine their capabilities in terms of expertise, technical knowhow all of which result into increase efficiency.
• Rationalisation: Merging results into rationalisation in those parts of a business that are inefficient or unprofitable are eliminated after merging.
• Diversification: Conglomerate mergers in which firms producing unrelated products integrate results into diversification of their production activities increasing their scope of business activities and therefore hedging against risks.
When two or more firms come together to produce a given product, there are different problems that they may experience. These problems sometimes are not experienced by the firms that operate alone. These problems may include:
• Diseconomies of scale: Merging results into diseconomies of scale where after merging the firm experiences problems of coordination and control resulting into increase in the costs of production and reduction in profits.
• Limited variety to consumers: As a result of merging firms which were competing become one and this limits consumer’s choice since consumers will be exposed to products of one firm as opposed to the situation before merging.
• Higher prices: After merging the firm is likely to sell its products at high prices since there is reduced competition hence leading to exploitation of consumers.
• Monopoly: Merged firms may have more monopoly power which may allow them to dictate terms to suppliers and customers such as offering low prices to the suppliers.
• Low output: Mergers may result into a reduction in output leading to shortage of goods on the market which is a disadvantage to the consumer.
• Layoffs: Merging of two businesses often leads to a reduction in labour force required. This leads to unemployment.
• Leadership issues: Merging may lead to a discontent over leadership of the newly formed company. One may have a feeling that their company has been taken over rather than merged as an equal partner. This can lead to corporate infighting and talent drain as people leave the company.
Warning!!! The key is to keep company/business only with people who uplift you, whose presence calls forth your best.
14.2.2.2 Factors limiting merging
To maximise profits, firms tend to amalgamate so as to improve on the output and sales volume. Some firms wish to merge but are discouraged by a number of factors while others are unwilling to do the same. The factors that limit amalgamation of firms are:• Fear of diseconomies: Most firms prefer to remain independent due to fear of disadvantages of large scale production which may arise with merging.
• Fear of complexity of management: Merging may create complex managerial problems due to combining different groups originally from different firms operating under different situations.
• Fear of losing clients: Firms may not merge due to fear of losing close touch with clients of the firm.
• Fear of losing independence: Firms may not merge due to fear of losing independence by the small firms as a result of being dominated by the large firm.
• Market limitation: Firms may not merge if the market potential favours competition rather than quasi monopoly hence preferring independence.
• Fear of unemployment: Merging results into rationalisation of capacity where some workers may be laid off therefore discouraging merging.
• Fear of high taxes: As a result of merging, a single large scale firm faces more taxes as compared to several small scale firms hence discouraging merging.
• Unrelated fields: Firms may not merge if they are operating in unrelated fields requiring different fields of specialisation.
Fear of heavy losses: Merging may increase the losses for a single large scale firm as compared a small scale firm which merging of firms.
• Government legislation: Firms may not merge if the government prohibits merging in order to control creation of monopolies.
• Fear of risks: Firms may not merge due to fear of risks associated with large scale production.14.2.3 Economies and diseconomies of scale
Activity 14.8
Azam industry a firm that a few years in Rwanda has been producing wheat. It started production process with only one branch. It has recently expanded its scale of production by venturing into production of other products including beverages like juice and mineral water and many others.
It has also expanded its branch network in all cities in Rwanda. During the expansion process, Azam Industries encountered different benefits as well as problems.(a) In pairs, think of some of the benefits a firm may enjoy as it tries to expand its production.
(b) As a class, discuss the problems that you think may be encountered by firms that expand.
(c) In your own opinion, is it profitable when a firm expands or when it remains small? Explain.As firms grow, they experience different problems (disadvantages) and benefits (advantages). These advantages are referred to as economies of scale. The disadvantages are called diseconomies of scale. These are discussed as below:
In the short-run, the firm may make super-normal profits as shown below.
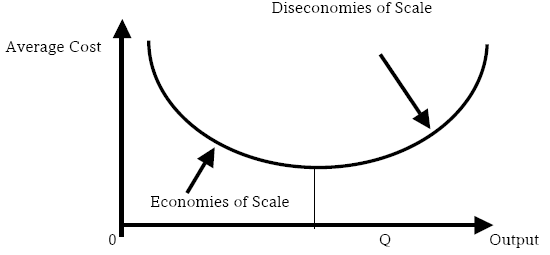
Fig 14.9: Supernormal profit of a firm
14.2.3.1 Economies of scale
For relatively small levels of production, a firm tends to experience economies of scale and increasing returns to scale. These result because an increase in the scale of operations (a proportional increase in all inputs under the control of the firm) causes a decrease in average cost. The advantages/ benefits enjoyed by a firm due to expansion resulting into a fall in average costs of production are referred to as economies of scale. Economies of scale can be categorised into internal and external economies.(a) Internal economies
These are benefits experienced by a single firm as a result of increasing its scale of production. These benefits are not shared with other firms in the industry. Internal economies of scale occur to a firm that has increased its level of output. It consists of the following:• Technical economies: As a result of expansion a firm becomes more efficient due to specialisation of both labour and capital, ability to use superior equipments, ability to increase dimensions and ability to link processes in production .
• Managerial economies: As a result of expansion a firm can afford better and more elaborate management which a small firm cannot afford. It can employ managers, engineers, accountants and many others. Therefore, functional specialisation at managerial level results into more efficiency and lower costs.
• Marketing economies: When a firm expands it realises advantages in buying and selling its products. For example a firm can employ specialised procurement officers who buy the right quality at the right time and right price. It can also employ marketers to promote sales of its products hence lower costs and higher profits.
• Financial economies: A large firm has more access to finance as compared to a small firm. It can easily secure loans, it has access to the stock exchange market, can easily sell its shares and debentures which give it financial advantages.
• Risk and survival economies: Due to expansion, a firm is in a better position to handle risks as compared to a small firm. It can also reduce risks in business through hedging and by acquiring insurance policies.
• Research and development economies: When a firm expands it can raise to undertake research, develop new designs, invent new products and undertake trade missions which cannot be afforded by a small scale firm.
• Social and welfare economies: As a firm expands its scale of production, it is in position to provide fringe benefits to its workers like better housing, medical insurance and recreation which improve the efficiency of labour.
(b) External economies
These are advantages/benefits enjoyed by a firm as a result of the expansion or growth of the industry. The external economies of scale are shared with other firms operating within the industry. These benefits include:Labour economies: When an industry expands, labour with various skills is attracted to that particular area creating more access to such labour by the firms at lower costs.
• Economies of co-operation: Due to expansion of an industry there are more co-operations between firms which enable them to establish common services like research centers, organisation of trade fairs among others.
• Development of commercial facilities: When an industry expands, commercial facilities like banking, insurance, transport and advertising are developed which helps small firms to survive in the long run.
• Development of social and economic infrastructure: The expansion of an industry results in development of infrastructures like roads, communication facilities etc. which help to reduce the average costs of production.
• Economies of information: An industry is in a better position to establish research centers and disseminate the research findings in form of new inventions to the member firms through scientific journals thereby increasing the production efficiency of individual firms and a reduction in cost of production.
• Economies of concentration: Due to concentration of an industry in a particular area, all member firms realise common economies, for instance skilled labour will b available to all firms, transport and communication network, insurance and banking companies are attracted to the area among others.
• Economies of specialisation: Due to the expansion of the industry, individual firms start specialising in different processes and in the end the industry benefits as a whole.
• Transport economies: When the industry expands, individual firms may benefit from the infrastructure net works set up by other firms or by the state.
14.2.3.2 Diseconomies of scale
For relatively large levels of production, a firm tends to experience diseconomies of scale and decreasing returns to scale. These result because an increase in the scale of operations causes an increase in average cost. The disadvantages realised by a firm as a result of expansion leading to higher average costs of production or a fall in the level of output is referred to as diseconomies of scale. They are also divided into internal and external diseconomies.(a) Internal diseconomies
These are the disadvantages or problems faced by a firm which has increased its scale of production. These problems are only experienced by a single firm and they are not shared by other firms in the industry. They include:• Managerial diseconomies: When a firm expands it faces the problem of supervision, coordination, control and communication of decisions, bureaucracy increases, time wastage and rigidity also increases which results into higher costs per unit of output.
• Technical diseconomies: A large firm realises disadvantages of specialisation and incurs high costs of maintaining complicated machines and buying raw materials hence higher average costs of production.
• Financial diseconomies: A large firm may face financial disadvantages especially if funds are not secured in time which delays production and limits expansion of the firm.
• Risk bearing diseconomies: Due to expansion a firm faces more disadvantages in case of uninsurable risks like a war since it loses on a very large scale.
Marketing diseconomies: A large firm faces the problem of scarcity of raw materials, changes in tastes and preferences of consumers, declining demand for its products etc. which may result into higher costs and more losses.
(b) External diseconomies
These are disadvantages realised by a firm from outside due to expansion of the industry. These problems are shared by the firms operating within the industry. They include:
• Labour diseconomies: As an industry expands it becomes more difficult to secure labour with the appropriate skills resulting into higher wages for labour and higher costs of production.
• Marketing diseconomies: As a result of expansion of an industry, competition for markets increases resulting into higher marketing costs and lower profits.
• High demand for raw materials: The expansion of an industry results into higher demand for raw materials hence higher costs of production.
• Scarcity of land: Expansion of an industry creates scarcity of land for expansion for individual firms which increase rent, congestion and transport costs hence higher average costs of production.
Factor prices: When an industry expands, firms will be challenged by the shortage of infrastructure facilities and social amenities. This will mean that the cost of transport and communication will be very high hence leading to high cost of production.
• Pollution diseconomies: The localisation of industries in a particular place or region pollutes environment. The polluted environment acts as a health hazard for the laboratories.
Unit Summary
• Costs were defined as the expenses by a firm to acquire the different production inputs used by the firm.
• Costs were classified into Implicit and explicit costs. Implicit costs are basically social costs that cannot be included in the computation of the firm’s profits like opportunity, time wasted among others.
• Explicit costs is the actual expenditure of a firm that is incurred when purchasing the input factors like cost of raw materials, labour, transport, energy and many others.
• Production periods were discussed that is the short run and the long run. Short run was defined as a period in which a firm cannot change its plant equipment and the scale of operation. In this period some factors are fixed while others are variable.
• Long run on the other hand is the period when all the factors of production are variable.
• Short run costs of the firm were identified as fixed and variable costs where by fixed costs are those which do not vary with the level of output while variable costs are those that vary with the level of output.
• Short run costs are varied to get average fixed costs, average variable costs, marginal costs as well as average total costs.
• The growth of firms was also discussed where by firms can either grow naturally or externally through mergers where two or more firms come together to form a new firm.
• Two types of mergers were identified; horizontal and vertical mergers. A vertical merger occurs when firms at different stages of production integrate while horizontal merger occurs when firms at the same stage of production integrate.
• Advantages of merging were identified which include, economies of scale enjoyed by the merged firms; increased efficiency, ability to undertake research and development, increased competitiveness of merged firms, rationalisation and diversification among others.
• The disadvantages of merging include; diseconomies of scale, low output, limited variety to consumers, high prices among others.• Factors limiting merging were also discussed and they include; fear of diseconomies, market limitation, fear of risks, and fear of losing clients among others.
• Economies and diseconomies of scale were also discussed. Economies of scale are the advantages enjoyed by a firm as a result of expansion and they can either be internal economies or external economies.
• Internal economies are the advantages enjoyed by a firm due to its expansion while external economies are the advantages enjoyed by a firm due to expansion of the industry.
• Internal economies include; technical economies, managerial economies, marketing economies, financial economies, research and development economies among others while external economies include; labour economies, economies of corporation, development of social and economic infrastructure, development of commercial facilities.
• Diseconomies of scale were defined as the disadvantages realised by a firm as a result of expansion and they include; managerial diseconomies, technical diseconomies, risk bearing diseconomies, financial diseconomies, marketing diseconomies among others.Unit Assessment 14
1 (a) Distinguish between the long run and the short run periods of production.
(b) Define the following short run average costs of the firm; fixed costs, variable costs,average costs, total costs and marginal costs.
2 (a) Distinguish between implicit and explicit costs.
(b) Why is the long run cost curve flatter than the short run cost curve?3 (a) Distinguish between horizontal and vertical merging.
(b) Explain the advantages and disadvantages of merging.
4 (a) What are economies of scale?
(b) Explain the different economies of scale clearly indicating whether they are internal economiesor external economies.
UNIT 15 REVENUES AND PROFITS OF A FIRM
Key unit competence: By the end of this unit, you should be able to discuss a firm’s revenues and profit maximisation process.
Activity 15.1
As a class with the help of the teacher, basing your debates on the previous units, divide yourselves into two groups and have discussion on the importance/challengers of studying microeconomics. Make notes and compare the pros and cons of studying microeconomics. Make presentations to the class.
Activity 15.2
In your locality, there are different economic activities that are carried out that involve production of either goods or services. As an Economics student, lists down some of these activities in your area.
(a) Identify both positive and negative factors that affect the production activities. Share your findings with the rest of the class.
(b) What factors that affect production activities do different regions share?15.1: REVENUES
15.1.1: Meaning of revenueActivity 15.3
With the help of your teacher, invite two resource persons to your school. One person from public sector and another from private sector. Listen to them as you also engage them by asking questions. Ask questions like:
(a) Proximate annual cost of production of their firms.
(b) Proximate annual output from their firms.
(c) Proximate annual sales from their firms.
Take notes as they explain and answer your questions. Divide yourselves into groups of 3 students each. Discuss the similarities and differences between these two firms. What name do you give to the excess sales on the cost of the production?Discovery
It is every firm’s objective to maximise profits, sales, revenue and improve the public image. To achieve this, firms try to minimise costs while maximises on the outputs and sales volume. During production process, there are different costs that are involved. After the production, goods are sold to the final users who are the consumers. Different firms produce different volumes of output depending on different factors. After sales, firms can calculate their profits. Profit is the excess of cost of sales that is total sales less total costs. Firms can use the profit to expand the business or invest in other business.Facts
Most of the firms produce their goods and services for sale and to realise profits. When goods are sold, there are proceeds received. Total amount of money value received by a firm or an industry by selling the goods and services is known as the revenue.
For example if Azam industry produces 100 units of a commodity per day and sells it at 20 FRW per unit, then its total revenue is:20 X 100= FRW 2000 per day
15.1.2: Forms of revenue
In economics, there are different forms of revenue and can be classified into three categories such as:1. Total revenue (TR)
This is the total sum of money value received from the sales of various quantities of output of product produced during a given period of time at a certain price level.It can be calculated as the selling price of the firm’s product times the quantity sold in a given period of time.
Total revenue = price × quantity, or letting TR be the total revenue function:
TR (Q) =P (Q) X QWhere Q is the quantity of output sold, and P (Q) is the inverse demand function (the demand function solved out for price in terms of quantity demanded).
Or simply: Total revenue= Total product x price
TR = Q x P2. Average revenue (AR)
This refers to the revenue per unit of output sold. It is obtained by dividing total revenue by output.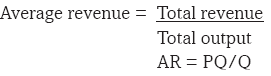
Given that TR will consist of price multiplied by the quantity (P x Q) then:
AR=PQ/Q=PThis implies that the average revenue equals the price. Any curve relating average revenue to output is the same as the demand curve which relates price to output.
3. Marginal revenue (MR)
This refers to the additional revenue from an extra unit of output sold. Or it refers to a measure of the instantaneous rate of change of total revenue with respect to output Q. It is obtained by dividing the change in total revenue by the change in total product.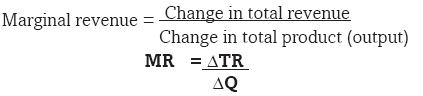
15.1.2.1 Calculation of revenues
Activity 15.4

Copy the above table in your exercise book. Basing on the formulas discussed above for calculating average and marginal revenues, fill the table that you have copied in your exercise book. Make presentations to the class with the help of your teacher. Has the whole class got the same answers as you?
15.1.3: Relationship between total revenue (TR), average revenue (AR) and marginal revenue (MR)
Activity 15.5
In Activity 15.4, we calculated all the revenue from the table given. After calculating the revenues in Activity 15.4 above, what have you noticed? Use the information you obtained in the table above to explain if there is any relationship between total revenue (TR), average revenue (AR) and marginal revenue (MR). Write down the relationship and make presentations to the class.Assuming that the table in Activity 15.4 represents perfect competition market and each unit is sold at same price. Both the marginal and the average revenue are constant. This can be illustrated as below:
15.1.3.1 The revenue position of a perfectly competitive firm
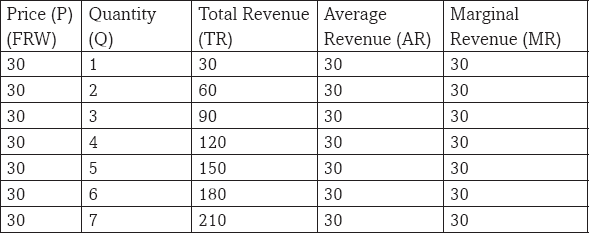
In the above table total revenue (TR) is obtained by multiplying output (Q) and price (P). Average revenue (AR) is obtained by dividing total revenue (TR) by quantity (Q). Under perfect competition market, this relationship between Average and Marginal Revenue can be illustrated in a graph as shown in the figure below.
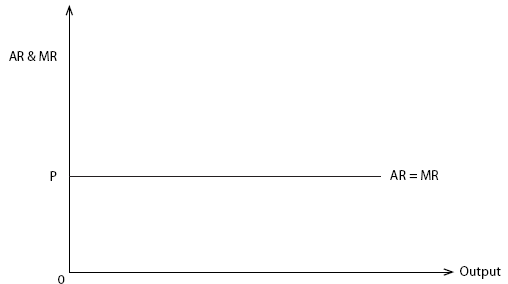
Fig 15.1: Average revenue and marginal revenue curves in a perfectly competitive firm
Under imperfect competition and monopoly market, average revenue is not the same as marginal revenue. It is always greater than marginal revenue at all levels of output. This is because the business persons want to sell more, they must reduce price, not only on the extra units sold, but also on the earlier units. This can be illustrated as in the schedule below:
15.1.3.2 The revenue position of a firm operating under imperfect competition or monopoly
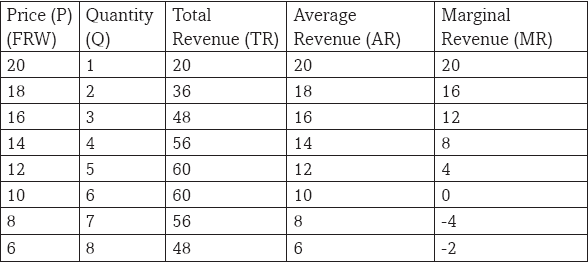
In the table above average and marginal revenues start off as equal but thereafter as the firm sells at a higher level of output, marginal revenue falls further below the average revenue. Both the average and marginal decrease as more is sold. This relationship can be represented in a graph as below:
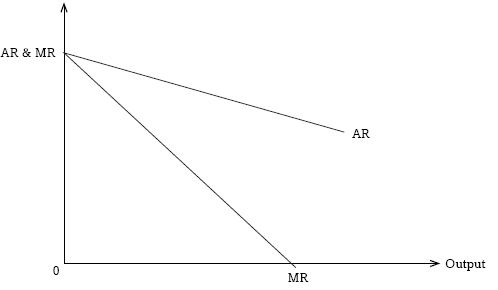
Fig 15.2: Average revenue and marginal revenue curves in an imperfect or monoply firm
15.2: PROFITS
15.2.1: Meaning of profitActivity 15.6
In our discovery in Activity 15.3, we learnt that most firms sell their product in excess to the costs of sale. In pairs, use internet and economic books from the library and carry out research on the concept of profit. Stress up on the meaning of profit and the various forms of profit to a firm. Take notes to use in class discussion.
(a) Basing on your research findings and in a class discussion, explain the concept of profit.
(b) What are some forms of profit you came across?Profit refers to the earnings to an entrepreneur as a factor of production. It is the difference between total revenue received by the firm and the total costs incurred by the same firm. It is the residue which remains after paying all other factors of production. A firm realises profits when its average revenue is greater than average cost.
Remember!!! In the state of nature, profit is the measure of right.
15.2.2: Forms of profit
15.2.2.1 Normal profitThis refers to the minimum level of profits which can maintain a firm in business. It is realised when average cost is equal to average revenue that is AC = AR. Normal profits are also known as the transfer earning or supply price of the firm. It is also called zero economic profits.
If normal profits are earned in an industry in the long run such an industry is said to be in equilibrium under competitive conditions.
15.2.2.2 Abnormal/supernormal profit
This refers to profits which are more and above the normal profits. They are earned if average revenue is greater than average cost. They are also known as monopoly rent if earned in the long run.15.2.2.3 Subnormal profit
This refers to the profits which are lower than normal profits obtained where average cost is greater than average revenue but average revenue is greater than average variable cost that is AC > AR > AVC.15.2.2.4 Windfall profits
These are the unexpected profits realised by a firm either due to an abrupt increase in price, increased in demand for the product or an abrupt fall in the cost of production.15.2.2.5 Gross profit
This is the excess of receipts or sales over the cost of goods sold.15.2.2.6 Pure profit/Net profit
This refers to the residual profit which is left to the firm after deducting all sundry expenses for the gross profit.15.2.3: Profit maximisation of the firm
Activity 15.7
All firms must pay some regard to profits. Carry out individual research on profit maximisation from firms next to your locality. Make notes on your findings. With the rest of the students, discuss profit maximisation of a firm under perfect competition and under monopoly markets.
(a) What similarities do these two markets have in terms of profit maximization?The major objective of any firm that is doing business is to maximise profits. The maximisation of profit corresponds to the accumulation of capital, which is the driving force behind economic activity within the production process. A firm maximises profits when MC=MR and the MC curve should cut the marginal revenue curve from below.
Remember: “Don’t STOP until you reach the TOP. When you reach the TOP do not STOP keep moving UP.”
15.2.3.1 Profit maximisation under perfect competition
Under perfect competition a firm cannot influence the market conditions. It is therefore a price taker. It can only make decisions concerning the output to be sold at the prevailing market price.
Fig 15.3: Marginal cost curve for a perfect competition firm
From the above illustration the firm maximises profits at point B where MC=MR and the profit maximising output is output q2 because it is greater than output q1 and the equilibrium price P which is equal to average revenue and equal to marginal revenue (P=AR=MR).
15.2.3.2 Profit maximisation under monopoly
Under monopoly situation, there is only one seller and the firm’s demand curve is downward sloping to the right and the firm is a price maker. Like any other firm, a firm under monopoly aims at making profits and the profits are maximised when the firm is in equilibrium where MC=MR AR/P and MC cuts the MR curve from below.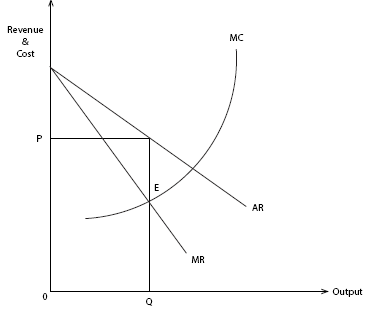
Fig 14.4: Marginal cost, marginal revenue and average revenue curves for a monopoly
From the above illustration the firm maximises profits at point E where
MC=MR and the profit maximising output Q is produced and sold at priceRemember!!! Although every firm aims at profit maximisations, remember:
“The corporate/firm Responsibility: Environmental Preservation; Consumer Protection; Sex and Race Discrimination (they must mean Sex and Race Liberation).”15.2.4 The role of profits in production
1. Profits determine the allocation of resources and ensure efficiency in resource allocation.2. Profits act as a reward to an entrepreneur for undertaking insurable risks and uncertainties in business. In the absence of profits entrepreneurs cannot undertake the initiative to produce goods and services.
3. Profits provide a source of finance for investment and expansion of production units. This is usually in form of retained profits which are ploughed back into the business to facilitate expansion.
4. They stimulate innovation in the production. This is because a firm which innovates realises higher profits which act as an incentive for more innovation, technological progress, resulting into economic growth.
5. Promotes efficiency. The presence of profits results into efficiency in production and allocation of resources where by resources are always removed from unprofitable uses to more profitable uses.
6. Promotion of economic welfare. Profits act as a yardstick to measure economic welfare where by the higher the profits, the higher the productive efficiency and the higher the economic welfare.
7. Profits act as bonus to an entrepreneur for coordinating and combining factors of production in the right quantities so as to maximise output and minimise costs.
8. Profits result into improvement in taxable capacity. As a result of profits government realises more tax revenue due to improvement in economic activity and income of tax payers.
Unit Summary
• Revenue was defined as all the earning to a firm from selling its output.
• Types of revenue were also identified as total revenue, average revenue and marginal revenue.
• Total revenue is the earnings received by a firm from sale of all its output while average revenue is the revenue per unit output sold and marginal revenue is the revenue from an extra unit of output sold.
• The relationship between marginal revenue and average revenue was also discussed in that MR=AR at all levels of output under perfect competition but under imperfect competition AR is always greater than marginal revenue at all levels of output.
• Profit was also discussed and it was defined as the difference between total costs to the firm and its total revenue
• Types of profit was also discussed and they normal profits and abnormal profits. Normal profits are the minimum level of profits which can maintain the firm in business realised when average cost is equal to average revenue and abnormal profits are realised when average revenue is greater than average cost.
• It was also discussed that all firms especially those engaged in business aim at profit maximisation and they maximise profits at a point where MC=MR and MC curve cuts the MR curve from below.Unit Assessment 15
1 (a) Distinguish between total revenue and marginal revenue.
(b) Explain the relationship between average revenue and marginal revenue curves underperfect and imperfect competition. Use illustrations.
2 (a) What is meant by profit? Differentiate between normal profit and abnormal profit.
(b) How does a firm maximise profit under perfect competition?
3 Explain the role of profit in the production process.