General
- Economics S4 SB File Uploaded 28/01/22, 13:13
- S4: Economics TG File Uploaded 11/08/22, 22:20
UNIT 7 EQUILIBRIUM AND PRICE DETERMINATION
Key unit competence: By the end of the unit, you should be able to determine the equilibrium position in the market.
7.1: MEANING OF EQUILIBRIUM PRICE AND EQUILIBRIUM QUANTITY
Activity 7.1
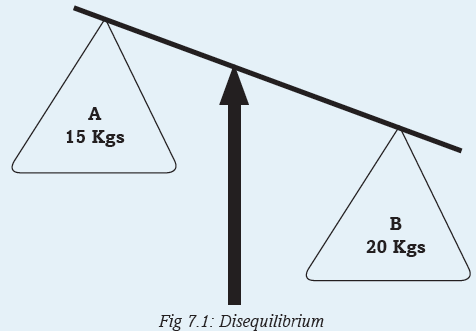
Study the diagram above and give the reasons for the inclination.
(a) What can be done to bring about a balance between the two objects?
(b) Supposing object A represented the number of kilogrammes brought by suppliers and object B represented the number of kilogrammes demanded by buyers of a particular commodity in a market, explain what would happen to the price of such a commodity.
(c) What would you do to bring the two sides to balance?Discovery
We have so far looked at demand and supply in the previous units. We looked at how quantity demanded and quantity supplied relate to price. We explained how each of the two changes and what happens to the curves whenever there is a change in any of the two variables. In this unit, we shall see how interaction of demand and supply brings about a point of stability in the market where the two forces are equal. We shall also look at how a change in one or both of them affects the price in the market.Equilibrium is a point of stability where the forces that exist tend to remain constant without any tendency to change. Equilibrium occurs when different forces acting on the centre tend to be equal. There is a balance between the two forces. In Economics, we may look at different kinds of equilibria. For instance, there is equilibrium price and equilibrium quantity, equilibrium level of national income, equilibrium of an industry, equilibrium of a firm and unemployment equilibrium.
In Unit 5, we looked at how prices are determined in the market by the forces of demand and supply. Buyers meet with sellers in the market and each negotiates to satisfy his or her interest. Buyers want to maximise satisfaction at the lowest possible price. Sellers want to maximise profits by selling at the highest possible price. When the market forces are left to operate freely without any interference, there will be continuous adjustments until a point where stability is attained.
Activity 7.2
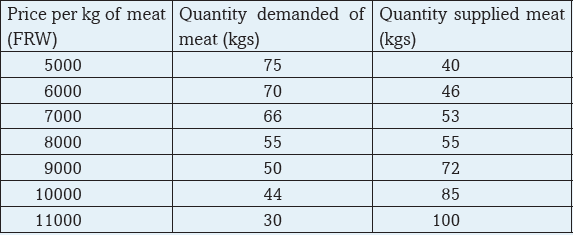
Basing on the knowledge you derived from the previous two units, use the information in the table above to illustrate the supply and demand curve on the same graph.
On your graph, identify the equilibrium point, equilibrium price and equilibrium quantity.Activity 7.3
Given that when the price of meat is 2000 FRW, quantity demanded is 190kg and quantity supplied is 130 kg. For any 100 FRW increase in price, quantity demanded reduces by 4kgs while quantity supplied increases by 8kgs. In groups of four, derive a demand and supply schedule using the above information. Use it to determine the equilibrium price and quantity in the market. Illustrate your findings on a graph.Discovery
Equilibrium price is that price ruling in the market where quantity supplied is equal to quantity demanded. At that price, the amount of commodities brought to the market by suppliers is wholly bought by the buyers, leaving no excess or shortages in the market.Equilibrium price and quantity occur when quantity demanded is equal to quantity supplied.
From the table in the activity above, as the price keeps increasing, buyers are willing to purchase less of the kilogrammes of meat. On the other hand, suppliers are ready to bring more and more to the market as the price increases. When the price reaches 2500 FRW for a kilogramme, the quantity demanded by buyers is equal to what is supplied by the sellers at 170 kilogrammes. At this point, the market is said to be in equilibrium.
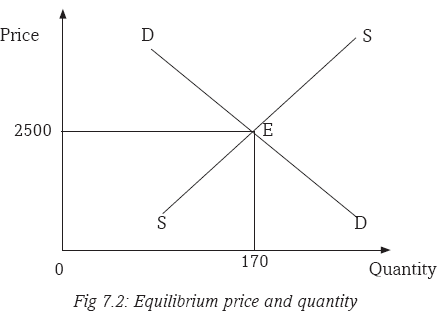
Where
E = Equilibrium point where quantity demanded is equal to quantity supplied.
2500 = Equilibrium price.
170 = Equilibrium quantity.
At the equilibrium point (E), quantity demanded and quantity supplied are equal.However, there could be disequilibrium where the two forces are not equal. Disequilibrium may be either a shortage (excess demand) or a surplus (excess supply).
When quantity demanded is greater than quantity supplied, then, there is a shortage of commodities in the market. In the figure 7.3, quantity demanded is Q2 but quantity supplied is Q4 at price P1. A shortage of commodities in the market implies that buyers will compete for the available few commodities. This scenario leads to an excess demand. They will be ready to pay a high price. This excess demand will lead to price increase.
When quantity supplied is greater than quantity demanded, there is a surplus of commodities in the market. In the figure 7.3, quantity demanded is Q1 while quantity supplied is Q2 at price P2. Suppliers have a lot of commodities to sell. Buyers are ready to purchase less quantities compared to what the sellers have to offer. This scenario leads to an excess supply. This excess supply of commodities will force the price to go down. Suppliers will be ready to reduce the price of their commodities so that they can attract buyers.
In the long-run, once excess demand and excess supply have been dealt with, the market will remain in a state of equilibrium.

7.2: EQUILIBRIUM EQUATIONS
Activity 7.4

Use the functions in the table to determine whether there is equilibrium in each set of equations. Illustrate your findings.
7.3: EFFECTS OF CHANGES IN DEMAND AND SUPPLY ON EQUILIBRIUM
Activity 7.5
Increase in transport costs reduced the supply of milk by 60% at constant prices. Decrease in consumer’s disposable incomes reduced milk demand by 30%. Examine the above market conditions in relation to demand and supply of milk and the equilibrium point and provide an illustration.In Units 5 and 6, we looked at changes in demand and changes in supply and what may bring about the two. A change may be an increase or a decrease.
An increase or decrease in demand is brought about by changes in the factors that influence demand, other than the commodity’s price. An increase or decrease in supply is caused by changes in factors that influence supply, other than the price of the commodity.In this unit we shall analyse how changes in demand or supply will affect the equilibrium. These changes may lead to the extension or contraction of the equilibrium.
7.3.1 Increase in demand
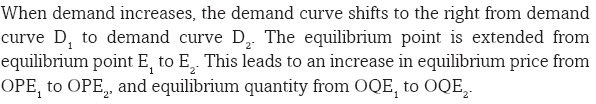
Increase in demand shifts the demand curve to the right. It may be due to increase in the size of the population, increase in consumers income, government subsidising consumers, reduction in both direct and indirect taxes, reduction in the price of a complementary good, increase in the price of a substitute good, a favourable change in the buyers’ tastes and preferences, or a favourable change in seasons.When the demand curve shifts to the right, the equilibrium is extended. This leads to an increase in the equilibrium price and equilibrium quantity.
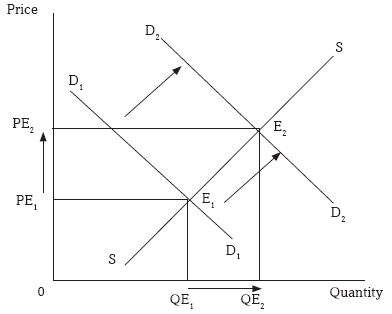
Fig 7.4: Increase in demand and extension of equilibrium
7.3.2 Decrease in demand
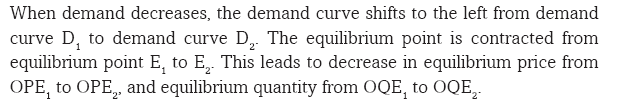
A decrease in demand makes the demand curve to shift to the left. It may be due to decrease in the size of the population, decrease in consumers income, reduction in government subsidies to consumers, increase in both direct and indirect taxes, increase in the price of a complementary good, decrease in the price of a substitute good, unfavourable changes in the buyers’ tastes and preferences, or unfavourable change in seasons.When the demand curve shifts to the left, the equilibrium is contracted. This leads to a decrease in the equilibrium price and the equilibrium quantity.

Fig 7.5: Decrease in demand and contraction of equilibrium
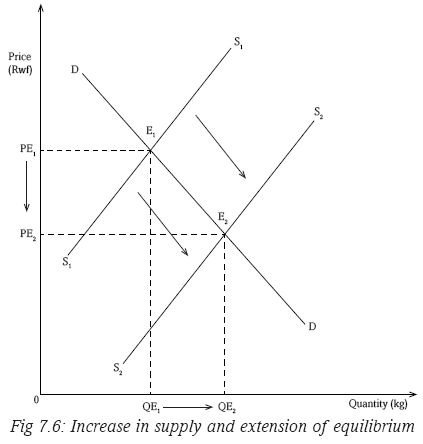
7.3.3 Increase in supply
Increase in supply shifts the supply curve to the right. This will lead to increase in the equilibrium quantity and decrease in the equilibrium price.An increase in supply of a commodity may be brought about by an increase in the number of producers, improvement in technology, entry of new firms into the industry, decrease in taxes on producers which reduces their production costs, favourable natural factors, increase in demand for the commodity, change in goals of the firm, decrease in prices of factors of production, or increase in price of jointly supplied commodities.

7.3.4 Decrease in supply
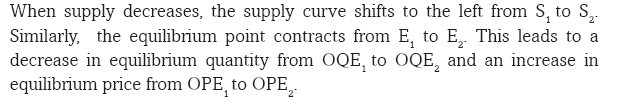
Decrease in supply shifts the supply curve to the left. The equilibrium point contracts to the left. This will lead to decrease in the equilibrium quantity and increase in the equilibrium price.A decrease in supply of a commodity may be brought about by a decrease in the number of producers, decline in technology, exit of new firms from the industry, increase in taxes on producers which increases their production costs, unfavourable natural factors, decrease in demand for the commodity, change in goals of the firm, increase in prices of factors of production, or decrease in price of jointly supplied commodities.
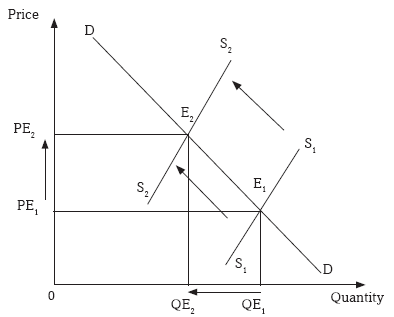
Fig 7.7: Decrease in supply and contraction of equilibrium.
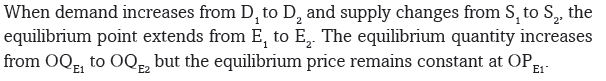
7.3.5 Change in demand and supply by the same margins
When both demand and supply change by the same margins and in the same direction, the equilibrium point changes. However the equilibrium price remains almost the same. The equilibrium quantity either increases or decreases.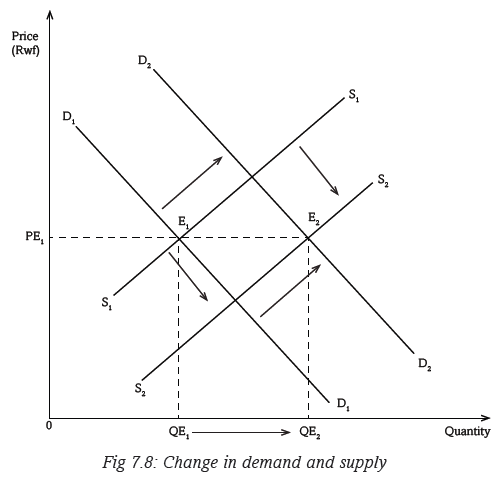
Due to the factors that influence both variables, the two may change by either increasing or decreasing. If the two change in the same direction and by the same degree, the equilibrium price remains constant.
Recall
In a market place, different people with different backgrounds, behaviour, character, and interests meet as either buyers or sellers. In this era of HIV/AIDS which advice can you give to such congregation as an Economics student?Unit Summary
In the whole unit, the following were covered:
• Equilibrium
• Equilibrium price
• Shortage in a market
• Surplus in a market
• Equilibrium quantity
• Change in demand and supply
• Effects of change in demand and supply or equilibrium.Unit Assessment
1. Distinguish between equilibrium price and equilibrium quantity.
2. Given the schedule below, derive a curve illustrating the equilibrium price and equilibrium quantity.
3. Given the functions that Qd-4p=136 and Qs=6p+124,
(i) Determine equilibrium price and equilibrium quantity.
(ii) Illustrate your findings on a curve.
4. Increase in transport costs reduced the supply of milk by 20% at constant prices while a decrease in consumer’s disposable incomes reduced milk demand by 10%. Illustrate the above market condition in relation to equilibrium price and equilibrium quantity of milk.