General
- Economics S4 SB File Uploaded 28/01/22, 13:13
- S4: Economics TG File Uploaded 11/08/22, 22:20
UNIT 6 THEORY OF SUPPLY
Key unit competence: By the end of the unit, you should be able to analyse the determinants of supply in the market.
6.1 MEANING OF SUPPLY
Activity 6.1
Study the following passage and answer the questions that follow.
Malaria has been identified as one of the killer diseases in Africa. In trying to find a solution to completely curb this disease, our government managed to get both curative and preventive measures. Some of these measures were: sleeping under a treated mosquito net, draining all stagnant water, using insecticides specifically the ones used to kill mosquitoes and using drugs upon permission by the medical practitioners, for the sick.A company was given the mandate to supply mosquito nets and drugs countrywide. It was later realised that some areas did not get the drugs nor the mosquito nets. In addition, some areas had plenty of these facilities, others had less and other areas had nothing at all. Prices also differed from one area to another.
(a) Which other ways can be used to prevent malaria?
(b) Discuss why some areas had plenty of the materials than others.
(c) Do you think the company was justified in supplying the materials the way it did? Give reasons to defend your answer.
(d) Analyse the different factors that may influence the distribution of the materials brought into the market by producers.In the previous unit, we analysed the relationship between price and quantity demanded. The two have an inverse relationship. In the supply theory, we are going to analyse the relationship between price and quantity supplied. There is a direct relationship between demand and supply. What is supplied by producers in the market is demanded by consumers.
In the chain of distribution of goods and services, there are different parties and activities involved. The parties involved include the producer/manufacturer, the wholesaler, the retailer, and then the consumer. Goods are transported from production centres to storages facilities or warehouses and then to the market.
Most important of the above parties is the producer. He or she combines resources to come up with finished products. In today’s monetary economies, most of this output is offered for sale in markets. The study of Supply Theory helps us understand how the producers handle their supplies in the market to achieve their basic aim of profit and sales maximisation.
Supply refers to the amount of goods and services that are available in the market. Quantity supplied refers to the amount of a particular commodity that producers/suppliers are able and willing to bring to the market for sale at a certain price in a given period of time. The ability to produce commodities requires resources. The willingness to supply commodities is majorly influenced by price.
6.2. FACTORS THAT INFLUENCE SUPPLY
Activity 6.2
Millennium Bakery Ltd, a producer of bread in Rwanda, uses wheat flour and sugar as the main ingredients. In your groups, examine what will happen to the price and amount of bread in markets in Rwanda if the following events took place.
(a) Because of the East African Common Market protocol, Hot Loaf Bakery Ltd from Uganda and Super Loaf Ltd from Kenya enter the Rwandan market.
(b) Pembe Rwanda Ltd, importers of wheat into Rwanda gets access to cheaper sources of wheat.
(c) As a result of environmental degradation like deforestation and silting of water bodies, there are long spells of drought that affect wheat and sugar plantations.
(d) The parliament passes a bill that imposes a very high minimum wage.
(e) There is introduction of new and more efficient machines in the bakery industry.
(f) Taxes on inputs are reduced.(g) Because of government efforts on encouraging and promoting young entrepreneurs, more youth form their cooperatives and start up their own bakeries.
The number of people who prefer to consume bread to other consumables increase.
(i) The demand for cakes, a substitute of bread reduces.Activity 6.3
In a recent visit to INYANGE INDUSTRIES LTD in Kigali city, we found that their output has more than doubled in the last two years.
In your groups, discuss the factors that may have made INYANGE INDUSTRIES LTD, produce and supply to the market more of its products.Discovery
The following are the main factors that influence supply of a commodity:
1. Price of the commodity
2. Cost and availability of factors of production
3. Goals of the firm
4. Level of technology
5. Change in prices of relates goods
6. Government influence
7. Seasonal changes
8. Number of producers
9. Freedom of entry of new firms into the industry
10. Gestation period
11. Demand for the commodityFacts
1. Price of the commodity
The higher the price, the higher the quantity supplied and vice versa, ceteris paribus. When the market price for a commodity increases, it becomes more profitable to supply such a commodity. Therefore, the supplier will be willing to produce and supply more which increases quantity supplied of such a commodity.
2. Cost and availability of factors of production
In order to produce and supply, producers require resources like labour, raw materials, power, land, storage facilities etc, all of which are called factors of production. When factors of production are cheap and readily available, producers are able to produce more and supply increases. When factors of production are scarce and expensive, the capacity of producers to produce becomes low and supply reduces.3. Goals of the firm
The producer aims at profit maximisation. Profits can be maximised either by selling less output at high prices or by selling more output at low prices. Profit maximisation through sales maximisation lowers profit per unit but increases profit through high sales. Thus it increases the quantity supplied. Profit maximisation through high prices increases the profit margin per unit but reduces the quantity supplied.4. The level of technology
When firms use advanced and more efficient methods of production, the amount of commodities produced and brought to the market increases. For instance, in the agricultural sector, the use of tractors, combine harvesters, irrigation, spraying pumps and other machines increases quantity supplied. The use of inefficient, slow and poor methods of production keeps quantity supplied very low e.g use of a handhoe.5. Change in prices of related products
When commodities are jointly supplied, a change in price of one influences the supply of another. For instance, increase in the price of beef may lead to increase in the supply of skins because the two commodities are supplied together. A change in the price of commodities that use the same resources to be produced also affect the supply of each other.6. Government influence
Activity 6.4
With reference to question (f) in Activity 6.2, in your groups, examine the many ways that the government may use to influence the quantity supplied of a commodity in a market. Make class presentantions.The government may influence the supply of a commodity in different ways. Some of these ways are:
(a) Imposing high taxes on production: This reduces production and supply by increasing the costs of production. Production becomes expensive when taxes on it are increased.
(b) Offering subsidies: The government can offer subsidies to producers. This increases their production capacity. This increases supply by reducing costs of production.
(c) Protecting local industries: The government can protect and motivate local producers of commodities by stopping the importation of similar products in the market. The government can also impose very heavy unseen costs on imported goods, so that the importers are unable to make profit from the sale of the imported goods, thereby giving up along the way.
(d) Quota system: The government, through this system, ensures that at no time, the level of imports exceeds the required quantities. In addition the government ensures that imported goods do not eliminate locally manufactured goods in the market.7. Seasonal changes
In the agricultural sector, production, especially in developing economies largely depends on physical conditions. When seasonal/ natural factors are favourable supply increases. When they are unfavourable, supply decreases.8. The number of producers
When producers are many, their capacity to produce is high and strong. When producers are few, supply remains low.9. Degree of freedom entry of new firms into the industry
Activity 6.5
Refer to question (a) in Activity 6.2. Analyse the effect of the following in relation to the supply and price of bread:
(a) Entry of Super Loaf Ltd from Kenya and Hot Loaf Ltd from Uganda into the Rwandan bread market.
(b) If the above firms and many others withdrew from the Rwandan market.
Make class presentations after your analysis.Some industries have entry barriers in form of start up costs, patents, technology, and/or limit pricing by the already existing firm. When there is freedom of entry of new firms into the industry supply increases. Restricted entry of new firms keep supply low.
10. Gestation period
This is the duration between the time when the decision to produce and supply a commodity is taken and the time when output is actually produced and supplied. A long gestation period reduces supply in the current period. A short gestation period increases supply in the current period.11. Demand for the commodity
There is a direct relationship between demand for a commodity and its supply. Increase in demand for a commodity makes it more profitable as it will increase its price. This increase in demand encourages producers to produce more output to satisfy the available demand. On the other hand, a decline in demand for a commodity discourages its production and supply.6.3. LAW OF SUPPLY
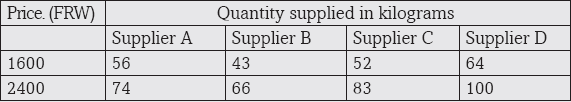
On a recent visit to Nyarugenge market, we carried a survey of the price of rice and the amount of rice brought into the market by the suppliers and derived the following table.

Studying the table above, how do you relate price to the amount of rice supplied to the market? Give reasons for your answer.

The law of supply states that the higher the price, the higher the quantity supplied and the lower the price, the lower the quantity supplied, ceteris paribus. When other factors that may influence supply are held constant, when the price increases, producers produce and supply more. The reverse is true.
Recall
Why do suppliers or producers bring more qunatities to the market at high prices than at lower prices?6.4. THE SUPPLY SCHEDULE
Activity 6.7
Using the information in Activity 6.6, draw a table showing respective price levels and their amount supplied in their ascending order.
Study your table and derive a comment. Compare your comment and the comments you made in the previous activity and those of the other students.Facts
A supply schedule is a table that shows different quantities of a commodity that a producer can supply at different prices per period of time. It shows the relationship between price and quantity supplied of a commodity. It can be illustrated as shown in Activity 6.6.6.5 THE SUPPLY CURVE
Activity 6.8
(a) Using the information in Activity 6.6, draw a supply curve.
(b) Comment on the shape of your curve.
Compare the comments you have made in the three activities and make a conclusionThe supply curve is a graph that shows different quantities of a commodity that suppliers/ producers are able and willing to bring to the market at different prices over a given period of time. It is a graphical representation of the supply law. It is upward sloping from left to right illustrating the supply law.
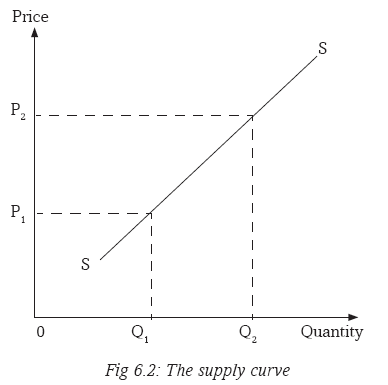
When the price increases, and production costs remain constant, production becomes more profitable. Profits per unit supplied increase. Thus the producer gets an incentive to produce and supply more to make more profits. Profit enjoyed by the existing firm motivates it to produce more.
When prices increase, firms enjoy profits, new entrants are attracted to enter into the industry and reap the available profit chance assuming there are no entry barriers. This in the end increases output produced and supplied on the market. The two events give the supply curve its upward sloping shape.
On the other hand however, when prices reduce, production becomes less profitable. Producers tend to curtail their production. Some firms exit the industry. This therefore reduces the quantity produced and supplied.
6.6: INDIVIDUAL AND MARKET SUPPLY SCHEDULES AND THE CURVES
Activity 6.9
(a) In your groups, using the knowledge acquired from the lessons on demand, generate your own figures and illustrate three individual supply schedules.
(b) Using the figures from the individual supply schedules generated by your group, present an illustration of a market supply schedule and a market supply curve.Facts
1. A supply schedule as explained above is a table showing the different quantities supplied by to the market at given prices.
2. An individual supply schedule is a table showing the various quantities of a given commodity supplied in the market by a specific producer at the given prices. It represents a single supplier in the market. This means if the market has more than one supplier, then every supplier will have his or her own supply3. A market supply schedule is a table that shows a total of different quantities of a commodity that different producers can supply to the market at different prices at a given period of time. It represents all suppliers for a particular commodity in a market.
4. An individual supply curve is a graph that shows the various quantities supplied by the individual supplier at the given prices. This graph normally has a curve moving upwards from the bottom left to the top right.
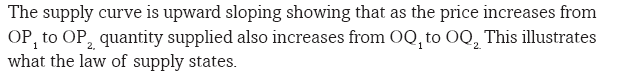
5. A market supply curve is a graph that shows the amount of a commodity that different suppliers can offer at different prices. It shows the total amount that different suppliers will be able to supply at different prices.chedule.
Table 6.1: The supply schedule

The above market supply curve shows the different quantities supplied by the two suppliers A and B at different prices
6.7 ABNORMAL SUPPLY CURVES
Group activity 6.10
1
(a) Draw a graph using the information above.
(b) What is the shape of your curve?
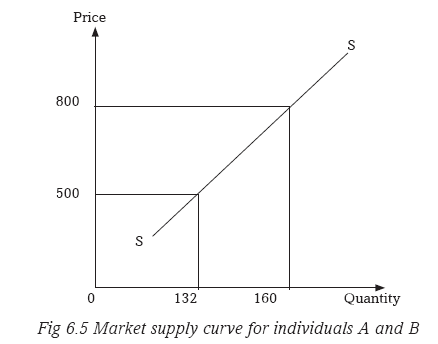
(c) Compare your curve with the curve you illustrated in Activity 6.7. What is the difference?2
(a) Illustrate the data in the table above on the supply curve.
(b) Study the slope of your curve and compare it with the one you drew in (1) above.
(c) Compare the two curves with the one in Activity 6.7. Comment on the shape of the curves.Normally, when the price of a commodity in the market increases, the quantity supplied in the market also increases. However, under certain conditions, the price of a commodity may increase but quantity supplied either remains the same or even reduces. This will result into a curve that does not obey the law of supply. Curves that do not obey the law of supply are called abnormal or regressive supply curves. Such curves appear under the following conditions.
6.7.1. Fixed supply in the short run
Group activity 6.11
Using question one of Activity 6.10, explain the factors that may explain the slope of the curve that you drew.
Make a class presentation.Facts
Production and supply of a commodity requires time. The producer has to organise resources with which to produce and supply. When the time available is not enough to allow the producer organise and increase production and supply, quantity supplied may remain constant despite the increase in price of the commodity. In this case, the curve may appear as shown below.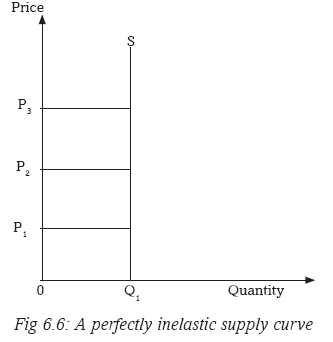
6.7.1.1 The supply of land in the short run
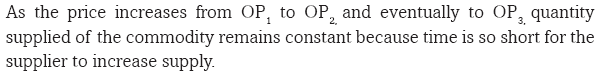
Land as a factor of production refers to all God made resources above, on, and under the surface of the earth that are used in the production process. It includes soils, minerals, even rain. In the short run, the supply of land is fixed and its supply curve is perfectly inelastic as shown in the figure above.6.7.2. The backward bending supply curve of labour
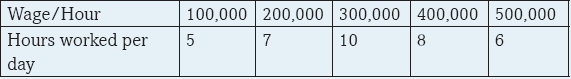
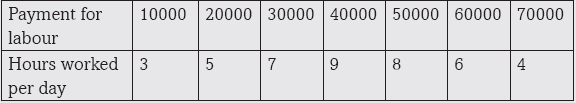
Activity 6.12
Use the information in Question 2 in Activity 6.10 to draw a curve. Compare the slope of your curve and the slope of the curve you drew in Activity 6.6.
In your groups, discuss and identify the factors that may have made the curve to appear the way it is.Labour has an abnormal supply curve. The supply curve of labour bends backward at high wages. When labour is paid a high wage, there is a tendency for workers to reduce the number of hours worked per day.

The supply curve of labour bends backwards when wages are increased because of the following reasons:
(i) Increase in wages stimulates a strong preference for leisure to work. At high wages, workers tend like more of leisure than work so they work for less hours.(ii) Presence of target workers. When the wage is increased, workers achieve their targets quickly and start working for less hours after achieving their targets.
(iii) When there is insecurity in the area where the job is located. This threatens workers who may reduce their hours of work irrespective of the increase in wages.6.8: CHANGE IN SUPPLY
Activity 6.13
‘In December last year, the price of milk in Kigali remained constant at 400 FRW per litre. However the amount of milk brought to the city rose from 100,000 litres to 180,000 litres per day. In groups;
(a) Discuss and make a presentation of the factors that may have brought about this increase in the amount of milk supplied to the city.
(b) Illustrate the above phenomenon on a curve.A change in supply refers to increase or decrease in the amount of a commodity supplied in the market at a particular time at a constant price.
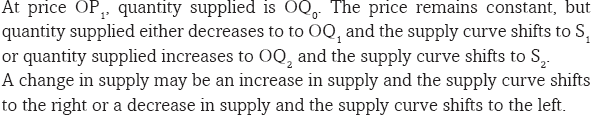
The price of the commodity does not change, but because of changes in the other factors that influence supply, the quantity supplied either increases or reduces. In a change in supply, the price of the commodity remains constant, the supply curve shifts either to the right (indicating an increase in supply) or
to the left (indicating a decrease in supply), quantity supplied changes.
6.8.1: Increase in supply
Activity 6.14
The price of AGASHYA juice in Kigali markets remained constant. However, the quantity of the AGASHYA juice supplied by Urwibutso Nyarangarama-Sina Gerard Enterprises Ltd increased by 65%.
Explain the factors that may have been responsible for this increase. Make a presentation to the class thereafter.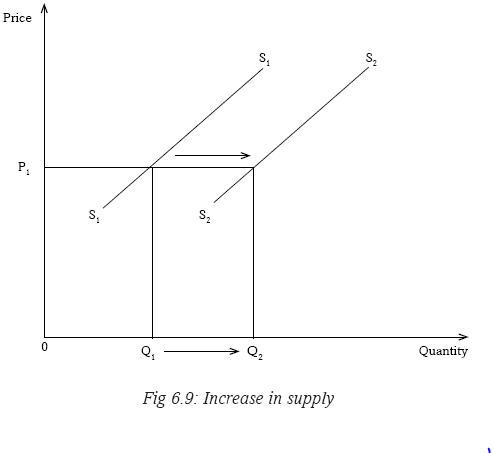
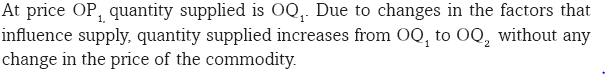
An increase in supply of a commodity may be brought about by an increase in the number of producers, improvement in technology, entry of new firms into the industry, decrease in taxes on producers (which reduces their production costs), favourable natural factors, increase in demand for the commodity, change in goals of the firm, decrease in prices of factors of production, increase in price of jointly supplied commodities or government support.
6.8.2 Decrease in supply
Activity 6.15Refer to the previous activity and analyse how the factors that you advanced can be responsible for a reduction in the amount of juice produced by the same firm.

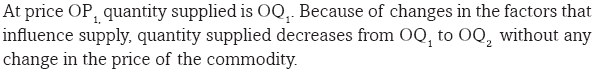
A decrease in the supply of a commodity may be a result of decrease in the number of producers, decline in technology exit of some firms from the industry, increase in costs of production due to increase in taxes on producers, unfavourable natural factors, decline in demand for the commodity, change in goals of the firm, increase in prices of factors of production, increase in the price of a competing commodity, decrease in prices of jointly supplied commodities or government influence.
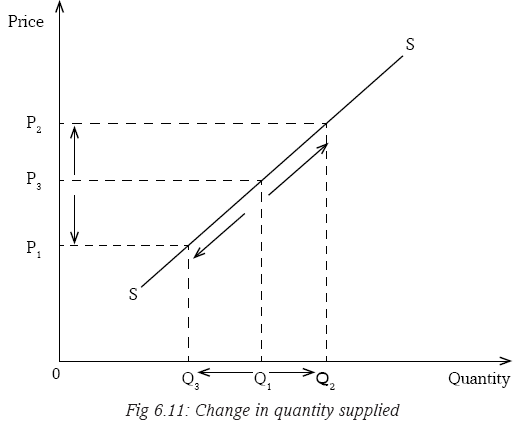
6.9: CHANGE IN QUANTITY SUPPLIED
Activity 6.16The price of rice doubled from 1000FRW per kilogram to 2000FRW leading to increase in the quantity supplied of rice from 240 bags to 400bags of rice per day.
(a) Illustrate the above on a curve.
(b) Identify the factor that was responsible for this change in the quantity supplied of rice.Change in quantity supplied refers to increase or decrease in the amount of a commodity supplied to the market as a result of changes in its price. In a change in quantity supplied, there is a price change which results into a change in the amount supplied. There is a movement along the same supply curve either downwards to the left which indicates a decrease or upwards to the right which shows an increase.

6.10. TYPES OF SUPPLY
Activity 6.17‘Inyange industries Ltd are the producers of Inyange Packed Milk and Inyange Fruit Juice. They have hectares of land which they use in the production of the two products.’
(a) Discuss how increase in the price of milk will affect the production and supply decisions of Inyange Industries Ltd in regard to juice production.
(b) If Inyange Industries Ltd diversified its production to include beef production, and used the piece of land to produce beef, explain what would happen to the supply and price of skins.1. Competitive supply
This is the supply of two commodities that use the same resources such that increase in the production and supply of one reduces the resources available for the production and supply of another. For instance, in the activity given above, when Inyange Industries Ltd decides to allocate more of its resources to the production of milk, the supply of fruit juice will reduce because more of the land will go to cow rearing.2. Joint supply
Activity 6.18Assume Inyange Industries Ltd has taken a decision to diversify its production by entering the beef production industry.
In your groups, discuss how this decision by Inyange Industries Ltd will affect the following:
(a) The supply of beef.
(b) Price of beef.
(c) The supply of skins.
(d) Price of skins.This is the supply of two commodities that are produced together such that increase in supply of one leads to increase in supply of another for instance the supply of beef and skins.
Remember !!
Efficient use of resources to produce and supply commodities require good production practices that can ensure environmental sustainability.
High financial and budgetary discipline is essential for the growth and expansion of private and public savings and investments.Unit Summary
The following aspects were covered in this unit:• Supply
• Quantity Supplied
• Price
• Gestation Period.
• Supply Curve
• Abnormal Supply Curves
• Backward Bending Supply Curve Of Labour.
• Change In Supply
• Change In Quantity Supplied.
• Competitive Supply.
• Joint Supply.Unit Assessment 6
1. Distinguish between supply and quantity supplied.
2. The price of commodity X remained constant at 700 FRW per kilogram but the quantity supplied of it in the market reduced by 40%. Explain the factors that may have caused this decline in supply.3.
Use the data in the above schedule to illustrate a market supply curve.
4.
Use the information in the table above to illustrate the supply curve.