UNIT 5 : Linear equations and inequalities
Key unit competenceModel and solve algebraically or graphically daily life problems using linear equations or inequalities.
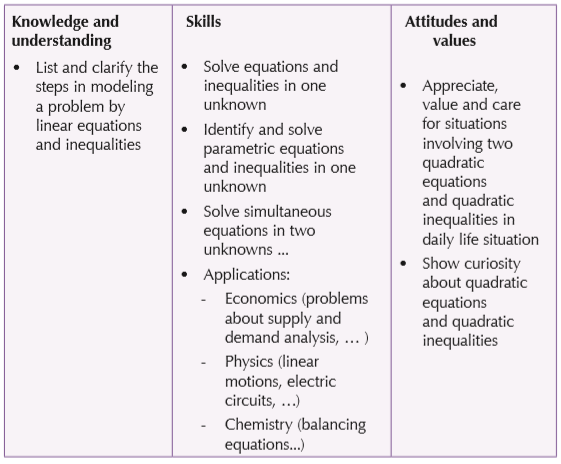
Learning objectives
5.1 Equations and inequalities in one unknown
In Junior Secondary, we learnt about linear equations and inequalities.
Activity 5.1
Research on the following:
1. What is a linear equation?
2. What is a linear inequality?
Present your findings, with clear examples, to the rest of the class.
Linear equations
A linear equation is an equation of a straight line. For example:

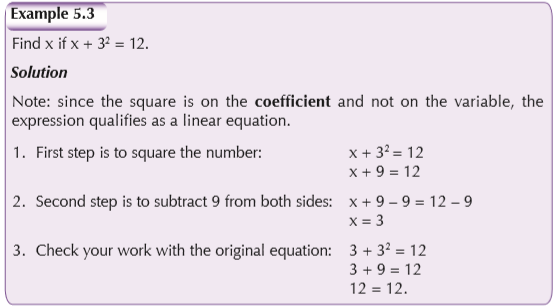
Solving linear equations
• A linear equation is a polynomial of degree 1.
• In order to solve for the unknown variable, you must isolate the variable.
• In the order of operation, multiplication and division are completed before addition and subtraction.

Activity 5.2
Discuss in groups and verify that the following are true.
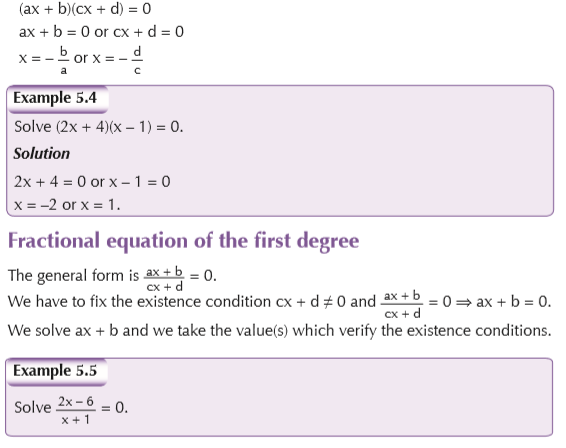
Product equation
This is in the form (ax + b)(cx + d) = 0.
Since the product of factors is null (zero) either one of them is zero. To solve this we proceed as follows:
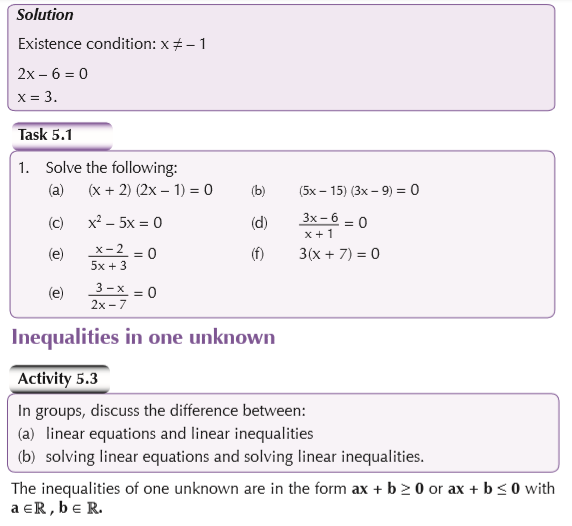
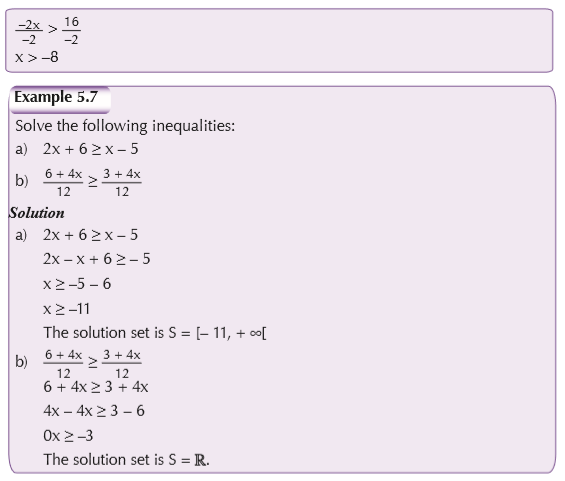
Solving inequalities
They are solved as linear equations except that:
(a) when we multiply an inequality by a negative real number the sign will be reversed
(b) when we interchange the right side and the left side, the sign will be reversed.

Graphs
The graph of a linear inequality in one variable is a number line. We use an unshaded circle for < and > and a shaded circle for ≤ and ≥. The graph for x > –3:

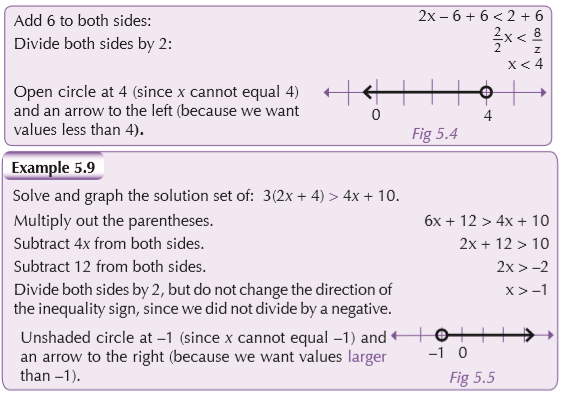
Figure 5.6 shows a graph of a linear inequality.
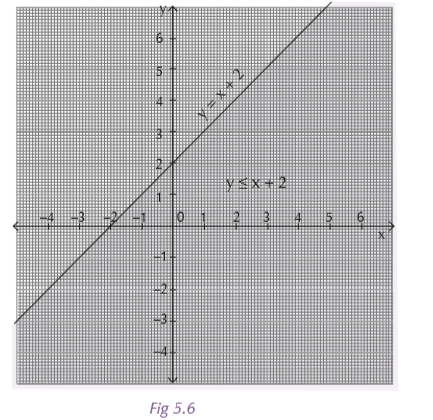
The inequality is y ≤ x + 2.
You can see the line, y = x + 2 and the shaded area is where y is less than or equal to x + 2
5.2 Parametric equations and inequalities
Activity 5.4
Carry out research. Find the meaning of parametric equations and inequalities. Discuss your findings using suitable examples.
Parametric equations
There are also a great many curves that we cannot even write down as a single equation in terms of only x and y. So, to deal with some of these problems we introduce parametric equations. Instead of defining y in terms of x i.e y = f(x)) or x in terms of y i.e x = h
we define both x and y in terms of a third variable called a parameter as follows:
This third variable is usually denoted by t (but does not have to be). Sometimes we will restrict the values of t that we shall use and at other times we will not. If the coefficients of an equation contain one or several letters (variables) the equation is called parametric and the letters are called real parameters. In this case, we solve and discuss the equation (for parameters only).
Each value of t defines a point (x, y) = (f(t),g(t)) that we can plot. The collection of points that we get by letting t be all possible values is the graph of the parametric equations and is called the parametric curve.

Graphs
Sketching a parametric curve is not always an easy thing to do. Let us look at an example to see one way of sketching a parametric curve. This example will also illustrate why this method is usually not the best.
Activity 5.5
In groups of five, work out the following.
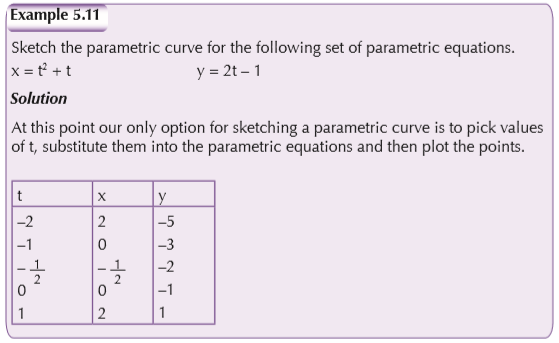
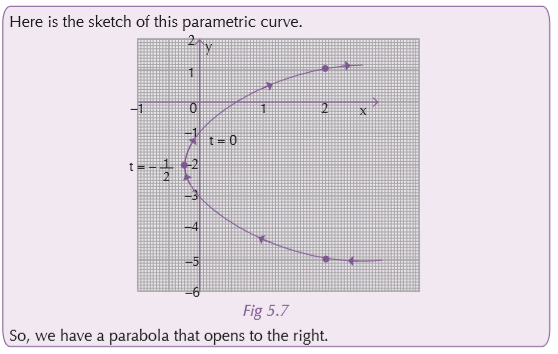
1. Sketch the parametric curve for the following set of parametric equations.
x = t2 + t y = 2t – 1 –1 ≤ t ≤1
2. Eliminate the parameter from the following set of parametric equations.
x = t2 + t y = 2t – 1
3. Sketch the parametric curve for the following set of parametric equations. Clearly indicate the direction of motion.
x = 5 cost y = 2 sin t 0 ≤ t ≤ 2π
Parametric inequalities in one unknown

5.3 Simultaneous equations in two unknowns
Mental task
What are simultaneous linear equations? How do we solve them?
A linear equation in two variables x and y is an equation of the form
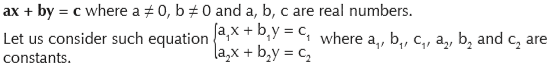
We say that we have two simultaneous linear equation in two unknowns or a system of two linear equation in two unknowns.
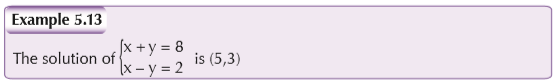
The pair (x, y) satisfying both equations is the solution of the given equation.
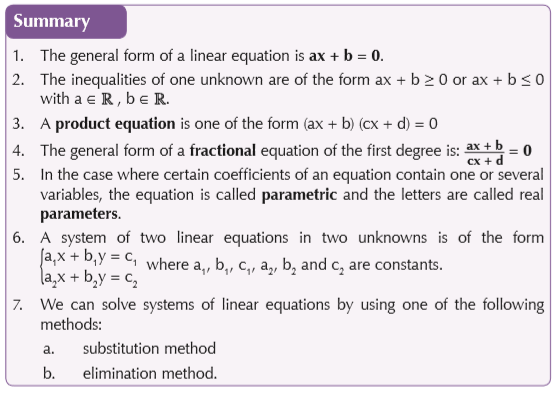
We can solve such systems of linear equations by using one of the following methods:
1. substitution method
2. elimination method.
Substitution
This method is used when one of the variables is given in terms of the other.
Elimination
Elimination method is used to solve simultaneous equations where neither variable is given as the subject of another.

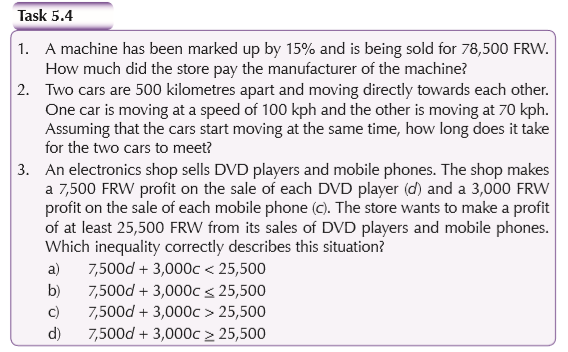
5.4 Applications
Systems of two equations have a wide practical application whenever decisions arise. Decisions of this nature always involve two unknown quantities or variables. The following steps are hereby recommended in order to apply simultaneous equations for practical purposes.
1. Define variables for the two unknown quantities, in case they are not given.
2. Formulate equations using the unknown variables and the corresponding data.
3. Solve the equations simultaneously.

Activity 5.6
Linear equations and inequalities have their use in our everyday life. Research on these and present your findings for discussion in class.
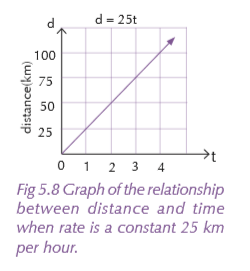
Distance = rate × time
In this equation, for any given steady rate, the relationship between distance and time will be linear. However, distance is usually expressed as a positive number, so most graphs of this relationship will only show points in the first quadrant. Notice that the direction of the line in the graph of Figure 5.8 is from bottom left to top right. Lines that tend in this direction have positive slope. A positive slope indicates that the values on both axes are increasing from left to right.
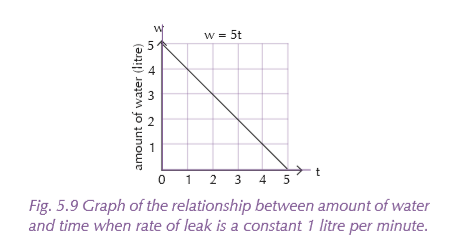
Amount of water in a leaking bucket = rate of leak × time
In this equation, since you cannot have a negative amount of water in the bucket, the graph will also show points only in the first quadrant. Notice that the direction of the line in this graph is top left to bottom right. Lines that tend in this direction have negative slope. A negative slope indicates that the values on the y axis are decreasing as the values on the x axis are increasing.
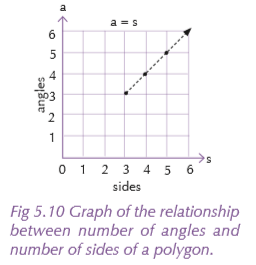
Number of angles of a polygon = number of sides of that polygon
In this graph, we are relating values that only make sense if they are positive, so we show points only in the first quadrant. In this case, since no polygon has fewer than 3 sides or angles, and since the number of sides or angles of a polygon must be a whole number, we show the graph starting at (3,3) and indicate with a dashed line that points between those plotted are not relevant to the problem.
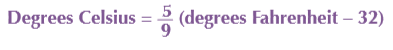
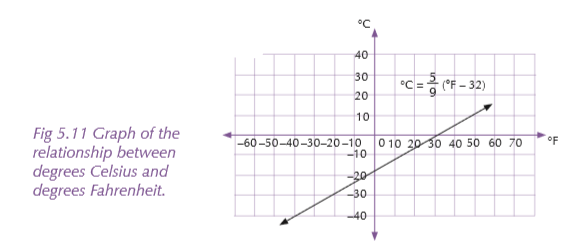
Since it is perfectly reasonable to have both positive and negative temperatures, we plot the points on this graph on the full coordinate grid.