UNIT 1 POPULATION AND NATURAL RESOURCES
UNIT 1: POPULATION AND NATURAL RESOURCES
Key Unit Competence
Describe the factors affecting population size and the importance of natural
resourcesLearning Objectives
By the end of this unit, I should be able to:
– State and define population characteristics.
– Explain factors that affect population density.
– Explain population growth patterns.
– Explain the terms renewable and non-renewable resources.
– Explain how environmental resistance affects the balance of nature.
– Explain the importance of natural resources in growth of the Rwandan economy
and methods of conservation.
– Demonstrate methods used in estimating populations by using quadrats and
line transects.
– Research how the human population has grown over the past 250 years.
– Compare statistics on the population age-sex structure of developing and
developed countries.
– Analyse the costs and benefits of managing renewable and non-renewable
resources.
– Support that human population explosion impacts negatively on the
environment.
– Recognize that some resources are renewable and others are non-renewable
and that effective use of these resources is of great value.
– Justify the practice of family planning as a tool for reducing populationexplosion.
Introductory activity
Analyse pictures below and answer the questions that follow.
1. Specify the appropriate ecological terms to describe picture A and picture B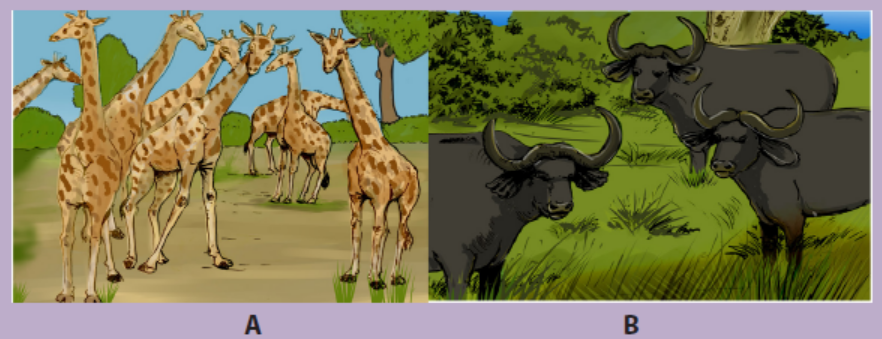
2. Describe what would happen if the number of animals in pictures A and B
were highly increased3. Using search engine categorize the natural resources.
Pictures A and B represent ecological populations. In biology, an ecological
population is a group of organisms of the same species that live in the same area at a
certain period of time. The population is the unit of natural selection and evolution.
How large population is and how fast it is growing are often used as measures of itshealth.
1.1 Population characteristics
Activity 1.1
Using search engine, define the following terms:
1. Density
2. Age structure
3. Growth pattern
4. Birth rate5. Death rate
A given population is characterized by its density, age structure, growth patterns,birth and death rate.
1.1.1 Population density
Population density is the number of individuals of the same species per unit area or
volume. For example, the number of Acacia tree species per square kilometer in the
Akagera National park in Rwanda or the number of Escherichia coli per millilitre in a
test tube express the density of these individuals per square kilometre in a natural
forest and per millilitre in a test tube.
1.1.2 Population age structure
Age structure is the number or proportion of individuals in each age group within
a population. The figure 1.1 below provides the distribution of the populationaccording to age.
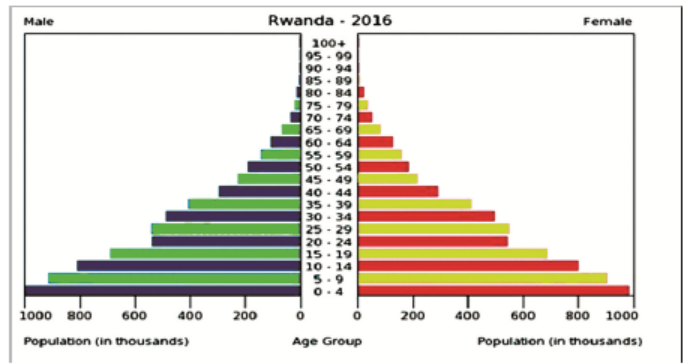
Figure 1.1: Age structure in Rwanda
Information is included by sex and age group as follows: 0-14 years (children), 15-
24 years (early working age), 25-54 years (prime working age), 55-64 years (mature
working age), 65 years and over (elder age). The age structure of a population affects
a nation’s key socioeconomic issues. For example, countries with young populations
(high percentage under age 15) need to invest more in schools while countries with
older populations (high percentage ages 65 and over) need to invest more in thehealth sector.
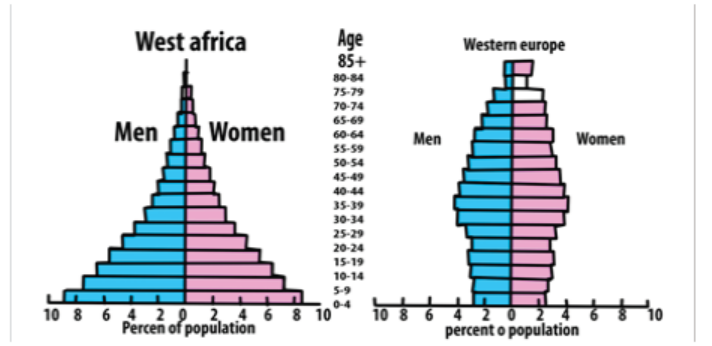
Figure 1.2: Age- sex structure pyramids of developing and developed countries
The shapes of the age-sex structure pyramids shown above show the age sexstructure
of a developing and developed country. The main characteristics of
developing countries including some of the African countries in terms of population
growth include high death rate; high birth rate and low life expectancy, while the
main characteristics of developed countries such as most European countries
in terms of population growth are low death rate, low birth rate and longer life
expectancy
1.1.3 Population explosion
Population explosion is the rapid increase in number of individuals of a particular
species. For example, the world’s human population increase since the end of World
War II is attributed to; an accelerating birth-rate, a decrease in infant mortality and
an increase in life expectancy. Such human population increase impacts negatively
the environment. For instance, human population explosion contributes to pollution
leading to; ozone depletion, eutrophication, acid rain, global deforestation, soilerosion and desertification.
Figure 1.3: World population growth from 1950 to 2050.Source: U.S. Census Bureau, International Data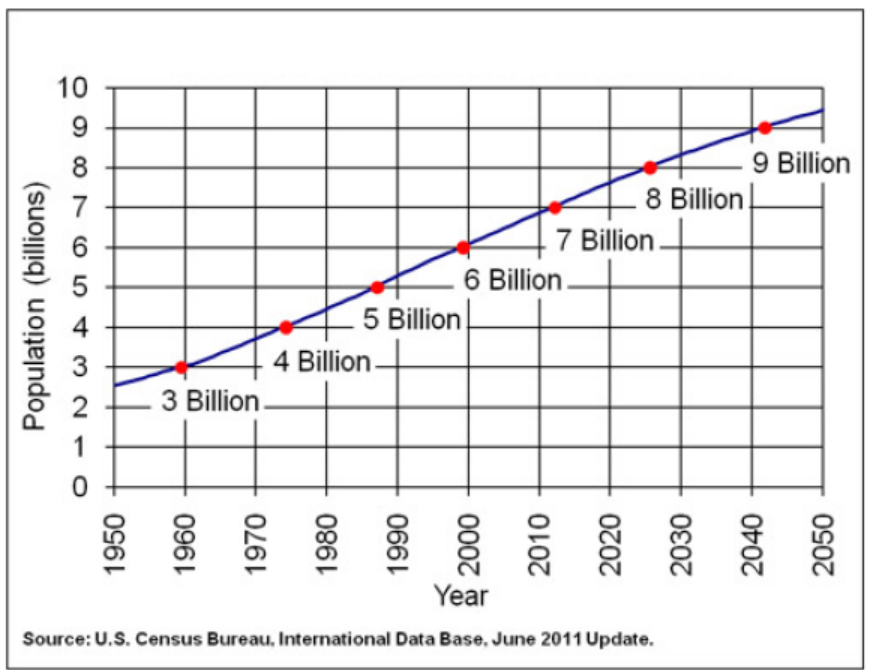
Base, June 2011 Update.
As the figure 1.3 above indicates, the World population is exponentially growing.
This is the reason why most countries, including Rwanda, are practicing the familyplanning. Family planning is the practice of controlling the number of children in a
family and the intervals between their births. If a married couple is sexually active,
they have to adopt at least one family planning technique such as contraception
and timing of reproduction. Other techniques commonly used include; sexuality
education, prevention and management of sexually transmitted infections, preconception
counselling and management, and infertility management.
1.1.4 Population growth patterns
Population growth patterns are graphs (population growth curves) in which increases
in size are plotted per unit time. When a population size increases, the growth rate
also increases. The larger the population becomes, the faster it grows. The factors
that contribute to the population growth are immigration of new species as well as
the birth rate. Population growth is also influenced negatively by emigration and
the death rate.
1.1.5 Birth and death rates
Birth rate is the ratio of live births in a specified area to the adults in population of
that area. It is usually expressed per one thousand individuals per year. It is estimatedfrom this calculation:
Death rate is the ratio of deaths to the adults in population of a particular area during
a particular period of time. It is usually calculated as the number of deaths per onethousand individuals per year and it is estimated from this calculation:
Application 1.1
1. Distinguish between population density and age structure.
2. There are 100 adult elephants in a population of an area. Each year, 10
elephants are produced while 2 elephants die.
a. Calculate the birth rate of this population.
b. Calculate the death rate of that population.
3. Explain the impact of population explosion on the environment.4. Describe the family planning techniques.
1.2 Population density: Dependent and independent factorsaffecting population density
Activity 1.2
The list of factors including; space, nutrients/food, shelter, natural disasters,
competition, predation, disease, sunlight, parasitism, temperature, water,
human activities, physical characteristics of the environment, and behaviour
of organisms in an environment have the relationship with figures belowindicating the relationship between animals and their environment.
1. Categorize the listed factors into density-dependent and densityindependent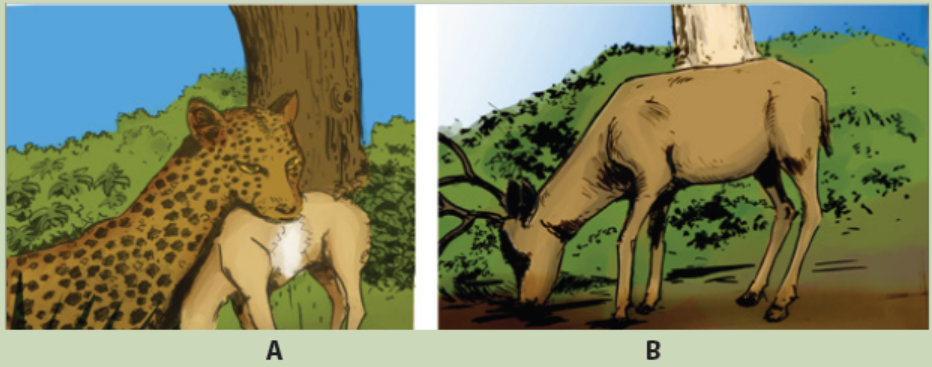
factors.
2. Among the 2 categories of factors given above, suggest the factors illustratedby the figures A and B.
Populations are differently distributed. The distribution and the density are controlled
by environmental factors, which can either increase or decrease the population size
by affecting birth rate, death rate, immigration and emigration (Table 1.1 below).
These factors are grouped into two major categories: Density -dependent factorsand Density- independent factors.
1.2.1 Density-dependent factors
Density dependent factors are factors whose effects on the size or growth of the
population vary with the population density. The types of density dependentfactors include: availability of food, predation, disease and migration. However, food
1.2.2 Density-independent factors
Density independent factors can affect the population without being necessary
based on the density. They include; natural disasters (droughts, floods, hurricanes
and fires), temperature, sunlight, seasonal cycle, human activities, and levels of
acidity, cited among many others.
Table 1.1: Environmental factors that affect the population densityavailability is considered as the main factor.
Application 1.2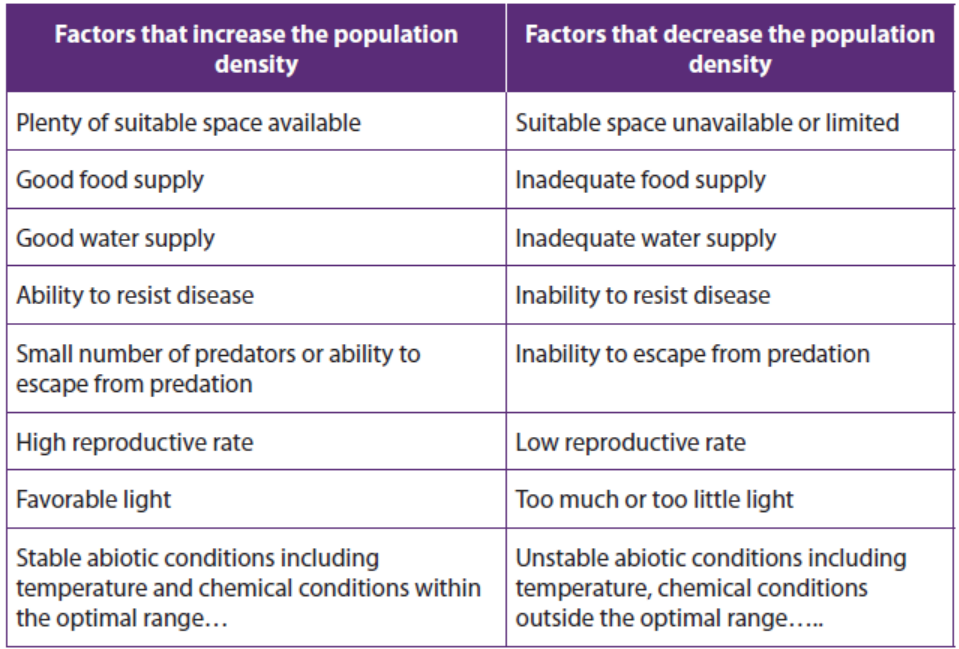
Discuss the ways by which natural disasters (droughts, floods, hurricanes andfires) affect the population growth.
1.3 Methods or techniques of measuring population density
Activity 1.3.1
Using pegs, strings/ropes, meter-ruler, and quadrats in your school ground,
carry out the following field work.
Move in the school ground and make a line transect of 15 meters by the use
of a decametre. Use pegs and strings/ropes to collect all plants and animal
species found at each five meters across transect.
In the ground, make five different quadrats of one square meter separated
by 3 meters and use pegs and strings/ropes to collect different plants and
animal species within each quadrat.
Record your samples in the following table with respect to each quadrat:
Calculate the population density and species frequency for each studiedquadrat.
Calculate the population density and species frequency for each studied
quadrat.
1.3.1 Quadrat method
A quadrat is a square frame that marks off an area of ground, or water, where you can
identify different species present and/or take a measurement of their abundance.
Before any experiment, the decision on a suitable size for the quadrat and the
number of samples to use is taken. Samples must be selected randomly to avoid
any bias, such as choosing to take all of samples from the place with fewest species
simply because it is the easiest to do. This would not represent the whole area youare surveying.
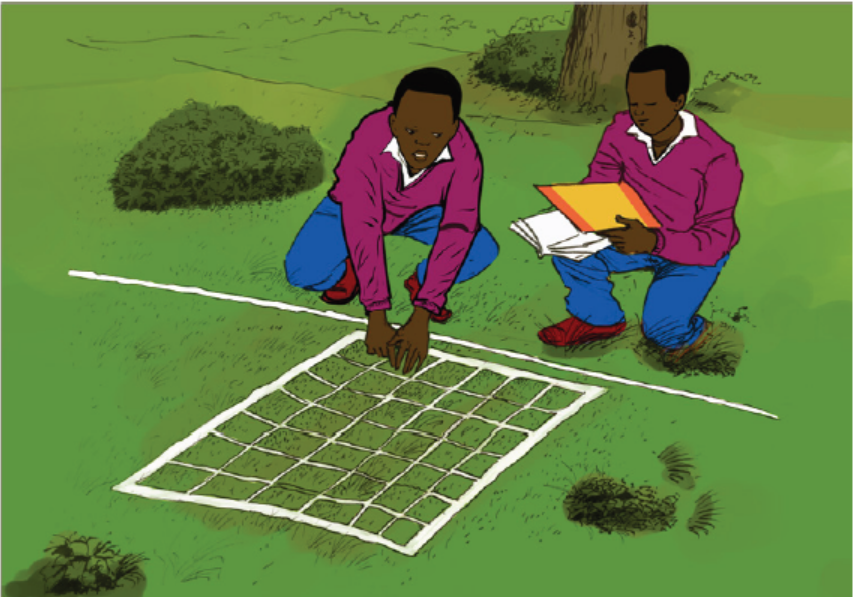
Figure 1.5: Sampling using a quadrat method
A quadrat method enables the calculations of 3 aspects of species distribution
including; species frequency, species density and species percentage cover. Theresults can be used to calculate species frequency and species density.
1.3.2 Species frequency
Species frequency is a measure of the chance (probability) of a particular species
being found within any one of the quadrat, and it is found simply by recording
whether the species was present in each analysed quadrat. For example, if a quadratis placed 50 times, and a given plant was identified in 22 samples, then the species
frequency for this plants equals:
1.3.3 Species density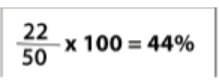
Species density is a quantity of how many individuals there are per unit area, for
example, per square meter. To achieve this, one takes the total number of counted
individuals and then divide it by the number of quadrats done. An example is:Total number of individuals = 200
Total area of quadrats = 480m2
1.3.4 Species cover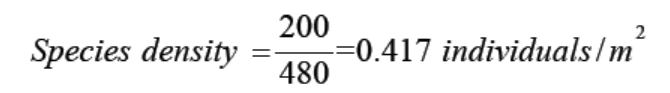
Species cover is a measure of the proportion of ground occupied by the species and
gives an estimate of the area covered by the species as the percentage of the total
area. For example, if there are 100 small squares in one quadrat, then the squares
in which the plant species is present are counted. If plants are found in 25 squares
within that quadrat, the conclusion is that the plant covers 25% of the area.
1.3.5 Line transect method
Line transect is a tape or string laid along the ground in a straight line between
two poles as a guide to a sampling method used to measure the distribution of
organisms. For example, the investigation on change at the edge of a field where it
becomes very marshy is done by randomly selecting a starting point in the field and
lay out a measuring tape in a straight line to the marshy area, and then sample the
organisms that are present along the line, which is called a transect. The simplest
way to do this is to record the identity of the organisms that touch the line at setdistances – for example, every two meters.
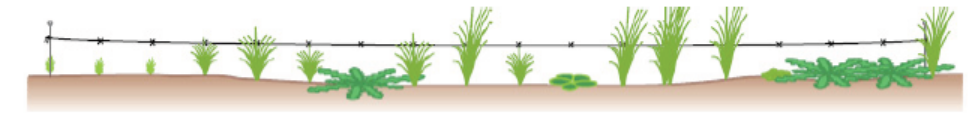
Figure 1.6: Line transect
1.3.6 Capture-recapture method
Activity 1.3.2
Mukamana is a fish farmer in Bugesera district. She wanted to know the total
population in her fish pond. She netted 240 fishes and tagged (marked) their
opercula with aluminium discs. She released those fishes into the pond. After
one week, she netted again 250 fishes among which 15 had the aluminiumdiscs. Calculate the estimated population from marked individuals.
Capture-recapture method involves capturing the organism, marking it without
any harm, and release it in the same area so that it can resume a normal role in
the population. For example, fish can be netted and their opercula is netted with
aluminium discs, birds can be netted and rings can be attached to their legs, small
animals may be tagged by dyes, or by clipping the fur in distinctive pattern, while
arthropods can be marked with paint. In all cases, some form of coding may be
adopted so that individual organisms are identified. Having trapped, counted andmarked a representative sample of the population.
Application 1.3
1. Kalisa and Mutoni conducted an experiment within a quadrat of 0.5m2 andfound the following statistics for a couch grass by quadrat:
a. Calculate the species frequency, and the species density of couch grass
from the results of this survey.
b. Suggest when it might be more appropriate to use species frequency
rather than species density to record the abundance of a species.
c. Given that the total surface area of the school ground is 200 m2 and
couch grasses were found on 50 m2. Calculate the percentage cover
occupied by couch grasses.
4. A population of 820 insects occupies a surface area of 1.2 km2. These insects
gather nectar from a population of 560 flowering plants which occupy asurface area of 0.2km2. Which population has greater density
At a later stage, the population is trapped again and counted, and the populationsize is estimated using the Lincoln index as follows:
Where: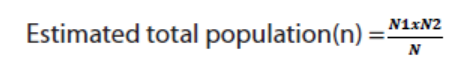
N1: the number of organisms in initial sample,
N2: the number of organism in a second sample,N: the number of marked organisms recaptured.
1.4 Population growth patterns and environmental resistance1.4.1. Population growth patterns
Activity 1.4
1. You are provided with the following statistics on population size of insects inthe following table:
a. Plot a graph of the population size against the generations.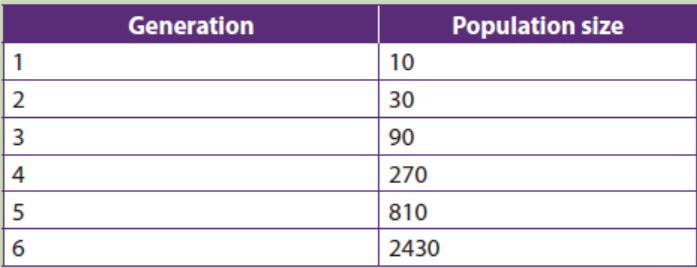
b. Compare the plotted graph in (a) above with the one given bellow andnote any similarities and differences.
2. Explain how environmental resistance affects the balance of nature.
1.4.1. Population growth patterns
Population growth patterns are graphs also called population growth curves in
which the increases in size are plotted per unit time. Two types of population growth
patterns may occur depending on specific environmental conditions:
a. Exponential growth pattern/J-shaped curve/J-shaped curve
Exponential growth is a pattern of population growth in which a population starts out
growing slowly but grows faster as population size increases. An exponential growth
pattern also called J- shapes curve occurs in an ideal, and unlimited environmental
resources. In such an environment there will be no competition. Initially populationgrowth is slow as there is a shortage of reproducing individuals that may be widely
dispersed. As population numbers increase, the rate of growth similarly increases,
resulting in an exponential J-shaped curve. Exponential population growth can be
seen in populations that are very small or in regions that are newly colonized by aspecies.
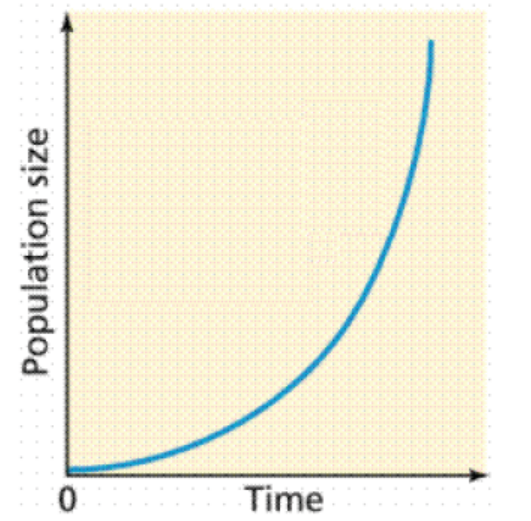
Figure 1.7: Exponential (unrestricted) growth curve
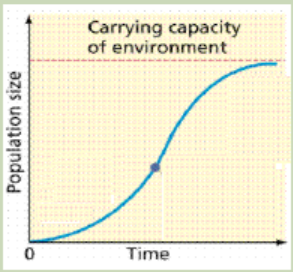
b. Logistic growth pattern / sigmoid growth curve
Logistic growth is a pattern of population growth in which growth slows and
population size levels off as the population approaches the carrying capacity. A
logistic growth pattern also called S-shaped curve occurs when environmentalfactors slow the rate of growth.
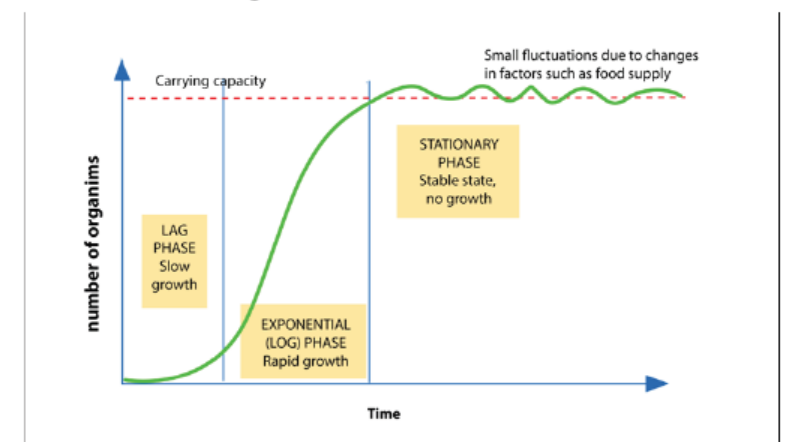
Figure 1.8: Logistic growth curve
The sigmoid or S- shaped curve represented by the figure 1.8 shows three main
stages in population growth: The lag phase where there is a slow growth, the log
phase or exponential growth phase, also called logarithmic phase, in which the
number of individuals increases at a faster rate and the plateau phase or stationary
phase, in which the number of individuals are stabilized.
Causes of the exponential phase are various and include the plentiful of resources
such as; food, space or light, little or no competition from other organisms, and
favourable abiotic factors such as; temperature or oxygen and reduced of lack of
predation or diseases. The stationary phase, however is caused by a balanced
number of; births plus the number of immigrations and the number of deaths plus
the number of emigration. Other causes may include; the increase of mortality
caused by predators and diseases, excess of wastes and competition for available
resources such as food, space, shelter and minerals. Some of these causes may
include the carrying capacity explained as is the maximum number of individualsthat a particular habitat can support.
1.4.2 Environmental resistance
Environmental resistance is the total sum of limiting factors, both biotic and abiotic,
which act together to prevent the maximum reproductive potential also called
biotic potential from being realized. It includes external factors such as predation,
food supply, heat, light and space, and internal regulatory mechanisms such asintraspecific competition and behavioural adaptations.
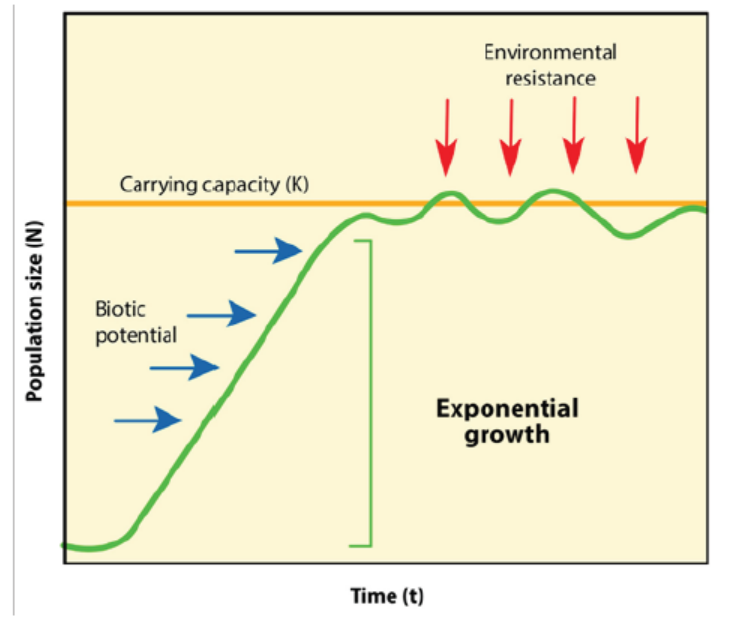
Figure 1.9: Effect of environmental resistance to population growth population growth..
1.4.3 Environmental balance
A balance of nature is the stable state in which natural communities of animals and
plants exist, and are maintained by competition, adaptation and other interactions
between members of the communities and their non-living environment. Every
biotic factor affects or causes a change in the natural environment. For example,
when a living organism interacts with the environment, this causes a change in the
environment. The following are some of the examples of biotic factors and theireffects on balance of nature:
– Respiration: when animals are respiring, they take in oxygen and give out
carbon dioxide (CO2) from respiration. The CO2 can be taken in by plant leaves
and be used in the process of photosynthesis to make food and give out oxygen.
– Predation: when animals, for example, predate on other animals, this reduces
the numbers of prey, which in turn affects the ecosystem.
– Parasitism: cause diseases that may slow down the growth rate of a population
and/or reduces the number of organisms.
– Competitors: when organisms compete over nutritional resources, this couldreduce the growth of a population.
Application 1.4
1. Explain any 3 biotic factors that affect the balance of nature.
2. Distinguish between carrying capacity and biotic potential.3. Explain how environmental resistance affects the population growth.
1.5 Natural resources and their importance
Activity 1.5
The pictures below illustrate some natural resources of Rwanda. Study themand respond to the following questions.
1. Categorize the natural resources mentioned in the above figures into
renewable and non-renewable resources.
2. Explain how those natural resources contribute to the economic growth ofRwanda.
1.5.1. Natural resources
Natural resources refer to materials or substances occurring in environment and
which can be exploited for economic gain. Natural resources such as; solar energy,
wind, air, water, soil and plants are renewable natural resources while others including
fossil fuels, oil, coal natural gas cited among many others are non-renewable natural
resources. A renewable resource can or will be replenished naturally in the course of
time, while a non-renewable resource is a resource of economic value that cannotbe readily replaced by natural means on a level equal to its consumption.
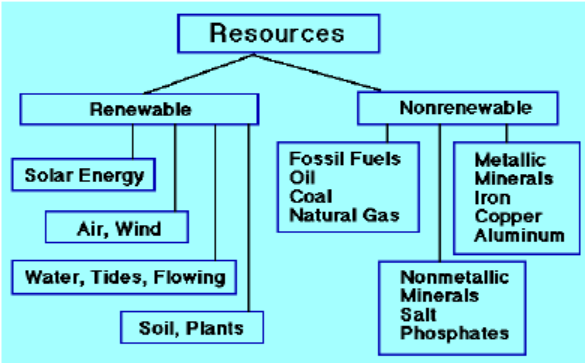
Figure 1.10: Renewable and non-renewable natural resources
1.5.2. Importance of natural resources in economic growth of Rwanda
– Water is used for; irrigation, domestic activities, industrial use, and mining.
– Lakes and rivers are source of food (fish) for humans and contribute for recreation
(tourism).
– Land serves as the storehouse of water, minerals, livestock, and home for wild
anima ls which generate an income in different ways.
– Minerals including gravel, coal, metals, oil, clay, sand, stones…are used for
construction and for income generation.
– Soil contributes to agricultural crop production, and supports forest and food
crops.
– Trees are the major sources of timber, construction materials and firewood
and contribute to fight against erosion, water and air purification and wind
protection.
– Some plants are source of food and money for humans and other animals
– Some animals including; mountain gorillas in Volconoes National Park, lions in
Akagera National Park and many other wild animals contribute to economicdevelopment of the country through tourism.
Application 1.5
1. Karekezi, Karake and Uwimana extract and sell legally the minerals from the
soil of Rwanda.
a. Describe the impact of their job on the economy development of
Rwanda.
b. Advise Karekezi, Karake and Uwimana on what they have to do at
the mine sites after the extraction of minerals.
2. Explain the reasons why we have to conserve and wisely use water in ourdaily activities.
1.6 Methods of conserving natural resources
Activity 1.6Look at the following pictures and respond to the following questions.
1. Identify the methods of conservation of natural resources mentioned in the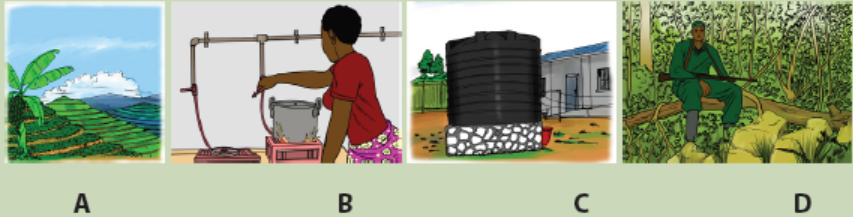
above figures.
2. Suggest all other possible methods of conservation of natural resources.
3. Discuss the measures established by Government of Rwanda for environment,biodiversity and natural resources conservation
They are various and different methods used for conservation of natural resources
and they include:
– Use of alternative sources of power such as; solar and wind energy:
These alternative sources of energy are bio friendly particulars because they
do not produce harmful gases that damage the ozone layer, compared to the
burning of fossils fuels such as; coal and charcoal. They are also; cheap to use,
not easily depleted, and are renewable.
– Tree planting to prevent soil erosion: This entails planting trees and other
vegetation to control soil erosion caused by wind and water. Trees and
vegetation are essential in the maintenance of the ecosystem. They also act as
home for most insects, birds and some symbiotic plants. This creates a habitat
for wildlife therefore conserving wildlife altogether.
– Practicing of judicious ways to conserve water in our homes: This entails
simple practices like ensuring that taps are closed when they are not in use.
Taking less time in the shower aids to conserve lots of water per month.
– Use pipelines to transport oil: During oil transportation on ships, spills can
happen which will negatively affect both plant and animal life. Therefore, use of
pipelines is more recommended.
– Growing vegetation in catchment areas: Catchment areas act as a source of
water that flows in; streams, rivers and oceans. Vegetation in the catchment
areas allows sufficient infiltration of water into deeper soil layers thus leadingto formation of ground water.
– Prior treatment of human sewage and Industrial wastes: Water flowing from
industries comes with many toxic wastes that must be treated before getting to
the natural water bodies. This reduces harm inform of pollutants e.g. chemical
and thermal forms.
– Harvesting rain water: This is done through usage of water tanks that collect
water during the rainy season and maintain use during dry periods. This reduces
tension on water reservoirs (e.g. lakes).
– Practice of in-situ or on-site conservation of wildlife: This involves
conservation of fauna and flora in their natural habitats. This entails setting up
measures that protect areas such as national parks and game reserves.
– Practice Ex-situ or offsite conservation of wildlife: It involves the conservation
of animals and plants outside the natural habitats. These include areas such as;
pollen banks, DNA banks, zoos, seed banks, botanical gardens, tissue culture
banks among others.
– Formulation of policies and regulations to curb poaching: Poachers continue
to kill many animals such as; elephants, rhinos, leopards for their tusks and
skins which are sold off in the black market. Poachers are a major threat to our
biodiversity as they are slowly making some species extinct. These regulations
will ensure that poaching is done away with.
– Practice judicious ways of conservation energy: Such practices
include switching off the lights when not in use, unplugging electrical
appliances when not in use. Plugged-in appliances continue to use electricity
even when not in use. Other practices include spending less time when taking
hot showers.
– Use of biogas in our homes: Around the World, Liquefied Petroleum Gas
(LPG) is the most rampant source of fuel in our homes today. Continued LPG
use results into the depletion of oil reserves, biogas is therefore an alternative.
Biogas is mainly produced from cattle dung, biogas plants are a source of both
biogas and manure.
– Use of bio-fuels: For more than a century, fossil fuels have been a major source
of energy. However, they are depleting rapidly, this calls for alternative sources
of fuel such as bio-fuels which are mainly from plant species. Bio-fuels are
known to be bio friendly and they reduce the occurrence of air pollution.
– Ensure the recycling of wastes: These wastes include; plastics, paper bags
that have resulted to tones of garbage. Recycling entails re-manufacturing of
already used materials. This reduces the amount of waste available reducing
soil and water pollution.
– Make use of electronic mails: Electronic mails are paperless and present a
good way to minimize the usage of paper. Technology has made this possible
reducing the usage of paper and envelops. This has reduced the production of
paper and also minimized cutting down of trees.
– Purchase hybrid cars instead of the conventional cars: Hybrid cars use a
combination of electricity and minimal amounts of gas to run them. This is a
break from the use of petroleum consuming cars that are now in large numbers.
– Water the lawns and farms in the evening: Watering the farm when it is dry
and hot results to increased water evaporation and a lot of water is used for the
same. During the evening, the weather is much cooler reducing evaporation
thus conserving water.
– Reuse old furniture: It is common to dispose of old furniture and opt for new
furniture. The old furniture should be sold off for use or donated to charity where
they can be reused. The old furniture can also be re-sculptured and redecorated
to save wood. This will reduce deforestation.
– Practice crop rotation: Planting the same crops for a long period of time
reduces soil fertility. The practice of crop rotation will restore and maintain soil
fertility thus conserving the soil.
– Translocation of wild animals: The growing population has led to human
encroaching on the wildlife habitat. This has resulted to human-animal
conflict where the wildlife are killed by humans as a way of protecting themselves
from them. Translocation involves moving wild animals to adjacent areas and
fencing to curb the conflict.
– Establish special schemes to preserve endangered plant and animal
species: This includes; botanical gardens, sanctuaries that may be established
to protect the endangered species so that they can be available for future
generations.
– Constructions of reservoirs: This will regulate the amount of water that
is used daily. The dams also act as a source of hydro-electric power which is
another alternative source of energy.
– Formulate regulations to stop overfishing: Overfishing interrupts aquatic
life and depletes the fish available in our water bodies. In some cases, it poses
a threat to the endangered aquatic species. Regulations to avoid over fishing
should be put in place.
– Construction of terraces in sloping land: This will prevent soil erosion aswater tends to run downhill.
Application 1.6
1. Distinguish between in-situ and ex-situ wildlife conservation.
2. Describe the energy sources that you can advise Rwandans to use forprotecting the environment.
End of unit assessment 1
Instruction: From question 1 to 5, choose the letter corresponding to the
best answer.
1. Which is the best definition of a population?
a. The unit of natural selection and evolution.
b. All the species that live in the same area.
c. A group of species that live in the same area.
d. A group of organisms of the same species that live in the same area.
2. Which of the following would be an example of population density?
a. 100 caterpillars
b. 100 caterpillars per maple tree
c. 100 caterpillars clumped into 5 specific areas
3. Exponential growth:
a. Is a characteristic of most species under ideal conditions?
b. Is a fast growth rate with a large population?
c. Begins with a slowly growing population.
d. All of the above.
4. Which of the following is a characteristic of developing countries?
a. A fast population growth due to a high death rate but higher birth rate.
b. A fast population growth due to a high birth rate but falling death rate.
c. A slow population growth due to a low birth rate and falling death rate.
d. A slow population growth due to a low birth rate and low death rate.
5. Fill in the blank with the term that best completes the sentence.
a. The ____________ is the largest population size that can be supported
in an area without harming the environment.
b. Populations gain individuals through births and ____________.
c. Under ideal conditions, populations can grow at ____________ rates.
6. Circle the letter of the correct choice.
i. Non-renewable resources include
a. Wind and sunlight.
b. Metals and other minerals.
c. All of the above.
ii. Renewable resources include
a. Wind and sunlight.
b. Fossil fuels.c. All of the above.
7. Observe the pictures below and respond to the following questions.
a. Identify the human activities shown above and that harm the natural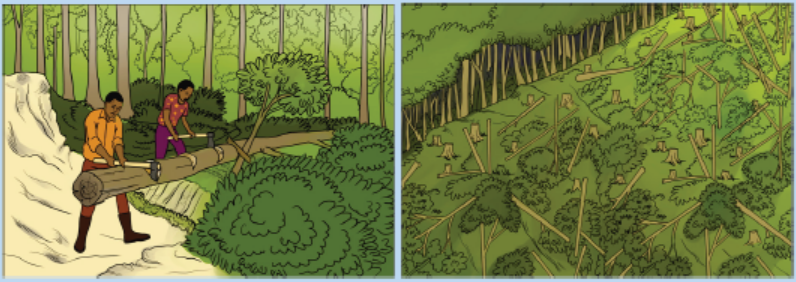
resources.
b. Describe all effects of the identified activities on the environment.
c. Suggest the possible measures to solve the above problems.
8. Students made a survey of blackjack (Bidens pilosa) growing on two
different gardens in the school environment. Ten quadrats of 1.0 m2 were
placed randomly in each garden, and the number of blackjack plants in eachquadrat was counted. The results are summarized in the following table:
Calculate:
a. The species frequency in each of the two gardens.
b. The species density of blackjack plants in each of the two areas.
c. Compare the species frequency and density for both gardens.
d. Explain why it is important to use randomly placed quadrats.
9. Explain how age structure of human population affect its growth rate?
10. Describe how has the growth of Earth’s human population has changed in
the 2 recent centuries? Give your answer in terms of growth rate and thenumber of people added each year.
11. A group of students investigated the size of quadrat that they should use to
assess the abundance of plant species in an old field of forest plantations.
They used quadrats of side 10, 25, 50, 75 and 100 cm and recorded the
number of plant species were encountered in each quadrat. They repeated
their investigation five times and calculated the mean numbers of speciesper quadrat. Their results are plotted as follows:
a. Calculate the area of each quadrat used for this study.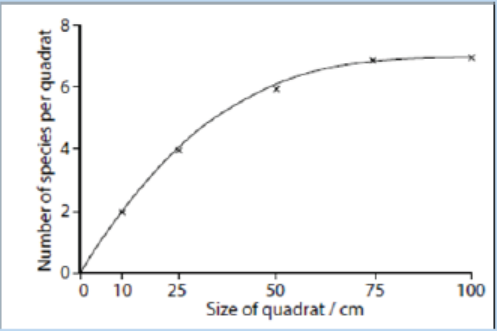
b. Explain why these students repeated the experiment five times for
each quadrat.
c. Based on their results, the students decided to use the 50 cm quadrat
to study the old field. Why did they choose the 50 cm quadrat instead
of others?
d. Explain how they would use the 50 cm quadrat to estimate theabundance of different plant species in the field.
12. A sample of 39 ground beetles was captured from an area of waste ground
measuring 100 x 25 meters. Each animal was marked and then released. A
second sample of 35 was captured the following day and 20 individuals of
them were marked.
a. Estimate the number of ground beetles in the population.
b. State three assumptions that must be made in order to make this
estimation.
c. Describe a method that could be used to verify that the mark–
release–recapture method gives a valid estimate of the groundbeetle population in the area of waste ground.