UNIT 9 : FINANCIAL STATEMENTS ANALYSIS
Key unit competence: To be able to analyze financial statements for anentity
Introductory activity
JWZ is a partnership business of lawyers operating its activities in
Bugesera District. The business accountant prepared all needed financial
statements for the year ended 31 December 2022 horizontally. Some
users of financial statements information are trying to convince him not to
use the horizontal format and the accountant is trying to explain to themthat there are different forms of financial statement analysis.
You are asked:
1. What is financial Statement analysis?2. What are the formats of Financial Statements?
9.1. Introduction to financial statement analysis
Learning Activity 9.1
An Audit conducted in Rwanda, in 2022 revealed that some businesses are
not preparing financial statements. Asking them why, some answered that
they do have enough knowledge on financial statements and thus they do
not know about the financial statements analysis. As an accountant student,
your asked to help them about:
a) Explain the term financial Statements analysis?
b) What is involved in Financial statements analysis?c) What are the advantages of financial statements analysis?
Financial Statement consists of Statement of Financial Position, Financial reports
and other financial reports which are to be framed according to applicable
financial reporting framework and auditor and various other analysts analyze
the financial statements and give their report on the same but this analysis has
certain limitations because of volatile industry, business conditions, and otherfactors.
9.1.1 Introduction
Financial statements are prepared and presented, in accordance with generally
accepted accounting principles, to give readers an overview of the financial
results and condition of a business. However, it is the analysis of financial
statements that gives true representation of what is going on inside the company.
It is necessary to analyses the numbers in the statements to get a true and clear
picture of the company. The financial statements are analyzed with the help of
different tools such as comparative statements, common size statements, ratioanalysis, trend analysis and funds flow analysis.
Financial statement analysis (or financial analysis) is the process of reviewing and
analyzing a company’s financial statements to make better economic decisions.
These statements include the income statement, balance sheet, statement ofcash flows, a statement of retained earnings.
9.1.2 Meaning of financial statements analysis
Financial statement analysis is a method or process involving specific
techniques for evaluating risks, performance, financial health, and future
prospects of an organization.
Financial statement analysis (or financial analysis) is the process of reviewing and
analyzing a company’s financial statements to make better economic decisions.
These statements include the income statement, balance sheet, statement ofcash flows, a statement of retained earnings.
Financial statement analysis is one of the most fundamental practices in financial
research and analysis. In layman’s terms, it is the process of analyzing financialstatements so that decision-makers have access to the right data.
Financial statement analysis is also used to take the pulse of a business.
Since statements center on a company’s key financial details, they are useful
for evaluating activities. This is essential to understanding the firm’s overallperformance.
Financial statement analysis involves:
• Assessment of the firm’s past, present and future financial condition
• Finding out a firm’s financial strengths and weaknesses
• Comparison through time (Trend)
• Comparison among companies (industrial analysis)
Advantages of a financial statement Analysis
• To meet their financial reporting obligations and to assist in strategic
decision-making, firms prepare financial statements. However, “the
information provided in the financial statements is not an end in itself as
no meaningful conclusions can be drawn from these statements alone.”
Firms employ financial analysts to read, compare and interpret the data
as necessary for quantitative analysis and decision- making.
• Financial analysis determines a company’s health and stability.
• The data gives you an intuitive understanding of how the company
conducts business
• Stockholders can find out how management employs resources and
whether they use them properly.
• Governments and regulatory authorities use financial statements to
determine the legality of a company’s fiscal decisions and whether the
firm is following correct accounting procedures
• Government agencies, such as the Internal Revenue Service, use
financial statement analysis to decide the correct taxation for thecompany.
Financial statements
Measures of financial performance and position are developed from a firm’s
financial information organized into 3 main statements:
– Statement of Profit or Loss
– Statement of Financial Position– Statement of Cash Flow
According to IFRS, a complete set of financial statements comprises the
following:
– Statement of financial Position
– Statement of Profit or Loss
– Statement of changes in equity
– Statement of cash flow– Accounting policies and notes
Entities are encouraged to furnish other related financial and non-financial
information in addition to the financial statements. The statement of changes
in equity reflects information about the increase or decrease in net assets orwealth.
Importance of Statement of Financial Position
The statement of Financial Position helps to know the three origins of economic
resources used by a firm:
• Contribution of shareholders or owners
• Long, medium and short term liabilities
• Internal financing (retained earnings and reserves)
Succinctly, sources of capital used by a business are:
• Personal resources
• Borrowings from friends or banks
• Trade credits• Bank overdraft
The Statement of Financial Position helps to know the use of economic resources
which are:
• Fixed assets (Fixed capital)
• Current assets (Stocks, receivables, cash)
Structural equilibrium of the enterprise
The structural equilibrium is based on the following general principles:
1. Owner’s equity should be greater than liabilities.
2. Capital employed (owner’s equity plus long term liabilities) should cover
the fixed assets and part of current liabilities.
3. Current liabilities should be invested only into current assets and basicallyin cash and receivables so to be easily reimbursed.
Application activity 9.1
As an accountant student:
a) What do you understand by financial statements analysis?
b) Is it necessary to have financial statement Analysis? Justify your answer
9.2 Uses of financial statement analysis
Learning Activity 9.2
Your classmates of senior six Accounting are discussing about preparation
of financial statements. They are not aware and asked you to:
Explain the key measures in determining the financial strength of the
business?
Final accounts or financial Statements are outputs of an accounting system,
they are prepared at the end of the financial year, hence the name final accounts.
However, interim financial statements can be prepared before the end offinancial year.
External users of accounting information (Banks, shareholders or investors,
creditors, donors, funding agencies, government, competitors and general
public) are more interested in final accounts or financial statements than booksof accounts.
Final accounts are prepared from trial balance after end year adjustments
are incorporated. The types of financial statements prepared vary from one
organization to another depending upon its nature and size among other factors.
However, the major financial statements prepared by profit making organizationsfor disclosure purpose are:
• Statement of profit or Loss
• Statement of Financial Position
The income statement should be prepared before the balance Sheet/Statement
of Financial Position because the ending figure after subtracting expenses from
incomes (net profit or net Loss) connects the income statement/Statement of
Profit or Loss and statement of financial Position, thus, there are two accounts
that are in both final accounts:
• Closing stock• Net profit/Loss
9.2.1 Statement analysis for different users
The users of information can be divided into two:
• Internal users: who are parties within the organization e.g. the
management or the employees.
• External users: who on the other hand, are parties outside the
organization e.g. the shareholder, creditors, government, customers,etc.
Stakeholders including current and potential investors, creditors, customers,
employees, government, bankers and stock exchanges all have an interest in the
financial performance (and other aspects) of a company. Financiers and credit
providers are concerned about the financial performance and creditworthiness
of a company, especially before providing any loans or securities. Stakeholderswill have enhanced confidence in a company if it has strong ratios compared
The need for financial analysis
Financial statements are prepared for decision-making purposes. Good decision
making is driven by effective analysis and interpretation of financial statements
(also referred to as financial analysis). Analysis provides a meaningful conclusion
by drawing a meaningful relationship between the various items of the two
financial statements:
• the profit and loss account or income statement
• the balance sheet or statement of financial position.
These are the indicators of profitability and financial soundness of a businessentity for a given period.
Interested parties and managers
Different parties are interested in financial statements and their analysis for
various reasons. As discussed above, they provide useful financial information to
external and internal users in making financial decisions. For example, investors
want to know the earning capacity of the business, the wellbeing of the business
and its future prospects. Understanding the company’s financial position andrecent performance helps management direct the business.
Shareholders entrust the board of directors with the responsibility for managing
the resources entrusted to them by giving it direction and providing both control
and strategy. The board employs managers to implement their strategic visionand to help ensure the investments of owners are maximized.
Owners put mechanisms in place to monitor managerial behavior. For example,
the UK Corporate Governance Code provides guidelines that require directors
to conduct business with integrity, responsibility and accountability. An
obligation of stewards or the directors is to provide relevant and reliable financialinformation, including analysis of financial statements using various techniques.
Key financial indicators
The purpose of financial analysis is to assess the financial strength and weakness
of the business by assessing the efficiency and performance of an entity. The
key measures in determining the financial strength of the business are as listedbelow.
• Profitability: the main objective of a business and its management
(the agent) is to earn a satisfactory return on the funds invested by
the investors or shareholders. Financial analysis ascertains whether
adequate profits are being earned on the capital invested. It is also useful
to understand the earning capacity of a business, its wellbeing and its
prospects, including the capacity to pay the interest and dividends.
• Trend of achievements: analysis can be done through the comparison
of financial statements with previous years, especially trends regarding
various expenses, purchases, sales, gross profits and net profit. Users
can compare the value of assets and liabilities, and forecast the future
prospects of the business.
• Growth potential of the business: financial analysis indicates the
growth potential of the business.
• Comparative position in relation to similar businesses: financial
analysis helps the management to study the competitive position of their
firm in respect of sales, expenses, profitability and capital utilization.
• Overall financial strength and solvency of the entity: analysis
helps users make decisions by determining whether funds required
for the purchase of new machines and equipment are provided from
internal sources or received from external sources, and whether it hassufficient funds to meet its short-term and long-term liabilities.
9.2.2 Analysis of income statement and balance sheet
Tools of financial statements analysis
• Comparative financial statement
• Common size financial statements
• Trend percentages analysis
• Ratio analysis, cash flow statement analysis etc.
What Is Horizontal Analysis?
Horizontal analysis is used in financial statement analysis to compare historical
data, such as ratios, or line items, over a number of accounting periods.
Horizontal analysis can either use absolute comparisons or percentage
comparisons, where the numbers in each succeeding period are expressed as
a percentage of the amount in the baseline year, with the baseline amount being
listed as 100%. This is also known as base-year analysis.
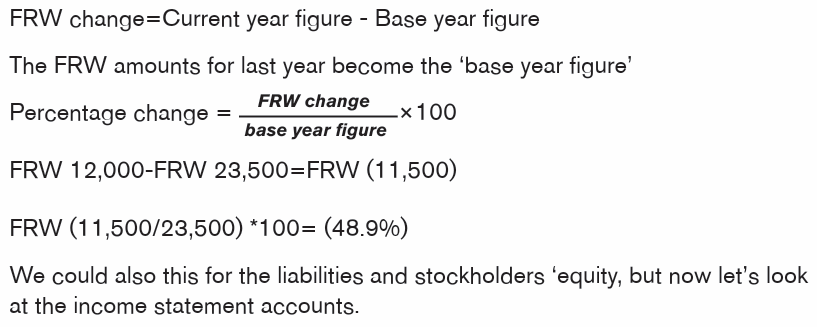
Horizontal analysis shows the changes between years in the financial data in
both FRW and percentage form
Illustration1
Norique Ltd had the following sales and operating income in FY 2016 and FY2017 (amounts are in FRW millions).
The change calculated shows that the sales have increased by FRW 9,910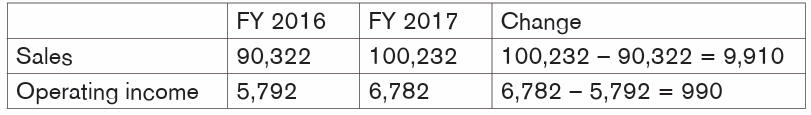
million in FY 2017, with the corresponding increase in the operating income byFRW 990 million.
A better trend analysis is provided by the change in percentage, calculated as:
Percent change = (Current period amount – Base period amount) ÷ Base
period amountPercentage change for Norique Ltd is as follows.
The above calculations show sales have increased by 11% from FY2016 to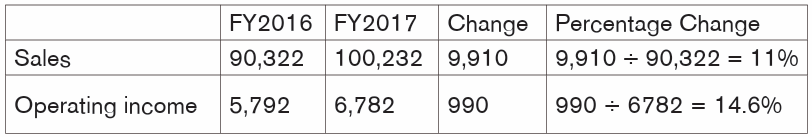
FY2017, whereas operating income has increased by 14.6%. This requiresfurther investigation.
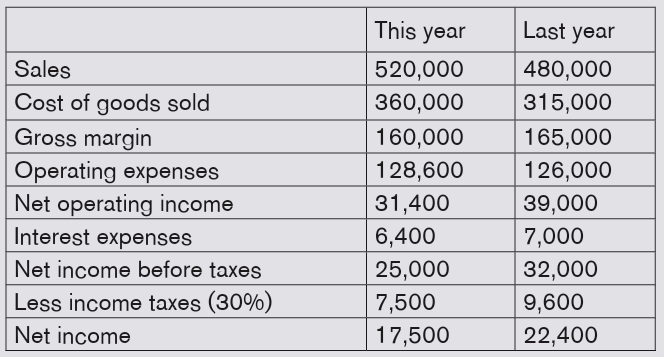
Illustration2.
Clover Corporation’s balance sheets for the year endedDecember 31

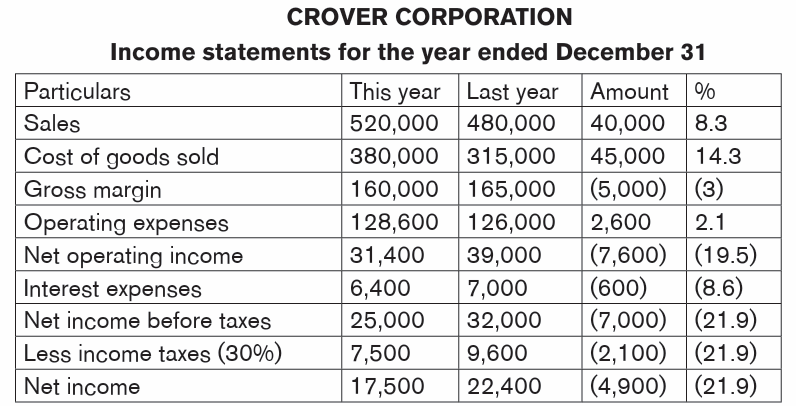
Sales increased by 8.3%, yet net income decreased by 21.9%
There were increases in both cost of goods sold 14.3% and operating expenses
2.2%. These increased costs more than offset the increase in sales, yielding an
overall decrease in net income.
Vertical analysis or Common size statements
Trend Analysis
Trend percentages state several years’ financial data in terms of a base year,which equals 100 percent
Working:
The base year is 2007, and its amounts will equal 100%.
2008 amount/2007 amount*100%
(290,000/275,000) *100%=105%
(198,000/190,000) *100%=104%(92,000/85,000) *100%=108%
By analyzing the trends for Berry Products, we can see that cost of goods sold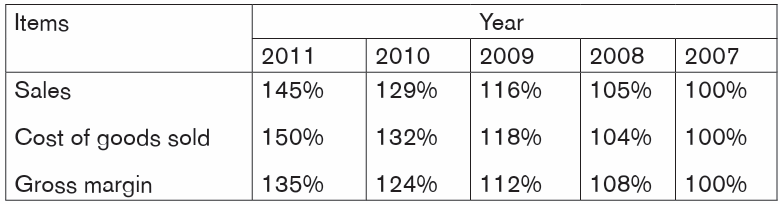
is increasing faster than sales, which is slowing the increase in gross margin.
Vertical analysis is a proportional analysis where each item of financial
statement is shown as a percentage of base items. Usually, line items in the
income statement are shown as a percentage of sales, while line items in the
balance sheet are shown as a percentage of the total assets. It helps to provide
a greater understanding of how sales revenue is being consumed within the
business, thus requiring further investigation if the level of activity is not as
expected
Vertical analysis: focuses on the relationships among financial statement
items at a given point in time.
In Income statements, all items usually are expressed as a percentage of sales.
In Balance sheets, all items usually are expressed as a percentage of total
assets.
Common-size financial statements are particularly useful when comparing datafrom different companies.
Interpreting Horizontal and Vertical Analyses
There are several interpretations that can come out of Horizontal analysis, the
following are examples:
Under horizontal analysis,
• Increase in total asset may mean company growth
• Increase in company’s inventory and fixed asset may be due to
expending business by opening new stores, branches, etc. However,
increase in inventory may also mean weakness because as a general
rule, retail companies are in business to sell, not hold, inventory. When
we see a build-up in inventory we know that the company is facing a
soft business environment. We cannot generate cash unless we sell
inventory.
• Significant Decrease in cash position from one period to another may
be a warning sign since the cash weakening hurt the liquidity of the
company.
• A comparative analysis on income statement reveals an increase/
decrease in income/expense from one year to another and this would
explain a decrease or increase in the resulting net income.
Under vertical analysis:
• Under balance sheet any other item is expressed as a percentage of
asset, so important figure is gauged depending on how much they are
compared to total asset for example: A higher % of debt may mean a
highly leveraged company and Vice versa.
• Under income statement important figures are determined depending
on how much they are compared to sales; for e.g. if COGS and
operating expenses are important compared to sale, one can evaluate
the effectiveness of management looking at how well the management
controls operating expenses and COGS. The increase in % of COGS
or Operating expense as compared to sales may mean an adversesituation given that it would worsen the net income.
9.2.3 Limitations of financial analysis
• The cost principle is used to prepare financial statements. Financial
data is not adjusted for price changes or inflation/deflation.
• Companies may have different fiscal year ends making comparison
difficult if the industry is cyclical.
• Diversified companies are difficult to classify for comparison purposes
• Financial statement analysis does not provide answers to all the users’questions. In fact, it usually generates more questions!
Other limitations
The analysis is based on past and present data and conditions: The
analysis of the auditor and various analysts are based on past data and present
conditions and results. They compare the past data with the present position
and if there is the improvement they will issue the positive reports and otherwise
the qualified report, but they do not consider the future plans of the enterprise
and future economic and market conditions as these conditions can change
at any point of time due to unpredictable nature. The report which shows the
favorable points is based on conditions which can be changed hence it is not
necessary that report will always show the points in the future also.
Reliability of the data presented: Auditor and various analyst make reliability
on the reports and financial statements presented by the management of the
enterprise and they only verify the figures on test check bases but in the world of
competition everyone wants to attract the investors and hence one can do the
same by window dressing of accounts and showing the better position of the
company. Hence the reports issued by independent third parties are subject to
the limitation of reliability and transparency by management.
Valuation by different methods of accounting policies and estimates:
The valuations made by management like valuation of inventory, valuation of
Fixed assets, valuation of investments, etc. are based on different methods
and accounting policies and estimates by the management. And the auditor or
financial analyst cannot question on the method or policy adopted unless being
not acceptable by law. The different methods and estimates show different
results and accordingly different financial positions.
Change in accounting methods enforced by law: There are situations
when an enterprise is following one accounting method for years and suddenly
the law changes and enterprise have to change the accounting policies or
methods as required by law. Hence because of different accounting policies
from past periods it is not justifiable to compare the statement with the past
data. Analysts and auditor while analyzing should keep this limitation in mind.
Inflationary effects are being ignored: As inflation is increasing day by day
and it affects every business organization which results into rise in expenses and
probably a decrease in profits. With this, too every investor, analyst or auditor
make the comparison of the current position with the past data but they should
also keep that limitation in mind that the time value of money changes.
Limitations of methods application for analysis: Every analyst whether
the auditor or the market analyst analyzes and make reports based on the
experience and skills of the analyst and we must take this fact in mind that the
experience and skill of analysts is not the same in any manner. Hence the reports
issued by them are subject to limitation as it is based on personal judgments of
the analyst.
The Reports of the Analysis should not create the assessment of
managerial Ability: On the basis of the reports issued by an analyst, the
people or some stock analyst question the management about their inability
to bring the company at the industry standards and forget the truth that it is
based on market conditions, situations, the response from buyers, the attitude
of employees, credit worthiness etc. hence one should keep the fact in mind
that unfavorable result doesn’t mean the poor managerial or performance ability.
Change of business conditions: The market is highly unpredictable, the
market situations and conditions can change at any point of time, sometimes
results into recession sometimes favorable conditions. Hence being an analyst,
one should make clear that the reports are subject to the current conditions and
which may or may not be the same all the time and can change in the future, theunfavorable conditions can turn into favorable and vice versa.
Application activity 9.2
a) Disco LLP has finalized its quarterly results for Q1 FY 2018. The team
has also included the previous years’ financials. Can you determine thehorizontal trends?
End unit assessment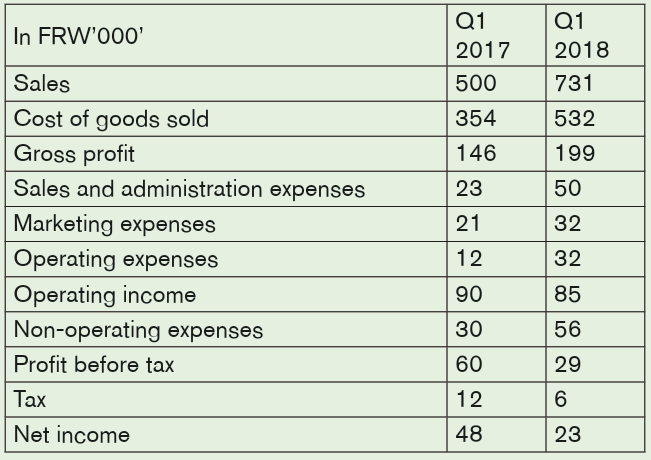
1. What do you understand about horizontal analysis?
2. Which of the following statement describes horizontal analysis?
a) A statement that shows items appearing on it in percentage and
dollar form.
b) A side-by-side comparison of two or more years’ financial
statements.
c) A comparison of the account balances on the current year’s
financial statements.
d) None of the above.
Let’s take the above information from the comparative income statements
of Clover Corporation for this year and last year.Determine the vertical trend.