UNIT 2: COST BEHAVIOR ANALYSIS
Key Unit Competence: Analyze Cost behavior for decision making
Introductory activity
VUDUKA express Ltd is a transport company operating its business
activities in Rwanda. It has a policy of increasing the numbers of
customers and minimizing costs resulting to the rise of profit.
In June and July 2022 the company incurred different costs; variable and
Fixed. for example in June the company purchased 2 coasters for FRW
10,000,000 each, in June and July the company rented 5 offices for FRW
100,000 each per month , June and July company paid taxes of FRW
80,000, in June salaries FRW 1,700,000 and in July salaries of FRW
2,000,000 ; June Paid electricity bills of FRW 150,000 and in July was
FRW 200,000 and maintenance cost of FRW 400,000 in June and FRW
450,000 in July . It was noted that the company costs of fuel depend on
the length of travel covered; but in June Fuel cost was FRW 1,100,000
and in July fuel cost was FRW 1,200,000 , Telephone bills in june was
FRW 150,000 , the cost of telephone was FRW 100,000 and Airtime was
FRW 50,000 but in July the cost of telephone remained constant and
the cost of airtime was FRW 80,000. Additionally, the company keeps
the drivers’ allowances of FRW 800,000 per month for attracting andmaintaining the drivers.
Questions:
1. Differentiate fixed cost from variable cost.
2. Calculate:
• Total Variable (June and July )
• Fixed cost (June and July)• semi variable cost (June and July)
2.1 Introduction to cost behaviorLearning Activity 2.1
Question
Classify above costs based on its behaviour.
2.1.1 Main classification of cost behavior
Cost behavior refers to the change in costs (increase or decrease) as the
output level changes, i.e. as we increase output, are the costs rising, dropping or
remaining the same. Cost behavior can be used to produce various classifications
of costs such as:
a. Variable Costs
Are costs that increase or decrease proportionately with the level of activity
i.e. cost of an activity that changes with the level of output or level of activities.
The total amount of variable cost tends to change in respect to changes in
production volume but the variable cost per unit stays at the same level under
the same level under the same manufacturing environment and production
methods. For example if 1kg of a material is needed for each cost unit then
100,000 kg will be required for 100,000 units of production and 500,000 kg for500,000 units of production. The total variable cost can be expressed as:
Note that with variable costs, the cost is zero when production level is zero.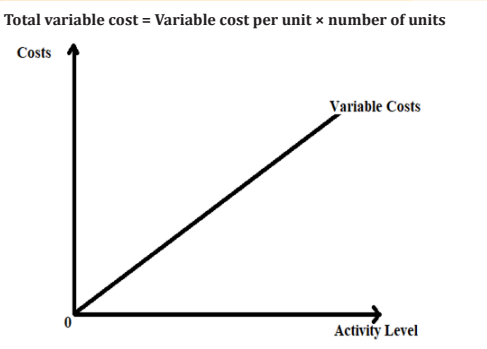
The cost increases in proportion due to the increase in the activity level, thus
the variable cost function is represented by a straight line from the origin. The
gradient of the function indicates the variable cost per unit.
b. Fixed Cost
Fixed cost is the cost which does not vary with the change in the volume of
activity in the short run. These costs are not affected by temporary fluctuation
in activity of an enterprise. These are also known as period costs. This may
include the rent of a factory or straight-line depreciation of plant and machinery.
The classification of cost into fixed and variable costs would only hold within
a relevant range beyond which all costs are variable. The relevant range is the
activity limits within which the cost behaviour can be predicted.
c. Semi variable costs
Are costs with both a fixed and variable cost component. The fixed component
is that portion which is constant irrespective of the level of activity.
The fixed part of semi variable cost represent minimum fees for making
particular item or services available . For example, a telephone bill includes a
fixed element being the fixed line rental for the period and a variable element
that will increase as the number of calls increase, the behavior of Semi variablecost is shown below:
a. Stepped cost or Semi Fixed Costs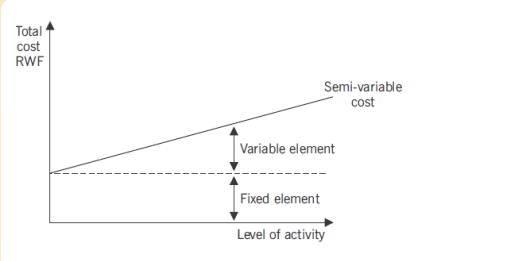
Are costs with both a fixed and variable cost component. The fixed component
is that portion which is constant irrespective of the level of activity. They are
variable within certain activity levels but areFixed within other activity levels as shown below:
Consider the depreciation of a machine which may be fixed if production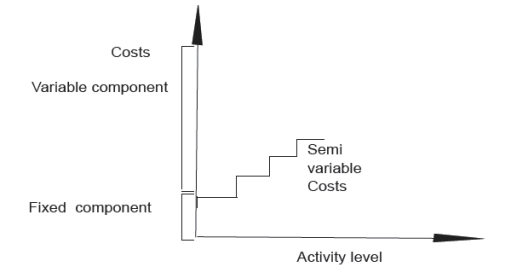
remains below 1,000 units per month. If production exceeds 1,000 units,
a second machine may be required, and the cost of depreciation (on twomachines) would go up a step.
2.1.2. Calculating the fixed and variable elements of
semi-variables costs.
A semi-variable cost is “a cost containing both fixed and variable elements
and which is thus partly affected by fluctuations in the level of activity”. A
typical example of a semi-variable cost is telephone charges containing a fixed
element i.e rental of telephone instrument, and a variable element i.e the cost
of telephone calls made.
Semi-variable cost should be separated into fixed and variable elements by
using the three methods:
a) Comparison method
b) Least squares method or Regression method,
c) High and low points or Range method
a. Comparison method
In this method, cost of two periods or two activity levels are compared. The
difference in these costs is considered as variable cost because it is assumed
that the fixed overhead of two periods or two activity levels is the same. From
this difference of costs, variable cost per unit is calculated.
Cost function
The cost estimating function is a linear equation i.e an expression of therelationship between variables, the independent and the dependent variables.
• Total cost = total fixed cost + total variable cost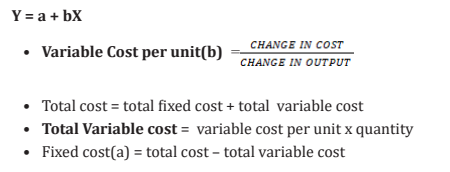
• Total Variable cost = variable cost per unit x quantity
• Fixed cost(a) = total cost – total variable cost
Where:
Y represents the dependent variable or the total cost
a represents fixed cost component of the total cost (Constant amount)
bX represents the variable costs component of the total cost
b represents the unit variable cost (this is the gradient of the equation)
X represents independent variable or the output level
Example
The manager of a shoe factory wishes to develop a method of forecasting
the total costs in any period. The following past costs have been recorded atdifferent levels of activity:
Required: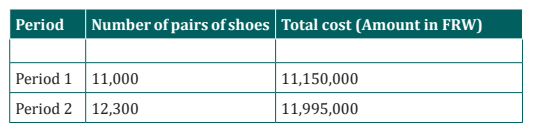
a) Calculate the variable cost per pair of shoes and show Fixed and
Variable costs.
b) What would be the total costs if the current year’s estimate of 12,800
pairs of shoes were actually produced?
Answer
a) We know that Y=a+ bx : total cost = total fixed cost + total variable
cost
Total Variable cost = variable cost per unit x quantityFixed cost =total cost – total variable cost
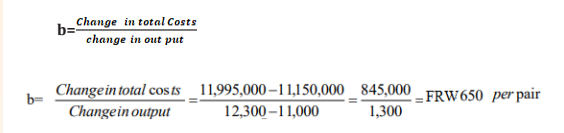
a) Total cost of 12800 pairs of shoes : y=a+bx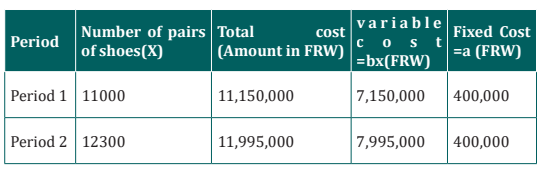
Y=400,000+650(12800) = FRW 12,320,000
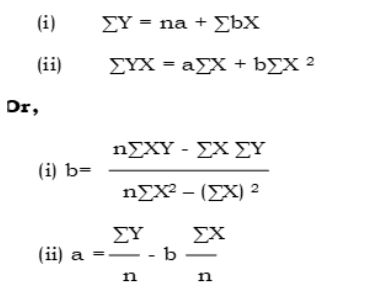
a. Least square Methods
The least-squares method is a crucial statistical method that is used to find a
regression line or a best-fit line for the given pattern. This method is described
by an equation with specific parameters. The method of least squares is
generously used in evaluation and regression. The general formulas used to
compute fixed cost (a) and variable cost (b)are listed below. The equations aresolved simultaneously to obtain the values.
The following data relates to ABC Company limited for the half year period just
ended.
Required: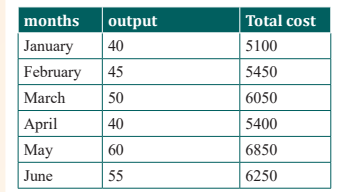
1. Determine the business fixed and variable costs for its manufacturing
overheads by using least square method
2. Write down the cost equation in the form of Y=a + bX.
Answer1. Determine the business fixed and variable costs
i) ΣY=na +b Σx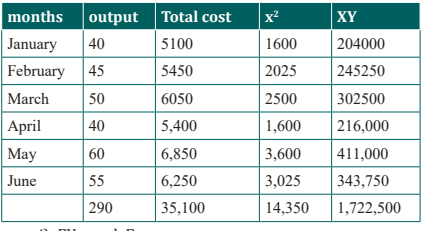
ii) ΣXY- aΣX + b ΣX2
i) 35100= 6a+290b
ii) 1722500=290a+14350b
Multiply equation (i) by 290 and equation (ii) by 6, to eliminate one unknown
variable
i) 35100= 6a+290b ……………x 290………….10179000 =1740a+84100b
ii) 1722500=290a+14350b…….X 6…………….10335000=1740a+86100biii) Difference (new equation ) 156000 = 0 2000b
To obtain a, substitute b in equation (i)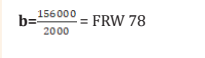
v. 35100=6a+290(78)
-6a=22620-35100-6a=-12480
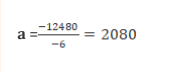
2. the cost equation in the form of Y=a + bX……………………….Y= 2080 +78x
OrDetermine the business fixed and variable costs
2. Equation Y= 2080 +78x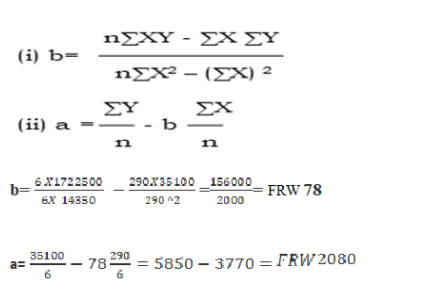
c. High-Low Method
This is a cost estimation based on the relationship between past cost and past
level of activity. Variable cost is based on the relationship between costs at the
highest level of activity and the lowest level of activity. The difference in cost
between high and low activity level is taken to be the total variable cost from
which the unit variable cost can be computed by dividing it by the change in
output level.
The goal of the high-low method is to describe this line mathematically in the
form of an equation stated as f(x) = a+ bX, which requires calculating both the
total fixed costs amount (a) and per unit variable cost amount (b). Four steps
are required to achieve this using the high-low method:
Step 1. Identify the high and low activity levels and the corresponding costs
from the data set.
Step 2. Calculate the variable cost per unit (b).
Step 3. Calculate the total fixed cost (a) or Y
Step 4. State the results in equation form f(x) =Y = a + bX.
Illustration: The following is an extract of the cost data of loyal industries for
the previous year; you are required to determine the variable rate and the fixed
component and construct an equation estimating the total cost for the samecompany.
Step 1. Identify the high and low activity levels from the data set.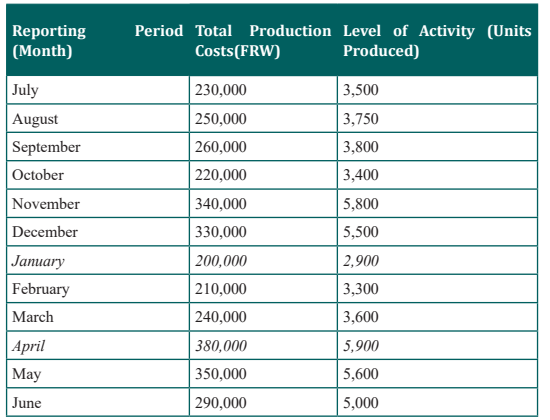
The highest level of activity (level of production) occurred in the month of April
(5,900 units; FRW 380,000 production costs), and the lowest level of activity
occurred in the month of January (2,900 units; FRW 200,000 production costs).Step 2. Calculate the variable cost per unit (b).
Step 3. Calculate the total fixed cost (fx) or Y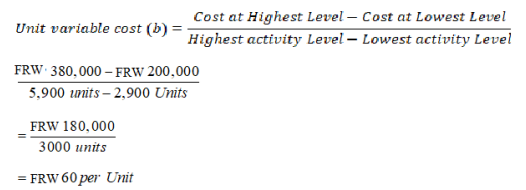
After completing step 2, the equation to describe the line is partially complete
and stated as /Y = a+FRW60X. The goal of step 3 is to calculate a value for total
fixed cost (a). Simply select either the high or low activity level, and fill in the
data to solve for a (total fixed costs), as shown. Using the low activity level of
2,900 units and FRW 200,000,
Y=a+bX
200,000 = a + ( 60×2,900 units)
a = 200,000 − (60×2,900 units)
a = 200,000 − 174,000
a = FRW 26,000
Thus total fixed costs total FRW 26,000. (Try this using the high activity level
of 5,900 units and FRW 380,000. You will get the same result as long as the per
unit variable cost is not rounded off.)
iv) State the results in equation form f(x) =Y = a + bX.
We know from step 2 that the variable cost per unit is FRW 60, and from step
3 that total fixed cost is FRW 26,000. Thus we can state the equation used to
estimate total costs asf(x) or Y = FRW 26,000 + FRW 60X
Application activity 2.1
Question
1. The Cost perunit amount of three different production costs forDalius Ltd are as follows:
What type of cost is each of these three costs?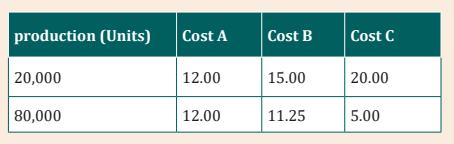
a) Cost A is mixed, Cost B is variable, Cost C is mixed
b) Cost A is fixed, Cost B is mixed, Cost C is variable.
c) Cost A is fixed, Cost B is variable, Cost C is mixed.d) Cost A is variable, Cost B is mixed, Cost C is fixed
2. The following information is extracted from the books of INYANGEIndustries Ltd for the year ended 31st December 2022.
You are required to seperate the above costs into fixed and variable elements
using the following methods of Ordinary Least Squares and High and lowpoints or Range method.
2.2. Cost-Volume-Profit (CVP) Analysis.
Learning Activity 2.2
Bank of Kigali is a commercial bank operating its business activities in
Rwanda. It uses its Agents to provide good services to its customers. Bank
of Kigali paid its agent a commision of 5% on deposit FRW 10,000 and the
commission is only source of income to the Bank of Kigali agent. The Bank
of Kigali agent fixed cost is FRW 200,000 per month (Salary and Rent) and
variable cost is FRW 350 per client deposited FRW 10,000 and average
number of client served per month is 4000 clients.
The Bank of Kigali has collected information about the customer satisfaction
and revealed that the customers are complaining for the high bank charges
on agent services.
The management of Bank of Kigali after a deep analysis of this situation, has
just announced a revised payment schedule of 4% commission on deposit
FRW 10,000. Fixed cost remains constant and variable cost has reduced to
FRW 300 per client served and the bank expected that the average number
of clients will increase to 5000 clients.
Question
1. What do you understand by cost, volume profit?
2. Calculate the number of customers, the BK agent are able to serve at
Break Even Point before and after revising the payment structure.
3. After revising the cost structure, BK agent set a targeted profit of FRW
500,000, how many customers the agent will be required to serve to get
this profit.
2.2.1 Introduction to cost-volume Analysis
Cost-Volume-Profit analysis is the study of the effects on changes on future
profit of changes in fixed cost, variable cost, sale price, quantity, and mix. There
is a direct relationship between cost, volume of output and profit. CVP analysis
examines the relationship of cost and profit to the volume of production to
maximize the profit of the firm. It is a logical extension of marginal costing and
is used as a very powerful tool by the management in the process of budgeting
and profit planning.
a. Elements of CVP analysis
CVP analysis establishes a relationship between cost, volume of output and
profit. It evaluates the effect on profit due to changes in cost and volume of
output. This analysis consists of several integral parts or components which
are as follows:
i) Marginal Cost equation
ii) Contribution
iii) Profit/volume (P/V) Ratio
iv)Break-Even Point (BEP)
v) Margin of safety
2.2.2. Marginal Costing
a. Marginal Cost Equation
Marginal Cost Equation exhibits the relationship between contribution, fixed
cost and profit. It explains that the excess of sales over the variable cost is
the contribution towards fixed cost and profit. Marginal Cost Equation can be
developed as follows:
Sales S Total Cost Profit P= +
or
Total Cost Fixed cost F Variable Cost V =
Therefore S F V P or S V F P = + + −= +
b. Contribution
Contribution is the excess of sales over variable cost. More clearly, contribution
is that portion of sales which remains after recovering the variable cost to that
extent of sales. This contribution is available towards fixed cost and profit.Mathematically, contribution can be expressed as follows:
Sales xxx
Less: Variable cost xxx
Contribution xxx
Less: Fixed cost xxx
Operating Profit xxx
Therefore
Sales - Variable cost = Contribution
Fixed cost + Profit = ContributionFixed cost - Loss = Contribution
XYZ Ltd produces 2,000 units of a product X, are sold at FRW 10 per unit,
Variable cost of manufacturing the product is FRW 6 per unit and the total fixed
cost is FRW 5,000. Calculate the contribution from the given data.
Sales 10
Less: Variable cost 6
Contribution 4 X2000
Less: Fixed cost 5000
Operating Profit 3000
Total contribution = contribution per unity * Quantity = 4X2000 = 8000
FRWa. Profit- Volume (P/V) Ratio / Contribution margin ratio
Profit-Volume ratio is the ratio of contribution and sales. It is generally expressed
in percentage. It exhibits the percentage of contribution included in sales. It
indicates the effects on the profit for a given change in sales. Mathematically,P/V Ratio can be expressed as follows:
Illustration : Consider the following contribution margin P/V Ratio format
income statement of Alpha & Son Ltd.in which sales revenues, variable expenses,
and contribution margin are expressed as percentage of sales.
Description Total(FRW) Per Unit(FRW) Percent of Sales
Sales (400 units) 100,000 FRW 250 100%
Less variable expenses 60,000FRW 150 60%
Contribution margin 40,000 FRW FRW 100 40%
Less fixed expenses 35,000
Net operating income 5,000 FRW
According to above data of Alpha & Son Ltd. the computations are: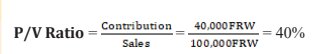
In a company that has only one product such as Alph & Son Ltd P/V ratio can alsobe calculated as follows:
The impact on net operating income of any given cash change in total sales can
be computed in seconds by simply applying the CM ratio (P/V Ratio) to the cash
change.
For example if the Alpha & Son Ltd plans a FRW 30,000 increase in sales during
the coming month, the contribution margin should increase by FRW 12,000
(30,000 INCREASED sales * CM ratio of 40%). As we noted above, net operating
income will also increase by FRW 12,000 if fixed costs do not change. This is
verified by the following table:
* Expected net operating income of FRW 17,000 can also be calculated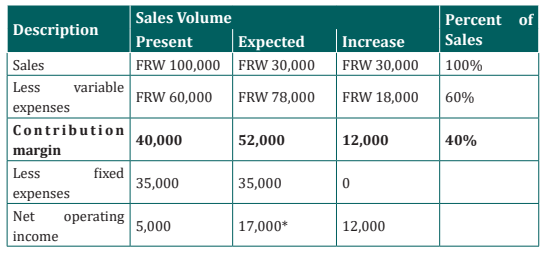
directly by using the following formula:
[P*= (Sales × CM ratio) – Fixed Cost]P* = Profit
2.2.3. Break - Even Point (BEP)
Breakeven point is the level of output or sales at which the business does not
make profit nor incur loss. At that level, total revenue is equal to the total cost
or Break-even point is point where the business is neither incurring profit nor
loss. This is the turnover that enables enterprise to cover all expenses without
profit or loss.
a. Break-Even Point Calculation
Break-Even point is the level of sales at which profit is zero. At break-Even point
sales are equal to fixed cost plus variable cost (Sales = fixed cost + variable
cost).
The break-Even point can be calculated using either Equation method orContribution margin method.
Equation method
The equation method centers on the contribution approach to the income
statement.
According to the definition of Break Even point, Break Even point is the level of
sales where profits are zero. Therefore the Break Even point can be computed
by finding that point where sales just equal the total of the variable expensesplus fixed expenses and profit is zero.
Example:
Given data are as follow:
• Sales price per unit = FRW250
• Variable cost per unit = FRW150
• Total Fixed expenses = FRW35,000
Formula of Break Even Point: Sales = Variable expenses + Fixed expenses +
Profit
FRW 250Q* = FRW 150Q* + FRW 35,000 + FRW 0
FRW 100Q = FRW 35000
Q = FRW35,000 /FRW 100
Q = 350 Units
Q* = Number (Quantity) of units sold.
The Break-Even point in sales dollars can be computed by multiplying the
break-even level of unit sales by the selling price per unit. 350 Units × FRW 250
per unit = FRW 87,500
– Contribution margin method
The contribution margin method is actually a short cut conversion of the
equation method already described. The approach centers on the idea discussed
earlier that each unit sold provides a certain amount of contribution margin
that goes toward covering fixed costs. To find out how many units must be soldto break even, divide the total fixed costs by the unit contribution margin.
FRW 35,000 / FRW 100* per unit =350 Units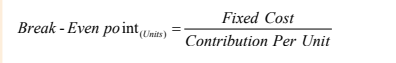
*S250 (Sales) – FRW 150 (Variable exp.)
A variation of this method uses the CM ratio (P/V Ratio) instead of the unit
contribution margin. The result is the Break-Even in total sales dollars rather
than in total units sold.
Example 1. Alpha bakery producing biscuits wants to evaluate the company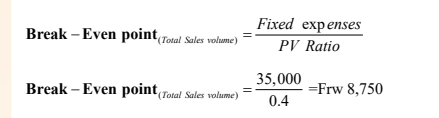
performance based on information recorded. If its fixed cost are FRW 200,000
and its variable cost to produce one packet of biscuit is Rwf 2 and its selling
price for each packet of biscuits is FRW 4,Calculate break even point of alphabakery.
Answer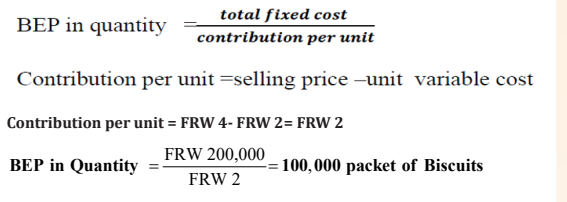
Break even point in value =100,000 X 4 = FRW 400,000
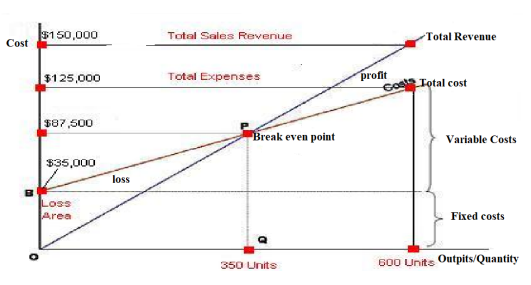
b. Cost Volume Profit (CVP) Relationship in Graphic Form
The relationships among revenue, cost, profit and volume can be expressed
graphically by preparing a cost-volume-profit (CVP) graph or break-even chart.
A CVP graph highlights CVP relationships over wide ranges of activity and can
give managers a perspective that can be obtained in no other way
Preparing a CVP Graph or Break-Even Chart
In a CVP graph sometimes called a break-even chart, unit volume is commonly
represented on the horizontal (X) axis and cost and revenues on the vertical(Y) axis. Preparing a CVP graph involves ploting the total revenue and total cost
curves and the point of intersection of the two is the the breakeven point.
Example1.
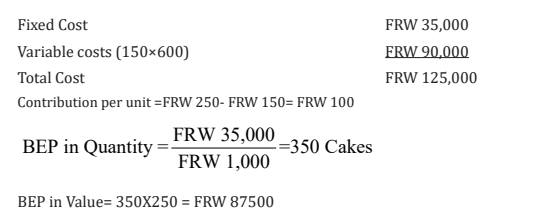
OLAN LTD is a bakery business which produces 600units (Cakes) and each
Cake is sold at FRW 250 and the variable cost per unit is FRW 150. Calculate
the breakeven point in quantity and in value and then plot these informationon graph.
c. Target Profit Analysis
Cost volume profit (CVP) formulas can be used to determine the sales volume
needed to achieve a target profit.
Example:
DANI Ltd has the following cost information in its books:
• Sales price per unit = FRW 250
• variable cost per unit = FRW 150
• Total fixed expenses = FRW 35,000
• Target Profit = FRW 40,000
Required: How many units would have to be sold to earn a profit of 40,000?
Solution:
The CVP Equation Method:
Under equation method: Instead of solving the equation where profits are zero,
we solve the equation where profits are FRW 40,000.
Sales = Variable expenses + Fixed expenses + Profit
250Q = 150Q + FRW 35,000+ FRW 40,000
100Q = FRW 75,000
Q = 75,000 / 100 per unit
Q = 750 Units
Thus the target profit can be achieved by selling 750 units per month, whichrepresents FRW 187,500 in total sales (250* 750 units).
d. The Contribution Margin Approach
A second approach involves expanding the contribution margin formula to includethe target profit.
This approach gives the same answer as the equation method since it is simply
a short cut version of the equation method. Similarly, the sales value needed toattain the target profit can be computed as follows:
e. Margin of Safety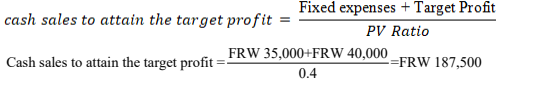
The margin of safety is the excess of budgeted or actual sales over the breakeven
volume of sales. It states the amount by which sales can drop before losses
begin to be incurred. The higher the margin of safety, the lower the risk of not
breaking even.Margin of Safety Formula
The formula for the calculation of margin of safety in sales value is:
Illustration
Sales (400 units @ FRW 250) ----- FRW 100,000
Break even sales---------------- FRW 87,500
Required: Calculate margin of safety in sales value.
Solution
Sales (400 units @ FRW 250) FRW 100,000
Break even units (at 350 units) FRW 87,500Margin of safety in sales value FRW 12,500
Margin of safety as a percentage of sales
Margin of safety as a percentage = [(Budgeted or Actual sales – Breakevensales)/Budgeted or Actual sales]
It means that at the current level of sales and with the company’s current prices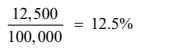
and cost structure, a reduction in sales of 12,500 FRW, or 12.5%, would result
in just breaking even. In a single product firm, the margin of safety can also
be expressed in terms of the number of units sold by dividing the margin of
safety in dollars by the selling price per unit. In this case, the margin of safety
is 50 units (12,500 ÷ 250 units = 50 units) or Budgeted or Actual sales units –Breakeven units
Limitations of breakeven analysis
Breakeven analysis is a useful tool for problem solving and decision making,
but some of the limitations should be noted:1. The breakeven analysis assumes that cost and revenue behaviour patternsApplication activity 2.2
are known and that the change in activity levels can be represented by a
straight line, which is not always the case.
2. It may not always be feasible to split costs into variable and fixed
categories. Some costs show mixed behaviour.
3. The breakeven analysis assumes that fixed costs remain constant over
the volume range under consideration. If that is not the case, then
the graph of total costs will have a step in it where the fixed costs are
expected to increase.
4. Breakeven analysis, as described so far in this book, assumes production
and sales volumes are the same, so that there is no build-up of stocks and
work-in-progress.
5. Breakeven charts and simple analyses can only deal with one product at
a time.
6. It is assumed that cost behaviour depends entirely on volume. Theselimitations may be overcome by modifying the breakeven analysis.
Q1. Choose the correct answer.
ABC Company sells shoes for FRW 450 per pair of shoes. The variable cost
is FRW 200 per pair of shoes. The fixed costs are FRW 750,000. What is the
breakeven in sales?a) FRW 750,000Q2. IHIRWE Ltd has recorded the following semi-variable cost over
b) FRW 937,500
c) FRW 1,350,000d) FRW 1,687,500
the past six months:
Estimate IHIRWE Ltds’ fixed cost and variable cost by using the high/low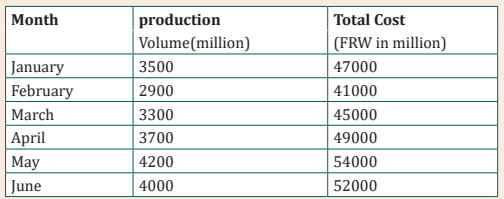
method.
Skills Lab 2
Gs Ubumenyi has the policy of promoting entrepreneurship clubs, During
the set up and the running of their student business club at their school, the
school administators committed to cover the fixed costs and other costs to
be covered by entrepreneurship club members. The club has prepared
a business estimates of operating a saloon business at school. In theirbusiness plan the following expected cost and revenues were presented.
The management of Gs ubumenyi has approved the above business
estimates and requested the students to determine the contribution
of the school and that of the club members. After reviewing the above
information, using comparison method:
1. Calculate the contribution (Variable costs) of students in this
business
2. Calculate the contribution of the school (Fixed costs) in this business
3. Prepare a short report to be presented to the club members and
the school management advising them on how their contributionwould be collected.
End of unit assessment 2
Questions1. Define break-even point.An activity level that the company expects to operate at is called a
2. Complete the following sentence by choosing the best answer from
the choices givena) Margin of SafetyOver the last five years, Amahoro Ltd has recorded the following costs:
b) Relevant range
c) Contribution margin
d) Target net income
Amahoro Ltd wants to estimate the cost for 2023,when they expect toproduce 52,000units.
Q4. ABC Ltd provides below information to professional accountant to
get his professional advise. The management requires the professional
accountant to determine the break- even point in units and Value and todetermine the quantity required to get a profit of FRW 1,200,000
a) The management requires the professional accountant to
determine the break- even point in units and in Valueb) Determine the quantity required to get a profit of FRW 1,200,000