Topic outline
UNIT 1: THE STRUCTURE OF COSTING SYSTEM WITHIN AN ORGANIZATION
Key Unit Competence: Explain the structure of costing system within anorganization
Introductory activity
The Brothers Ltd Co. is a hospitality company operating in Huye District. It
has been hired by its potential customer Neza to serve her wedding ceremony.
The company has been requested to perform different activities: decoration,
meal provision and soft drinks to host such an event, transport facilities from
the beginning to the end of the ceremony, as well as the coordination of
ceremony and to entertain guests. Before signing a contract, The Brothers Ltd
co. exhorted its accountant to firstly assess various costs that will occur for
activities to be performed in order to set affordable price, but the company
was not well informed about the number of people to be hosted for proper
financial valuation of resources to be used in the job completion. Later the
client informed the company that 750 people were approved to attend the
wedding. The company policy is to compute the cost based on material
used, skills required, direct expenses, overhead and the quality of service.
However, accountant has revealed that the amount of money to be spent for
individual item was structured as follows: meal as a product: FRW 3500 and
soft drinks FRW 1,400 per person; decoration and transport as services were
FRW 650,000 and FRW 300,000 respectively as fixed cost; and FRW 150,000
to Master of Ceremony (MC) for his coordinating and organizing role duringthe event.
Question:
1. Basing on the above case study, what is about the scenario?
2. Outline different activities that require cost.
3. Define costing?4. Explain the main costing methods as used in product costing
1.1 Introduction to costing systemLearning Activity 1.1
Ruberwa is soler trader producing and selling bread, juice and biscuits.
Ruberwa as an entrepreneur does not have sufficient skills and necessary
information to compute the cost of each product; he estimates the cost of
product based only on ingredients recorded during the production process.
While selling, he gets many customers due to the lower price resulting
from wrong costing system comparatively to surroundings business.
Considering high sales and getting a lot of money in the pocket, he thinks
that really, he will get high profit; unfortunately, he gets loss at the end of
the year in his financial statement. He decided to hire an accountant for
monitoring and controlling exist costs so as to know the main cause of this
problem. The accountant revealed that information used in computation
of the cost of product was incomplete for each product because the owner
only considered the portion of direct material cost recorded and did not
consider labor cost, direct expenses and overhead incurred during andafter the production process.
RUBERWA was surprised by the cost review report provided by
accountant, the later has been requested to calculate the cost of each
product appropriately. In next accounting period, RUBERWA recognized a
significant profit resulting from good computation of the production costand setting affordable price.
Questions
1. From the above scenario, what do you understand by a costing
system?
2. Identify the lesson you learnt from this case study.
3. As an accountant of Ruberwa, explain he main advantages forinstalling a good costing system in your organization.
1.1.1. Definition of key concepts
Today different business and industry needs different methods for calculating,
monitoring and controlling cost to meet their individual requirements. It
is not possible to devise a single costing system to fulfill everybody’s needs.
Different methods of costing for different industries depending upon the type
of manufacturing and their nature have been developed. Various methods
of ascertaining costs are available to suit the business needs. But the basic
principles are the same in every method.
• Product cost
Product cost refers to the costs incurred to make or produce a product. These
costs include direct labor, direct materials, direct expenses and overhead cost.
• costing
Costing’ refers to the methods and processes of determining costs of a product
manufactured or services rendered. or costing is the technique and process of
ascertaining costs.
• Costing system
Costing system is that system in which we calculate different cost with different
methods and also monitor cost for reducing wastages and misuse of resources.
Costing system comprises of a set of forms, processes, controls and reports that
are designed to aggregate and report to the management about revenue, costs
and profitability. It ascertains product profitability and helps management in
planning and control of business operations.
1.1.2. Characteristics of a good costing system
A good Costing System will consist of the following characteristics:
• The Costing System adopted in a particular organization must suit its
nature and size of business and its information needs.
• The Costing System must be economical to the organization and the benefits
derived from the system should be more than its cost of installation and
operation.
• The system should be more flexible enough to take care of changing
business situations and information needs of the organization.
• The system should be simple to understand and easy to operate. The users
of costing data should be convinced of the Costing System from which the
data is derived.
• The Costing System should ensure proper accounting for materials, labour
and overheads and proper classification of transactions should be done at
the level of recording.
• The Costing System should clearly mention the details of records to be
maintained and the degree of accuracy of data required.
• Since the Costing System is for internal control purpose, it should meet the
requirements of management and its information needs.
• The costing system should fix up the duties and responsibilities of costing
department staff and the cooperation that can be sought from other
departments.
1.1.3. Effective conditions for a good costing system installation
As a system designer, the cost accountant should be able to perceive the needs
of the management at various levels and design such a system as will meet
those needs promptly, effectively and efficiently. The following conditions and
factors must be taken into account when designing a costing system:• Preliminary investigations must be made before a system is installed. ThisThe following factors must be taken into account before finalising the cost
help to discover weaknesses and inefficiencies
• For accuracy of cost records, a system of material cost, labour cost and
production overhead cost is essential
• Nature of business enterprise must be put into consideration when
designing a cost system accounting system. the system developed should
be practical and must suit the business.
• The system must be cost effective in that the benefits derived from the
system must be greater than the cost of running it.
management system• The system must be designed in such a way as to meet managerial1.1.4. Advantages of installation a costing system.
information needs. There should be no duplication in reporting.
• The factory layout and production sequence. This is important for the
identification of the sequence of production.
• The nature of material used affect the system adopted. This is because it
affects the recording and issue of raw materials and method of pricing.
• Control exercise over production: the cost data must focus on specific
areas of control so that any variance between actual and standard cost can
be identified by the individual department.
• The deployment of workers, who may work as a team or as individuals.
This affects the method of remuneration and analysis of time worked.
• Key personnel and office staff, their cooperation is vital for success of the
system. In addition, the system needs to be simple and easy to understand
to enhance acceptability.
• Need for uniformity; a business needs to observe the industrial norms and
thus follow the industrial practices as regards the accounting.
• The cost benefit analysis should be carried out and it is only reasonable to
run a system which has more benefits than cost.
• The system should be capable of adapting to changing conditions.• It should be logical and simple.
Cost accounting has now become the norm in most industries and firms.
Almost all businesses rely on cost accounting information to supplement
the information provided by financial accounting. In fact, cost accounting is
essential not only to businessmen and the management but also to the economy
as a whole.
a. Measuring and Improving efficiency
Cost accounting allows for data that enables the firm to measure efficiency.
This isefficiency in respect to cost, time, expenses etc. Standard costing is then
used to compare actual outcomes with the industry or economy standards to
indicate changes in efficiency.
b. Identification of Unprofitable Activities:
Just because a firm is making overall profits, it does not mean all activities
are profitable. Cost accounting system will help us identify the profitable and
unprofitable activities of the firm. Activities that cause the firm losses can be
made profitable or eliminated. This can happen due to the cost ascertainment
done in cost accounting.
c. Fixing the price
Costing system makes the distinction between fixed and variable cost, which
allows the firm to fix prices in different economic scenario. prices that we fix
without the help of costing system can be too high or too Low and both cause
losses to the business.
c. Control over Stock
Costing system helps with restocking and control over materials. Cost accounting
system will help us determine the most ideal and economic re-order level and
quantities. This will ensure that the firm is never overstocked or understocked.
e. Evaluates the Reasons for Losses
Every firm has to deal with periods of profits and losses, hence they must
always evaluate or investigate the reasons for the losses suffered. This will help
to tackle the problem or overcome the cause by some other means necessary. if
the cause can not be eliminated then at least minimize the losses.
f. Aids Future Planning
One of the biggest advantages of cost accounting system is that it will help the
management with future plans they may have. For any production or selling
plans, it is important to have detailed data about the machines, the labour
capacity, output levels, levels of efficiency of each process.
1.1.5. Challenges in installing of costing system
There are different challenges facing the business at the time of installation a
Costing System:
a. Lack of Support from Top Management
The basic objective of Cost Accounting System is to provide necessary
information to the internal management for the purpose of problem solving,
decision making and control. Without support and recognition from the top
management, the very purpose of Cost System is insignificant.
b. Resistance from Existing Accounting Staff
The existing accounting staff may resist the introduction of Cost Accounting
System in the organization due to fear of loosing job recognition and importance
after the implementation of the system.
c. Lack of Cooperation from other Departments
The employees of other departments may not cooperate for the installation of
Cost Accounting System due to fear of increase in workload as it brings-out
inefficiency etc.
d. Resistance from Operating Level Workers
The foremen, supervisors, workers and other operating level staff may resent
the introduction of cost system on the ground that it will increase their job
responsibilities and paperwork and may fear that it may cause change in wage
structure.
e. Shortage of Trained Staff
The installation and implementation of cost system requires trained, qualified
and experienced staff which may not be available.
1.1.6. Overcoming challenges to costing system
The management of business after finding the above challenges should set
strategies to overcome them. The following are the proposed solutions:
• The management should be convinced of the benefits which can be derived
by installation and operation of a Costing System.
• Non-cooperation and resistance can be overcome by explaining the
simplicity and use of the system and should be assured that the system will
benefit the organization and increase its profitability. They should be given
assurance that the system will not reduce the importance of existing staff.
• To overcome resistance, the existing staff should be properly trained to
take up the responsibilities in the Costing System
• All levels of staff and managers in the organization should be properly
trained and made familiar with the Costing Procedures.
• The system should be simple to understand and easy to operate.
• The benefits derived from Costing System should be more than the costs
incurred on its installation and operation.
• A qualified and experienced cost accountant should be assigned with
responsibility to achieve the desired objectives of the Costing System. He
should be capable of coordinating with other departments.
• The Costing System designed and installed should meet specific
requirements of the concern and it should reduce unnecessary paperwork
of the organization.
• Regular meetings with accounting staff and user departments will clarify
all doubts about the system and eliminate ambiguity.
1.1.7. Steps for installing a good costing system
The steps to be taken into consideration in installing a costing system are given
below:
a. Objective to be achieved through the Costing System
The costing system will be simple if the objective is only to determine cost, but
it will have to be elaborated if the objective is to have information which will
help management in exercising control and taking decisions.
b. Studying the Existing Organisation and Routine
In this connection the points to be noted are the nature of the business and
of the operations or process carried on, extent of responsibility and authority
attached to the various functions, the methods of dealing with wastage of
materials, the system of time recording and the methods of computing and
paying wage.
c. Deciding the Structure of Cost Accounts:
The structure of cost accounts should follow the natural production line; the
sequence can be simple, analytical or synthetic.
d. Determining the Cost Rates
This entails a thorough study of factory conditions and decisions are to be made
about classification of cost into direct and indirect, grouping of indirect costs
into production, selling, administration etc., treatment of wastes of all kinds,
methods of pricing issues, methods of recovering overheads and calculation of
overhead rates.
e. Introducing the System
No costing system can be expected to function effectively unless co-operation
of all the officials could be obtained. Before the system is implemented, the
implications of the system should be explained to all indicating to them the
benefits that will accrue to each and to the business as a whole.
f. Organising the Cost Office
It is always better that the cost office is situated adjacent to the factory so that
delay in routing out documents or in clearing up discrepancies and doubts, is
avoided. The costing staff must be allowed to have access to the works if they
are to perform their duties properly.
1.1.8. Factors to consider for installation of a good costing
system
It is necessary that the costing system is properly installed in an organization.
Costing system installed in an organization should be simple to understand,
easy to operate, highly reliable and suitable to the organization. In designing
and installation of a good costing system, the following factors should be given
due consideration:
a. Size of the firm
Size of the firm is an extremely important factor in designing a cost accounting
system. As the size of the firm and its business grows, the volume and complexity
of the cost data also grows. In such situation, the cost accounting system should
be capable of supplying such information.
b. Manufacturing Process:
Process of manufacturing changes from industry to industry. In some industries,
there may be a continuous process of production while in some batch or job
type of production may be in operation. A cost accounting system should be
such that the manufacturing process is taken into consideration and cost data
is collected accordingly.
c. Nature and Number of Products
If a single product is produced, all costs like material, labor and indirect
expenses can be directly allocated to that product. But if more than one
product is manufactured, the question of allocation and apportionment as
well as absorption of indirect expenses (Overheads) arises and hence the cost
accounting system should be designed accordingly as more complex data will
be required.
d. Management Control Needs: The designing of a cost accounting system in
a business organization is guided by the management control requirements.
The costing system should supply data to persons at different levels in the
organization to take suitable action in their respective areas.
e. Raw Materials: The designing of a cost accounting system in a business is
also guided by the raw materials required for production. The nature of raw
materials and the degree of waste therein influence the designing of costing
system. There are some materials which have a high degree of spoilage.
The costing system should be such that identification of spoilage, keeping
records of materials, pricing of the issues etc are taken into consideration.
f. Organization Structure: The structure of the organization also plays a vital
role in designing a costing system. The system should correspond to thehierarchy of the organization.
Application activity 1.1
1. What are the main characteristics of a good costing system?
2. Complete the following sentences by given terms :
I. Costing refers to the techniques and processes of __________
A. ascertainment of costs.
B. allocation of costs.
C. apportionment of costs.
D. distribution of costs.
II. Cost of sales plus profit is __________.
A. selling price.
B. value of finished product.
C. value of goods produced.D. value of stocks
1.2. Information required in costing systemLearning Activity 1.2
RAVIM Ltd is a manufacturing business which produces high-quality
Soaps compared to existing soap market. The management is not able
to determine the cost of one soap and it sets soap price in reference to
the price of similar soap. At the end of six months, the company prepared
interim financial statement and finds that it made a loss. The management
hired an accountant for installation of a good costing system which could
help the company to determine the cost of the product but the accountant
has not found necessary data to install a good costing system and prepares
a cost sheet which indicates the data needed in his exercise such as cost
of material used, number of employees used , processing cost, number of
hours available per day and overhead absorption cost , the wasted materials
cost during the production process , water and electricity cost, pay rate per
day, packaging cost, overhead cost and the quantity produced during this
period . Accountant decides to meet with different business managers
to collect necessary data related to production process and delivery. After
this exercise he/ she gets necessary data that could allow him/her to
determine the cost of each soap produced and get the opportunity to advise
the managers on the strategies that they can use to reduce the cost of each
department as well as the cost of the soap. This may include reducing theduplication use of resources and reusing existing resources.
Questions
Identify information that an accountant needs to design a good costing system
1.2.1 Identify information required in costing system.
A costing system should collect statistical data for significant operations, analyse
the data, and make it available to the management to support managerial
decision making.
Businesses or industries need sufficient information for installation of costing
system in organization but the type of information required depends on
whether you are a service, trading or manufacturing organization and how you
have structured your cost system. Business needs the following information,
including: volume, material quantities, expected output or yield, scrap factor,
standard time, business capacity, labor hours available, material cost, labor
cost and overhead etc
1.2.2. Explain information required in costing system
The availability of information is the lifeblood of any cost and management
accounting system. It is vital that input information is properly controlled in
order that output information is useful. Such information must be relevant
for management‘s planning, control and decision-making purposes. The
information used in cost and management accounting may be quantitative or
qualitative.
• Quantitative information is information which may be measured in
monetary terms or other physical units eg material may be expressed as
FRW 200 or 500 Kilos. It is easily objectively expressed.
• Qualitative information: is that information which cannot be objectively
expressed. It is therefore very difficult to quantify such information and
for this reason, it is largely subjective. The management accounting mainly
utilizes mixture of the two but mainly quantitative information.
The information required for installation a good costing system are:
• Volume
The volume levels usually drive the number of resources required or consumed
by the organization. It is the starting point for any budgeting or forecasting
exercise and is a critical element to determine capacity utilization and its
impact on the cost structure of the organization.
• Materials quantities
This information is important for business organizations and will generally
be found in the bill of materials. It provides the quantities required of each
component or ingredient that is used to manufacture the product. In some
service organizations, materials may also represent significant costs, for
example, a power generation facility typically consumes a significant amount
of carbon or fuel in the production of electricity.
• Expected output or yield
For process manufacturers, each product should have an expected or theoretical
output for each process based on the key ingredient. In service organizations,
the expected yield represents the expected output of a process based on a fixed
level of input.
• Scrap factor
This factor will reflect how much materials are lost as a normal part of the
process. Discrete manufacturers commonly use the scrap factor to recognize
expected materials losses resulting from breakage, spillage, equipment failures,
and operator errors.
• Process parameters.
Process parameters are used to determine the time standards, particularly
for machine-paced operations. They generally describe the cycle time of the
process such as bottles or capsules per minute and the number of workers
required to run the operation. Process parameters vary significantly from
industry to industry.
• Business process Capacity.
The team should determine the practical and available capacity of each
major business process and how much of this capacity is being utilized. This
information can help identify improvements in capacity utilization and is used
to isolate the cost of excess capacity in the unit cost.
• Materials costs.
This cost represents the actual, standard, forecasted, or estimated cost of
the material components or ingredients that are consumed by the product or
service. The materials costs usually includes the purchase price of the goods
plus other costs such as freight, insurance, royalty payments, tax, brokerage
fees, and duties. In organizations that have high materials costs, focusing on
this area can produce significant cost savings.
• Labor and overhead costs.
This information is necessary to calculate the labor and overhead rate that will
be used to assign these costs to the items being measured. Usually organizations
budget and collect labor and overhead costs by work areas or departments. The
team should ensure that the way the organization is currently collecting actual
costs is consistent with the system design.
Application activity 1.2
1. Explain the information needed to design a good costing system in
organization
2. Matching questionMatch up the following services with their typical cost units
1.3. Types of costing system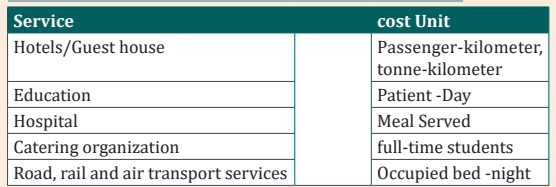
Learning Activity 1.3
PIKU co. is a company which produces and provide different products
such as manufacturing of modern plastic bucket, manufacturing motor
vehicles, construction services and road maintenance, it receives two
purchase orders, one for 2000 plastic buckets and second 5 motor vehicles
and winning two tenders, one for construction a mega building house and
second for road maintenance. The main problem in this company is to
know the method that should be used to calculate the cost of each product.
Purchase order 1: For manufacturing plastic bucket, Kaneza requests 2000
plastic bucket of 10 liters with the following specification: 1000 plastic
bucket should be in a yellow color and the remaining should be in a white
color and the purchase order should be delivered within 15 days. And the
payment will be made on condition that the company supplies all quantity
required in time.
Purchase order 2: For manufacturing the motor vehicle, Muzika Ltd in
its purchase order requests motor vehicle materials that can be used to
manufacture 5 motor vehicle (V6 Tesla) and assembling will be done in
its premises after physical testing; and the payment will be done based on
batch tested.
Tender 1. Rwanda Housing Authority requests PIKU in its bidding
documents to construct a mega Building in Kigali City and the payment will
be done after completing this activity.
Tender 2. Road maintenance: Rwanda Housing Authority has contracted
PIKU Co. to maintain the Huye – Kigali Road of 154 kilometers in a period
of 1 year and the payment will be done on quarterly basis based on workdone. Consider that the maintenance cost of 1 kilometer is FRW 3000,000.
Question
1. What do you understand by costing methods?
2. Explain costing methods that can be used on
a) purchase order one and twob) tender one and two
1.3.1. Job Costing
Job Costing: This method is used in Industries or businesses where the
production is per the requirements of the customer. In Job Order, the production
is not on continuous basis, rather it is only when order from customers is
received and made as per the specifications of the customers. Consequently,
each job is different from the other one. Method used in such type of business
organizations is the Job Costing or Job Order Costing.
A costing system is designed to suit the way goods are processed or
manufactured or the way services are provided. Each organisation’s costing
method will therefore have unique features but costing methods of firms in the
same line of business will more than likely have common aspects.
The objective of this method of costing is to determine the cost of each job by
preparing a Job Cost Sheet. A job may be a product, unit, batch, sales order,
project, contract, service, specific program or any other cost objective that is
distinguishable clearly and unique in terms of materials and other services
used. The cost of completed job will be the materials used for the job, the
direct labor employed for the same and the production overheads and other
overheads if any charged to the job
1.3.2. Batch Costing
Batch Costing: In the job costing, we have seen that the production is as per the
orders of the
customers and according to the specifications mentioned by them. On the
other hand, batch costing is used where units of a product are manufactured
in batches and used in the assembly of the final product. Thus, components of
products like television, radio sets, motor vehicle and other consumer goods
are manufactured in batches to maintain uniformity in all respects.
It is not possible here to manufacture as per the requirements of customers and
hence rather than manufacturing a single unit, several units of the component are
manufactured as group. For example, rather than manufacturing a single unit, it
will be always beneficial to manufacture say, 75,000 units of the component as
it will reduce the cost of production substantially and bring standardization in
the quality and other aspects of the product. The finished units are held in stock
and normal inventory control techniques are used for controlling the inventory.
Batch number is given to each batch manufactured and accordingly the cost isdetermined.
1.3.3. Service Costing
Cost Accounting has been traditionally associated with manufacturing
companies. However, in the modern competitive market, cost accounting has
been increasingly applied in service industries like banks, insurance companies,
transportation organizations, electricity generating companies, hospitals,
road transport and railway transport, hotels, road maintenance, educational
institutions, road lighting, canteens, port trusts and several other service
organizations. The costing method applied in these industries is known as
‘Operating Costing’. operating costing is, ‘that form of operating costing which
applies where standardized services are provided either by an undertaking or
by a service cost center within an undertaking’.
• Nature of Operating Costing:
The main objective of operating costing is to compute the cost of the services
offered by the organization. For doing this, it is necessary to decide the cost
unitin such cases. The cost units vary from industry to industry. For example,
in goods transport industry, cost per tonnne perkilometer is to be ascertained
while in case of passenger transport, cost per passenger per kilometer is to be
computed
1.3.4. Contract Costing
Contract Costing: Contract Costing is a method used in construction industry
to find out the cost and profit of a particular construction assignment.
The principles of job costing are also applicable in contract costing. Contract
Costing can be termed as an extension of Job Costing as each contract is nothing
but a job completed. Contract Costing is used by concerns like construction
firms, civil engineering contractors, and engineering firms. One of the important
features of contract costing is that most of the expenses can be traced to a
particular contract. Those expenses that cannot be traced to a particularcontract are apportioned to the contract on some suitable basis.
Application activity 1.3
1. Differentiate costing method from costing technique.
2. Choose the best alternative.
A. Which of the following organizations should not be advised to
use service costing?
a) Freight rail company
b) IT department company
c) Catering company
d) Clothing company
B. Operating costing is suitable for ___________.
a) job order business.
b) contractors.
c) sugar industries.
d) service industries.
C. Process costing is suitable for _________.
a) hospitals.
b) oil reefing firms.
c) transport firms.d) brick laying firms.
Skills Lab 1
Imagine in your school, students need to consume bread every day and no
one produces bread near the school. Your business club members bring the
idea of bakery but none among the club members has information on what
it requires to produce bread (ingredients, equipments, required skills etc),
As club members research on:
1) Ingredients
2) Equipments3) Skills required in producing bread.
End unit assessment 1
1. Differentiate costing and costing system?
2. complete the following sentence with appropriate words
A. Job costing is used in ..........
a) a) furniture making
b) b) repair shoes
c) c)press printing
d) d) all the above
B. In a job cost system, costs are accumulated
a) On a monthly basis
b) By specific job
c) By department or process
d) By kind of material used
C. Operating costing is suitable for ___________.
a) job order business.
b) contractors.
c) sugar industries.
d) service industries.
1. Suggest the challenges faced during installation of a good costing
system and propose the possible solution for each challenge.
2. BAHO is a profit oriented business which produces and sells
different products such as jeans clothing, Television Manufacturing,
transport services and civil engineering contractors services , its
sales and marketing department has the task to search for themarket of its products.
On 1 January 2023 the company received a purchase order for 1000 jeans
for men and 1000 jeans for women from Terimbere and each jeans should
be delivered at 15000FRW.
On 1 January 2023 the company received a purchase order of 1200
Televisions from AGAHOZO TV shop and each television should be
delivered at 200,000FRW and the payment will be done based on batchdelivered.
15 January 2023 the management was contracted by REB for transporting
students from their homes to their schools and payment was to be made
when all students reached to their schools.
On 20th January 2023 won a tender of constructing model village in
Nyamagabe. The contract specify the terms of payment, first term the
company will receive a half of total amount and the remaining half will be
paid after official handover
Required
a) As cost accountant, some costing method are appropriate to the
above case, highlight at least four and propose a brief explanation
on the Indicator / activities for each costing method using BAHOcase.
UNIT 2: COST BEHAVIOR ANALYSIS
Key Unit Competence: Analyze Cost behavior for decision making
Introductory activity
VUDUKA express Ltd is a transport company operating its business
activities in Rwanda. It has a policy of increasing the numbers of
customers and minimizing costs resulting to the rise of profit.
In June and July 2022 the company incurred different costs; variable and
Fixed. for example in June the company purchased 2 coasters for FRW
10,000,000 each, in June and July the company rented 5 offices for FRW
100,000 each per month , June and July company paid taxes of FRW
80,000, in June salaries FRW 1,700,000 and in July salaries of FRW
2,000,000 ; June Paid electricity bills of FRW 150,000 and in July was
FRW 200,000 and maintenance cost of FRW 400,000 in June and FRW
450,000 in July . It was noted that the company costs of fuel depend on
the length of travel covered; but in June Fuel cost was FRW 1,100,000
and in July fuel cost was FRW 1,200,000 , Telephone bills in june was
FRW 150,000 , the cost of telephone was FRW 100,000 and Airtime was
FRW 50,000 but in July the cost of telephone remained constant and
the cost of airtime was FRW 80,000. Additionally, the company keeps
the drivers’ allowances of FRW 800,000 per month for attracting andmaintaining the drivers.
Questions:
1. Differentiate fixed cost from variable cost.
2. Calculate:
• Total Variable (June and July )
• Fixed cost (June and July)• semi variable cost (June and July)
2.1 Introduction to cost behaviorLearning Activity 2.1
Question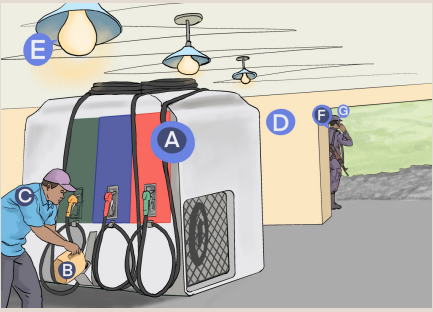
Classify above costs based on its behaviour.
2.1.1 Main classification of cost behavior
Cost behavior refers to the change in costs (increase or decrease) as the
output level changes, i.e. as we increase output, are the costs rising, dropping or
remaining the same. Cost behavior can be used to produce various classifications
of costs such as:
a. Variable Costs
Are costs that increase or decrease proportionately with the level of activity
i.e. cost of an activity that changes with the level of output or level of activities.
The total amount of variable cost tends to change in respect to changes in
production volume but the variable cost per unit stays at the same level under
the same level under the same manufacturing environment and production
methods. For example if 1kg of a material is needed for each cost unit then
100,000 kg will be required for 100,000 units of production and 500,000 kg for500,000 units of production. The total variable cost can be expressed as:
Note that with variable costs, the cost is zero when production level is zero.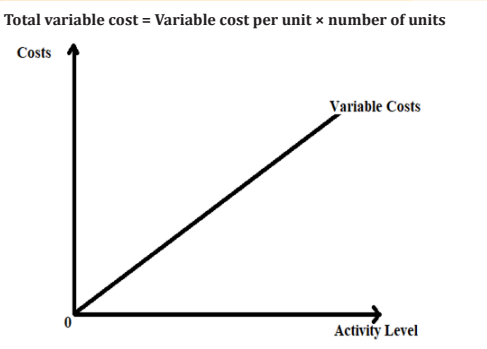
The cost increases in proportion due to the increase in the activity level, thus
the variable cost function is represented by a straight line from the origin. The
gradient of the function indicates the variable cost per unit.
b. Fixed Cost
Fixed cost is the cost which does not vary with the change in the volume of
activity in the short run. These costs are not affected by temporary fluctuation
in activity of an enterprise. These are also known as period costs. This may
include the rent of a factory or straight-line depreciation of plant and machinery.
The classification of cost into fixed and variable costs would only hold within
a relevant range beyond which all costs are variable. The relevant range is the
activity limits within which the cost behaviour can be predicted.
c. Semi variable costs
Are costs with both a fixed and variable cost component. The fixed component
is that portion which is constant irrespective of the level of activity.
The fixed part of semi variable cost represent minimum fees for making
particular item or services available . For example, a telephone bill includes a
fixed element being the fixed line rental for the period and a variable element
that will increase as the number of calls increase, the behavior of Semi variablecost is shown below:
a. Stepped cost or Semi Fixed Costs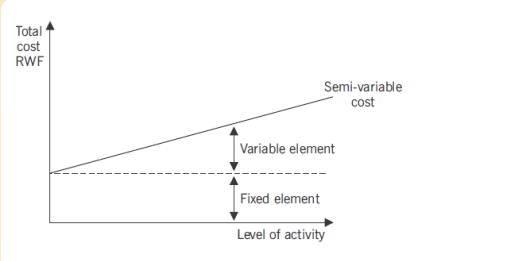
Are costs with both a fixed and variable cost component. The fixed component
is that portion which is constant irrespective of the level of activity. They are
variable within certain activity levels but areFixed within other activity levels as shown below:
Consider the depreciation of a machine which may be fixed if production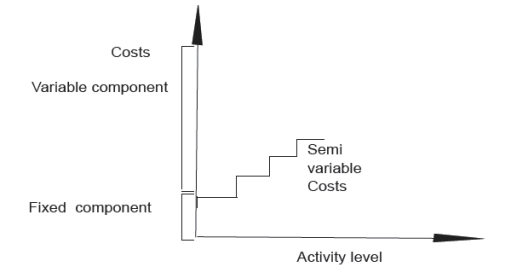
remains below 1,000 units per month. If production exceeds 1,000 units,
a second machine may be required, and the cost of depreciation (on twomachines) would go up a step.
2.1.2. Calculating the fixed and variable elements of
semi-variables costs.
A semi-variable cost is “a cost containing both fixed and variable elements
and which is thus partly affected by fluctuations in the level of activity”. A
typical example of a semi-variable cost is telephone charges containing a fixed
element i.e rental of telephone instrument, and a variable element i.e the cost
of telephone calls made.
Semi-variable cost should be separated into fixed and variable elements by
using the three methods:
a) Comparison method
b) Least squares method or Regression method,
c) High and low points or Range method
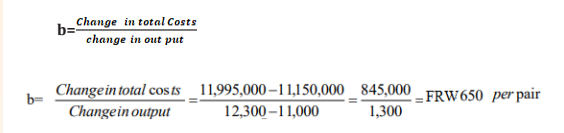
a. Comparison method
In this method, cost of two periods or two activity levels are compared. The
difference in these costs is considered as variable cost because it is assumed
that the fixed overhead of two periods or two activity levels is the same. From
this difference of costs, variable cost per unit is calculated.
Cost function
The cost estimating function is a linear equation i.e an expression of therelationship between variables, the independent and the dependent variables.
• Total cost = total fixed cost + total variable cost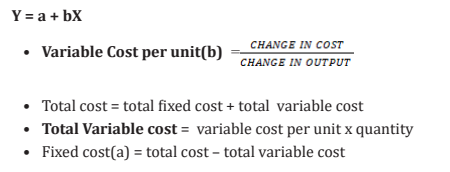
• Total Variable cost = variable cost per unit x quantity
• Fixed cost(a) = total cost – total variable cost
Where:
Y represents the dependent variable or the total cost
a represents fixed cost component of the total cost (Constant amount)
bX represents the variable costs component of the total cost
b represents the unit variable cost (this is the gradient of the equation)
X represents independent variable or the output level
Example
The manager of a shoe factory wishes to develop a method of forecasting
the total costs in any period. The following past costs have been recorded atdifferent levels of activity:
Required: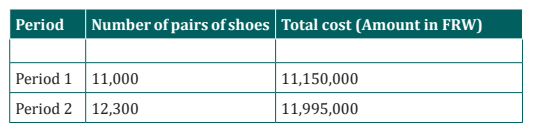
a) Calculate the variable cost per pair of shoes and show Fixed and
Variable costs.
b) What would be the total costs if the current year’s estimate of 12,800
pairs of shoes were actually produced?
Answer
a) We know that Y=a+ bx : total cost = total fixed cost + total variable
cost
Total Variable cost = variable cost per unit x quantityFixed cost =total cost – total variable cost
a) Total cost of 12800 pairs of shoes : y=a+bx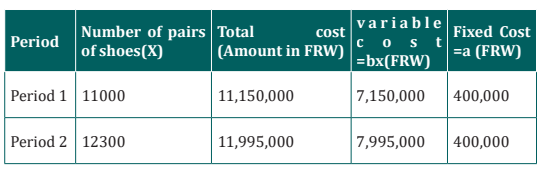
Y=400,000+650(12800) = FRW 12,320,000
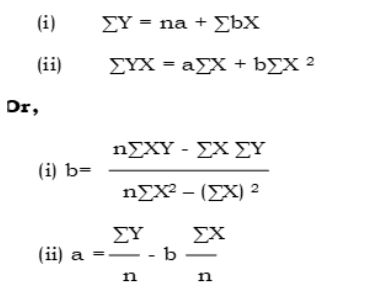
a. Least square Methods
The least-squares method is a crucial statistical method that is used to find a
regression line or a best-fit line for the given pattern. This method is described
by an equation with specific parameters. The method of least squares is
generously used in evaluation and regression. The general formulas used to
compute fixed cost (a) and variable cost (b)are listed below. The equations aresolved simultaneously to obtain the values.
The following data relates to ABC Company limited for the half year period just
ended.
Required: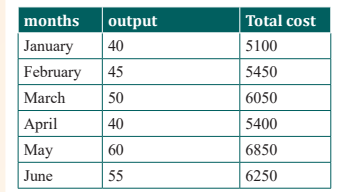
1. Determine the business fixed and variable costs for its manufacturing
overheads by using least square method
2. Write down the cost equation in the form of Y=a + bX.
Answer1. Determine the business fixed and variable costs
i) ΣY=na +b Σx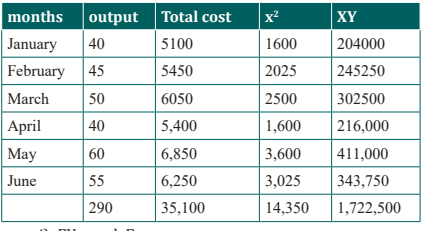
ii) ΣXY- aΣX + b ΣX2
i) 35100= 6a+290b
ii) 1722500=290a+14350b
Multiply equation (i) by 290 and equation (ii) by 6, to eliminate one unknown
variable
i) 35100= 6a+290b ……………x 290………….10179000 =1740a+84100b
ii) 1722500=290a+14350b…….X 6…………….10335000=1740a+86100biii) Difference (new equation ) 156000 = 0 2000b
To obtain a, substitute b in equation (i)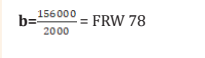
v. 35100=6a+290(78)
-6a=22620-35100-6a=-12480
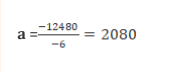
2. the cost equation in the form of Y=a + bX……………………….Y= 2080 +78x
OrDetermine the business fixed and variable costs
2. Equation Y= 2080 +78x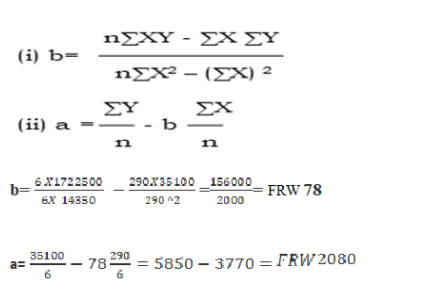
c. High-Low Method
This is a cost estimation based on the relationship between past cost and past
level of activity. Variable cost is based on the relationship between costs at the
highest level of activity and the lowest level of activity. The difference in cost
between high and low activity level is taken to be the total variable cost from
which the unit variable cost can be computed by dividing it by the change in
output level.
The goal of the high-low method is to describe this line mathematically in the
form of an equation stated as f(x) = a+ bX, which requires calculating both the
total fixed costs amount (a) and per unit variable cost amount (b). Four steps
are required to achieve this using the high-low method:
Step 1. Identify the high and low activity levels and the corresponding costs
from the data set.
Step 2. Calculate the variable cost per unit (b).
Step 3. Calculate the total fixed cost (a) or Y
Step 4. State the results in equation form f(x) =Y = a + bX.
Illustration: The following is an extract of the cost data of loyal industries for
the previous year; you are required to determine the variable rate and the fixed
component and construct an equation estimating the total cost for the samecompany.
Step 1. Identify the high and low activity levels from the data set.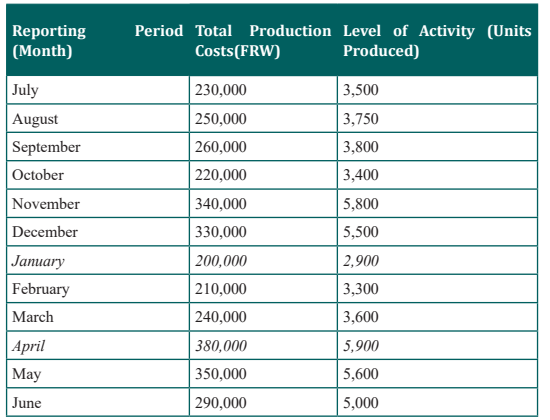
The highest level of activity (level of production) occurred in the month of April
(5,900 units; FRW 380,000 production costs), and the lowest level of activity
occurred in the month of January (2,900 units; FRW 200,000 production costs).Step 2. Calculate the variable cost per unit (b).
Step 3. Calculate the total fixed cost (fx) or Y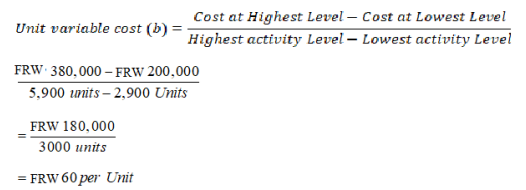
After completing step 2, the equation to describe the line is partially complete
and stated as /Y = a+FRW60X. The goal of step 3 is to calculate a value for total
fixed cost (a). Simply select either the high or low activity level, and fill in the
data to solve for a (total fixed costs), as shown. Using the low activity level of
2,900 units and FRW 200,000,
Y=a+bX
200,000 = a + ( 60×2,900 units)
a = 200,000 − (60×2,900 units)
a = 200,000 − 174,000
a = FRW 26,000
Thus total fixed costs total FRW 26,000. (Try this using the high activity level
of 5,900 units and FRW 380,000. You will get the same result as long as the per
unit variable cost is not rounded off.)
iv) State the results in equation form f(x) =Y = a + bX.
We know from step 2 that the variable cost per unit is FRW 60, and from step
3 that total fixed cost is FRW 26,000. Thus we can state the equation used to
estimate total costs asf(x) or Y = FRW 26,000 + FRW 60X
Application activity 2.1
Question
1. The Cost perunit amount of three different production costs forDalius Ltd are as follows:
What type of cost is each of these three costs?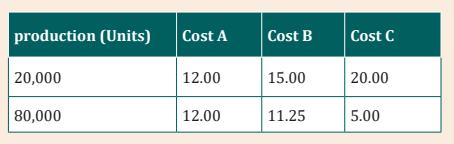
a) Cost A is mixed, Cost B is variable, Cost C is mixed
b) Cost A is fixed, Cost B is mixed, Cost C is variable.
c) Cost A is fixed, Cost B is variable, Cost C is mixed.d) Cost A is variable, Cost B is mixed, Cost C is fixed
2. The following information is extracted from the books of INYANGEIndustries Ltd for the year ended 31st December 2022.
You are required to seperate the above costs into fixed and variable elements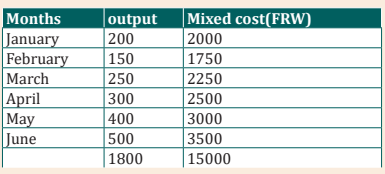
using the following methods of Ordinary Least Squares and High and lowpoints or Range method.
2.2. Cost-Volume-Profit (CVP) Analysis.
Learning Activity 2.2
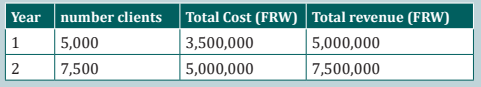
Bank of Kigali is a commercial bank operating its business activities in
Rwanda. It uses its Agents to provide good services to its customers. Bank
of Kigali paid its agent a commision of 5% on deposit FRW 10,000 and the
commission is only source of income to the Bank of Kigali agent. The Bank
of Kigali agent fixed cost is FRW 200,000 per month (Salary and Rent) and
variable cost is FRW 350 per client deposited FRW 10,000 and average
number of client served per month is 4000 clients.
The Bank of Kigali has collected information about the customer satisfaction
and revealed that the customers are complaining for the high bank charges
on agent services.
The management of Bank of Kigali after a deep analysis of this situation, has
just announced a revised payment schedule of 4% commission on deposit
FRW 10,000. Fixed cost remains constant and variable cost has reduced to
FRW 300 per client served and the bank expected that the average number
of clients will increase to 5000 clients.
Question
1. What do you understand by cost, volume profit?
2. Calculate the number of customers, the BK agent are able to serve at
Break Even Point before and after revising the payment structure.
3. After revising the cost structure, BK agent set a targeted profit of FRW
500,000, how many customers the agent will be required to serve to get
this profit.
2.2.1 Introduction to cost-volume Analysis
Cost-Volume-Profit analysis is the study of the effects on changes on future
profit of changes in fixed cost, variable cost, sale price, quantity, and mix. There
is a direct relationship between cost, volume of output and profit. CVP analysis
examines the relationship of cost and profit to the volume of production to
maximize the profit of the firm. It is a logical extension of marginal costing and
is used as a very powerful tool by the management in the process of budgeting
and profit planning.
a. Elements of CVP analysis
CVP analysis establishes a relationship between cost, volume of output and
profit. It evaluates the effect on profit due to changes in cost and volume of
output. This analysis consists of several integral parts or components which
are as follows:
i) Marginal Cost equation
ii) Contribution
iii) Profit/volume (P/V) Ratio
iv)Break-Even Point (BEP)
v) Margin of safety
2.2.2. Marginal Costing
a. Marginal Cost Equation
Marginal Cost Equation exhibits the relationship between contribution, fixed
cost and profit. It explains that the excess of sales over the variable cost is
the contribution towards fixed cost and profit. Marginal Cost Equation can be
developed as follows:
Sales S Total Cost Profit P= +
or
Total Cost Fixed cost F Variable Cost V =
Therefore S F V P or S V F P = + + −= +
b. Contribution
Contribution is the excess of sales over variable cost. More clearly, contribution
is that portion of sales which remains after recovering the variable cost to that
extent of sales. This contribution is available towards fixed cost and profit.Mathematically, contribution can be expressed as follows:
Sales xxx
Less: Variable cost xxx
Contribution xxx
Less: Fixed cost xxx
Operating Profit xxx
Therefore
Sales - Variable cost = Contribution
Fixed cost + Profit = ContributionFixed cost - Loss = Contribution
XYZ Ltd produces 2,000 units of a product X, are sold at FRW 10 per unit,
Variable cost of manufacturing the product is FRW 6 per unit and the total fixed
cost is FRW 5,000. Calculate the contribution from the given data.
Sales 10
Less: Variable cost 6
Contribution 4 X2000
Less: Fixed cost 5000
Operating Profit 3000
Total contribution = contribution per unity * Quantity = 4X2000 = 8000
FRWa. Profit- Volume (P/V) Ratio / Contribution margin ratio
Profit-Volume ratio is the ratio of contribution and sales. It is generally expressed
in percentage. It exhibits the percentage of contribution included in sales. It
indicates the effects on the profit for a given change in sales. Mathematically,P/V Ratio can be expressed as follows:
Illustration : Consider the following contribution margin P/V Ratio format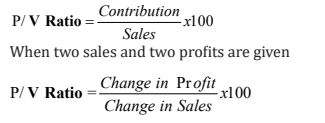
income statement of Alpha & Son Ltd.in which sales revenues, variable expenses,
and contribution margin are expressed as percentage of sales.
Description Total(FRW) Per Unit(FRW) Percent of Sales
Sales (400 units) 100,000 FRW 250 100%
Less variable expenses 60,000FRW 150 60%
Contribution margin 40,000 FRW FRW 100 40%
Less fixed expenses 35,000
Net operating income 5,000 FRW
According to above data of Alpha & Son Ltd. the computations are: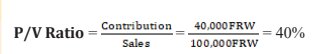
In a company that has only one product such as Alph & Son Ltd P/V ratio can alsobe calculated as follows:
The impact on net operating income of any given cash change in total sales can
be computed in seconds by simply applying the CM ratio (P/V Ratio) to the cash
change.
For example if the Alpha & Son Ltd plans a FRW 30,000 increase in sales during
the coming month, the contribution margin should increase by FRW 12,000
(30,000 INCREASED sales * CM ratio of 40%). As we noted above, net operating
income will also increase by FRW 12,000 if fixed costs do not change. This is
verified by the following table:
* Expected net operating income of FRW 17,000 can also be calculated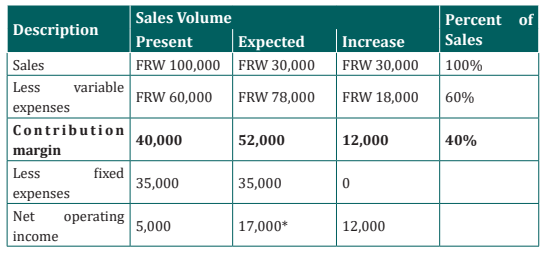
directly by using the following formula:
[P*= (Sales × CM ratio) – Fixed Cost]P* = Profit
2.2.3. Break - Even Point (BEP)
Breakeven point is the level of output or sales at which the business does not
make profit nor incur loss. At that level, total revenue is equal to the total cost
or Break-even point is point where the business is neither incurring profit nor
loss. This is the turnover that enables enterprise to cover all expenses without
profit or loss.
a. Break-Even Point Calculation
Break-Even point is the level of sales at which profit is zero. At break-Even point
sales are equal to fixed cost plus variable cost (Sales = fixed cost + variable
cost).
The break-Even point can be calculated using either Equation method orContribution margin method.
Equation method
The equation method centers on the contribution approach to the income
statement.
According to the definition of Break Even point, Break Even point is the level of
sales where profits are zero. Therefore the Break Even point can be computed
by finding that point where sales just equal the total of the variable expensesplus fixed expenses and profit is zero.
Example:
Given data are as follow:
• Sales price per unit = FRW250
• Variable cost per unit = FRW150
• Total Fixed expenses = FRW35,000
Formula of Break Even Point: Sales = Variable expenses + Fixed expenses +
Profit
FRW 250Q* = FRW 150Q* + FRW 35,000 + FRW 0
FRW 100Q = FRW 35000
Q = FRW35,000 /FRW 100
Q = 350 Units
Q* = Number (Quantity) of units sold.
The Break-Even point in sales dollars can be computed by multiplying the
break-even level of unit sales by the selling price per unit. 350 Units × FRW 250
per unit = FRW 87,500
– Contribution margin method
The contribution margin method is actually a short cut conversion of the
equation method already described. The approach centers on the idea discussed
earlier that each unit sold provides a certain amount of contribution margin
that goes toward covering fixed costs. To find out how many units must be soldto break even, divide the total fixed costs by the unit contribution margin.
FRW 35,000 / FRW 100* per unit =350 Units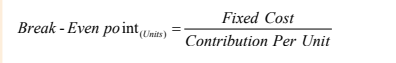
*S250 (Sales) – FRW 150 (Variable exp.)
A variation of this method uses the CM ratio (P/V Ratio) instead of the unit
contribution margin. The result is the Break-Even in total sales dollars rather
than in total units sold.
Example 1. Alpha bakery producing biscuits wants to evaluate the company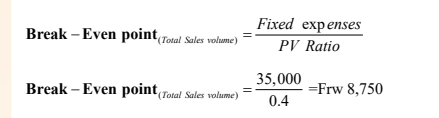
performance based on information recorded. If its fixed cost are FRW 200,000
and its variable cost to produce one packet of biscuit is Rwf 2 and its selling
price for each packet of biscuits is FRW 4,Calculate break even point of alphabakery.
Answer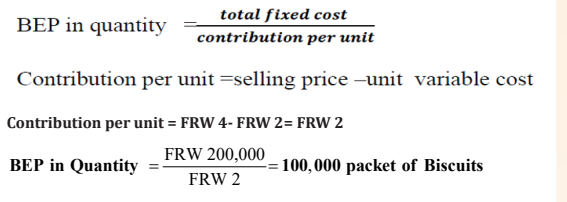
Break even point in value =100,000 X 4 = FRW 400,000
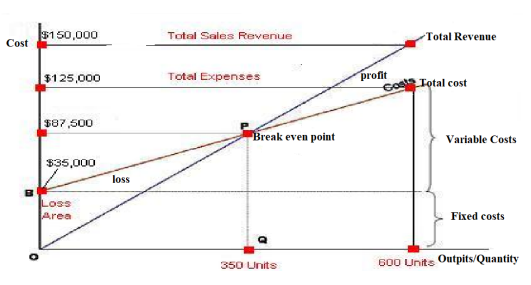
b. Cost Volume Profit (CVP) Relationship in Graphic Form
The relationships among revenue, cost, profit and volume can be expressed
graphically by preparing a cost-volume-profit (CVP) graph or break-even chart.
A CVP graph highlights CVP relationships over wide ranges of activity and can
give managers a perspective that can be obtained in no other way
Preparing a CVP Graph or Break-Even Chart
In a CVP graph sometimes called a break-even chart, unit volume is commonly
represented on the horizontal (X) axis and cost and revenues on the vertical(Y) axis. Preparing a CVP graph involves ploting the total revenue and total cost
curves and the point of intersection of the two is the the breakeven point.
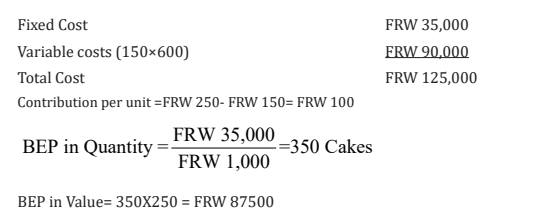
Example1.
OLAN LTD is a bakery business which produces 600units (Cakes) and each
Cake is sold at FRW 250 and the variable cost per unit is FRW 150. Calculate
the breakeven point in quantity and in value and then plot these informationon graph.
c. Target Profit Analysis
Cost volume profit (CVP) formulas can be used to determine the sales volume
needed to achieve a target profit.
Example:
DANI Ltd has the following cost information in its books:
• Sales price per unit = FRW 250
• variable cost per unit = FRW 150
• Total fixed expenses = FRW 35,000
• Target Profit = FRW 40,000
Required: How many units would have to be sold to earn a profit of 40,000?
Solution:
The CVP Equation Method:
Under equation method: Instead of solving the equation where profits are zero,
we solve the equation where profits are FRW 40,000.
Sales = Variable expenses + Fixed expenses + Profit
250Q = 150Q + FRW 35,000+ FRW 40,000
100Q = FRW 75,000
Q = 75,000 / 100 per unit
Q = 750 Units
Thus the target profit can be achieved by selling 750 units per month, whichrepresents FRW 187,500 in total sales (250* 750 units).
d. The Contribution Margin Approach
A second approach involves expanding the contribution margin formula to includethe target profit.
This approach gives the same answer as the equation method since it is simply
a short cut version of the equation method. Similarly, the sales value needed toattain the target profit can be computed as follows:
e. Margin of Safety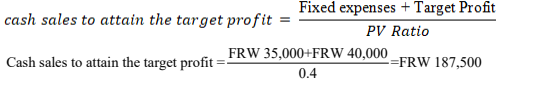
The margin of safety is the excess of budgeted or actual sales over the breakeven
volume of sales. It states the amount by which sales can drop before losses
begin to be incurred. The higher the margin of safety, the lower the risk of not
breaking even.Margin of Safety Formula
The formula for the calculation of margin of safety in sales value is:
Illustration
Sales (400 units @ FRW 250) ----- FRW 100,000
Break even sales---------------- FRW 87,500
Required: Calculate margin of safety in sales value.
Solution
Sales (400 units @ FRW 250) FRW 100,000
Break even units (at 350 units) FRW 87,500Margin of safety in sales value FRW 12,500
Margin of safety as a percentage of sales
Margin of safety as a percentage = [(Budgeted or Actual sales – Breakevensales)/Budgeted or Actual sales]
It means that at the current level of sales and with the company’s current prices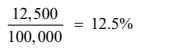
and cost structure, a reduction in sales of 12,500 FRW, or 12.5%, would result
in just breaking even. In a single product firm, the margin of safety can also
be expressed in terms of the number of units sold by dividing the margin of
safety in dollars by the selling price per unit. In this case, the margin of safety
is 50 units (12,500 ÷ 250 units = 50 units) or Budgeted or Actual sales units –Breakeven units
Limitations of breakeven analysis
Breakeven analysis is a useful tool for problem solving and decision making,
but some of the limitations should be noted:1. The breakeven analysis assumes that cost and revenue behaviour patternsApplication activity 2.2
are known and that the change in activity levels can be represented by a
straight line, which is not always the case.
2. It may not always be feasible to split costs into variable and fixed
categories. Some costs show mixed behaviour.
3. The breakeven analysis assumes that fixed costs remain constant over
the volume range under consideration. If that is not the case, then
the graph of total costs will have a step in it where the fixed costs are
expected to increase.
4. Breakeven analysis, as described so far in this book, assumes production
and sales volumes are the same, so that there is no build-up of stocks and
work-in-progress.
5. Breakeven charts and simple analyses can only deal with one product at
a time.
6. It is assumed that cost behaviour depends entirely on volume. Theselimitations may be overcome by modifying the breakeven analysis.
Q1. Choose the correct answer.
ABC Company sells shoes for FRW 450 per pair of shoes. The variable cost
is FRW 200 per pair of shoes. The fixed costs are FRW 750,000. What is the
breakeven in sales?a) FRW 750,000Q2. IHIRWE Ltd has recorded the following semi-variable cost over
b) FRW 937,500
c) FRW 1,350,000d) FRW 1,687,500
the past six months:
Estimate IHIRWE Ltds’ fixed cost and variable cost by using the high/low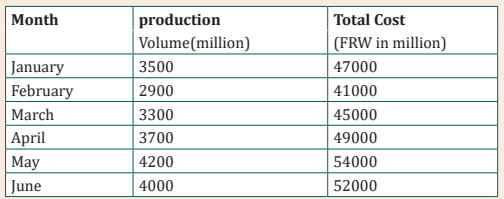
method.
Skills Lab 2
Gs Ubumenyi has the policy of promoting entrepreneurship clubs, During
the set up and the running of their student business club at their school, the
school administators committed to cover the fixed costs and other costs to
be covered by entrepreneurship club members. The club has prepared
a business estimates of operating a saloon business at school. In theirbusiness plan the following expected cost and revenues were presented.
The management of Gs ubumenyi has approved the above business
estimates and requested the students to determine the contribution
of the school and that of the club members. After reviewing the above
information, using comparison method:
1. Calculate the contribution (Variable costs) of students in this
business
2. Calculate the contribution of the school (Fixed costs) in this business
3. Prepare a short report to be presented to the club members and
the school management advising them on how their contributionwould be collected.
End of unit assessment 2
Questions1. Define break-even point.An activity level that the company expects to operate at is called a
2. Complete the following sentence by choosing the best answer from
the choices givena) Margin of SafetyOver the last five years, Amahoro Ltd has recorded the following costs:
b) Relevant range
c) Contribution margin
d) Target net income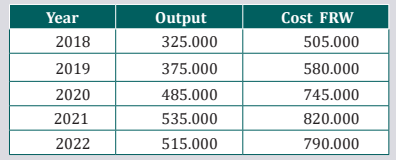
Amahoro Ltd wants to estimate the cost for 2023,when they expect toproduce 52,000units.
Q4. ABC Ltd provides below information to professional accountant to
get his professional advise. The management requires the professional
accountant to determine the break- even point in units and Value and todetermine the quantity required to get a profit of FRW 1,200,000
a) The management requires the professional accountant to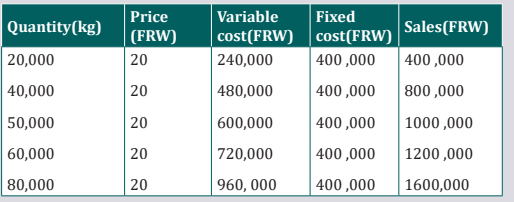
determine the break- even point in units and in Valueb) Determine the quantity required to get a profit of FRW 1,200,000
UNIT 3: BASIC PRINCIPLE OF COSTING
Key Unit Competence: Identify and recording cost accounts used in organization
Introductory activity
“Making a profit on a project/product depends on pricing it correctly”.
AKARABO located in Kimironko Kigali city, is one of the Kigali’s largest
manufacturers of flat-screen televisions and mobile phones. In 2015,
AKARABO sold FRW 15million from phone cover and FRW 20 million
of cables of flat screen in Kigali city. Many of material used in shop of
flat-screen for well looks, AKARABO Spends FRW 40 million Annually
on the procurement of stand table of flat-screen, speakers, cables of
mobile phone and other materials. Until 2020, AKARABO did not have
a centralized procurement system to leverage its scale and to control
supply costs. Instead, the company had a decentralized system riddled
with wasteful spending and inefficiencies. To respond to these challenges,
AKARABO hired its first chief procurement officer introducing activity
-based costing (A.B.C) as solution. ABC Analysis of the company’s
procurements system revealed that most company resources were
applied to administrative and not strategic tasks. Furthermore, the
administrative tasks were done manually and at very high cost. A team
of manager and employees in AKARABO are responsible for costing and
pricing of its flat-screen and mobile phone. For each product, account
managers carefully examine and verify job costs as part of a competitive
bidding process. AKARABO business managers are also responsible for
identifying any potential problems with each product and determining
any alternative necessary to unsure high quality, on time delivery within
the original product budget. AKARABO received an order (command)
for new product of producing a computer. Manager at AKARABO need to
know how much it costs to manufacture its new product. Knowing the
cost and profitability of new job helps manager pursue their businessstrategies.
Of course, when making decisions, managers combine cost information
with non-cost information such as personal observations of operations,
and non-financial performance measures, such as quality and customer
satisfaction.
Questions1. State the products produced by AKARABO manufacturing co..3.1. Costing methods
2. What does the manager need for decision making?
3. According to your observation identify the costing methods thatcan be used from the above scenario.
Learning Activity 3.1
Question
a) What do you observe on the above picture?b) What do you think the man is going to do?
3.1.1. Introduction to costing methods
Costing methods is the approach or style or tactic adopted by an organization
to collect cost data in a more appropriate manner so as to establish the total
cost and cost per unit of final product produced or manufactured. The finalproduct can either be physical goods or services.
Costing methods is an approach of cost data collection which is “under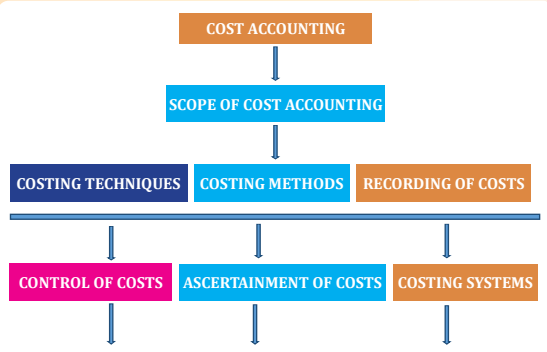
ascertainment of cost” umbrella and you know that ascertainment of cost aspect
is a thematic sub-topic of scope of cost accounting as show in above diagram.
These are several methodologies utilized by different organizations, which is
determined by the nature of products being manufactured. The viewpoint of
the diverse needs of different organisations necessitates consideration of the
criteria used in classifying the costing methods.
• Characteristics of Costing Method
The method is applicable to products which have common characteristics.
The ascertainment of cost in most of the times involves some repeated activities
or repetitive processes.
The process of cost ascertainment is within a specific period of time usually a
year.
• Costing methods entails both the determination of the overall cost and the
unit profitability of the products.
• The activity of costing method is periodical in the sense that the aspect of
cost ascertainment is limited to a specific accounting period.
• In addition to economic costs, the costing method incorporates other costsinform of normal and abnormal losses.
• Advantages of costing method
a. Minimization of production cost
By reducing inefficiencies associated with wastages and loses during production
therefore minimizing overall cost incurred in production.
b. Help in the profitability determination
Ascertainment of the costs guides the producer to know exactly the total cost of
the final product so as to set an appropriate profit margin in setting the selling
price.
c. Basis on purchase or manufacture of a component decision.
The cost ascertainment approach is timely in guiding the management on
whether it is economical to produce or purchase a certain component.
d. Control of costs
Costing methods help in comparing \previous year’s cost level so as to manage
the consumption of the economic resources. This can be achieved by use of
budgeting tool.
e. Tax matters
Taxation of firm’s profit by the government is pegged on the cost of production.
This helps the government to ensure that fairness prevails to avoid over or
under taxation.
f. Bargaining power.
The employee’s or worker’s union may use the cost of production as per cost
ascertainment to argue their case.
g. Delegation of responsibilities to employees.
The workers are assigned their duties based on the costing method used. This
helps in ensuring that no idle employees who are paid.
h. Preparation of financial statements
Costing method is a tool which is helpful in financial accounting during
preparation of end of the year financial reports. This is because reports such
as closing inventory for finished goods, work in progress and raw materials are
associated with preparation of financial statements.
i. Avoidance of collusion and fraud by workers
Costing methods are ways of ensuring that material and other inputs are not misused
by corrupted workers who may sell some to make personal gain at the expense of the
quality of the goods being produced.
Disadvantages of costing methods
Here are clarified limitations of the costing methods
a. Historical data
The data which is always readily available in the books of accounts of the
business is the financial data which is historical which is not much needed for
costing methods as they deal with the future decision making, for which the
data is missing or scanty. This disparity in need gap curtails costing method
procedures.
b. Under-Utilized Capacity
Costing methods works with the assumption that production capacity is fully
utilized. If this is not the case, then the results presented at the end of the year
will be misleading.
c. Problem of over and under absorption of overheads
Since costing methods is a process which has to do with estimation of the total
cost of a product. Some aspects are standardized or pre-determined and so,
when actual outcome takes place, it can be a case of over or under absorption
of overheads. this brings inconvenience of planning.
d. Lagged costing methods information
Most of the times, costing require furnishing of timely information to the costing
department which may not be the case for the various departments concerned
with this exercise may have individual departmental challenges which can
result to failure on timely costing exercise.
e. Non-flexibility of a costing system.
Some costing system which are concerned with recording of the costing
information may be faulty or rigid and this hiccup may deny the objective of
ascertaining of cost on a particular product, hence adversely affect costingmethod used.
3.1.2. Calculation based on costing methods
A. Job Costing
This method is also called as Job order costing method. This costing method is
used in firms which work based on job work. There are some manufacturing
units which undertake job work and are called as job order units. The main
feature of these organizations is that they produce according to the requirements
and specifications of the customers. Each job may be different from each other.
Production is only on specific order and there is no pre demand production. In
this system, each job is treated separately and a job cost sheet is prepared tofind out the cost of the job.
Illustration
XYX Engineering ltd has three departments: preparation, machining and
assembly. The budgeted direct labor hours for these three departments are8,000, 12,000 and 10,000 respectively.
Factory fixed overheads are budgeted at FRW 180,000 for the year and variable
overheads are as under: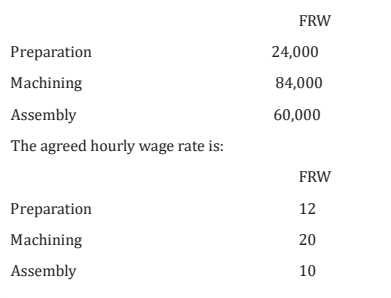
Administration and selling Overheads are to be abosorbed by adding 10% of all
other costs. Profit is charged at 25% of total costs.
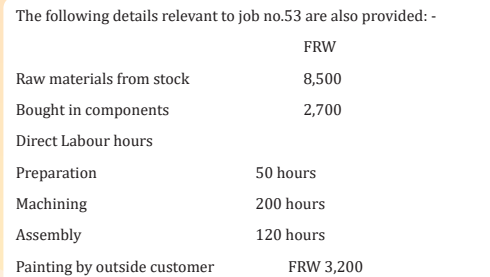
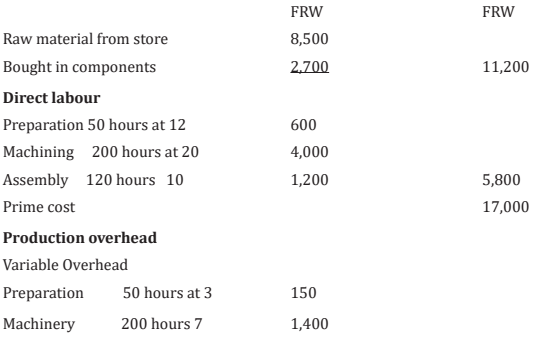
You are required: to determine the cost estimate for job.no.53
ANSWERS:
XYZ ENGENNERING LTD
COST ESTIMETE FOR JOB NO:53Direct materials
• Characteristics of job costing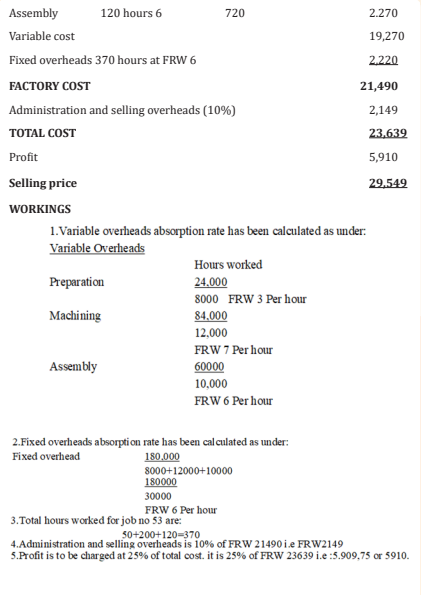
Job costing is a costing method with the following features:
a. The order is specific,
It means that the task to be performed is subject to strict guidelines. There are
terms of reference of the customer or client.
b. It is possible to closely track the cost elements associated with the
order.
The job being performed is sufficiently diverse to allow the manufacturer to
associate the specific input materials, labor, and overhead associated with that
job completion.
c. The executed jobs differ from each other.
Since the customers are diverse, the jobs are also diverse. That is, they are
not similar. This is because the manufacturer may be dealing with different
customers or the same customer/client but with different types of orders.
d. The overhead cost allocation is carried out according to the relevant
criteria.
The indirect costs associated with the production of the relevant order number
are determined by a unique basis from the other orders such as area, size of the
order, etc.
e. Keeping a separate account for each job.
Since the jobs are different in most cases, the accounts are required for each job.
That is, all costs associated with that specific order are charged to that specific
account with a unique account number, and the costs posted therein form the
total cost for that order.
a. The production process is not continuous
Each order is independent of the next and therefore there is no continuity as
with the process cost method. Therefore, the jobs are broken in the real sense.
That is, an order is initiated based on an order placed by the customer.
a. The profitability of each job is determined separately
The profitability margin for each job is determined by the total cost of the
inputs consumed by that particular job. So each job has its own cost calculation
and determination of the profits from it.
• Classification of job costing method
Job costing method is further broken down to:
a. Contract costing method
Contract costing method is also known as terminal costing method and it
involves doing some assignment with set specification for another person for
payment.
The contract costing method of ascertaining cost for a contract. once the
contract is completed as per the agreement of the two parties, the assignment
is closed down.
b. Factory costing method
Factory job costing is entails undertaking a clients ‘assignment or job in a
factory. The focus is the assignment at hand and on its completion, the output
is delivered to the client.
c. Batch costing method
Batch costing method is an approach of assigning costs on a task which is
completed in batches. It entails manufacture of a large number of products or
goods at the same time.
• Advantages of job costing– Help in determining the level of profitability of company products in the
future. The current record of how costs have been allocated to the current
product provides a guide for determining the profit margins to be achieved.
– Having clear cost data available helps management determine the selling
price of the end product (final product). The selling price set depends on the
amount of cost accumulation, so when the cost is higher, the selling price is
high and vice versa is true.
– Optimal allocation of economic resources. The job costing method is set in
such a way that it is possible to monitor the use of the available resources.
Thus, the manufacturer or producer is able to identify instances of waste
and mistakes for each specific job and avoid such situations.
– Job costing assists in the adoption of predetermined overhead rates, which
in turn assists in the application of the budgetary control system. That is,
before the actual costs are incurred, the producer can plan earlier to know
how to control the costs/inputs for the inputs needed estimated using the
cost method provided.– The job costing method encourages the activity of delegating tasksamong employees. The job costing method helps in delegating tasks to beDisadvantages of job costing method
performed by each employee in the workplace. Therefore, accountability to
a department or an individual employee is enhanced.
– Avoidance of duplication. The manufacturer is able to separate one order
from another and avoid duplication in production that can lead to wasted
resources.
– Increased production efficiency. The manufacturer is able to assess the level
of inputs and outputs and ensure that the former are minimized, improving
the efficiency and quality of the final product.– Unnecessary expenses or costs incurred between two processes can beB. Process costing method
unavoidable. The job costing method is a difficult and costly/expensive
endeavor for small businesses due to the lack of economies of scale.
– The job costing method does not consider any standard procedure
for estimating the costs paid or incurred. This means that the jobs are
different and are approached differently than in activity-based costing,
in which the uniformity of the products prevails.
– The job costing method is not applicable/suitable for fast moving jobs.
The category of short-lived jobs may not benefit from this costing
method approach. Because the cost efficiency is naturally low.
– The job costing method requires a lot of paperwork to accomplish
a specific task. There are several logistics areas that require a lot of
paperwork when estimating a job to capture all the details of the cost
elements. This is a cumbersome approach.
– The job costing method is sunken or historical in nature. Sunk costs are
costs that have already been incurred and are never suitable for future
decisions. You see the producer relies on the already completed tasks
according to past records showing the incurred/actual costs of similartype of work and therefore is not a suitable tool for future decisions.
• Definition
Process costing is a form of operational costing used when cost units go through
a series of clearly defined processes before the final product is completed. The
main feature of this method is that the finished output of one process becomes
the input of the next process. In this case, all costs (direct and indirect) are
charged to each process.
This method is used in industries like chemicals, soaps, paper, paints, oil
products, etc
• Elements of process cost
Final goods are produced after a specific number of processes. An account is
kept for each process or operation. All costs incurred to complete a process are
debited to process account.
The elements of process cost are:
• Materials
In process costing, raw material is issued to process 1, where after processing
it is transferred to process 2 and so on. Some more materials are added to
the original material at each process. The materials used at each process are
debited to the respective process account.
• Labor
Direct labor of each process is debited to the respective process account.
• Direct expenses
Expenses incurred in respect of any particular process are debited to the
process account.
An example of direct expenses is packing cost of biscuits.
• Production overhead
In process costing, the proportion of production overhead is comparatively
high. Each process is charged with a reasonable share of production overhead.
Example 1:
The manufacture of product ‘G’ requires three distinct processes numbered 1-3.
On completion, the product is passed from process 3 to finished goods stock.
The following information was obtained in respect of product ‘G’ for the month
of July.
3,000 units of raw material at FRW 25 were issued to process 1 and costsincurred are given below:
Production overhead is absorbed by each process at 150% of direct labor. There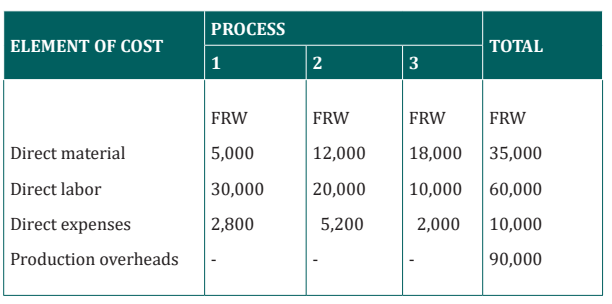
was no stock of raw material or work-in-progress either at the beginning or atthe end of the period.
You are required to prepare the process accounts.ANSWER
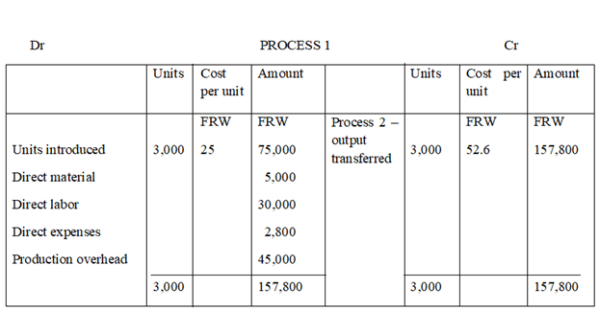
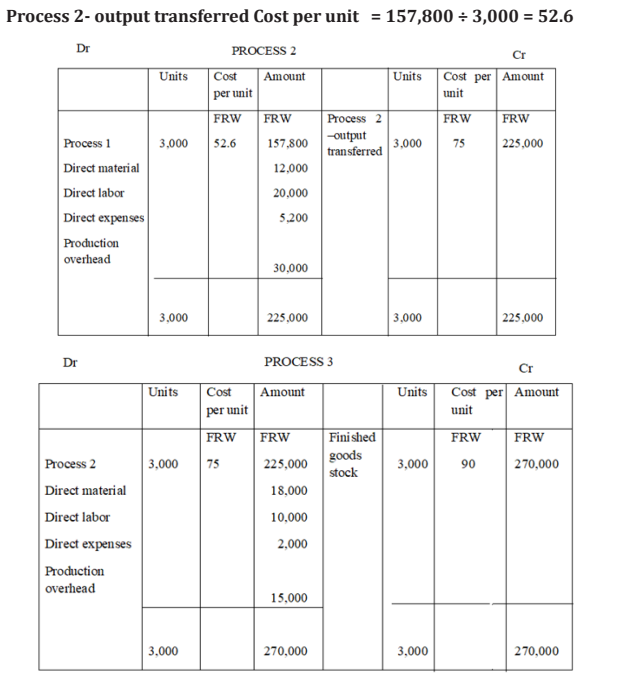
FINISHED GOODS STOCK ACCOUNT
• Process loss, scrap and waste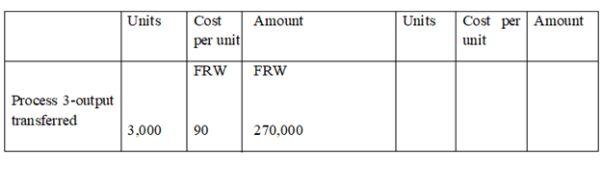
These terms are used frequently in process costing. Mostly the quantity or
weight of output of a process is less than input of that process. The loss of
weight or volume arises in the course of manufacture. This loss mainly arises
where distillation or disintegration by heat or chemical action is involved. The
reasons of this loss are evaporation, residuals, ash, spoilage.
C. PROCESS LOSS
This is the loss of weight or volume of material during a process.
It may be Normal process loss or abnormal process loss.
Normal process loss represents the loss which is expected under normal
conditions. This loss is unavoidable in view of the nature of the production
process. This loss is caused by such factors as evaporation and this is calculated
in advance on the basis of past experience.
The cost of normal loss is absorbed in the cost of production for good production.
If defective units in respect of normal loss can be sold for at a reduced value
then the proceeds (amount you get after selling ) of these units are subtractedfrom total cost of good products. In this case the following formulas are used.
Cost per unit=Total Process Cost/Estimated Production
Abnormal process loss represents the loss which occurs under abnormal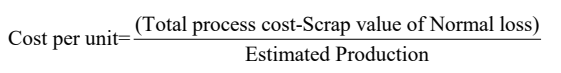
conditions. Abnormal loss cannot be foreseen. The main causes of abnormal
loss are plant breakdown, industrial accidents, inefficiency of workers or
defective raw materials. If actual loss is greater than the normal loss then this
difference is called as abnormal process loss. Abnormal process loss is costedon the same basis as good production.
It is treated as:– Value of Abnormal LossDr: Abnormal Loss Account
Cr: Process Account– Scrap value of abnormal lossDr: Scrap Debtors AccountCr: Abnormal Loss Account
The balance in the abnormal loss account is transferred to the profit and loss
account at the end of the year.
ABNORMAL GAIN
If normal process loss is less than expectations then the difference between the
actual loss and normal loss is known as abnormal gain. The value of abnormal
gain is calculated on the same basis as good production.
It is treated as:– Value of Abnormal GainDr: Process Account
Cr: Abnormal Gain Account– wasteWaste is the material arising in production process that has no value. It means
waste refers to anything which has no value.
If waste is part of the normal loss then the cost will be absorbed by the good
production and in case of abnormal loss, it will be transferred to abnormal lossaccount.
– scrapScrap is the material that can no longer be used for its original purpose (e.g.
broken parts).
It can be sold at much lower price than the cost. The income from sale of scrap
is taken into consideration and process loss is reduced by that amount.
Example 2
In the manufacture of product “Pee”, 2,000 kg of material at FRW 5 per kg were
supplied to process 1. Labor costs amounted to FRW 3,000 and production
overheads ofFRW 2,300 were incurred. The normal loss has been estimated at10%. The actual production was 1,750 kg.
Prepare the process account and calculate cost per unit
Answer
Normal loss calculation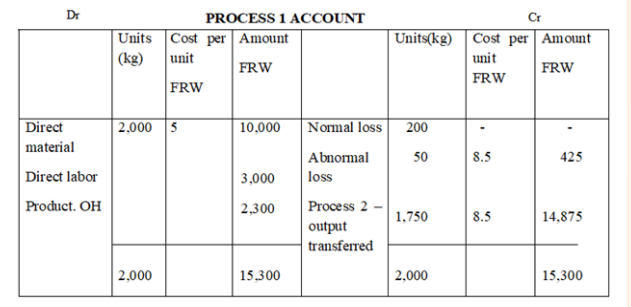
Estimated loss 10% of 2,000 kg =200kg
Abnormal loss calculation
Estimated production (2,000-200) = 1 ,800 kg
Actual production 1,750 kgAbnormal loss 50 kg
Unit cost of normal production
Cost per unit=Total process cost/Estimated production
= FRW 15,300 /1,800 = FRW 8.5
Value of abnormal loss =50 kg* FRW 8.5= FRW425
Value of good production =1,750kg* FRW8.5 = FRW 14,875
Abnormal Loss Account Units (kg) Cost per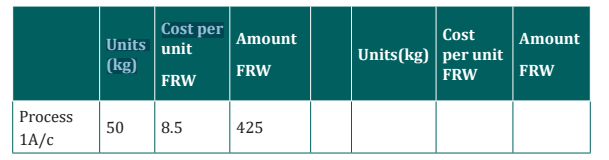
EXAMPLE 3
Assume the same data as in example 2 except that the scrap value of normal
loss and abnormal loss was FRW1.8 per kg. Prepare the process 1 account andcalculate cost per unit.
Unit cost of Normal Production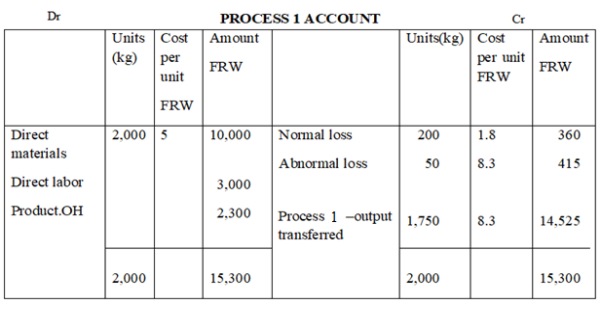
Cost per unit= (Total process cost-Scrap value of normal loss)/Estimated
production= FRW (15,300-360) /1,800 = FRW 8.3
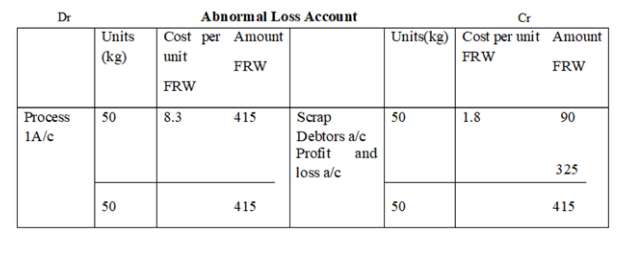
Example 4:
Assume the same data in example 2 except that the scrap value of normal loss
was FRW 1.8 per kg and actual production was 1,830 units. Calculate the normalgain and show the relevant accounts.
Answer
Expected production= 1,800 kg
Actual production = 1830 kgAbnormal gain = 30 kg
Note: If actual production is greater than expected production then this
excessive production is the abnormal gain.Cost per unit will be the same as in example 3
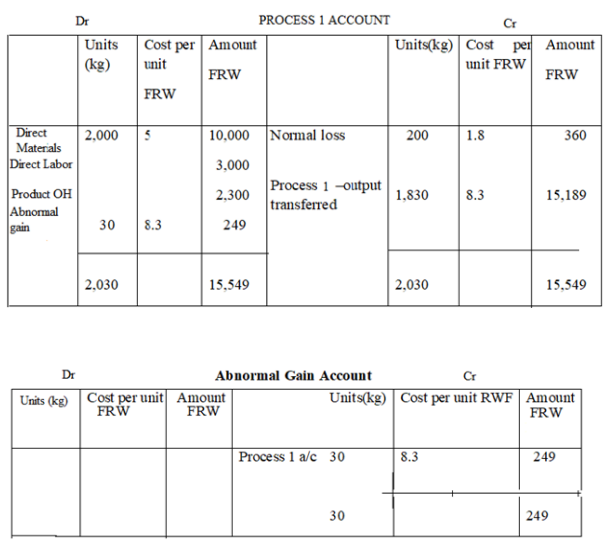
– JOINT PRODUCTS AND BY-PRODUCTS
These represent outputs that simultaneously result from some joint process.
Joint products are two or more products which are output from the same
processing operation but are not distinguishable up to their point of separation.This point of separation is known as split-off – point or separation point.
Before this point of separation, one cannot distinguish the products involved
because they are in mixed form and all costs incurred cannot be attributed to
any product. They form the main or target products the firm plans to produce.
An increase in the output of one product will bring about an increase in the
quantity of others, or vice versa, but not necessarily in the same proportion.
Joint products may be sold off immediately after the split – off point or may
be further processed if they are not in saleable condition. At whatever stage
joint products are sold, they have a substantial sales value as compared to by products.
A by-product is that which is similarly produced at the same time and from
the same process as the main product. The by-product has low sales value
compared to the main product and is usually incidental to the process. They
are not always the company’s target and cannot influence the manager’s
production decision as to whether the main product should be produced or
not. Examples of industries that produce both joint and by-products include
chemicals, oil refining, mining, flour milling and gas manufacturing. Specific
examples of such products include petrol, paraffin and grease which represents
a by-product.
The major distinguishing features of joint-products and by-products are Joint
products have substantial sales value whereas by-products have minor sales
value. Joint products are the major or main products of the firm and form
manufacturing objective of the firm but by-products are incidental products
to the production process. Joint products influence the production decision of
the firm since they are major products whereas by-products don’t influence
production decision. Accounting for Joint products:
The major constraint in accounting for joint products is the presence of joint or
common costs that have been incurred prior the split-off point which cannot
be identified with joint products. Since the aim of costing is to ascertain each
product’s unit cost, then common costs must be apportioned or allocated tojoint products.
Such apportionment is necessary for two reasons including providing productvaluations required for financial accounting, and other regulations.
Coordinating the activities of decision – makers in a decentralized organization.
Though many scholars have come up with many methods used to assign
joint costs to joint products, none of them is superior to the other but their
applicability is influenced by certain factors.The following methods are commonly used to assign joint costs:
1) Physical units/measures method.
2) Sales value or market value method
D. Physical units method
Under this method, common or joint costs are assigned to products on the
basis of volume of output. Joint costs are allocated in proportion to the number
of units produced or their relative weights. For this method to be suitable
quantity of the joint products must be in the same state or else, the methodcannot be applied.
The major weakness of this method is that it assumes that all products are equal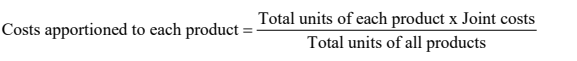
in terms of value. Costs are therefore assigned to products in equal proportions
which is very unrealistic because products cannot be equal in terms of value
and even resources required to produce each. Since the method does not assign
joint costs to products on the basis of revenue generating power of individual
products, cost information will mislead decision makers.Example 1:
A manufacturing firm produces three products ( K, M & P) through a joint
process. Prior to the split – off point, common or joint costs amounting to FRW
24,000,000 were incurred. The units produced according to each product areas follows:-
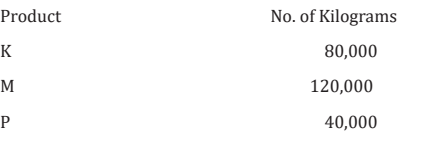
The firm uses physical units method for apportioning joint costs to joint
products.Required: Apportion joint costs and determine the unit cost of each product.
Solution
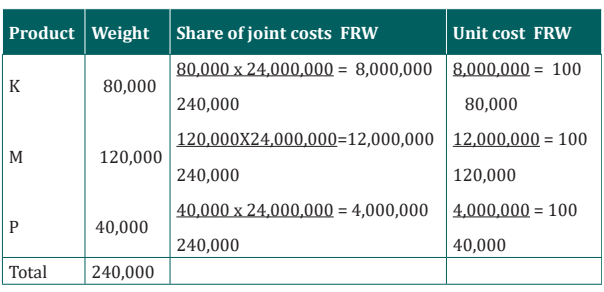
E. Sales value method:
This method apportions or assigns joint costs to joint products on the basis of
value attached to each joint product. The ratio of sales value of each product
at split-off to total sales of all joint products is ascertained and multiplied by
the joint costs incurred. The resulting amount will represent the joint costsassigned to each joint product. The formula is given below:
This method addresses the shortcomings of physical units method because the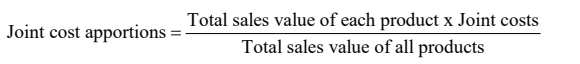
assignment of joint costs to products depends on the value of each joint productand therefore, joint products cannot have a uniform unit cost.
Illustration:
Using the same data in example 1, assume the company selling prices of jointproducts are as follows:
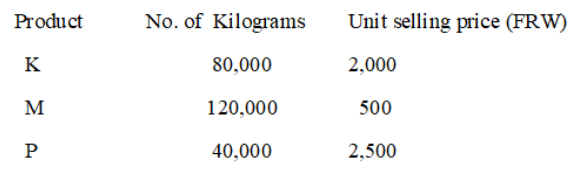
Required: Apportion joint costs and determine the unit cost of each Product.Solution:
Note: Sales value = Units involved * unit selling price.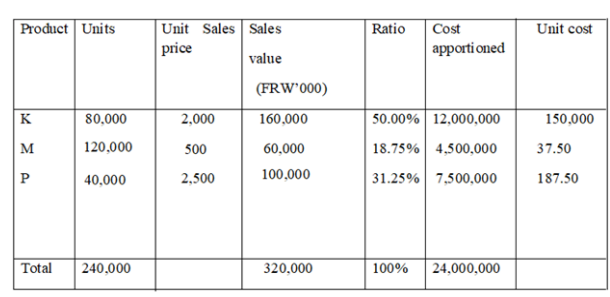
Ratio= Individual product sales/Total sales * 100Unit cost = Cost apportioned/individual units of product.
F. Accounting for By-product costing
Because by-products are generally of secondary importance, cost allocation
differs from that applied to joint products. Common methods used are:a) By-product receipts are treated as incidental or other income. OtherHere, the sales revenue or proceeds received from the sale of the by-product are
income realized from sale of by-product is transferred to profit and
loss account as miscellaneous income.
b) By-product net realizable value is deducted from the total cost of joint
products
credited to the total production costs of manufacturing the main product. If there are
any selling and distribution costs incurred for selling the by-product, the same are
deducted from the sales value of the by-products and the net amount is either credited
to process account or is deducted from the total cost. When a by-product requires
further processing after split-off, the processing cost as well as selling cost, if any is
deducted from the same value, and the net value of the by-product is deducted from
the cost of the main product or credited to the relevant process account.
c) By-product sales being treated as additional sales hence increasingturnover figures of the firm.
Illustration
A company processes 2,400kg of beef in a month and this was sold at FRW 1,000.
per kilogram. The total costs of products arising from the main production
process were FRW 1,750,000. 6,000kg of bones were obtained and sold at
FRW 80 per kilogram. The company spent FRW 22. per kilo for packing and
distribution of the bones.
Required
Prepare the income statement for the firm using at least three different methods of
accounting for by-product costing.
Solution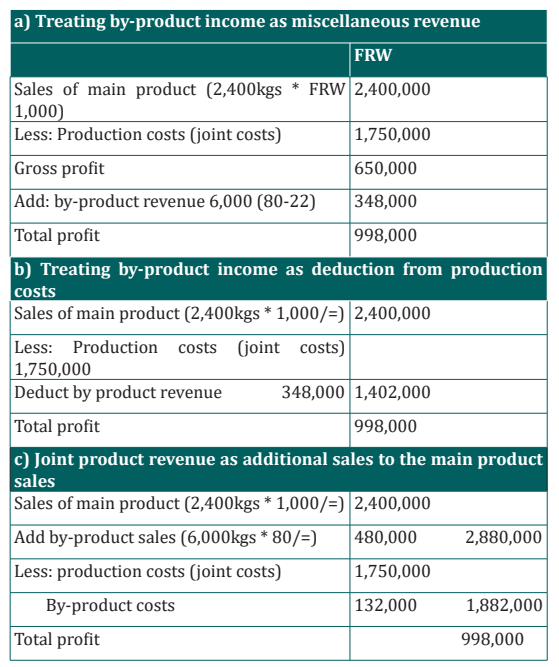
G. Services costing
Definition
The term service costing or operating costing refers to the calculation of the
total operating costs incurred for each unit of the intangible product. These
intangible products or services can either be in the form of internal services
provided by industries as activities supporting the production of goods. Or in
the form of external services offered by the companies in the service sector as
an essential product for customers.
Service costing is an essential concept because every service organization needs
to determine its business overheads. It is intended to ensure fair pricing of theproducts or services; and to maintain control of its fixed and variable costs.
COST UNIT
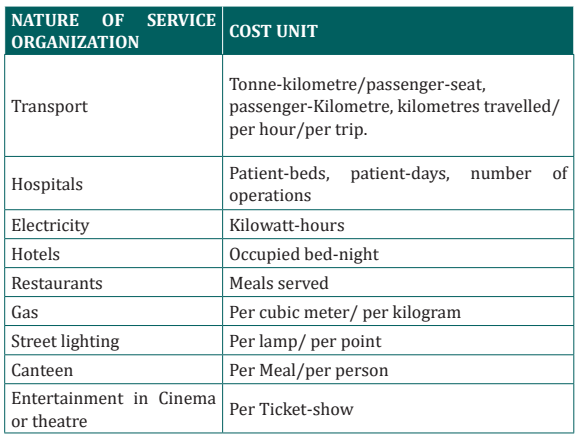
Calculation of cost per unit: The formula for computing the cost of each service
unit (i.e, cost per unit)is given below
In addition, we will discuss transportation cost as an example of service costing.
Therefore, in this section we will look at the calculation of transport costs.
Transportation is one of the most important service industries nowadays, and
it is important to have an insight into the pro forma to determine the operatingcosts of such organisations :
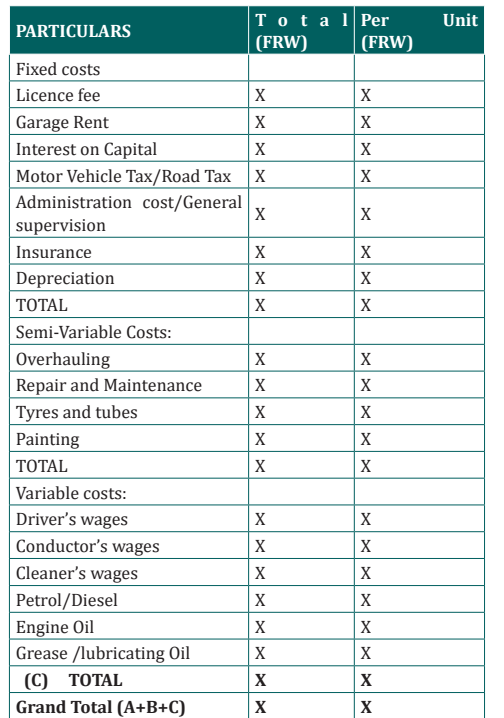
Illustration:
Note that: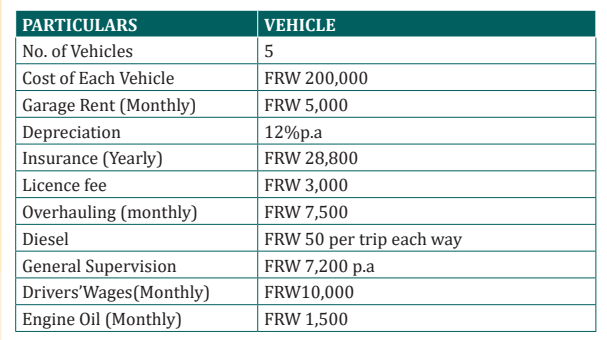
We have assumed that the licence fee was calculated every month. Also, each
vehicle has the capacity of 2-tonne of goods.
If, each vehicle covers a distance of a 100 miles each way daily to and from the
city; each vehicle runs on an average of 20 days a month; and while going to
the city, the capacity was full and while returning the capacity is 25% occupied;
find out the following:
Operating cost per tonne-mile; and Rate per trip to be charged, if the companyplans to make 40% profit on freightage.
ANSWER:
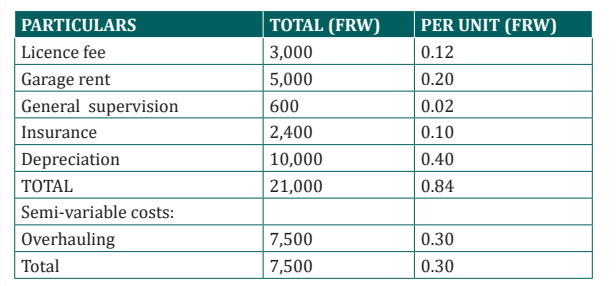
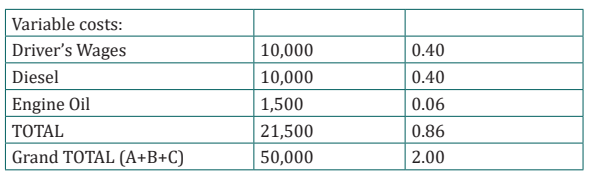
WORKINGS
No. of Cost Units:
On the first way of the trip: 100% capacity was occupied, i.e., 2-tonnes
No. of Cost Units = Distance * Capacity Occupied *Working Days *No. of Vehicles
No. of Cost Units=100*2*20*5 = 20,000 tonne-miles
On the second way of the trip: 25% capacity was occupied, i.e., 0.5-tonnes; Similarly,
No. of Cost Units= 100*0.5*20*5= 5,000 tonne-miles
Hence, Total No. of Cost Units= 20,000 + 5,000 = 25,000 tonne-miles
General Supervision:
Itis given annually, therefore;
Monthly expense on general supervision=7200/12= FRW 600
Insurance:
It is given annually, therefore;Monthly expense on insurance=28800/12= FRW 2400
Depreciation:
It is given annually, therefore; Monthly depreciation=(Total Cost of 5
Vehicles*Rate of Depreciation)/(100*12)
Monthly depreciation=(1000000*12)/(100*12)= FRW 10000
Diesel:
Monthly expense on diesel=Cost per Trip*No. of Ways per Trip*No. of Working
Days*No. of VehiclesMonthly expense on diesel=50*2*20*5= FRW 10000
H. Activity Based Costing (ABC)
Many companies use a traditional cost system such as job-order costing or
process costing, or some hybrid of the two. This traditional system may provide
distorted product cost information. In fact, companies selling multiple products
are making critical decisions about product pricing, making bids, or product
mix, based on inaccurate cost data. These prime costs are traceable to individual
products, and most conventional cost systems are designed to ensure that this
tracing takes place.
The problem is not with assigning the costs of direct labor or direct materials,
but, the assignment of overhead costs to individual products is the main
issue. Using the traditional methods of assigning overhead costs to products
where a single predetermined overhead rate based on any single activity
measure, can produce distorted product costs. The growth in the automation
of manufacturing (such as increased use of robotics, high-tech machinery, and
other computer-driven processes) has changed the nature of manufacturing
and the composition of total product cost. The significance of direct labor
cost has diminished and overhead costs have increased. In this environment,
overhead application rates based on direct labor or any other volume-based
cost driver may not provide accurate overhead charges since they no longerrepresent cause and effect relationships between output and overhead costs.
Activity-based costing (ABC) attempts to get around this problem. An ABC system
assigns costs to products based on the product`s use of activities, not product
volume. It has proved to produce more accurate product costing results in an
environment where there is diversity in product line and services coming out
of the same shop. A recent survey by the Institute of Management Accounting
shows that over 30 percent of the companies which responded currently areusing ABC systems to replace their existing traditional cost systems.
An activity-based cost system is one which first traces costs to activities and then
to products. Traditional product costing also involves two stages, but in the first
stage costs are traced to departments, not to activities. In both traditional andactivity-based costing, the second stage consists of tracing costs to the product.
The principal difference between the two methods is the number of cost drivers
used. Activity-based costing uses a much larger number of cost drivers than the
one or two volume-based cost drivers typical in a conventional system. In fact,
the approach separates overhead costs into overhead cost pools, where each cost
pool is associated with a different cost driver. Then a predetermined overhead
rate is computed for each cost pool and each cost driver. In consequence, this
method has enhanced accuracy.
Activity-based costing (ABC) is not an alternative costing system to job costing
or process costing. It focuses on activities as the principal cost objects. ABC is
a method of assigning costs to goods and services that assumes all costs are
caused by the activities used to produce those goods and services. This method
provides more insight into the causes of costs than conventional costingmethods.
Conventional costing methods divide the total costs by the number of units to
compute a unit cost. In contrast, activity-based costing starts with the detailed
activities required to produce a product or service and computes a product`scost using the following four steps:
1. Identify the activities that consume resources and assign costs to those
activities. Inspection would be an activity, for example.
2. Identify the cost driver (s) associated with each activity or group of
activities, known as a cost pool. A cost driver is a factor that causes, or
“drives,” an activity`s costs. The number of inspections would be a cost
driver. So could the number of times a new drawing is needed because a
product has been redesigned.
3. Calculate an applied rate for each activity pool. The pool rate could be
for example the cost per purchase order.
4. Assign costs to products by multiplying the cost pool rate by the number
of cost driver units consumed by the product. For example, the cost per
inspection times the number of inspections required for Product X for
the month of March would measure the cost of inspection activity forProduct X for March.
Note: ABC is also applicable to service, merchandising, and nonprofit sectors as
well as manufacturing companies.
First-Stage Procedure:
In the first stage of activity-based costing, overhead costs are divided into
homogeneous cost pools. A homogeneous cost pool is a collection of overhead
costs for which cost variations can be explained by a single cost driver. Overhead
activities are homogeneous whenever they have the same consumption ratiosfor all products.
Once a cost pool is defined, the cost per unit of the cost driver is computed
for that pool. This is referred to as the pool rate. Computation of the pool rate
completes the first stage. Thus, the first stage produces two outcomes: (1) a setof homogeneous cost pools and (2) a pool rate.
Second-Stage Procedure:
In the second stage, the costs of each overhead pool are traced to products. This
is done using the pool rate computed in the first stage and the measure of the
amount of resources consumed by each product. This measure is simply the
quantity of the cost driver used by each product. In our example, that would
be the number of production runs and machine hours used by each product.
Thus, the overhead assigned from each cost pool to each product is computed
as follows:Applied overhead = Pool rate x Cost driver units used
The total overhead cost per unit of product is obtained by first tracing the
overhead costs from the pools to the individual products. This total is then
divided by the number of units produced. The result is the unit overhead
cost. Adding the per-unit overhead cost to the per-unit prime cost yields the
manufacturing cost per unit. Illustration see (Team ltd below)Advantages of ABC method :
1. The complexity of manufacturing has increased, with wider product
ranges, shorter product life cycles and more complex production
processes. ABC recognises this complexity with its multiple costdrivers.
2. In a more competitive environment, companies must be able to assess
product profitability realistically. ABC facilitates a good understanding
of what drives overheads costs.
3. In modern manufacturing systems, overheads functions include a lot
of non-factory floor activities such as product design, quality control,
production planning and customer services. ABC is concerned with all
overhead cost and so it can take management accounting beyond itstraditional floor boundaries.
Disadvantages of (ABC)/criticisms of( ABC)
1. Cost apportionment may still be required at the cost pooling stage
for shared items of cost, such as rent, rate, building depreciation.
Apportionment can be an arbitrary way of sharing costs
2. A single cost driver may not explain the cost behaviour of all items in a
cost pool. An activity may have two or more cost drivers.
3. Unless cost are ‘driven’ by an activity that is measurable in quantitativeterms, cost drivers cannot be used.
4. There must be reason for using a system of ABC must provide
meaningful product costs or extra information that managements will
use. If management is not going to use ABC information for any practical
purpose, a traditional absorption costing system would be simpler to
operate and just as good.
5. The cost of implementing and maintaining an ABC system can exceed
the benefits of improved accuracy in product costs.
6. Implementing ABC is often problematic due to problems with
understanding activities and their costs.
7. ABC is an absorption costing which has only limited value for managementaccounting purpose.
Illustration:
Team ltd manufacture four products W,X,Y and Z. Output and cost data for theperiod just ending are as follows :
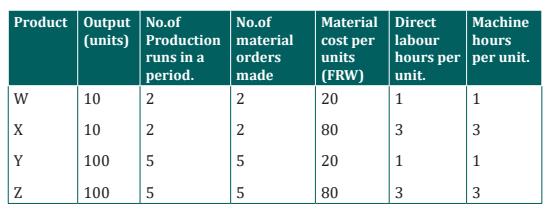
Direct labour cost per hour = FRW 5
Overheads cost (common costs) FRW’ (000)
Overheads variable costs 3,080
Set- up costs 10,920
Scheduling costs 9,100
Material handling costs 7,70030,800
REQUIRED
Use both traditional /conventional cost system and ABC systems to determine
the cost of each product.
Compare the results got using the two systems and comment accordingly.
ANSWER:A) Using traditional costing system direct labour hour or machine hours
can be used as bases of apportionment and hence the product costwould be as follows :
Overhead absorption rate (O.A.R)=Overheads cost/no.of Direct labour hours,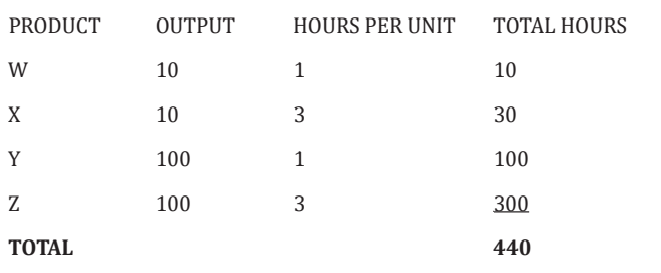
machine hours
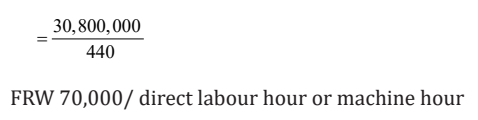
Determination of each product’
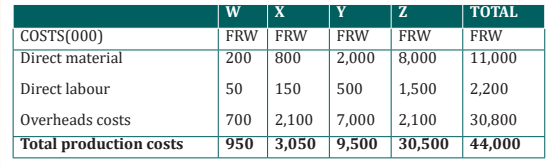
Overhead absorbed by each product =number of hours per unit*O.A.R
(b) Using ABC, and assuming that the number of production runs is the cost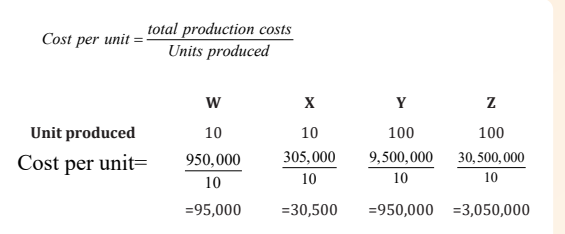
driver for set up cost and scheduling cost, number of orders for material handlingcosts and that machine hours are the cost drivers for overheads variable costs.
ANSWER :
Cost driver rate= Overheads/ Quantity of cost driver(FRW 000) (000)
1. 3,080÷440 Machine hours= FRW 7 per machine hour.
2. 10,920 ÷14 production runs= FRW 780 per production run
3. 9,100 ÷14 production run = FRW 650 per production run
4. 7,700÷14 no.of orders = FRW 550 per order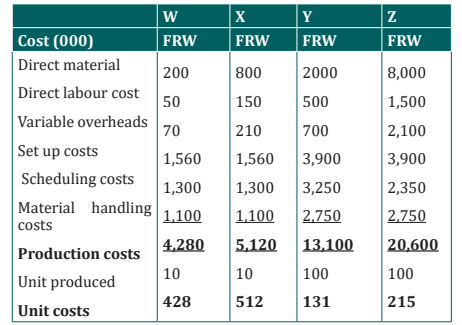
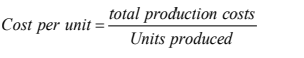
Overhead assigned to products=Cost driver rate*number of activities.
E.g. Set up costs has been absorbed as follows :
Product W=2(production runs)*780,000=(cost driver rate)=1,560,000
Product X=2(production runs)*780,000=(cost driver rate)=1,560,000
Product Y=5(production runs)*780,000=(cost driver rate)=3,900000Product W=5(production runs)*780,000=(cost driver rate)=3,900000
SUMMARY OF THE COMPARISONS :
The figures suggest that the traditional volume related costing system gives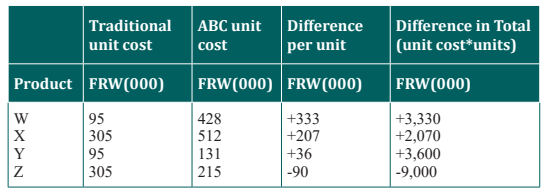
misleading cost information. It underallocates overhead cost to low-volume
products (i.e W&X with ten units of output) and over allocates overheads to
higher volume products (i.e Z in particular) This confirms the earlier statementsmade.
Application activity 3.1
1.Choose the correct sentence related to activity-based costinga) ABC uses a plant-wide overhead rate to assign overhead2. Which of the following is a limitation of activity-based costing
b) ABC is not expensive to implement
c) ABC typically applies overhead cost using direct labor-hours
d) ABC uses multiple activity ratesa) costs are accumulated by each major activity
b) A variety of activity measures are usedc) All cost in an activity cost pool pertain to a single activityeach cost pool is strictly proportional to its cost measure
d) Activity-based costing relies on the assumption that the cost in
3.Define the following concepts:
1. By-product
2. Joint product
4.Vehicle carries 8 tonnes on a trip and delivers as follows:
3tonnes after 20km, 2tonnes after a further 10km, and the remaining
5tonnes after a further 30km, it then returns empty, covering a distance of60km. The following information in respect of costs is provided
FRW
Fuel and lubricants 100
Wages driver 150Mate 80
Share of annual costs like insurance, maintenance, administration,
depreciation etc. charged to this trip amounts to FRW 320
You are required to calculate:a) Cost per tonne-kilometre3.2. Decision makingb) Cost per kilometre.
Learning Activity 3.2
RTS Ltd is a manufacturing company which produces and sells radios. It
has two main challenges such as setting competitive market price and a
stiff competition with foreign companies. The management has hired a
cost accountant to set different pricing strategies. The cost accountant
has proposed and submitted the following strategies for decision makingpurpose:
1. The company should set the price based on cost of materials used
during production process and the cost of each activity required to
complete the production and delivery of product to the customer
as well; as a result, the price becomes high compared to the market
price of similar radios and the contribution margin has negativefigures.
2. The company should set the price based on cost of additional
unit; and a consider the fixed cost absorbed during the production
process, then marginal contribution has a positive figures and net
operating profit.
3. The company set the price based on cost of last unit produced and
considers the fixed cost absorbed during the production process; in
this case the contribution margin is positive and net operating loss.
4. The company should purchase radio materials from foreign
specialized company and assemble them locally, this strategy
reduces 3% on existing cost. The contribution margin is positive and
net operating profit has a negative figure.
5. The company should purchase radios from specialized foreign
company and resell them to the market, in case of adopting this
strategy, the selling price of imported radios is less than the variable
cost required to produce a radio. In that case the contribution margin
has negative figures and net operating loss
After a deep analysis, the management of company has selected the strategy
which brings to the company a positive contribution and a positive netoperating profit.
Question
1. Identify the costing techniques used on each price strategy
2. From this case study, select the pricing strategies, the company mayadopt and justify the reasons.
3.2.1. Introduction to decision making
In management accounting, decision‑making may be simply defined as
choosing the best course of action among the alternatives available. If there are
no alternatives, then no decision is required. The assumption is that the best
decision is the one that generates the most revenue or the least amount of cost.
The process of making decisions is generally considered to involve the following
steps:
i) Identify the various alternatives for a given type of decision.
ii) Obtain the necessary data necessary to evaluate the various alternatives.
iii) Analyze and determine the consequences of each alternative.
iv) Select the alternative that appears to best achieve the desired goals or
objectives.
v) Implement the chosen alternative.
vi) At an appropriate time, evaluate the results of the decisions againststandards or other desired results.
Respond to the variancesIn management accounting, it is useful to classify decisions as:
1. Strategic and tactical2. Short‑run and long-run Strategic andTactical Decisions
In management accounting, the objective is not necessarily to make the
best decision but to make a good decision. Because of complex interacting
relationships, it is very difficult, even if possible, to determine the best decision.
Management decision‑making is highly subjective.
Whether a decision is good or acceptable depends on the goals and objectives
of management. Consequently, a prerequisite to decision‑making is that
management have set the organization’s goals and objectives. For example,
management must decide strategic objectives such as the company’s product
line, pricing strategy, quality of product, willingness to assume risk and profit
objective. In setting goals and objectives, it is useful to distinguish between
strategic and tactical decisions. Strategic decisions are broad‑based, qualitative
type of decisions which include or reflect goals and objectives. Strategic
decisions are non quantitative in nature. Strategic decisions are based on the
subjective thinking of management concerning goals and objectives. Examples
of strategic decisions and tactical decisions from a management accountingpoint of view include:
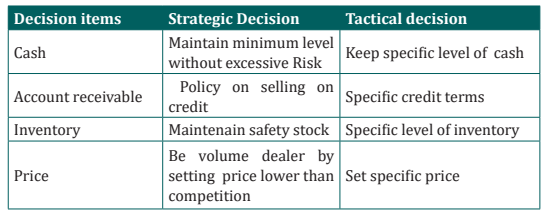
3.2.2. Marginal costing and decision making
Marginal costing, as one of the tools of management accounting helps
management in making certain decisions. It provides management with
information regarding the behavior of costs and the incidence of such costs
on the profitability of an undertaking. Marginal costing is the ascertainment of
marginal costs by differentiating between fixed costs and variable costs and to
see the effects on profit of changes in volume or type of output. Thus, marginal
costing includes two things i.e. The ascertainment marginal cost and the cost
volume profit relationship. In this technique of costing only variable costs are
charged to operations, processes or products leaving all indirect costs to bewritten off against profits in the period in which they arise.
A. Ascertainment of marginal cost
Marginal cost is incremental/additional cost of production which arises due to
one –unit increase in production quantity. Variable costs have direct relationship
with the volume of output and fixed costs remains constant irrespective ofvolume of production.
– Marginal costing decisions
• Contribution
Contribution is the reward for the efforts of the entrepreneur or owner of a
business concern. From this, one can get in his mind that contribution means
profit. But it is not so.
Contribution is helpful in determination of profitability of the products and/
or priorities for profitability of the products. When there are two or more
products, the product having more contribution is more profitable.
For example: The following are three products with selling price and costdetails:
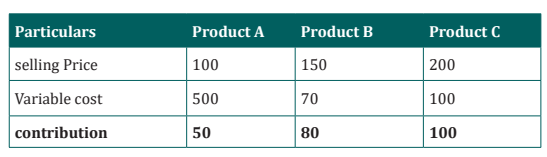
In the above example, one can say that the product ‘C’ is more profitable because,
it has more contribution. This proposition of product having more contribution
is more profitable is valid, as long as, there are no limitations on any factor of
production.CHOICE OF A PRODUCT FROM VARIOUS ALTERNATIVES
A company can produce different types of goods on a machine, in this case the
choice is to be made\ from various alternatives. The company will prefer toproduce that product which gives maximum contribution.
Illustration:
ABC Ltd is a manufacturing company which can produce three products A, B
and C on Machine “P”. The following information is provided in respect ofthese three products for a specific period.
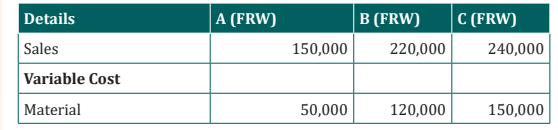
You are required to advise the company regarding the choice of best product.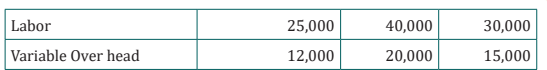
ANSWER
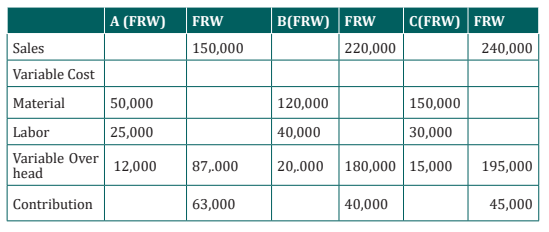
The company should produce A because this product has maximum contribution.
The ranking of these products from the point of view of contribution will be:Product
A :1st B:3rd C:2ndThe profit from these products will be:
• ACCEPTANCE AND REJECTION OF A SPECIAL ORDER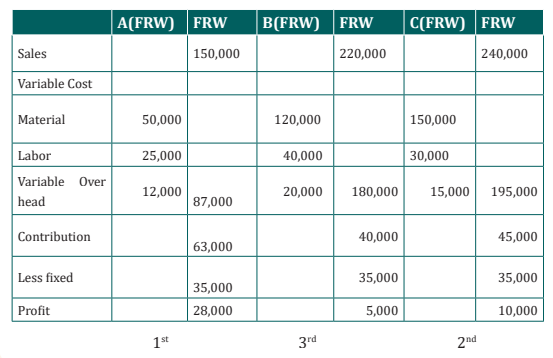
Sometimes, a company has to decide regarding the acceptance or rejection of
a special order. In this case also the gain or loss on contribution is the decision
factor .
EXPO Ltd manufactures a product Zed which they sell for FRW 25 per unit.
Current output is 20,000 units per month which represent a 100% of the
capacity. They received an order of 2,000 units which they can produce by
working extra time during the month.
The selling price is FRW 48,000.
The total quantity of the last month were FRW 420,000 which include fixed costs
of FRW 70,000. If the special order for 2,000 units is received, then the variable
cost per unit will increase by 20% but the fixed cost will remain unchanged.
You are required to advise the company whether to accept or reject this order.Answer
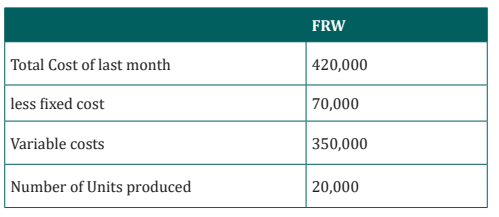
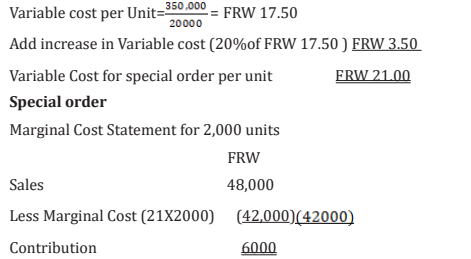
This order will increase the contribution of the current month by FRW 6000 .so
it should be accepted. The final decision also depends upon some other factors
like the willingness of the workers to work for extra time and the possibility ofthe repeat orders from the same customers.
DROPPING A PRODUCT
If a company has a range of products and one of which is deemed to be
unprofitable, the company may consider to drop this product and to increasethe production of more profitable products.
Example . a company produces three products for which the following datahave been provided :
Total cost comprises of 75% Variable cost and 25% fixed cost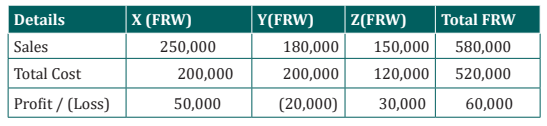
The director of company consider that the product “Y’ Shows a loss, so it should
be discontinued. You are required to advise the management whether to dropthe product “Y’ or not?
ANSWER
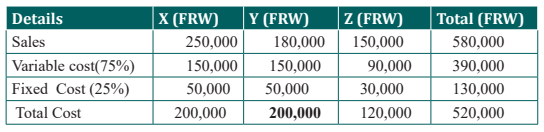
• MARGINAL COST STATEMENT PRODUCT
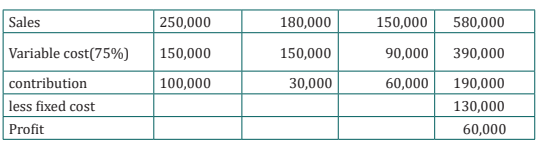
If the product “Y” is dropped then the position would be as under

The dropping of product “Y” reduces the profit of the company from FRW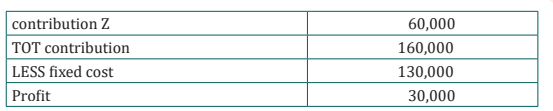
60,000 to FRW 30,000 which is the amount of contribution lost from product
Y. In this situation the product Y should not dropped inspite of the fact that it
gives a loss FRW 20,000. If the sales of other products can be increased then the
product Y can be dropped and same resources should then be used to increasethe production of X and Z.
• Make or Buy Decisions
When the management is confronted with the problem whether it would be
economical to purchase a component or a product from outside sources, or to
manufacture it internally, marginal cost analysis renders useful assistance in
the matter. Under such circumstances, a misleading decision would be taken on
the basis of the total cost analysis. In case the proposal is to buy from outside
then, what is already being made, then the price quoted by the outsider should
be lower than the marginal cost of manufacturing it internally. If the proposal is
to make something what is being purchased outside, the cost of making should
include all additional costs like depreciation on new plant, interest on capitalinvolved and that cost should be compared with the purchase price.
The decision to make or buy is based on comparison of the marginal cost of
manufacturing internally and the purchase price of an external supplier of the
component. The choice is guided by the objective of minimizing cost and hencechoose the option which is cheaper.
Illustration
A T.V. manufacturing company finds that while it incurs costs to make component
X, the same is available in the market at FRW 5.75 each, with all assurance ofcontinued supply. The breakdown of cost per unit incurred by the company is:
a) Should the company make or buy the component?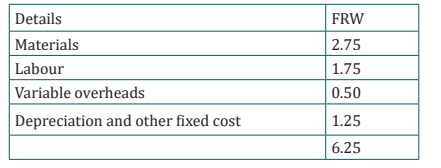
b) What should be your decision if the supplier offered component atFRW 4.85 each?
Answer
a) The purchase cost of the above component is FRW 5.75 each. If the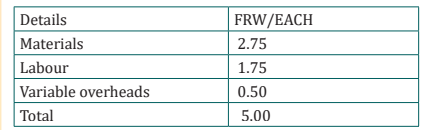
company is having spare capacity which cannot be filled with more
profitable jobs, it is recommended that the above component be
manufactured in the company since the marginal cost at FRW 5.00
each is less than the purchase cost of FRW 5.75.
b) In the event that the purchase cost is FRW 4.85 each which is less
than the marginal cost of FRW 5.00 each, it is recommended that the
component be bought from the supplier as this results in a saving of
FRW 0.15 each. The spare capacity thus available can be utilised forother purposes, as far as possible.
3.2.3. Absorption costing and decision making
Absorption costing means that all of the manufacturing costs are absorbed
by the total units produced. In short, the cost of a finished unit in inventory
will include direct materials, direct labour, and both variable and fixed
manufacturing overhead. As a result, absorption costing is also referred to as
full costing or the full absorption method. Absorption costing is often contrasted
with variable costing or direct costing. Under variable or direct costing, the fixed
manufacturing overhead costs are not allocated to the products manufactured.
Variable costing is often useful for management’s decision-making. However,
absorption costing is required for external financial reporting and for income
tax reporting. It is also referred to as full- cost techniqueA. PROFIT CALCULATION FROM ABSORPTION COSTING
Absorption costing is a costing technique that includes all manufacturing
costs, in the form of direct materials, direct labour, and both variable and fixed
manufacturing overheads, while determining the cost per unit of a product.In the context of costing of a product/service, an absorption costing considers
a share of all costs incurred by a business to each of its products/services. In
absorption costing technique; costs are classified according to their functions.
The gross profit is calculated after deducting production costs from sales and
from gross profit, costs incurred in relation to other business functions are
deducted to arrive at the net profit. Absorption costing gives better informationfor pricing products as it includes both variable and fixed costs.
Absorption costing technique absorbed fixed manufacturing overhead into
the cost of goods produced and are only charged against profit in the period
in which those goods are sold. In absorption costing income statement,
adjustment pertaining to under or over-absorption of overheads is also made
to arrive at the profit. Absorption costing is a simple and fundamental methodof ascertaining the cost of a product or service.
• Inventory valuation
Finished goods inventories are over-stated in absorption costing as it includes
one more cost element in inventory value than under variable costing, i.e thefixed manufacturing cost.
Inventory value under absorption costing
= Direct material+ Direct labour +variable manufacturing costs+ Fixed
manufacturing costs
The differences between the profits revealed by absorption costing andmarginal costing can be computed with the help of the following formula:

Illustration
A company makes and sells a single product. At the beginning of period 1, there
was no opening stock of the product, for which the variable production cost
was FRW 4 and the sale price was FRW 6 per unit. Fixed costs are FRW 2,000
per period of which FRW 1,500 are fixed production costs. The following detailsare available:
What would be the profit in each period using -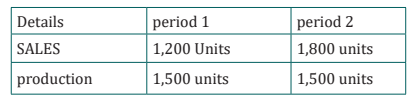 a) Absorption costing. (Assume normal output is 1,500 units per period);Answer
and
b) Marginal costing?a. Absorption Costing Method
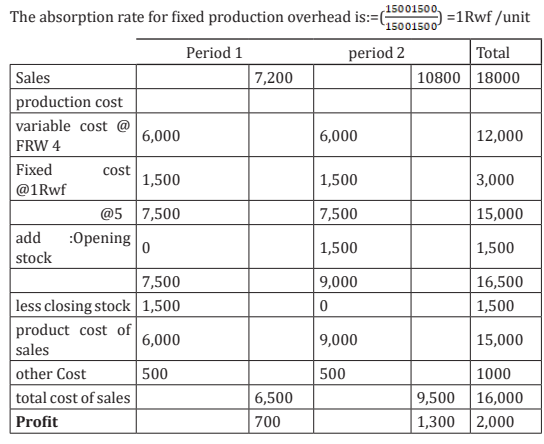
b. Marginal Cost Method: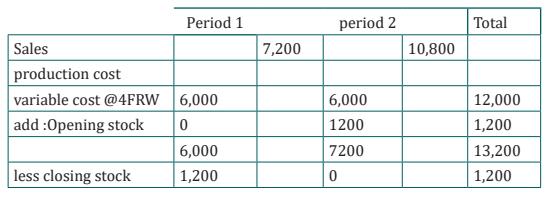
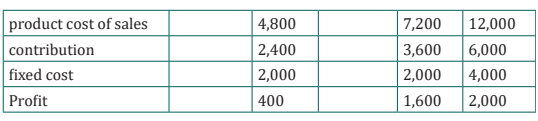
B. Absorption Decision making
1. Profit planning
There are four ways in which profit performance of a business can be
improved:by increasing volume, by increasing selling price; by decreasing
variable costs; and by decreasing fixed costs. Profit planning is the planning of
future operations to attain maximum profit or to maintain a specified level of
profit. Profitability of the different sectors of the business whenever there is a
change in selling price, variable costs or fixed cost absorbed. Best product isproduct which generates a high profit compare to others
2. Evaluation of Performance
The various section of a concern such as a department, a product line, or a
particular market or sales division, have different revenue earning potentialities.
A company always concentrates on the departments or product lines which
yield more net profit than others. The performance of each such sector can be
brought out by means of higher profit generation. The analysis will help thecompany to take decision that will maximize the profits.
3. Alternative Use of Production Facilities
When alternative use of production facilities or alternative methods of
manufacturing a product are available, contribution analysis should be used to
arrive at the final choice. The alternative which will yield highest contribution
shall generally and obviously be selected.
3.2.4. Break-even point and decision making
1. Contribution
The contribution from a product is the amount by which its selling price
exceeds its variable cost. The idea of contribution is central to breakeven
analysis in evaluating the effects of various decisions. Once the contribution
per unit is known it can be compared with the fixed costs. The business does
not begin to make a profit until the fixed costs are covered, so the formula isapplied as:
Covering fixed costs and making a profit
To find the level of sales necessary to cover fixed costs and make a specified
profit a knowledge of selling price per unit, variable cost per unit, and the fixedcosts together with the desired profit. These are set out in the data table.
Example1.AKEZA produces the following cost data related to the production of product Y.
a) Calculate the break evenpoint ?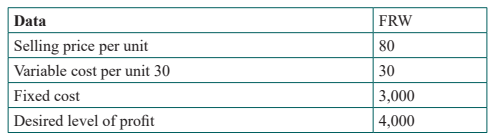
b) Calculate the level of output that can help the company to generate
FRW 4,000 as a profit?
ANSWERContribution =80-30 = FRW 50
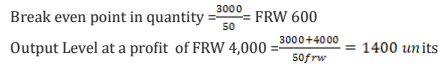
2. Sensitivity Analysis
Beyond the breakeven point the fixed costs are covered and the sales of further
units are making a contribution to profit. The higher the contribution per unit,
the greater the profit from any particular level of activity
a. Margin of safety
The margin of safety has been defined as the difference between the breakeven
sales and the normal level of sales, measured in units or in Cash of sales.
b. Change in selling price
If the selling price per unit increases and costs remain constant, then the
contribution per unit will increase and the breakeven volume will be lower.
Take as an example the dry-cleaning business of the previous illustration
c. Change in variable cost
The effect of a change in variable cost is very similar to the effect of a change in
selling price. If the variable cost per unit increases, then the contribution per
unit will decrease, with the result that more items will have to be sold in order
to reach the breakeven point. If it is possible to reduce variable costs, then the
contribution per unit will increase. The enterprise will reach the breakeven
point at a lower level of activity and will then be earning profits at a faster rate.
d. Change in fixed costs
If fixed costs increase, then more units have to be sold in order to reach the
breakeven point. Where the fixed costs of an operation are relatively high, there
is a perception of greater risk because a cutback in activity for any reason is
more likely to lead to a loss. Where an organisation has relatively low fixed
costs, there may be less concern about margins of safety because the breakeven
point is correspondingly lower.
3. Profit Volume Ratio (P/V Ratio) or Contribution Ratio:
The P/V ratio is very important ratio studying the profitability of operations
of a business and established relationship between the contribution and sales.
In order to find out which product is most profitable, we have to calculate the
profit-volume ratio of the different products. The product which gives the
maximum P/V ratio is the most profitable. Every concern tries to maximise P/V
ratio, as higher P/V ratio gives an indication of more profit. It can be increased
by: Increasing the selling price of the product.
i) Decreasing the variable cost of the product and
ii) Shifting to the production of those products which are more profitable or
having more P/V ratio. With the help of this ratio variable costs can also
be calculated by the following: Variable costs = Sales(1-P/V ratio)
For example: Gross profit ratio: It may be expressed as:
• Sales is 4 times that of gross profit• Gross profit ratio is 25%
4. Margin of Safety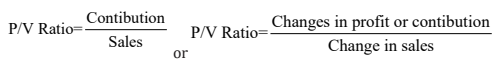
Margin of safety is the difference between the actual sales and sales at breakeven
point. At breakeven point ,we have seen there is no profit or loss. It is only after
the breakeven point that the business starts making profit.The more the actual
sales are from the breakeven point the more margin of safety will be. Margin
of safety indicates the strength of the business. If the production or sales are
increased from the breakeven point the margin of safety will increase. The more
the margin of safety the more beneficial it is for the business. Every concern
tries to increase the margin of safety in order to increase the strength of the
business. Margin of safety can be increased by the following steps: Increase the
level of production, Increase the selling price, Reduce the fixed costs or variablecosts or both, Substitute the existing product by more profitable products.
Margin of Safety in sales = Total Sales – Break Even Sales (1)Total Sales = Break Even Sales + Margin of Safety Sales (2)
Illustration
Magasin Sport Class is a sports material manufacturing company and hasbudgeted the following revenues and costs data for the coming year.
Calculate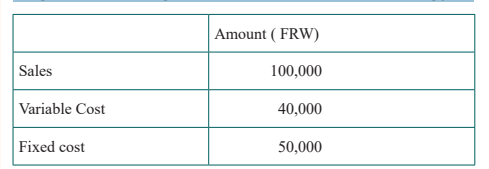 a) P/V Ratio, B.E.P in sales and Margin of Safety in sales
b) Evaluate the effect of the policy adopted on the profitability
i) 20% increase in sales volume
ii) 20% decrease in sales volume
iii) 5% increase in variable costs
iv)5% decrease in variable costs
v) 10% increase in fixed costsAnswer
a) P/V ratio, B.E.P and Margin of Safety
Contribution = Sales – Variable cost
= 1,00,000 – 40,000 = FRW 60,000
P/V Ratio = (Contribution / Sales) x 100
= (60,000 / 1,00,000) x 100 = 60%
B.E.P sales = Fixed cost / PV ratio
= 50,000 / 60% = FRW 83,333
Margin of Safety = Total sales – B.E.P sales
= 1,00,000 – 83,333 = FRW 16,667 This is considered as a
profit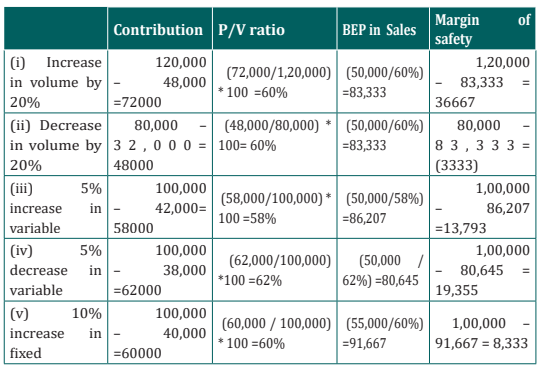
3.2.5. Activity-Based costing and decision making
The features of ABC are as under
i) Activity-based costing (ABC) is a two-stage product costing method that
first assigns costs to activities and then allocates them to products based
on each product’s consumption of activities.
ii) Activity-based costing is based on the concept that products consume
activities and activities consume resources.
iii) Activity-based costing can be used by any organization that wants a
better understanding of the costs of the goods and services it provides,including manufacturing, service, and even nonprofit organizations.
USES OF ACTIVITY BASED COSTING
The areas in which activity based information is used for decision making are
as under: -
1. Activity costs: ABC is designed to track the cost of activities, so we can
use it to see if activity costs are in line with industry standards. If not,
ABC is an excellent feedback tool for measuring the ongoing cost of
specific services as management focuses on cost reduction.
2. Customer profitability: Though most of the costs incurred for
individual customers are simply product costs, there is also an overhead
component, such as unusually high customer service levels, product
return handling, and cooperative marketing agreements. An ABC system
can sort through these additional overhead costs and determine which
customers are providing a reasonable profit. This analysis may result
in some unprofitable customers being turned away, or more emphasis
being placed on those customers who are contributing more in profits.
3. Distribution cost: Organisation uses a variety of distribution channels
to sell its products, such as retail, Internet, distributors, and mail order
catalogs. Most of the structural cost of maintaining a distribution
channel is overhead, so if we can make a reasonable determination of
which distribution channels are using overhead, we can make decisions
to alter how distribution channels are used, or even to drop unprofitable
channels.
4. Make or buy: ABC enables the manager to decide whether he should get
the activity done within the firm or outsource it. Outsourcing may be
done if the firm is incurring higher overhead costs as compared to the
outsourcer or vice-versa.
5. Margins: With proper overhead allocation from an ABC system, we can
determine the margins of various products, product lines, and entire
subsidiaries. This can be quite useful for determining where to position
company resources to earn the largest margins.
6. Minimum price: Product pricing is really based on the price that the
market will bear, but the marketing manager should know what the
cost of the product is, in order to avoid selling a product that will lose a
company money on every sale. ABC is very good for determining which
overhead costs should be included in this minimum cost, dependingupon the circumstances under which products are being sold.
3.2.6. Processing costing and decision making
Process costing Decisions.
1. Sell or Process-Further
Decision rule: when incremental revenues exceed incremental costs (may also
need to consider opportunity costs), the company should further process the
products. Do not assume all separable costs in joint-cost allocations are alwaysincremental costs.
Illustration
DG Ltd is a souvenir supplier which makes and sells gold coins. The gold coins
are finished either rough or further polished.
• Rough gold coin can be sold for FRW 800 each and the polished gold coin can
be sold for FRW 1,000 each.
• Platinum, the direct material, costs FRW 120 per pound.
• Processing costs are FRW 16,000 to convert 40 pounds of platinum into 80
rough gold coins.
• Fixed manufacturing cost amounted to FRW 120 per gold coin.
• For polished gold coin, it needs an additional processing cost of FRW
250 each. However, it does not need additional platinum and fixed
manufacturing overheads.
Required: Should DG Ltd further process rough gold coin into polished gold
coin?
ANSWER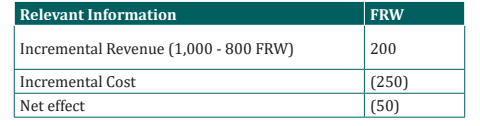
I cannot advise DG Ltd to further process this rough gold coins because there isa negative effect of FRW 50 for further processing.
2. Make or Buy Decisions
Decisions about whether a producer of goods or services will make it
internernally or outsource. Surveys of companies indicate that managers
consider quality, dependability of suppliers, and costs as the most important
factors in the make-or-buy decision.
Example .ABC firm can purchase a spare part from an outside source at FRW
6500 per unit. There is a proposal that the spare part be produced in the factory
itself and cost of processing has identified and recorded. For the purpose of
making the spare part a machine costing FRW 1,000,000 with an annual capacity
of 20,000 units and a life of 10 years, will be required. Materials required will
be FRW 1,750 per unit and wages FRW 1,900 per unit, direct, Expenses for FRW
1,000 per unit Variable overheads are FRW 1,250. Advise the firm whether the
proposal should be accepted.Answer
Purchase price FRW 6500
Variable cost FRW
MATERIAL COST 1,750
Labor Cost /wages 1,900
Direct expenses 2,000
Variable overhead 1,250 (6,900)
Contribution form purchase outside FRW (400)Advice the firm whether the proposal should be accepted,
The proposal should not be accepted because the company has obtained a
negative contribution of FRW 400. The firm should continue to purchase spare
part outside instead of producing them internally.
3. Dropping a product
A Manufacturing company has a range of products and if one of which is deemed
to be unprofitable, due to high processing cost, the company may consider todrop this product and to increase the production of more profitable products.
3.2.7. CVP and decision making
Cost Volume Profit decisions
1. Special order to use up spare capacity
In the short term, a business must ensure that the revenue from each item of
activity at least covers variable costs and makes a contribution to fixed costs.
Once the fixed costs are covered by contribution, the greater the level of activity,
the higher the profit.
When the business reaches full capacity there will be a new element of fixed
cost to consider should the business decide to increase its capacity. If there is
no increase in capacity, then the business should concentrate on those activities
producing the highest contribution per unit or per item. the special order is
acceptable provided the sales price per item covers the variable costs per item
and provided there is no alternative use for the spare capacity which could
result in a higher contribution per item.
2. Abandonment of a line of business
The allocation of fixed costs to products is a process which is somewhat arbitrary
in nature, and is not relevant to decision making because the fixed costs are
incurred irrespective of whether any business activity takes place. When a line
of business comes under scrutiny as to its profitability, cost–volume–profit
analysis shows that in the short term it is worth continuing with the line if it
makes a contribution to fixed costs. If the line of business is abandoned and
nothing better takes its place, then that contribution is lost but the fixed costsrun on regardless.
3. Existence of a limiting factor
In the short term, it may be that one of the inputs to a business activity is
restricted in its availability. There may be a shortage of raw materials or a
limited supply of skilled labour. There may be a delivery delay on machinery
or a planning restriction which prevents the . The item which is restricted in
availability is called the limiting factor. Cost–volume–profit analysis shows
that maximization of profit will occur if the activity is chosen which gives thehighest contribution per unit of limiting factor.
4. In-house activity versus bought-in contract
For a manufacturing business, there may be a decision between making a
component in-house as compared with buying the item ready-made. Cost–
volume–profit analysis shows that the decision should be based on comparison
of variable costs per unit, relating this to the difference in fixed costs betweenthe options.
Application activity 3.2
Q1. A business has budgeted sales of its single product of 38,000units.The
selling price per unit is FRW 57,000 and the variable costs production are
FRW 45,000. The fixed costs of the business are FRW360,000,000. Choose
the correct breakeven point in units from the following.
– A 3,529
– B 8,000
– C 9,474
– D 30,000
Q2. ABC Ltd produces four products (P,Q,R and S)and the following details
are provided: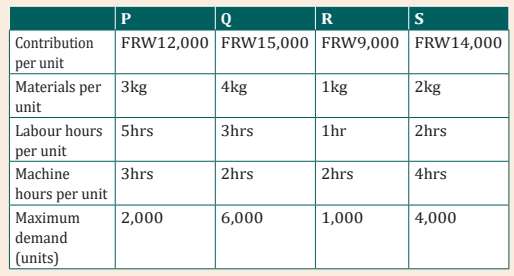
Machine hours are limited to38,000 hours. Labour hours are limited to
40,000 hours and materials are limited to 30,000kg. Determine whether
any of the resource limits will prevent the maximum demand beingproduced.
Skills Lab 3
Senior five accountancy students started business club named
“Birashoboka” by using their money. They invested in Piggery and Poultry.
The financial information related to business income and expenditure areindicated in this table below.
Three Senior five students as owners and the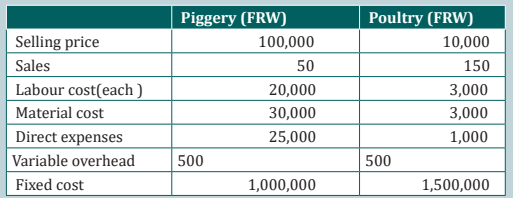
supervisors of these projects, They find it difficult to run both projects
because of their limited number that is insufficient to share all their routine
responsibilities of keeping hens and pigs. Some pigs and hens started
dying because of little care given to them. The headmaster of the school
has advised the students to perform only one project because hefound that
it is difficult to manage both at ago. In the annual general meeting, the
club management has decided to drop one business and continue with one
which is more profitable.
Imagine you are one the management team and you are requested to
explain to the entire club members on which project to maintain, what
would you say while selecting the best project? Draft a summary report
and use the following methods to inform your decision / communication
to the club.a) Marginal contributionEnd of unit assessment 3
b) Breakeven pointc) Net profit by using marginal costing
1. Define margin of safety?
2. A business has fixed costs of FRW 910million. It produces and sells
a single product at a selling price of FRW 24,000 and the variable
costs of production and sales are FRW 17,000 per unit. How many
units of the product must the business produce and sell inorder to
make a profit of FRW 500 million?– A 909,9933. NYIRANEZA’s sales turnover and profit during two years were as
– B 130,000
– C 201,429
– D 22,195follow :
Calculate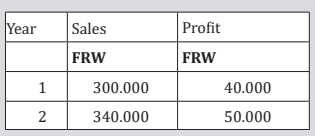
i) P/V Ratio
ii) BreakEven Point
iii) The sales required to earn a profit of FRW 80,000
iv)The profit when sales are FRW 5,00,000v) Margin of safety at a point of sales of FRW1,000,000.
UNIT 4: THE CASH MANAGEMENT PROCEDURES IN ORGANIZATION
Key unit competence: Describe the cash management procedures in organization
Introductory activity
1. Analyze the above picture and answer the questions that follow:
i) Identify the different activities shown on above picture.
ii) Which kind of agents intervening in the specified activities?
iii) Are all agents having the same intention? Which ones and in which
way?
iv)Which cash management procedures are involved in the above
activities?
1.1. Introduction to cash management
Learning Activity 4.1
HEMA PLC is profit oriented company processing many products from two
cereals, which are maize and wheat, for sales in Rwanda. The products
produced in that enterprise are Maize flour super, Maize flour Bugesera,
Wheat flour porridge and Wheat Flour Baker all of which were experiencing
sharp growth of sales and profitability to the whole business.
In the post Covid-19 period, HEMA PLC improved its organizational
management strategy and announced an implementation plan of 2 years.
The plan shows that Cash receipts from sales and Investments are estimated
to be FRW 10,000,000 and FRW 35,500,000, respectively; FRW 12,500,000
cash payments on supplies; Salaries of FRW 25,000,000 payables in the
period in which they occur; Other cash payments estimated as being
FRW 4,200,000 and Opening cash balance was FRW 300,000. Because
of external factors from business environment which made cereals to
become scarce, HEMA PLC borrowed FRW 3,000,000, as liquid cash, from
its Comercial bank to finance its new strategy. Its strategic restructuring
of the management strategy, the expected results are high financial and
non-financial performance. As shown in the financial statements and other
report of performance, as the story of HEMA PLC illustrates, management
accountant must understand how cash management procedures are
followed, analyzed, and reported to managerial decision makers.
Management accountant must be able reconcile financial and nonfinancial
information from various business activities for internal and externalreporting.
Questions:
1. According to the story of HEMA PLC explain the situation faced up to
liquidity borrowing.2. Name the management accounting terms used in HEMA PLC story.
4.1.1. Definition of concepts
a. Cash-flows
Cash flows are inflows and outflows in cash equivalent. These cash equivalent
are cash received and paid on operating, investing, or financing activities in thestatement of cash flows, and depending also on the nature of the transaction.
These cash equivalents consist of the temporary investments of cash not
required at present by the business, such as funds put on short-term deposit
with a bank. Such investments must be readily convertible into cash, or availableas cash within three months.
b. Cash management
Cash management is about dealing with liquidity management and the
investment of funds. Cash management function ensures that minimum
requirements for liquidity in the organization are met and that any investments
are within the organization’s rules and regulations, as well as offering the bestreturn, risk and liquidity available.
c. Cash flow statement
Cash flow statement is a statement that provides valuable information about
a company’s gross payments and receipts and allows insights into its future
income needs.
Frank W. (2005) notes that Cash-Flow shows us exactly where the cash has
come from during the year, exactly what we have done with it and helps us to
throw some light on to the cash situation. For him, it is important to ensure
that:
– Sufficient profits are made to finance the business activities.– Sufficient cash funds are available as and when needed.
4.1.2. Types of cash flow activities
The three categories of cash flow activities are operating activities, investing
activities, and financing activities. Operating activities include cash activities
related to net income. Investing activities include cash activities related
to noncurrent assets. Financing activities include cash activities related to
noncurrent liabilities and owners’ equity.
Operating activities include cash activities related to net income. For example,
cash generated from the sale of goods (revenue) and cash paid for merchandise
(expense) are operating activities because revenues and expenses are included
in net income.
Investing activities include cash activities related to noncurrent assets.
Noncurrent assets include (1) long-term investments; (2) property, plant, and
equipment; and (3) the principal amount of loans made to other entities. For
example, cash generated from the sale of land and cash paid for an investment
in another company are included in this category.
Financing activities include cash activities related to noncurrent liabilities
and owners’ equity. Noncurrent liabilities and owners’ equity items include (1)
the principal amount of long-term debt, (2) stock sales and repurchases, and
(3) dividend payments. (Note that interest paid on long-term debt is included
in operating activities.)
Examples of Cash-flow Activity by category
Operating Activity (activities related to net income)
Cash receipts from the following: 1) Sales of goods or services, 2), 3);
Cash payments for the following: 1) Merchandise purchases from suppliers, 2)
material used to manufacture products, 3) employee payroll, 4) interests paid
to lenders, 5) Income taxes, 6) other operating expenses.
Investing activities (activities related to noncurrent assets)
Cash receipts from the following: 1) Sale of long-term Investment (e.g., bonds
and stocks of other companies), 2) sale of property, equipment, and plant, 3)
collection of principal for loans made to other entities
Cash payments for the following: 1) Purchase of long-term Investment (e.g.,
bonds and stocks of other companies), 2) purchase of property, plant andEquipment, 3) loans made to other entities
Financing activities (related to noncurrent liabilities and owners’ equity)
Cash receipts from the following: 1) Issuance of notes (e.g., a loan with bank),2) issuance of bonds, 3) issuance of common bonds,
Cash payments for the following: 1) principal amount of loans, principal amountof bonds, 3) repurchase of common stocks (treasury stocks), 4) cash dividends.
Example of Cash Activity at UMUMARARUNGU Company and UWINEZA
Company. UMUMARARUNGU Company and UWINEZA Company are wholesale
business which has stores of cooking oil and throughout Kigali. A review of
the statements of cash flows for both companies reveals the following cash
activities. Positive amounts are cash inflows, and negative amounts are cashoutflows.
This information shows that both companies generated significant amounts of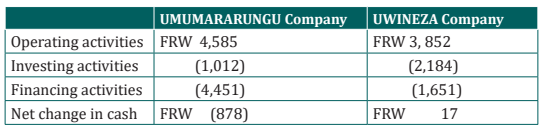
cash from daily operating activities; FRW 4,585 for UMUMARARUNGU Company
and FRW 3,852 for UWINEZA Company. It is interesting to note both companies
spent significant amounts of cash to acquire property and equipment and long term
investments as reflected in the negative investing activities amounts. For
both companies, a significant amount of cash outflows from financing activities
were for the repurchase of common stock. Apparently, both companies chose toreturn cash to owners by repurchasing stock.
4.1.3. Objectives of cash management
The prime objective of cash management is to channelize the flow of cash from
the surplus to deficit units to maintain the appropriate liquidity position of the
organization. Other important objectives of cash management are discussed asfollows:
a. Planning of Cash Flows
This objective refers to scheduling the cash inflow and outflow of an organization
over a period of time. The planning of cash flow helps in maintaining an adequateamount of capital to finance day-to-day- functions of the organization.
b. Synchronizing Cash Flows
This objective refers to developing equilibrium between inflow and outflow of
cash in the business. If the amount of cash receipts (inflow) is equal to the cashpayment (outflow) then there would be no requirement of holding extra cash.
c. Optimizing Cash Holding
This objective refers to determining the appropriate amount of cash to be kept
in the business to meet the contingency needs. It is the duty of the finance
manager to decide the optimal cash holding to avoid any excess or deficit ofcash.
4.1.4. Tools of cash management
Cash management tools are financial management mechanism that determine
the expected cash inflows and cash requirements. They assist the business in
determining the optimum level of cash. There are a number of tools that cash
managers can draw on to support an efficient cash management structure.
These include:
Working capital tools to improve the liquidity available to the organizations
using only commercial flows, and not requiring the assistance of any externalfinancial institution.
Control over the cycle of payments and receipts to reduce the volatility
of intra-month cash balances and improve application of corporate policies
regarding supplier and customer payment terms.
Internal processes to accelerate the allocation of receipts to customer
accounts, thereby increasing the liquidity available for corporate uses and
better customer credit management.
An optimized banking structure that uses a limited number of banks and
bank accounts,
Structures that concentrate available balances in fewer locations and thereby
enabling economies of scale, greater risk diversification and a reduction inoperational risk.
4.1.5. Techniques of cash-flow management
There are various techniques of cash-flow management used in an organization.
Some of the cash-flow management techniques are mainly related to
1) Accelerating Cash Inflows and
2) Slowing Cash Outflows.
Accelerating cash inflows includes:
a) Prompting Customers for Timely Payment,
b) Quick Conversion of Payment into Cash,
c) Improving Average Collection Period;
Slowing cash outflows includes:
a) Paying on Last Date,
b) Paying by Draft,
c) Centralization of Payment,
d) Adjusting Payroll Funds,
e) Use of Float.
Also, some additional cash-flow management techniques include:
1) Effective Inventory Management,
2) Minimizing Operational Cost,
3) Reducing the Time Span of Production Cycle,
4) Fast Cash Transaction,
5) Speedy Conversion of Securities into Cash,
6) Effective Management of Account Receivable,
7) Concentration Banking,8) Lock-Box System.
4.1.7. Purpose of cash management
a. To Control Cash Flows
This purpose is clear-cut because most business owners want to increase the
amount of money flowing into their business and at the same time minimizing
the cash leaving their business, by reducing operational expenses and other
costs. A currency recycler, for example, recycles the same cash that comes in
through transactions to fund the employee floats and cash registers.
b. To Optimize Cash Levels for the Business
Optimizing cash levels is essential to control the cash flow. If the business inflow
in terms of cash are not available for use (e.g., when the business manager has
outstanding unpaid invoices or money is held in the cash registers), he may
not have liquidity that business needs. The cash management system allows
optimizing the cash levels by creating a better liquidity. A good example is the
store float. If the manager of the company is unsure about what the inflows will
look like for the day, he might set the float higher than he need to. However,
the money is held in the petty cash fund or smart safe, when it could be paying
debts or held in a deposit account earning interests.Equally, if the manager of
the company puts all his/her cash on deposit, he/she has hampered his/her
liquidity. When an unexpected cost comes up, he/she may find him/her-self
without the cash to cover them.
Thus, the need of any cash management software which might have functions
that help optimize the cash levels, including:
Cash analytics: Provide data around the movement of cash from tills to vault
holdings. This allows to manage cash balances, reconciliation, and deposit
reporting more effectively
Cash forecasting: Provides insights into trends to forecast the cash needs and
replenishments, while enabling to see cash on hand and what one need on a
frequent basis to operate the business efficiently.
Cash status: Gives the view into the available cash on hand and frequency of
denomination usage. One would better understand which notes and coins are
most in demand, so that he/she may always have enough cash on hand.
c. To Enable More Efficient Cash Planning
The right cash management system helps optimize cash and this allows cash
manager to plan more effectively. The use of Automated cash management
systems to collect and provide data, will help to make more informed decisions.
d. To enable more Effective Cash Management
A good management system allows the business owner to see cash movements
through the business, giving him/her a bird’s eye view of where and when cash
is leaving the business and where and when it’s entering. The business owner
will also make better decisions about how to manage cashflow in the business,
such as when to deposit it or how much to hold back. All of his/her decisions
will be backed by data to both streamline and improve cash management andcashflows.
Application activity 4.1
1. Define the following concepts:
– Cash flows
– Cash flow statement
– Cash management
2. Which section of the statement of cash flows is regarded by most
financial experts to be most important?
3. State the objectives of cash management
4. Explain the purpose of cash management
4.2. Cash-flow statement
Learning Activity 4.2
John Karamaga, CEO and founder of Home Furniture Company has
reviewed the company’s income statement and balance sheet for the most
recent fiscal year ended December 31, 2021. Home furniture Company
has grown rapidly this year, with sales and net income showing significant
gains compared to 2020. Although John is satisfied with the increase in
profitability, he noticed a significant decline in cash. John decides to pursue
this with Linda Uwimana (CFO) and Steve Kayira (treasurer) in their
regular meeting:
John
I just received the income statement and balance sheet for 2021. Profits
look great, but our cash position seems to have deteriorated. We had
FRW130,000 in cash to start the year and ended with only FRW32,000.
I noticed cash was declining throughout the year when I reviewed our
monthly financial statements, but I’m concerned about how far our cash
balance has dropped.
Steve
You’re right, John. We encountered cash flow problems several times
throughout the year despite increased sales and profits. On several
occasions, I had to delay payments to creditors because of cash flow issues.
John
Seems to me we shouldn’t have this problem. Where is our cash going?
Linda
Good question. Let me round up our cash flow information for the year.
I’ll have something for you by next week.
John
Great! I’d like to start next week’s meeting by discussing how much cash we
generated in 2021 from our daily operations. I realize net income is shown
on an accrual basis, but I’d like to know how much net income was received
in the form of cash.
Linda
No problem. I’ll have it for you next week.
Question
a) What kind of employees are having discussion?
b) Which finance report must be prepared by Steve, Joh and Linda ?c) Which are the ways in which cash flows are reported? Give ideas.
4.2.1. Purpose of cash-flow statement
Financial accounting courses covered in the first three statements in detail and
often provide an overview of the statement of cash flows. The preparation of
cash flows statement and using the resulting cash flow information for analytical
purposes, leads to the purpose of information provided in the statement of cashflows.
The purpose of the statement of cash flows is to provide a summary of cash
inflows and cash outflows information for a period of time and to reconcile
the difference between beginning and ending cash balances shown on thestatement of financial position.
4.2.2. Steps of preparing the cash-flow statement
The four steps required to prepare the statement of cash flows are described
as follows:
Step1.
Prepare the operating activities section by converting net income from an
accrual basis to a cash basis. This step will be done using indirect method
throughout this chapter. The indirect method begins with net income from
the income statement and makes several adjustments related to changes in
current assets, current liabilities, and other items to arrive at cash provided
by operating activities (or used by operating activities if the result is a cash
outflow). Cash provided by operating activities represents net income on a cash
basis. It tells the reader how much cash was received from the daily operations
of the business.
Step 2.
Prepare the investing activities section by presenting cash activity for
noncurrent assets.
This step focuses on the effect changes in noncurrent assets have on cash.
Noncurrent asset balances found on the the statement of financial position or
balance sheet, coupled with other information (e.g., cash proceeds from sale of
equipment) are used to perform this step.
Step 3.
Prepare the financing activities section by presenting cash activity for
noncurrent liabilities and owners’ equity. This step focuses on the effect changes
in noncurrent liabilities and owners’ equity have on cash. Noncurrent liabilities
and owners’ equity balances found on the balance sheet, coupled with other
information (e.g., cash dividends paid) are used to perform this step.
Step 4.
Reconcile the change in cash. Each section of the statement of cash flows
described in steps 1, 2, and 3, will show the total cash provided by (increase)
or used by (decrease) the activity. Step 4 simply confirms that the net of these
changes equates to the change in cash on the statement of financial positionbalance sheet
Example 1,
Using the information extracted in the accounting information system of Home
Furniture Company, assume the balance sheet shows cash totaled FRW100
at the end of last year from 2020 and FRW140 at the end of the current year
2021. Thus cash increased by FRW40 over the course of the current year. Step
4 reconciles this change with the changes shown in the three sections of the
statement of cash flows. Suppose operating activities provided cash of FRW170,
investing activities used cash of FRW160, and financing activities provided cash
of FRW30. These 3 amounts netted together reconcile to the FRW40 increase in
cash shown on the balance sheet (= FRW170 − FRW160 + FRW30).
4.2.3. Methods used to prepare the cash-flow statements
There are two Methods of preparing a cashflow statement:
a. Direct method for the preparation of cash flow statement
The direct method for creating a cash flow statement reports major classes of
gross cash receipts and payments (Cash inflow and cash outflow). At the end
of that given period, the business will have a surplus if cash inflows are morethan the cash outflows or deficit if cash inflows are less than the cash outflows.
Illustration:
Prepare Iraguha’s cash flow for the years 2015, 2016, 2017 and 2018, given the
following information below:
Cash balance b/d or b/f in January 2015 was FRW 15,000,000
Yearly rent income was FRW 5,000,000
Yearly credit sales to be paid in the next year were FRW 4,000,000
Sold a business van in 2016 FRW 14,500,000
Yearly commission received was FRW 3,000,000
Yearly cash sales FRW 10,000,000
Yearly cash purchases FRW 12,000,000
Bought a truck in 2015 for FRW 800,000
Yearly salaries and wages FRW 5,000,000
Bought machinery worth FRW 15,000,000, payment of FRW 8,000,000 was
made in 2015 and the balance was paid in two equal instalments during themonth of February and March.
SolutionIRAGUHA’S CASH FLOW STATEMENT FOR 2015, 2016, 2017 and 2018
b. Indirect method for the preparation of cash flow statement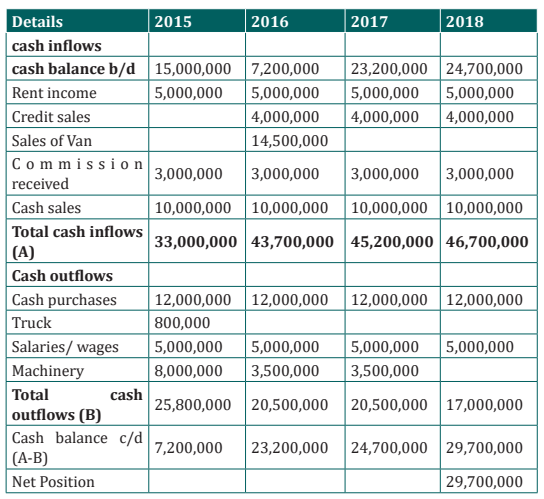
The indirect method uses net-income as a starting point, makes adjustments
for all transactions for non-cash items, then adjusts from all cash-based
transactions. An increase in currentasset account is subtracted from net income,
and an increase in a current liability account is added back to net income. This
method converts accrual-basis net income (or loss) into cash flow by using aseries of additions and deductions.
4.2.3. Prepare cash-flow statement
As stated earlier, the information needed to prepare the statement of cash
flows includes the statement of financial position, income statement, and otherselected data.
Illustration
Using the financial statement’s information below and Other additional data of
Home Furniture Company for 2021, let’s prepare the statement of cash flows
as follows:
Sold equipment with a book value of FRW11,000 (= FRW21,000 cost −
FRW10,000 accumulated depreciation) for FRW5,000 cash, purchased
equipment for FRW67,000 cash, Long-term investments were purchased
for FRW12,000 cash. There were no sales of long-term investments, Bonds
were paid with a principal amount of FRW18,000, Issued common stock forFRW4,000 cash, Declared and paid FRW32,000 in cash dividends
With these information provided, we can start preparing the statement of
cash flows using the indirect method. It is important to note that all positive
amounts shown in the statement of cash flows denote an increase in cash, and
all negative amounts denote a decrease in cash.
Furniture Company, statement of financial position as at December31st,2020 and December 31st, 2021
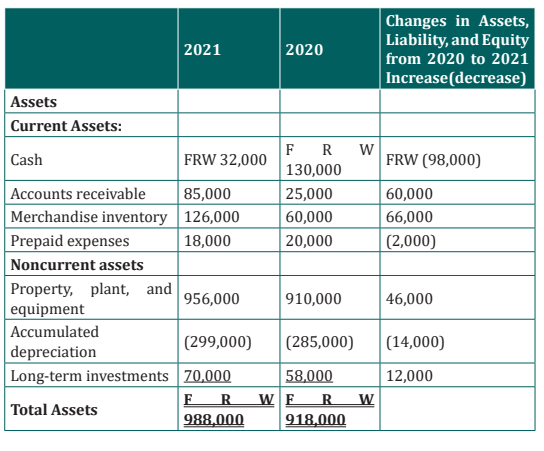
Home Furniture Company’s Income Statement, for the Year Ended December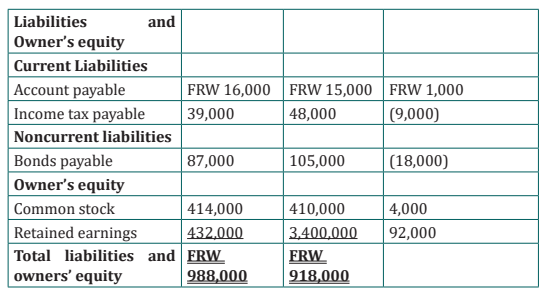
31st, 2021
Step 1: Prepare the Operating Activities Section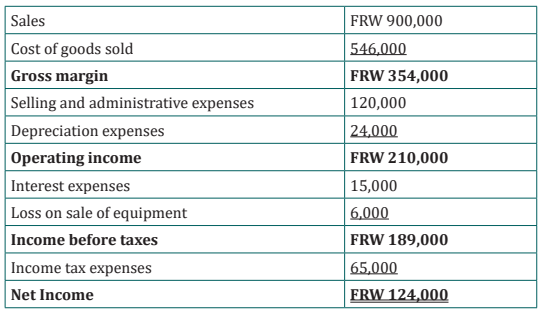
The Format of Cash Flows from Operating activities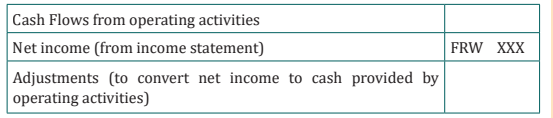
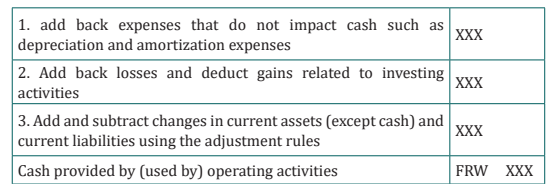
The first adjustment to net income involves adding back expenses that do not
affect cash (often called noncash expenses). The second adjustment to net
income involves adding back losses and deducting gains related to investing
activities. However, this loss is not related to the daily operations of the business.
Remember, we are trying to find the cash provided by operating activities in
this section of the statement of cash flows. Since equipment is a noncurrent
asset, cash activity related to the disposal of equipment should be included in
the investment activities section of the statement of cash flows. The third type
of adjustment to net income involves analyzing the changes in all current assets
(except cash) and current liabilities from the beginning of the period to the
end of the period. Two important rules must be followed to determine how the
change is reflected as an adjustment to net income.Study these two rules carefully:
1. Current assets. Increases in current assets are deducted from net income;
decreases in current assets are added to net income.
2. Current liabilities. Increases in current liabilities are added to netincome; decreases in current liabilities are deducted from net income.
Operating Activities Section of Statement of Cash Flows for Home FurnitureCompany
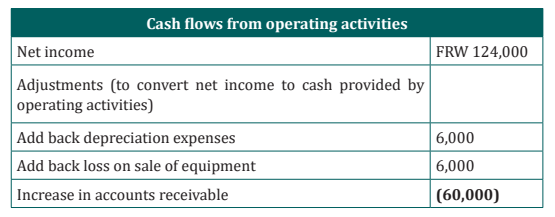
With the above information, Home Furniture Company received FRW 22,000 in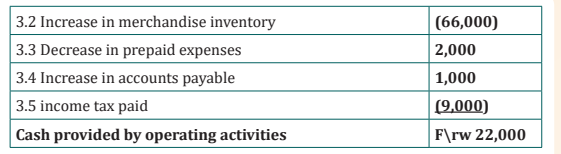
cash for the year related to daily operations of the business.
Step 2: Prepare the Investing Activities Section
Now that we have completed the operating activities section for Home
Furniture Company, the next step is to prepare the investing activities section.
The statement of cash flows focuses on cash activities related to noncurrent
assets. Three noncurrent asset items must be analyzed to determine how to
present cash flow information in the investing activities section.
1. Property, plant, and equipment increased by FRW46,000.
The additional information provided for 2021 indicates two types of transactions
which caused this increase. First, the company purchased equipment for
FRW67,000 cash and Second, the company sold equipment for FRW5,000 cash
(often called a disposal of equipment). The net effect of these 2 entries is an
increase of FRW46,000 (= FRW67,000 − FRW21,000). This is summarized in
the following T-account: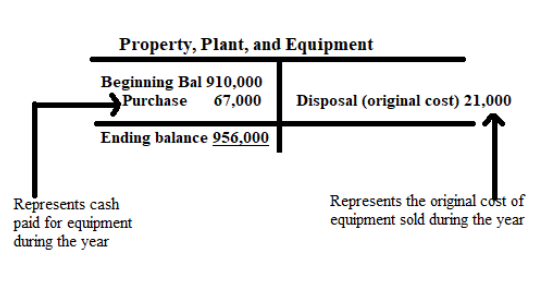
2. Accumulated depreciation decreased noncurrent assets by
FRW14,000.
Two items caused the change in the accumulated depreciation account. First,
the sale of equipment during the year caused the company to take FRW10,000
in accumulated depreciation off the books. Second, FRW24,000 in depreciation
expense was recorded during the year (with a corresponding entry to
acc4.2.5. Cash-flow information analysis
Companies and analysts tend to use income statement and balance sheet
information to evaluate financial performance. In fact, financial results
presented to the investing public typically focus on earnings per share. Analysis
of cash flow information is becoming increasingly important to managers,
auditors, and financial analysts. Three common cash flow measures used to
evaluate organizations are (1) operating cash flow ratio, (2) capital expenditure
ratio, and (3) free cash flow. umulated depreciation). This information is summarized in the followingT-account:
How is accumulated depreciation information used in the statement of cash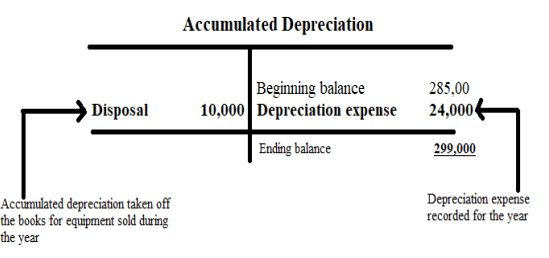
flows for Home Furniture Company?
3. Long-term investments increased by FRW12,000.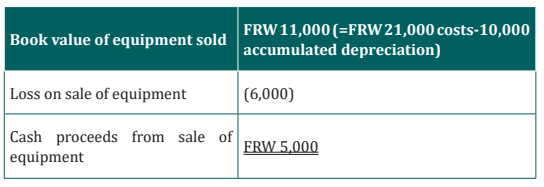
The additional information provided for 2021 indicates there were no sales of
long-term investments during the year. The increase of FRW12,000 is solelyfrom purchasing long-term investments with cash.
The following paragraph shows the three investing activities described
previously:
1. a FRW67,000 decrease in cash from the purchase of equipment,
2. a FRW5,000 increase in cash from the sale of equipment, and
3. a FRW12,000 decrease in cash from the purchase of long-term
investments.
There is also the impact of these three items on cash and the resulting cashused by investing activities of FRW74,000.
The company used FRW 74,000 in cash for investing activities.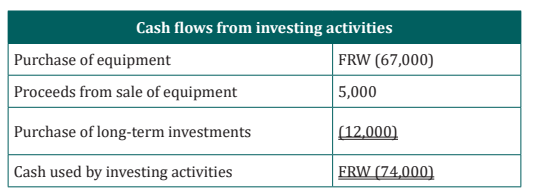
Step 3: Prepare the Financing Activities Section
What information is used for this section, and how is it prepared? The financing
activities section of the statement of cash flows focuses on cash activities related
to noncurrent liabilities and owners’ equity (i.e., cash activities related to long term
company financing). One noncurrent liability item (bonds payable) and
two owners’ equity items (common stock and retained earnings) must be
analyzed to determine how to present cash flow information in the financing
activities section. How is this information used in the statement of cash flows?
Step 4: Reconcile the Change in Cash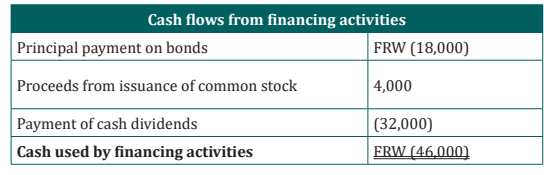
The following table provides a summary of cash flows for operating activities,
investing activities, and financing activities for Home Furniture Company,along with the resulting total decrease in cash of FRW 98,000
4.2.5. Cash-flow information analysis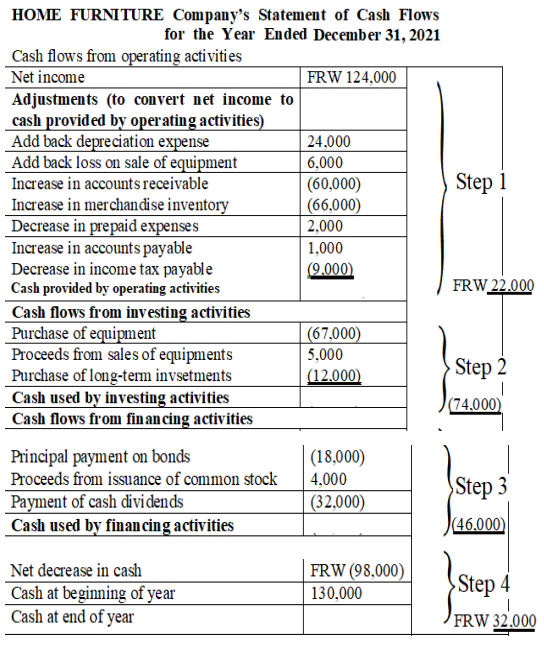
Companies and analysts tend to use income statement and balance sheet
information to evaluate financial performance. In fact, financial results
presented to the investing public typically focus on earnings per share. Analysis
of cash flow information is becoming increasingly important to managers,
auditors, and financial analysts. Three common cash flow measures used to
evaluate organizations are (1) operating cash flow ratio, (2) capital expenditure
ratio, and (3) free cash flow.
Example
The following statement of cash flow for L. Holmes Ltd., were prepared for theperiod ending 31 January 2022
Is cash provided by operating activities divided by current liabilities. This ratio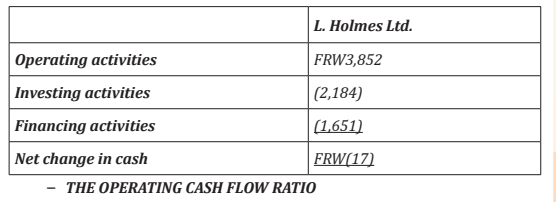
measures the company’s ability to generate enough cash from daily operations
over the course of a year to cover current obligations. Although similar to the
commonly used current ratio, this ratio replaces current assets in the numerator
with cash provided by operating activities. The operating cash flow ratio is asfollows for L. Holmes Ltd.:
The numerator, cash provided by operating activities, comes from the
bottom of the operating activities section of the statement of cash flows. The
denominator, current liabilities, comes from the liabilities section of thestatement of financial position/balance sheet.
– CAPITAL EXPENDITURE RATIO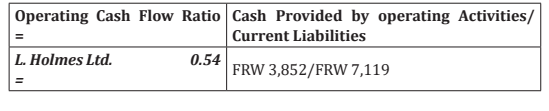
Is cash provided by operating activities divided by capital expenditures. Thisratio measures the company’s ability to generate enough cash from daily
operations to cover capital expenditures. A ratio in excess of 1.0, for example,indicates the company was able to generate enough operating cash to cover
investments in property, plant, and equipment. The capital expenditure ratio
for L. Holmes Ltd.is as follows: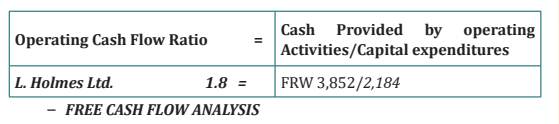
Free cash flow is cash provided by operating activities minus capital expenditures
as follows:
Free cash flow = Cash provided by operating activities − Capital
expenditures
The cash provided by operating activities comes from the bottom of the
operating activities section of the statement of cash flows. The capital
expenditures amount comes from information within the investing activities
section of the statement of cash flows. The free cash flow amount is calculatedusing information from each company’s statement of cash flows.
The results tell us that the company generates enough cash (FRW 1,668 ) from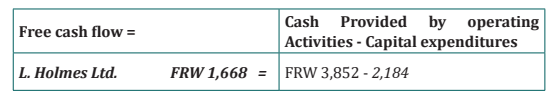
daily operations to cover capital expenditures (FRW2,184)
Application activity 3.2
Question 1
Define the following ratios, and how they are calculated.
a) Free cash flow ratio
b) capital expenditure ratio
c) operating cash flow ratio
Question 2The following information is from the consolidated statement of cashflows for BMC Motors for the year ended December 31, 2022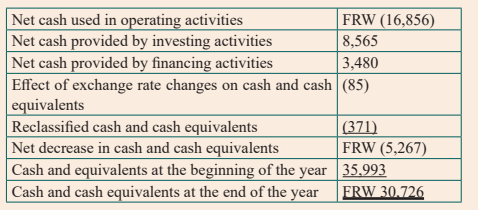
Required:
An investment advisor recently reviewed BMC Motors’ statement of cash
flows and statement of financial position and stated: “BMC Motors is doing
great! They are holding cash of more than FRW 30,000. There is no cash
flow problem with this company!”
Do you agree with this statement.? Support your conclusion with an
analysis of BMC Motors’ cash flows.
Question 3
Using the statement of financial position and income statement attached
herewith, you are required to prepare the statement of cash flows using the
indirect method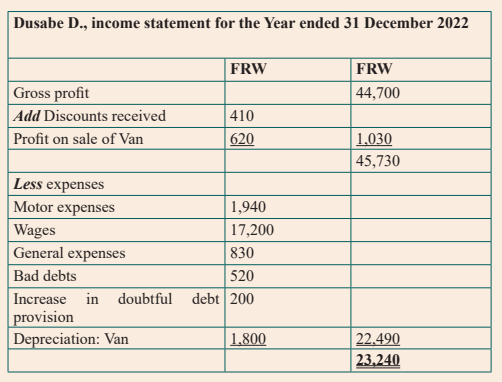
4.3. Use of financial and nonfinancial performancemeasuresLearning Activity 4.3
Sandy Masaka is the CEO of a fast-food restaurant called Chicken Remix.
The company operates five restaurants throughout Kigali City and is
choosing between two suppliers of soft drinks: ABC Fizz Ltd and BIG Fizz
Ltd. Consumer surveys indicate no significant preference between the
two. Sandy is meeting with Dave Gasana, the CFO, and Karen Mugwiza, the
purchasing manager, to discuss the company’s options. Chicken Remix is
facing a supplier choice decision which is common to many companies.
Financial stability is an important factor in choosing on a supplier, along
with the quality of product and reliability of service. Chicken Remix must
analyse financial information for ABC Fizz Ltd and BIG Fizz Ltd to determine
the financial condition of each company. The analysis of a company’s
financial information typically follows a three-pronged approach. First,
trends within a company’s own financial information are analyzed, such as
sales and earnings from one year to the next, using two methods. Second,
financial measures are compared between competitors. Finally, the ratios
are analyzed and are compared to industry averages.
Question
What should be the accounting responsibilities of each person attending
the meeting?
Do you have any idea about the kind of analysis which might be made by
Finance Department?
Which one may be appropriate?
4.3.1. Introduction to Financial and non-financial performance measures
For any business which is a going concern, the owner is always afraid of business
activities performances. For different reasons the performances are measured
on one hand using financial criteria (statistical) and non financial measures
(Qualitative assumptions) on other hand.
4.3.2. Financial performance measures
a. Trend analysis
Trend analysis evaluates an organization’s financial information over a period
of time. Periods may be measured in months, quarters, or years, depending
on the circumstances. The goal is to calculate and analyze the amount change
and percent change from one period to the next. Trend analysis is often used
to evaluate each line item on the income statement and statement of financial
position. The percent change is calculated as the current year amount minus
the base year amount, divided by the base year amount.
Example: The following shows ABC Fizz Ltd.’s income statement trend analysisor horizontal analysis
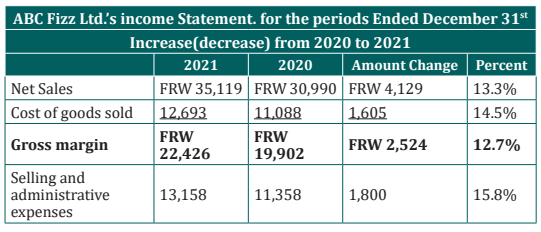
resulting in a 12.7% increase in gross margin. Good news for ABC Fizz Ltd! Selling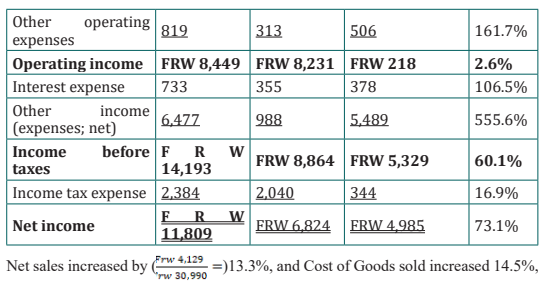
and administrative expenses increased 15.8%, while other operating expenses
increased 161.7%. operating income increased 2.6%, interest expense increased
106.5%, and other income increased 555.6% (related to a one-time acquisition
gain). Income before taxes increased 60.1% resulting in a 16.9% increase in income
tax expense. Net income increased a substantial 73.1% (much of this was related toa one-time acquisition gain).
b. Common-size analysis of Financial statement
Common-size analysis (also called vertical analysis) converts each line of
financial statement data to an easily comparable, or common-size, amount
measured as a percent. This is done by stating income statement items as a
percent of net sales and statement of financial position items as a percent of
total assets (or total liabilities and shareholders’ equity). For example, ABC Fizz
Ltd had net income of FRW 11,809 and net sales of FRW 35,119 for 2020. The
common-size percent is simply net income divided by net sales, or 33.6 percent
(= FRW 1,809 / FRW 35,119).
There are two reasons to use common-size analysis:
1. To evaluate information from one period to the next within a company
and
2. To evaluate a company relative to its competitors.
Common-size analysis answers such questions as “how do our current assets
as a percentage of total assets compare with last year?” and “how does our net
income as a percentage of net sales compare with that of our competitors?”
Example: The following presents the common-size analysis for ABC Fizz Ltd.’s
income statement. As you look at these figures, notice that net sales are used as
the base for the income Statement. That is, for the income statement, each item
is measured as a percent of net sales.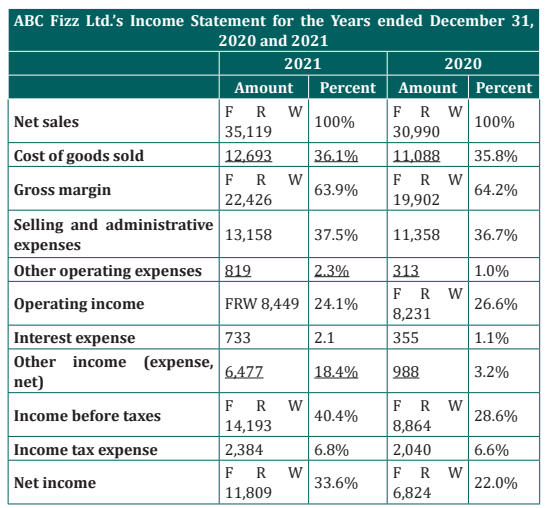
Cost of goods sold increased from 35.8% of net sales in 2020 to 36.1% in 2021,
which resulted in a decrease in gross margin from 64.2% to 63.9%. selling and
administrative expenses increased from 36.7% to 37.5%, while other operating
expenses increased from 1% to 2.3%. operating income decreased from 26.6%
to 24.1%. interest expense increased from 1.1% to 2.1% and other income
increased from 3.2% to 18.4%. income before taxes increased from 28.6% to
40.4%. income taxes increased slightly. Net income increased from 22% to
33.6%.
In general, managers prefer expenses as a percentage of net sales to decrease
over time, and profit figures as a percent of net sales to increase over time.C. Ratio analysis
Although trends and common-size analysis provides an excellent starting
point for analyzing financial information, managers, investors, and other
stakeholders also use various ratios to assess the financial performance and
financial condition of organizations.
The four categories of ratios presented in this point are as follows:
• Ratios used to measure profitability (focus is on the income statement)
• Ratios used to measure short-term liquidity (focus is on short-term
liabilities)
• Ratios used to measure long-term solvency (focus is on long-term liabilities)
• Ratios used to measure market valuation (focus is on market value of thecompany)
Profitability Measures for ABC Fizz Ltd for the year ended December 31,
2020
– Gross margin ratio indicates the gross margin generated for each
Rwandan franc in net sales and is calculated as gross margin (which isnet sales minus cost of goods sold) divided by net sales
– Profit margin ratio indicates the profit generated for each Rwandan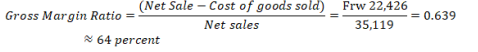
franc in net sales and It is calculated as net income divided by net sales:

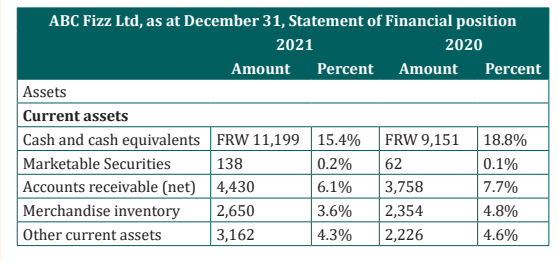
– Return on assets indicates how much net income was generated from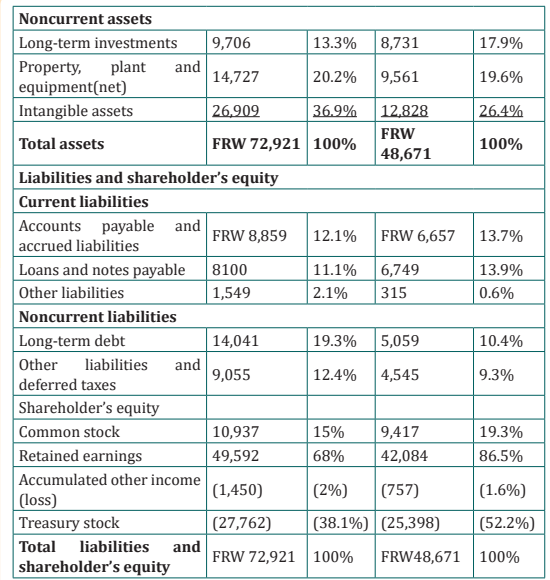
each Rwandan franc in average assets invested. Return on assets is netincome divided by average total assets:
– Return on common shareholder’s equity ratio indicates how much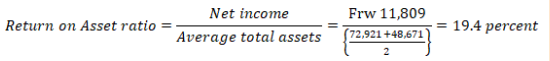
net income was generated from each Rwandan Franc of common
shareholders’ equity. If the company does not have any outstanding
preferred stock, as is the case with ABC Fizz Ltd, the preferred
dividends amount is zero. Average common shareholders’ equity in the
denominator is found by adding together all items in the shareholders’
equity section of the statement of financial position at the end of the
current year and previous year (2020 and 2021 for this example),except preferred stock items, and dividing by two.\
• Short-Term Liquidity Measures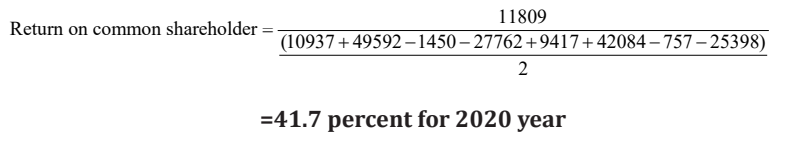
– Current ratio indicates whether a company has sufficient current
assets to cover current liabilities. It is found by dividing current assets
by current liabilities (Current assts/current liabilities). In general, a
current ratio above 2 to 1 is preferable, which indicates the company
has sufficient current assets to cover current liabilities. However,
finding the ideal minimum current ratio is dependent on many factors,
such as the industry, the overall financial condition of the company and
the composition of the company’s current assets and current liabilities.
Because of variations in these factors from one company to the next, amore stringent measure of short-term liquidity is often used.

– Quick ratio (also called acid-test ratio) indicates whether a company
has sufficient quick assets to cover current liabilities. The quick ratio is
quick assets divided by current liabilities (current assets – Inventory /current liabilities).
The quick ratio indicates that ABC Fizz Ltd had FRW 0.85 in quick assets for every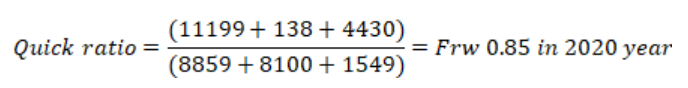
Rwandan franc in current liabilities.– Receivables Turnover Ratio indicates how many times receivables
are collected in a given period. Receivables Turnover Ratio is found
by dividing credit sales by average accounts receivable (credit sales/accounts receivables).
– Inventory Turnover Ratio indicates how many times inventory is
sold and restocked in a given period. It is calculated as cost of goodssold divided by average inventory(cost of sales/average inventory)
The inventory turnover ratio indicates that ABC Fizz Ltd sold and restocked
inventory 5.07 times during 2021
• Long-Term Solvency Measures– Debt to Assets ratio indicates the percentage of assets funded by
creditors and is used to evaluate the financial leverage of a company. The
higher the percentage, the higher the financial leverage automatically
the higher the percentage of assets funded by the shareholder. Debt to
assets is found by dividing total liabilities by total assets:
– The debt to equity ratio indicates the amount of debt incurred for
each Rwandan franc that owners provide. The debt to equity ratio
is total liabilities divided by total shareholders’ equity indicates the
company’s ability to cover its interest expense related to long-term
debt with current period earnings. This ratio indicates the amount
of debt incurred for each Rwandan franc that owners provide. It also
measures the balance of liabilities and shareholders’ equity used to
fund assets.
The debt to equity ratio is total liabilities divided by total shareholders’ equityThe debt to equity ratio for ABC Fizz Ltd is calculated as follows
The debt to equity ratio indicates that ABC Fizz Ltd had FRW 1.33 in liabilities for
each Rwandan in shareholders’ equity
• Market Valuation Measures
– Market capitalization (also called market cap) indicates the value
of a company at a point in time. is determined by multiplying market
price per share times the number of shares outstanding.
– The price-earnings ratio (also called P/E ratio) indicates the
premium investors are willing to pay for shares of stock relative to
the company’s earnings. The price-earnings ratio is found by dividing
market price per share by earnings per share.
4.3.3. Non-financial performance measures
Many organizations use a mix of financial and nonfinancial measures to evaluate
performance. For example, airlines companies track on-time arrival percentages
carefully, and delivery companies such as those ones which deliver goods
purchased online, monitor percentages of on-time deliveries. The balancedscorecard uses several alternative measures to evaluate performance.
The balanced scorecard is a balanced set of measures that organizations use to
motivate employees and evaluate performance. These measures are typically
separated into four perspectives:
Financial perspective, measures that shareholders, creditors, and other
stakeholders use to evaluate financial performance.
Internal business process perspective, measures that management uses to
evaluate efficiency of existing business processes.
Learning and growth perspective, measures that management uses to
evaluate effectiveness of employee training.
Customer perspective, measures that management uses to evaluate whetherthe organization is meeting customer expectations.
Application activity 4.3
Question 1
Ruhinguka Corneille, has the following statement of financial positionas at 31 December 2022 and 31 December 2021,
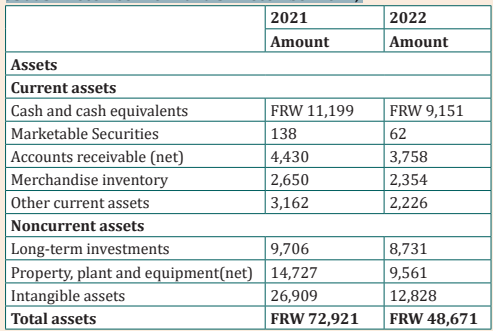
And the following Income Statement, Ruhinguka Corneille, for the year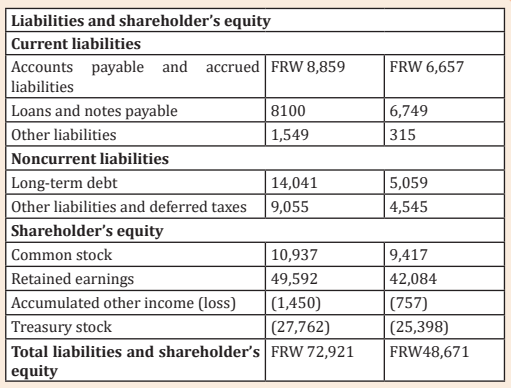
endend 31 December 2022 and 31 December 2022
Required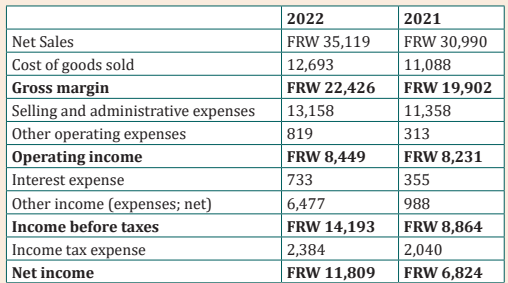
Use the above financial statement and answer the following questiona) Demonstrate a meaningful trend analysis. Explain how theSkills Lab 4
percent change from one period to the next is calculated.
b) Using the appropriate information from above financial
statement show your financial analysis and interpretation with
the common-size analysis.
c) Name and explain three ratios used to evaluate profitability.
Assess at least two of the profitability ratios and interpret themwith the use of above financial information.
Students visit one of businesses operating near their school “MUGABO
ENTERPRISE”. One businessman called Mugabo presents to them the
financial statements of his Enterprise for the year ended 31 January 2021and 31 January 2022 as follow:
Mugabo Enterprise
Statement of Financial Position (Balance Sheet)
As at 31 January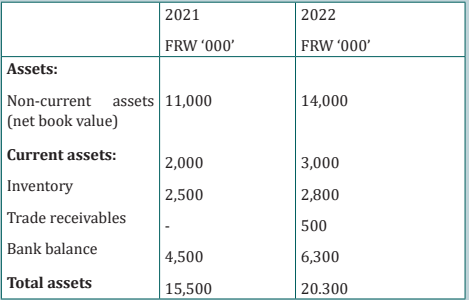
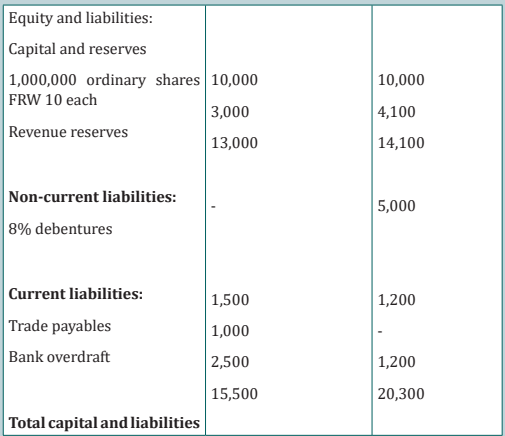
Mugabo Enterprise Income Statement for the year ended 31 January
Inventory on 1 February 2020 was FRW 5,000,000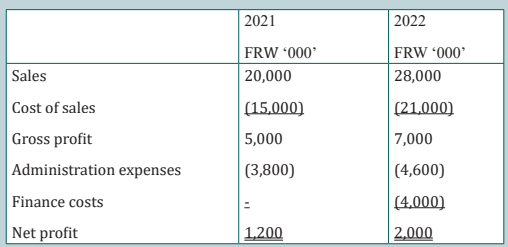
You are Required to calculate for 2021 and 2022 the:
i) Gross profit margin
ii) Inventory turnover
iii) Return on sales
iv)Acid test ratio
v) Current ratioEnd of unit assessment 4
Question 1
a) What are the 3 general areas or aspects which analysts are
normally concerned about?
Question 2: Which of the following ratios includes a component that
is not from the Statement of financial position balance sheet?
a) Acid-test ratio
b) Debt ratio
c) Accounts receivable turnover
d) Current ratio
Question 3:
– Use the Free cash flow ratio to explain and interpret the cash flowschanges from one period to the next
– With the information from above financial statements, produce
your financial analysis and interpretation of cash flows with the
capital expenditure ratio
UNIT 5: CASH BALANCES MANAGEMENT
Key Unit competence: Use effectively and efficiently cash balances for better
managementIntroductory activity
MK Ltd is an enterprise which sells agro-processed goods such as packed
maize flour, soya oil and sorghum flour at Rwamagana. Raw materials
used to make maize flour are purchased from Ngoma farmers, soya grains
are imported from Zambia and payment transfers are done electronically
while sorghum cereals are supplied by a trader from Musanze who
require direct cash payment. The acquisition of raw materials is managed
by Linda M. who is the chief accountant. Rutayisire who manages the
department of Human Resources had submitted payroll for the month
of January 2022 and M. Kayisire, Chief Finance Officer prepared the
statement of cash flows. The department of finance has a cash balance of
FRW 50 millions as at 31 December 2021. During January, cash receipts
are estimated to be FRW 15 millions, cash payments FRW 26m and a
depreciation charge of FRW 7 millions. Goods produced are sold both
for cash as well as on credit. In the case of credit sales, the pending bills
are realised at a later date. This cycle continues to be repeated in an
accounting year several times. Thus, the flow of cash in a business passes
through various channels. The magnitude of the flows in terms of time(days) may be depicted in the analysis made by M. Kayisire.
Question
a) Which is the report that provides the appropriate financial
information used to measure the use of cash for good
management?
b) What should be the appropriate procedures for cash balancesmanagement?
5.1 Liquidity and cash balance management toolsLearning Activity 5.1
Questions:
a) What should be the appropriate responsibilities of the lady with
question mark signs?
b) The EBM as a cash and inventory management tool may help in
what kind of cash flows?
5.1.1 Definition of liquidity
Liquidity is the amount of cash a company can obtain quickly to settle its debts
(and possibly to meet other unforeseen demands for cash payments too). It is
the ability of a company to pay its suppliers on time, meet its operational costs
such as wages and salaries and to pay any longer-term outstanding amounts
such as loan repayments.
5.1.2. Liquidity assets
• Cash
Cash is the most liquid asset possible as it is already in the form of money.
This includes physical cash, savings account balances, and checking account
balances. It also includes cash from foreign countries, though some foreign
currency may be difficult to convert to a more local currency.
• Inventory
Inventory is a liquid asset because it gets converted to cash as part of normal
business operations. However, the business slows in a recession and inventory
may not be as liquid.
• Short-term investment
A short-term investment is a highly liquid financial asset to mean that it can
be easily converted to cash. Short-term investments are commonly called
marketable securities or temporary investments. Most are converted to cash,
or sold, within 12 months of the investment being made.
• Fixed term
Are deposits with a bank or building society for example, six month deposits
with a bank. Term deposit is a type of savings Account which holds a specific
amount of money for a specified duration i.e. 1 month, 2 months or longer at a
pre- agreed interest rate with the bank.
• Trades receivables
There are defined as the amount owed to a business by its customers following
the sale of goods or services on credit. Also known as accounts receivable,
trade receivables are classified as current assets on the statement of financial
position/balance sheet.
5.1.3. Cash balance Management Tools
Checking/current account
It’s a bank account used for everyday deposits and withdrawals. It means all
transactions related to putting money into the bank account and taking them
out using a cheque or using your debit card in the place of cash.
Money market account
Money market accounts (MMA) are offered by banks and credit unions and
provide the benefits and features of both savings and checking accounts. Money
market account are suited for short-term goals rather than long-term financial
planning.
Certificate of deposit
A certificate of deposit (CD) is a savings product that earns interest on a lump
sum for a fixed period of time. CDs differ from savings accounts because the
money must remain untouched for the entirety of their term or risk penalty fees
or lost interest. CDs usually have higher interest rates than savings accounts as
an incentive for lost liquidity.
Saving bonds
Savings bonds are debt securities issued by the Treasury Department in Central
Bank to help pay for the Government’s borrowing needs. Government savings
bonds are considered one of the safest investments because they are backed by
the full faith and credit of the Central Government, especially the Ministry ofFinance.
5.1.4. Make informed decisions regarding the managementof cash balances within an organization
The elements of effective cash management based on the efficient decision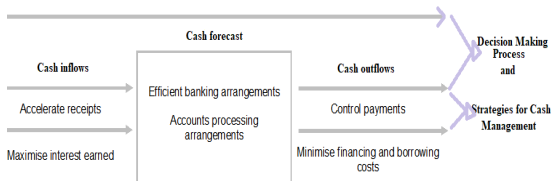
making include:
a) Accurate and timely cash flow analysis and forecasting as the efficient
decision making process,
b) Maximizing returns from cash balances as the receipts acceleration
strategy
c) Minimizing financing and borrowing costs as a good strategy to
manage outflows
d) Efficient banking arrangements. For example, centralization and
rationalization of bank accounts enables economies of scale and
a reduction in bank fees and administration costs, while access to
electronic payment and collection methods increases efficiency.
e) Efficient accounts processing arrangements for receipts and payments
reduce transaction costs. For example, centralized infrastructure
for accounts processing enables economies of scale benefits to be
achieved, while the use of a central financial system minimizes risks
associated with accessing and using information from disparate
systems.
f) Efficient management and collection of receivables/debtors
g) Effective control of payments and disbursements.
5.1.1. Characteristics of the main types of cash receipts and
payments
a. Regular revenue receipts
Revenue receipts can be defined as those receipts which neither create any
liability nor cause any reduction in the assets of the government. They are
regular and recurring in nature and the government receives them in the
normal course of activities.
b. Capital receipts
Capital receipts are receipts that create liabilities or reduce financial assets.
They also refer to incoming cash flows. Capital receipts can be both non-debt
and debt receipts. Loans from the banks or public entities, foreign financial
market or Central bank form a crucial part of capital receipts.
c. Exceptional receipts and payments
It means any cash received by or paid to or for the account of any person not in
the ordinary course of business, including tax refunds, pension plan reversions,
proceeds of insurance (other than proceeds of business interruption insurance
to the extent such proceeds constitute compensation for lost earnings),
condemnation awards (and payments in lieu thereof), indemnity payments
and any purchase price adjustments. These receipts and payments depend on
how the receipt or payment is important or critical to the ordinary course of
business. Examples are taxes, pension fees, insurance premium, indemnity fees.
d. Drawings.
It refers to the act of withdrawing cash or assets from the company by theowner(s) for personal use.
Application activity 5.1
Question 1: Choose the best answer.
In a retail business, where payment is received from customers by cash,
cheque and debit/credit card, what reconciliation should be carried out at
the end of each day?
A. Reconciliation to bank statement
B. Reconciliation to trade receivables
C. Reconciliation to cash book
D. Reconciliation to amount of cash/cheques/credit card vouchers
Question 2
Analyze the elements of an informed decisions process regarding the
management of cash balances within an organization.
5.2. Explain and apply cash management measuresLearning Activity 5.2
A sole trader is making FRW 40,000 a year profits. However, his drawings
have been over FRW 60,000 a year for some time.
A company has been over-generous with credit terms to debtors, and last
year extended the time in which debtors could pay from one month to three
months. In addition, it has a few customers who are not creditworthy and
such sales may result in bad debts in the future.
A partnership whose products will not be on the market for quite a long
time has invested in some very expensive machinery. A lot of money has
been spent now, but no income will result in the near future.
In all of these cases, each of the businesses could easily run out of cash. In
fact, many businesses fail and are wound up because of cash shortages,
despite adequate profits being made. cash management measures can help
to signal the development of such problems.
Question
What do many people think about profitability at the end of the year?
5.2.1. Cash management measures.
• Current ratio
The standard test of liquidity is the current ratio. Recall that the working capitalof the business is the current assets of the business less the current liabilities.
When calculated, the ratio may be expressed as either a ratio to 1, with current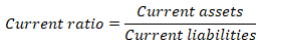
liabilities being set to 1, or as a ‘number of times’, representing the relative size ofthe amount of total current assets compared with total current liabilities.
For example, see 4.3.6, B.1• Quick ratio
Provided that creditors and debtors are paid at approximately the same time, a
view might be made as to whether the business has sufficient liquid resources to
meet its current liabilities. This ratio should ideally be at least 1 for companies
with a slow inventory turnover. For companies with a fast inventory turnover,
a quick ratio can be less than 1 without indicating that the company is in cash
flow difficulties.
For example see 4.3.6,
• Inventory holding ratio
It is useful for management to have an indication of how long inventory is
being held. In some businesses, inventory must be sold, or turned over, quickly,
for example, if it consists of perishable foods. However, in other businesses,
inventory may be held for some considerable time before it is sold (eg in the
construction industry).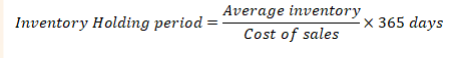
For example see 4.3.6,
• Trade receivable collection period ratio
The trade receivables collection period ratio, also known as ‘trade receivables’
days, is a measure that shows how long it is taking for the trade receivables ofthe business to pay.
A long trade payables period means that the business is delaying payment to
its suppliers. This could be viewed as sensible cash flow management as the
business is using its suppliers as a form of finance or it could be indicative of abusiness that is having cash flow difficulties and is unable to pay.
Example (Mariam Manufacturing Ltd below)
• Cash operating cycle/ratio
It measures the length of time taken for funds to flow through the organization.
It is the period of time between the time cash is paid out for raw materials
and the time cash is received from customers for goods sold. We can use the
inventory, trade receivables and trade payables ratios to calculate the cashoperating cycle of a business in days as follows:
Illustration: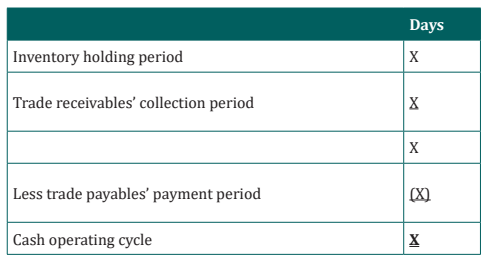
Set out below are the statement of profit or loss and statement of financialposition for Mariam Manufacturing Ltd:
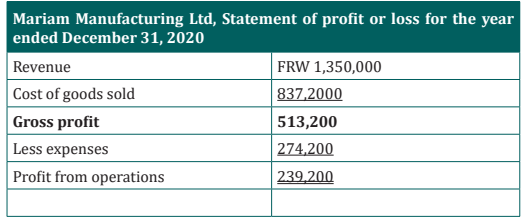
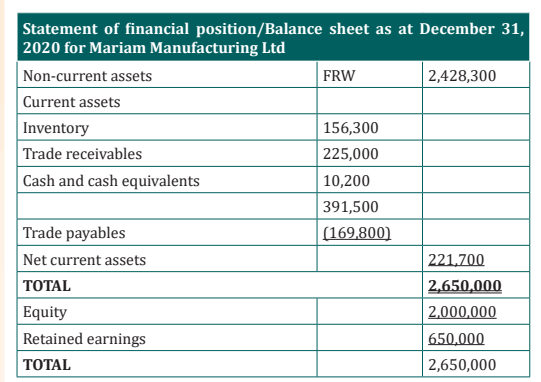
Let’s calculate the individual working capital ratios,
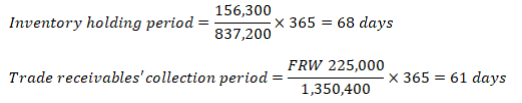
We can use the inventory, trade receivables and trade payables ratios to calculate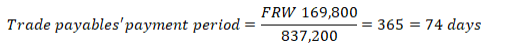
the cash operating cycle or cash ratio for Mariam Manufacturing Ltd, as follow :
Therefore, 55 days elapses between Mariam Manufacturing Ltd paying for its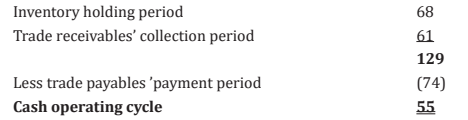
raw materials and then getting cash in from the customer who has purchased
the goods that these materials have been made into.
5.2.2. Statutory and other regulations relating to the
management of cash balances
In the organisations, treasury function is responsible for dealing with cash
management and the investment of funds. It is this function of the organization
which has the responsibility for ensuring the minimum requirements for cash
in the organization are met and any investments within the organization’s rules,
regulations offer the best return, low risk and ensure liquidity availability
The treasury function actions in an organization including :
1. Centralized cash management avoids having a mix of cash surpluses and
overdrafts in different localized bank accounts,
2. Larger volumes of cash are available to invest so that better rates can be
negotiated,
3. Borrowing can be arranged in bulk at lower interest rates than for
smaller borrowings,
4. A centralized pool of buffer funds will be smaller than the sum of the
separate buffer funds that would be held by the individual operations,
5. A separate team will be able to monitor performance of the function
more effectively.– Procedures for dealing with cashWhen payments are received in the form of cash, cheques, debit or credit cards,
• Reconciliation of cash received
then a list of all receipts taken during the day must be kept and this list must
then be reconciled with the amount of cash in the till, cash box or safe at the
end of the day.
• Physical safeguards
The cheque or cash should be kept under lock and key, either in a cash box,
lockable till or safe with only authorised individuals having access to the keys.
• Checking for valid payment
If cheques are accepted as payment, then they must be supported by a valid
cheque guarantee card and be correctly drawn up, dated and signed. If debit
or credit cards are accepted, then basic checks should be made on the card and
signature, and authorization must be sought for payments which exceed the
floor limit.
• Banking procedures
Any cash, cheques, debit and credit card vouchers (if the business does not
use Electronic Funds Transfer at Point of Sale (EFTPOS)) should be banked
as soon as possible. This helps the business in not only the money being used
by employees for unauthorized purposes it is earning for the business the
maximum amount of interest. If it is not possible to bank the takings until the
following day, then either the cash must be left in a locked safe overnight or in
the bank’s overnight safe.
• Recording procedures
For security purposes, the paying-in slip for the bank should be made out by
someone other than the person paying the money into the bank. The total on
the paying-in slip should also be reconciled to the till records or cash list for the
day.
Application activity 5.2
Question 1
What is the difference between the formulae for the current ratio and the
acid test ratio?
Question 2
Which of the following is the quick ratio?
a) Current assets/Current liabilities
b) Current assets less inventories/Current liabilities
c) Profit/revenues
d) Trade receivables/Credit sales
Question 3:
A business has a cash operating cycle of 65 days. Its inventory holding
period is 38 days and its trade payables’ payment period is 45 days.
Required
What is the trade receivables’ collection period in days?
a. 7 days, b. 20 days, c. 27 days, d. 72 days
Skills Lab 5
With the reference to successful entrepreneurs operating in Rwanda,
MUKARUTESI Ltd is an enterprise which sells agro-processed goods such
as packed wheat flour, palm oil, maize flour at Rwamagana. Raw materials
used to make maize flour are purchased from Ngoma farmers, soya grains
are imported from Zambia and payment transfers are done electronically
while sorghum cereals are supplied by a trader from Musanze who require
direct cash payment. The acquisition of raw materials is managed by Linda
M. who is the chief accountant. Rutayisire who manages the department
of Human Resources had submitted payroll for the year 2022 and M.
MUKARUTESI Ltd, Chief Finance Officer prepared the statement of cash
flows. The department of finance has a cash balance of FRW 50 millions as
at 31 December 2022 During January 2023, cash receipts are estimated to
be FRW 25 million, cash payments FRW 26m and a depreciation charge of
FRW 7 millions.
Goods produced are sold both for cash as well as on credit. In the case
of credit sales, the pending bills are realized at a later date. This cycle
continues to be repeated in an accounting year several times. Thus, the
flow of cash in a business passes through various channels. The magnitude
of the flows in terms of time (days) may be depicted in the analysis made
by MUKARUTESI Ltd.
Required
– Think of a financial statement that is appropriate to report this
financial information.
– What will be the forecast cash balance for 31 January 2023?
a) FRW 61m
b) (FRW 11m)
c) FRWF 39m
d) FRWF 32m
End of unit assessment 5Question 1
1. What do you think is meant by ‘cash’? (Hint: which are the truly
liquid assets?)
2. Can you think of any more examples? Spend a minute thinking
about this and then write down any you come up with.
Question 2:
A business has an inventory holding period of 84 days, a trade receivables’
collection period of 51days and a trade payables’ payment period of 43
days.
Required:
What is the cash operating cycle in days?a. 10 days, b. 76 days, c. 92 days, d. 178 days
UNIT 6: IDENTIFICATION OF COST ACCOUNTS
Key unit competence: Identify and recording cost accounts used in organizationIntroductory activity
URURABO MANUFACTURING PLC located in Musanze, manufacturing
three products: biscuits, banana juice and banana beer using many
different costs. During the year 2020, it made a number of transactions
like payment of workers, purchase of raw materials and others activities
for producing a product. But they did not know how much was used for
producing each product. This is because it was not aware of cost used
in purchasing of raw materials during the period and transport made.
URURABO also had no idea on other expenditures for the same period.
Besides, it was very hard for URURABO to know what to plan for the
forthcoming year. It advised itself to go for deep checking on invoices for
the period, but failed because some invoices were missing! Due to that
critical situation.
Questions?
1. What was the mistake URURABO MANUFACTURING PLC did?
2. What do you think as a sustainable answer to avoid that mistakefrom happening again?
6.1. Introduction to cost accounts
Learning Activity 6.1Analyse the picture below and answer questions that follow:
Question:
1. According to your observation, what do you see in this picture?
2. What are they doing?
6.1.1. Inter-locking accounting system
A control account is a summary account in the general ledger that is supported
in details by individual accounts in a subsidiary ledger.
In cost accounting the cost books are basically maintained under the two
systems namely Non-Integral or non-integrated cost accounting orInterlocking accounts and Integral or integrated cost accounting.
It is known as non- integrated accounting system referring to a traditional system.
Under this system, the enterprise keeps separate cost accounts from financial
accounts. The cost ledgers are quite independent of the financial ledgers. In
other words, Interlocking accounting system is a system in which company
records its transactions on the basis of
financial accounting principles and cost accounting principles separately. It
means there will be two records of accounts; one is financial accounts recordand second is cost accounts record.
The cost accounts use the same basic data as the financial accounts but
frequently adopt different bases for matters such as depreciation and stock
valuation. Interlocking accounts is a system in which the cost accounts are
distinct from the financial, the two sets of accounts being kept continuously inagreement by the use of control accounts.
The separate ledgers are kept and cost accounts display the following features:
a) There are no double entries that span the two ledgers
b) There is control account (General ledger adjustment account) in the
cost ledger. This account helps to complete the double entry and make
the cost ledger self-balancing.
c) The financial ledger is the normal ledger that is found in bookkeeping.It is not in any way affected by the existence of the cost ledger.
The financial accounting department maintain the following financial
ledgers:a) General ledger that contains all real, nominal and personal accountsThe cost accounting department maintains the following cost ledgers:
except for account receivable and account payable.
b) Accounts receivable ledger that has all personal accounts of trade
debtors
c) Accounts payable ledger that has all personal accounts of trade
creditors.a) Store ledger containing all accounts of individual items of rawCONTROL ACCOUNTS
materials, components and consumable stores.
b) Work-in-progress ledger containing all cost of material, wages and
overheads for each job or manufacturing in progress are posted to the
respective job accounts in this ledger.
c) Finished goods/stock ledger containing accounts of all types of
finished goods. A separate account is opened for each type of finished
product.
d) Cost ledger: recording impersonal accounts i.e accounts relating toincome and expenditure.
A control account is a summary account where entries are made for totals of
transactions for a period and kept for each subsidiary ledger.
The main purpose of cost control accounts is to minimize and detect accounting
errors such as non-posting, incorrect postings, check that all effective expenditure
is accounted for in the cost accounts with double entry proof, provide an
effective system of internal check since there is cross checking of work done by
different persons. This leads to greater accuracy of records, summarize masses
of detailed information contained in the subsidiary ledger and this provides
immense help to management in policy formulation and facilitate compilationof financial accounts and reconciliation with financial accounts.
– Advantage of interlocking accounting systemMain benefit of interlocking accounting system is for big companies tokeep
double record by independent accountants. So, there is less chance of fraud
and mistake because in reconciliation process, such fraud and mistake can be
found by auditor.-Disadvantages of interlocking accounting systemHence we keep double set of accounts (cost and financial ) we therefore need
the reconciliation of cost and financial accounts for finding the reason of not
matching of cost accounts records with financial accounts records from the
same period of time. Due to its separate accounting staff for keeping two
separate sets of accounts, the system becomes costly. Finally the periodic result
(cost profit and financial profit) from both systems confuses the users.
6.1.2. Integrated accounting system
Integrated accounting is defined by the Chartered Institute of Management
Accountants (CIMA) as “a collection of accounting records that offers financial
and cost accounts using a common data input for all accounting purposes.” This
is a single accounting system which contains both financial and cost accounts
that is, there is no division between financial and cost accounts.– Advantages of integrated system• Accounting policies are standardized
• There is no need for duplication source documents
• There is no problem of reconciliation as there will only be one profit
amount.
• Cost data can be presented promptly and regularly
• The system is economical and easy to understand
• Integrated accounting helps in widening the outlook of the accountant
and his staff and in return they appreciate the entire accounting system.
• All cost data and accounts are automatically checked and thus cost figures
are accurate.
• All the accounts are maintained in an objective form; the process of cost
ascertainment and cost control is facilitated.– Disadvantages of integrated system• It is costly system
• Integrated accounting system is comparatively more sophisticated and
hence its handling requires trained and more efficient persons
• Not suitable if cost and financial data are required to be separately
presented.– Factors that should be considered before established an integratedcost accounting system.
• Degree of integration
This should be determined early in advance. Some business firms may
integrate up to the stage of prime cost or factory cost. On the other hand, many
undertakings integrate the whole of the records.
Provisions for accrued expenses,
Prepayments and stocks should be dealt with by transfer to suitable suspense
accounts, so that the balance remaining in each control account represents the
charges for the period.
• Control accounts
In place of classifying expenditure according to its nature, control accounts
may be prepared for each of the elements of cost, such as ;material control
account, direct labour control account, factory overheads control account,
administration overhead control account, selling and distribution overheads
control account.
• Cost accumulation purposes
Full details about the cost the cost data are provided to the cost accounting
department so as to achieve the following objectives. To form the basis of
journal entries so that the control accounts can be charged to suitable revenue
accounts resulting into a cost of sales accounts and to provide the necessary
costing data.– Comparison between integrated system and interlocking system
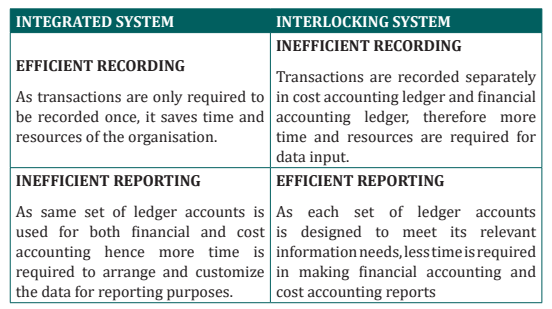
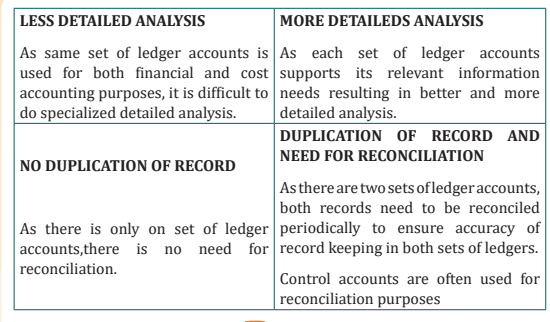
Application activity 6.1
1. Explain the meaning of the following terms in regard to the cost and
financial accounting systems:
i) integrated cost accounts
ii) interlocking cost accounts
iii) cost ledger control account
2. Identify two factors that should be considered before establishingan integrated cost accounting system.
6.2. Recording and analysis of information relating to cost accounts.Learning Activity 6.2
We have many professions and careers to be engaged in. Some people
become teachers, medical doctors, other people become engineers and
yet others work as priests, pastors, sheikhs, traders or farmers. In the
business world, some of the mostly heads or leaders of business companies
are accountants by profession. What accountants do is very important for
every business or enterprise because accountants help in the management
of finances for a service enterprise or a manufacturing company. As a
manager of manufacturing company, you don’t need to be an accountant
by profession but you need to have basic knowledge and skills of recording
and analyzing accounting information. The need to know the basics of
accounting is crucial even if you are running a small enterprise and cannot
afford to employ a fulltime accountant. Knowledge of accounting also helps
you make informed decisions, because accounting is the language of all
kind of business.
Questions
1. What do you think accountants do?
2. What do you think the accounting is for?
3. Is it necessary for company to record and analyze accounting
information?
6.2.1. Recording by inter-locking system.
This is a system of cost accounting in which the cost accounts have no double
entry connection with the financial accounts but use the same basic data.
Under this system, cost ledger and financial ledger are maintained separately.
Cost profit and financial profit do not agree in most of the cases and these arereconciled at the end of the year. Cost ledger contains only impersonal accounts.
There are normally four ledgers in costing department:
1. Cost ledger,
2. Store ledger,
3. Work-in-progress ledger and4. Finished goods ledger.
For all these ledger, one control account is maintained in the cost ledger.
The main cost control accounts maintained in the cost ledger are:
1. General ledger adjustment account
This account is also called “Cost ledger control account” or “cost ledger
contra account”
This account takes place of the personal accounts because in cost ledger only
impersonal accounts are maintained. All entries from financial accounts to cost
accounts should pass through this account.
The main objective of this account is to complete the double entry in the cost
ledger.
Any entry which is to be made in real accounts or personal accounts is made in
this account.
The balance in the “general ledger adjustment account “ represents the total of
all the balances of the impersonal accounts. 2. Stores ledger control account
This account shows the receipt of materials purchased and issues of materials
to production department.
The returns of materials to suppliers or returns from production department
are also recorded in this account.
3. Wages control account
It is under this account that all types of wages and labour cost incurred are
recorded. this accounts acts as a clearing house for wages incurred and
absorbed.direct wages are normally transferred to work-in- progress accounts
and indirect wages are transferred to respective overheads control accounts.
This account shows the total wages paid to the employees.
This account does not have any closing balance.
4. Production Overhead Account
This account shows the production overhead expenditure incurred and charged
to production.
This accounts contains the factory expenses.it is debited with indirect expenses
and credited with the amount of overheads recovered. Overheads allocated to
work-in-progress are carried over to next period. The balance in the control
represents under or over absorption and is transferred to costing profit and
loss accounts.
5. Administration Overhead Account
This account shows the administration overhead expenditure incurred and
charged.
The administrative overheads incurred is debited on this accounts and credited
with the amount of overheads recovered, any balance on account is transferred
to costing profit and loss account.
6. Selling and Distribution Overhead Account
This account shows the Selling and distribution overhead expenditure incurred
and charged.
Selling and distribution costs are debited to this account and the credit side
captures the overheads recovered from goods sold. In case of any balance on
this account, it is transferred to costing profit and loss account.
7. Work-in-progress Ledger control Account
This account shows the material cost, direct wages, production overhead
allocated and cost of finished goods.
The balance in this account represents the value of the Work-In-Progress at the
end of the year
8. Finished goods Ledger control Account
This account shows the material cost of completed jobs and cost of finished
goods sold.
9. Cost of Sales Account
This account shows the total cost of goods sold during a specific year.
10. Costing Profit and Loss Account
This account shows the sales, total cost of sales, adjustments regarding over orunder charge of overheads and costing profit for a specific year.
FOR EXAMPLE1. Materials
a) Purchase of materials for stock (cash or credit basis)
Dr Stores ledger control a/c
Cr General Ledger adjustment a/c
b) Returns to suppliers:
Dr General Ledger adjustment a/c
Cr stores ledger control a/c
c) Material purchased for a specific job ( i. e direct issue)
Dr Work-in-progress control a/c
Cr General ledger adjustment a/c
d) Direct material issued from stores to job
Dr Work- in- progress control a/c
Cr stores ledger control a/c
e) Material returned from jobs to stores:
Dr Stores ledger control a/c
Cr Work-in- progress control a/c
f) Issue of indirect materials:
Dr Factory overheads control a/c
Cr stores ledger control a/c
g) Transfer of material from one job to another:
Dr Receiving job a/c
Cr giving job a/c
h) Normal wastage of material and stores:
Dr Factory overheads control a/c
Cr stores ledger control a/c
i) Abnormal wastage of materials:
Dr Costing P & L a/cCr stores ledger control a/c
j) Abnormal gain of materials:
Dr Stores ledger control a/cCr costing P &L a/c
2. LABOUR
a) Payment of direct wages:3. DIRECT EXPENSES
Dr Wages control a/c
Cr General ledger adjustment a/c
b) Allocation of direct labour:
Dr Work-in- progress a/c
Cr wage control a/c
c) Payment of indirect labour cost:
Dr Wages control a/c
Cr To General ledger adjustment a/c
d) Allocation of indirect labour cost:
Dr Overheads control a/c
Cr wages control a/c
e) Normal Idle time cost :
Dr Factory overheads control a/c
Cr wages control a/c
f) Abnormal Idles time cost:
Dr Costing P & L a/c
Cr wages control a/cDr Work-in-progress control a/cCr General ledger adjustment a/c
4. OVERHEADSa) for recording overheads incurred and accrued:
Dr Factory control a/c
Dr Administration control a/c
Dr Selling and distribution control a/c
Cr To General ledger adjustments a/c
b)Allocation of factory overheads:
Dr Work- in-progress control a/c
Cr Factory overheads control a/c
c)Absorption of administration overheads
Dr Finished stock ledger control a/c
Cr administration overheads control a/c
d)absorption of selling and distribution overheads
Dr cost of sales a/c
Cr selling and distribution overheads control a/c
e) If under/over absorbed amounts are carried forward to subsequent year,
the balance of each overheads a/c will have to be transferred to respective
overheads suspencse (or reserve) account as follows
i) Dr production overheads a/c
Cr productions overheads suspense a/c
( for over recovery)
ii) Dr Administration overheads suspense a/c
Cr administration overheads a/c
(for under recovery)
iii) Dr selling and distribution overheads suspense a/c
Cr selling and distribution overheads a/c(for under recovery)
f) In case of under/over absorbed are transferredto costing P& L a/c then there levant entries will be as follows:
i) For over recovery.
Dr Overhead control a/c
Cr costing profit and loss a/c
ii) For under recovery
Dr costing P&L a/c
Cr Overhead control a/c5. FINISHED GOODS or COMPLETED JOBS
a. Transfer of completed jobs or finished goods produced to finished
goods ledger
Dr Finished stock ledger control a/c
Cr work-in-progress control a/c
b. Transfer of finished goods sold:
Dr Cost of sales a/c
Cr finished stock ledger control a/c
c. Transfer of cost of sales a/c to P&L a/c
Dr costing P&L a/c
Cr cost of sales a/c
d)To records sales:
Dr General ledger adjustment a/c
Cr costing P&L a/c
6. TRANSFER OF PROFIT OR LOSS
a. In case of profitDr Costing P&L a/cCr To General ledger adjustment a/cTREATMENT OF CARRIAGE INWARDS
b. In case of loss:
Dr General ledger adjustment a/cCr To Costing P&L a/c
The carriage inwards should be normally added to the purchase price of
materials. However, this expenses can be also recovered through production
overhead. In this case:
Carriage Inward
Dr: Production overhead account
Cr: General ledger adjustment account
CAPITAL ORDERS
If capital expenditure is incurred, it is transferred to an appropriate asset
account. The improvements to plant and machinery, tools and buildings are
mostly carried out by the workers of a manufacturing company. A capital
order account is opened for each item of capital work to be performed and all
expenditure incurred is charged to that capital order.
When a capital order is completed, the entries are made as under,
Dr: Capital order account
Cr: Work-in-progress ledger account.
The asset when capitalized is transferred to the financial ledger by the following
order:
Dr: General ledger adjustment account
Cr: Capital order account.
SPECIAL REPAIRS ORDERS
Sometimes special repairs orders are received by the production department.
When the repairs are completed, these repairs orders are closed.
On completion, the following entries are made:
Dr: Special repairs order account
Cr: Work-in-progress ledger control account.
The cost of the repair is then charged to the department for which the work
was carried out. In this case:
Dr: The respective department (e.g. production O.H account or selling and
distribution O.H account)Cr: Special repairs order account.
EXAMPLE: Prepare journal entries in the cost books maintained on non-integrated system for the following:
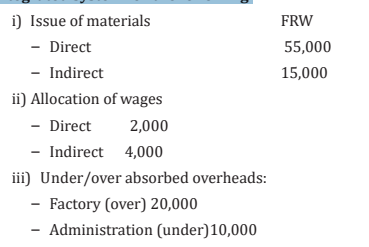
Answer
6.2.2. Reconciliation of cost and financial accounts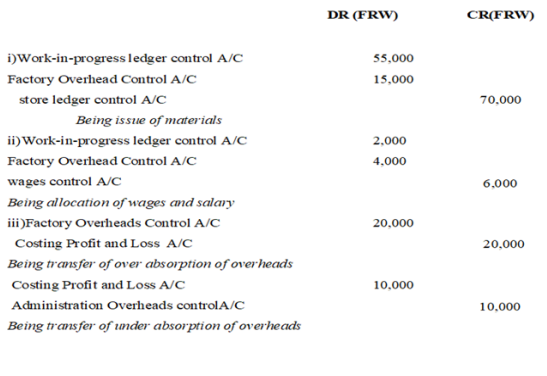
In case of interlocking accounts, the difference can arise between the profits
shown by the cost accounts and the financial accounts. It is essential to reconcileit these differences to ensure that there are no errors in both sets of accounts.
The differences in financial and costing profit can arise due to the following
items:
a. Items shown only by one set of accounts
There are some items which appear only in one set of accounts.
Some items appear only in the financial accounts and similarly some itemsappear only in the cost accounts.
The following items appear only in the financial accounts:
* Financial expenses * Financial income
1. Fines and penalties 1. Rent receivable
2. Donations 2. Interest received on bank deposits
3. Interest on bank loans 3. Dividends received
4. Stamp duty paid on issue of shares 4. Profit from sale of fixed assets5. Losses from sale of fixed assets
The following items appear only in cost accounts:
* Notional interest: is that interest which is charged by the management on
the capital invested by the Owners (the main purpose of this
charge is to show the nominal cost of the capital employed in the business
rather than investing it outside the business)
* Notional rent: shows the nominal rent charge of premises owned by thecompany.
This shows the cost of these premises rather than renting these premises to
outsiders.
Note: Notional interest and notional rent do not affect reconciliation between
financial and cost accounts, because in the reconciliation statement we start
with costing profit.
b. Difference bases of stock valuation
Different bases of stock valuation are adopted in the financial accounts and cost
accounts.
In financial accounting, stock is valued either at cost or net realisable value
whichever is the lower.
In cost accounting, different methods of stock valuation are adopted (LIFO,
FIFO, Average price, AVCO,...)
The differences in stock valuation will affect the profits or losses shown by the
two sets of accounts.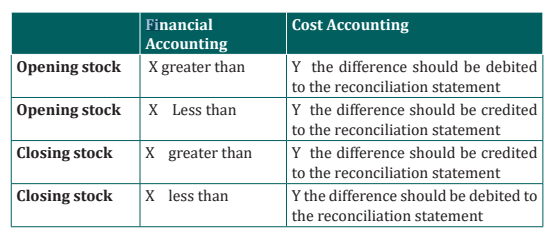
• X: is financial Accounting
• Y: is cost accounting
c. Overheads
In the financial accounts, the actual overhead expenses are charged to profitand loss account.
In cost accounts the overheads are absorbed at predetermined rates. The
differences in overheads affect the reconciliation between the financial andcost account.
If overheads charged in financial accounts are greater than cost accounts, thenthis difference should be debited to reconciliation statement and vice versa.
A memorandum reconciliation account is prepared to reconcile financial profitand cost accounting profit.
The following procedure is adopted in this case:– Start with the costing profit6.2.3. Memorandum reconciliation account
– Insert the differences on the debit and credit sides– The balancing figure will be identical to the financial profit
Reconciliation of Cost and Financial Accounts is the process to find all the
reasons behind disagreement in profit which is calculated as per cost accounts
and as per financial accounts. A reconciliation statement is a statement which
is prepared to reconcile the profit as per cost accounts with the profit as per
financial accounts by suitably treating the causes for the difference betweenthe cost and financial profit.
– Reconciliation Memorandum account formatProfit as per cost accounts XXXX
Add: Excess of opening stock value in cost A/C over financial A/Cs XXXX
Excess of closing stock value in financial A/Cs over cost A/Cs XXXX
Excess of depreciation charge in cost A/C over financial A/C XXXX
Dividends received XXXX
Profit on sales of fixed assets XXXXInterest received (other income) XXXX
Less: Excess of opening stock value in Financial A/C over cost A/Cs (XXXX)
Excess of closing stock value in cost A/Cs over financial A/Cs ( XXXX)
Excess of depreciation charge in cost A/C over financial A/Cs (XXXX)
Dividends Paid/proposed (XXXX)
Interest Paid (XXXX)Tax Paid (XXXX)
PROFIT AS PER FINANCIAL A/Cs XXXX
Illustration.
The cost accounting profit of XYZ Ltd for the year ended 31st December 2020
was FRW 46,000 whereas the financial profit for the same period was FRW
60,000. You are required to prepare a reconciliation statement given thefollowing information:
* The cost accounting records show:a) The opening and closing stocks were FRW 115,000 and FRW 154,000The financial trading and profit and loss account XYZ Ltd for the year ending
respectively,
b) Production overheads recovered was FRW 68,000
c) Administration overhead was absorbed at 5% of sales
d) Selling and distribution overhead was recovered at 7½% of sales
e) Notional rent and interest on capital were FRW8,000 and FRW 6,000respectively.
December 31, 2020 was as under:
Answer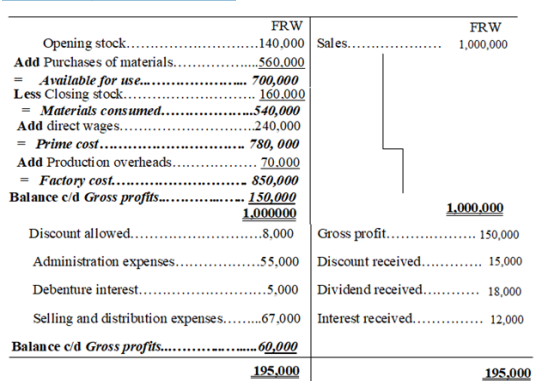
Workings
Administration overhead charged in cost accounts was 5% of sales:
1,000,000 x 5% = FRW 50,000
Selling and distribution overhead charged in cost account 7.5% of sales:
1,000,000 x 7.5% = FRW 75,000
Note: Notional rent and notional interest on capital do not affect reconciliationstatement
MEMORANDUM RECONCILIATION ACCOUNT
Alternative method (vertical format)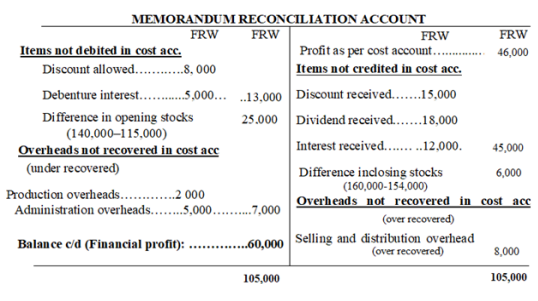
MEMORANDUM RECONCILIATION ACCOUNT
6.2.4. Integrated accounts /integrated system.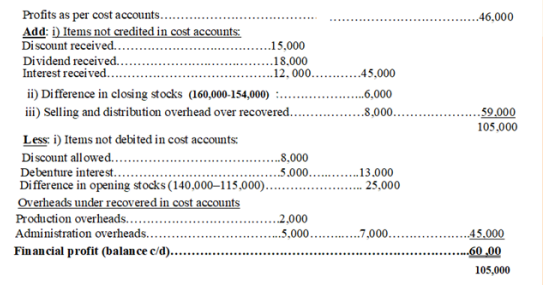
This is a single set of account which provides both financial and cost accounting
information This system is also known as integrated accounting system.
Under this system, personal and impersonal accounts are maintained in the
ledger.
Cost profit and financial profit are similar and there is no need of reconcilingthe cost and financial acc.
Although, the usual real and personal accounts are maintained but the nominal
accounts follow the principlesof cost accounting system. It means there
are accounts for stock, production, administration, selling and distributionoverheads followed by such final accounts as cost of sales, profit and loss etc
In integrated accounting system, the following two methods can be adopted:a) The double entry methodThe double entry methodb) The third entry method
In this system, the cost ledger includes the creditors’ control account, the
cash account, the provision for depreciation account and the debtors’ controlaccount in place of the general ledger cost control account.
The third entry method
This method is similar to the double entry method but incorporates an extra
account called the cost control account in which the costs are collected that canbe analyzed in memorandum account which is outside the double entry system.
The cost control account then enables the costs to be charged to finished goodsaccount and other accounts by using it as the double entry
Materials
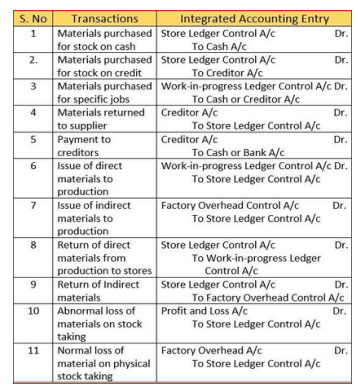
Labor
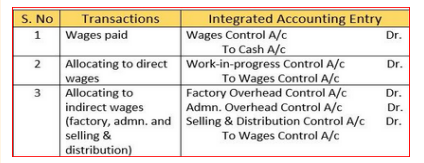
Direct expense
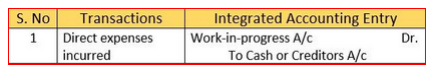
Overheads
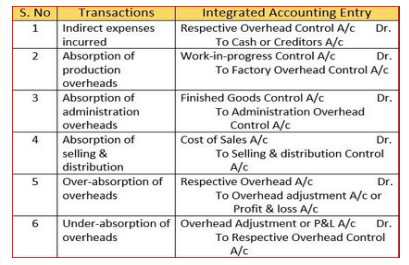
Other transaction
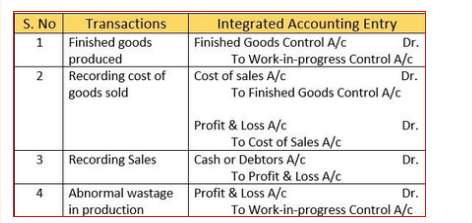
Illustration
URURABO Enterprise operates an integrated system of accounting.
Journalize the following transactions:
1/1/2022. Raw material purchased (50% on credit) FRW 300,000
2/1/2022. Material issued to production FRW 200,000
3/2/2022. Wages paid (50%Direct) FRW 100,000
4/2/2022. Wages charged to production FRW 50,000
5/2/2022. Factory overheads incurred FRW 40,000
6/2/2022. Factory overheads charged to production FRW 50,000
7/2/2022. Selling and Distribution overheads incurred FRW 20,000
8/2/2022. Finished goods at cost FRW 250,000
9/2/2022. Sales (50%credit) FRW 375000
10/2/200. Closing stock nil
11/2/2022. Receipts from debtors FRW 100,000
12/2/2022. Payments to creditors FRW 100,000
ANSWER
Journal Entries (integrated system)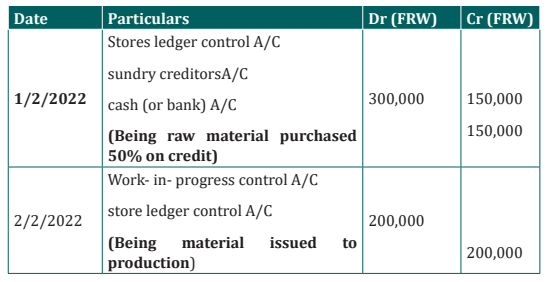
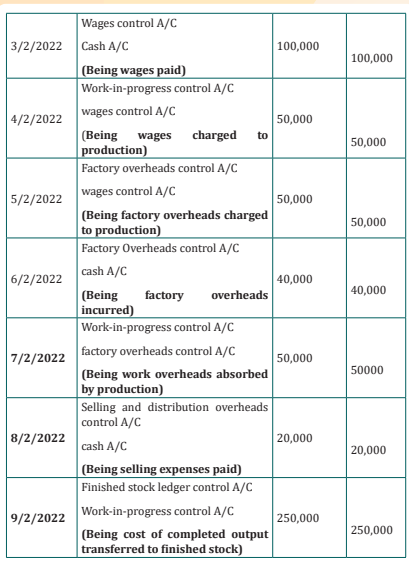
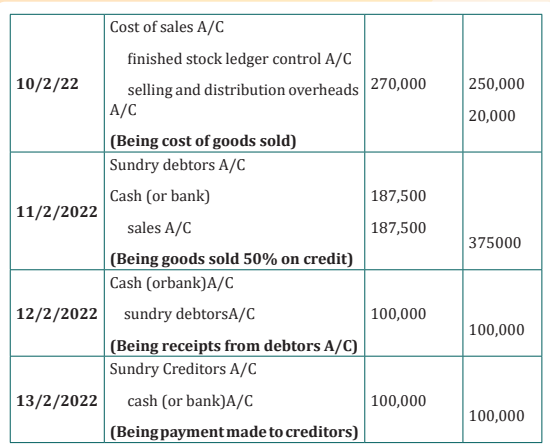
Application activity 6.2
1) Explain the meaning of the following terms in the context of cost
accounting under interlocking system.a) Notional rent2) Outline the advantages to a business firm of using an integrated
b) Dividends received
c) Notional interest
d) The double entry method
e) The third entry method
cost accounting system.
3) State possible causes of differences between reported profit in cost
accounting and financial accounting under the non-integrated cost
accounting system.
Skills Lab 6
Identify any Manufacturing Company in around your location. Visit that
company and find out if the company keeps any records. Identify the
records that are kept and the kind of company information such records
capture. Analyze the identified records, interpret them and advice this
company on what to do to be able to earn desired profit. Generate a reportof your findings.
End of unit assessment 6
I. Choose the correct answer1) Issue of material is credited to:2) The cost of materials, wages and overheads of each job undertaken
a) Stores ledger control A/C
b) Work-in progress control A/C
c) Overheads control A/C
d) Cost ledger A/C
is posted ina) General ledger adjustment account3) Non-integrated system of accounting is also known as
b) Stores ledger control accounts
c) Work- in-progress ledger
d) Finished goods control accounta) Cost ledger accounting4) Ledger control account is :
b) Interlocking accounting system
c) Cost ledger accounting or interlocking accounting system
d) Cost Centre accountinga) An account in the cost ledger to record financial accounting itemsThe financial accountsof NMG manufacturing Company showed a profit
b) An accounting in financial ledger to record financial accounting
items
c) An account that summarized outstanding payables balances
d) An accounting that summarizes outstanding receivables balances
of FRW 22,700 and for the same period the cost accounts showed a
profit of FRW 23,100. Comparison of the two sets of accounts revealed
the following:
a) Stock valuations:
No rent is shown in the financial accounts but a notional rent of FRW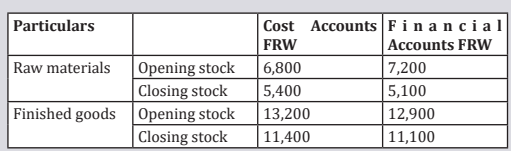
1,500 was charged in the cost accounts during the period.b) During the period the company sold an old machine and madeRequired: Prepare a Memorandum reconciliation account for NMG
a loss of FRW2,100 on the sale.This was not recorded in the
cost accounts.
c) Depreciation charge in the financial accounts was FRW2,500 based
on the straightline method. In the cost accounts depreciation
was charged at a rate of FRW 5 per unit produced. During the
period, the company produced 600units.
d) Other items appearing only in financial accounts include:
– Dividends received FRW 1,300
– Interests paid of FRW 800
– Corporation tax paid FRW 3,300
– Interest income FRW 1,900
– Company donations FRW 800
– Dividends paid FRW 700
– Miscellaneous income FRW 2,800manufacturing company