Unit 17 Genetics
Key Unit Competence
To be able to explain the role of genes in inheritance and how genetic disorders occur.
LEARNING OBJECTIVES
At the end of this unit, the learner will be able to:
• Explain the terms gene, locus, allele, dominant, recessive, co-dominant, linkage, test cross,
F1 and F2, phenotype, genotype, homozygous and heterozygous.
• Explain how to conduct a test cross.
• Explain why monohybrid ratios of 1:2:1 occur.
• Describe an example of inheritance involving multiple alleles.
• Explain the effect of lethal genes on phenotype ratios.
• Analyse various patterns of inheritance.
• Appreciate the roles of genes in determining the phenotype and patterns of inheritance.
• Use genetic diagrams to solve problems involving monohybrid and dihybrid crosses, including
those involving autosomal linkage, sex linkage, and codominance, multiple alleles and gene
interactions. (The term epistasis does not need to be used: knowledge of the expected ratio
for various types of epistasis is not required. The focus is on problem-solving).
• Use the complete and accurate format to show a genetic cross and the results of a simple
monohybrid cross.
• Use genetic diagrams to solve problems involving test crosses.
• Use the chi-squared test to test the significance of the differences between observed and
expected results (the formula for the chi-squared test will be provided.).
• Demonstrate monohybrid and dihybrid inheritance.
• Give a genetic explanation of Mendelian dihybrid inheritance.
• Explain the use of test crosses to determine unknown genotypes in studies of dihybrid
inheritance.
• Explain the significance of recombination.
• Explain how sex is determined in humans and the role of sex related Y genes in determining sex.
• Describe how non-disjunction can affect the distribution of sex chromosomes in gametes
and offspring.
• Explain why linked genes do not show independent assortment.
• Explain how crossover values can be used to make a chromosome map.• Interpret Pedigree charts.
INTRODUCTORY ACTIVITY
Read the passage below and answer the questions that follow
We all are aware of the fact that we look similar to our parents ( grand –parents) and siblings
in our appearance such as eye color, hair texture, skin color etc.
We are also aware of the fact that certain diseases run in the family such as albinism, hemophilia
etc, which indicates that certain characters on traits are passed on from parents to their offspring
a. Why do you resemble your parents or siblings?
b. Which structure do you think controls the transmission of information from parentsto their offsring
17.1 CONCEPTS OF INHERITANCE
ACTIVITY 1
You must be familiar with the statements such as:
“You look similar to your mum but your skin colour is like that of your dad.” Or
“Your eye colour is same as that of your grandfather”.
Discuss such example for traits where you resemble to your family in traits such as hair colour,eye colour, skin colour etc.
We all are aware of the fact that we resemble to our parents (grand-parents) and siblings in
our appearance such as eye colour, hair texture, skin colour etc. We are also aware of the fact
that certain diseases run in the family such as diabetes, hemophilia etc. which indicates that
certain characters or traits are passed on from parents to their offspring. This phenomenon isknown as Heredity or Inheritance.
An organism produced by sexual reproduction has two parents and inherits certain traits from
father and certain traits from mother. It leads to variation in organism. So heredity and variation
is characteristics of sexually reproducing organism. The study of heredity and variations in
biology is referred to as Genetics.17.2 MENDEL’S LAWS OF INHERITANCE
ACTIVITY 2
A farmer came to complain to the seed seller in this way: “ I always buy the red bean seeds from
your shop but this time, look, they produce red and some few yellow colored been. What did
you put in the seed you gave me?”
How can you help to solve such a conflict?Is there any pattern by which traits pass on from one generation to another?
17.2.1 Mendel’s Experiments
In 1856, Gregor Mendel conducted experiments in garden pea (Pistum sativum) in the limited
space of a monastery garden. Garden pea plant has both male (pollen-producing part) and
female parts (pollen-receiving part). Since both the male and female parts are on the same
plant, it has tendency to undergo self-fertilization. Because of self-fertilization, the tall plants
always give rise to tall plants and dwarf plants always produce dwarf plants. Such true breeding
varieties are known as pure lines. Furthermore, he was lucky to get pure lines in garden pea.
He then carefully conducted hybridization experiments between two parent plants expressing
contrasting form of single trait. He also made sure that self-fertilization didn’t happen by removing
male parts from one parent (say tall plants) before female part got matured. In his initial experiments
(Figure 17.1), he carefully transferred pollen from male parent (say dwarf plant) to tall parent’s
female part and analyzed transmission of one particular trait (stem height) in all progenies of
the first generation (also known as F1 generation where F symbolizes the Latin word “filial”
meaning progeny and 1 represents first). Furthermore, he followed the transmission of same trait
(stem height) in second (F2) and third generation (F3) progenies as well which were naturally
produced by self-fertilizing power among first generation plants and second generation plants.
He maintained the quantitative records of all his experiments.
Since Mendel focused on one trait at a particular time, a cross between parents which differsin contrasting form of single trait is known as Monohybrid cross or inheritance.
Gregor Mendel: Father of Genetics Figure 17.1: A hypothetical experimental plan by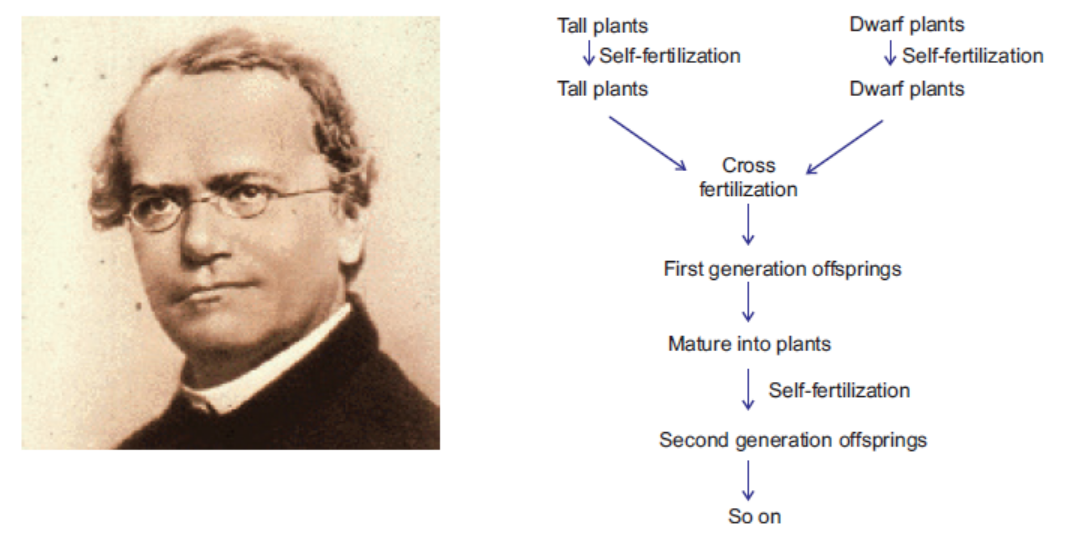
(Source: http://www.biography.com/ ; Mendel to follow the inheritance of particular trait orpeople/gregor-mendel-39282) monohybrid inheritance (for example – stem height)
17.2.2 Mendel’s Observation
Mendel carried out experiments to follow the pattern of inheritance of particular trait in several
generations. On crossing tall plants (which provided the female part) verse dwarf plants (whichprovided pollen), he observed that (Figure 17.2).
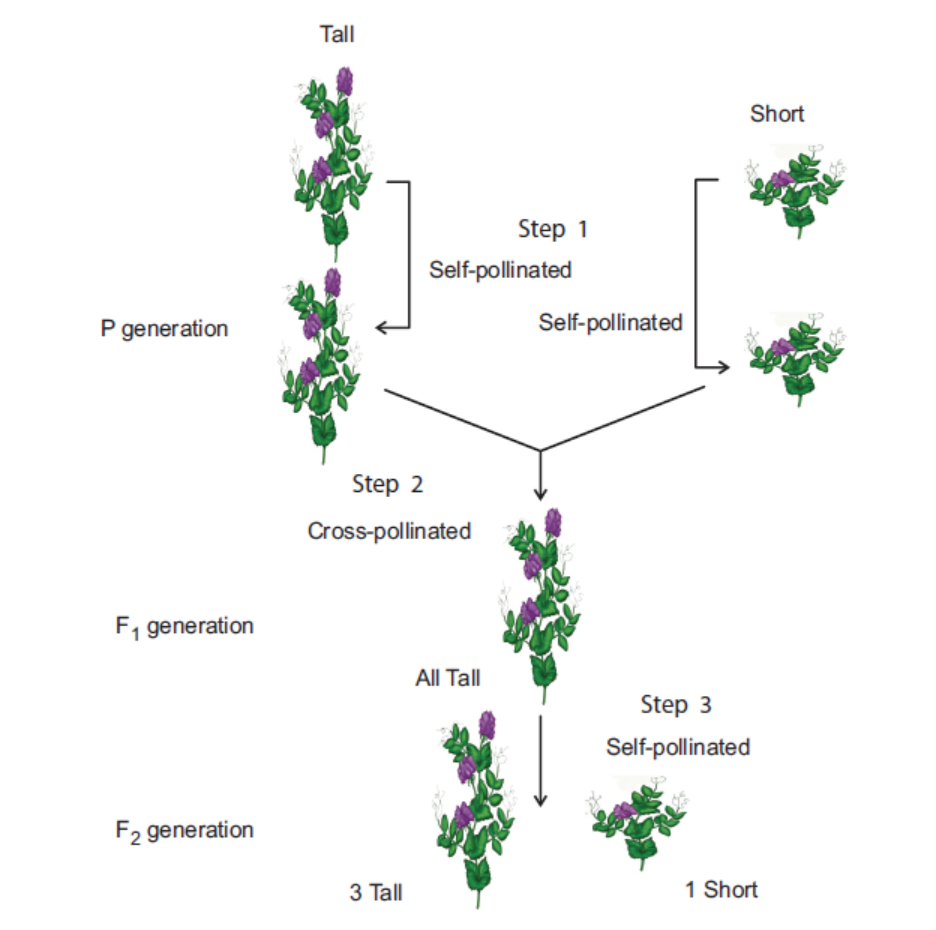
Figure 17.2: The experimental observation from a cross between tall and dwarf plants
• First generation progenies were always tall.
• Second generation progenies (also known as F2 generation) include tall plants as well as
dwarf plants almost in ratio of 3 (tall plants) : 1 (dwarf plants).
Mendel then performed the reciprocal cross (A similar cross where tall plants provided male
parts whereas dwarf plants represented female plants). Mendel observed similar results.
On performing similar cross-fertilizing experiments with parent plants showing other
contrasting set of traits such as seed colour, seed shape, seed coat colour, pod colour, pod
shape and flower position/arrangement (figure 17.3), he observed similar observation and
concluded that:
• First generation progenies were always showing one form of trait expressed in one of the
parent plants.
• Second-generation progenies include the plants showing both contrasting forms of traits,almost in ratio of 3:1.
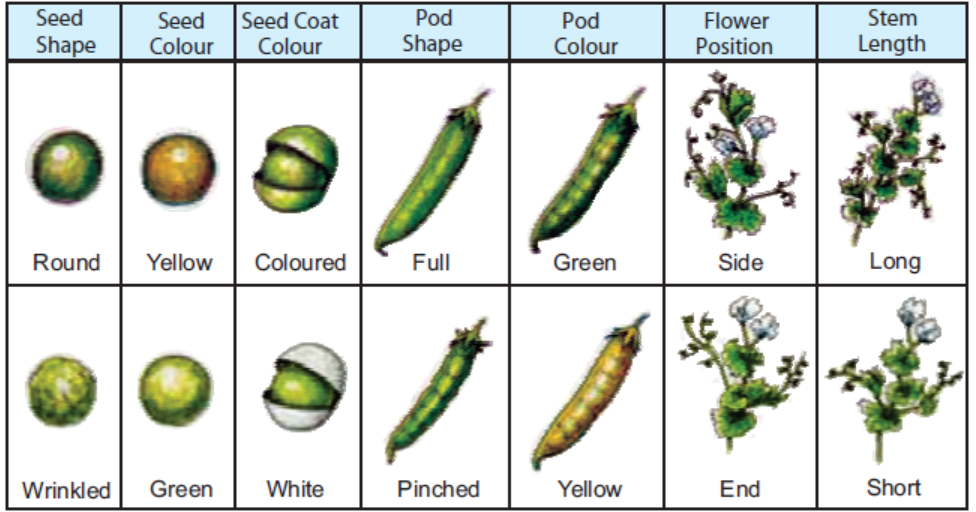
Figure 17.3: A seven pairs of contrasting traits in garden pea, the inheritance pattern was followed
On self-fertilization of F2 plants for various contrasting traits (for example: for stem height),
Mendel observed the following points:
• Dwarf F2 plants always yielded dwarf plants only.
• All F2 tall plants were not genetically same. The one-third tall plants produced tall plants
only but two-third tall plants yielded both tall plants and dwarf plants in the ratio of 3 : 1.
It means phenotypic ratio is 3 : 1 but genetically the ratio is 1 : 2 : 1.
The results of Mendel´s experiment were published in the monograph – “Experiments in PlantHybridization” in 1866.
17.2.3 Mendel’s Postulates: Principles of Inheritance
Based on consistency of his results in transmission of seven contrasting traits, he derived
postulates which later became principles of inheritance.
• There are two factors (Unit factor in pairs) for each trait. In pure lines of plants, both the
factors for particular trait (stem height) are alike. For example, if Factor “T” donates height,
there are two factors for each trait. The tall plants have TT and dwarf plants have tt.
• At the time of gamete formation, the factors for particular trait randomly segregate
with equal likelihood. Each gamete contain single factor, therefore the gamete is always
pure for the trait. Later on, it becomes popular as “Mendel’s principle of segregation”.
For example: all the gametes from tall plants have single factor “T” and dwarf plants
have “t” (Figure 17.4).
• After fertilization, when gametes from parents randomly fuse, factors for a particular
trait also unite together. For example, in a cross between tall and dwarf plants, gamete
from tall plant with factor “T” fuses with gamete from dwarf plant with factor “t” to
form “Tt” organism.
Figure 17.4: Mendel’s conclusion from hybridization experiments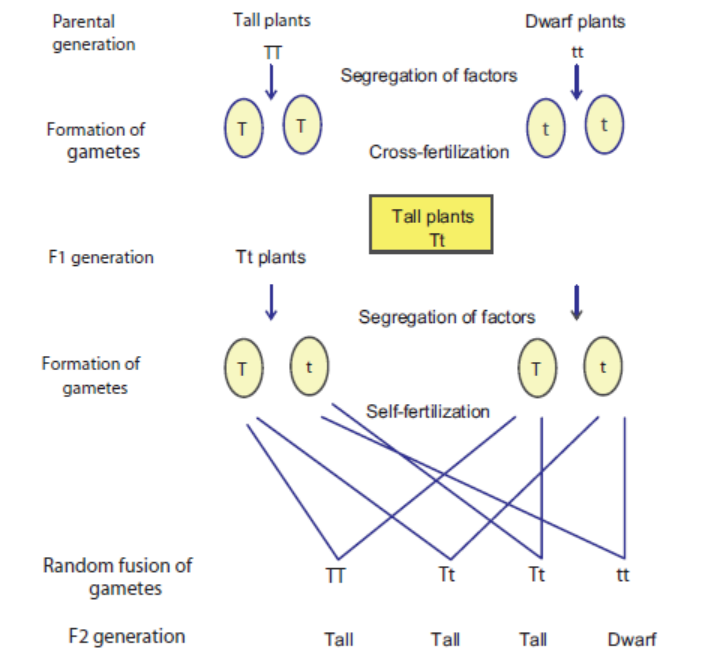
(shown for trait : stem height)
• In F1 generation, only one of the parental traits is expressed, it indicates that out of two
forms of factors for the single trait, one factor is dominant. For example: Tt organisms are
tall, so the factor for tallness “T” is dominant over the factor “t” for dwarfness. The factor
which remains under-expressed in presence of dominant factor is known as recessive factor.
• In the F1 populations, the factors again randomly segregate in the gametes. So a ‘Tt’
organism will produce two type of gametes either having ‘T’ or‘t’ form for particular
trait. During self-fertilization, there is random fusion of gamete and formation of TT,
Tt, Tt or tt. Hence, three out of four F2 progeny becomes tall whereas one out of four
progeny are small (figure 4). The tall and dwarf varieties are obtained in the ratio of
3 : 1. The F2 ratio (3 : 1) obtained is known as monohybrid ratio.
• Mendel concluded that the F2 ratio (3 : 1) indicates the morphological pattern of trait
(for example in case of stem height, it indicates tall verse short), so it is also known as
phenotypic ratio (Phenotype: morphological appearance). Genetically, it is further dividedinto 1 : 2 : 1 (Genotypic ratio) as Pure dominant: hybrid: pure recessive.
17.2.4 Reasons Behind Mendel’s Success
His experiments were highly successful and he was able to discover the pattern of inheritance.
The reasons for his success are as follows:
• His choice of experimental organism i.e. garden pea, was extremely good as it generates a
large number of generations in a very short duration.
• Pollination of garden pea leads to large number of offsprings due to which the inheritance
pattern could be followed in the progeny.
• Furthermore, Mendel studied one trait at a time thereby allowing him to deduce useful
interpretations.• Lastly, his mathematical background played an important role in deducing the results.
ACTIVITY 3
Problem A
Aim: A plant with round seeds along with wrinkled seeds is crossed. What will be the
genotype and phenotype of F1 generation and F2 generation if trait follows Mendelianpattern of Inheritance?
Procedure: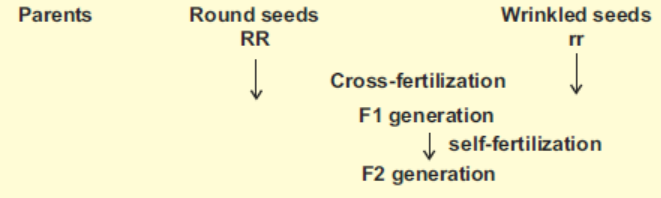
• Observe the given diagram carefully.
• Draw the punnett square showing the gametes from both the parents on each side.
• Note down the genotype and phenotype of F1 generation.
• Again draw the punnett square showing the gametes of F1 parents.• Note down the genotype and phenotype of F2 generation.
Problem B
Aim: Demonstrate monohybrid inheritance using beads of two different colours.
Materials Required:
Class notebook
Two colour beads (red and yellow)
Procedure for monohybrid inheritance:
• Open pouch containing beads of two different colours.
• Count total number of beads.
• Divide total number of beads with 4 (T/4 = z)
• Differentiate beads according to their colour and count them respectively.
• Divide each number obtained in the previous step with value “z” and make a ratio.
• Discuss whether the observed ratio is in accordance with the Mendelian monohybridratios.
17.3 DEFINITION OF GENETIC TERMS
Gene: Gene is the entity/unit which has the information for particular trait. For example:
in garden pea, gene for stem height has information for height whether it would be long
or small.
Locus: The position of gene on chromosome constitutes its loci/locus.
Allele: The alternate forms of genes are known as Alleles. A pair of alleles for each trait is
present in the zygote of an organism. For example: in garden pea, true breeding tall parent
plants have two similar alleles (TT).
Dominant Allele: In individual, out of two alleles for the particular trait, only one allele is
expressed. The expressed allele is known as dominant. For example, allele (T) for tallness is
expressed in F1 individuals (Tt), dominant allele. Dominant allele is generally referred by
capital alphabet.
Recessive Allele: In individual, out of two alleles for the particular trait one allele is underexpressed.
The under-expressed allele is known as recessive. For example, allele (t) for shortness
is not expressed in F1 individuals (Tt), recessive allele. Recessive allele is generally referred bysmall alphabet.
Co-dominant: It’s a phenomenon when both alleles present in an individual, are equally
expressed. For example, in humans, Blood cells express both the alleles M and N (alternate
form of gene encoding Red blood cell membrane protein) when present together.
Linkage: The genes are said to be linked when present on the same chromosome and inherited
together as unit.
F1: F symbolized filial, which means “progeny” in Latin. F1 is the filial generation first,
produced by cross between parent individuals.
F2: F2 is the filial generation second, produced by cross between F1 individuals.
Phenotype: The morphological appearance for particular trait constitutes its phenotype. For
example: In the cross between tall and dwarf parent plants, F1 plants are tall. Tallness is their
phenotype. In F2 plants, tall and dwarf plants are obtained in ration of 3 : 1, it is phenotypic ratio.
Genotype: The combination of allele for a particular trait in an individual constitutes its
genotype. For example: In the cross between tall and dwarf parent plants, F1 plants are Tt. “Tt”
constitute their genotype for the trait stem height. Similarly, F2 plants are tall and dwarf. But
genotype of all tall F2 plants is not same, one third are pure (TT) while two third are hybrid
(Tt). So genotypically F2 ratio is 1 : 2 : 1.
Homozygous: When in an individual, two alleles for a particular trait are alike, then individual
is considered homozygous for the particular trait. For example, parent plants tall and dwarf
plants are homozygous for stem height.
Heterozygous: When in an individual, two alleles for a particular trait are different then individual
is considered heterozygous for the particular trait. For example, F1 plants are genotypically
“Tt”. They are heterozygous for stem height.
Monohybrid Cross: ‘It is a cross between two individuals of a species which is made to study the
inheritance of a single pair of factors or genes of a trait.’ A ratio among the offspring of F2 generation
of a monohybrid cross is called a ‘monohybrid ratio.’ It is usually 3 : 1 (phenotypic ratio) or
1 : 2 : 1 (genotypic ratio), in which 1/4 individuals carry the recessive trait, 1/4 pure dominantand 1/2 have impure dominant trait (Figure 17.5).
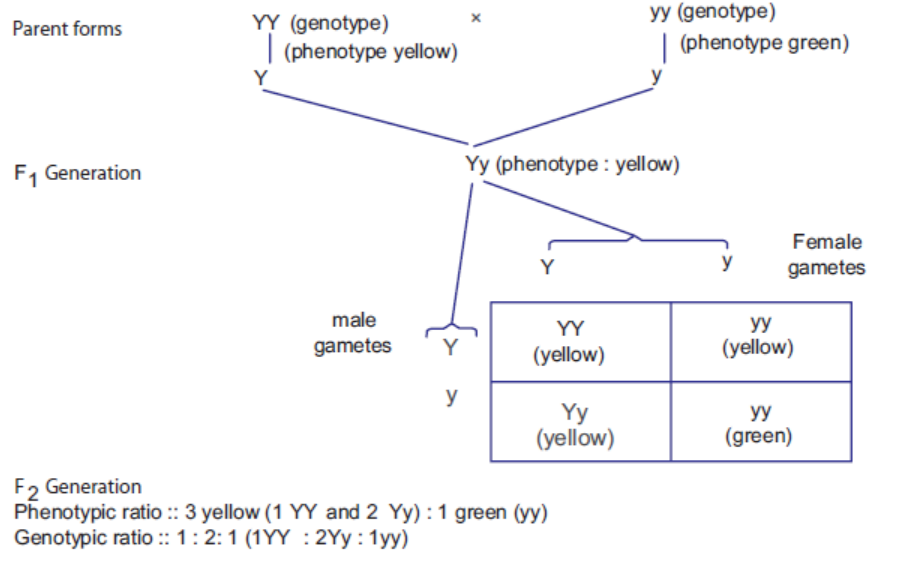
Figure 17.5: Mendel’s monohybrid experiment on garden pea (Pisum sativum)
Test Cross: It is cross between hybrid forms (dominant phenotype) with other parent with
recessive form of particular trait (homozygous recessive). It is generally used to identify
the genotype of hybrid form. The progenies are observed. If all progeny demonstrates only
dominant form of trait thereby indicating that unknown genotype must be homozygous
for the particular trait. Or If F1 progeny shows both dominant and recessive form of
trait in the ratio of 1 : 1 indicating that unknown genotype must be heterozygous for
the particular trait.
There can be two possible genotypes of an unknown dominant phenotype as illustrated below.
Possibility 1. If the unknown is homozygous yellow (YY), then crossing with green recessive(yy) gives all yellow offspring (i.e., all Yy) as shown below:
Possibility 2. If the unknown is heterozygous yellow (Yy), then crossing with green recessive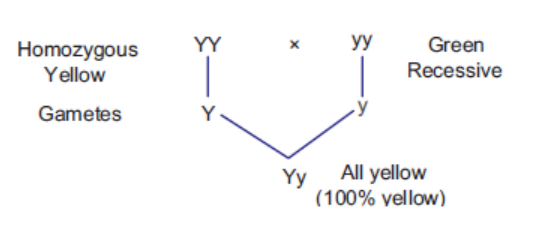
results in 50% yellow (Yy) and 50% green (yy) progeny as shown below:
In case of a double heterozygous, i.e, heterozygous yellow and round (Yy Rr) crossed with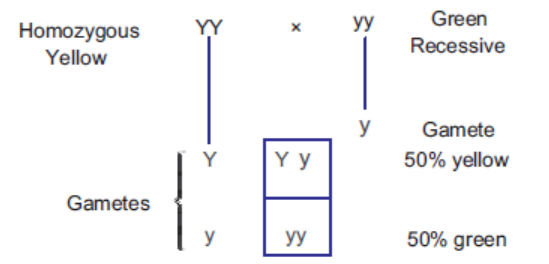
double recessive, i.e, recessive green and wrinkled (yy rr) the ratio will be 1 : 1 : 1 : 1.
Back Cross: The mating of the hybrid form with one of its parent or with individual genetically
similar to parent is known as back cross. When the back cross is carried out for several generations,
the hybrid becomes genetically closer to that parent. The back cross is commonly used in
horticulture and animal breeding.
Chi-Square Test: The statistical test used to analysis genetic data especially obtained
from breeding experiments. When breeding experiments are carried out, the progeny
number is counted and based on their phenotype, the ratio is calculated. But there is
always a difference in observed value from expected value. However, this might happen by
chance or there can be a real difference behind this deviation. Hence, chi-square analysis
test is used to find out whether deviations are by chance or there is indeed difference inobserved value.
Probability of Deviation
Using chi-square analysis, the probability or p value is calculated. Probability of deviation
indicates whether differences in observed value from expected value are by chance or not. If
probability is very high (equal to or more than 0.05 or 5%) then probability of deviation by
chance is high and there is no significant difference in observed and expected value. However,
if probability of deviation by chance is less (less than 0.05 or 5%) then observed value issignificantly different from expected value.
Calculation of p ValueFor its calculation, chi-square and degree of freedom is needed.
How to Use Chi-square Analysis by Example
Just consider a monohybrid cross for a trait pod colour in garden pea was carried out. In F2
generation, out of 582 plants, 428 green and 152 yellow were observed. We want to know
whether this cross is following Mendelian monohybrid ratio 3:1. According to expected ratio,
plant with green phenotype should be 437 (3/4 of total number) and yellow phenotype should be
145 (1/4 of total number). Now we can see there is difference in observed value from expected
value, whether this deviation is by chance or significantly different, and chi-square analysis canbe used according to formula in Table 17.1.
Table 17.1: Calculation of chi-square value from the given data
Degree of freedom is always one number less than total number of classes. Degree of freedom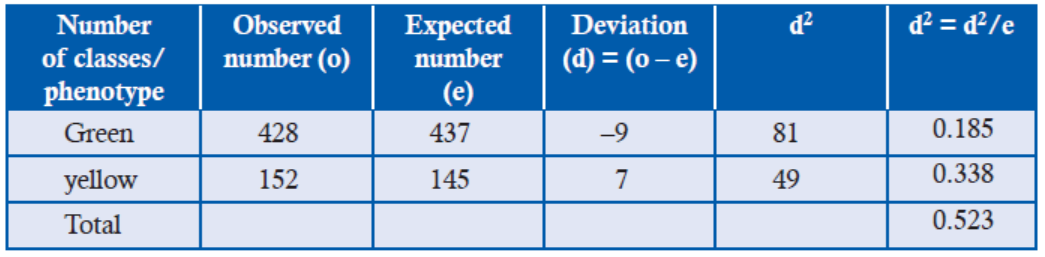
represents the quantum of independency that is there with the given classes. If there are
two classes, then only one class has freedom to fall in any criteria other class has no choice.
(for example : provided there are pairs of socks, there are two classes but freedom is there with
one socks which can be part of left or right foot, there is no option for second socks). Hence,degree of freedom (D) can be represented as:
D = n – 1(Where n is total number of classes)
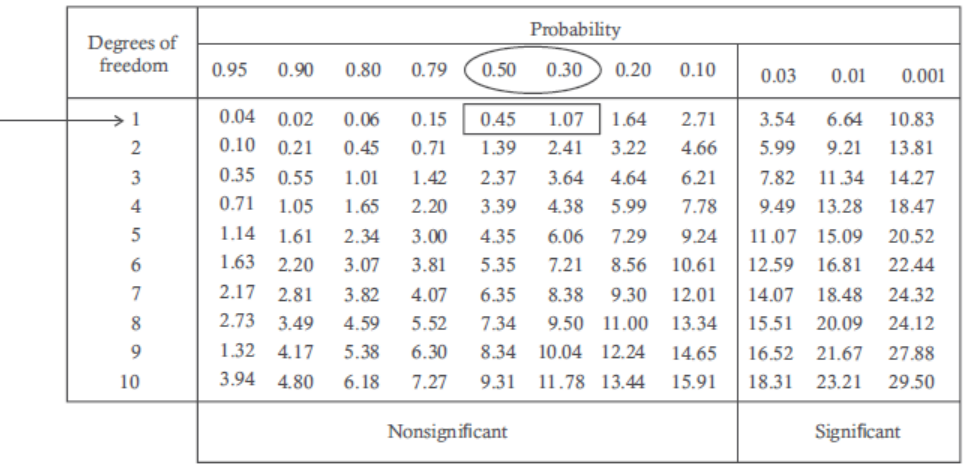
Probability of deviation calculation can be calculated by using probability table (Table 17.2)
wherein left column degree of class (D) is written and on right row (top most) Probabilities
are mentioned. At degree of freedom 1 (black arrow), summation of chi-square 0.523 value
(red box) shows p value as 0.30–0.50 (blue oval) or 30 to 50%. It indicates that deviation is by
chance. There is no significant difference between observed and expected value. Hence, thegiven cross follows Mendelian ratio (3 : 1).
Table 17.2: Probability table for chi-square analysis
ACTIVITY 4
Aim: Use genetic diagram below to solve problems involving test crosses
On test cross, out of 500 progeny 245 plants are observed with blue flowers and 255 plants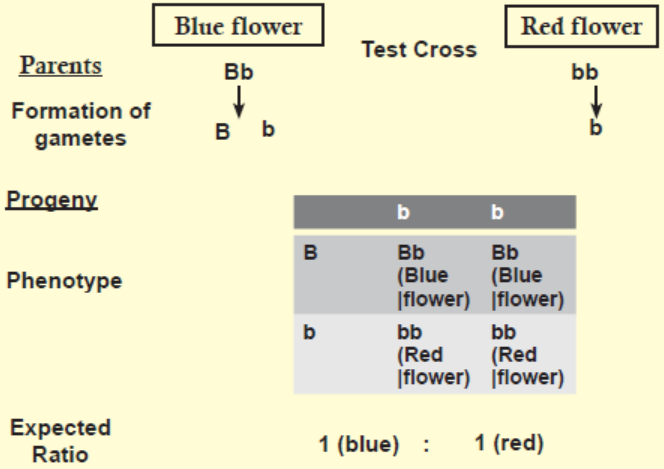
are observed with red flowers. But according to test cross ratio, total 500 progeny should be
expected as 250 blue flowers and 250 red flowers.
With the help of a chi-squared analysis test the significance of differences between observedand expected results.
• Using Chi-square formula, calculate the value for chi-square followed by its summation.
• Find the degree of freedom.
• Find the value of probability of deviation using probability table.• Discuss your results in group.
17.4 INDEPENDENT ASSORTMENT AND SEGREGATION
What do you think would have happened if Mendel would have tried inheritance pattern oftwo traits? Do inheritance of one trait is dependent on the inheritance pattern of another trait?
The cross was made between the double dominant plants (round seed shape with yellow seed
colour) with double recessive parent (wrinkled seed shape with green seed colour) and the
following points were observed:
• All round yellow seeds were observed in F1 generation indicating dominant factor for a gene
was expressed in the same manner as in monohybrid cross.
• On self-fertilization of F1 plants, F2 seeds were obtained and segregated in the ratio of
9 : 3 : 3 : 1 based on their phenotype.
In addition to parental phenotype combination, two new phenotype combinations/
recombinants (wrinkled and yellow and round and green seeds) were observed. Mendel
hypothesized that the factors for different traits separate and assort independently in the
gametes (factor for seed shape can assort with any seed colour factor and vice versa) then F1
plants should produce four types of gametes.
So male and female F1 plant gametes can fuse randomly and combine in 16 possible ways
which can be simply represented by a simple square popularly known as Punnett’s square*
(Figure 17.6).
Mendel observed similar results when he analyzed results of dihybrid cross for the other pair
of traits as well.
• The dihybrid results did not contradict monohybrid results, the round seeds and wrinkled
mseeds as well as yellow and green seeds were in ratio of 3 : 1. He hypothesized dihybrid crossevent as two independent monohybrid cross events.
(*Punnett’s square or checker-board: square-shaped presentation used to predict result of a particular
cross or breeding experiment in which gametes from each parent are placed on the top and left side
of the square. This diagram is used to predict of genotype of the individual when gametes fromparents randomly fuse. It is named after Reginald C. Punnett, who devised the approach.)
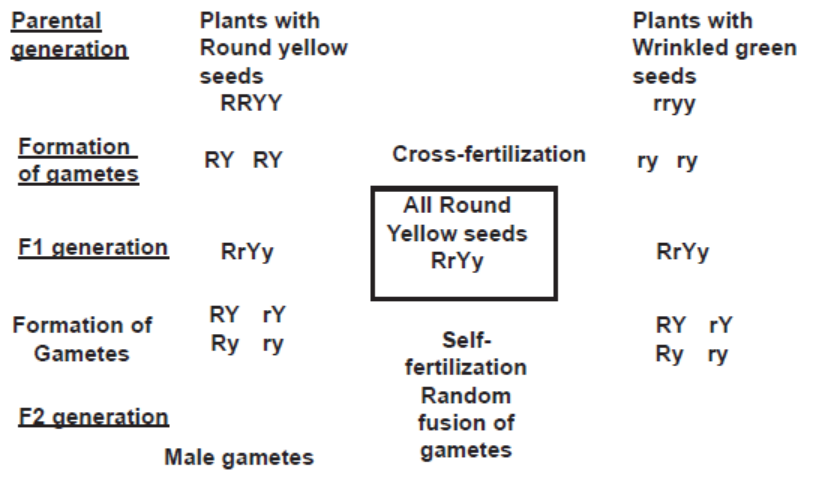
Figure 17.6: A dihybrid cross between plants with dominant round yellow seeds with plants with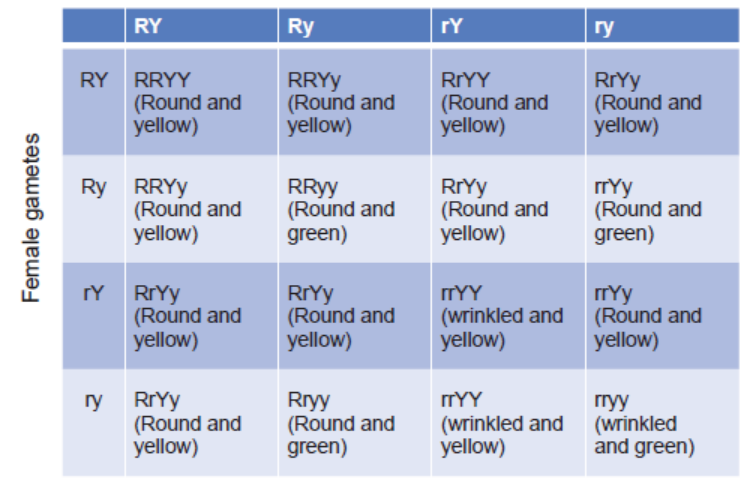
recessive traits wrinkled and green seeds through two generations
Random fusion of F1 gametes is represented with the help of Punnett’s square. The four
phenotypes—two parental (written in black) and two recombinants (written in purple and red)are obtained in the ratio of 9:3:3:1.)
17.4.2 Law of Independent Assortment
From the result of dihybrid cross experiments, Mendel gave the following postulates:
• The dominant allele of a particular gene is expressed in the presence of alleles of other
genes for different traits.
• On self-fertilization F1 plants, F2 plants were observed in the phenotypic ratio 9:3:3:1
(Dihybrid ratio). He concluded that factors for different traits assort segregate and assort
independently in the gamete. This is popularly known as Law of Independent Assortment.
17.4.3 Significance of Test Crosses in Dihybrid Inheritance
Test cross can be used to differentiate genotype of dihybrid organisms (whether it is homozygous
and heterozygous for the traits) if phenotypically same for a traits.
For example: plants with similar phenotype rounded seed shape and yellow seed colour can
have different genotype RRYY or RrYy. So the genotype of such plants can be identified by
test cross. So the plant with unknown genotype is crossed with plant with recessive form of
both the traits. There are two possibilities.
1. If progeny plants are observed in phenotypic dihybrid test ratio 1 (round and yellow):1
(round and green):1 (wrinkled and yellow):1 (wrinkled and green), then the parent plantmust have heterozygous genotype for both the traits (Figure 17.7).
Expected ratio for dihybrid test cross
Figure 17.7: Dihybrid test cross ratio when plant has dominant heterozygous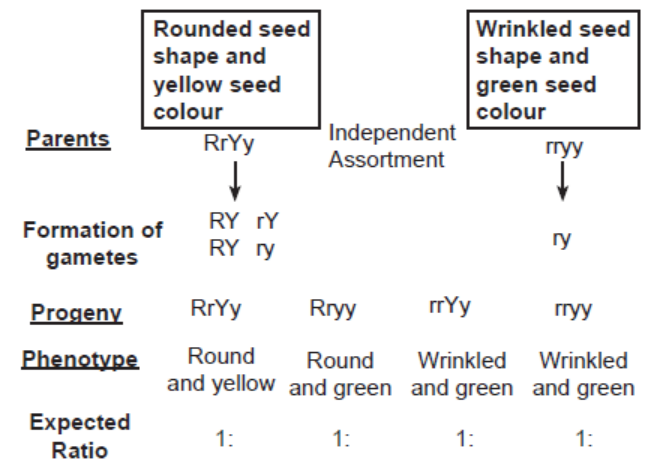
genotype for two traits
2. If after the cross all the plants are formed with dominant phenotype i.e., round seed
shape and yellow seed colour, it indicates that given parent plant must have homozygousgenotype for both the traits.
ACTIVITY 5
Aim: To demonstrate dihybrid inheritance using beads of two different colour and two
different sizes.
Materials Required:
Class notebook
Two colour beads (red and yellow)
Two size beads (Large and small)
Procedure for dihybrid inheritance:
• Open pouch containing beads of two different colours and different sizes.
• Count total number of beads.
• Divide total number of beads with 16 (T/16 = h)
• Differentiate beads according to their colour and size and count them respectively.
• Divide each number obtained in the previous step with value “h” and make a ratio.Discuss whether the observed ratio is in accordance with the Mendelian dihybrid ratios.
17.4.4 The Chromosome Theory of Inheritance
According to Mendel‘s law of inheritance, there are two factors for each character, each factor
segregates and assorts independently in the gametes without getting influenced by presence
of other factors for different traits. Similarly, same rules are followed for chromosomes during
cell division and cell biologists have confirmed that similar to Mendel’s factors.
• Chromosomes are also found in pairs,
• Segregate and assort independently in the gametes at the time of meiotic cell division.
This indicates that Mendel’s factors or genes are located on the chromosomes and it is chromosomes
which segregate and independently assort in the gametes. This is most popularly known aschromosome theory of inheritance which was independently given by Sutton and Boveri in 1902.
APPLICATION 17.1
1. Complete with appropriate terms:
(i) A cross of F1 with the recessive parent is ............................. .
(ii) ............................. is the father of genetics.
(iii) Mendel selected ............................. varieties of garden pea.
(iv) F2 generation shows 9 : 3 : 3 : 1 ratio in ......................
2. One of the genes for color vision in cats is sex-linked. The allele A gives orange fur, whereas
the allele B gives black. The two alleles are codominant, and when both are present the cat
has patches of orange and black, which is known as tortoiseshell.
a) Explain why male cats cannot be tortoiseshell.
b) Draw a genetic diagram to show the expected genotypes and phenotypes of the offspring
from a cross between an orange male and a tortoiseshell female cat.
3. In a species of animal, it is known that the allele for black eyes is dominant to the allele for
red eyes, and that the allele for long fur is dominant to the allele of short fur.
a) What are the possible genotypes for an animal with black eyes and long fur?b) How could you find out which genotype this animal had?
17.5 INHERITANCE: VARIATIONS FROM MENDEL’S PATTERN
Do you find all traits in accordance with Mendalian pattern?
Is there always two alleles for a trait in a population, if no discuss some examples.
Is one allele is always dominant to another?
Do product of all alleles are equally beneficial?
Are all our traits independent of inheritance of other traits? Think of metabolic pathways where
product of one reaction is substrate for next event and so on. Here the enzymes of reaction willnot be dependent on another enzyme of reaction of same metabolic pathways.
17.5.1 Co-dominance
When in heterozygote, both alleles of gene for particular trait are expressed, the phenomenon
is known as co-dominance. The best example of co-dominance is the MN blood group antigens
which are found in Red Blood Cells in Human. In Homozygous MM and NN individuals,
antigen M and Antigen N are expressed but in heterozygous MN individuals both antigen
M and N are co-expressed on the surface of RBC. When two heterozygous individuals are
mated, Progeny are obtained in phenotypic ratio of 1 (MM) : 2 (MN) : 1(NN) instead of 3 : 1monohybrid Mendalian ratio (Figure 17.8).
Figure 17.8: Cross between heterozygous MN individual – demonstrating co-dominance and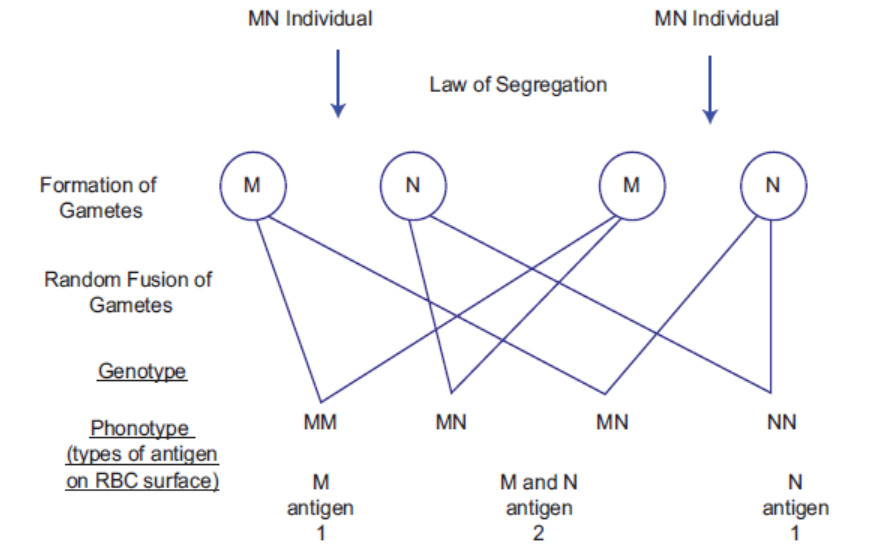
characteristic phenotypic ratio 1 : 2 : 1
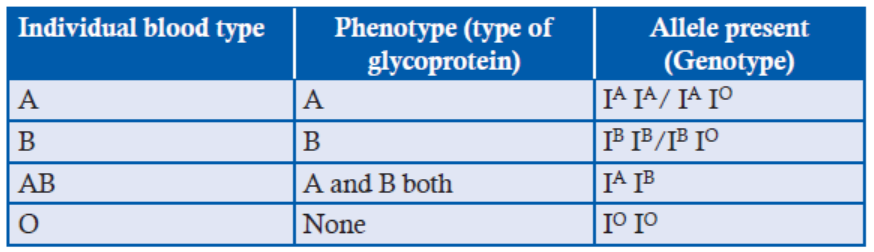
17.5.2 Multiple Alleles
It is well established that there are two alleles for a single gene. However, sometimes in a
population there can be more than two alleles for a certain gene which can be illustrated by the
ABO blood group system. In ABO blood group system, there are three alleles IA, IB and IO in
the population. The alleles decide the type of glycoprotein found on the surface of erythrocytes
(red blood cells). There are four blood types phenotype as depicted in table 17.3. The Individual
with blood group A express A type of glycoprotein while the individual with blood group B
express B type of glycoprotein. The individual with blood group AB expresses both types ofglycoprotein while O type individual contains neither A or B.
Alleles IA and IB are dominant to IO so A type individuals can have IA IA or IA IO genotype.
Similarly, B type can have IB IB or IB IO genotype. Alleles IA and IB are co-dominant so when
present together in AB individuals are expressed together. Alleles IO is recessive so O type
individuals are recessive homozygous IO IO. ABO Blood type example demonstrates uniquecombination of multiple alleles as well as co-dominance.
Table 17.3: The ABO blood type in human population
ACTIVITY 6
Aim: Consider two co-dominant alleles P and R. Draw a genetic diagram showing a cross
between two heterozygous individual (PR)? Discuss genotypic and phenotypic ratio in
progeny.
Procedure:
• Make a genetic diagram showing two heterozygous parents.
• Draw their gametes and with the help of Punnett square, make their progeny and give their
genotype and phenotypic ration.• Discuss it among yourselves and with class teacher.
17.5.3 Lethal Alleles
Sometimes genes have serious effect on development, physiology of the organism in such a way that
organism is unable to survive. Such genes are known as lethal genes. The particular allele responsible
for death of the organism is known as lethal alleles. Lethal allele can be dominant or recessive.
For example: The dominant allele C in chicken has serious effect on development of the
organism and results in following phenotype:
• Aberrant form “creepers” in Heterozygous individual (Cc)
• Completely “lethal” in homozygous dominant (CC).
When two heterozygous creeper individuals are mated, progeny are obtained in phenotypicratio of 2 (Creeper): 1(Normal) instead of 3 : 1 monohybrid Mendelian ratio (Figure 17.9).
Figure 17.9: Cross between two creepers chickens — demonstrating lethality and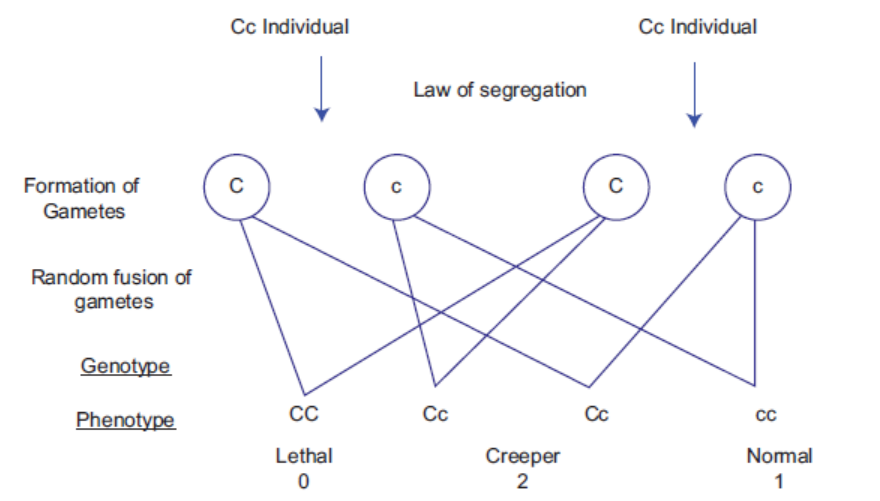
characteristic ratio 2 : 1
ACTIVITY 7
Aim: In mice, dominant allele Y is for yellow coat colour while recessive allele y is for agouti
coat colour.
(a) The yellow coat colour mice were self-bred. The yellow and agouti mice are produced in
the ratio of 2 : 1. What could be the reason for change in Mendelian monohybrid ratio?
(b) What is the genotype of mice having yellow coat colour?
Materials Required:
Notebook
Lethal allele information
Procedure:
• Read about lethal allele.
• Try to solve the genetic problem.• Discuss it among yourself.
17.5.4 Incomplete Dominance
Sometimes the allele is not completely dominant or completely recessive. In such heterozygotes
individuals, intermediate phenotype is observed. Such phenomenon is known as incomplete
dominance or semi-dominance or intermediate inheritance. For example: in Snapdragon
(Antirrhinum majus) a cross between plants with red and white flower variety produces all
plants with pink flower or intermediate phenotype. When two heterozygous plants with pink
flowers are mated, Progeny are obtained in phenotypic ratio of 1 (red) : 2 (pink) : 1 (white)instead of 3 : 1 monohybrid Mendelian ratio (Figure 17.10).
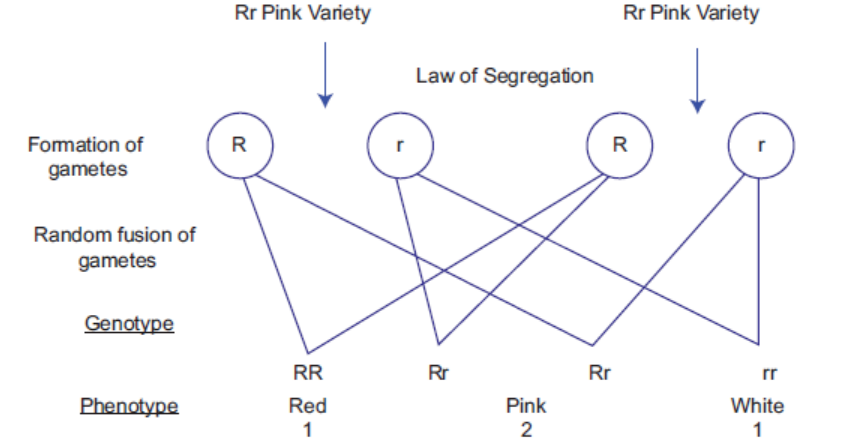
Figure 17.10: Cross between two heterozygous plants (pink variety) in snapdragon —demonstrating incomplete dominance and characteristic phenotypic ratio 1 : 2 : 1
17.5.5 Gene Interaction
There are cases when product of one gene influences the product/phenotypic expression of
another gene and this phenomenon is known as gene interaction (meaning: standing on/to mask).
One of the examples illustrating this is flower colour in sweet pea (Lathyrus odoratus), where
P dominant allele determines formation of the pigment anthocyanin (responsible for purple
flower colour). However, plants with PP and Pp will have purple flower only when another
allele of different gene C is present in dominant form. So product of gene C influences
phenotypic expression of gene P. The reason for this phenomenon can be explained as follows.
It is observed that gene C encodes for enzyme that synthesizes intermediate compound x
from precursor molecule. The intermediate compound is converted to coloured pigment via
product/enzyme of gene P.
Therefore, at least one allele of both gene C and P should be dominant to have colour flower. Such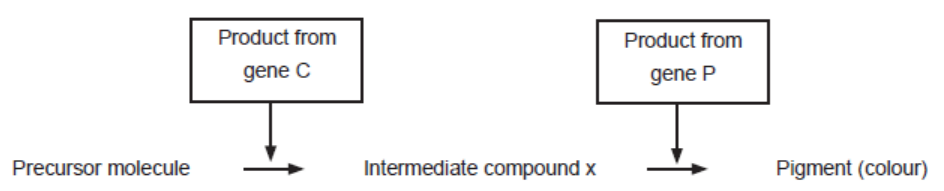
interaction where allele for one gene complements expression of allele of another gene is knownas complementary gene interaction. The respective genes are known as complementary gene.
ACTIVITY 8
Aim: In a given reaction, can you find gene interaction? If yes, what are the genes? If gene
“H” is present in homozygous recessive form and “A” gene is present in homozygous dominant
form, would you expect product A?
Procedure:
• Observe the reaction carefully.
• Note the number of gene that is required for the formation of product A.
• Considering the given condition in the question, try to answer to the best of your knowledge.• Discuss among yourself and with your class teacher.
17.6 LINKAGE AND CROSSING OVER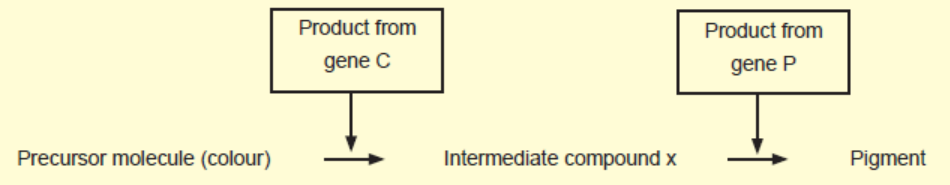
According to chromosomes theory of Inheritance, it is the chromosomes which segregate and
assort independently in the gametes. So the question arises as to then what happens to genes
located on same chromosome? Do they always remain together or linked (exception to law of
independent assortment)? Or, do they segregate and assort independently, if yes what couldbe the mechanism?
17.6.1 Linkage
There are cases when genes (present on the same chromosome) for different traits do not show
independent assortment, inherit together and behave as if genes are linked; the phenomenon
is known as linkage.
For example: two genes for trait flower colour and pollen grain texture in sweet pea (Lathyrusodoratus) where blue flower colour (B) allele is dominant over red flower colour (b) and long
pollen (L) is dominant over round pollen (l). A test cross was carried out between heterozygous
plant with double homozygous recessive plant (bbII), the observed phenotype had higher
frequency of parental phenotype (87.4%) and lower frequency of recombinants phenotype
(12.6%) in contrast to expected dihybrid test ratio (figure 17.6). It indicated that genes do not
assort independently and appear as if they are linked. However, occasionally they may separate
therefore resulting in lower frequency of recombinants.
Such genes are identified as linked when present on the same chromosome and do not assort
independently and tends to form parental phenotype but occasionally they may separate resultingin low recombinants frequency. This phenomenon is known as linkage.
Table 17.4: Observed dihybrid test cross frequency exception to lawof independent assortment
17.6.2 Linkage Crossing-Over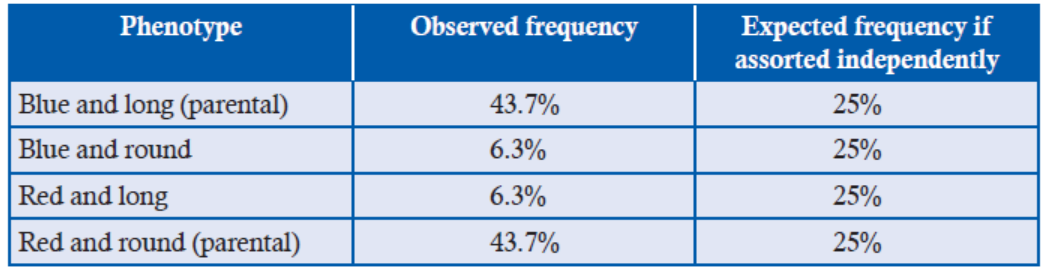
Now the question arises what could be the possible mechanism for the separation of the genes
located on the same chromosomes. The answer is crossing-over or recombination. Crossing-over
is the physical exchange of chromosome parts between non-sister chromatids of the homologous
chromosomes during meiosis division. The chiasma formation (observed by Janssens in 1909)
clearly provides the site at which non-sister chromatids of paired homologous chromosomes
cross over (Figure 17.12). The cross-over event between two gene loci in non-sister chromatidsis responsible for formation of recombinant chromatids and their separation (Figure 17.11).
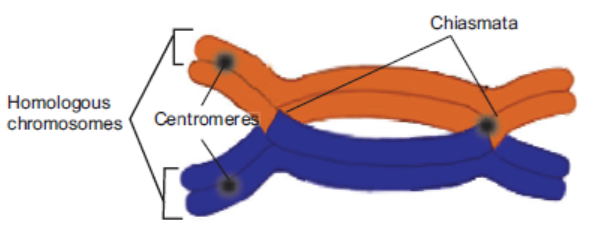
Figure 17.11: Micrograph demonstrating chiasmata formation in homologous chromosomes.
Here two paired homologous chromosomes (each with two sister chromatids) with centromeres
and gene loci are shown. Two alleles of a gene A (A and a) and two alleles of gene B (B and b)
occupy same position in homologous chromosomes (Figure 17.12). The crossing over between
two non-sister chromatids involves breakage of non-sister chromatids and reunion of broken
parts. The chromatids which participate in crossing over generate recombinants chromatids.
In the recombinants, the alleles on the same chromatid get separated and combine with allelesof non-sister chromatid.
Significance of Recombination/crossing-over
• The major significance is generation of variations. Due to crossing over, genes even on the
same chromosome can be assorted differently. It leads to variations in the progeny. The
variations are very useful in nature as it provides raw material on which natural selection
can act.
• The frequency of crossing over becomes higher with increase in physical distance between
gene loci. So recombinant frequency between two genes can be used to determine distancebetween genes, hence it helps to create chromosome map.
17.6.3 Chromosome Map
A chromosome map is the linear arrangement of genes in the chromosome with their relative
distance. It is based on fact that the frequency of crossing over between two genes is directly
proportional to the physical distance between the two. Therefore, the distance between genes
is indicated by percentage of crossing over (recombinant frequency). The distance unit is map
unit or 1cM (centi-Morgan, in honour of T. H. Morgan), so when 1% recombinant frequency
is observed between two genes, the genes are said to be 1 map unit apart.
T. H. Morgan and Sturtevant carried out extensive work in drosophila in finding recombinationfrequency between different genes and based on recombination data, they generated chromosome map.
Figure 17.12: Separation of genes A and B located on the same chromosome via crossing over—two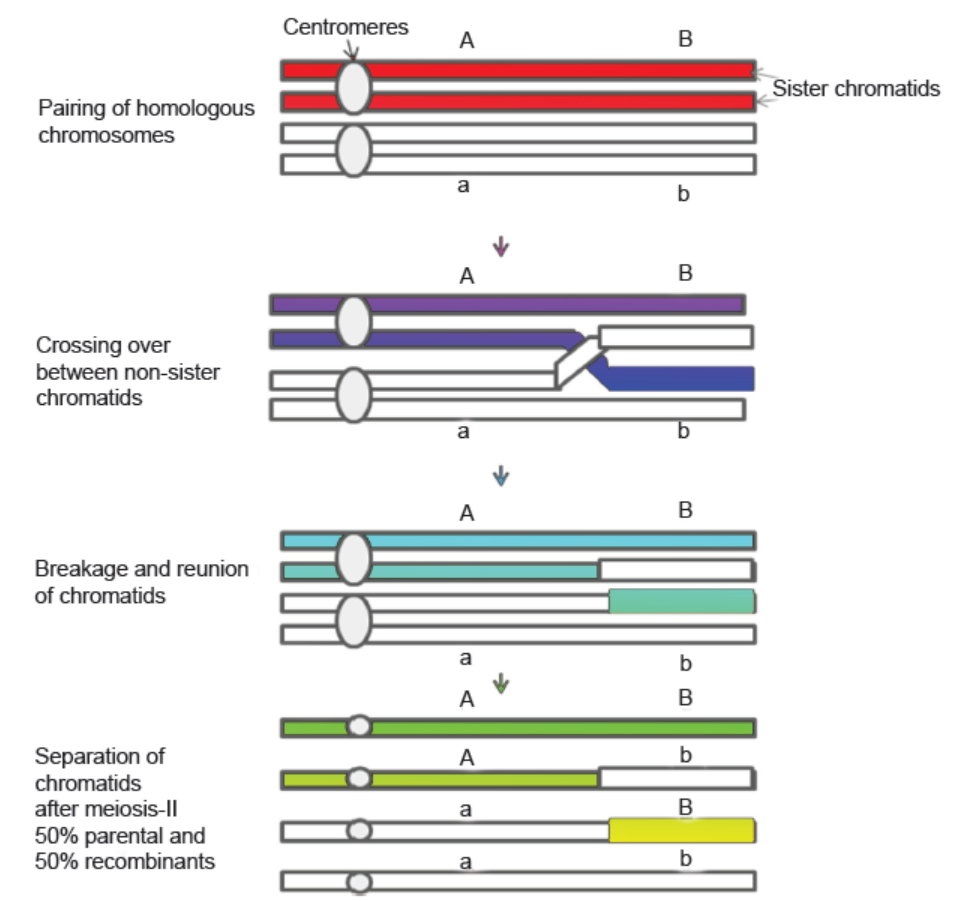
chromatids retain parental arrangement of the alleles while two are recombinant
A and a alleles of gene A while B and b are alleles of gene B. In recombinant chromatids allele
“A” combine with “b” allele while “a” combine with “b”.
For example: if recombination frequency between two genes A and B is 3% or 3 map unit. If
distance between B and C is 10 map unit and distance between A and C is 7 map unit, then
we can make chromosome map based on the information of recombination frequency. Thereare three possibilities:
But based on the information, possibility B represents the actual order of genes.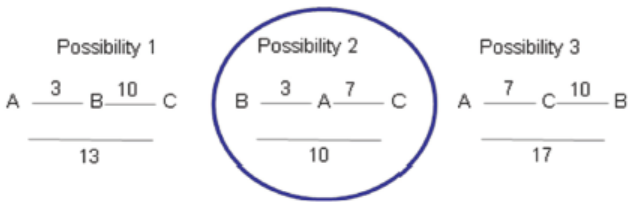
At the same time, we should remember even when genes are very far, there are 100% chances of
crossing over but recombinant frequency will not exceed more than 50% only because with increaseddistance, double or multiple cross events happens which cancels the effect of single cross over.
APPLICATION 17.2
1. Complete with appropriate terms:
( i) .............. is the phenomenon in which genes for different traits do not show independent
assortment.
(ii) Complete the table. Identify a, b and c.
(iii) A plant with genotype AABbcC is selfed F2 phenotypic ratio would be ............. (iv)
How many types of gametes are found in F1 progeny of cross AABBCC and aabbcc
2. Pure-breeding Drosophila with straight wings and grey bodies were crossed with pure-breeding
curled-wing, ebony bodied flies. All of the offspring were straight-winged and grey-bodied.
Female offspring were then test-crossed with curled-wing, ebony-bodied males, giving the
following results.
Straight-wing, grey body 113
Straight-wing, ebony body 30
Curled-wing, grey body 29
Curled-wing, ebony body 115
a) State the ratio of phenotypes expected in a dihybrid test cross such as this.
b) Explain the discrepancy between the expected result and the results given.c) Calculate the crossover value.
(iii) A plant with genotype AABbcC is selfed F2 phenotypic ratio would be .............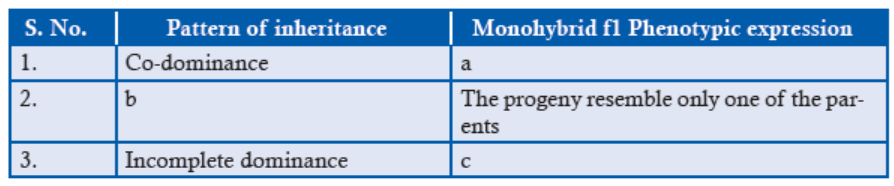
(iv) How many types of gametes are found in F1 progeny of cross AABBCC and aabbcc.
17.7 SEX DETERMINATION
Mostly, the organisms that produce their progeny using sexual reproduction have two sexes,
male and female. Occasionally, there are hermaphrodites which have characteristics of both
sexes. Sex determination is the biological system which initially determines sex of the organismwhile development.
17.7.1 System for Sex Determination
Based on whether genes play an important role in sex determination, there are two types of systems:
(a) Genetic sex determination in which chromosomes (especially sex chromosomes) play
an important role in determining sex of the individual.
For example: mammals
(b) Non-genetic sex determination in which other environmental factors such as diet,
temperature etc., play an important role in sex determination.For example: Certain reptiles
17.7.2 Sex Determination in Humans
In humans and other placental mammals, male and female differ in their chromosome
complement. Generally, there are two types of chromosomes, autosomes and sex chromosomes.
Generally in one sex (mostly female), both the sex-chromosomes are alike/homomorphic (XX)
and in other sex (male), there are two different/heteromorphic sex chromosomes (XY).
As the females are homomorphic (44 autosomes and XX, they produce single type of
ovum, containing 22 autosomes and one X chromosome while males are heteromorphic
(44 autosomes and XY) and therefore, they produce two types of sperm, one containing 22
autosomes and an X chromosome while other with 22 autosomes and a Y chromosome.
It is the Y chromosome which determines the sex of an individual. Y chromosome has Testisdetermining
factor (TDF) gene which produces testis determining factor which causes primordial
gonadal tissue in developing foetus to differentiate into testis. In the absence of TDF, tissue
differentiates into ovaries. So, the
• Individuals with Y chromosome are genetically male.
• Individuals without Y chromosome are genetically female.
Thus, the sex in human is determined at the moment of conception or fertilization of male (sperms)
and female gamete (ovum). If ovum gets fertilized by sperm containing an X-chromosome,then resulting zygote will have two XX chromosomes and will develop into female.
But if ovum gets fertilized by sperm containing a Y-chromosome, then resulting zygote will
have two XY chromosomes and will develop into male. So biologically, father is responsiblefor sex of the child.
17.7.3 Evidence for Role of Y Chromosomes in Sex Determination in Humans
The early evidence for the role of Y chromosome in sex determination is provided by certain
individuals with chromosome number abnormality i.e. turner syndrome and Klinefelter
syndrome which are caused by non-disjunction of sex chromosomes in meiosis.
• Turner syndrome: Here individuals have 45 chromosomes in contrast to normal complement
of 46 chromosomes. The turner individuals have chromosome complement 45 (XO) and are
sterile females. They tend to have short height; fail to develop secondary sexual characters
and immature internal sex organs.
It indicates that the presence of two X chromosomes is not important at least in female sex
determination; obviously, it is essential for proper development of female.
• Klinefelter syndrome: Here individuals have 47 chromosomes in contrast to normal
complement of 46 chromosomes. The Klinefelter individuals have chromosome complement
47 (XXY) and sterile male. They tend to have underdeveloped testis, taller than the average
male, breast development.
It indicates that despite the presence of two XX chromosomes, the sex of the individual is male.So presence of Y chromosome determines maleness.
17.7.4 Non-disjunction of Sex Chromosomes
Chromosome non-disjunction: it is the failure of the homologous chromosomes to separate
at anaphase at the time of cell division. The phenomenon was first observed by C. Bridges in
drosophila.
It involves autosomes or sex chromosomes.
Generally, two sex chromosome synapse at the time of meiosis and segregate equally in the
gametes, so gametes have single sex chromosomes.
If synapsed sex chromosomes fail to separate, then one type of gamete receives both sex
chromosomes while other receives none.
For example: If non-disjunction of sex chromosomes happens in egg formation, then one egg
will receive both X chromosomes while other receives none in contrast to equal distribution
of sex chromosomes. The fusion of the egg with normal sperm with single chromosome X or
Y leads to individuals with XXX (super-female), XXY (Klinefelter syndrome), XO (Turnersyndrome) and YO (lethal phenotype) (Figure 17.13).
Figure 17.13: Non-disjunction of sex chromosomes at meiosis—leads to abnormal gametes and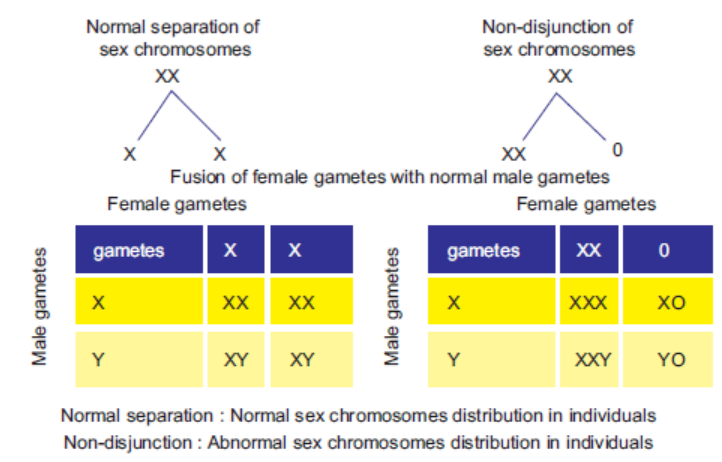
abnormal phenotype in humans.
17.8 SEX LINKAGE
Have you ever wondered that some variations are associated with particular sex of the individual?
For example, the diseases like colourblindness, Haemophila etc., are more common in male as
compared to female. Is mutation sex associated?
There are certain genetic traits, the expression of which depends upon sex of the individual
or inheritance of sex chromosomes. The transmission of such traits (or alleles responsible for
traits) is tied up or linked with the sex chromosomes; inheritance pattern of such genes is known
as sex-linked inheritance. The phenomenon is called as sex linkage.
Sex linkage was first demonstrated in 1910 by Morgan while working with white-eye
(mutant) Drosophila. He carried several breeding analysis with white-eyed male drosophila
and red-eye female drosophila. The F1 flies (male and female) are all red-eyed. On mating
F1 male and female, he found F2 flies with red-eye and white eye in the ratio of 3 : 1 in
accordance with Mendelian monohybrid ratio thereby concluding that white-eye colour is
recessive character. In Mendel’s cross, expression of recessive trait in F2 is not associated
with sex of the individual. Strangely, he observed that all F2 white-eye flies were male justlike their grandfather (Table 17.5).
Table 17.5: Summary of Morgan breeding experiment of cross between white eye male andred eye female
Morgan explained that the recessive allele must have been associated with X chromosome.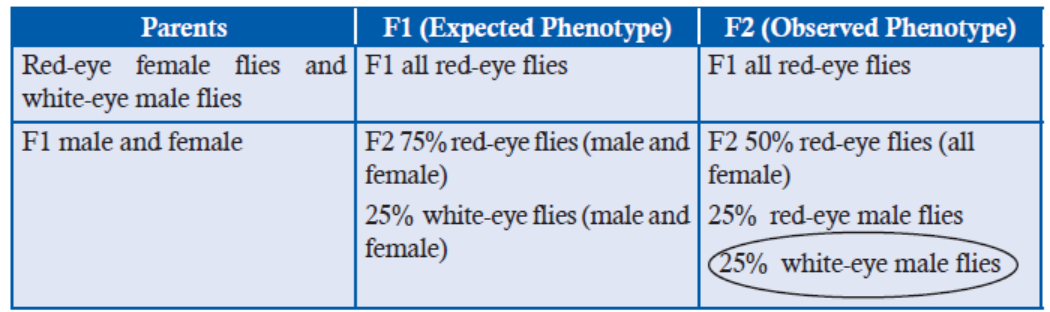
Males have one X chromosome only unlike female which carries two X chromosome so they
are hemizygous (only one allele for a gene) for X-linked genes.
In this experiment, white-eye male parent must have transferred its X chromosome to all F1
females and Y chromosome to all sons. F1 females are heterozygous carrying one normal
X chromosome with normal eye colour i.e., red and other X chromosome with white eye gene
while F1 males had one normal X chromosome from their mother, thus had red-eyed and
Y chromosome from father.
The F2 males obtained their X chromosomes from heterozygous F1 mothers. The half of the F2
males received normal X chromosome while other half received X chromosome with recessiveallele hence developed white-eyes (Figure 17.14).
Figure 17.14: A cross between F1 red-eye male and female representing sex-linked inheritance of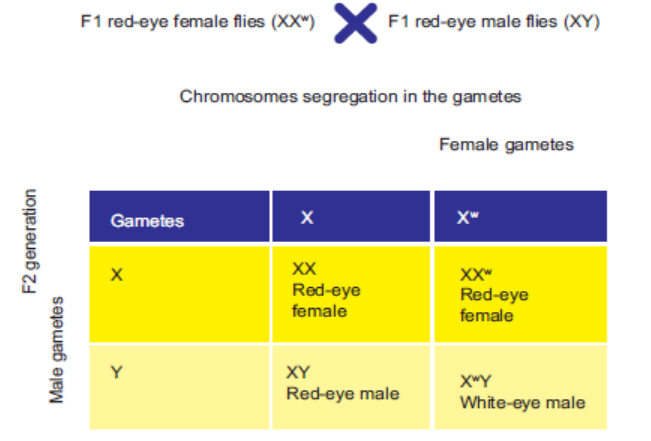
trait to F2 generation
Here, the characters are transmitted from male parent to grandson through carriers (heterozygous)
F1 daughter. Trait is recessive and X-chromosome linked. For this work, Mendel was awardedNobel Prize in 1933
17.8.1 Types of Sex Linkage
There are two types of sex-linked inheritance:
(1) Genes located on X chromosomes demonstrate X-linked inheritance. It is of two types’
X-linked recessive inheritance and X-linked dominant inheritance.
X-linked recessive inheritance, gene causing a mutant phenotype (variant phenotype)
is recessive. It is more common in male. As male has single X chromosome only, they
are pure for X-linked genes (hemizygous). While for female to express X-linked recessive
trait, both the X chromosome should carry recessive allele. Here, criss-cross inheritance
pattern is seen when recessive trait from male are transmitted through their daughter to
their grandson. For example:
• Hemophilia A in human, here individuals lack a clotting factor; thus, a minor cut
may cause excessive bleeding. It follows X-linked recessive inheritance.
X-linked dominant inheritance: Here, the gene causing for a mutant phenotype (variant
phenotype) is dominant. It is less common than X-linked recessive trait. Only a few
X-linked dominant traits have been identified. For example:
• X-linked hypophosphatemia is X-linked dominant trait that can cause bone deformity
in human.
(2) Genes located on Y-chromosomes demonstrate Y-linked inheritance.
Here, genes are transmitted according to inheritance of Y chromosomes. All males receive
Y chromosome from their father, so here Y-linked genes (hence their information) are
directly passed from father to son. This type of inheritance is also known as Holandric
(“wholly male”) inheritance.
It never appears in female. Y chromosome has very few genes. A few traits are Y-linked.
For example:• Hairy ears trait in human in which bristly hairs grow from ear.
ACTIVITY 9
Aim: If a colourblind man (XcY) marries a normal homozygous female (XX), what are the
chances of their progeny being affected with the disease?
Procedure:
• Make gametes from male and female.
• Draw Punnett square showing the random fusion of gametes to get F1 generation.• Observe the results and discuss among yourselves and class teacher.
17.9 GENETIC DISORDER
In humans, how can we study inheritance pattern of different genetic disorders? So here, we have
to study the history of families of person suffering from particular genetic disease by making a
tree or chart. Also, we can predict the chance of transmission of disease to future generation.
Genetic disorders are the diseases which are caused by abnormalities in genetic information
of the organisms. Genetic diseases are quite rare in population and their frequency varies from1 : 1000 to 100,000.
Types of Genetic Disease
Single gene disorder: caused by abnormalities in single gene so that its product becomes either
non-functional or abnormal. For example: haemophilia.
Polygenic genetic disorder: caused by abnormalities in more than one gene. For example:
cancer, diabetes etc.
Chromosomal genetic disorder: caused by change in the structure (deletion, duplication) or
number of chromosomes (chromosomes becomes high or less 47, 45 etc). For example: Turner’ssyndrome, klinefelter’s syndrome.
17.9.1 Single-gene Genetic Disorder
There are two types:
1. Autosomal-linked disorder: in this case, the affected gene is located on the autosomes
and it can be dominant and recessive.
In autosomal dominant, the affected gene allele is dominant in its expression. Only one
allele is sufficient to cause the disease in affected person. Affected person will have 50%
chance to pass it to offspring if he or she marries a normal person and it inherits in everygeneration in affected person’s family.
For example: Huntington’s disease is a neurodegenerative genetic disease that affects
muscle coordination.
In autosomal recessive, affected gene allele is recessive. Both copies of allele must be
recessive for a person to be affected by the disease. An affected person usually has
unaffected parents who each carry a single copy of the mutated gene.
For example: Albinism disease which is characterized by the complete or partial absence
of the pigment in the skin, hairs and eyes.
2. Sex-chromosome linked disorder: here the affected gene is located on the sex chromosome.
Inheritance of this genetic disorder depends upon sex of the affected person.
In X-chromosome dominant, the affected gene is dominant and present on the
X-chromosomes. The female with X-linked disease (XX*) when marries a normal man
(XY), has 50% chance of having an affected offspring.
The male with X-linked disease (X*Y) when marries a normal woman (XX), has all
affected daughters (XX*) but sons will be unaffected.
For example: X-linked hypophosphatemia which causes bone deformity.
In X-chromosome recessive, the affected is recessive and is present on the X-chromosome.
It is more common in males. The male with X-chromosome linked genetic disease will
have normal sons and daughter but pass trait to half of their grandson.
The female with one mutant allele and one normal allele (XX*) will have 50% chance of having
affected sons but 100% chance of unaffected daughters.
For example: Haemophilia
Y-linked genetic disease: It is caused by mutation in the gene located on the Y chromosome.
It only appears in male. The disease is always transferred from father to son.
For example: hairy pinna
17.9.2 Pedigree Analysis: Studies of Inheritance of Genetic Diseases in Humans
The inheritance pattern of different genetic diseases can be studied by pedigree analysis. It
involves collection of information about the family’s history for a particular genetic trait. Thenthe expression of trait is represented into a family tree (also known as Pedigree tree).
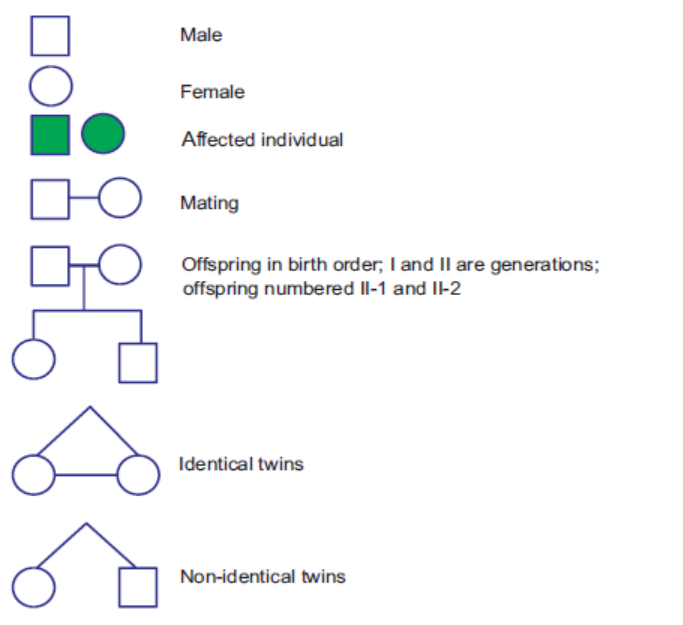
Figure 17.15: The symbols used in human pedigree analysis
In the tree, there are different symbols (Figure 17.15). The females are represented by circles
and males by squares. A horizontal line between circle and squares represent marriage. The
vertical line in middle of horizontal line represents their offsprings. The offsprings are written
from left to right in the order of birth. The solid symbols represent the particular genetic diseasestudies while open symbols represent unaffected individuals.
Hypothetical Pedigree for Different Genetic Traits
Based on the transmission of genetic trait, the different pedigree can be made.
(a) Recessive pedigree: if an affected person has unaffected parents, it indicates that
nature of affected gene is recessive. It can be autosomal or sex-linked.
If it appears randomly in male and female, then it is autosomal (Figure 17.16 (a)).
If affected person is mostly males, then it might be sex-linked recessive genetic trait(Figure 17.16 (b))
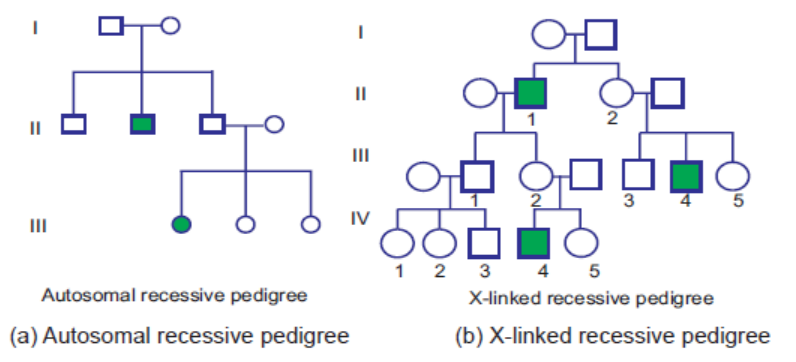
Figure 17.16: Recessive pedigree
(b) Dominant pedigree: if an affected person has affected parents and traits appears
almost in every generation, it indicates that nature of affected gene is dominant. It
can be autosomal or sex-linked.
If it appears randomly in male and female, then it is autosomal (Figure 17.17 (a)).
If trait is passed on every generation but differentially transmitted based on sex of
the affected person, then trait is X-linked dominant (Figure 17.17 (b)).
An affected father will pass the disease to all of his daughters. An affected motherwill pass the trait equally to her sons and daughters.
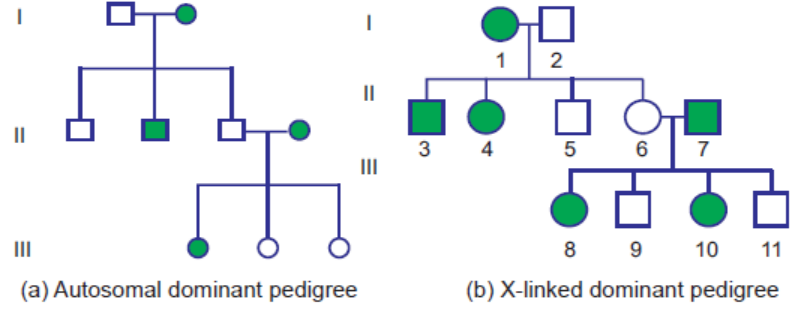
Figure 17.17: Dominant pedigree
17.9.3 Significance of Pedigree Analysis
(a) Pedigree analysis is very useful to find out nature of genetic trait in family.
(b) It is useful to study the inheritance pattern of traits in organisms in which there is
long generation time, especially in humans.
(c) Pedigree analysis is used by genetic counsellors to advise couples about the possibilityof having genetically defective children when a defect runs in their family.
APPLICATION 17.3
1.Choose the correct statement or complete with appropriate terms: (i)
(i)
The following pedigree shows: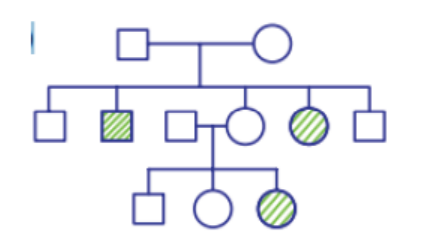
(a) Inheritance of a recessive sex-linked disease like haemophilia.
(b) Inheritance of a sex-linked inborn error of metabolism like phenylketonuria.
(c) Inheritance of a condition like phenylketonuria and autosomal recessive trait.
(d) The pedigree chart is wrong.
(ii) ........... disease affects muscle coordination. It is a neurogenetic digenerative disease.
(iii) In turner’s syndrome ............... .
(iv) ..................... is the failure of homologous chromosomes to seggregate at anaphase.
2.
a) State and explain the second law of Mendel.
b) Manx cats do not have tails. When a Manx cat is mated with a normal long tailed
cat, approximately half the offspring are long tailed and approximately half are
Manx. When two Manx cats are mated, the ratio of phenotypes of the offspring
is 2 Manx to 1 long tailed cat.
i. What does this suggest of the Manx condition in cats?
ii. Show the inheritance of Manx condition when two Manx cats are matedACTIVITY 10
17.10 SUMMARY
• Inheritance/heredity is the phenomenon of transmission of traits from parents to offspring.
• Mendel conducted breeding experiments in garden pea to study inheritance pattern of
several traits. He found that the first generation progeny always exhibited one of the parentaltrait (dominant) while the second generation progeny exhibited both the forms of trait
dominant and recessive in 3 : 1 ratio, popularly known as phenotypic monohybrid ratio.He postulated that there are two factors for each trait, the factors segregate (principle of
segregation) at the time of gamete formation and reunite in zygote.
• Mendel’s factors are now known as gene, two alternate forms are known as alleles. Mendel
also devised a test cross which helps us to differentiate pure dominant form from the
hybrid dominant form. Chi-square test is used to analysis genetic data when observed
data has deviation from the expected value. We can find out whether there is significant
deviation from the expected value or not.
• Mendel carried out dihybrid cross where parent plants differ in contrasting form of two
traits. He found that F1 plants exhibited dominant form of both traits and F2 plants
exhibited four types of phenotypes (two parental types and two new recombinants) in
the dihybrid ratio of 9 : 3 : 3 : 1. He concluded that factors of different traits segregate
and assort independently in the gametes (principle of independent assortment). Mendel’sfactors or genes are found to be located on chromosomes.
• In population there can be more than two alleles (multiple allele), although a particular
individual will have two alleles. Sometimes both the alleles are equally expressed (codominance)
as in ABO blood type. There can be incomplete dominance where one form
is not completely dominant. Also, sometimes allele is lethal which leads to the death of
the individual. Also, one gene may influence the expression of another gene. It leads tovariation in Mendelian ratio.
• The genes located on the same chromosomes, inherit together the phenomenon is called
as linkage. The genes located on the same chromosome occasionally assort independently
via the physical phenomenon known as crossing over. The frequency of crossing over
increases as distance between gene loci on the chromosome increases, so the frequency
of recombinant will vary. It also helps in finding the distance between gene loci ( chromosomemap).
• Sex determination in humans is determined by the presence of Y chromosome. The
“Y” chromosome plays an important role in determining maleness. It has gene testis
determining factor (TDF) which initiates the sequence of events required to differentiateprimordial gonadial tissue into testis.
• The genes located on sex chromosome (X and Y chromosome), demonstrate sex linkage.The inheritance of such traits depends on the sex of the individual.
• The genetic diseases may happen due to changes in genes or chromosomes on which
genes are located. The inheritance of genetic disease caused by genes can be traced
by pedigree analysis which involves collection of information about the expression ofparticular genetic trait in the family’s history.
17.11 GLOSSARY
• Alleles: There are two genes which occur on the same locus in homologous chromosomes
and centrails due expression of a trait or character in an individual.
• Character: It is a feature of an individual for example, stem height, flower colour, seed
shape etc.
• Dominant gene: Gene which always expresses itself in presence of its contrasting allele.
• F1 generation: It is generation of hybrids produced from a cross between two true breeding
potental forms.
• F2 generation: It is a generation of individuals, which arises as a result of inbreeding of
individuals of F1 generation.
• Gene: A unit of heredity.
• Genotype: It is the genetic constitution of an organism.
• Recessive gene: A gene which fails to express itself in presence of its contrasting dominant
allele.
• Phenotype: It is expressed on observable characteristics of an organisms.
• Trait: It is an inherited character and its detectable variant. For example, tall and dwarfvariant of stem height.
END UNIT ASSESSMENT 17
Do all these exercises in your exercise book.I. Choose whether the following statements are True (T) or False (F)
1. Heredity is the transfer of traits from one parent to offsprings.
2. In the monohybrid cross between tall and dwarf plants, second generation plants
were all tall.
3. In codominance, both the alleles of gene are equally expressed.
4. The genes located on same chromosomes are always linked and never assort
independently.
5. In humans, XXY individual will be male.
6. In recessive genetic diseases, affected person can have one affected and another
unaffected homozygous parent.
7. The frequency of crossing over increases as distance between the linked genes
decreases.
8. The sex linkage phenomenon was first observed in Drosophila.
9. In pedigree analysis, the dominant traits are observed every generation.10. Non-disjunction of chromosomes can happen at meiosis and mitosis.
II. Multiple Choice Questions
1. Which of the following reasons are true for Mendel’s success?
(a) He studied many traits at one time
(b) He worked with pure lines
(c) His model organisms were Homo sapiens
(d) He was a chemist
2. Offsprings produced during first progeny are also known as:
(a) F1 generation (b) F2 generation
(c) F3 generation (d) P generation
3. Mendel was successful in his experiments because garden pea:
(a) Produces large number of offsprings
(b) Has long reproduction cycle
(c) Does not show self-pollination
(d) Has difficulty to grow
4. A gamete has ........ number of alleles for a particular gene:
(a) 0 (b) 1
(c) 2 (d) 3
5. The Phenotypic Mendelian monohybrid ratio can be described as:
(a) 3 : 1 (b) 1 : 2 : 1
(c) 2 : 1 b (d) 2 : 2
6. What is Semi-dominance
(a) When both the traits are expressed
(b) When both traits are partially expressed
(c) When both traits are not expressed
(d) When only one trait is expressed
7. A cross between two plants with two pair of contrasting traits is commonly known as:
(a) Monohybrid cross (b) Dihybrid cross
(c) Trihybrid cross (d) Tetra-hybrid cross
8. Test cross is a cross between
(a) F1 hybrid with any of the parent
(b) F1 hybrid with recessive parent
(c) F1 hybrid with other individual similar to parent
(d) None of the above
9. Genetic makeup of Klinefelter syndrome is
(a) 44 autosomes + XXY (b) 44 autosomes + XXX
(c) 44 autosomes + XXXX (d) 44 autosomes + XY
10. Huntington’s disease in humans is the example of:
(a) Autosomal dominant genetic disease
(b) Autosomal recessive genetic disease
(c) X-linked dominant genetic disease
(d) X-linked recessive genetic disease
III. Long Answers Type Questions
1. Explain the terms gene, locus, allele, dominant, recessive, co-dominant, linkage, test
cross, F1 and F2, phenotype, genotype, homozygous and heterozygous.
2. Explain how to conduct a test cross.
3. Explain why monohybrid ratios of 1:2:1 occur.
4. Describe an example of inheritance involving multiple alleles.
5. Explain the effect of lethal genes on phenotype ratios.
6. Give a genetic explanation of Mendelian dihybrid inheritance.
7. Explain the use of test crosses to determine unknown genotypes in studies of dihybrid
inheritance.
8. Explain the significance of recombination.
9. Explain how the sex is determined in humans and the role of sex related Y genes in
determining sex.
10. Describe how the non-disjunction can affect the distribution of sex chromosomes in
gametes and offspring.
11. Explain why the linked genes do not show independent assortment.
12. Explain how crossover values can be used to make a chromosome map.
13. How can genetic studies by supportive for environment protection? State the role of
different genetic aspects to list and cure diseases since ages. What relevance can be
cited to support genetics as an important branch of biology?
14. A man claims to be the father of a child who is blood group AB. The man is blood
group O and the mother of the child is blood group A. State with reasons whether
the man could be the father of the child.
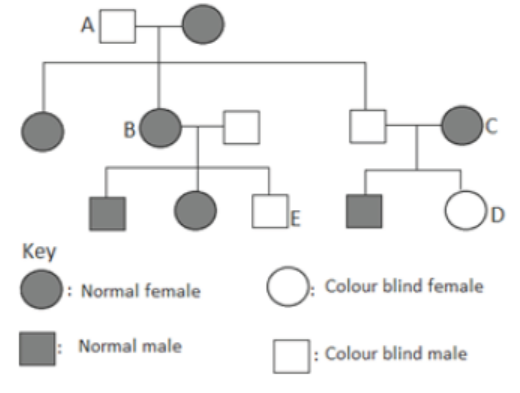
15. Red-green colour blindness is sex-linked recessive condition. The gene of colour
blindness is carried on the X-chromosome. The figure below shows a family tree.Workout the genotypes of the individuals labelled A – E.