UNIT 1: INTRODUCTION TO BIODIVERSITY
Key Unit Competence
Explain how diversity is threatened by climate change and human activities
Learning objectives
By the end of this unit, I should be able to:– Define the terms: species, ecosystem and niche.
– Explain that biodiversity is considered at three different levels
– Evaluate the consequences of loss of biodiversity.
– Characterize the biotic and abiotic components that define Rwanda’s
ecosystems (example: freshwater, marine, and terrestrial).
– Apply Simpson’s Index of Diversity.
– Explain the importance of random sampling in determining the biodiversity
of an area.
– Use suitable survey methods such as frame quadrats, line and belt transects to
assess the distribution and abundance of organisms in a local area.
– Use Pearson’s linear correlation to analyze the relationships between the
distribution and abundance of species and abiotic or biotic factors.– Recognize that the biodiversity of the earth is threatened by human activitiesIntroductory activity: Biodiversity of Rwandaand climate change
Read the following text and answer the questions that follow
Rwanda is located at the heart of the Albertine Rift eco-region in the western
arm of the Africa’s Rift Valley. Habitats of Rwanda are equally varied, ranging from
Afro-Montana ecosystems in the northern and western regions to lowland forests,
savannah woodlands and savannah grasslands in the southern and eastern
regions. There are other habitats around volcanic hot springs and old lava flows,
especially in the northern and western part of the country.
Rwanda also has several lakes and wetlands which are rich in different species.
Though not yet well surveyed, all these ecosystems host a rich variety of fauna and
flora and micro-organisms. This rich biodiversity is mainly conserved in protected
areas including three national parks, natural forests and wetlands. These cover
almost 10 percent of the national territory while the rest of the country is densely
populated (507 people per square kilometer in 2018).
Many tourists visit Rwanda for its beautiful environment and biodiversity made
of different species of plants and animals such as Aloe vera (Igikakarubamba),
Muringa oleifera (Muringa), Phaseolus vulgaris (common bean), Nymphaea
thermarum (Endemic plant species that cannot be met elsewhere in the world,only found in Mashyuza minor locality harbors),
Colobus polykoma (White-black colobus monkey), Gorilla gorilla (mountain
gorilla) bird Laniarius mufumbiri (Bird species mainly found in Rweru- Mugera
wetland),etc.
The most attracting species in Rwanda is Gorilla gorilla whose habitat is the
mountains of Birunga where they make a large population. Another natural forest,
Nyugwe National Park is a terrestrial ecosystem that contains a large community
of different plants and animals.
Rwanda also has different lakes such as Muhazi and Rumira. They are aquatic
ecosystems made of few species of fish, such as tilapias. Tilapias from Lake Muhazi
are small, black and bony fish while those from Lake Rumira look red, big and soft.Tilapias from both lakes still belong in the same species but show variations.
Many species of animals and plants have been discovered in Rwanda but some
species also disappeared. Today the big garden snails known as Achatina achatina
have become rare in Bugesera. Other people poached Rhinoceros alba living in
Savanah of Akagera National Park.
Honey bees, butterflies and grasshoppers are small in size but still important for
different ecosystem services. Each organism is important for its niche in ecosystem.
We need to identify and protect the biodiversity of our ecosystem. Many tourists
enjoy visiting Rwanda for its biodiversity.1. Name the species not found elsewhere that attract the tourists and locate1.1. Meaning of key ecological terms and biodiversity
where it is found.
2. Mashyuza is a minor locality in western province in Rusizi district that
contributes to biodiversity of Rwanda. Give any other two locations.
3. Define each of the following biological terms and give an example from
the text
abovea) Species (b) Population (c) Community (d) Habitat (e) Ecosystem
(f)Variation (g) Niche
4. What causes some species to become extinct?
5. What can be the consequences of the loss of some species from our
biodiversity?6. Do you support tourism in Rwanda? Give a reason to justify your answer.
Activity 1.1
Using addition resources to your textbook available in your school such as the
books from the school library and search further information from the internet:
1. Describe the following terms: biodiversity, species, niche, population, and
community?2. Differentiate between ecological niche and habitat.
1.1.1. Key ecological terms
Species is a group of closely related organisms which are capable of interbreeding to
produce fertile offspring. Occasionally two organisms which are genetically closely
related but not of the same species can interbreed to produce infertile offspring. For
example:– A cross between a donkey and a horse produces a mule, which is infertile.
Thus, a donkey and a horse do not belong to the same species
– Lions and tigers belonging to different species. However, when a male tiger
mates with a female lion they can have fertile offspring called tiglons, althoughthe offspring of female tigers and male lions called ligers are not fertile
Note that normally, tigers are forest dwellers and lions are plains dwellers and they
are ecologically isolated. Breeding has only been observed in captivity.
An ecological population is a group of individuals of the same species which live in
a particular area at any given time.
An ecological community consists of populations of different species which live in
the same place at the same time, and interact with each other.
A habitat is a specific area or place in which an individual organism lives. When a
habitat is very small it is regarded as a microhabitat. Most ecosystems contain
several habitats, and one species can have more than one habitat constituting its
geographic range.
An ecological niche is the status or the role of an organism in its habitat or the mode
of life of an organism within its habitats. For example, insects are pollinating agents
and preys of insectivores.Biotic factors are the living organisms in the environment. They include organisms
Abiotic factor are non-living physical aspects of the environment such as thesunlight, soil, temperature, wind, water, and air.
and their interactions with each other.
An ecosystem is a natural unit consisting of biotic and abiotic factors through
which energy flows and nutrients recycle. In an ecosystem, nutrients pass between
different organisms in definite pathways. For example, nutrients in the soil are taken
up by plants, which are then eaten by herbivores, which in turn may be eaten bycarnivores and recycled by decomposers.
A biome is a group of ecosystems that have the same climate and similar dominant
communities. The highest level of organization is the entire biosphere.
The Biosphere is the whole of the earth’s surface, the sea and the air that is inhabited
by living organisms. The biosphere is made up of all ecosystems.
1.1.2. Biodiversity
Biodiversity is defined as the full range of variety and variability within and among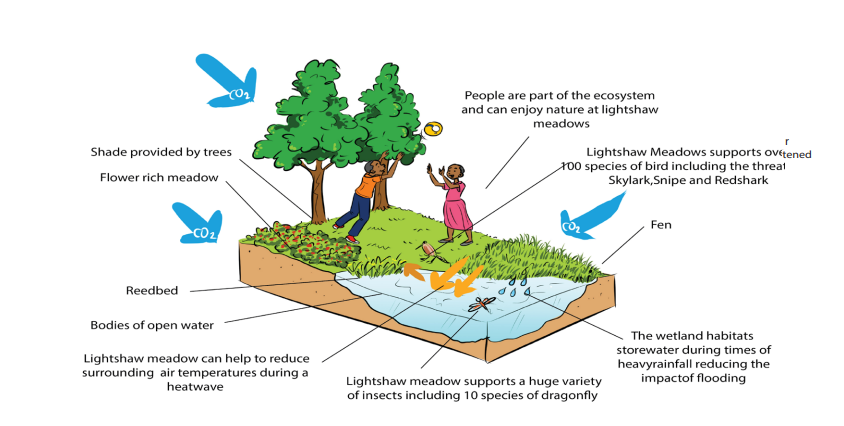
living organisms and the ecological complexes in which they occur.
Self-assessment 1.1
1. Describe the two main components of an ecosystem.
2. Hippopotamus has different habitats. It was found that the resting
habitat is different from the mating habitat, and these two habitats
are different from the area where this animal gets food. Explain theecological term given to this set of habitats.
1.2. Identification of biodiversity
Activity 1.2
Use books or other sources of information to answer the followings questions:
1. What kinds of initiatives and incentive mechanisms are put in place by
the Government of Rwanda to motivate local community in biodiversity
conservation?
2. Describe different ways used to identify biodiversity.
3. Discuss the values of biodiversity and ecosystem services in Rwanda.
4. Evaluate the contribution of biodiversity to human well-being.
1.2.1. Categories of biodiversity
Biodiversity can be categorized into three groups:– Genetic diversity: the combination of different genes found within a1.2.2. Importance of biodiversity
population of a single species, and the patterns of variation found within
different populations of the same species.
– Species diversity: the variety and abundance of different types of organisms
which inhabit an area.
– Ecosystem diversity: the variety of habitats that occur within a region, or withinthe mosaic of patches found within a landscape.
Biodiversity contributes to ecosystem goods and services. The ecosystem goods and
services include:– Provision of food, air, fire wood, medicines(Fig.1.2), energy, fresh water.
– Nutrient cycling such carbon, water and nitrogen cycles by microorganisms
and primary production by photosynthesis.
– Cultural or aesthetic service recreation, ecotourism, cultural and religious
inspiration.
1.2.3. The threats and consequences of biodiversity loss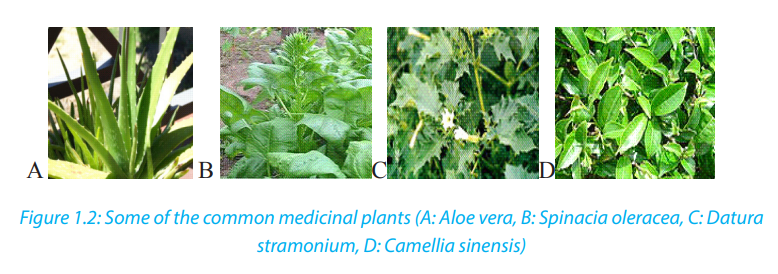
1.2.3.1. Causes of biodiversity loss
The main causes of biodiversity loss can be attributed to the influence of human
activities on ecosystems. Threats to biodiversity include:
a. Habitat loss and the degradation of the environment
The habitat loss and the degradation of the environment occur in different ways.
The most occurring, are tree cutting, agriculture and fires (Figure1.3). These human
activities lead to the alteration and loss of suitable habitats for biodiversity. As a
consequence, there is a loss of plant species as well as the decrease in the animalspecies associated to this plant diversity.
b. Introduction of invasive alien species and genetically modified organisms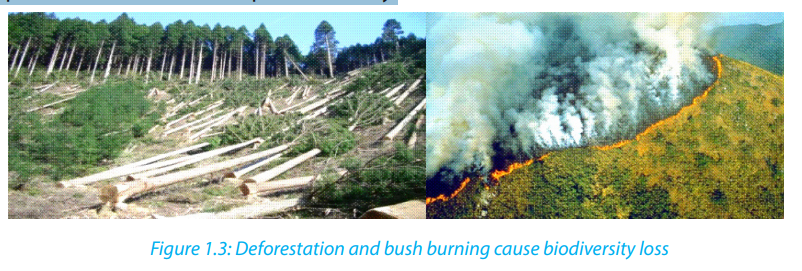
Species originating from a particular area are harmful to native species also called
endemic species when they are introduced into new natural environments. They
can lead to different forms of imbalance in the ecological equilibrium, so that
endemic species may fail to compete with introduced species, and they may affect
the abundance and distribution in natural habitat.
c. Pollution
Human activities such as excessive use of fertilizers, and increased pollutants from
industries and domestic sewage affect biodiversity. They contribute to the alteration
of the flow of energy, chemicals and physical constituents of the environment and
hence species may die as a result of toxic accumulation.
d. Overexploitation of natural resources
Increased hunting, fishing, and farming in particular areas lead to the decrease and
loss of biodiversity due to excessive and continuous harvesting without leaving
enough time for the organisms to reproduce and stabilize in their natural habitat.
e. Climate change
This is a change in the pattern of weather, related changes in oceans, land surfaces
and ice sheets due to global warming resulting from man’s activities. Increasing
global temperatures have resulted into melting of icebergs raising sea levels and soflooding coastal areas eventually affecting the niche.
1.2.3.2. Consequences of loss of biodiversity
They are various consequences of loss of biodiversity that include:– Desertification, is thought by scientists to be a consequence of climate change,Self-assessment 1.2
has been considered to be related to deforestation. Disrupting water cycles
and soil structure results into less rainfall in an area.
– Floods as a result of rising sea levels
– Habitat destruction for extensive farming, timber harvesting and infrastructure
and settlement
– Decrease in food production as result of change in pattern of weather that
affects productivity
– Large scale deforestation has a negative effect on nutrient recycling and can
accelerates soil erosion– Diseases that come as effects of floods and malnutrition due to famine
1. Define the term Extinction.1.3. Calculation of Simpson’s index
2. Suggest the causes of extinction of species in Rwanda.
3. Discuss the benefits of biodiversity to humans
4. Discuss the major factors leading to the degradation of ecosystems in
Rwanda
5. Discuss the contribution of ecosystems to cultural traditions in Rwanda.
6. In Rwanda different plants are used in traditional medicine to treat different
diseases. Conduct a research and list at least 20 medicinal plants and the
diseases they treat. From the list above describe at least one medicinal
plant and get ready to present your work. The project work should include:
written content of 2 pages in minimum and 4 pages in maximum, a
testimony of people that have used plant species.
7. Pollution is one of the causes of aquatic biodiversity loss.
a. What do you understand by water pollution?
b. Outline human activities that contribute to water pollutionc. Discuss how polluted water affects aquatic living organisms?
Activity 1.3
A survey on tree species was conducted in Gako forest by a group of students.
Five tree species (A to E) were identified and counted. The numbers found duringthis exercise are summarized in the following table:
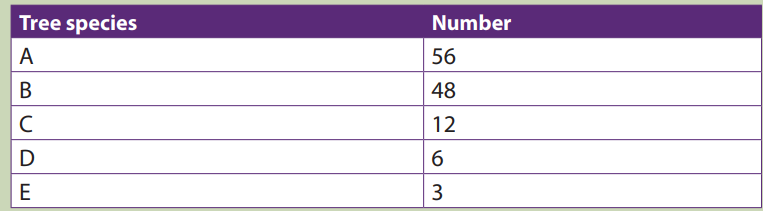 1. Describe the relative abundance of species A to E.There are many ways to measure diversity. The Simpson diversity index among
2. Based on the data in the above table, suggest how species diversity of treespecies can be calculated.
indices used to measure diversity. It is expressed in three related indices namelySimpson index, Simpson index of diversity and Simpson reciprocal index.
a. Simpson index D
Simpson index D can be expressed in two ways and takes into consideration the
total number of organisms of a particular species and the total number of organisms
of all species. It is calculated as follows: D =1-∑ (n/N) 2 or D = , with n: the total
number of organisms of a particular species and N: the total number of organisms
of all species. When the index equals or is nearby 0 there is an infinite diversity
of considered species. When it equals or is nearby 1, this means that there is no
diversity. The bigger the value of D, the lower the diversity and small is D, the biggeris the diversity.
b. Simpson index of diversity 1 – D The value of this index ranges between 0 and
1, but now, the greater the value, the greater the sample diversity. This makes
more sense. In this case, the index represents the probability that two individuals
randomly selected from a sample will belong to different species.
c. Simpson reciprocal index 1 / D
Another way of overcoming the problem of the counter-intuitive nature of Simpson’s
index is to take the Simpson’s reciprocal index 1 / D. The value of this index starts with
1 as the lowest possible figure. This figure would represent a community containing
only one species. The higher is the value of Simpson reciprocal index, the greater the
biological diversity.
Examples
1. In woodland, a quadrat was sampled for ground vegetation. Data collected were
recorded in the table 1.3.2. Find out the value of the Simpson index and draw the
conclusion about the biological diversity of the sampled area.Table 1.3.1: Recorded data on the vegetation from a woodland
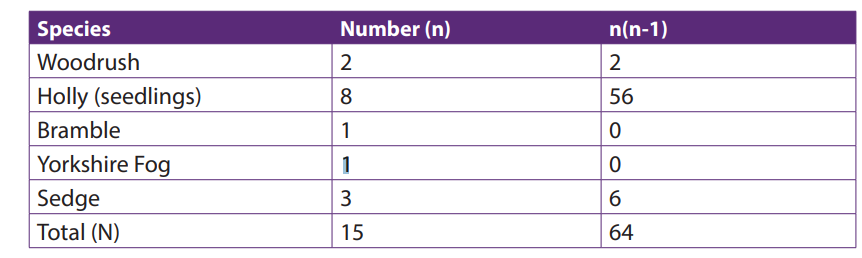
Solution: Putting the figures into the formula for Simpson’s Index:
Based on the meaning of Simpson index, the quadrat presents a low diversity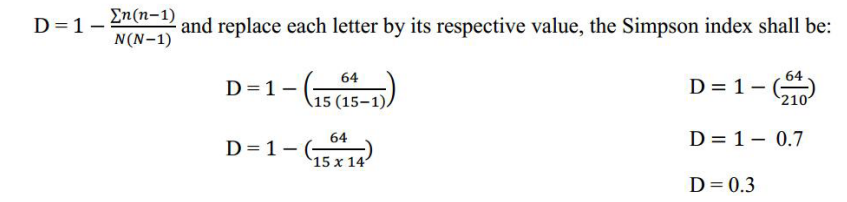
because the value of D is near zero and zero and below 0.5.
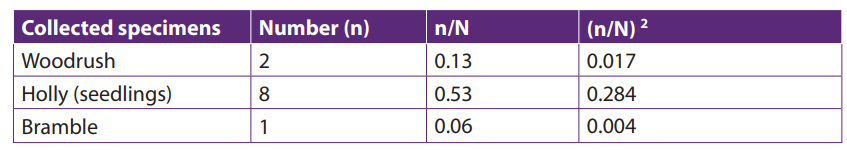
2. Calculate the value of Simpson’s Diversity Index (D) for a single quadrate sample
of ground vegetation in woodland from which the following sampling date wasobtained:
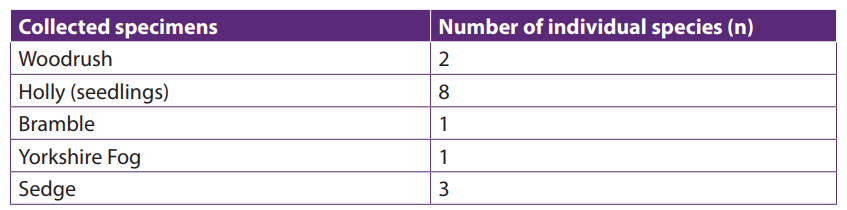
Solution:
Self-assessment 1.3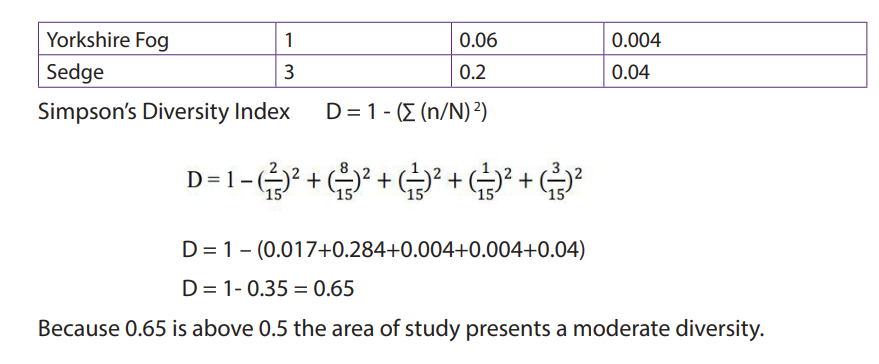 1. Differentiate between species richness and species evenness
2. Suggest precautions taken when measuring populations of aquatic animals
or plants.
3. Explain why a habitat with high diversity tends to be more stable than one
with lower diversity.
4. In a survey of trees in a tropical forest, students identified five tree species
(A to E).
They counted the numbers of trees in an area 100 m × 100 m and found
these results:
Calculate the Simpson’s Index diversity for identified species and explain the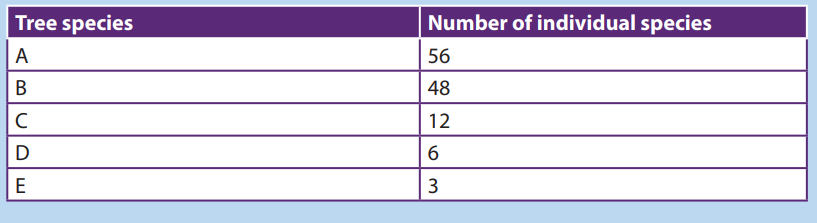
advantage of using data on species diversity and abundance when calculating an
index of diversity.5. The Simpson’s Index of diversity for vegetation in an open area inhabited1.4. Sampling techniques to assess the distribution and
by grasslands was 0.8. For a similar sized area of vegetation beneath someconifer trees it was 0.2. What do you conclude from these results?
abundance of organismsActivity 1.4
From your school garden, sample different flowering plant species and answer
the following questions:
1. Specify the techniques used for collecting flowers of different species.To calculate Simpson’s index for a particular place:
2. What are the advantages of the technique you used for data collection?
3. Move around the school garden and collect different specimens of plant
species. Name the collected species by using their names. In case you don’t
know their names, use letters A, B, C ….
Calculate Simpson index D, Simpson index of diversity and Simpsonreciprocal index.
– Identify the habitat to be studied.To analyze the distribution and abundance of organisms in an area of study, there
– The number of individuals sampled for each species must be recorded.
are different sampling methods.
Note that, sampling only one quadrat would not give reliable estimate of thediversity of the ground flora in the wood.
a. Random sampling method
A random sampling method is a sampling method where samples are taken from
different positions within a habitat and those positions are chosen randomly.
b. Quadrat sampling method
A quadrat is a square area that is marked using a pre-made square of plastic, or
stakes and string and it can range in size. Different species and their numbers within
the quadrat are counted. Counting is repeated many times in different places in the
habitat to get an accurate representation of biodiversity.
c. Frame quadrats
Frame quadrats are small plot used to isolate a standard unit of area for the study
of the distribution of an item over a large area. While originally rectangular, modern
quadrats can be rectangular, circular, and /or irregular. The quadrat is suitable for
sampling plants, slow-moving animals such as millipedes and insect and some
aquatic organisms.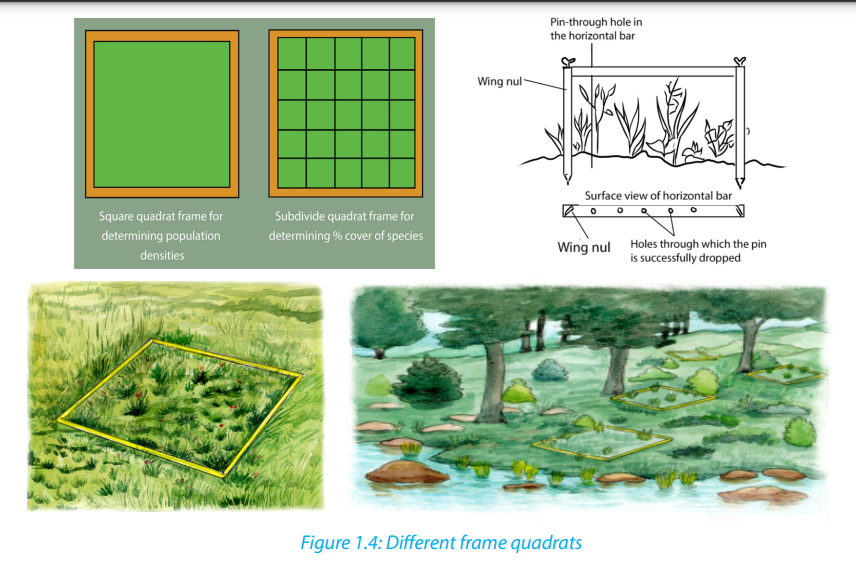
d. Transect sampling
Transect sampling is done using a transect line, which is usually a rope or measuring
tape that has been marked at set intervals, such as every meter. The line is unrolled
within the habitat. At every interval, the type and number of species along the
line are recorded. A measured line is laid across the area in the direction of the
environmental gradient. The species touching the line can be recorded along the
whole length of the line (continuous sampling) or at specific points along the line(systematic sampling).
e. Belt transects method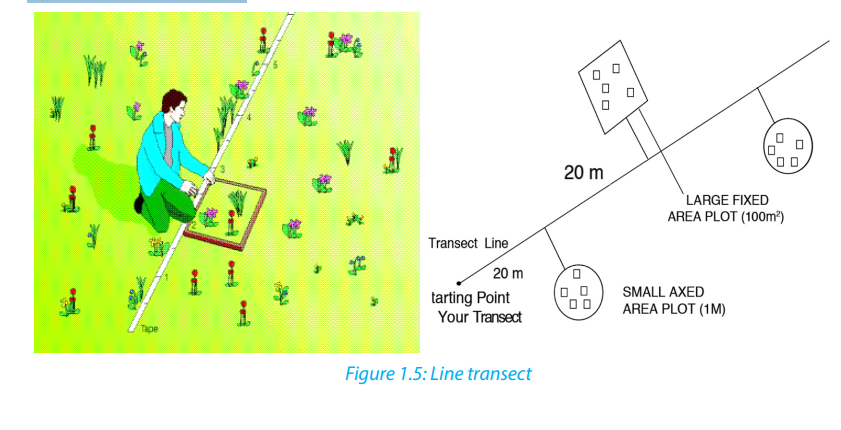
Belt transects method is the same as the line transects but widens the sampling
area. The samples are taken and the abundance, percentage cover in a defined areadetermined. Samples can be taken within the belt.
f. Netting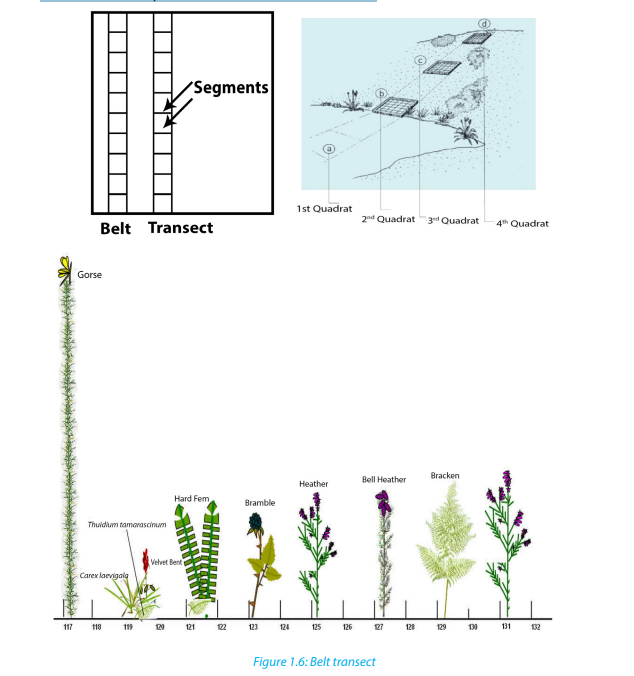
Netting is a sampling method where fine mesh nets are used to capture different
organisms that include insects, birds and bats. The technique is also used forsampling small aquatic organisms like daphnia, and water boatman.
g. Capture -recapture technique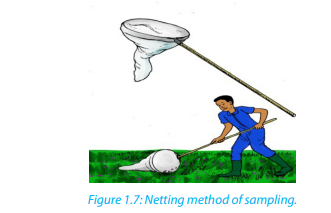
This method is useful for sampling non-fixed population and is suitable for animal
such as fishes, birds, lizards and insects. A sample of the population to be studied is
first captured and each individual is marked with a spot for identification. These are
then released and given enough time to mix up with the rest of the members in the
habitat. After a certain period of time, another sample is taken.
During the mark-release-recapture technique, the total population can be estimated
by the use of the formula: , where
n1 is a number caught and marked in first sample,
n2 is a number caught in second sample
n3 is a number in the second sample that had been marked.
To understand this application, let us use the following examples:1. A team of students used a sweep net to sample brown grasshoppersSolution
and each collect insect was marked with a very small spot of non-toxic
waterproof paint and then they were released in the field. The next day, a
second large sample was conducted and data were recorded as follows:
number of caught and marked in first sample (n1) = 247, number of caught
in second sample (n2) = 269, and the number in the second sample that hadbeen marked (n3) = 16. What is the number of estimated population?
The estimated number =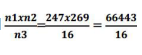 = 4152 grasshoppers
2. A student collected 16 butterflies which he marked and released. For a second
time he collected 18 butterflies among which 12 were already marked from thefirst sampling. Estimate the population size of butterflies in that area.
Solution
The estimated number
Self-assessment 1.4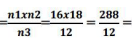 24 butterflies
1. Explain the advantages of the random sampling techniques.
2. Use suitable methods, such as frame quadrats, line transects, and belt
transects, to assess the distribution and abundance of insect species in a
school garden. Record your data and use the Simpson index of diversity (D)
to calculate the diversity of collected insects.
3. Suggest the benefits of using the following sampling techniques:a. Quadrats4. State the conditions in which quadrats, transect and mark recapture are
b. Transect
c. Mark-capture-recapturesuitable sampling methods.
1.5. Pearson’s linear correlation
Activity 1.5Some of the following figures indicate a positive, negative or non-correlation.
1. What do you understand by the term correlation?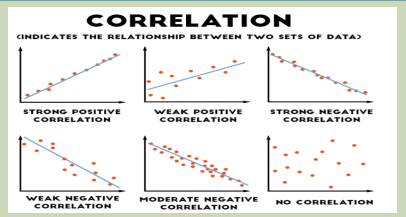
2. Categorize the graphs given as positive, negative or weak or no correlation
3. In which conditions results can indicate a positive correlation?
4. Conclude about your results when there is no correlation.
To decide if there is an association between collected data, a correlation coefficient
is calculated and plot scatter graph drawn in order to make a judgment. The
strongest correlation is present for studied items when all the points lie on a straightline. In this case, there is linear correlation, and the correlation coefficient equals
1. If a given variable X increases so does another variable Y, the relationship is a
positive correlation. If a variable X increases while the variable Y decreases, then
the relationship is a negative correlation. A correlation coefficient of 0 means there
is no correlation at all. These correlation coefficients are ways to test a relationship
observed and recorded to see if the variables are correlated and, if so, to find thestrength of that correlation.
a. Pearson’s correlation coefficient
Pearson’s correlation coefficient can only be used where there might be a linear
correlation and when there are collected quantitative data as measurements (for
example, length, height, depth, and light intensity, mass) or counts (for example
number of plant species in quadrats). The data must be normally distributed.
Where: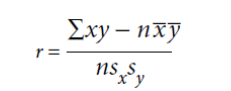 r is the correlation coefficientSelf-assessment 1.5
x is the number of species in a quadrat
y is the number of species in the same quadrat
n is the number of readings (From1 to n)
x is the mean number of species
y is the mean number of species
sx
is the standard deviation for x
s
yis the standard deviation for y
Use Pearson’s linear correlation to analyze the relationships between thedistribution and abundance of species and abiotic or biotic factors.
End of unit assessment 1
Section A: Answer as true or false1. Abiotic factors are the non-living physical aspects of the environment.
2. Capture –recapture is a method used to integrate the numbers of mobile
animals in a particular place.3. A correlation coefficient of 0 means that there is no correlation at all.4. A sample is a portion, piece, or segment that is representative of a whole
area of study.5. In the Simpson’s index, N represents the total number of organisms of aparticular species
Section B: Long and short answer based questions
1. What do you understand by the term biodiversity?
2. What do you think would happen to plants if there were no insects?
3. Suggest different ways to conserve our forests.
4. A student has randomly collected 5 types of species at the followingfrequencies.
Calculate the Simpson’s diversity index of this community.
5. A team of students conducted the capture- recapture sampling method
of tilapia from lake Muhazi at different times of the day as recorded in thedata below:
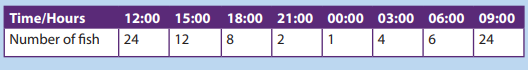 a. Plot the graph for the date provided and describe the shape of the6. What do you understand by term endangered species?
graph.
b. From the graph, determine the appropriate time to have the most
catch.
7. Describe how diversity is threatened by climate change and humanactivities