General
- UNIT 1 MARKET STRUCTURES File Uploaded 2/11/21, 16:15
Key unit Competency: Analyse the operation of firms under different market structures.
INTRODUCTORY ACTIVITY
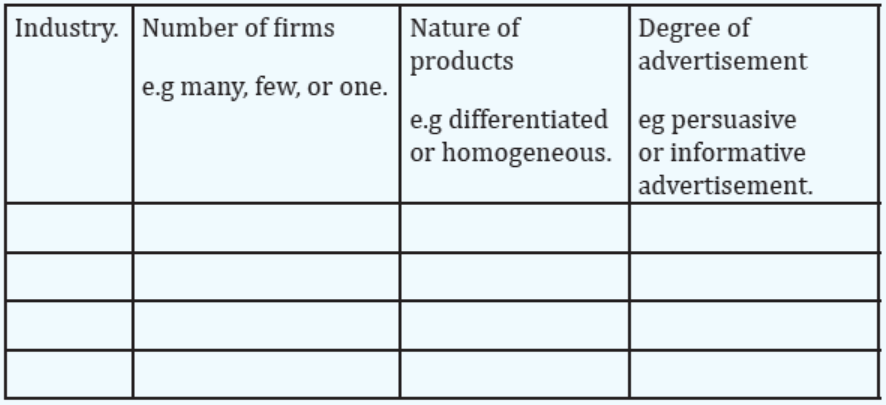
Rwanda has many industries operating in different forms. Given the table below, analyze these industries in terms of their number, the nature of products they produce and the degree of advertisment, arrange your findings in a table to enable you categorize according to their similarities.
INDUSTRIES:
Air travel industry; Hotel industry; Banking industry; Water and sanitation services; Petroleum products industry; Newspaper industry; Hydro power industry; Telecommunication industry;
1.1. Introduction to market structure
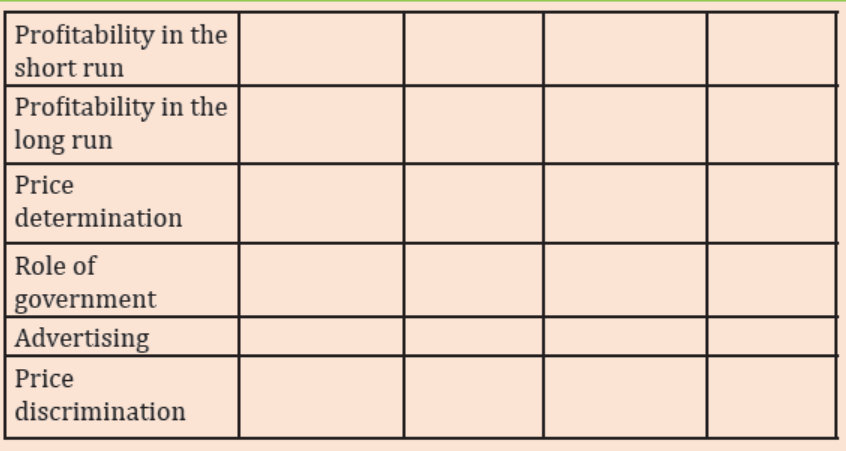
ACTIVITY 1.1
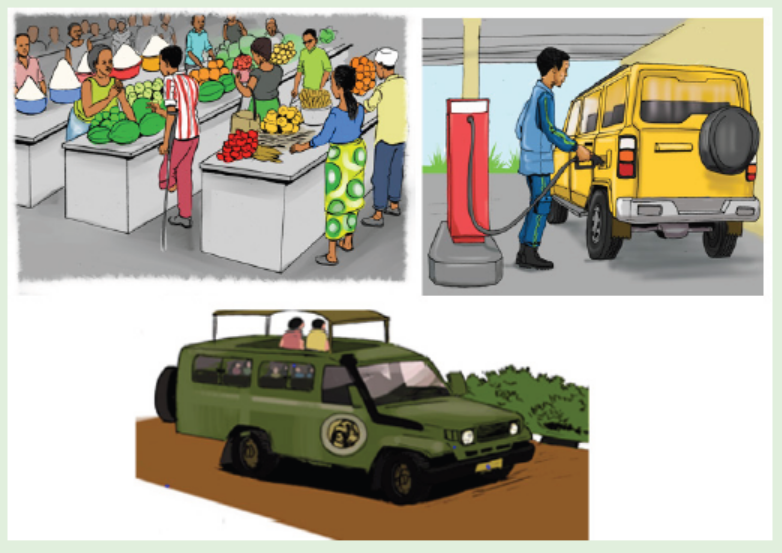
Analyse the activities taking place in the pictures below. Identify the commodities being sold in there.
Do you notice any relationship between the markets in the pictures in terms of nature of commodities sold and the number of firms dealing in these commodities etc. Then identify the type of market structures in the picture shown below.
1.1.1. Meaning of market structures.
A market is any arrangement that brings buyers and sellers into close contact
to transact business with an aim of making profits. It may be a physical place,
communication through telephone, fax and mail. Different markets have
different characteristics, participants and conditions; thus markets differ in
many ways. The conditions that prevail in the market which determine how
the market players operate are what we call the market structures. Therefore,
market structure is a range of unique features or characteristics which
influence the behaviour, conduct and performance of firms which operate in a particular market.
1.1.2. Categories of market structures.
Market structures are classified into two categories:
1. Perfect markets: These are markets where buyers and sellers are
numerous and price cannot be manipulated. These include perfect
competition markets.
2. Imperfect markets: These are markets where individual buyers and
sellers can influence prices and production. These include monopoly,
oligopoly, monopolistic competition etc.
The market structures mentioned above differ depending on:
- The number of firms in the market; either one, few or many.
- Nature of the product dealt with; whether homogeneous or differentiated or heterogeneous.
- Entry and exit restrictions; either free entry, limited or highly restricted.
- Cost conditions.
- Degree of market information; Consumer informed or not informed about the market.
- Firms ability to influence demand through advertising.
- Degree of government interference.
APPLICATION ACTIVITY 1.1
1. a) Identify the firms operating in the banking sector.
b) Which types of products do they offer?
c) What means do they use to attract customers?
2. a) Identify the firms operating in the energy sector?
b) Which types of product do they offer?
c) What means do they use to attract customers?
3. Determine the difference in the structure of the two sectors above.
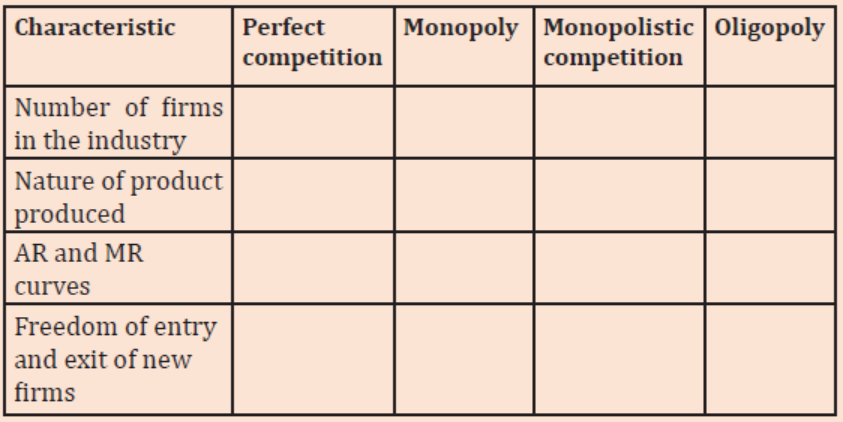
ACTIVITY 1.2
Considering market conditions in Rwanda, Describe the firms in which the features in the chart below exist.

1.2.1 Meaning of perfect competition.
Perfect competition is a market structure where there are several buyers and
sellers (firms) dealing with homogeneous commodity and possessing perfect
information of market conditions at that particular time.
At times a distinction is made between pure competition and perfect competition.
Pure competition Perfect competition is a market structure where there are
several buyers and sellers (firms) dealing with a homogeneous commodity but
consumers and sellers do not possess perfect knowledge of market conditions
and there is no perfect mobility of factors of production.
Perfect competition, on the other hand, requires the fulfilment of two
additional conditions: Perfect mobility of factors of production and perfect knowledge of market conditions.
Therefore, perfect competition is a wider term than pure competition.
1.2.2. Features of perfect competition.
Perfect competition is said to exist where there are the following conditions or features:
- There are many buyers and sellers in the market. Firms are many such
that none of them controls the market conditions independently. Each firm
in the market is free to put to the market as much output as it can or wishes
at the ruling market price but cannot independently influence the price of
the commodity. Therefore, firms under perfect competition are price takers
i.e. they take the price that is determined by automatic forces of demand and
supply.
- There is product homogeneity i.e. all the commodities supplied in the market
are identical (the same). All firms in the industry produce homogeneous or the
same product such that no consumer has preference for the product of one firm over the other.
- There is free entry and exit in the market. Any firm with capital is free
to enter the market and start producing and any existing firm is free to stop
production and leave the market if it so wishes. On expectation of making
profits, firms can freely join the industry and can also freely leave the industry if they make losses.
- There is no government intervention in form of fixing prices. All participants in the market abide by the price that is set by forces of demand and supply. Such a price rules all over the market.
- There is stiff competition among firms such that less efficient firms are always kicked out of the business.
- The major aim of firms is profit maximization. This is attained at a point where the marginal cost is equal to the marginal revenue (MC= MR) as the necessary condition though not sufficient at lower levels of output, but becomes sufficient at higher levels of output.
- The firms under perfect competition do not incur transport costs. Under perfect competition it is assumed that the raw materials, the firm, the consumers, are all found in the same place or locality.
- There is perfect mobility of factors of production from one production unit
to another. Factors of production can easily move from low paid economic
activities to high paid economic activities.
- Buyers and sellers have perfect (complete) information about the
market conditions. It is assumed that the price, quality, quantity and the
location of the product in question are known by all the participants in
the market. If one firm charges a higher price than others, it would not
make any sales.
- There is no persuasive advertising since firms are producing homogeneous
products and the consumers have perfect knowledge about the market
conditions. However, there may be some informative advertisements to make
the consumers aware of the products.
- Under perfect competition, AR=MR because selling an extra unit of output
adds the same amount to the total Revenue since price is constant, In other
words; for the firm to sell an extra unit of output, has to sell it at the same
price like previous one..
- The demand curve of a perfect competitive firm is perfectly elastic. This
indicates a constant price for the whole industry. At this point the demand curve
is equal to marginal revenue (MR), equals to average revenue (AR) which is
equal to the price. (DD=MR=AR=P). Therefore, the firms in the industry are
price takers not price makers. No any firm in the industry can set its own price
but they all sell at the constant price set by forces of demand and supply.
NOTE: Entry barriers refer to economic, procedural, regulatory, or
technological factors that restrict entry of new firms into market. Such barriers may take the form of:
1. Clear product differentiation, necessitating heavy advertising expenditure to introduce new products.
2. Economies of scale necessitating heavy investment in large plants to achieve competitive pricing.
3. Restricted access to distribution channels.
4. Collusion on pricing and other restrictive trade practices by the producers or suppliers.
5. Limit pricing i.e. fixing the price so low to avoid entry of new competitors.
6. Well established brands. A brand is a name, term, design, symbol, or
any other feature that identifies one seller’s good or service as distinct from those of other sellers.
Barriers to exit also serve as barriers to entry because they make it difficult for a firm that make losses to exit the industry.
Examples of perfect competition;
In the real world, it’s hard to find examples of industries which fit all the criteria of ‘perfect information’. However, some industries are close and these may include:
1. Foreign exchange markets. Here currency is all homogeneous and traders will have access to many buyers and sellers and there will be good information about relative prices.
2. Agricultural markets. In some cases, there are several farmers selling identical products to the market e.g. potatoes, cassava, pineapples, Irish potatoes, tomatoes, maize, bananas etc. and many buyers.
3. Internet related industries. It is easy to compare prices quickly and efficiently and entry barriers are lower.
1.2.3. The demand curve for a firm under perfect competition
Each firm in a perfectly competitive market faces a perfectly elastic demand curve
because variations in the firm’s output have no noticeable effect on price. The
perfectly elastic demand curve does not indicate that the firm could actually sell
an infinite amount at the prevailing price. It only indicates that the variations in
production will leave price unchanged because their effect on total industry output
will be negligible. The firm’s output variation has only a tiny percentage effect
on industry output. The price is determined by the industry through forces of demand and supply
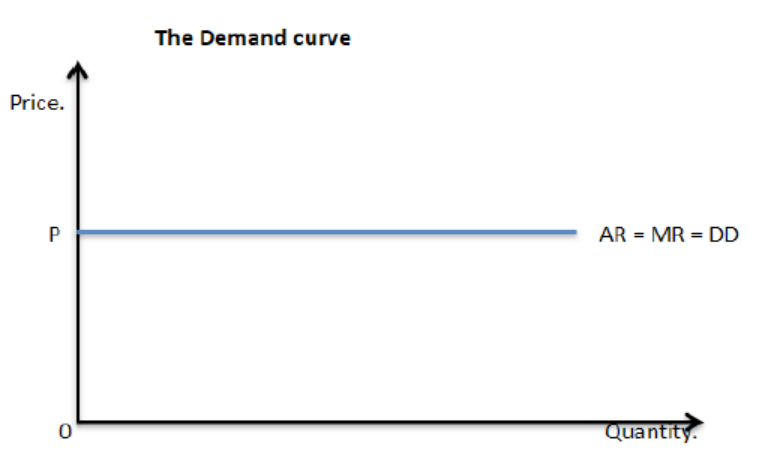
As shown in the figure above, the demand curve is equal to the average revenue
curve and equal to marginal revenue curve. (AR=MR=D) The AR curve is the
same as MR curve under perfect competition. This is because selling an extra
unit of output adds the same amount to the total revenue since price is constant.
ACTIVITY 1.3
Basing on your knowledge about the perfect competition,
Explain the meaning of the following terms and illustrate their curves.
i. MC
ii. MR under perfect competition.
iii. Illustrate the two curves on the same graph and identify the point
where they meet to determine the equilibrium.
1.2.4.1. Equilibrium position of the firm under Perfect competition.
Equilibrium can be defined as a state of balance when variables under
consideration have no tendencies to change. A firm is in equilibrium at the
point where MC= MR at this point, the firm is able to determine the output to
be produced and the price of that output. The firm maximises its profits by
equating its MC with its MR i.e MC= MR.
Conditions of Equilibrium of the firm and industry under Perfect competition
i. The MC curve must equal to MR curve. This is the first order and necessary
condition. But this is not a sufficient condition at lower output levels but
becomes sufficient condition at a higher output levels.
ii. The MC curve must cut the MR curve from below and after the point of
equilibrium it must be above the MR. This is the second order condition.
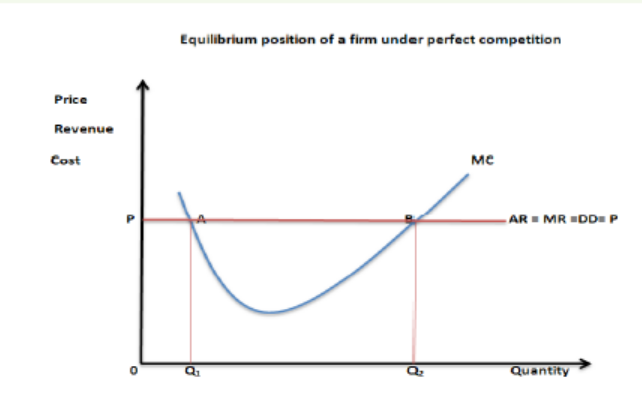
As shown in figure above at point A (output 0Q1), the firm is in equilibrium
i.e. MC = MR. However, this is not sufficient. It therefore requires the firm to
increase output to a higher output e.g. 0Q2 in order to fetch more revenue compared to the cost incurred in its production.
At point B the firm fulfils the sufficient condition of equilibrium by producing a
high output 0Q2 where MC= MR and MC is rising. Therefore, the equilibrium is at
point “B” where MC=MR and MC is rising thus fulfilling the necessary condition.
At equilibrium, the firm may either make abnormal profits or incur losses (subnormal
profits) depending on the level of average cost (AC).
1.2.4.2. Short run profit maximisation under perfect competition.
The firm will be in equilibrium at a point where marginal cost (MC) is equal to
marginal revenue (MR) and it will come under the following conditions:
- The average revenue (AR) must be greater than average cost (AC) i.e.
Average cost curve must be below the Average revenue curve.
- The average revenue curve determines the price while the Average cost curve determines the cost of the firm.
- Where AC curve meets the price-output line, we determine costs to the vertical axis.
- Marginal cost curve cuts the Average cost curve at the lowest point to mark the optimum point of the firm.
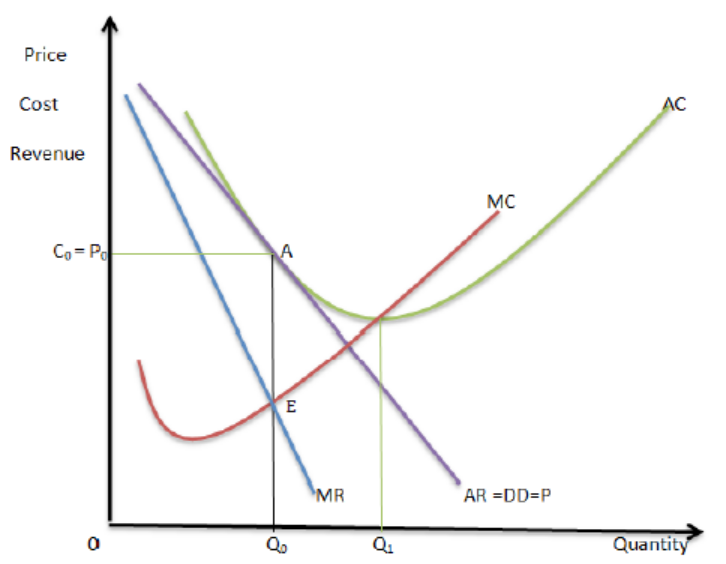
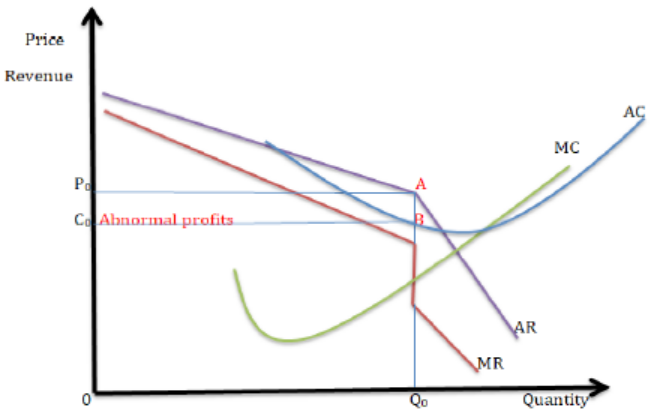
Illustration of short run profit maximisation under perfect competition
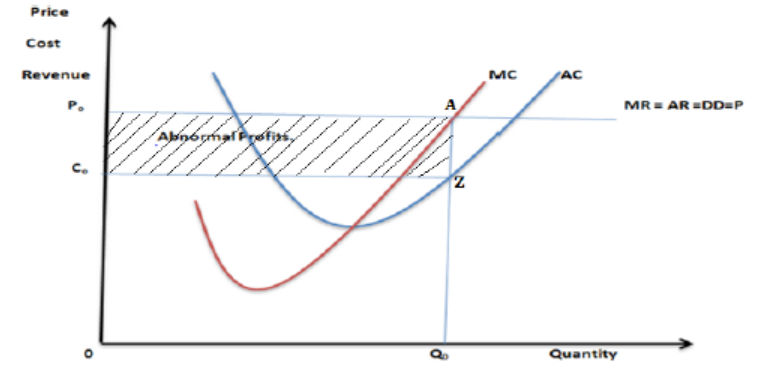
Output: The output that the firm produces is determined at the equilibrium
point where MC=MR at the biggest level of output. Thus output 0qo is the
equilibrium output.
Cost: The average cost of producing each unit of output 0qo is determined at a
point where the output line meets the AC curve. Thus 0co is the average cost of
producing each unit of output 0qo.
Price: The price at which the firm sells its output is determined at a point where
the output line meets the AR. Thus price 0po is the equilibrium price.
Profit: Along the equilibrium, AR is greater than AC and therefore the firm
earns Abnormal profits in the short run, as shown by the shaded area C0P0AZ
above
Example:
The marginal cost of paper bag making industry in Kayonza is given by,
MC = 20+2Q (which is always rising), where Q=100 paper bags.
Find the cost-maximizing quantity if P=30 or P=40
Answer:
P=D=AR=MR=MC
PC=MC, P-30
30=20+2Q
30-20=2Q
10=2Q
5=Q
P=MC, 40
40=20+2Q
10=Q
1.2.4.3. Long run equilibrium position under perfect competition.
Because of freedom of entry of new firms into the industry, in the long run, new
firms enter the market being attracted by the abnormal profits enjoyed in the
short run. As new firms enter, supply of the commodity increases leading to a reduction in the price level.
The increase in the number of firms will also result into increased competition
for factors of production which will cause the costs of production to rise. This
will push AC and MC curves upwards in the long run.
As prices in the market fall, abnormal profits will continue to reduce. Thus
firms make normal profits in the long run where AR=AC.
Long run situation comes under the following conditions;
- The average revenue (AR) must be equal to the average cost (AC) i.e.
Average cost curve must be tangent to the Average revenue line.
- The average revenue curve determines the price while the Average cost curve determines the cost of the firm.
- Where AC curve meets the price-output line, we determine costs to the
vertical axis. Since this time AC and AR are equal, the price line is the same as the costs line.
- Marginal cost curve cuts the Average cost curve at the lowest point to mark the optimum point of the firm.
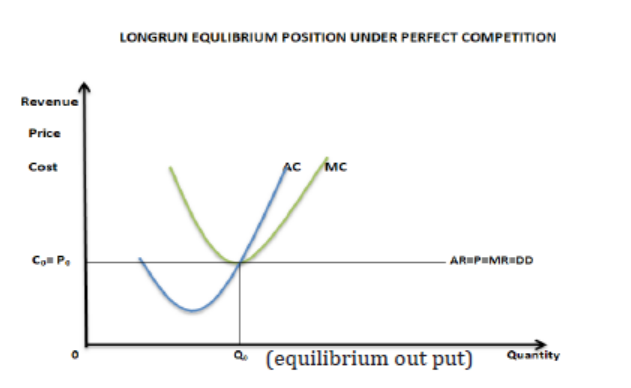
Output: The output that the firm produces is determined at the equilibrium
point where MC=MR at the point x, at the biggest level of output. Thus output
0qo is the equilibrium output.
Cost: The average cost of producing each unit of output 0qo is determined at a
point where the output line meets the AC curve. Thus 0co is the average cost of
producing each unit of output 0qo.
Price: The price at which the firm sells its output is determined at a point where
the output line meets the AR. Thus price 0po is the equilibrium price.
Profit: Along the equilibrium, AR is equal to AC (C0=P0) and therefore the firm earns Normal profits in the long run.
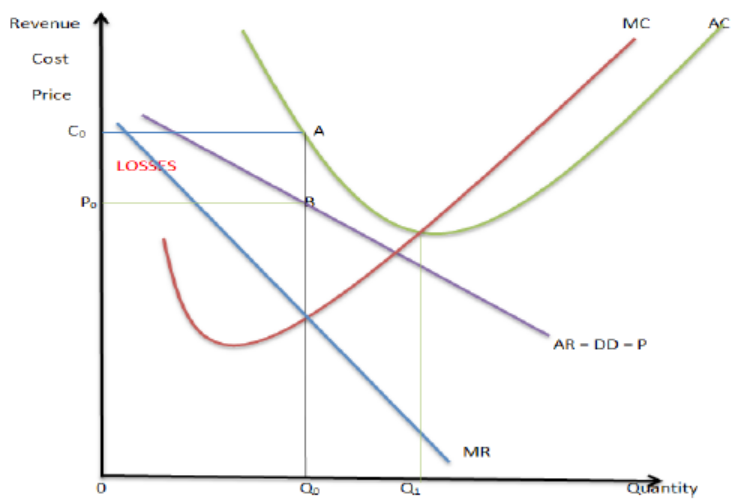
1.2.5. Loss making under perfect competition.
The firm can be in equilibrium under perfect competition but when making
losses making firm. Some firms can be able to make abnormal profits while some
others are likely to earn losses. Losses come under the following conditions:
- The average revenue (AR) must be less than average cost (AC) i.e. Average
cost curve must be above the Average revenue curve (AR).
- The average revenue curve determines the price while the Average cost curve determines the cost of the firm.
- Where AC curve meets the price-output line, we determine costs to the
vertical axis. This time the price-output line is prolonged to meet/ touch the AC curve since its higher above the AR curve.
- Marginal cost curve cuts the Average cost curve at the lowest point to mark the optimum point of the firm.
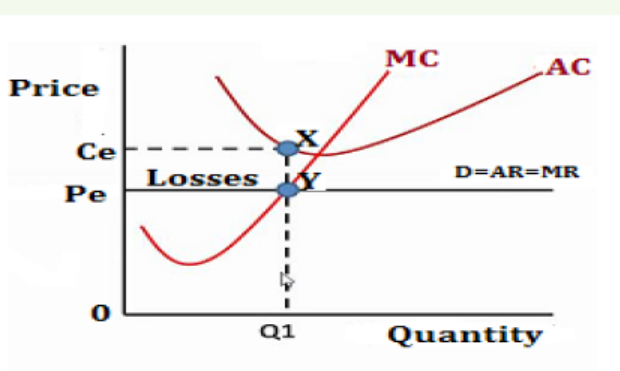
As shown in the figure above, the firm produces output 0Q1 at Total cost
0CeXQ1 and sales it at price 0Pe getting Total Revenue 0PeYQ1 hence making
losses PeCeXY because the AC is greater than the AR.
Losses = TR- TC. Thus from the above curve, losses= 0PeYQ1- 0CeXQ1 = PeCeXY.
Example
Given the firm’s total cost function as TC = 100+20Q+Q2.
a. Calculate the firm’s supply curve
b. If firm’s market price is 25Frw, calculate firm’s production.
c. Calculate firm’s profit/loss if P=25
Answer
TVC= 20Q+Q2
AVC= 20+Q
MC= 20 + 2Q
a. Therefore,
P = MC
P = 20+2Q
qs = ½P - 10
b. If P=25, therefore,
qs = ½P - 10
qs = ½(25) – 10
qs = 2.5
c. Profit/loss
qs = 2.5
π= TR-TC
π= PQ-(100 + 20q + q2)
π= (25)2.5-(100 + 20(2.5) + (2.5)2)
π= 62.5-(100 + 50 + 6.25)
π=-93.75Frw
In long run, firms push their profit to zero and sometimes, they start making losses.
1.2.6. Breakeven and shut down points of a firm.
Breakeven point is a point where the firm is neither earning abnormal profits
nor making losses. i.e. it is earning normal profits where the average revenue
is equal to average cost (AR =AC). The firm can only cover the costs of production without earning any profit.
Example
Assume an industry producing 1000 kg (Q) of biscuits daily, and selling at price
50Frw per kg. Calculate the profit of the firm, and interpret what will happen to the firm.
P= 50, Q = 1000
TR = P x Q
TR 50x1000= 50000
TC = ATC x Q
ATC=50,
Q=100TC = 50 X 1000 = 50000
Profit = TR - TC = 50000 – 50000 = 0
Therefore the industry is at breakeven point where AC=AR and the industry is making 0 profits.
When normal profits are earned, no more firms will be attracted to the industry and
the existing firms will have no desire to leave. As new firms may enter the industry
more would be supplied to the market. Prices will fall even further and firms will
begin to incur losses. Firms may continue to operate even when they are incurring
losses so long as they can pay for variable costs of production. This implies that
firms can operate even below the breakeven point until such a point when they may
be forced to close down. This point of a firm is referred to as Shut down point of a firm.
Shut down point is a point below where the firm only covers variable costs and
below this point, the firm cannot continue operation. At shut down point AR= AVC.
Example
Given that the firm is producing 7500 kg(Q) of maize floor, and selling at price
30Frw per kg, given also that the ATC=50. Calculate the profit of the firm, and interpret what will happen to the firm.
P = 30,
Q = 7500
TR = P x Q
TR = 30x7500 = 22500
Given, ATC = 50
So,
TC = ATC x Q
50 x 7500 = 375000
Profit = TR - TC = 225000 - 375000 = -150000
A firm will be at shutdown point since it will be making loss at AVC point.
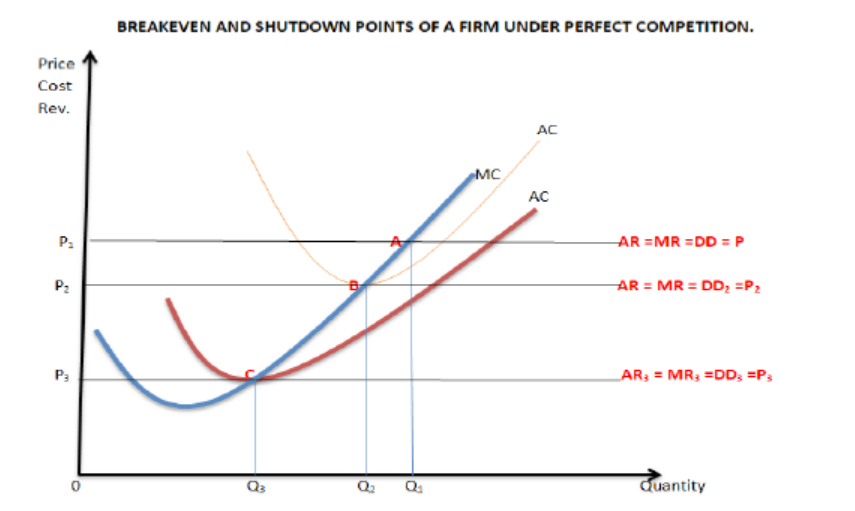
As shown in the figure above, In the long run, many firms join the business
because of the abnormal profits in the short run (at point A in the above
figure). As new firms enter the industry, supply of the commodity increases
creating more competition in the market leading to a reduction in the price. In
the end all firms get normal or zero profit at point (B). They are only able to
cover costs of production as shown by the AC curve. Point B is the breakeven
point where the firm earns normal profits and AR=AC.
Other firms will still join the business up to when the firm is not able to cover
all the costs of production but only covers variable costs as shown by the AVC
curve. (Point C in the above figure)
Point C is the shutdown point where the firm only covers variable costs. Below
this point, the firm cannot continue operation.
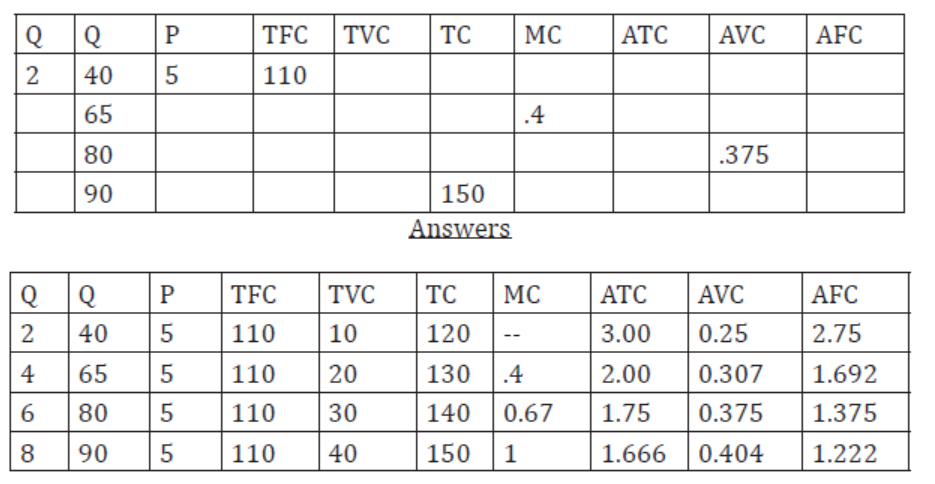
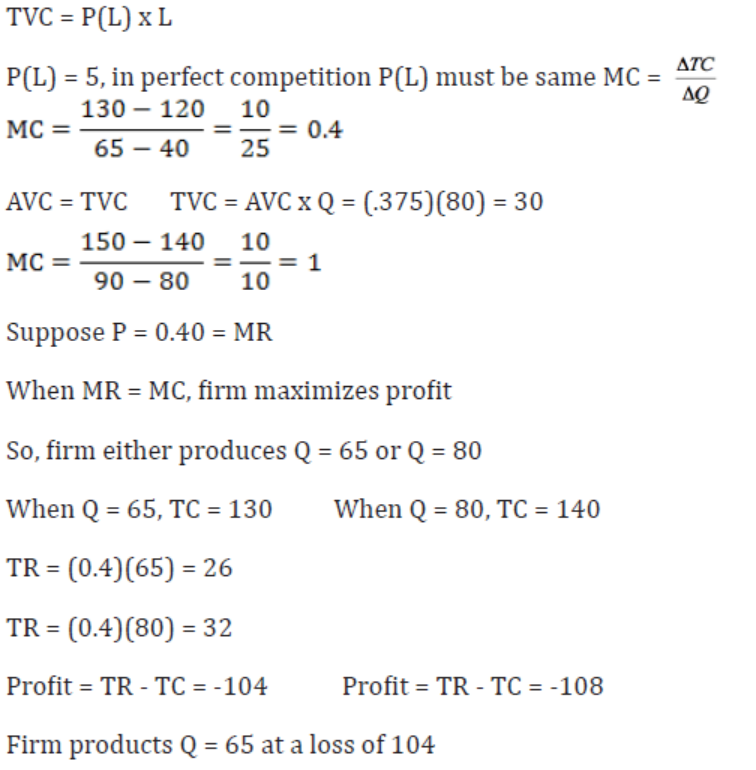
Example
Fill in the missing cells. Assume the firm operates in a perfectly competitive environment in both, the input and output markets. Calculate the profit (loss) when the firm receives 0.40Frw for the product.
APPLICATION ACTIVITY 1.2.
Equilibrium of a firm is at point where MC = MR and the optimum point is the lowest point of the AC.
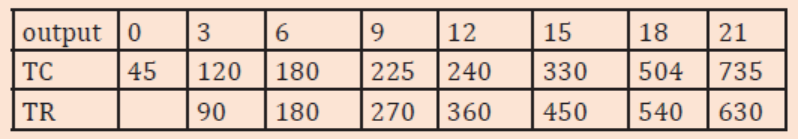
i. Using the following below, determine the equilibrium and optimum output.
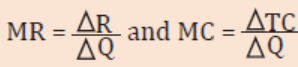
ii. Illustrate the MR and MC curves of the above firm.
Why firms continue to operate even when it is not covering all the costs.
ACTIVITY 1.4
Make research around. Look for a firm that has not been performing well
in the recent years. It may be a firm loosing market to a competitor or
has run out of resources. Find out the reasons for its poor performance
and why it has not yet closed?
A firm may continue to operate even if total costs of production are not covered because of the following factors:
- Some firms may not want to lose their good customers thus they continue
to operate even when total costs are not covered in order to keep such customers.
- Firms continue to operate because they fear to lose their suppliers of raw materials for their industry.
- Some firms may fear to lose their suppliers of raw materials for their
industry thus they continue to operate even when total costs of production are not covered.
- The firm may be newly established when it is still at its infancy stage
and expects to make profits in the long run thus it accepts to continue to operate even when total costs are not covered.
- Some firms fear to lose their skilled man power which it would have trained
at a high cost, which labour may be necessary in the near future thus they continue to operate.
- Firms may be expecting to get loans the nearby in future from the financial institutions to boost its business.
- Some firms fear to be taken over by the state through nationalization
when they stop operating thus they continue to operate even when the total costs are not covered.
- The firm may be newly established when it is still at its infancy stage
and expects to make profits in the long run thus it accepts to continue to operate even when total costs are not covered.
- The firm may have invested heavily in fixed assets like buildings, machines
and land which it cannot leave idle thus continue to operate when even total costs are not covered.
- Some firms keep operating when they hope to change or restructure management, if it
- believes current losses are due to poor management
- A loss making firm may be a branch of a bigger firm (subsidiary firm)
which is making profits and the losses can be shared by the other firms so as to cover the costs.
- Some firms are not meant to be making profits but to give services like welfare improvement, in case of government organizations.
- Some firms may be set up for research/ experimental purposes so they operate even if they are making losses.
- If a firm had earned abnormal profits before and is still surviving on them.
- Difficulties might be short run and therefore hope to make improvements in the long run.
- Some firms keep operating when they fear to lose their reputation or good name in society.
Under certain conditions, a firm may decide to close business because of;
- Appearance of new and strong firm thus out competed.
- Exhaustion of raw materials.
- Persistent labour unrest or inadequate labour supply.
- Absence of spare parts or failure to get them.
- New government regulations e.g. total ban of production of a given commodity.
- Change in fashion and design hence demand shifts to fashionable goods.
- Lack of raw materials e.g. during war times and economic decline.
1.2.7. Advantages and disadvantages of perfect competition.
Perfect competition has the following advantages:
- Encourages optimum use of resources because factors of production
can freely move from one place to another
- Production of better quality goods because of high levels of competition within the industry
- No wastage of resources because of no advertisement costs incurred. This reduces prices for final commodities.
- There is no consumer exploitation because prices are determined by the forces of demand and supply.
- There is a lot of output because of many suppliers and buyers.
- Producers are able to expand their firms and use modern technology because of the abnormal profits in the short run.
- Eliminates income inequality because in the long run all firms earn normal profits. On the other hand, everyone with capacity if free to join production.
- The plant is used to full capacity in the long run. This is mainly because firms
operate at the least average cost and so there is no resource wastage.
- There is price stability due to homogeneous products and all producers selling at the same price.
Disadvantages or shortcomings of perfect competitive firms:
- No variety of commodities since they are homogeneous; this limits consumers’ choice.
- The existence of perfect knowledge doesn’t motivate firms to incur expenses on research and development.
- Unemployment is likely to occur because of the inefficient firms leaving the production after being outcompeted.
- Consumers have little or no choice because the goods produced are the same.
- There are no abnormal profits in the long run so expansion of the firm is hard.
- Research is difficult because of little of no profits in the long run.
- Firms aim at profit, maximization and this discourages the production of public utilities like water supply which are vital for society but are non-profit making
- Profits are reduced because the seller is supposed to sale at the same price as others.
- Perfect competition cannot exist in reality and so cannot be relied upon for development.
- Sellers cannot carryout price discrimination since demand is perfectly elastic and prices tend to be constant and this limits the profit levels of the firm.
APPLICATION ACTIVITY 1.3
Identify a firm that declined and eventually closed. Make research and find
out the cause of its decline and closure.
1.3. Monopoly
ACTIVITY 1.5
REG is composed of EUCL and EDCL as its subsidiaries.
Write down what you know about EUCL and EDCL.
Why do you think REG is the only firm responsible for handling all electricity issues in the country?

1.3.1. Meaning and characteristics.
Under imperfects there are many market situations including:
- Monopoly.
- Monopolistic competition.
- Oligopoly.
Monopoly is a market situation where there is one producer or supplier of a product, which has no close substitutes and entry into the market is highly restricted.
Examples of monopoly firms include;
- Water and Sanitation Corporation Limited (WASAC)
- Rwanda Energy Group (REG)
- National Bank of Rwanda (BNR)
Extreme forms/ types of monopoly may include;
- Pure /absolute monopoly: This is a market situation where there is single seller or producer of a commodity that has no substitutes at all. In practice, there is no pure monopoly because people can always forge substitutes for that commodity.
- Monopsony: This is market situation where there is only one buyer of a commodity or a factor of production. E.g. one employer.
- Bilateral monopoly: This is a market situation consisting of a single seller and a single buyer of a commodity.
- Imperfect/ simple monopoly: this is a market situation where there is a single firm which produces a commodity that can be substituted to some extent though they are not perfect substitutes.
- Discriminatory monopoly: this is a type of monopoly where the seller has the ability to charge different prices from different customers for basically the same commodity.
- Collective monopoly: this is a market situation where a few firms producing similar products decide to come together so as to determine price and output.
- Natural monopoly: this is a market situation where a firm exclusively owns and controls a source of raw material and it is impossible for other firms to produce similar commodities that require similar raw materials. i.e. such firms become monopolies because other firms cannot enter the industry.
- The market demand for such an industry is only sufficient for one firm to operate at its minimum efficiency.
- Statutory monopoly: this refers to a type of monopoly which is set up by
an act of the parliament to provide a certain economic product/service
and such a service or product cannot be duplicated by firms.
- Spatial/local monopoly: This is a type of monopoly which arises from distance between the producers of a given product. Therefore, this when a firm becomes a monopoly due to the long distance between that firm and others firms.
Characteristics (features/assumptions) of monopoly market conditions.
Under monopoly market conditions,
- There is only one single seller/ producer and many buyers.
- The commodity produced has no close substitutes.
- Entry of new firms in the market is restricted/ highly blocked.
- There is no persuasive advertising instead there is informative advertising where the public is just informed about the existence of the commodity but not being persuaded to purchase it.
- The firm aims at profit maximization.
- Firms are price makers but not price takers. I.e. they can determine the price at which to sale their products
- The demand curve of a monopolist is inelastic because its products have no close substitutes. In other words, a big percentage increase in prices of such products lead to a small percentage reduction in the quantity demanded.
1.3.2. Sources of monopoly power.
- Patent rights: this where a firm/ producer has exclusive knowledge of a given production technique and the law forbids other firms/ producers to deal in the same commodity. e.g. authors, artists, inventors etc. copy rights and patent rights prevent other firms or producers from imitating
the products of others which leads to temporary monopolies.
- Strategic ownership or control of a source of raw materials which makes it impossible for other firms or producers to produce similar product that require similar raw materials. Thus such firms become monopolies because other firms cannot enter the industry leading to natural monopoly.
- Long distance among producers where each producer monopolizes the market in his/her locality. This leads to spatial monopoly.
- Advantages of large-scale production which do not allow small firms to compete successfully with large firms.
- Protectionism: This is where trade barriers are imposed on the product to exclude foreign competitors. In such cases, the home producer may become a monopolist.
- Take over and mergers: Take-over’ is when one firm takes over the assets and organization of another whereas mergers are formed when firms combine their assets and organizations into one to achieve strong market position. Both situations may result into a monopolist firm.
- Collective monopoly or collusive e monopoly: This is where firms come together in a formal or informal agreement (cartel) to achieve monopoly power. Such firms can fix quotas (maximum output each may put on the market). They may also set the price very low with the objective of preventing new entry of other firms. This is called limit pricing.
- Small market: where the market demand is small or limited, a single seller or supplier is most appropriate In other words, a firm becomes a monopoly because the market size is too small to allow more than one firm to operate in it.
- Long-time of training/acquiring skills: where entry into business or rofession is restricted by long-time of training, it means that a person who joins the profession will remain the sole supplier for some time e.g. doctors, judges etc.
- Talent: Individuals with talent tend to develop peculiar products or services hence development of monopoly in marketing of such commodities. E.g. designers, musicians etc.
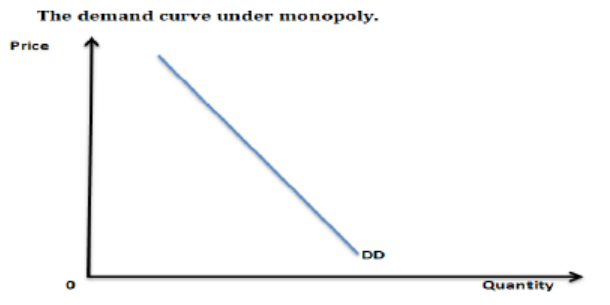
1.3.3. Equilibrium position and profit maximization under monopoly. The demand curve under monopoly is downward sloping from left to write. It is inelastic because of lack of competition.
Under monopoly:
- The firm produces at excess capacity both in the short run and long run because it must restrict output to charge a high price especially when it a private monopoly that aims at maximising profits. State monopolies created to provide strategic services to the population may optimally utilise their resources to provide more services.
- There is no supply curve under monopoly because the producer bases his production plans on the demand curve which is fixed and known to him/ her.
- There is no difference between a firm and an industry.
- The firm is in equilibrium when the marginal cost curve is equal to the marginal revenue curve. (MC=MR)
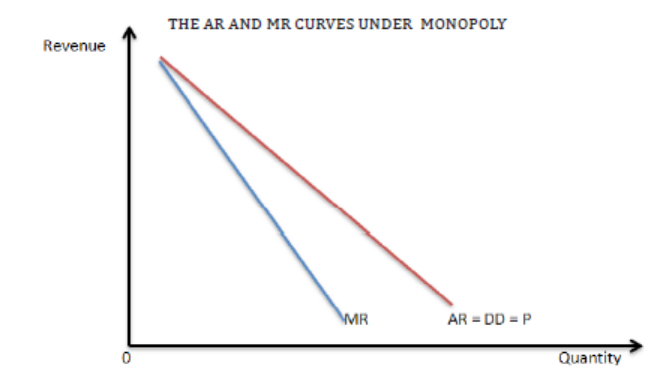
The AR and MR curves under monopoly
The AR and MR curves under monopoly are downward sloping from left to right. Marginal revenue curve is below the Average revenue curve because for monopoly firm to increase revenue, it has to lower the price
The equilibrium position under monopoly.
In the short run period, the monopolist behaves like any other firm. It will maximize profits or minimize losses by producing that output for which marginal cost (MC) equals marginal revenue (MR). Whether a profit or loss is made or not depends upon the relation between price and AC. It may be made clear here that a monopolist doesn’t necessarily make profits. The firm may earn super normal profits or normal or even produce at a loss in the short run.
Conditions for the equilibrium of a monopoly firm are that,
The firm under monopoly will still earn abnormal profits because it is the only firm in the production process. The firm will be in equilibrium where the marginal cost curve is equal to marginal revenue curve. (MC=MR). This is shown below:
Conditions:
- The average revenue (AR) must be greater than average cost (AC) i.e.
Average cost curve must be below the Average revenue curve.
- The average revenue curve determines the price while the Average cost curve determines the cost of the firm.
- Where AC curve meets the price-output line, we determine costs to the vertical axis.
- Marginal cost curve cuts the Average cost curve at the lowest point to mark the optimum point of the firm.
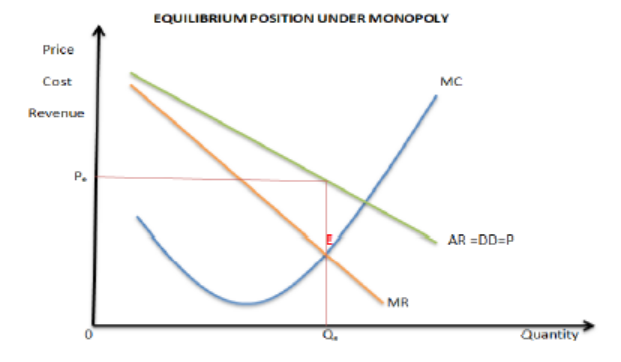
At point E, MR =MC and there that is the equilibrium point.
Short-run profit maximisation under monopoly
In the short run period, if the demand for the product is high, a monopolist increases the price and quantity of output. He can increase output by increasing labour, using more raw materials, increasing working hours etc. In case demand falls, he can reduce the use of variable inputs.
A monopolist is a price maker; therefore the firm can set a price which earns profits i.e a price greater than AC.
Conditions for short run normal profits under monopoly:
- The firm is in equilibrium where MC=MR.
- The average revenue (AR) must be equal to average cost (AC)
- The average revenue curve determines the price while the Average cost curve determines the cost of the firm.
- Where AC curve meets the price-output line, we determine costs from the vertical axis. However, since AC=AR, the price line is the same as the costs line.
- Marginal cost curve cuts the Average cost curve at the lowest point to mark the optimum point of the firm.
Illustration of normal profits under monopoly
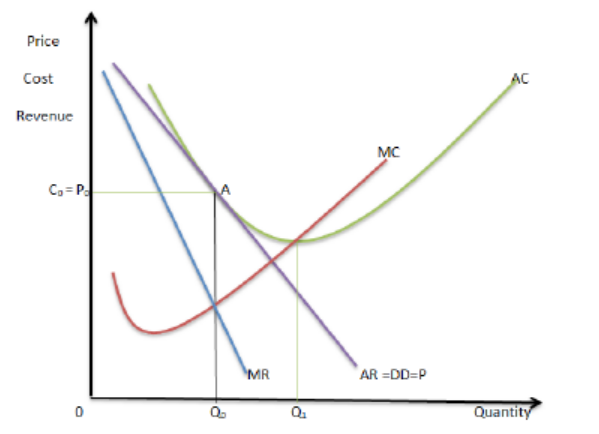
The firm is in equilibrium at a point where MC=MR. The price is tangent to the AC. The firm charges OP0 price per unit for units of output 0Q. The firm earns only normal profits and keeps on operating.
Losses under monopoly in the short run
A monopolist can also make losses in the short run, provided the variable costs of the firm are fully covered. The loss minimizing condition in the short run can happen under the following conditions;
Conditions
- The average revenue (AR) must be less than average cost (AC) i.e. Average cost curve must be above the Average revenue curve.
- The average revenue curve determines the price while the Average cost curve determines the cost of the firm.
- Where AC curve meets the price-output line, we determine costs from the vertical axis. Since AC is greater than AR, the price-output line is extended up to touch the AC curve so as to determine the costs to the vertical axis.
- Marginal cost curve cuts the Average cost curve at the lowest point to mark the optimum point of the firm.
Losses of a firm under monopoly in the short run
As shown in figure above, the firm produces the best short run level of output which is given by point where MC=MR. A monopolist sells output 0Qo at price 0Po. Total revenue of the firm equal to 0P0BQ0 and total cost of producing it is 0C0AQ0. The monopoly firm suffers a net loss equal to the area P0C0AB. The firm in the short run prefers to operate and reduce its losses to P0C0AB only. In the long run, if the loss continues, the firm shall have to close down
Equilibrium position of a firm under monopoly in the long run.
In the long run the firm under monopoly will still earn abnormal profits because it is the only firm in the production process. The firm will be in equilibrium where the long run marginal cost curve is equal to long run marginal revenue curve. (LMC=LMR). This is shown below:
Conditions
- The average revenue (AR) must be greater than average cost (AC) i.e. Average cost curve must be below the Average revenue curve.
- The average revenue curve determines the price while the Average cost curve determines the cost of the firm.
- Where AC curve meets the price-output line, we determine costs to the vertical axis.
- Marginal cost curve cuts the Average cost curve at the lowest point to mark the optimum point of the firm.
Illustration of Equilibrium position of a firm under monopoly in the long run.
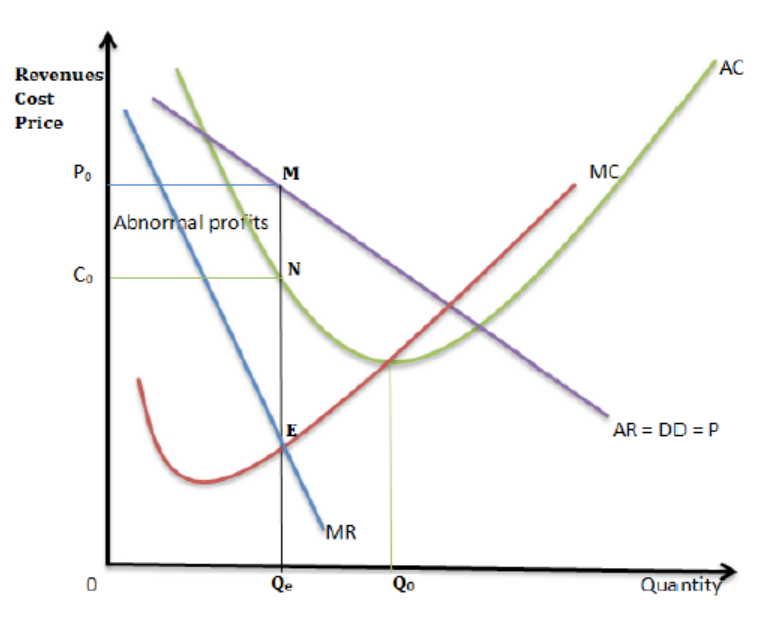
In the figure above, the firm is in equilibrium at point “E” where it produces output 0Qe at Total cost 0C0NQe and sells it at price 0P0 getting Total revenue 0P0MQe hence getting abnormal profits C0P0MN.
Profits = TR-TC. I.e. 0P0MQe - 0C0NQe = C0P0MN.
The firm under monopoly, in the long run, still operates at excess capacity since
its equilibrium output (0Qe) is less than optimum output (0Qo).
1.3.4. Advantages, disadvantages and control of monopoly.
ACTIVITY 1.6.
Discuss the view that monopoly market is better than a perfectly competitive market.
1.3.4.1. Advantages of monopoly.
Monopoly has the following advantages.
- There is no duplication of services and this saves resources e.g. if there is one energy firm providing power, there may not be the need to set up another one in the same area
- Economies of scale can be enjoyed by the firm because it is capable of expanding using the abnormal profits earned.
- There is a possibility of price discrimination. (Parallel pricing). This refers to the selling of the same commodity at different prices to different customers which benefits the low-income earners.
- Research can easily be carried out using the abnormal profits which in turn leads to an increase in the quality and quantity of goods produced.
- There is no wastage of resources in persuasive advertising which may increase leads the prices.
- Public utilities like roads, telephones, etc, are easily controlled by the government as a monopolist
- Infant industries can grow up when they are monopolies and are protected from foreign competition.
- It encourages innovations by protecting copyright and patent owners.
1.3.4.2. Disadvantages of monopoly
- Because there is no competition, the firm can become inefficient and
produce low quality products.
- Monopoly firms produce at excess capacity i.e. they under utilize their
plants so as to produce less output and sell at a high price.
- Monopoly firms may charge higher price than firms in perfect competition.
- In case a monopolist stops operating, there would be shortage of the commodity.
- Monopoly firms tend to exert pressure on the government and sometimes they can influence decision making because they are the controllers of production.
- Discrimination of consumers. This may be based on political or religious affiliation other than the factors respected by economics
- Leads to income inequality. The monopolies who over charge earn more compared to others
- Restriction of choices. A monopolist normally produces one type of commodity thus consumers are denied a chance to choose among alternatives
1.3.4.3. Measures to control monopoly
Because of the above disadvantages of monopolies, the following methods can be used to control their activities.
- The government can fix prices of commodities through price legislation.
- Anti-monopoly (antitrust) Legislation i.e. laws imposed to control monopolies. Such laws can prohibit monopolization, and collusion among firms to raise prices or inhibit competition.
- Nationalization of monopoly firms by the government so as to lower the prices.
- Subsidization of new firms. This can help them to compete with the already established firms favorably.
- Resale price maintenance where by the producers set prices at which sellers should sale the goods to avoid charging high prices
- Encouraging imports to compete with the commodities of monopoly firms in the country.
- Setting up government owned firms to compete with the monopoly firms.
- Removal of deliberate monopoly bases like protectionism and taxation to encourage competition among the firms.
- Taxation. The government can impose taxes to reduce the profits of the monopolists. Such taxes may include:
1. Surtax. This refers to the tax charged on producers or people who earn more than a particular large amount. This helps to reduce on the profit levels of a monopoly firm which reduces monopoly power.
2. Advalerem tax. This is a tax levied on the value of the commodity
3. Specific tax. This is a tax charged per unit of output and will therefore vary as output varies. It will increase the cost of production of additional unit (MC) and AC of every unit.
4. Lump sum tax. This is a tax charged especially on monopolists regardless to their level of outputs or any circumstance.
1.3.5. Price discrimination
ACTIVITY 1.7
Mutamuliza is an entrepreneur operating a number of enterprises in Gatsibo district. She runs a poultry firm where she produces eggs for sale. When traders from Kigali come, she sells to them at 5000rwf a tray while those from Gatsibo she charges them 3000rwf per tray.
She also produces pineapples and sells each at 1000rwf. But when Students from a nearby secondary school come to buy, she sells to them at 500rwf each. Some times during bumper harvest she exports some to Tanzania and sells each at 700rwf in Tanzania markets.
a. In your opinion, why do you think i. She charges Kigali traders more than what she does to those from Gatsibo for a tray of eggs?
ii. She sells pineapples to students at a lower price than others?
iii. She sells pineapples in Tanzanian markets at lower prices than what she charges in domestic markets?
1.3.5.1. Meaning
It is where the producer sells a commodity to different customers at different prices irrespective of the costs of production. It can also be referred to as parallel pricing. Price discrimination takes place at the following degrees of price discrimination,
Price discrimination occurs in the following degrees:
- First degree discrimination where a producer is able to charge each customer the maximum price he/ she is prepared to pay for the good or service depending on consumers’ demand.
- Second degree of price discrimination where a firm sells off excess output or supply that could be remaining at a lower price than normal price.
- Third degree price discrimination where the producer sells / separates markets according to elasticity of demand and charge a high price where there is inelastic demand and a low price where there is elastic demand.
1.3.5.2. Forms of price discrimination.
- Discrimination according to personal income. For example, income differentiation among buyers, e.g. doctors charging low prices on the poor and high prices on the rich for the same services.
- Discrimination according to age: e.g. charging low prices on the young people than old people on tickets to watch football or for a film show.
- Discrimination according to sex: where different prices are charged to females and males e.g. for discotheques where for ladies’ nights, ladies enter for free and males are made to pay.
- Discrimination according to geographical e.g. dumping where commodities are sold cheaply in other countries compared to prices in the home country.
- Discrimination according to the time of service e.g. tickets for video shows charged high prices in afternoons when there are many people than in morning hours when there are few people.
- Discrimination according to nature of the product e.g. a soft cover book may be cheaper than a hard cover book.
- Discrimination according to the number of uses of the product e.g. electricity used for industrial purposes is cheaper to electricity for domestic use.
- Discrimination by differentiation of commodities e.g. high prices on travellers in first class in the train and low charges of other classes like the economy class.
1.3.5.3. Conditions for Price Discrimination to be successful.
- The commodity must be sold by a Monopolist so that even when the price is increased, the buyer has nowhere else to go
- Elasticity of demand should be different in different markets. A higher price should be charged in the market where elasticity of demand is low than where elasticity of demand is high.
- The cost of dividing the markets should be very low e.g. in case of dumping costs of transport should be low.
- Buyers should not know how much is charged on others. This is possible especially where goods are sold on orders with no advertising.
- It should be impossible for buyers to transfer the commodity from where the price is low to where the price is high. This is possible especially with services of doctors, teachers, etc.
1.3.5.4 Advantages and disadvantages of price discrimination.
ACTIVITY 1.8
Discuss the view that customers with different income status should be charged different prices for the same commodities.
Advantages of price discrimination
- It enables the poor to get essential services at low prices e.g. cheap houses to civil servants and doctors charging low prices on poor patients.
- To the sellers, it increases total revenue because output sold increases.
- It is one way in which the rich subsidize the poor thus a method of income distribution. The rich are charged highly on commodities while the poor are subsidized on the same commodities
- It increases sales and consumption e.g. for air time, the first units, may be charged higher price than other extra units. Therefore, the more units of air time you use, the less the charges you pay for any extra units.
- It helps producers to dispose-off surplus and poorly manufactured commodities e.g. dumping.
- Increased efficiency. The increased profits from the higher charges make the firms efficient and such profits are reinvested
Disadvantages of price Discrimination
- It may encourage consumption of some commodities in undesirable excessive amounts. For example, when children are charged less for entrance in film halls, they may spend more time watching films than on studies or leisure.
- It can lead to low quantity of products/services for example in some airlines, travellers in the economy class (where fares are lower) are sometimes not well treated like those in the first class (where fares are higher) by airline staff.
- Discrimination in form of dumping discourages local industries.
- It increases monopoly powers of firms by limiting entrance of other firms
in the market. One firm serves all categories of customers irrespective of
their incomes, ages or sex cause consumers’ exploitation.
- Poor quality output normally arises; such output is sold to the less privileged who yearn for the less prices
- Misallocation of resources. Price discrimination may bring about divergence of resources from their socially optimal uses to produce for those who can reward highly because producers aim at profit maximisation.
APPLICATION ACTIVITY 1.4
The table below shows electricity tariffs from REG. Analyse the tariffs
and answer the questions that follow
Tariffs for non-industrial customers.
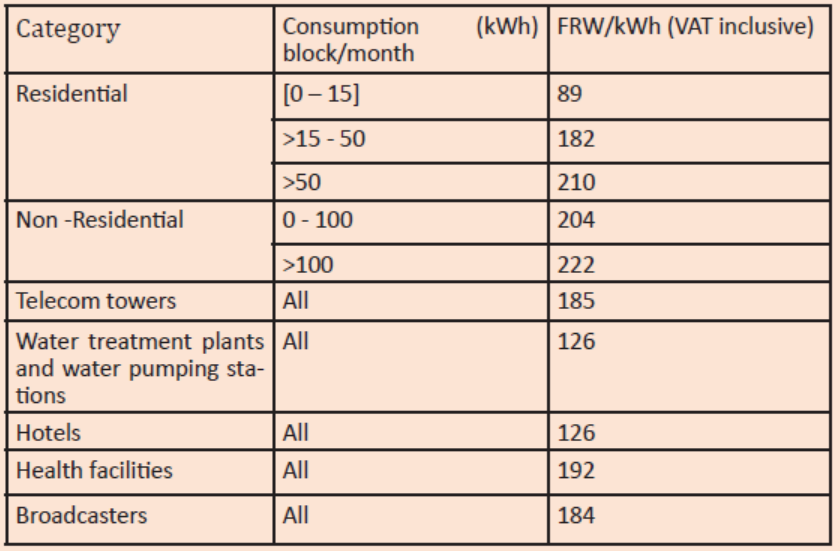
a. In your own view, why do you think
i. REG charges low tariffs for residential customers using below
15 kWh and higher tariff for those using 50 and above kWh?
ii. Water treatment plants are charged lower tariffs than telecom towers.
b. How is the above system of charging different tariffs by REG helpful to
i. REG.
ii. The customers
1.4. Monopolistic competition
1.4.1. Meaning and characteristics.
ACTIVITY 1.9.
Identify the 3 star and 4 star hotels in Rwanda. Make research on them in terms of
i. Their number.
ii. The means they use to compete against each other.
iii. Their services and their quality.
iv. Their prices.
Make class presentations on your discoveries.
Monopolistic competition market structure has characteristics similar to that of perfect competition except that the commodity dealt with in monopolistic competition is not homogeneous. It is a market structure in which a large number of firms sell differentiated products that are close substitutes.
Because of product differentiation, the seller has some control over the market price thus the firm is a price maker. Examples of monopolistic firms include:
- Soap industry.
- Bread industry
- Hotel industry
- Hair salons
- Restaurants etc.
Characteristics of firms under monopolistic competition
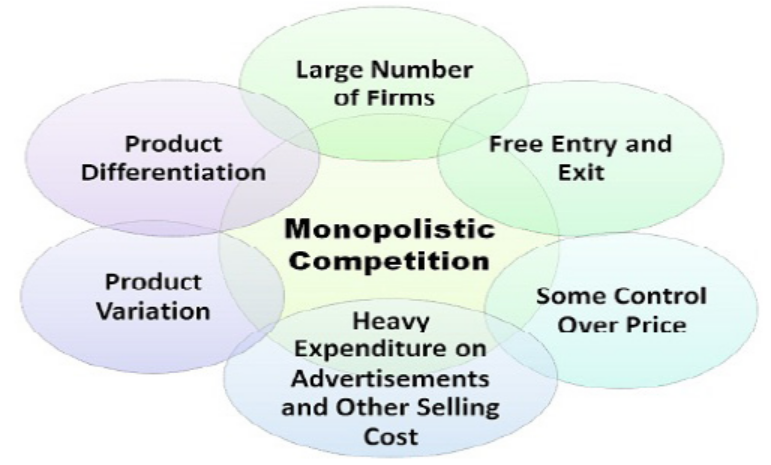
There are many firms in the industry.
- Firms deal in differentiated products though they remain close substitutes.
- There is freedom of entry and exit of new firms into and out of the industry.
- There is stiff competition due to production of close substitutes.
- There is a lot of intensive persuasive and informative advertising.
- The firms exercise a lot of non-price competition due to the stiff competition.
- There is production at excess capacity.ie production less than the required
output so as to charge at a high price.
- The firms in the industry are large but none of them dominates the market.
- The major aim is to maximize profits and this done at a point where marginal revenue is equal to marginal cost (MR=MC)
- There exists brand loyalty/ fidelity ie consumers exercise a lot of loyalty/fidelity by sticking on a particular commodity believing that a particular brand is superior.
- The demand curve is fairly elastic in nature because of the presence of many substitutes. When a firm makes a small increase in the price of the commodity, there is big reduction in quantity demanded because of the existence of many other firms in the market.
- The AR curve is greater than the MR curve, i.e. the MR curve is below the AR curve because the firm gets marginal revenue when it sells extra units of the commodity at the low price than the previous one.
1.4.2. Short run and long run profit maximisation under monopolistic competition.
1.4.2.1. The demand curve, AR and MR curve under monopolistic competition.
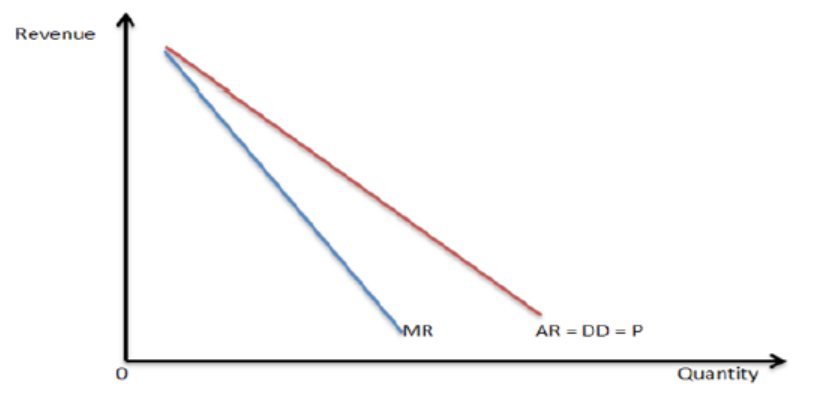
The demand curve under monopolistic competition is elastic because of competition. MR is below the AR
Equilibrium position of a firm under monopolistic competition
The firm under monopolistic competition is in equilibrium when the MC=MR and in the short run the firm will either make abnormal profits or losses. The supernormal profits will exist in the short-run because new firms cannot enter the industry. In the short run, the firms may attempt to maximize their profits by changing the quality and the nature of the product and by increasing advertisement expenditure.
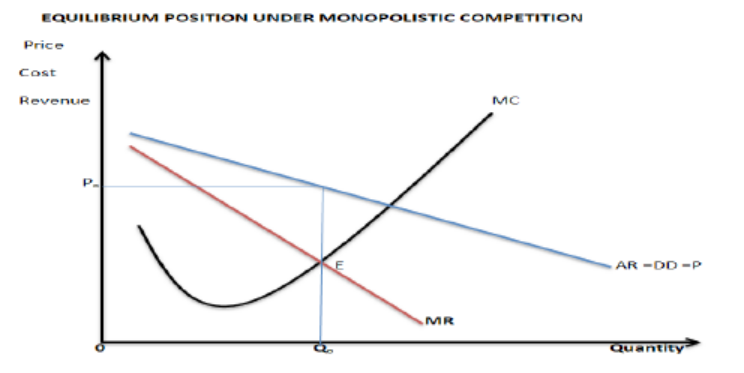
Point E in the figure above shows the equilibrium point where MC=MR
1.4.2.2: Price and output determination of a firm under monopolistic competition in the short run.
Price and output determination of a firm under monopolistic competition in the short run.
To determine price and output under monopolistic competition, we need to first determine equilibrium where profits are maximized. Thus, unit cost curves are super imposed on the unit revenue curves to determine where MC=MR (equilibrium point). From there, a perpendicular line is dropped to the horizontal axis to determine output and to the vertical axis, another line is dropped to determine price.
A firm under monopolistic competition in the short run the firm can either make abnormal profits or losses. Abnormal Profits are made as seen below
Conditions
- The average revenue (AR) must be greater than average cost (AC) i.e. Average cost curve must be below the Average revenue curve.
- The average revenue curve determines the price while the Average cost curve determines the cost of the firm.
- Where AC curve meets the price-output line, we determine costs from the vertical axis.
- Marginal cost curve cuts the Average cost curve at the lowest point to mark the optimum point of the firm.
Abnormal profits of a firm under monopolistic competition in the short run.
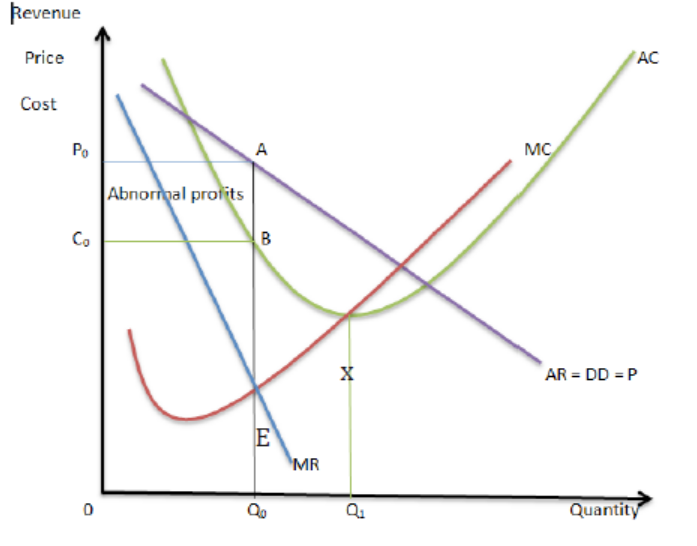
Output: The output that the firm produces is determined at the equilibrium point
(point E) where MC=MR at the biggest level of output. Thus output 0qo is the equilibrium output.
Cost: The average cost of producing each unit of output 0qo is determined at a point where the output line meets the AC curve (Point B). Thus 0co is the average cost of producing each unit of output 0qo.
Price: The price at which the firm sells its output is determined at a point where the output line meets the AR (Point A). Thus price 0po is the equilibrium price.
Profit: Along the equilibrium, AR is greater than AC and therefore the firm earns Abnormal profits in the short run represented by area C0P0AB.
NOTE: Firms under monopolistic competition produce at excess capacity/below their optimum point (point X) i.e equilibrium output oq0 is less than optimum output oq1
1.4.2.3. Losses under monopolistic competition in the Short run.
- The firm can also make losses. This is shown below.
Conditions
- The average revenue (AR) must be less than average cost (AC). I.e. The AC curve is higher above the AR curve.
- The average revenue curve determines the price while the Average cos curve determines the cost of the firm.
- Where AC curve meets the price-output line, we determine costs from the vertical axis. Since AC is greater than AR curve, the price-output line is extended up to touch the AC curve so as to determine the costs to the vertical axis.
- Marginal cost curve cuts the Average cost curve at the lowest point to mark the optimum point of the firm.
Losses of a firm under monopolistic competition in the short run
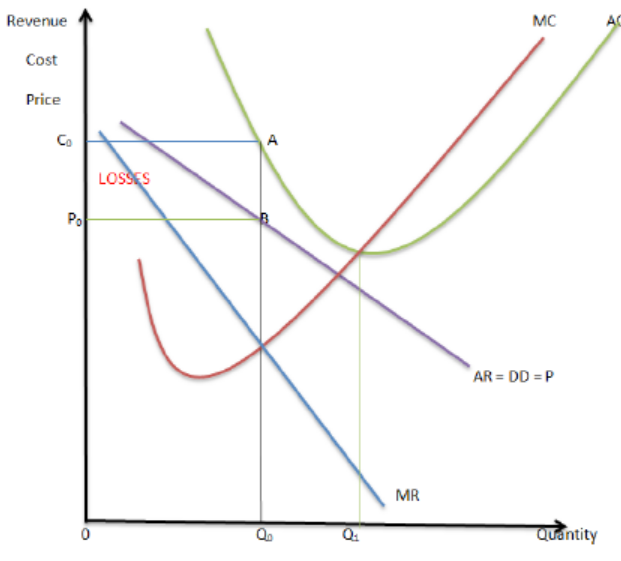
From the figure above, the firm produces output 0Q0 at cost 0C0 and sells it at lower price 0P0 getting total revenue 0P0BQ0. Hence the firm makes losses P0C0AB because total cost (AC) is greater than Total revenue (AR)
1.4.2.4. Equilibrium of the firm under monopolistic competition in the long run
Due to the supernormal profits in the short run, new firms join the industry with new brands, output increases, product differentiation increases, consumer choice widens and the firms reduce the level of their output since the market has remained the same.
The firms that were previously incurring losses leave the industry. Therefore, the demand curve would keep on shifting to the left until a point is reached where the demand curve is tangent to the long run average cost curve (LAC).
Equilibrium is attained at point where long run marginal cost curve (LMC) is equal to long run marginal revenue (LMR).
Conditions
- The average revenue (AR) must be equal to average cost (AC). I.e. The AC curve is tangential to the AR curve.
- The average revenue curve determines the price while the Average cost curve determines the cost of the firm.
- Where AC curve meets the price-output line, we determine costs from the vertical axis. Since AC is equal to AR curve, the price line is the same as the AC curve.
- Marginal cost curve cuts the Average cost curve at the lowest point to mark the optimum point of the firm.
Normal profits of a firm under monopolistic competition in the long run:
Output: The output that the firm produces is determined at the equilibrium point (point E) where MC=MR at the biggest level of output. Thus output 0qo is the equilibrium output.
Cost: The average cost of producing each unit of output 0qo is determined at a point where the output line meets the AC curve. Thus 0co is the average cost of producing each unit of output 0qo.
Price: The price at which the firm sells its output is determined at a point where the output line meets the AR. Thus price 0po is the equilibrium price.
Profit: Along the equilibrium, AR is equal to AC and therefore the firm earns Normal profits in the long run. The firm is operating at excess capacity since equilibrium output (0Q0) is less than optimum output 0Q1.
1.4.3. Advantages and disadvantages of monopolistic competition.
ACTIVITY 1.10
Discuss the view that monopolistic competitive market conditions are suitable for the Rwandan economy.
Advantages of monopolistic competition
- Product differentiation enables consumers to get a variety of products to choose from.
- Due to existence of many sellers in the market as a result of free entry of new firms, there are high quantities in the market. This makes prices lower than monopoly.
- Due to high level of competition, firms produce better quality output which improves people’s welfare.
- In case one firm collapses, substitutes are available for the consumers.
- Consumers buy at a lower price because of the presence of close substitutes which makes it difficult for sellers to charge very high prices.
- The freedom of entry gives a chance to any willing entrepreneur to enter the industry which creates employment opportunities in the country.
- Individual firms gain a lot of popularity due to specialization in their own brands.
- In the short run abnormal profits earned are used to improve on the quality of products, undertake research and expand the size of the firm.
- Disadvantages of monopolistic competition
- Advertising may mislead the public into paying higher price for the commodity when there is no improvement on the quality of the product.
- Firms produce at excess capacity in the short run and long run as they operate at less than optimum. Thus there is resource under utilisation.
- In the long run, there is no profit to make improvements because the firm earns normal profits. So it may not expand to enjoy economies of scale.
- The wide variety of commodities in the market often confuses consumers who may not make right choices in the end.
- The price charged on buyers is higher than in perfect competition which reduces consumers’ welfare.
- In the long run, there are no profits to invest in research since the firm earns normal (zero) profits.
- To maintain the market share, the seller has to persuasively advertise and this may increase costs and the price.
- There are limited employment opportunities as firms operate at excess capacity
- The output produced is less than that in perfect competition
1.4.4. Product differentiation under monopolistic competition
Product differentiation is a situation where a firm is in position to make its products appear different from other products of other firms. It may take the following forms; Packaging. Design/shape. Branding. Colour. Scent. Labelling, Salesmanship. Size. Quality, Advertising, Blending, Giving credit etc.
It is intended to win market for a firm by trying to make its commodities superior than those of rival firms. Therefore, there is need for persuasive advertising in monopolistic competition.
APPLICATION ACTIVITY 1.5
List down the mineral water producing firms you know.
i. Which one do you think takes the largest market share? Why?
ii. Which methods has it used to out-compete others?
iii. Are their products different? If yes, what makes them different?
1.5. Oligopoly
1.5.1. Meaning and features of oligopoly.
ACTIVITY 1.11
Identify the petroleum companies operating in Rwanda.
i. How many are they?
ii. Which one do you like and why?
iii. Is the petrol they sell different?
iv. Do they sell their products at the same price?
v. Are the lubricant oils they sell the same?
vi. What means do they use to compete against each other?
It is a market structure that is dominated by few, unequal and interdependent firms producing either a homogeneous product or a differentiated product.
a. Forms of oligopoly:
1. Perfect oligopoly occurs where there are few, unequal and interdependent firms in the industry producing a homogeneous product for instance Petroleum firms in the sale of petrol.
2. Imperfect oligopoly occurs when there are few, unequal and interdependent firms in the industry producing differentiated products for instance soft drinks firms.
3. Duopoly. This is an extreme form of oligopoly where there are only two firms in the market. For example in the telecommunication industry in Rwanda where Airtel and MTN are the only companies.
4. Duopsony. This is a form of oligopoly where there are two buyers in the market.
5. Oligopsony. This is a form of oligopoly where there are a few buyers in the market.
Examples of firms under oligopoly are;
- Mobile telephone companies: like MTN, Airtel.
- Petroleum companies like Kobil, SP, Mount Meru, Hass etc.
- Soft drink companies like Bralirwa Ltd, Azam Bakhresa Group etc.
- Newspaper firms. TAALIFA RWANDA, DOVE MAGAZINE LIMITED, Igihe Ltd., Rwanda Printing and publishing company, Nonaha Ltd, Inyarwanda Ltd, The Kigali Today group, Mucuruzi Online Market, Muhabura Ltd, The
New Times Publications, Umuseke Ltd, Digital Focus Limited.
b. Features/ characteristics of oligopoly.

Oligopoly markets have the following main features.
- There are few, unequal, competing firms. Each firm, though faced with competition from other firms, has enough market power and therefore cannot be a price taker.
- There is non-price competition such as advertising, quality of services etc. if one firm reduces the price, others would do the same and all firms would end up losing.
- There is interdependence among firms. Each firm is concerned with the activities of other firms so as to act accordingly, e.g. it can reduce the price when others reduce the price.
- In most cases there is product differentiation where firms produce similar products but each firm makes its product appear different from other firms’ products by using different colours, size, shape, labeling, quality etc.
- Presence of monopoly power. There are very few oligopoly firms and this makes it easy for collusion as a form of price determination leading to monopoly.
- Uncertainty. There is a lot of uncertainty in oligopoly industry, as one firm takes a decision say to increase the price, it cannot be certain of the reaction of other firms
- There is limited entry into the production process because most oligopoly firms operate at large scale, therefore this requires a lot of capital which others firms may not have.
- There is price rigidity. I e prices tend to be stable for a long period of time.
- There are price wars i.e. when one firm reduces the price other firms reduce theirs even lower.
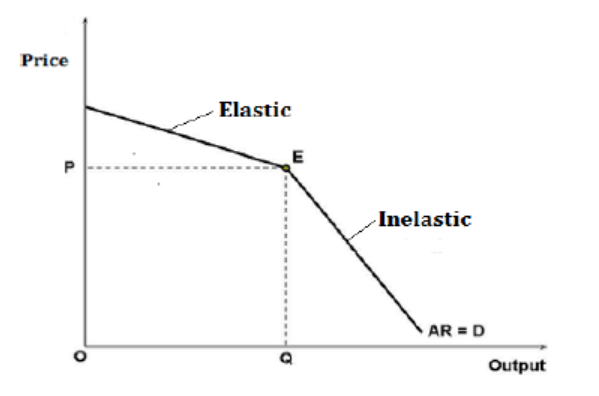
- The demand curve under oligopoly is kinked. i.e. a curve that has a bend (kink) and it is elastic above the kink and inelastic below the kink.
c. The demand curve of an oligopoly firm
The demand curve is kinked because the demand for their products largely depends on the behaviors of other rival firms. This brings in uncertainties in the industry because no single firm can predict reaction of another firm in case they take their own decision. The kinked demand curve is elastic above the kink and inelastic below it.
It is drawn on the assumption that there is an administered price, asymmetry in the behavior of oligopoly firms such that if one firm reduces its price, other firms will reduce their prices even further and if one raises its price others will not follow. Therefore, above the administered price, demand is fairly elastic while below the administered price demand is fairly inelastic. That is why demand curve has two parts joined together at the administered price (at the kink) i.e. one fairly elastic and another fairly inelastic. This is shown below
Illustration of the demand curve of an oligopoly firm:
From the curve above, P is the market price or administered price. Should any firm increase its price above that price, it would lose its customers to other firms. If a firm decides to set price below P, other firms will react by reducing their price even further or lower to win more customers hence increase in quantity sold will be lower than the reduction in price. Hence the demand curve
has a kink (at point E) meaning that the prices will remain rigid/ stable for a long period of time.
d. The MR curve under oligopoly
The MR curve will also have a kink with 3 parts. It will be fairly elastic before the kink and inelastic after the kink. Below the kink, MR curve is discontinuous and straight indicating that MR is falling although the price is constant. When the price remains rigid for a long time, there will be other changes in the market that may lead to changes in costs of production.
MR curve under oligopoly
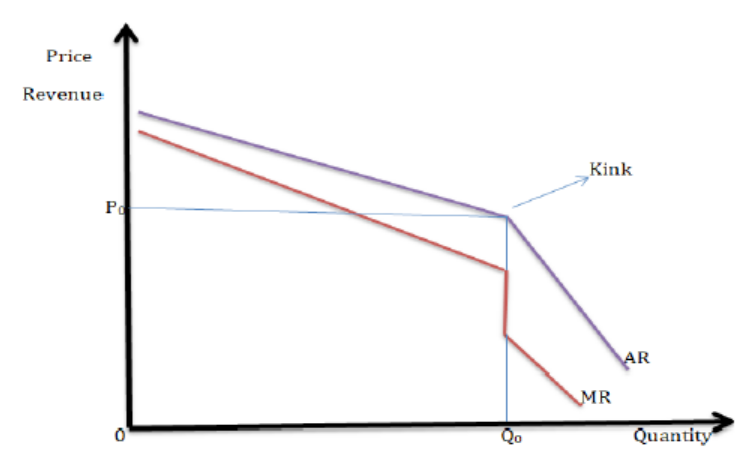
The figure above shows the MR curve which has three parts i.e. a part which is fairly elastic when AR is fairly elastic (before the kink),, a part that is vertical at the kink and a part that is fairly inelastic when AR is fairly inelastic (after the kink)..
e. Equilibrium position under oligopoly
The equilibrium under oligopoly occurs at a point where MR = MC. The MC cuts the MR in the vertical section of the MR. the position of the MC does not affect the equilibrium output as long as the MC passes through the vertical section of MR as illustrated below.
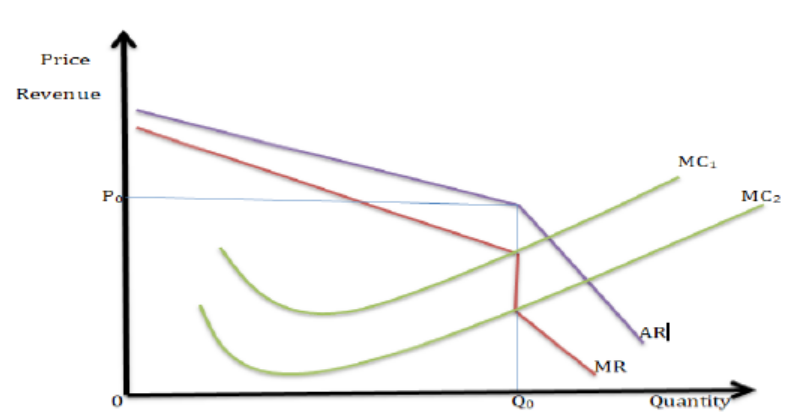
From the above figure, equilibrium is at any point between the vertical part of MR curve “R” to “Z”. The position of MC in the vertical MR doesn’t affect the equilibrium. At any point on this part of MR, MC=MR and there is equilibrium.
1.5.2: Profit maximization abnormal profits under oligopoly
A firm under oligopoly both in the short run and long run markets abnormal profits.
Conditions
Abnormal Profits are made in the following conditions as seen below:
- The average revenue (AR) must be greater than average cost (AC) i.e. Average cost curve must be below the Average revenue curve.
- The average revenue curve determines the price while the Average cost curve determines the cost of the firm.
- Where AC curve meets the price-output line, we determine costs from the vertical axis.
- Marginal cost curve cuts the Average cost curve at the lowest point to mark the optimum point of the firm.
Illustration of profit maximisation by an oligopoly firm.
Output: The output that the firm produces is determined at the equilibrium
point (at point E), where MC=MR at the biggest level of output. Thus output
0qo is the equilibrium output.
Cost: The average cost of producing each unit of output 0qo is determined at a point where the output line meets the AC curve. Thus 0co is the average cost of producing each unit of output 0Qo.
Price: The price at which the firm sells its output is determined at a point where the output line meets the AR. Thus price 0po is the equilibrium price.
Profit: Along the equilibrium, AR is greater than AC and therefore the firm earns Abnormal profits in the short run and the long run shown by C0P0AB in the above figure.
1.5.3. Advantages and disadvantages of oligopoly
ACTIVITY 1.12
Discuss the view that oligopoly market is better than a monopolistic market.
Advantages of oligopoly.
- Stable prices are charged due to presence of price rigidity.
- The high level of competition leads to better quality commodities.
- There are low prices to the consumers due to existence of intensive competition and fear of other firm’s reaction.
- Eases consumer budgeting due to due to price stability.
- Most oligopoly firms operate on large scale which enables the firm to enjoy economies of scale. This together with stiff competition reduces price in the market.
- Widens consumer choice due to production of a variety especially with imperfect oligopoly due to branding and product differentiation.
- Increase innovation and inventions in the economy due to competition and use on non-price competition measures to win market share.
- Provision of gifts by different competitive firms to customers improves people’s welfare.
- There is increased output due to production on large scale.
- Consumer awareness of the commodity is high due to extensive advertising.
- A lot of abnormal profits earned are spent on research and development which leads to technological advancement and a high standard of living in the country.
- Branding and product differentiation gives the consumer a wide variety of commodities to choose from.
Demerits of oligopoly firms:
- Consumers are denied a variety to choose from in case of perfect oligopoly.
- Consumer exploitation through over charging due to collusion.
- Profits are limited due to price rigidity and this may affect further expansion.
- There is a lot of duplication of commodities due to stiff competition hence wastage of resources and losses.
- Collapse of small firms when they are out competed due to stiff competition leading to unemployment.
- There is under exploitation of resources due to production at excess capacity which reduces the chances of firms to enjoy economies of scale.
- Industries with large firms exert pressure on government due to their large capital base and large market share.
- Distorts consumer choices due to excessive advertisements thus may end up consuming unwanted commodities.
- Worsens income inequality due to limited entry of other firms.
- Some firms at times engage in price wars where each firm keeps on reducing on prices of its products to outcompete rival firms which results into losses
- Firms incur high costs on advertising which increases on the price of the commodity.
- The market structure is characterized by uncertainties about the reactions and activities of other firms which limit the ability of an individual firm to make independent decision.
- Due to limited entry of firms, there may be lack of competition leading to inefficient and poor-quality products
1.5.4. Non price competition under oligopoly.
ACTIVITY 1.13
Identify the means used by the two firms below to attract more customers

Non price competition refers to the situation where firms in the industry compete using other means other than price. The price is kept constant but firms use other means of attracting customers. This can be done through,
- Persuasive advertisement using various media like radios, television, newspapers etc. to make people aware of the commodity and attracted to it
- Branding and blending i.e. use of appealing brand names like Rwanda tea……
- Offering credit facilities to customers to encourage them keep buying
- Offering gifts and free samples to encourage them buy more like petrol stations giving soap to customers
- Opening many branches in different locations in the country
- Offering after sales services like free transport to customer’s premises, guaranteeing spare parts all which attract customers to the firm involved
- Sponsoring social events like sports and music thus winning market etc.
- Organizing promotions through raffle draws which are intended to increase the number of customers who are attracted to buy the commodity in order to join the draw.
- Organizing trade fairs and exhibitions to make their products known to customers.
- Offering mobile shops. This is where the firm puts its products in a vehicle/ bicycle and moves from place to another selling its products e.g. bread firms
- Renovation of premises of customers by rival firms e.g. telecommunication networks (MTN, Airtel), beer firms (primus, Skol)
- Use of stop shopping centres at fuelling stations
- Use of differentiated attractive packaging and convenient designs of products by firms to outcompete each other.
- Quality improvement and introduction of new variables in order to increase their market share.
- Use of appealing slogans which attract commodities customers to their products e.g. MTN- everywhere you go, Airtel- express yourself, Coca- Cola- taste the feeling etc.
- Free distribution of samples and large purchases to customers’ premises.
1.5.5. Advantages and disadvantages of non-price competition.
Advantages.
1. It ensures quality products on the market. If consumers must choose between two products of the same price but they can see that one is of a higher quality, they generally pick the product of higher quality.
2. It increases total sales. Consumers may even pay more for goods perceived as higher quality with similar outward features. For instance Apple, makers of iPhones, and producers of organic food benefit from this phenomenon.
3. It encourages producers to reduce costs through innovations. If a firm can figure out how to produce an item at a cost comparable to what its competitor incurs, it widens its profit margins.
4. Perception and branding creates market for the commodity. A number of producers compete by manufacturing a perception of high quality with their brands. This allows some companies to charge higher prices for seemingly identical products because consumers see value in the brand itself.
5. Competition by product differentiation helps to widen market. By offering a range of similar products geared toward different market sectors firms can expand their market base.
Disadvantages of non-price competition
1. Competing by improving quality requires more time and resources. The problem with this approach is that it may take some time for consumers to realize any difference in quality.
2. It may be difficult to compete through maintaining brand loyalty. Long-term sustainability of a brand name may be difficult because, as such brand advantages arise through consumer trends, consumer trends may also lead to their demise. For instance, if consumers no longer see a clothing brand as fashionable, the market share may reduce.
3. Competing through product differentiation can result in significantly higher overhead costs for production.
APPLICATION ACTIVITY 1.6
Fill the table below with a summary of the difference and similarities between the following market structures.
END UNIT ASSESSMENT
1. With the help of illustrations, explain how profits are maximized under monopolistic competition in the
i. Short run.
ii. Long run.
2. Examine the differences between perfect competition and oligopoly.
3. Describe the factors that may make a firm to continue in operation though it is operating below the breakeven point.
UNIT 2 MEASURING NATIONAL INCOME
Key unit Competency: Analyse the importance of measuring national income in an economy.
INTRODUCTORY ACTIVITY
Case study of Murwanashyaka
Murwanashyaka is a resident in Nyamasheke and practices farming (crop
production, cattle rearing and poultry farming), fishing and has small
boutique in a nearby trading centre. He wakes up in the morning together
with his wife Kantengwa, milks the cow as the wife is collecting eggs from
the poultry farm. When they finish, they keep both milk and eggs and then
the wife goes to the garden and Murwanashyaka goes to the Lake for fishing.
In the afternoon they take all their products to the market to get money that
will enable them to meet their needs. The money they get is used for buying
basic requirements at home, investing in other profit making activities and
saving for future use.
We can see that his time is divided between producing consumer goods for his
immediate use, capital goods that are an investment for his improved standard
of living in the future, and goods that would be purchased by government
in a more complex society. Murwanashyaka is obliged to decide how much
of his income and the things he produces, will be allocated to consumption
now, investment and saving. His opportunities to consume, invest, and saving
are limited by his ability to produce. The portion of his income that is either
consumed, saved, or invested in capital goods, will determine his income in the future.
Even though Murwanashyaka’s economy is just a one person economy, assess
his case and explain what it teaches to modern economies.
2.1. National income
ACTIVITY 2.1
Using the photographs in figure 1 below;
a. Describe the activities in photographs a, b, c and d.
b. What is the purpose of the named activities in a above to the economy?
c. Based to your knowledge of goods and services;
Activity (a) is........................
Activity (d) is........................
d. Who should participate in such activities?
e. Relate the activities to national income and give the meaning of national income.
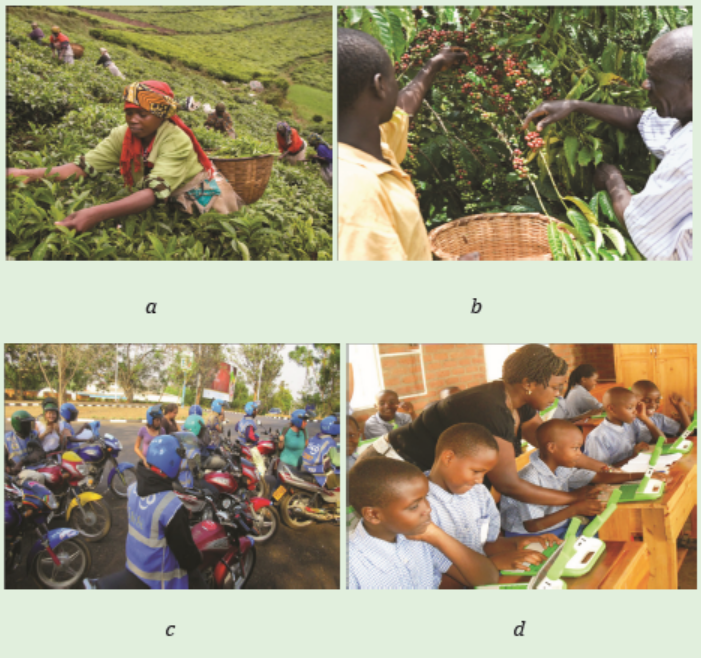
Figure 1: Economic activities
2.1.1. Meaning of national income
National income is an uncertain term which is used interchangeably with national dividend, national output and national expenditure. On this basis, national income has been defined as:
The total monetary value of goods and services arising from productive/ economic activities of a country in a given period of time, usually a year. In other words, the total amount of income accruing to a country from economic activities in a year’s time is known as national income. It includes payments made to all resources in the form of wages, interest rent and profits.
For an individual, the income during any given period of time largely consists of earnings received from participation in the productive/economic activity carried out in the economy.
National income of a country is the aggregate/total of all incomes of those individuals who are residents of the country. Incomes that are received in form of gifts or transfer receipts from other individuals, business firms and governments, do not form part of national income because they are not from corresponding productive activities.
2.1.2. Concepts used in national income
vi. Gross Domestic Product (GDP)
This is the monetary value of goods and services produced in the country by both nationals (residents) and non-nationals (foreigners). Foreigners include foreign investors and expatriates. GDP can be calculated by considering various sector net changed values during a time period.
GDP=C+I+G
Where;
- C = All private consumption/ consumer spending in the economy. It includes durable goods, non-durable goods, and services.
- I = All of a country’s investment on capital equipment, housing etc.
- G = All of the country’s government spending. It includes the salaries of a government employee, construction, maintenance etc.
GDP=GNP-Net income from abroad
GDP=GNP- (x-m)
Where, X-M= Net country export – Net country import.
vii. Gross National Product (GNP)
This is the monetary value of goods and services produced by the nationals within the country and those nationals that live outside the country (abroad). It excludes the incomes earned by foreigners living in the country.
GNP = C + I + G +(x-m)
Where: C= Consumer expenditure by households on goods and services
I = Investment by firms.
G = Government spending sector
X =Exports
M = Imports
(x-m) = net income property from abroad.
GNP = GDP + Net Factor Income from Abroad (x-m).
viii. Net National Product (NNP)
This is the monetary value of goods and services produced by nationals of a country in a given period of time less depreciation costs.
NNP= GNP-Depreciation
Or NNP = GNP - ΔK
Where ΔK = capital depreciation.
ix. Net Domestic Product (NDP)
This is the monetary value of goods and services produced in the boundaries of a country by both nationals and non-nationals less depreciation.
NDP = GDP-Depreciation
x. Income per capita
This is income earned per person in a given period of time.
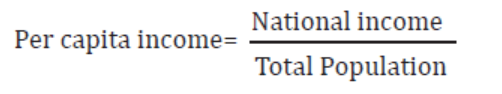
xi. Personal income
This is the total income received by an individual from both productive and unproductive activities.
Personal income = Private income – undistributed corporate profits – profit taxes.
xii. Disposable income
This is a fraction of income that remains for spending after deducting the taxes.
DY = Personal Income – Direct Taxes. Or
DY = Consumption expenditure + savings.
xiii. Nominal income
This refers to incomes expressed in monetary units such as dollars, francs, shillings, etc.
xiv. Real income
This refers to the amount of goods and services that nominal income can buy.
xv. Net factor (Property)
This is the difference between income earned by nationals abroad and income earned by foreigners in the country. Such earnings may be in form of salaries, rent from properties, dividends, profit, royalties, etc.
xvi. National income at market price (NNP mp)
This is the monetary value of goods and services valued at market prices. When the goods are in the market, we add indirect taxes but we subtract subsidies.
NNPmp=NNPfc + indirect taxes – subsidies
xii) National income at factor cost (NNPfc)
This is the monetary value of goods and services produced in a country at a given period of time valued at the cost of factors of production used to produce the goods and services.
NNPfc = NNPmp + Subsidies – Indirect taxes
xvii. Quid Pro Quo.
This is payment received in exchange of goods and services.
xviii. Non-Quid pro Quo.
This is any income received not in exchange of goods and services e.g. gifts, grants, students’ allowances. It’s any income received for no corresponding economic activity reflected in the production of goods and services. Its otherwise known as transfer payments.
xix. Black economy:
This is part of the economy or economic activity which isn’t recorded in the official statistics of the country. It’s an economy where illegal activities take place. Like smuggled output, income of prostitutes etc.
xx. Imputed value:
This is the value assigned to commodities which are not exchanged for money.
This is done when compiling national figures.
xxi. Closed economy.
This is any economy that does not have any economic relation with outside countries i.e. it does not take part in international trade.
xxii. Open economy:
This is any economy that has economic relations with outside countries i.e. it takes part in international trade.
2.1.3. Approaches of measuring national income
ACTIVITY 2.2
Using photographs in figure 2 below;
1. Describe the activities in the photographs a, b, c, and d.
2. How do the activities contribute to the measurement of national income?
3. Explain the approaches used in measuring national income as shown in the photographs.
4. Identify the problems of using the different approaches in measuring national income.
5. Explain how the three approaches give the same results.
National income measures the income generated by a country through the production/economic activities that are carried out within a country during a specific period of time. In this sense, three important methods/approaches are used to measure national income and these are:
i. Product/Output/Value added method/approach
ii. Income Method/approach, and
iii. Expenditure Method/approach.
These approaches are explained in details as below:
i. Product /Output/value added method/approach
The product/output/value added method/approach is the total summation of the gross value of the final goods and services in different sectors of the economy like industry, service, agriculture, etc. is acquired for the current year by determining the total production that was made during the specific time period. This is the most direct approach of estimating the value of output produced by the country. In this approach, we add up ‘value added’ on output by
all sectors during the course of the year. All final goods and services produced must be included, whether they are sold to consumers, government, firms as capital goods or sold abroad as exports.
The value obtained is the gross domestic product. Thus, we can calculate GDP according to this method:
GDP= Total product of (industry + service + agriculture) sector
Symbolically,
GDP= Σ (P × Q), Where,
P= Market price of goods and services
Q= Total volume of Output
In using this method/approach to determine the national income, it is important to note that sometimes goods produced by one sector are further processed by another sector. These goods are termed as intermediate goods and are already included while determining the value of final goods. So, in order to avoid the problem of double counting of value of goods, the product method if further categorized into two approaches:
a. The Final Goods Approach
In this method, only the value of final goods and services are computed while estimating GDP, regardless of any intermediate goods and their processing. This method takes into account only those goods and services that purchased and consumed by the final consumers in the economy.
b. The Value Added Method
In the value added method of measuring national income, the value of materials added by producers at each stage of production to produce the final good is considered. The difference between the value of output and inputs at each stage of production is the value added.
Thus,
Value added= Value of output – Cost of intermediate goods
Example 1
Given that a farmer in Burera district produces wheat and sells it to the miller in musanze at 100 frw per kg; The miller produces floor and sells it at 150
frw per kg to the baker in Kigali for making breads, who bakes and sells bread each at 200 frw. If the differences are added up for all production sectors in the economy, the value of GDP is computed and the table below clearly explains this method:
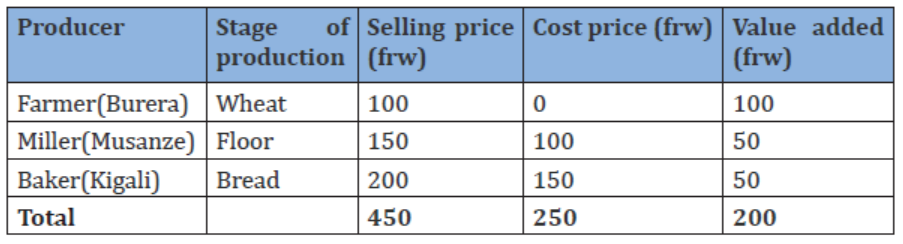
Table 1: Estimation of National Income by Value Added Method
In this example, GDP using product/output/value added method/approach is 200 frw where
GDP= wheat (100)+floor(50)+bread(50)
= 200 frw
Example 2
Stage 1: Masera a farmer in Byumba grows cotton and sells it to a ginnery at 10,000 FRW. This represents an income of 10,000 FRW to Masera. The value added is 10,000 FRW.
Stage 2: The ginnery sorts out the good cotton from the poor cotton and sells it to a spinner at 15,000 FRW meaning that the value added on the cotton is equal to 5,000 FRW.
Stage 3: The spinner uses the good quality cotton to make threads that it sells to Utexrwa, a cloth-making industry, at 25,000 FRW, meaning the value added to the cotton to make threads is 10,000 FRW.
Stage 4: Utexrwa turns the threads into a dress and sells it to Umutoni at 40,000 FRW meaning the value added onto the threads is now 15,000 FRW.
The total value added on to the cotton up to the time of its sale is: 10,000+5,000+ 10,000+ 15,000= 40,000 which is equal to the value of the final dress.
This can further be illustrated in the table below:
Table: calculating national income using value added
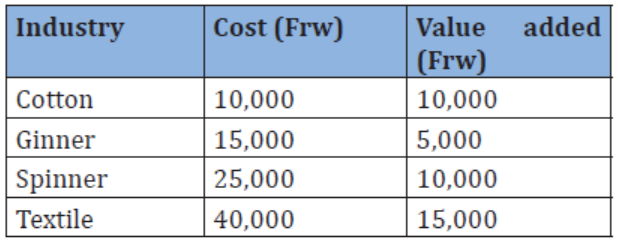
National income=10,000+5,000+10,000+15,000=40,000 Frw
ii. Income Method/approach
Income method sometimes termed as factor income method or factor share method is used to determine national income by measuring as the total sum of the factor payments received during a certain time period.
The factors of production include land, labor, capital, and entrepreneurship. Individuals who provide these factor services get payment in the form of rent, wages/salaries, interest, and profit respectively. The total sum of income received by these individuals comprises the national income for a given period of time.
Besides these, there are professionals who employ their own labor and capital like consultants, doctors, barbers, etc. The income of these individuals is called mixed incomes and is also accounted for calculating the national income. However, income received in the form of transfer payments is not included.
Thus, according to this method,
GDP= RI+W+I+Up+D+Dt+D…
Where;
RI= Rent (Rental incomes on agricultural and non-agricultural properties)
W=Wages/Salaries (Wages and salaries earned by employees including supplements
I= Interest (Net interest earned by individuals other than governmental bodies)
Up=Undistributed Profit (Profits earned by businesses before payment of corporate taxes and liabilities)
D=Dividends
Dt=Direct taxes
D=Depreciation
iii. Expenditure Method/appraoch
The expenditure method measures the national income as the sum total of expenditures made by individuals on personal consumption, firms on private investments, and government authorities on government purchases.
Since incomes from production are earned as a result of expenditure made by other entities on the produced goods and services within the economy, the result of expenditure method should be same total as the product method. However, with an exception of avoiding intermediate expenditure in order to avoid the problem of double counting, national income under expenditure method can be expressed as
GDP= C + I + G + (X – M)
Where,
C= Consumption Expenditure (Expenditure on durable goods such as furniture, cars, and non-durable goods such as food);
I= Investment Expenditure (Private investment in capital goods or producer goods such as buildings, machinery, etc.);
G= Government Expenditure (Government expenses for maintaining law and order, developing pre-requisites of development, etc.);
(X-M)= Net Export (Difference between imports and exports)
Identical results of the approaches to national income
The national income accounts are based on the idea that the amount of economic activity that occur during period of time can be measured in terms of:
1. The amount of output produced during certain period excluding output used up in intermediate stages of production (product approach);
2. The income received by sellers of output (income approach);
3. The amount of spending by the buyers of the output (expenditure approach).
Meaning that, unless there are errors such as incomplete or misreported data, all the three approaches of measuring national income are expected to give the same (identical) results. This is shown below.
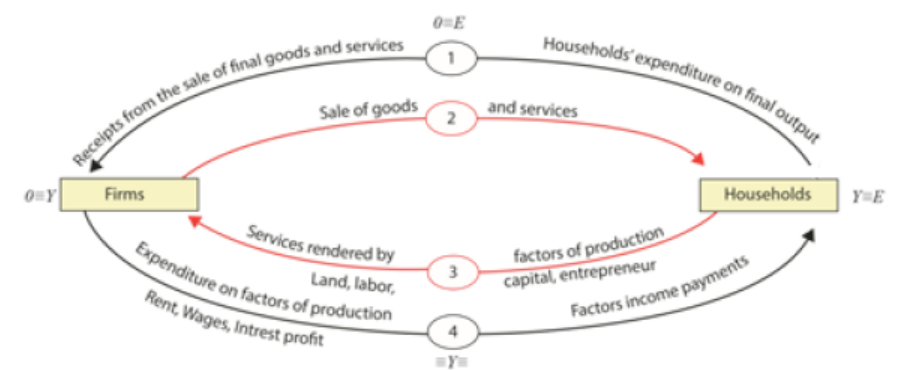
Figure 3: Identical results of the approaches to national income
From Figure 4 above:
- The expenditure on goods and services in the market is paid out to the
factors of production as rewards for their contribution to the production of
goods and services in form of wages, interests, rent, profits, and, therefore,
the income approach is equivalent to the expenditure approach, i.e. Y≡E.
- The money value of goods and services produced by the firms is reflected
in the prices paid for them in the market a n d , there fore, the output approach is equivalent to the expenditure approach,
- i.e. O≡E.
- The value of goods and services produced by firms is also reflected in the incomes received by the different factors of production, therefore, the output approach is equivalent to the income approach, i.e. O≡Y.
- Since Y≡ E, O≡ E, O≡ Y, therefore, O≡ Y≡ E
Example:
Given the table below, we can calculate GDP by use of 3 approaches and you will notice that all the 3 approaches give the same results.
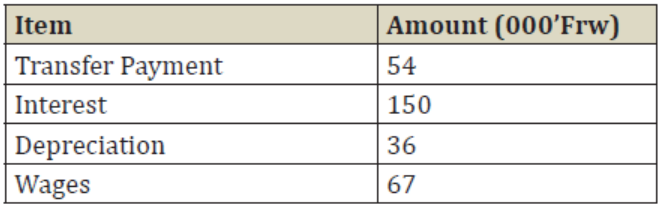
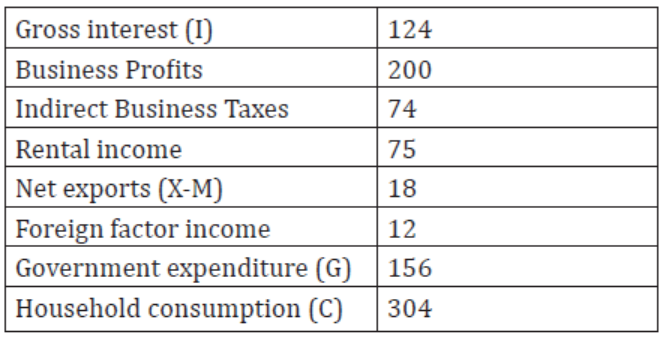
As you can see, the table contains variety of data, so you have to select which data fit into the approach you want to use. In this sense, by expenditure approach;
GDP =C+G+I+(X-M)
Where C = 304
G = 156
I = 124
X-M = 18
Therefore: GDP = 304+156+124+18=602Frw
By using income approach, we can get:
NI = W+R+I+PR
Where W = 67
R = 75
I = 150
PR = 200
NI =67+75+150+200=492 FRW
Recall, determining GDP using income approach:
GDP =NI+Indirect business taxes +depreciation
GDP = 492+74+36=602 Frw
As you can see, in this example, both approaches to calculate GDP will give the same result/estimate. However, this is not always what happens and sometimes GDP will differ slightly when different approaches used.
2.1.4 The circular flow of income
This is a system that illustrates the flow of resources and commodities and the flow of expenditure and incomes between households and firms. The flow of resources and commodities is known as real flow while the flowof receipts and incomes is called money flow. Therefore, the circular flow of income involves both real and money flows.
a. Circular flow of income in a closed economy
A closed economy is that economy that doesn’t take part in international trade. In this economy, the flow of resources and commodities and flow of expenditure and incomes is between households and firms.
Assumptions underlying the circular flow of income in a closed income.
- Only 2 sectors exist i.e. the business or firm sector and the household sector (C+I).
- The household sector consists of the owners of factors of production and consuming class.
- No production takes place in the household sector.
- The firm sector is the sole producer of goods and services for all the household sector.
- Output produced is sold i.e. no inventories or unsold stock.
- All incomes earned are spent i.e. no savings (it is a spend thrift economy)
- There is no international trade i.e. no economic relations with other countries.
- There is no government intervention;
Basing on the above assumptions, the circular flow of income would appear as follows;
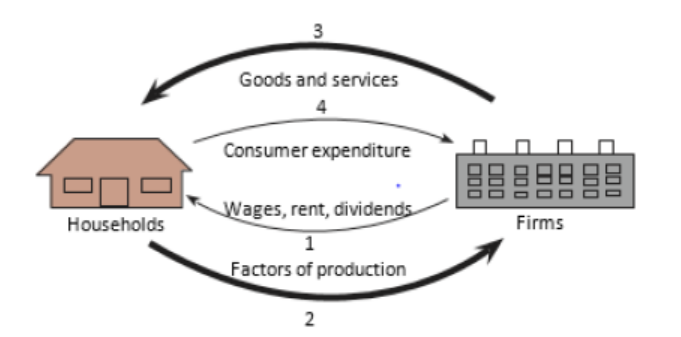
Figure 4: Circular flow of income in a closed economy
From Figure 4 above, we note the following:
- Firms buy factors of production from households (2) and pay for these factors of production (1). Firms use the factors of production to produce goods and services which they sell to households (3). In turn, households pay for these goods and services (4).
- Arrow (2) and arrow (3) show real flows, i.e. the flow of factors of production and commodities, respectively.
- Arrow (1) and arrow (4) show monetary/financial flows, i.e. flow of income and expenditure, respectively.
- The value of goods and services (output approach) is equal to households’ expenditure on them (expenditure approach), O=E.
- Receipts received by firms from sale of goods and services (expenditure approach) are spent on buying factors of production (income approach), E=Y. The value of the goods and services is also reflected in the incomes received by the factors of production, O=Y. Therefore, the three approaches should give equivalent results if there are no errors,
i.e. O ≡ Y ≡ E.
b. Circular flow of income in an open economy
An open economy is that economy that has economic relationship with outside countries, i.e. there is international trade, so as to protect infant industries, check on profit repatriation by foreign investors and save the volume of foreign savings injected into the domestic economy. It tends to utilise other sources apart from the household to provide capital, which is injected into the circular flow of income.
The sources could be foreign investment and the government. In an open economy, both domestic and foreign firms interact, thus it involves domestic
households, domestic producers, government interference and the foreign sector as well. Thus, showing how the economic agents interact, i.e.
C+ I+ G + (X-M).
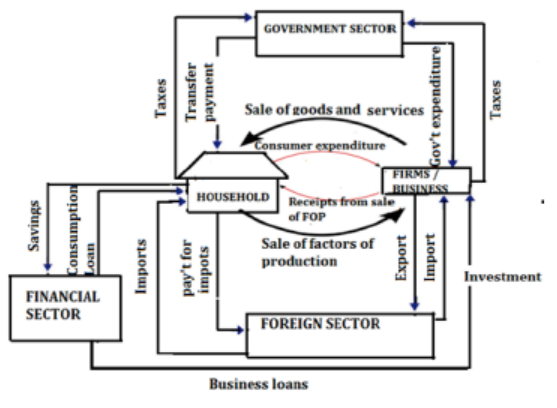
Figure 5: Circular flow of income in an open economy
From Figure 5 above, it is noted that:
- The household owns all factors of production and hires them to the domestic producers. In turn, they receive income in form of rent, salaries, interest and profits from the business sector (domestic producers) which is used to pay for goods and services from the producers. The remaining income after consumption is used to make savings through financial system which lend to the business firms.
- Firms buy factors of production from domestic households and use them to provide goods and services which are consumed locally and at times exported to the foreign sector. When they run short of funds for paying for factor services and investment, they have to borrow from the financial institutions in order to raise capital to produce.
- Taxes are paid to the government by firms’ profits.
- The state spends the tax revenue received to provide social services to the people.
- The foreign sector provides market, i.e. for domestic exports and providing imports to the domestic households.
- The financial sectors stand between savers (households) and borrowers (investors) by receiving savings from households on which it pays interest. It provides business loans for firms for investment on which it charges interest which is higher than that paid to depositors. The difference is the surplus for this sector.
2.1.5. Factors determining the level of national income
There are many determinants or factors which influence the size of the national income. They, in brief, are as follows:
1. Stock of natural resources: These include resources such as land, minerals, soils, etc. When such resources are available and exploited, national income will be high but if they are scarce and not exploited, national income will be low.
2. Availability of capital: When capital in form of machines and money is available, national income will be high compared to when capital is scarce.
3. Technological progress: Once technology is advanced, output will increase and national income will be his/her than when technology is outdated.
4. Human resource: If the country’s labour force is highly productive with good entrepreneur skills, national income will be high compared to when the quality of labour is low.
5. Political situation: Political stability will lead to increase in productivity and high national income while instability will cause low production and national income.
6. Level of market: A big market for goods and services will lead to high productivity and national income; while a small market will discourage production, hence low income.
7. Level of infrastructure development: Once infrastructure such as roads and communication, among others, are well developed, it will encourage investment, hence increasing national income. But when they are under developed, national income will be low.
8. Government policy of taxation and subsidisation: Once the government overtaxes the people, it will discourage investment and national income will be low but once the government subsidises the people, investment and national income will increase.
9. Organisation of factors of production: Once factor inputs such as land, labour and capital are well coordinated and organised, national income will be higher than when these factors are poorly coordinated.
10. Institutional factors such as culture, religion and people’s attitude towards work. If people’s attitudes towards work are high, national income will be high but low attitude will lead to low national income.
2.1.6 Importance and difficulties in measuring national income
ACTIVITY 2.3
Rwanda is ranked among the fastest developing economies in the world. Both the country’s nationals and non-nationals have witnessed the outstanding development in in all sectors of the economy. The GDP growth rate is at 8.6% in 2018 (Minecofin, key statistics of 2018).
1. Do you think producing figures of the country annually is necessary? why
2. What do you think are the difficulties encountered in measuring national income?
a. Importance of National Income Statistics
National income data/statistics are of great importance for the economy of a country. It tells us aggregates of a national income, output and product result from the incomes of different individual products or industries and transactions of international trade. It is thus important to compile national income data because of the following reasons:
1. National policy analysis: For example, policies on employment can be based on the level of output, investment, etc;
2. Research: Both economy and social research can be carried out in respect of incomes, savings, investments, consumption patterns, etc. Data on these indicators can be got from the statistics of national income;
3. Per capita income (national income divided by total population) is a good indicator of improvement or decline in the standard of living;
4. National income statistics show the distribution of income among the various factors of production and sectors of the economy, namely: the household, business and the government sectors. This is important in planning for taxes and governments expenditure;
5. They are important in estimating the level of international transactions and the degree to which an economy depends on other economies. This can be estimated from the figures of imports and exports;
6. They show the patterns of expenditure: This is shown by figures of private and public expenditure. This is important in the making of the national budget where there is the need to estimate private and public expenditure;
7. They show regional performance and improvements: Incomes of different regions in the country can be compared so as to make plans on how to improve backward regions;
8. They are used for international comparisons which are necessary if improvement in economic performance is to be achieved;
9. They are used for comparisons of economic performance in one country over time so as to make improvements;
10. They show the rate of resource utilization: The increase in national income may be the result of increased utilization of national resources;
11. They measure the size of various economic sectors, i.e. agriculture, industry and infrastructure or monetary and subsistence sector. This is helpful in tracing the source of economic growth and allocation of resources among these sectors.
b. Difficulties of measuring national income in LDCs
There are a number of statistical and conceptual problems which are encountered when measuring national income. Conceptual problems are those problems that arise from the interpretation of the subject matter of national income for example, defining the boundary of production.
While statistical problems are those that arise from the exercise of collecting and processing national income data, such as inadequate information, lack of enough qualified personnel, etc.
A combination of both statistical and conceptual problems includes the following:
1. Defining the term nation: There is difficulty in defining the term nation in national income. Every country has its own political boundaries but in national income estimation, the term nation includes the income earned by nationals of a country in a foreign country beyond the territorial boundaries of the country in question;
2. Double counting: There is a possibility of counting some commodities more than once. For example, wheat as an intermediate good may be counted and at the same time bread as the final good;
3. Non-monetary output: National income is measured in monetary terms, but there are some goods and services which are difficult to measure in monetary terms, for example, Subsistence output, services of housewives, etc. All these activities add to economic welfare and all use economic resources yet none of them is included in official measures of national income and product. This leads to underestimation of national income;
4. Inadequate information especially on private expenditure and other private incomes, information on fisheries, crops and animal husbandry, among others, on which very little data is available leads to national income figures underestimated;
5. Shortage of facilities such as computers to collect and process national income data may also bring about statistical errors when computing national income;
6. Price changes: When the price level in the country rises, national income also shows an increase although the production level may have fallen. Also, there might be a decrease in the price and national income also shows a reduction although production levels may have increased. Thus, due to price changes, national income cannot be adequately measured;
7. Timing of production: It is very difficult to determine output produced in the country during the year. For example, crops may stay in the field for more than one year and there is a likelihood that they may be counted year after year;
8. Inflation: Changes in prices affect the value of GNP and the effect of inflation is difficult to adjust accurately;
9. It is difficult to determine transfer payments such as unemployment benefits, gifts, etc. It is hard to tell whether such payments were received as a result of providing services or not yet they are part of the incomes of the giver;
10. Omissions from GDP: There are activities that may be omitted from national income such as prostitution and smuggling, among others. Although those bring welfare and incomes to the people, they are not included when calculating national income. Therefore, it leaves national income figures underestimated;
11. It is difficult to determine net exports and income earned from abroad since import and export trade is carried out by many people or groups of people also there are lots of goods that come in and go out undetected due to smuggling.
c. Shortcomings of using national income figures
National income data are highly useful in several ways, but it is necessary to use them with caution. They have the following shortcomings:
1. Comparison between countries: The per capita income of a country whose principal diet is rice and fish as in Korea is not comparable with Rwanda’s, where the diet is so much varied. Money units do not measure these differences in the kinds of products consumed;
2. Changes in the country’s stock of capital: National income statistics do not consider the changes in the country’s stock of capital equipment. The calculation of depreciation on capital goods is not accurate;
3. Changes in quality: The qualitative aspect is totally ignored. The GNP figures do not take into account the quality of goods and services;
4. Marketed activities: National income data are confined to goods and services sold in the market. But, in the majority of underdeveloped countries, most production takes place in the homes of people. Measures of national income confined to production for home consumption underestimate per capita income in such countries, since the national income is underestimated;
5. Use of national income figures over a long period: For shorter periods of two or three years, comparisons of income totals are valid for most purposes. But over a longer span of time, they can be misleading. Over a longer period, a number of new products may appear in the economy and a number of old products may disappear. It, therefore, becomes difficult to compare two periods with unlike items.
APPLICATION ACTIVITY 2.1
1. Differentiate between GDP and GNP
2. Suppose an economy has only three producing units, (a) an enterprise engaged in cutting trees, (b) another engaged in converting trees cut by the first enterprise into wood and (c) a third engaged in converting wood, produced by the second enterprise into tables. Further, suppose that the first enterprise engaged in cutting trees does not require any raw materials for undertaking its activity. Analyse the table below and determine the value added of these three enterprises over a year.
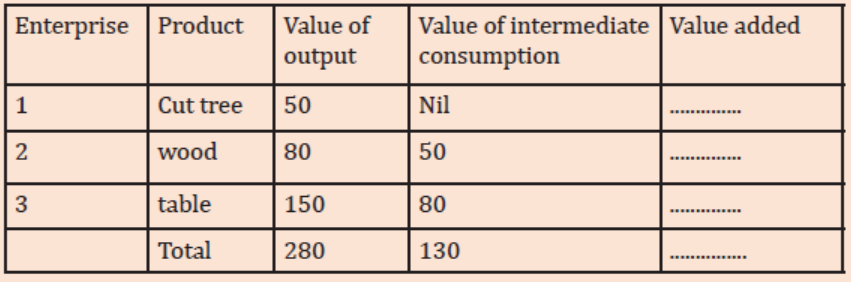
3. Explain the factors determining national income
4. Give the importance and difficulties in measuring national income
2.2. National Income equilibrium Approaches
ACTIVITY 2.4
Carry out research and answer the following:
1. What is equilibrium?
2. Explain situations when national income is in equilibrium.
3. Illustrate the situations for national income equilibrium.
4. The additions to the circular flow of income are called………..,
while the withdraws are called……………….
5. The situation when aggregate demand is greater than aggregate
supply at full employment is known as……… and when
aggregate supply is greater that aggregate demand at full
employment is known as………
6. With illustrations, explain how the gaps in (5) above can be closed.
2.2.1 Meaning of equilibrium
Equilibrium can be defined as a state of stability in economic conditions irrespective of the forces influencing different economic agents.
That is, there is no tendency for consumers and firms to change their economic behaviour. This means that the variables in an economy are equal and have no tendency to change. As already pointed out, during equilibrium, national product and national income must be equal and also national income is equal to national expenditure since it is derived from this income.
2.2.2 Equilibrium level of national income
We combine the aggregate demand and supply curves to determine the equilibrium level of national income. When we impose the AD on the AS as shown in figure below, we note that AD is greatest at lower prices, whilst AS is at its highest when prices are higher. The equilibrium, in the macro sense, will
occur at the level of real national income or output at which the total planned expenditure on output equals the quantity of goods and services firms are willing and able to supply.
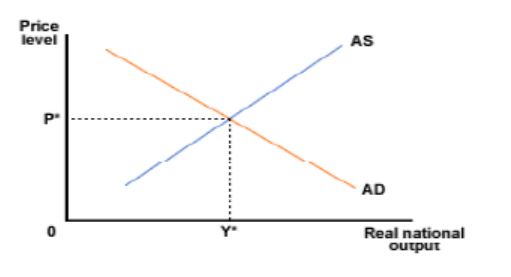
From the figure above, equilibrium level of national income is obtained at an output level of Y* and a price level of P*. If nothing changes then the economy will be stable at this equilibrium, but any changes in aggregate supply and demand will lead to changes in output and the price level.
2.2.3. Approaches of measuring national income equilibrium
We can measure national income equilibrium level using various approaches. Under this unit, we shall consider; leakages-injections and inflationary and deflationary approaches in measuring national income equilibrium.
a. National income equilibrium: leakages – injections approach National income is in equilibrium when total leakages are equal to total injections.
Leakages refer to elements which withdraw money from the circular flow of income. They include savings -S, consumption-C, taxation -T, imports-M and capital outflow-Ko. These elements remove money from the circular flow of income, i.e. C+S+M+K0
Injections refer to elements that add to the circular flow of income. They include investment-I, consumption-C, Government expenditure-G, exports-X and capital inflow-Ki. These elements add money to the economic activities in an economy, i.e. C+I+G+ +X+ Ki
Thus, national income is in equilibrium when C+S+M+K0=C+ I+ G+ X+ Ki
i. National income equilibrium in a closed/two sector economy
A closed economy is one where transactions take place within the country without any foreign trade. The major factors, which determine the level of income (Y), are consumption (C), saving (S) and investment (I). The country’s
income can be used for the consumption and saving. These are known as leakages or withdrawals. The identity is Y = C + S. If the level of income is to be maintained, saving must be put back into the economy in form of investment so as to create more income.
Consumption must also take place. These are known as injections. The identity is C+I =Y. Therefore, we have Y = C + S and Y = C +I; equating the two expressions yields C + S = C + I = Y. In a closed economy without government, equilibrium income is a situation where savings are equal to investments. This can be illustrated as below:
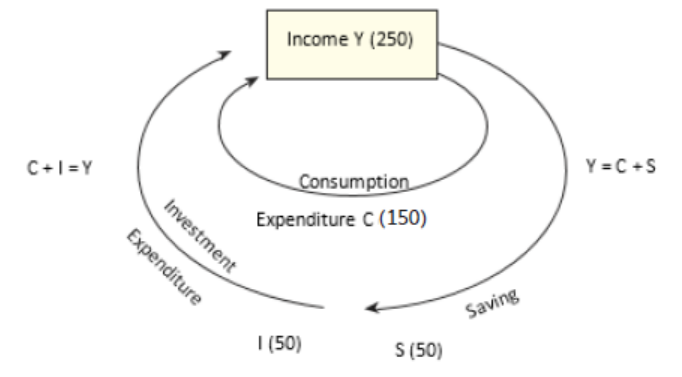
Figure 6: National income equilibrium in a closed economy
The left hand side of the Figure shows how income is being created through consumption and investment. The right hand side shows how income is being used through consumption and saving. Our objective is to determine precisely the equilibrium level of GDP and to see what factors it depends upon. Thus, C+I=C+S=Y which then means I (an injection) =S (a leakage) in a closed economy.
Equilibrium income determining: Saving-investment approaches
Total withdrawals from and injections into the circular flow determine equilibrium national income. In a two-sector/closed economy, withdrawal comprises only saving while injection comprises only investment. Equilibrium national income is determined at that point when planned saving and planned investment are equal to each other. Diagrammatically, at the intersection of the saving and investment line, equilibrium national income (Y0) is determined.
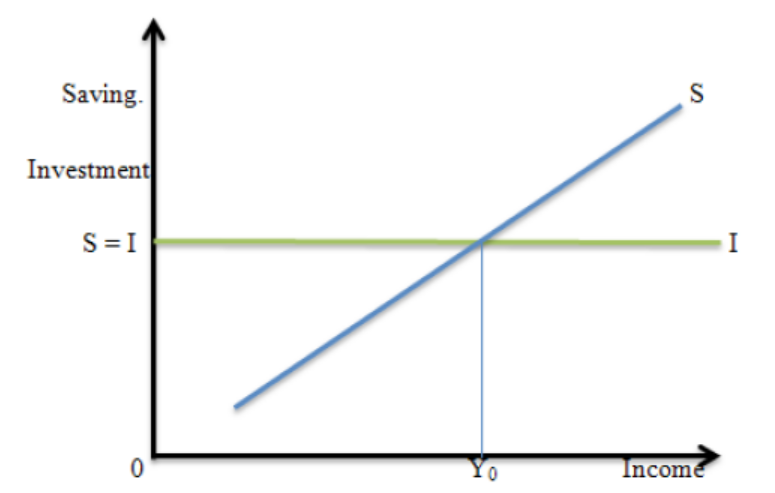
Figure7: Saving-investment approaches
From Figure 7 above, it is seen that equilibrium income can also be determined through the saving- investment approach. Planned saving is equal to planned investment. The intersection of the saving and investment schedules determines equilibrium income and output at (Y0). The savings are positively related to the income, while investment is autonomous.
The economy will reach equilibrium at full employment only if the amount that consumers wish to save out of their income is precisely equal to the amount that investors want to invest. At any income below (Y0) , planned investment exceeds planned saving. Aggregate demand exceeds aggregate supply. This forces investors to increase the rate of production until Y . At any level of income beyond Y , savings exceed investment. Aggregate supply exceeds aggregate demand. Consequently, there are unsold inventories and investors will be forced to reduce the rate of production until S =I.
Example
In Determining an equilibrium national income in a two-sector /closed economy model, lets assume consumption (C) is given by the consumption function C = 5 + 0.8Y
Where Y is income
Assume that investment is autonomous (I) and is given by I = 10
It says that investment is an exogenous variable. As it is determined outside the
model, investment is simply considered as given.
With this information, we want to derive the equilibrium values of income,
consumption, saving and investment.
Solution:
Equilibrium condition is Y = C + I, where C = a + bY and I = Î.
Putting the values of C and I, we obtain
Y = a + bY + Î (i)
Y – bY = a + Î
Y (I – b) = a + Î
Therefore,
Here, Y is the equilibrium level of income. Substituting the consumption and
investment equations into equation Y, we get
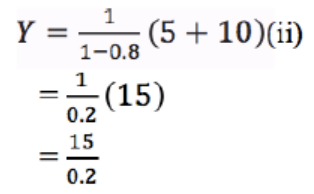
Y=75
Thus, C = 5 + 0.8(75) =65, and
S = Y – C = 75 – 65 =10
I =10
The above approach has an alternative approach, known as saving-investment approach.
Alternative Solution:
Equilibrium condition now is S = I
S = Y – C
= Y – a – bY
= – a + (1 – b) Y
Assuming Î = Î, the equilibrium condition becomes
– a + (1- b) Y = Î
So the equilibrium level of income is
From the consumption function C = 5 + 0.8Y we find the values of -a and (1 – b). If a = 5 then (-a) = -5 and if b = .8 then (1 – b) = 0.2. Now putting these values into saving and investment equation, we get
– 5 + 0.2Y = 10
0.2Y – 5 = 10
0.2Y =10 + 5
Or, Y = 15/0.2 = 75
If Y = 75, saving must be equal to 10 since consumption is 65.
Note that since the two forms of equilibrium condition are equivalent, the level of income must be the same.
Exercise 2.1
Suppose S = - 40 + 0.20Y and I = 60. Find the equilibrium income, saving and consumption.
ii. National income equilibrium in an open economy
An Open economy is one where there is foreign trade. So far, we have dealt with a very simple economy consisting of only households and businesses. All the income created in the process of production was passed on to households as disposable income. Thus, GNP and disposable income were identical.
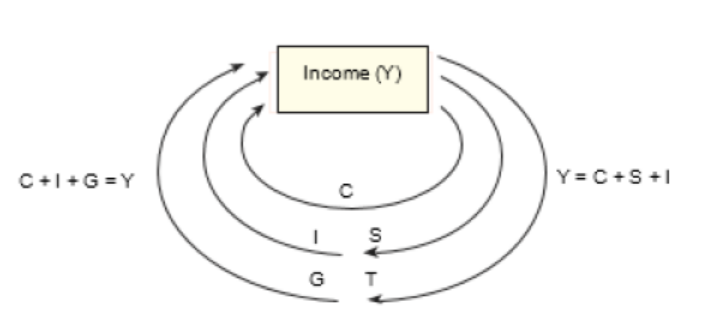
Figure 8 National income equilibrium in a closed governed economy
From Figure 8 above, in our simple economy, when the government sector is added, it levies taxes and makes expenditures on the purchase of goods and services. The government also makes transfer payments. Aggregate demand now consists of consumption (C) investment (I) and government demand for goods and services (G). Therefore, C + I + G = Y. Not all the income from the production of output is disposable income to the households. A portion is now absorbed by the government as net tax receipts.
Net tax receipts are total tax receipts less that portion which is returned to the private sector in the form of government transfer payments. While government tax receipts reduce disposable income, government transfer payments such as unemployment allowances increase disposable income.
The income is used for consumption, saving and tax.
Y = C + S + T. Therefore, equilibrium income is where S + T = I + G, i.e. leakages = injections. When government expenditure is added on, the equilibrium income increases from Y1 to Yθ where I + G = S+ T.
Equilibrium income determining: The leakages-injections approach
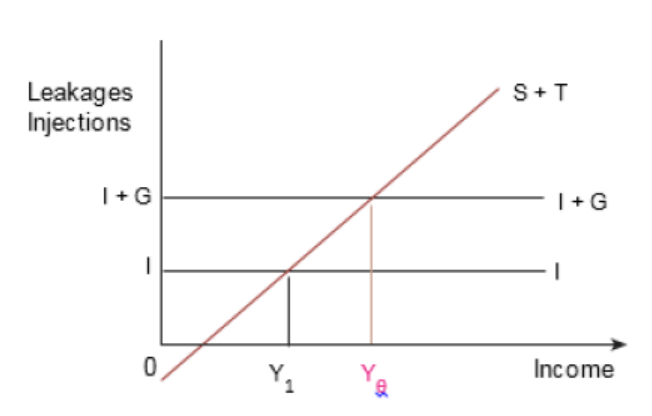
Figure 9. The leakages-injections approach
When the foreign sector is introduced, income is created through consumption, investment, government expenditure and exports. Thus, C + I + G + X = Y. The income is used for consumption, saving, tax and imports. This is indicated by the following equation Y=C+S+T+ M.
Equilibrium income is, therefore, equal to S + T + M = I+ G + X. Leakages =
injections. The equilibrium income is indicated in Figure below;
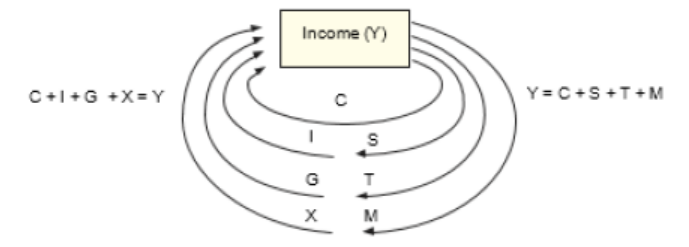
Figure 10 Equilibrium income with the foreign sector (open economy)
From Figure 10, it is seen that when the foreign sector is added on, injections become C + I +G + X and leakages become C + S + T + M. Therefore, the equilibrium income increases to Ye where, I+ G + X = S + T + M.
Equilibrium income determining: Leakages-injections approach
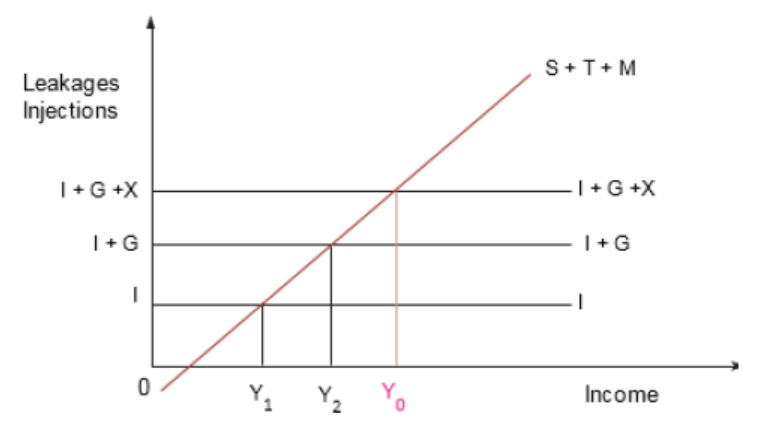
Figure 11: Leakages-injections approach
From Figure 11 above, investment, government spending and exports are known as the injections into the flow of income. They increase the circular flow of income. Savings, taxes and imports are referred to as withdrawals or leakages from the flow. They reduce the country’s income—the circular flow of income.
The condition for the equilibrium income is that injections = leakages. When injections exceed leakage, the level of income increases whereas if leakages exceed injections, the income level reduces.
Mathematically, when determining equilibrium income in an open economy we can demonstrate it as below;
Y=C+Id +G+(X-M)
Where; C =a+bYd
Id =Î
G =Ĝ
x=x^
Yd =Y-Ť
M =Ḿ+gY
By substituting the values of different constant variables in national income equation we get
Y= a+bYd+ Î+ Ĝ+ Ẋ+ Ḿ+gY
Given Yd =Y.Ť, then;
Y=a+b(Y- Ť))+ Î+ Ĝ+(Ẋ-(Ḿ+gY))
Y=a+bY-b Ť+ Î+ Ĝ+Ẋ+Ḿ-gY
Y - bY + gY = a- b Ť+ Î+ Ĝ+Ẋ+Ḿ
Y(1 - b + g) =a - b Ť+ Î+ Ĝ+Ẋ+Ḿ
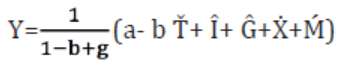
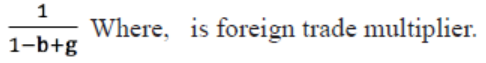
Recall, total demand for national output equals national output. But national expenditure (C + Id + G) does not have to equal national output, even in equilibrium, if the economy is open. Equilibrium still means what it did with a closed economy, which is to say that there is no change in inventories. Equilibrium in no way implies trade balance.
Example
Suppose
C = 10 + .8(Y- Ť)
S=-10+.2(Y-Ť)
Id =23
G=10
T=10
M=.3Y
X = 15
Find the equilibrium income (Y)
Solution
Y= C+Id+G+(X-M)
Y=10+0.8(Y-10)+23+10+15-0.3Y
Y=50+0.5Y
0.5Y=50
Y=1000
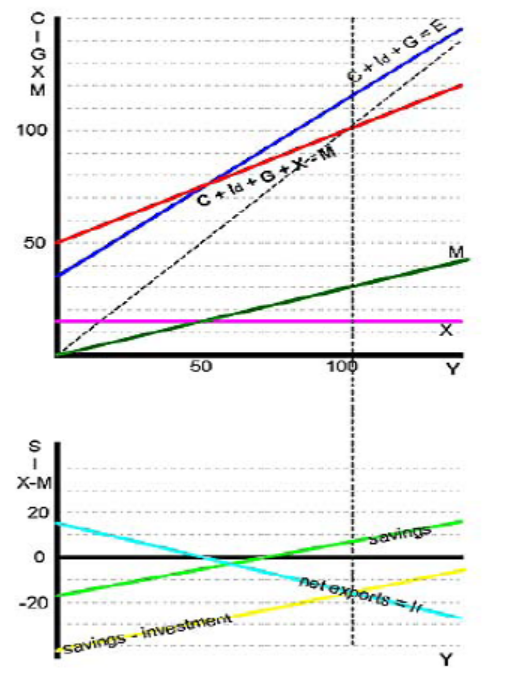
Figure 12: Diagrammatically, the above situation can be shown below;
From the diagram, it is important to note that, the lower part of the diagram graphs net exports and the gap between savings and domestic investment. Savings is also graphed by itself. Here equilibrium is the point where the amount of financing forthcoming from foreigners is enough to fill the domestic savings-investment gap.
b. Inflationary and deflationary gaps approach
National income equilibrium: Inflationary gap and deflationary gap approach. According to the classical economists, equilibrium income is determined where aggregate demand is equal to aggregate supply. At such a point, savings are
equal to investment, and all the resources are fully employed.
Keynes, on the other hand, disagrees with this analysis. According to him, full employment level of income (Yf ) may not equal to the equilibrium income (Ye). It is possible to have (Yf ) being greater than (Ye ) and hence the deflationary gap. It is also possible to have (Ye ) being greater than (Yf) and hence the inflationary gap.
A deflationary gap is a situation where aggregate supply exceeds aggregate demand at full employment. All that is produced is not demanded. Realised investment is greater than the actual demand. A deflationary gap is caused by deficiency in demand.
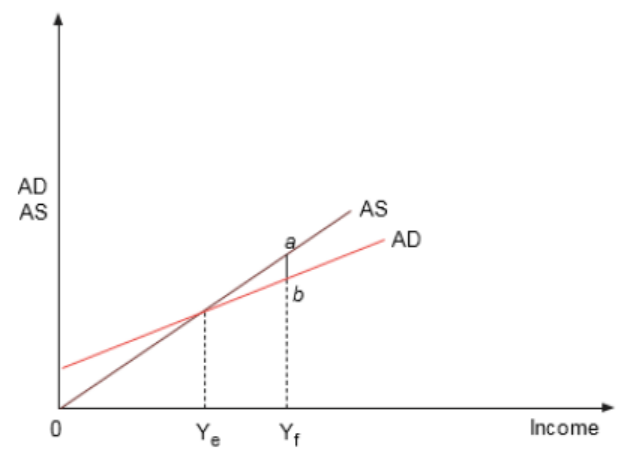
Figure 13 Deflationary gap
From the figure 13, gap a-b is deflationary gap and it can be closed by increasing aggregate demand from aggregate demand (1) to aggregate demand (2) and this can be done through using the policies that increase demand for goods and services.
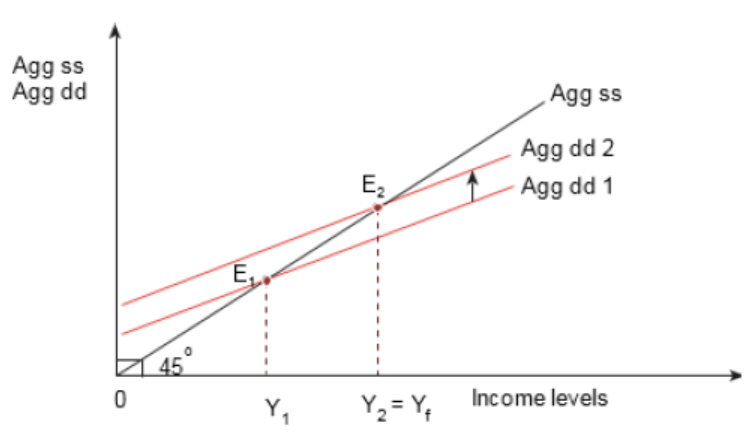
Figure14: Closing a deflationary gap
From Figure 14 above, Agg ss- aggregate supply, Agg dd- aggregate demand, E1- equilibrium 1, E2 equilibrium 2, Y1 – income 1, Y2= Yf – shows full employment levels of resources.
Policies that can be used to increase aggregate demand
- Increasing the volume of exports so as to get rid of the surplus;
- Discouraging imports so as to avoid increasing the volume of goods in the country;
- Adopting an expansionary monetary policy – This will help to increase money in the hands of the people, hence increase their demand;
- Increasing government expenditure – This will also increase money in the hands of the people, hence increasing their demand;
- Increasing wages such that the people can have access to income and increase demand;
- Reducing taxes – This will increase the disposable income in the hands of the people, hence increasing their demand;
- Adopting price control especially maximum price which is low and will encourage demand.
An inflationary gap is a situation where aggregate demand exceeds aggregate supply at full employment level. Realised investment is less than actual demand. Supply is not enough.
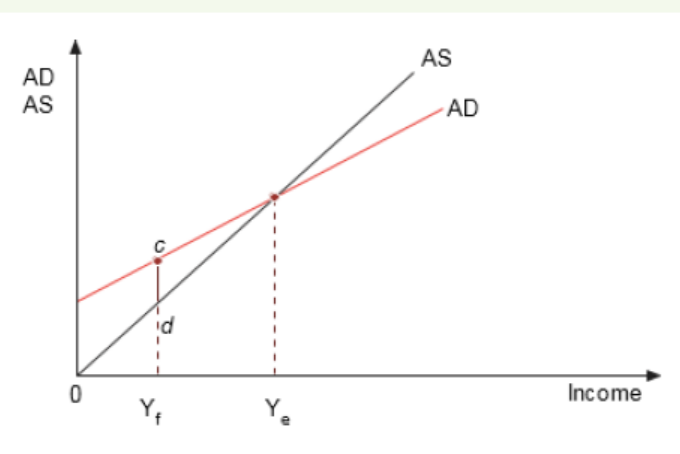
Figure 15: An inflation
From Figure above, gap c-d is an inflationary gap.
At point (Ye ), national income is in equilibrium when aggregate demand is equal to aggregate supply. Before (Ye ), aggregate demand exceeds aggregate supply and this is called an inflationary gap. It can be closed by reducing aggregate
demand from aggregate demand (1) to aggregate demand (2) as shown below and this can be done through the policies which reduce the money in the hands of the people so that because of little income, demand is also reduced.
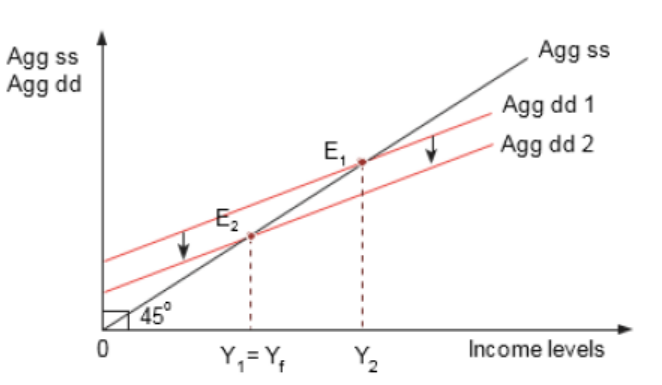
Figure16 : Closing an inflationary gap
From Figure 16, Agg ss- aggregate supply, Agg dd- aggregate demand, E1- equilibrium 1, E2 equilibrium 2, Y1= Yf shows full employment levels of resources, Y2- income.
Policies that can be used to reduce aggregate demand
- Adopting a restrictive monetary policy – This will reduce the amount of money supply and hence lower aggregate demand;
- Increased imports – This can help to increase the volume of goods available when demand is greater than supply;
- Reduced exports – This is to reduce the amount of goods going out of the country so as to make them enough for the people;
- Increased taxes – This is to help reduce the disposable income of the people so that they do not have a lot to spend;
- Reduced government spending – This is aimed at reducing and controlling the amount of money in circulation which leads to limited liquidity and low demand;
- Adopt price control especially minimum price legislation which is a high price that can reduce the demand for goods and services;
- Reducing wages by adopting a tight income and wage policy.
c. Fluctuations in level of economic activities
In any given economy, economic conditions and circumstances do not remain constant over a long period. There are always upward and downward swings in business activities or trade.
According to Professor Mitchell, it is a type of fluctuations found in aggregate economic activities of nations that organise their work mainly in business enterprises.
The course of trend of business activities passes through phases of prosperity and adversity which are referred to as trade/business cycles. They occur in every economy periodically and they follow a particular pattern. Each cycle takes a different period from the other and a time taken in each cycle is different in different economies.
A typical business cycle is generally divided into 4 phases although some scholars argue that they are five as seen below.
- Boom phase (upswing)
- Recession phase (upper turning point)
- Depression or slump or trough phase ( downswing)
- Recovery phase (lower turning point)
- Prosperity
There are basically four stages of business growth although some scholars argue that they are five as seen below.
1. Expansion (Boom)
This is a stage where business activities are at high levels and they tend to acquire profits. The business is normally in the upswing mode as shown by the high levels of economic activities. It is characterised by the following:
- There is increase in the demand for both capital and consumer goods.
- Companies invest in more production facilities with a view of making profits from the increase in sales.
- Banks lend capital for expansion at low rates because they have confidence in the investors paying back.
- There are high rates of employment brought about by high aggregate demand and investments.
- Business is at its peak and makes supernormal profits.
2. Recession
This stage is the upper turning point and shows that the economy is in a decline as shown by the characteristics below:
- Level of sales and production orders start declining.
- Production facilities become underutilised.
- Companies reduce the work rate.
- Workers hired on casual basis are laid off.
- There is reduction in the level of output.
- Banks raise the interest rates to counter the rise in risk of default on loans.
- Most of the companies reduce the price of their goods so that they can increase demand.
3. Depression
This is the bottom of a cycle where economic activity remains at a low level.
It has the following characteristics:
- Demand for products and services reduce, forcing some companies to shut down some production facilities.
- There are rampant cases of unemployment brought by closing of industries.
- There are high rates of poverty.
- The purchasing power in an economy becomes very low.
- The gross domestic product declines and so does the standard of living of the people.
- The fall in price of capital goods is more than that of consumer goods.
- Demand for loans declines because the investors become irritated by the economic situation.
4. Recovery
This is the stage where business begins regaining its strength. Business may sell output at very low prices to retain the operating costs; carry out some repairs; or gets some credit, among others. This helps it to begin moving from the trough. The stage is characterised by the following:
- Business become confident in the market and they begin buying goods so the business begins making profits.
- The bank rates become low so the companies can afford to borrow and finance projects.
- There is an increase in production because of increase in aggregate demand.
- Companies begin employing people and so there is a reduction in unemployment levels.
- Standards of living of the people improve since they can afford to buy goods and services.
- Profit margins of business start rising and the gross domestic product also begins to rise.
5. Prosperity
This is where business regains its strength and activities are at their peak.
The following are its characteristics:
- There are high employment levels in an economy.
- There are high incomes due to the employment levels.
- High levels of production is common at this stage.
- There is high aggregate demand and cost which leads to a rise in
investment and prices for goods and services.
- The existing capacity of plants is under utilised.
This can be illustrated in the figure below.
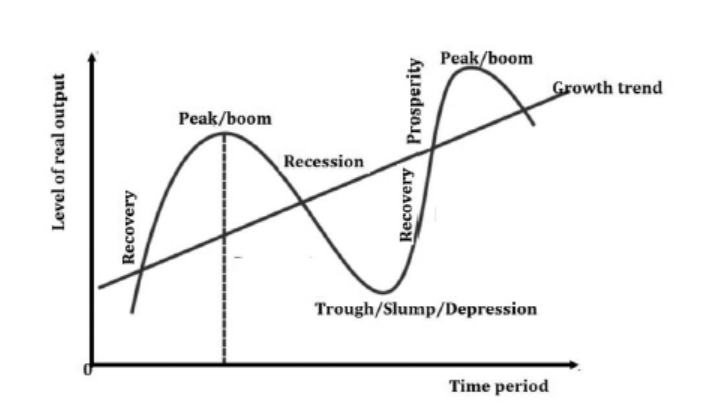
Figure 17: Business cycle
From the figure above, we notice that the phases of a business cycle follow a wave-like pattern over time with regard to GDP (real output), with expansion leading to a peak and then followed by contraction.
APPLICATION ACTIVITY 2.2
1. Why is it important to determine equilibrium level of national income where AD=AS? Graphically explain your argument.
2. Given an economy where consumption function is given by C=25+0.75(Y-T) and taxes are autonomous equaling to 20M frw, government spending is constant (autonomous) and equal to 30M frw, investment spending (autonomous) is 40M frw, and net exports (autonomous) are -5M frw. In this kind of economy, assume there is no inflation and aggregate price level is constant.
a. Calculate the level of equilibrium income
b. Illustrate the graph of consumption function
c. Describe the economy’s trade situation by explaining the value of exports and imports.
d. Suppose that the full employment level of output for this economy is Yfe = 292 million frw. The Minister of Finance and Economic Planning has a goal of keeping prices constant and doesn’t want the economy to be dragged by inflation. As a staff in the ministry of finance and economic planning you are requested to prepare a report on 3 fiscal policies (spending policy, tax policy, and balanced budget policy) to restore the economy to full employment. Prepare that report outlining the three fiscal policies that could be pursued. Show the mathematical analytics behind each of these policies.
3. By use of graph, distinguish between inflationary and deflationary gap.
2.3. National income and standards of living
2.3.1. Meaning of standard of living
ACTIVITY 2.5
Mr Bucyana and Mrs Mutesi are two nationals of Rwanda who earn 30,000 and 100,000 FRW, respectively. However, after compiling statistics by the national institute of statistics of Rwanda (NISR), it is shown that they all earn the same amount 65,000 FRW.
When you compare their average earnings and that of an American, it is very low and hence their standard of living and way of life is still low. From the case study above, respond to the following questions.
1. What economic term is given to the average amount that they both earn?
2. Explain reasons to explain why you think the average income they earn is low.
3. Give reasons to explain why the average income they get is not a good measure of standard of living in:
a. A country over a period of time.
b. Between two countries.
4. What should be based on to determine good or bad conditions of living in a country or between countries.
National income of a given country reflects the way of life of its people during a specified period. The way of life people lives or hope to live is what we call standard of living. The higher the level of national income, the higher the standard of living and vise-versa. Holding other factors constant. The standard of living will depend on the average income of the people in the country at a particular time.
To maintain a given standard of living an individual or region or country has to incur certain expenses in real or nominal terms (cost of living). The key difference between cost of living and standard of living is that cost of living is the cost (expenses) of maintaining a certain level of living in a specific geographical region whereas standard of living is the level of wealth, comfort, material goods and necessities available in a geographical region, typically a country. The cost of living is defined as the cost incurred to maintain a certain level of living in a given geographical location, e.g. a country. It indicates how a country is fairing economically and it changes as time changes.
2.3.2: Factors that determine standard of living in a country:
Standard of living is a composite of different factors that are generally believed to enhance the quality of life of individuals in a population. A number of factors include among others the following.
- Level of Productivity: The total amount of goods and services which a country is able to produce, and hence the standard of living it can provide to its people, depends upon the levels of productivity in different branches of economic activity such as agriculture, industry, transport, etc. The higher the productivity per person engaged in agriculture, industry, etc., the higher will be the national output and the standard of living of the people and vice versa.
- Terms of Trade: The average standard of living in a country depends not only on the physical productivities of its people but also on the prices of goods it exports and the prices of goods it imports (i.e., terms of trade). If the terms of trade are more favorable for a country, it can import comparatively larger amount of goods for a given amount of exports and hence its standard of living will be higher and vice versa.
- Size of Population: Given the total national income or output of a country, the greater the size of its population, the lower will be its average standard of living. It is the per capita income which in fact determines the average standard of living in a country. Relative to its resources, a country which is over-populated i.e. has crossed the optimum size of population, has a poor standard of living than a country with optimum population. This brings down the per capita income which is the most important single factor that determines the standard of living. Thus, a comparatively smaller size of population accompanied with a high level of national income and productivity leads to higher the standard of living and vice versa.
- Distribution of National Income: If there is large inequality in the distribution of income among the population, then the standard of living of a few rich people will be very high, while the standard of living of the masses of the people will be extremely low. Thus, fair income distribution indicates better living standard than unfair income distribution.
- Natural resource endowment: A country endowed with natural resources has its people with high standard of living than a country with low levels of resource endowment. This is because natural resource, once well exploited, i.e. existence and proper exploitation of resources indicate high production and thus standard of living of a country and vice versa.
- Level of Education: Educated people tend to have higher standard of living than the uneducated. You cannot expect a higher living standard from the illiterate and ignorant people because their health care system and social services is poor. Even if the illiterate and uneducated people happen to have large incomes, they would either hoard them or waste or misuse them in useless social ceremonies or by indulging in evil habits such as drinking, gambling, etc.
- General Price Level: The higher the general price levels of goods and services, the lower the standard of living and vice versa. This is because as prices increase, the cost of living also increases. For determining peoples’ standard of living, it is not enough to take into account only their money income, but what the income is capable of buying in terms of goods and services, i.e., their real income is more important for this purpose. That depends largely on the price level, particularly that of the goods and services which enter into peoples’ consumption. Other things being equal, if the price level in country “Y” is higher than in “Z”, the standard of living will be lower in “Y” than in “Z”.
- Real income: Real income is the purchasing power of nominal income. Or its income expressed in terms of goods and services. The higher the real income, the higher the standard of living and vice versa.
- Poverty rate: Poverty is the inability of a person to obtain the basic necessities of live. A country with higher the rates of poverty indicate low standard of living than a country with reduced or no poverty
- Quality and affordability of housing: Housing is one of the basic necessities of life. Better quality and affordable housing imply a high
standard of living and vice versa. Some people in some countries in LDCs don’t have easy access to proper housing facilities which indicates poor living standard.
- Quality and availability of employment: The higher the levels of employment the higher the levels of earnings and standard of living and vice versa. This means that people are able to afford the necessities of life and meet the costs of living thereof.
- Inflation rate: The higher the inflation rates the higher the cost of living and thus low standard of living and vice versa.
- Life expectancy. This refers to the average number of years a human being is expected to live after birth. i.e. it’s the person’s expected life span. A high life expectancy indicates high standard of living and vice versa.
- Incidence of disease: A healthy population indicates high standard of living than a diseased one.
- Economic climate Economic stability promotes better standard of living than an economically unstable economy. For example, where there is low or no levels of unemployment, stable prices and exchange rates etc. people have high incomes and are capable of maintaining their living standards and vice versa.
- Political climate: Politically stable country has its people with high standard of living than a politically unstable. This is because people are denied chance to acquire necessities to maintain their standard of living and freedom of expression and interaction which affects their state of mind.
- Social freedom: In a country that has high social freedom and personal freedom of man be enhanced, respected and promoted by the government, makes people feel happy because they are given comprehensive development in a free society, thus a high standard of living and vice versa.
- Income levels: The number of necessaries, comforts and luxuries which people enjoy are very largely governed by their income. The poor people’s standard must be very low and that of a rich very high. This is because the purchasing power or earning power of the poor people is less than that of the rich.
- Size of the Family: Coupled with people’s income, the size of the family also helps in determining standard of living. In a large family, the family income will be thinly spread over the family and the standard of living will be lowered. Other things being equal, the smaller the size of the family, the higher is likely to be the standard of living and vice versa.
- Family Traditions: People who inherit certain standard of living from their parents will be maintained somehow. Departure from the traditional standard of the family is not easy. One can inherit a better or poor standard of living.
- Social customs and conventions: Peoples’ standard of living, are affected by social customs and conventions since they live in a society and normally follow the norms and practices obtaining in it. Rigid and traditional social customs and conventions hinder improvement in standard of living. While flexible social customs and conventions make ways for better standard of living. Social conventions compel people to spend heavily on their children or even on donations to others children’s marriages, boost their funerals etc. all which are very expensive. Such acts drain peoples’ income and worsen their living standards and vice versa.
- Development levels: The higher the development levels of a country, the higher the living standard of its people and vice versa. E.g. developed agriculture, Trade, industry, transport, banking, infrastructure etc. This is because the country’s output increases as such sectors and activities are developed resulting into a high standard of living.
- Climatic Factor: Living standards of people who depend on out-door activities are largely affected by climatic changes. When climate is favourable for them and their activities, standard of living is high than when the climatic conditions are unfavourable
- Religious freedom. If people are given freedom of worship, their standard of living is higher than where there is no religious freedom. Or Religions which are flexible promote good standard of living than religions which are rigid.
- Level of crime. The higher the level of crime, the lower the level of standard of living and vice versa. This is because crime creates insecurity for people in protection of lives and property, human rights and other things they care. Human cannot live and work with an anxious and restless mood. Therefore, labor productivity, satisfaction and quality of life begin to fall gradually. They are negative impact on living standards.
- Political freedom: this means the non-interference in the sovereignty of each individual by oppressive or aggressive individuals. in a country with political and freedoms, every citizen must have their full rights in the community and their own lives. This involves freedom of press, religion, speech, association, and thought etc. this makes people more comfortable, promotes education, journalism, speech and movement. all which promote high level of standard of living.
- Leisure accessibility: Leisure time shows happiness and stable mind of people. Therefore, people who have access to labour, enjoy a better standard of living than those who don’t.
2.3.3: Per capita income and standard of living.
Per capita income is income received per person in a period.
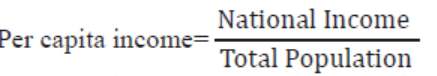
Per capital income is used as an indicator of the standard of living in a country and to compare standard of living between countries because it is available for all countries and it is the most relevant among other available measures.
Calculations of percapita income.
Example:
Given the Rwanda’s population in 2018 as 12,000,0000 and the nominal GDP as 9,000,000,000. We determine the per capita income as:
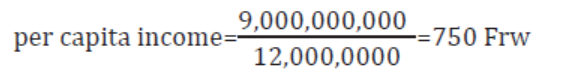
It is important to note that per capita income is expressed in monetary units and for the case of Rwanda, it is expressed in francs. From the example above, every nationals of Rwanda earns 750 Frw per annum.
Exercise 2.2:
Study the table below showing population and GNP of countries A and B and answer the questions that follow.
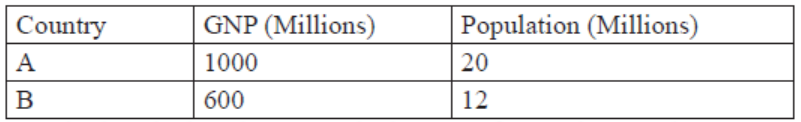
Required: Calculate the per-capita income of countries A and B
2.3.4: Comparisons of per capita income between periods in a
country and between countries.
a. Limitations of using per-capita income figures as a measure of good standard of living in a country for period of time
- Differences in income distribution: Per-capita income does not take into account the distribution of income. It may be high in the current period but when in hands of a few people and many are poor yet in the past it was low but equitably distributed so it may not reflect a good standard of living in the country between the two periods.
- Differences in the patterns of goods produced: Per-capita income does not take into account the pattern of goods produced either capital or consumer goods. It may be high in the current period but when capital goods are produced as compared to consumer goods that yield satisfaction to the consumers unlike in the past where more consumer goods which contribute to human welfare were produced.
- Differences in working conditions: Per-capita income does not consider the working conditions of the people. It may be high in the current period but when the working conditions of the people are poor as compared to the past when working conditions are favourable, so it may not reflect a good standard of living in the present than the past.
- Differences in leisure time enjoyed: Per-capita income does not take into account the amount of leisure. It may be high in the current period but when the people don’t have leisure yet we know that leisure is one of the attributes of good welfare so meaning the standard of living will be low. Unlike in the past where people would enjoy leisure comparatively.
- Differences in monetization of the economy: Per-capita income does not consider the level of subsistence sector. It looks at the monetary terms of the output but the subsistence sector where food is grown for home consumption is not considered yet it is a basis for good welfare in the rural areas. Per capita income may be high today due to more production for market, and less remains home for consumption which reduces people’s welfare, unlike in the past where more was produced for home consumption to improve people’s welfare.
- Differences in price levels: Per-capita income does not consider the level of prices. It may be high in the current period because the prices of goods and services are very high implying that the people cannot afford buying them hence leading to poor standard of living. Whereas in the past, prices of commodities might have been low thus affordable, indicating an improved peoples’ welfare.
- Differences in political climate: Per-capita income does into put into consideration the political climate. It may be high in the present day but when there is political instability in the country meaning that the people are always on the run. This may not show good standard of living unlike in the past though there’s low per capita income, but people were living peacefully.
- Difference in the quality of goods produced: Per-capita income does not consider the quality of goods produced. It may be high in the present day but when the quality of goods produced is low. This means that the quality of life of the people will also be poor, unlike in the past betterquality commodities were considered, a clear indication that peoples’ welfare was better than today.
- Differences in statistical data: Inaccurate statistical data e.g. population figures. It may be high but when the population figures given are inaccurate. This means that the per-capita income figures will not reflect what is actually on ground.
b. Limitations of using per-capita income figures as a measure of good standard of living between two countries in a period of time
Per-capita income can also be used to compare the standard of living between two different countries. The figures got from the different countries are compared and the country with a high per-capita income figure is assumed to be having a high standard of living. However, this is not true in reality as seen below:
- Differences in goods produced: Per capita income does not consider the types of goods produced. It may be high in the country which produces many capital goods which do not improve welfare directly in the short run, where as in another, they produce many or variety of consumer goods which improves welfare directly.
- Leisure enjoyment: It does not take into account leisure which contributes to welfare. Per capita income may be high in a country where people work hard and forego leisure, which may be on top of their scale of preferences than another country which values leisure time.
- Transport differences: Two countries may produce the same quantity and quality of product but may have different figures of per capita income because of the difference in transport costs.
- Per capita income figures do not reflect some factors, which influence the welfare of the people. For example, it may be high in a country where there are wars, accidents, diseases, pollution etc.
- Differences in population figures: In LDC’s, it is likely that population
figures are inaccurate because of inadequate facilities and therefore the
figures for per capita income are unreliable.
- Per capita income may be underestimated in a country where there are omissions in measuring GNP e.g. due to a large fraction of subsistence sector, high non-monetary output etc.
- Differences in boundaries of production: There are people who live on illegal activities like gambling and smuggling, which are not included in national income figures.
- Countries use different concepts and definitions of national income. For example, some countries value subsistence output while other do not, others use GNP at factor cost while others use GNP at market prices, etc.
- Differences in Income distribution: A country may have high-income per capita figures when income is in the hands of few people while the majority of the population is suffering which may not be the case with the other country.
- Price structures: figures of national income may be high because of inflation and this does not mean that people are better off. Also, a commodity may be cheap in one country and expensive in another but generate the same welfare.
- Per capita income may be high in a country where there is unemployment which affects welfare of affected people/household while in another, percapita may be low but the majority are employed.
2.3.5. Factors influencing the increased per capita income
- Levels of education: This allows people to get employed in different sectors of economy, thus increased levels of income and in the end increased per capita income.
- Infrastructure development, such as roads facilitates movement of people and their goods from one place to another. This further increases the level of earnings of the people and as output will be able to reach the market where it is highly demanded.
- Development of entrepreneurship: Entrepreneurship development boosts the business sector and employs more factors of production such as labour.
- Technological development: When the level of technology increases, level of production also increases leading to increased income and thus increase in the levels of per capita income.
- Improved terms of trade: When the country’s revenue from exports is more than that from imports, it means that the country doing well and this will positively affect the per capita income of the country.
2.3.6. Causes of low per capita income in developing countries
- Low levels of education: This makes the people get casual low paying jobs leading to low levels of income and in the end the per capita income will be low.
- Under developed infrastructure especially in the rural areas: This complicates movement of people and their goods from one place to another. This, further limits the level of earnings of the people and some of the output may remain unsold.
- High levels of unemployment: Lack of jobs means that the output in the country will be low leading to a low national income and per capita income figures.
- Low levels of income: Some institutions give people low incomes despite their high contributions to the economy. Some may end up getting subsistence wage that will reflect a low income per person.
- Dependence of agriculture which depends on climate: Agriculture in Rwanda depends on climate and in situations where there is a mismatch between the seasons, the farmers suffer with no output and income leading to low income per person.
- Large subsistence sector: This yields little income since only the incidental surplus is sold. Most of the foods grown here are for home consumption implying that the there are no incomes expected during the production process.
- Unbalanced development: Some areas are highly developed with many economic activities while others are lagging behind in terms of development. The least developed areas yield low productivity and the general national income will be affected, leading to a low per capita income.
- Lack of capital to invest in businesses: There is still lack of enough capital to invest in production activities. This is evidenced by the low level of manufacturing industries. This leads to low productivity, low national income and finally low per capita income.
- Low prices of agriculture products: This accompanied by high rates of price fluctuation and little earnings from the agricultural sector, leading to low national income and hence low income per person.
APPLICATION ACTIVITY 2.3
“The per capita income of USA is almost ten times than that of Rwanda, meaning that the level of well being of Americans is far better than that of people in Rwanda”. With examples, examine the relevancy of the statement.
2.4. Income inequalities
Using the photographs a, b, c and d: in the figure beow
1. Describe the photographs provided.
2. What term is given to the differences in the appearances in the
photographs below? What causes it?
3. Explain the advantages and disadvantages of some people or
areas being richer than others.
4. Suggest what can be done by the government of Rwanda to ensure that all the people and regions are equally the same in terms of resources.
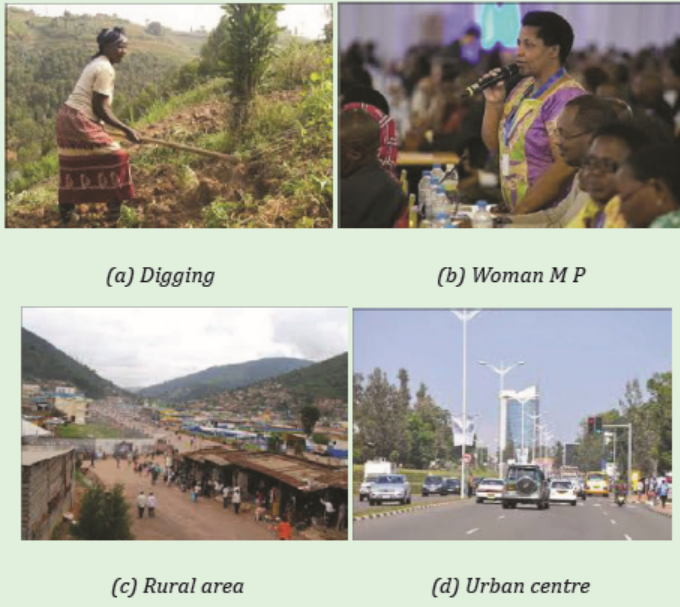
Figure18: Income distribution
2.4.1. Meaning of income inequality
Income distribution refers to the way income is spread among various social groups in an economy. It may be between different people in the same region or in another region or it may be how resources are distributed in different regions.
Inequality means an instance of being unequal which may imply difference in size, degree or circumstances, among others. In economics though, inequality is always talked of in terms following forms or types:
Types of inequality
1. Personal inequality: refers to the economic difference between the very poor and the rich people in society.
2. Regional inequality: refers to a situation where there is a difference in terms of resource endowments, developments through infrastructure such as roads and industries, among others. These make one region appear different and more developed than others.
3. National inequality: This is where some countries are richer than others in terms of resources and development.
4. Sector inequality: This where some sectors are richer and developed compared to other sectors e.g. Industrial sector being more developed than agriculture sector.
5. Occupational inequality: This where some occupations are more advanced in terms of technology used and payments etc. than other occupations.
2.4.2. Causes to income inequality
Income inequalities may be among different social groups or even among people in the same social group. Income inequality is caused by historical, geographical, social, economic and political factors as explained below:
- Differences in distribution of resources, for instance, people who have access to fertile land are likely to get more income than those who live on marginal land, for example pastoralists.
- Differences in social and economic infrastructure such as roads to ease the transportation of goods and services from one area to another.
- Government policies such as a regressive tax which taxes the poor more than the rich causes income differences.
- Historical factors for example one can get much income because of inheriting property from rich parents. In rural areas, most people become rich because of inheriting land.
- Differences in natural abilities, for example, when one is physically handicapped, he/she is likely to have less income than one who is physically well.
- Differences in employment, i.e. some jobs bring in more money than others, hence income inequality.
- Differences in education levels: Educated people have higher chances of being employed and earning higher salaries than the illiterate.
- Uneven distribution of investment opportunities: Most of the investments are done in the urban centers and others are neglected, hence leading to regional inequalities.
- Difference in sex: Females are generally poorer than males because of limited access to income-generating properties such as land and credit.
Lorenz curve
The Lorenz curve is a graphical representation of the distribution of income or wealth in an economy. It was developed by Otto Max Lorenz in 1905 to represent the inequality of wealth distribution.
- It is based on two pieces of information, income and population.
- To draw it, information is required on both (income and population) and then formed into two variables that reflect the cumulative value of income and the population.
- On the horizontal axis we sort the cumulative population in the ascending order of income, with the lowest income first followed by the second lowest and so on. Hence the first 20% of the population will necessarily be the poorest 20% of the entire population.
- It looks at the line of perfect equality where there it is assumed to be income equality and as we move away from the line, the gap between the rich and the poor also increases.
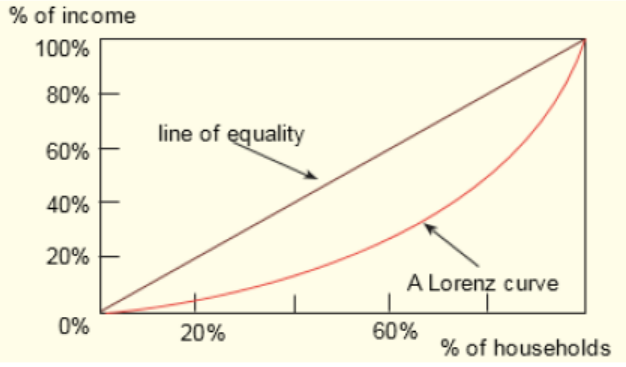
Figure 19: Lorenz Curve
From Figure above, the further away the Lorenz curve from the line of perfect equality, the more the income inequality. And the nearer the Lorenz curve to from the line of perfect equality, the less the income inequality.
Gini coefficient
This is also known as the Gini index or the Gini ratio and it is the measure of statistical dispersion intended to represent the income distribution of a nation’s residents. The Gini coefficient is a number between 0 and 1 where 0 corresponds to perfect equality (where everyone has the same income) and 1 corresponds to perfect inequality (where one person has all the income and everyone else has zero income).
2.4.3. Effects of income inequalities
Positive effects
- Income is in hands of few people who can invest it and produce commodities for other people and the society at large.
- It encourages the poor to work hard so as to survive in the ever changing economy.
- It encourages savings among the rich which can be used for further investments, employment creation and production of goods and services.
- The rich can invest in research and innovations and improve technologies and this can help to speed up production and economic growth.
- The few rich employ the poor through investments in industries and factories, hence improving their standard of living.
- More tax revenue is realised by taxing the rich and this can lead to increase in national income through progressive taxation.
- The poor take up low category jobs such as cleaners, mortuary attendants etc. which would have nobody to take them up if all people were in the same average class.
- The rich invest in assets, which increase the wealth of the country.
- Foreign exchange is earned by rich export firms. This, through export promotion industries, can lead to increase in the foreign exchange earnings and reduce the balance of payment problems of a country.
Negative effects
- There is minimum economic welfare of some group of people because of absolute poverty, i.e. inability to purchase basic needs.
- Reduction in aggregate demand: The rich have a lower marginal propensity to consume than the poor. The poor people are left with little money to purchase commodities. The reduction in aggregate demand discourages investment.
- Misallocation of resources: The very rich people spend on luxuries, leaving the poor to go without basic needs.
- Capital outflow especially when the very rich are non-citizens who always repatriate their earnings to their home countries – In countries which are politically unstable, rich people prefer to invest/ bank their money in other countries where there is political stability.
- It leads to a reduction in government revenue since the majority of the people would be having little or no incomes to tax.
- It leads to social disharmony whereby the poor feel neglected and not catered for which results into political instability.
- It leads to failure of government programs when the majority have no adequate means to participate in development activities.
- Regional imbalances come up because the regions with resources develop at the expense of others without resources.
2.4.4: Solutions to income inequality in Rwanda
- Education reforms have been undertaken. This has helped many people to access education so that they can be prepared to get jobs
- Land tenure reforms: This is through land redistribution policies and making it accessible to all people in society so that they can be able to carry out agriculture.
- Kick-start funds such as the “one cow per family” have helped people to access cows that can be used as a source of income through selling the milk.
- Progressive taxation: This has reduced the gap between the rich and the poor people since the revenues collected are used to subsidise the poor.
- Improving infrastructure such as roads which helps in the movement of people and goods from areas of production to markets helps people to increase their earnings.
- Liberalisation of the economy: This has helped people to participate in economic activities and trade, hence increasing their incomes and standards of living.
- Controlling population growth: This has helped to reduce the ratio of resources to the population and also dependence burden among the families.
- Modernising agriculture: This has helped reduce the level of poverty in rural areas where the activity is fully based. The people are able to increase the quality and quantity of their products, hence receiving more incomes.
- Improvement of the investment climate: This has been through giving tax holidays and free land such as the free investment zone in Masoro. This has attracted more investors, hence creating employment opportunities.
- Improvement of the political climate: This has created good environment for production whereby the people are not scared of carrying out any activity.
- Encouraging development of small-scale enterprises: These have also created more employment for the people in Rwanda, hence improving their standard of living.
- Formation of co-operatives: This has been the basis for reducing income inequalities among the people. These cooperatives such as Saccos, for example, umurenge sacco, umwarimu sacco, producer co-operatives, among others, have encouraged micro savings and given small loans to the local people.
APPLICATION ACTIVITY 2.4
1. Visit your sector and collect data on population and income earned by different groups, use the data to plot Lorenz curve.
2. Assume you are among the policy makers in the country, which policy measures can you put in place to reduce income inequality
END UNIT ASSESSMENT
1. Examine why the government of Rwanda undertakes compilation of annual gross domestic product.
a. Analyse the measures that the government of Rwanda can undertake to improve the level of gross domestic product.
b. Given that the per-capita income of an average Kenyan is three times greater than that of an average Rwandan, does it necessarily mean that an average Kenyan is better off than an average Rwandan?
2. Why are the figures not a good measure for standard of living in the country?
3. Explain how the construction of good roads may help to increase national income of Rwanda.