Topic outline
General
- UNIT 1 MARKET STRUCTURES File Uploaded 2/11/21, 16:15
Key unit Competency: Analyse the operation of firms under different market structures.
INTRODUCTORY ACTIVITY
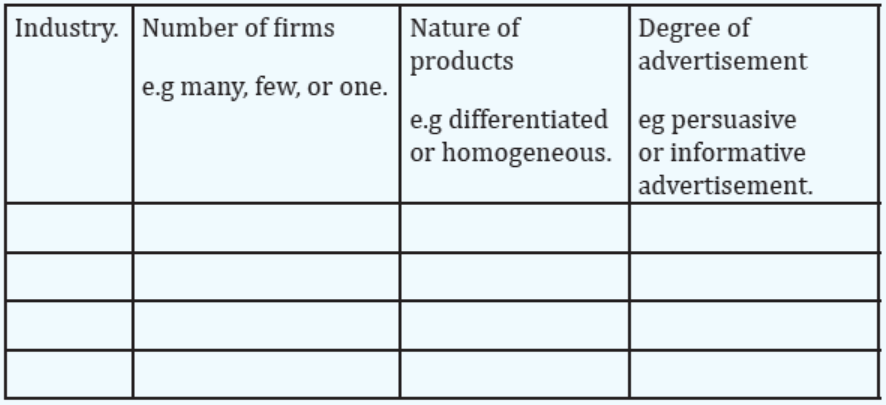
Rwanda has many industries operating in different forms. Given the table below, analyze these industries in terms of their number, the nature of products they produce and the degree of advertisment, arrange your findings in a table to enable you categorize according to their similarities.
INDUSTRIES:
Air travel industry; Hotel industry; Banking industry; Water and sanitation services; Petroleum products industry; Newspaper industry; Hydro power industry; Telecommunication industry;
1.1. Introduction to market structure
ACTIVITY 1.1
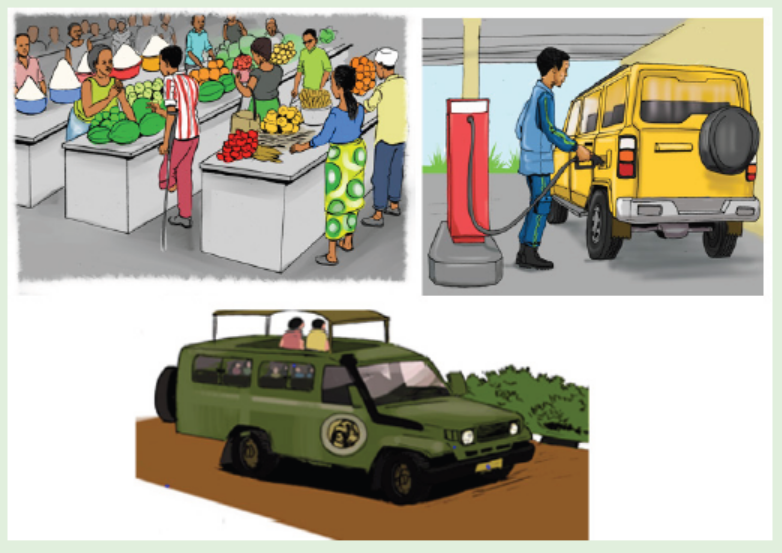
Analyse the activities taking place in the pictures below. Identify the commodities being sold in there.
Do you notice any relationship between the markets in the pictures in terms of nature of commodities sold and the number of firms dealing in these commodities etc. Then identify the type of market structures in the picture shown below.
1.1.1. Meaning of market structures.
A market is any arrangement that brings buyers and sellers into close contact
to transact business with an aim of making profits. It may be a physical place,
communication through telephone, fax and mail. Different markets have
different characteristics, participants and conditions; thus markets differ in
many ways. The conditions that prevail in the market which determine how
the market players operate are what we call the market structures. Therefore,
market structure is a range of unique features or characteristics which
influence the behaviour, conduct and performance of firms which operate in a particular market.
1.1.2. Categories of market structures.
Market structures are classified into two categories:
1. Perfect markets: These are markets where buyers and sellers are
numerous and price cannot be manipulated. These include perfect
competition markets.
2. Imperfect markets: These are markets where individual buyers and
sellers can influence prices and production. These include monopoly,
oligopoly, monopolistic competition etc.
The market structures mentioned above differ depending on:
- The number of firms in the market; either one, few or many.
- Nature of the product dealt with; whether homogeneous or differentiated or heterogeneous.
- Entry and exit restrictions; either free entry, limited or highly restricted.
- Cost conditions.
- Degree of market information; Consumer informed or not informed about the market.
- Firms ability to influence demand through advertising.
- Degree of government interference.
APPLICATION ACTIVITY 1.1
1. a) Identify the firms operating in the banking sector.
b) Which types of products do they offer?
c) What means do they use to attract customers?
2. a) Identify the firms operating in the energy sector?
b) Which types of product do they offer?
c) What means do they use to attract customers?
3. Determine the difference in the structure of the two sectors above.
ACTIVITY 1.2
Considering market conditions in Rwanda, Describe the firms in which the features in the chart below exist.

1.2.1 Meaning of perfect competition.
Perfect competition is a market structure where there are several buyers and
sellers (firms) dealing with homogeneous commodity and possessing perfect
information of market conditions at that particular time.
At times a distinction is made between pure competition and perfect competition.
Pure competition Perfect competition is a market structure where there are
several buyers and sellers (firms) dealing with a homogeneous commodity but
consumers and sellers do not possess perfect knowledge of market conditions
and there is no perfect mobility of factors of production.
Perfect competition, on the other hand, requires the fulfilment of two
additional conditions: Perfect mobility of factors of production and perfect knowledge of market conditions.
Therefore, perfect competition is a wider term than pure competition.
1.2.2. Features of perfect competition.
Perfect competition is said to exist where there are the following conditions or features:
- There are many buyers and sellers in the market. Firms are many such
that none of them controls the market conditions independently. Each firm
in the market is free to put to the market as much output as it can or wishes
at the ruling market price but cannot independently influence the price of
the commodity. Therefore, firms under perfect competition are price takers
i.e. they take the price that is determined by automatic forces of demand and
supply.
- There is product homogeneity i.e. all the commodities supplied in the market
are identical (the same). All firms in the industry produce homogeneous or the
same product such that no consumer has preference for the product of one firm over the other.
- There is free entry and exit in the market. Any firm with capital is free
to enter the market and start producing and any existing firm is free to stop
production and leave the market if it so wishes. On expectation of making
profits, firms can freely join the industry and can also freely leave the industry if they make losses.
- There is no government intervention in form of fixing prices. All participants in the market abide by the price that is set by forces of demand and supply. Such a price rules all over the market.
- There is stiff competition among firms such that less efficient firms are always kicked out of the business.
- The major aim of firms is profit maximization. This is attained at a point where the marginal cost is equal to the marginal revenue (MC= MR) as the necessary condition though not sufficient at lower levels of output, but becomes sufficient at higher levels of output.
- The firms under perfect competition do not incur transport costs. Under perfect competition it is assumed that the raw materials, the firm, the consumers, are all found in the same place or locality.
- There is perfect mobility of factors of production from one production unit
to another. Factors of production can easily move from low paid economic
activities to high paid economic activities.
- Buyers and sellers have perfect (complete) information about the
market conditions. It is assumed that the price, quality, quantity and the
location of the product in question are known by all the participants in
the market. If one firm charges a higher price than others, it would not
make any sales.
- There is no persuasive advertising since firms are producing homogeneous
products and the consumers have perfect knowledge about the market
conditions. However, there may be some informative advertisements to make
the consumers aware of the products.
- Under perfect competition, AR=MR because selling an extra unit of output
adds the same amount to the total Revenue since price is constant, In other
words; for the firm to sell an extra unit of output, has to sell it at the same
price like previous one..
- The demand curve of a perfect competitive firm is perfectly elastic. This
indicates a constant price for the whole industry. At this point the demand curve
is equal to marginal revenue (MR), equals to average revenue (AR) which is
equal to the price. (DD=MR=AR=P). Therefore, the firms in the industry are
price takers not price makers. No any firm in the industry can set its own price
but they all sell at the constant price set by forces of demand and supply.
NOTE: Entry barriers refer to economic, procedural, regulatory, or
technological factors that restrict entry of new firms into market. Such barriers may take the form of:
1. Clear product differentiation, necessitating heavy advertising expenditure to introduce new products.
2. Economies of scale necessitating heavy investment in large plants to achieve competitive pricing.
3. Restricted access to distribution channels.
4. Collusion on pricing and other restrictive trade practices by the producers or suppliers.
5. Limit pricing i.e. fixing the price so low to avoid entry of new competitors.
6. Well established brands. A brand is a name, term, design, symbol, or
any other feature that identifies one seller’s good or service as distinct from those of other sellers.
Barriers to exit also serve as barriers to entry because they make it difficult for a firm that make losses to exit the industry.
Examples of perfect competition;
In the real world, it’s hard to find examples of industries which fit all the criteria of ‘perfect information’. However, some industries are close and these may include:
1. Foreign exchange markets. Here currency is all homogeneous and traders will have access to many buyers and sellers and there will be good information about relative prices.
2. Agricultural markets. In some cases, there are several farmers selling identical products to the market e.g. potatoes, cassava, pineapples, Irish potatoes, tomatoes, maize, bananas etc. and many buyers.
3. Internet related industries. It is easy to compare prices quickly and efficiently and entry barriers are lower.
1.2.3. The demand curve for a firm under perfect competition
Each firm in a perfectly competitive market faces a perfectly elastic demand curve
because variations in the firm’s output have no noticeable effect on price. The
perfectly elastic demand curve does not indicate that the firm could actually sell
an infinite amount at the prevailing price. It only indicates that the variations in
production will leave price unchanged because their effect on total industry output
will be negligible. The firm’s output variation has only a tiny percentage effect
on industry output. The price is determined by the industry through forces of demand and supply
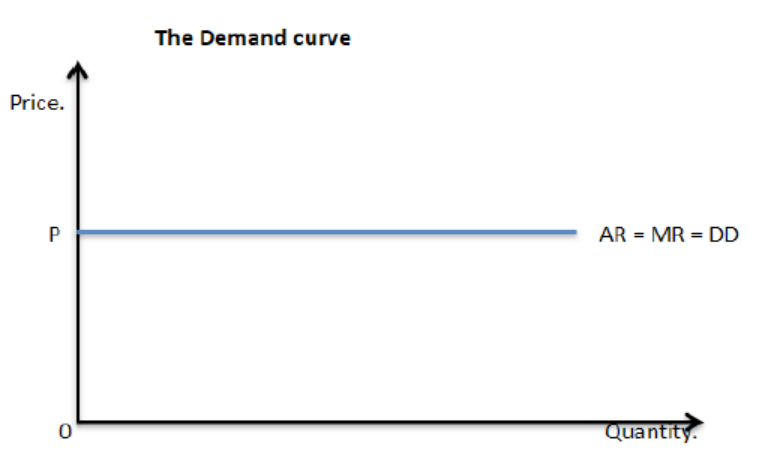
As shown in the figure above, the demand curve is equal to the average revenue
curve and equal to marginal revenue curve. (AR=MR=D) The AR curve is the
same as MR curve under perfect competition. This is because selling an extra
unit of output adds the same amount to the total revenue since price is constant.
ACTIVITY 1.3
Basing on your knowledge about the perfect competition,
Explain the meaning of the following terms and illustrate their curves.
i. MC
ii. MR under perfect competition.
iii. Illustrate the two curves on the same graph and identify the point
where they meet to determine the equilibrium.
1.2.4.1. Equilibrium position of the firm under Perfect competition.
Equilibrium can be defined as a state of balance when variables under
consideration have no tendencies to change. A firm is in equilibrium at the
point where MC= MR at this point, the firm is able to determine the output to
be produced and the price of that output. The firm maximises its profits by
equating its MC with its MR i.e MC= MR.
Conditions of Equilibrium of the firm and industry under Perfect competition
i. The MC curve must equal to MR curve. This is the first order and necessary
condition. But this is not a sufficient condition at lower output levels but
becomes sufficient condition at a higher output levels.
ii. The MC curve must cut the MR curve from below and after the point of
equilibrium it must be above the MR. This is the second order condition.
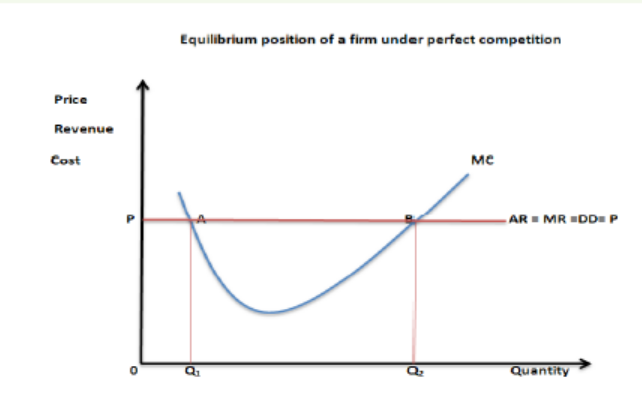
As shown in figure above at point A (output 0Q1), the firm is in equilibrium
i.e. MC = MR. However, this is not sufficient. It therefore requires the firm to
increase output to a higher output e.g. 0Q2 in order to fetch more revenue compared to the cost incurred in its production.
At point B the firm fulfils the sufficient condition of equilibrium by producing a
high output 0Q2 where MC= MR and MC is rising. Therefore, the equilibrium is at
point “B” where MC=MR and MC is rising thus fulfilling the necessary condition.
At equilibrium, the firm may either make abnormal profits or incur losses (subnormal
profits) depending on the level of average cost (AC).
1.2.4.2. Short run profit maximisation under perfect competition.
The firm will be in equilibrium at a point where marginal cost (MC) is equal to
marginal revenue (MR) and it will come under the following conditions:
- The average revenue (AR) must be greater than average cost (AC) i.e.
Average cost curve must be below the Average revenue curve.
- The average revenue curve determines the price while the Average cost curve determines the cost of the firm.
- Where AC curve meets the price-output line, we determine costs to the vertical axis.
- Marginal cost curve cuts the Average cost curve at the lowest point to mark the optimum point of the firm.
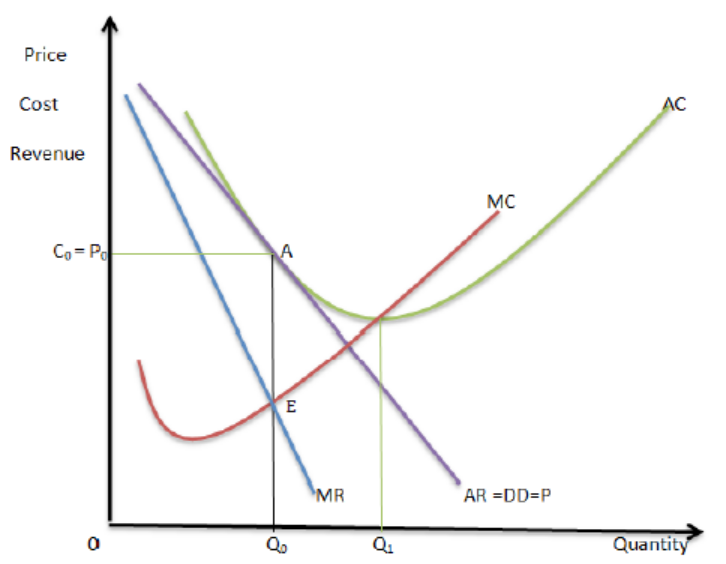
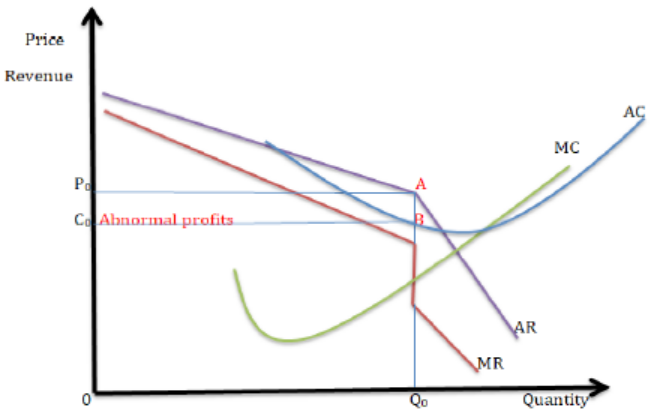
Illustration of short run profit maximisation under perfect competition
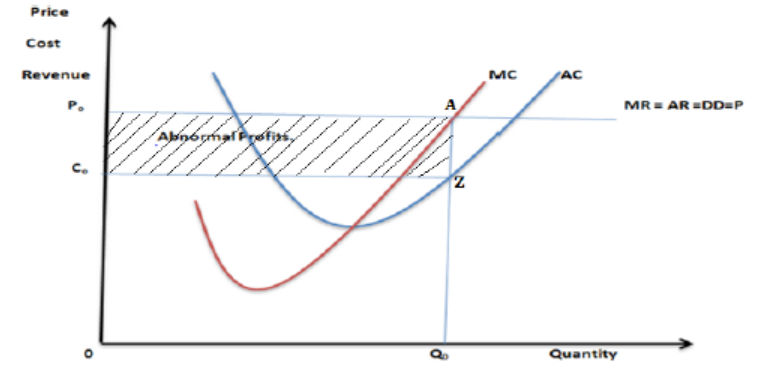
Output: The output that the firm produces is determined at the equilibrium
point where MC=MR at the biggest level of output. Thus output 0qo is the
equilibrium output.
Cost: The average cost of producing each unit of output 0qo is determined at a
point where the output line meets the AC curve. Thus 0co is the average cost of
producing each unit of output 0qo.
Price: The price at which the firm sells its output is determined at a point where
the output line meets the AR. Thus price 0po is the equilibrium price.
Profit: Along the equilibrium, AR is greater than AC and therefore the firm
earns Abnormal profits in the short run, as shown by the shaded area C0P0AZ
above
Example:
The marginal cost of paper bag making industry in Kayonza is given by,
MC = 20+2Q (which is always rising), where Q=100 paper bags.
Find the cost-maximizing quantity if P=30 or P=40
Answer:
P=D=AR=MR=MC
PC=MC, P-30
30=20+2Q
30-20=2Q
10=2Q
5=Q
P=MC, 40
40=20+2Q
10=Q
1.2.4.3. Long run equilibrium position under perfect competition.
Because of freedom of entry of new firms into the industry, in the long run, new
firms enter the market being attracted by the abnormal profits enjoyed in the
short run. As new firms enter, supply of the commodity increases leading to a reduction in the price level.
The increase in the number of firms will also result into increased competition
for factors of production which will cause the costs of production to rise. This
will push AC and MC curves upwards in the long run.
As prices in the market fall, abnormal profits will continue to reduce. Thus
firms make normal profits in the long run where AR=AC.
Long run situation comes under the following conditions;
- The average revenue (AR) must be equal to the average cost (AC) i.e.
Average cost curve must be tangent to the Average revenue line.
- The average revenue curve determines the price while the Average cost curve determines the cost of the firm.
- Where AC curve meets the price-output line, we determine costs to the
vertical axis. Since this time AC and AR are equal, the price line is the same as the costs line.
- Marginal cost curve cuts the Average cost curve at the lowest point to mark the optimum point of the firm.
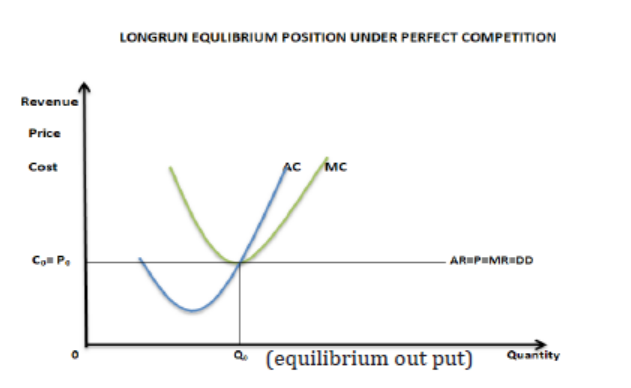
Output: The output that the firm produces is determined at the equilibrium
point where MC=MR at the point x, at the biggest level of output. Thus output
0qo is the equilibrium output.
Cost: The average cost of producing each unit of output 0qo is determined at a
point where the output line meets the AC curve. Thus 0co is the average cost of
producing each unit of output 0qo.
Price: The price at which the firm sells its output is determined at a point where
the output line meets the AR. Thus price 0po is the equilibrium price.
Profit: Along the equilibrium, AR is equal to AC (C0=P0) and therefore the firm earns Normal profits in the long run.
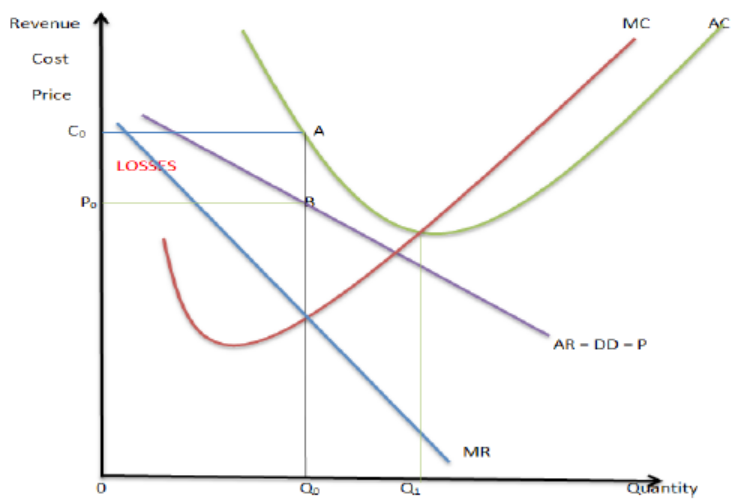
1.2.5. Loss making under perfect competition.
The firm can be in equilibrium under perfect competition but when making
losses making firm. Some firms can be able to make abnormal profits while some
others are likely to earn losses. Losses come under the following conditions:
- The average revenue (AR) must be less than average cost (AC) i.e. Average
cost curve must be above the Average revenue curve (AR).
- The average revenue curve determines the price while the Average cost curve determines the cost of the firm.
- Where AC curve meets the price-output line, we determine costs to the
vertical axis. This time the price-output line is prolonged to meet/ touch the AC curve since its higher above the AR curve.
- Marginal cost curve cuts the Average cost curve at the lowest point to mark the optimum point of the firm.
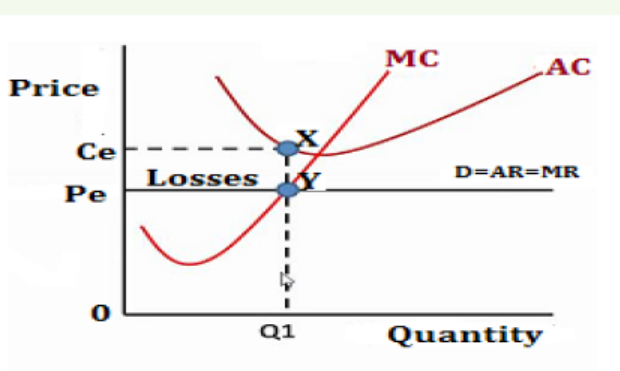
As shown in the figure above, the firm produces output 0Q1 at Total cost
0CeXQ1 and sales it at price 0Pe getting Total Revenue 0PeYQ1 hence making
losses PeCeXY because the AC is greater than the AR.
Losses = TR- TC. Thus from the above curve, losses= 0PeYQ1- 0CeXQ1 = PeCeXY.
Example
Given the firm’s total cost function as TC = 100+20Q+Q2.
a. Calculate the firm’s supply curve
b. If firm’s market price is 25Frw, calculate firm’s production.
c. Calculate firm’s profit/loss if P=25
Answer
TVC= 20Q+Q2
AVC= 20+Q
MC= 20 + 2Q
a. Therefore,
P = MC
P = 20+2Q
qs = ½P - 10
b. If P=25, therefore,
qs = ½P - 10
qs = ½(25) – 10
qs = 2.5
c. Profit/loss
qs = 2.5
π= TR-TC
π= PQ-(100 + 20q + q2)
π= (25)2.5-(100 + 20(2.5) + (2.5)2)
π= 62.5-(100 + 50 + 6.25)
π=-93.75Frw
In long run, firms push their profit to zero and sometimes, they start making losses.
1.2.6. Breakeven and shut down points of a firm.
Breakeven point is a point where the firm is neither earning abnormal profits
nor making losses. i.e. it is earning normal profits where the average revenue
is equal to average cost (AR =AC). The firm can only cover the costs of production without earning any profit.
Example
Assume an industry producing 1000 kg (Q) of biscuits daily, and selling at price
50Frw per kg. Calculate the profit of the firm, and interpret what will happen to the firm.
P= 50, Q = 1000
TR = P x Q
TR 50x1000= 50000
TC = ATC x Q
ATC=50,
Q=100TC = 50 X 1000 = 50000
Profit = TR - TC = 50000 – 50000 = 0
Therefore the industry is at breakeven point where AC=AR and the industry is making 0 profits.
When normal profits are earned, no more firms will be attracted to the industry and
the existing firms will have no desire to leave. As new firms may enter the industry
more would be supplied to the market. Prices will fall even further and firms will
begin to incur losses. Firms may continue to operate even when they are incurring
losses so long as they can pay for variable costs of production. This implies that
firms can operate even below the breakeven point until such a point when they may
be forced to close down. This point of a firm is referred to as Shut down point of a firm.
Shut down point is a point below where the firm only covers variable costs and
below this point, the firm cannot continue operation. At shut down point AR= AVC.
Example
Given that the firm is producing 7500 kg(Q) of maize floor, and selling at price
30Frw per kg, given also that the ATC=50. Calculate the profit of the firm, and interpret what will happen to the firm.
P = 30,
Q = 7500
TR = P x Q
TR = 30x7500 = 22500
Given, ATC = 50
So,
TC = ATC x Q
50 x 7500 = 375000
Profit = TR - TC = 225000 - 375000 = -150000
A firm will be at shutdown point since it will be making loss at AVC point.
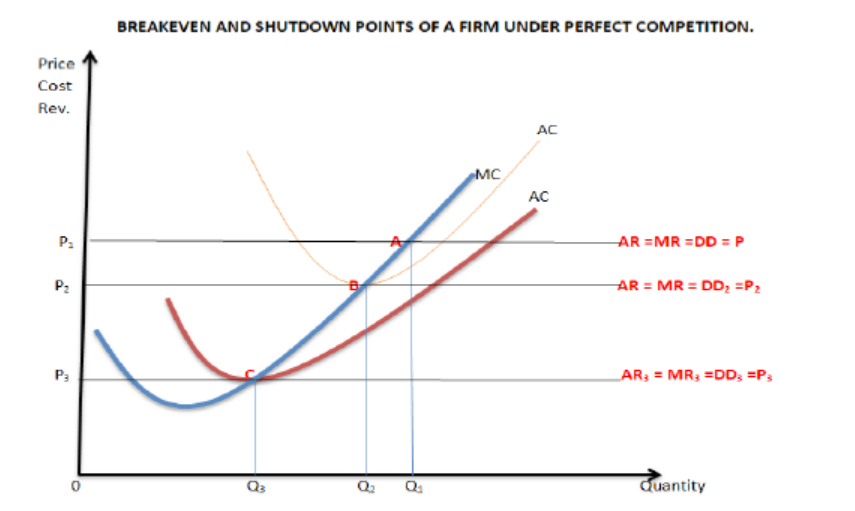
As shown in the figure above, In the long run, many firms join the business
because of the abnormal profits in the short run (at point A in the above
figure). As new firms enter the industry, supply of the commodity increases
creating more competition in the market leading to a reduction in the price. In
the end all firms get normal or zero profit at point (B). They are only able to
cover costs of production as shown by the AC curve. Point B is the breakeven
point where the firm earns normal profits and AR=AC.
Other firms will still join the business up to when the firm is not able to cover
all the costs of production but only covers variable costs as shown by the AVC
curve. (Point C in the above figure)
Point C is the shutdown point where the firm only covers variable costs. Below
this point, the firm cannot continue operation.
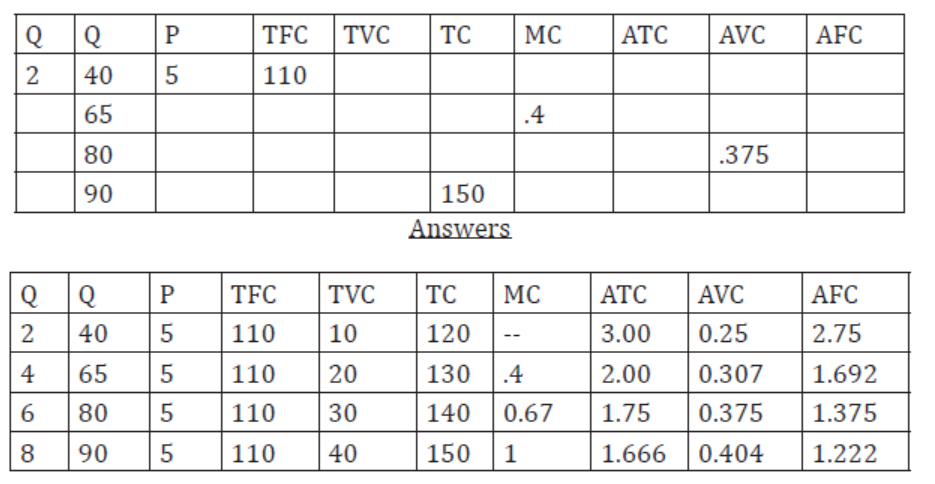
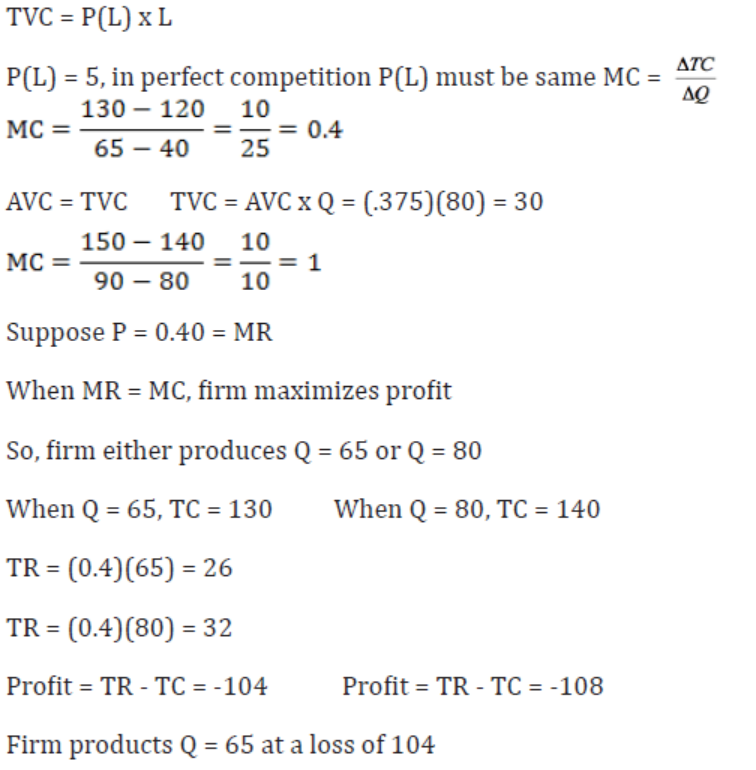
Example
Fill in the missing cells. Assume the firm operates in a perfectly competitive environment in both, the input and output markets. Calculate the profit (loss) when the firm receives 0.40Frw for the product.
APPLICATION ACTIVITY 1.2.
Equilibrium of a firm is at point where MC = MR and the optimum point is the lowest point of the AC.
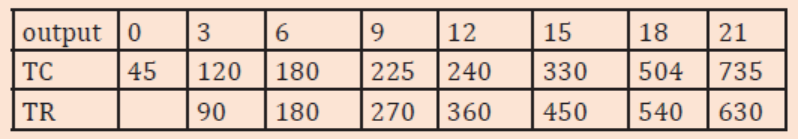
i. Using the following below, determine the equilibrium and optimum output.
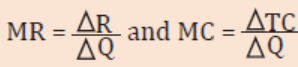
ii. Illustrate the MR and MC curves of the above firm.
Why firms continue to operate even when it is not covering all the costs.
ACTIVITY 1.4
Make research around. Look for a firm that has not been performing well
in the recent years. It may be a firm loosing market to a competitor or
has run out of resources. Find out the reasons for its poor performance
and why it has not yet closed?
A firm may continue to operate even if total costs of production are not covered because of the following factors:
- Some firms may not want to lose their good customers thus they continue
to operate even when total costs are not covered in order to keep such customers.
- Firms continue to operate because they fear to lose their suppliers of raw materials for their industry.
- Some firms may fear to lose their suppliers of raw materials for their
industry thus they continue to operate even when total costs of production are not covered.
- The firm may be newly established when it is still at its infancy stage
and expects to make profits in the long run thus it accepts to continue to operate even when total costs are not covered.
- Some firms fear to lose their skilled man power which it would have trained
at a high cost, which labour may be necessary in the near future thus they continue to operate.
- Firms may be expecting to get loans the nearby in future from the financial institutions to boost its business.
- Some firms fear to be taken over by the state through nationalization
when they stop operating thus they continue to operate even when the total costs are not covered.
- The firm may be newly established when it is still at its infancy stage
and expects to make profits in the long run thus it accepts to continue to operate even when total costs are not covered.
- The firm may have invested heavily in fixed assets like buildings, machines
and land which it cannot leave idle thus continue to operate when even total costs are not covered.
- Some firms keep operating when they hope to change or restructure management, if it
- believes current losses are due to poor management
- A loss making firm may be a branch of a bigger firm (subsidiary firm)
which is making profits and the losses can be shared by the other firms so as to cover the costs.
- Some firms are not meant to be making profits but to give services like welfare improvement, in case of government organizations.
- Some firms may be set up for research/ experimental purposes so they operate even if they are making losses.
- If a firm had earned abnormal profits before and is still surviving on them.
- Difficulties might be short run and therefore hope to make improvements in the long run.
- Some firms keep operating when they fear to lose their reputation or good name in society.
Under certain conditions, a firm may decide to close business because of;
- Appearance of new and strong firm thus out competed.
- Exhaustion of raw materials.
- Persistent labour unrest or inadequate labour supply.
- Absence of spare parts or failure to get them.
- New government regulations e.g. total ban of production of a given commodity.
- Change in fashion and design hence demand shifts to fashionable goods.
- Lack of raw materials e.g. during war times and economic decline.
1.2.7. Advantages and disadvantages of perfect competition.
Perfect competition has the following advantages:
- Encourages optimum use of resources because factors of production
can freely move from one place to another
- Production of better quality goods because of high levels of competition within the industry
- No wastage of resources because of no advertisement costs incurred. This reduces prices for final commodities.
- There is no consumer exploitation because prices are determined by the forces of demand and supply.
- There is a lot of output because of many suppliers and buyers.
- Producers are able to expand their firms and use modern technology because of the abnormal profits in the short run.
- Eliminates income inequality because in the long run all firms earn normal profits. On the other hand, everyone with capacity if free to join production.
- The plant is used to full capacity in the long run. This is mainly because firms
operate at the least average cost and so there is no resource wastage.
- There is price stability due to homogeneous products and all producers selling at the same price.
Disadvantages or shortcomings of perfect competitive firms:
- No variety of commodities since they are homogeneous; this limits consumers’ choice.
- The existence of perfect knowledge doesn’t motivate firms to incur expenses on research and development.
- Unemployment is likely to occur because of the inefficient firms leaving the production after being outcompeted.
- Consumers have little or no choice because the goods produced are the same.
- There are no abnormal profits in the long run so expansion of the firm is hard.
- Research is difficult because of little of no profits in the long run.
- Firms aim at profit, maximization and this discourages the production of public utilities like water supply which are vital for society but are non-profit making
- Profits are reduced because the seller is supposed to sale at the same price as others.
- Perfect competition cannot exist in reality and so cannot be relied upon for development.
- Sellers cannot carryout price discrimination since demand is perfectly elastic and prices tend to be constant and this limits the profit levels of the firm.
APPLICATION ACTIVITY 1.3
Identify a firm that declined and eventually closed. Make research and find
out the cause of its decline and closure.
1.3. Monopoly
ACTIVITY 1.5
REG is composed of EUCL and EDCL as its subsidiaries.
Write down what you know about EUCL and EDCL.
Why do you think REG is the only firm responsible for handling all electricity issues in the country?

1.3.1. Meaning and characteristics.
Under imperfects there are many market situations including:
- Monopoly.
- Monopolistic competition.
- Oligopoly.
Monopoly is a market situation where there is one producer or supplier of a product, which has no close substitutes and entry into the market is highly restricted.
Examples of monopoly firms include;
- Water and Sanitation Corporation Limited (WASAC)
- Rwanda Energy Group (REG)
- National Bank of Rwanda (BNR)
Extreme forms/ types of monopoly may include;
- Pure /absolute monopoly: This is a market situation where there is single seller or producer of a commodity that has no substitutes at all. In practice, there is no pure monopoly because people can always forge substitutes for that commodity.
- Monopsony: This is market situation where there is only one buyer of a commodity or a factor of production. E.g. one employer.
- Bilateral monopoly: This is a market situation consisting of a single seller and a single buyer of a commodity.
- Imperfect/ simple monopoly: this is a market situation where there is a single firm which produces a commodity that can be substituted to some extent though they are not perfect substitutes.
- Discriminatory monopoly: this is a type of monopoly where the seller has the ability to charge different prices from different customers for basically the same commodity.
- Collective monopoly: this is a market situation where a few firms producing similar products decide to come together so as to determine price and output.
- Natural monopoly: this is a market situation where a firm exclusively owns and controls a source of raw material and it is impossible for other firms to produce similar commodities that require similar raw materials. i.e. such firms become monopolies because other firms cannot enter the industry.
- The market demand for such an industry is only sufficient for one firm to operate at its minimum efficiency.
- Statutory monopoly: this refers to a type of monopoly which is set up by
an act of the parliament to provide a certain economic product/service
and such a service or product cannot be duplicated by firms.
- Spatial/local monopoly: This is a type of monopoly which arises from distance between the producers of a given product. Therefore, this when a firm becomes a monopoly due to the long distance between that firm and others firms.
Characteristics (features/assumptions) of monopoly market conditions.
Under monopoly market conditions,
- There is only one single seller/ producer and many buyers.
- The commodity produced has no close substitutes.
- Entry of new firms in the market is restricted/ highly blocked.
- There is no persuasive advertising instead there is informative advertising where the public is just informed about the existence of the commodity but not being persuaded to purchase it.
- The firm aims at profit maximization.
- Firms are price makers but not price takers. I.e. they can determine the price at which to sale their products
- The demand curve of a monopolist is inelastic because its products have no close substitutes. In other words, a big percentage increase in prices of such products lead to a small percentage reduction in the quantity demanded.
1.3.2. Sources of monopoly power.
- Patent rights: this where a firm/ producer has exclusive knowledge of a given production technique and the law forbids other firms/ producers to deal in the same commodity. e.g. authors, artists, inventors etc. copy rights and patent rights prevent other firms or producers from imitating
the products of others which leads to temporary monopolies.
- Strategic ownership or control of a source of raw materials which makes it impossible for other firms or producers to produce similar product that require similar raw materials. Thus such firms become monopolies because other firms cannot enter the industry leading to natural monopoly.
- Long distance among producers where each producer monopolizes the market in his/her locality. This leads to spatial monopoly.
- Advantages of large-scale production which do not allow small firms to compete successfully with large firms.
- Protectionism: This is where trade barriers are imposed on the product to exclude foreign competitors. In such cases, the home producer may become a monopolist.
- Take over and mergers: Take-over’ is when one firm takes over the assets and organization of another whereas mergers are formed when firms combine their assets and organizations into one to achieve strong market position. Both situations may result into a monopolist firm.
- Collective monopoly or collusive e monopoly: This is where firms come together in a formal or informal agreement (cartel) to achieve monopoly power. Such firms can fix quotas (maximum output each may put on the market). They may also set the price very low with the objective of preventing new entry of other firms. This is called limit pricing.
- Small market: where the market demand is small or limited, a single seller or supplier is most appropriate In other words, a firm becomes a monopoly because the market size is too small to allow more than one firm to operate in it.
- Long-time of training/acquiring skills: where entry into business or rofession is restricted by long-time of training, it means that a person who joins the profession will remain the sole supplier for some time e.g. doctors, judges etc.
- Talent: Individuals with talent tend to develop peculiar products or services hence development of monopoly in marketing of such commodities. E.g. designers, musicians etc.
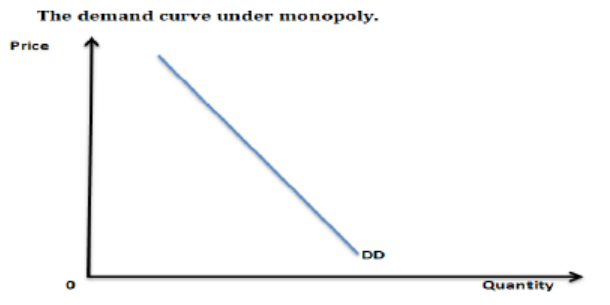
1.3.3. Equilibrium position and profit maximization under monopoly. The demand curve under monopoly is downward sloping from left to write. It is inelastic because of lack of competition.
Under monopoly:
- The firm produces at excess capacity both in the short run and long run because it must restrict output to charge a high price especially when it a private monopoly that aims at maximising profits. State monopolies created to provide strategic services to the population may optimally utilise their resources to provide more services.
- There is no supply curve under monopoly because the producer bases his production plans on the demand curve which is fixed and known to him/ her.
- There is no difference between a firm and an industry.
- The firm is in equilibrium when the marginal cost curve is equal to the marginal revenue curve. (MC=MR)
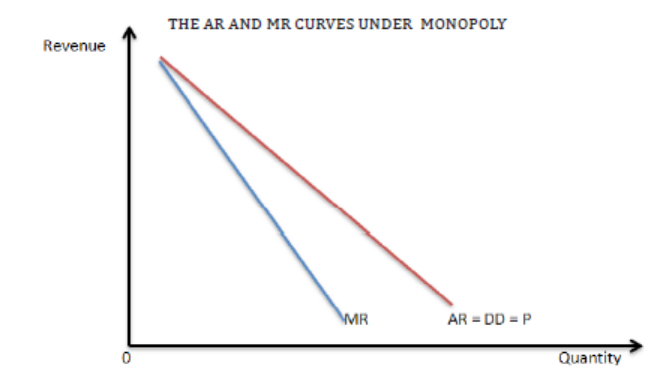
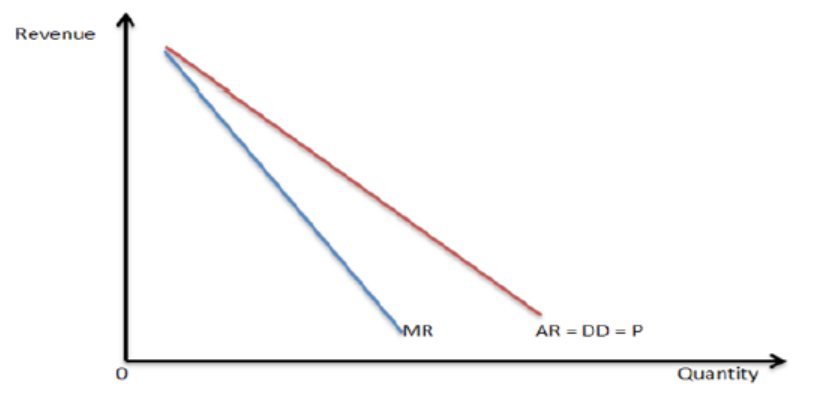
The AR and MR curves under monopoly
The AR and MR curves under monopoly are downward sloping from left to right. Marginal revenue curve is below the Average revenue curve because for monopoly firm to increase revenue, it has to lower the price
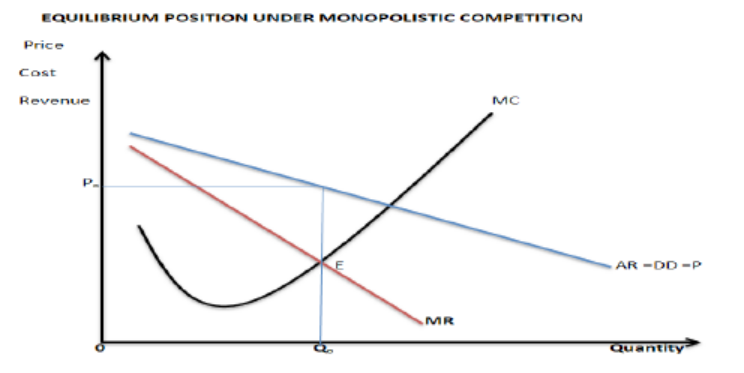
The equilibrium position under monopoly.
In the short run period, the monopolist behaves like any other firm. It will maximize profits or minimize losses by producing that output for which marginal cost (MC) equals marginal revenue (MR). Whether a profit or loss is made or not depends upon the relation between price and AC. It may be made clear here that a monopolist doesn’t necessarily make profits. The firm may earn super normal profits or normal or even produce at a loss in the short run.
Conditions for the equilibrium of a monopoly firm are that,
The firm under monopoly will still earn abnormal profits because it is the only firm in the production process. The firm will be in equilibrium where the marginal cost curve is equal to marginal revenue curve. (MC=MR). This is shown below:
Conditions:
- The average revenue (AR) must be greater than average cost (AC) i.e.
Average cost curve must be below the Average revenue curve.
- The average revenue curve determines the price while the Average cost curve determines the cost of the firm.
- Where AC curve meets the price-output line, we determine costs to the vertical axis.
- Marginal cost curve cuts the Average cost curve at the lowest point to mark the optimum point of the firm.
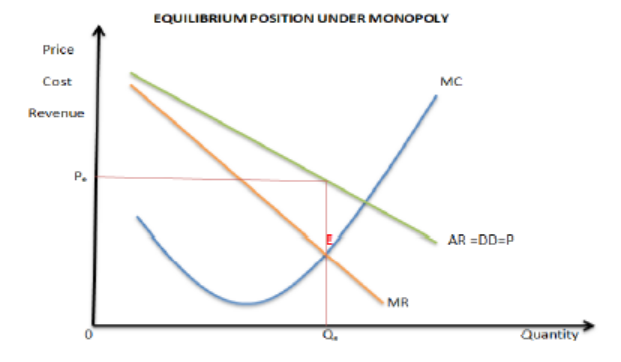
At point E, MR =MC and there that is the equilibrium point.
Short-run profit maximisation under monopoly
In the short run period, if the demand for the product is high, a monopolist increases the price and quantity of output. He can increase output by increasing labour, using more raw materials, increasing working hours etc. In case demand falls, he can reduce the use of variable inputs.
A monopolist is a price maker; therefore the firm can set a price which earns profits i.e a price greater than AC.
Conditions for short run normal profits under monopoly:
- The firm is in equilibrium where MC=MR.
- The average revenue (AR) must be equal to average cost (AC)
- The average revenue curve determines the price while the Average cost curve determines the cost of the firm.
- Where AC curve meets the price-output line, we determine costs from the vertical axis. However, since AC=AR, the price line is the same as the costs line.
- Marginal cost curve cuts the Average cost curve at the lowest point to mark the optimum point of the firm.
Illustration of normal profits under monopoly
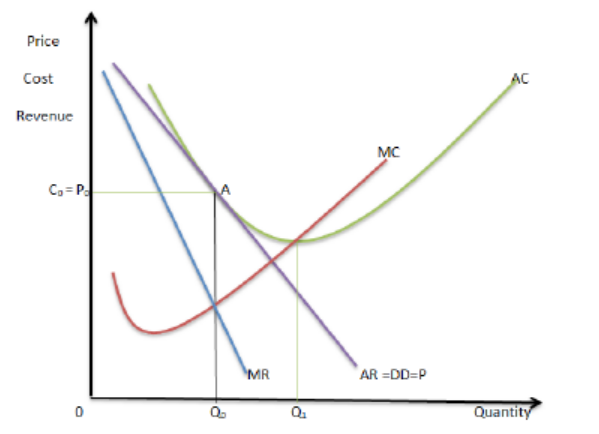
The firm is in equilibrium at a point where MC=MR. The price is tangent to the AC. The firm charges OP0 price per unit for units of output 0Q. The firm earns only normal profits and keeps on operating.
Losses under monopoly in the short run
A monopolist can also make losses in the short run, provided the variable costs of the firm are fully covered. The loss minimizing condition in the short run can happen under the following conditions;
Conditions
- The average revenue (AR) must be less than average cost (AC) i.e. Average cost curve must be above the Average revenue curve.
- The average revenue curve determines the price while the Average cost curve determines the cost of the firm.
- Where AC curve meets the price-output line, we determine costs from the vertical axis. Since AC is greater than AR, the price-output line is extended up to touch the AC curve so as to determine the costs to the vertical axis.
- Marginal cost curve cuts the Average cost curve at the lowest point to mark the optimum point of the firm.
Losses of a firm under monopoly in the short run
As shown in figure above, the firm produces the best short run level of output which is given by point where MC=MR. A monopolist sells output 0Qo at price 0Po. Total revenue of the firm equal to 0P0BQ0 and total cost of producing it is 0C0AQ0. The monopoly firm suffers a net loss equal to the area P0C0AB. The firm in the short run prefers to operate and reduce its losses to P0C0AB only. In the long run, if the loss continues, the firm shall have to close down
Equilibrium position of a firm under monopoly in the long run.
In the long run the firm under monopoly will still earn abnormal profits because it is the only firm in the production process. The firm will be in equilibrium where the long run marginal cost curve is equal to long run marginal revenue curve. (LMC=LMR). This is shown below:
Conditions
- The average revenue (AR) must be greater than average cost (AC) i.e. Average cost curve must be below the Average revenue curve.
- The average revenue curve determines the price while the Average cost curve determines the cost of the firm.
- Where AC curve meets the price-output line, we determine costs to the vertical axis.
- Marginal cost curve cuts the Average cost curve at the lowest point to mark the optimum point of the firm.
Illustration of Equilibrium position of a firm under monopoly in the long run.
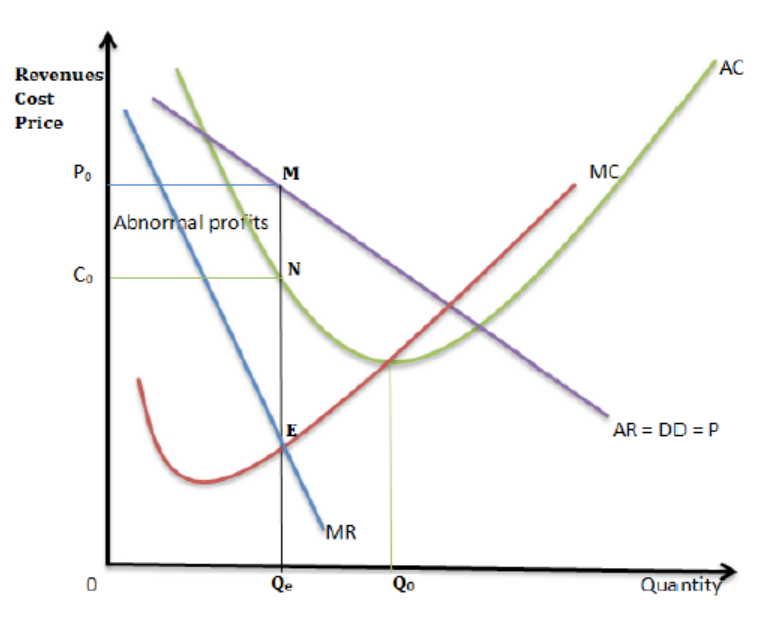
In the figure above, the firm is in equilibrium at point “E” where it produces output 0Qe at Total cost 0C0NQe and sells it at price 0P0 getting Total revenue 0P0MQe hence getting abnormal profits C0P0MN.
Profits = TR-TC. I.e. 0P0MQe - 0C0NQe = C0P0MN.
The firm under monopoly, in the long run, still operates at excess capacity since
its equilibrium output (0Qe) is less than optimum output (0Qo).
1.3.4. Advantages, disadvantages and control of monopoly.
ACTIVITY 1.6.
Discuss the view that monopoly market is better than a perfectly competitive market.
1.3.4.1. Advantages of monopoly.
Monopoly has the following advantages.
- There is no duplication of services and this saves resources e.g. if there is one energy firm providing power, there may not be the need to set up another one in the same area
- Economies of scale can be enjoyed by the firm because it is capable of expanding using the abnormal profits earned.
- There is a possibility of price discrimination. (Parallel pricing). This refers to the selling of the same commodity at different prices to different customers which benefits the low-income earners.
- Research can easily be carried out using the abnormal profits which in turn leads to an increase in the quality and quantity of goods produced.
- There is no wastage of resources in persuasive advertising which may increase leads the prices.
- Public utilities like roads, telephones, etc, are easily controlled by the government as a monopolist
- Infant industries can grow up when they are monopolies and are protected from foreign competition.
- It encourages innovations by protecting copyright and patent owners.
1.3.4.2. Disadvantages of monopoly
- Because there is no competition, the firm can become inefficient and
produce low quality products.
- Monopoly firms produce at excess capacity i.e. they under utilize their
plants so as to produce less output and sell at a high price.
- Monopoly firms may charge higher price than firms in perfect competition.
- In case a monopolist stops operating, there would be shortage of the commodity.
- Monopoly firms tend to exert pressure on the government and sometimes they can influence decision making because they are the controllers of production.
- Discrimination of consumers. This may be based on political or religious affiliation other than the factors respected by economics
- Leads to income inequality. The monopolies who over charge earn more compared to others
- Restriction of choices. A monopolist normally produces one type of commodity thus consumers are denied a chance to choose among alternatives
1.3.4.3. Measures to control monopoly
Because of the above disadvantages of monopolies, the following methods can be used to control their activities.
- The government can fix prices of commodities through price legislation.
- Anti-monopoly (antitrust) Legislation i.e. laws imposed to control monopolies. Such laws can prohibit monopolization, and collusion among firms to raise prices or inhibit competition.
- Nationalization of monopoly firms by the government so as to lower the prices.
- Subsidization of new firms. This can help them to compete with the already established firms favorably.
- Resale price maintenance where by the producers set prices at which sellers should sale the goods to avoid charging high prices
- Encouraging imports to compete with the commodities of monopoly firms in the country.
- Setting up government owned firms to compete with the monopoly firms.
- Removal of deliberate monopoly bases like protectionism and taxation to encourage competition among the firms.
- Taxation. The government can impose taxes to reduce the profits of the monopolists. Such taxes may include:
1. Surtax. This refers to the tax charged on producers or people who earn more than a particular large amount. This helps to reduce on the profit levels of a monopoly firm which reduces monopoly power.
2. Advalerem tax. This is a tax levied on the value of the commodity
3. Specific tax. This is a tax charged per unit of output and will therefore vary as output varies. It will increase the cost of production of additional unit (MC) and AC of every unit.
4. Lump sum tax. This is a tax charged especially on monopolists regardless to their level of outputs or any circumstance.
1.3.5. Price discrimination
ACTIVITY 1.7
Mutamuliza is an entrepreneur operating a number of enterprises in Gatsibo district. She runs a poultry firm where she produces eggs for sale. When traders from Kigali come, she sells to them at 5000rwf a tray while those from Gatsibo she charges them 3000rwf per tray.
She also produces pineapples and sells each at 1000rwf. But when Students from a nearby secondary school come to buy, she sells to them at 500rwf each. Some times during bumper harvest she exports some to Tanzania and sells each at 700rwf in Tanzania markets.
a. In your opinion, why do you think i. She charges Kigali traders more than what she does to those from Gatsibo for a tray of eggs?
ii. She sells pineapples to students at a lower price than others?
iii. She sells pineapples in Tanzanian markets at lower prices than what she charges in domestic markets?
1.3.5.1. Meaning
It is where the producer sells a commodity to different customers at different prices irrespective of the costs of production. It can also be referred to as parallel pricing. Price discrimination takes place at the following degrees of price discrimination,
Price discrimination occurs in the following degrees:
- First degree discrimination where a producer is able to charge each customer the maximum price he/ she is prepared to pay for the good or service depending on consumers’ demand.
- Second degree of price discrimination where a firm sells off excess output or supply that could be remaining at a lower price than normal price.
- Third degree price discrimination where the producer sells / separates markets according to elasticity of demand and charge a high price where there is inelastic demand and a low price where there is elastic demand.
1.3.5.2. Forms of price discrimination.
- Discrimination according to personal income. For example, income differentiation among buyers, e.g. doctors charging low prices on the poor and high prices on the rich for the same services.
- Discrimination according to age: e.g. charging low prices on the young people than old people on tickets to watch football or for a film show.
- Discrimination according to sex: where different prices are charged to females and males e.g. for discotheques where for ladies’ nights, ladies enter for free and males are made to pay.
- Discrimination according to geographical e.g. dumping where commodities are sold cheaply in other countries compared to prices in the home country.
- Discrimination according to the time of service e.g. tickets for video shows charged high prices in afternoons when there are many people than in morning hours when there are few people.
- Discrimination according to nature of the product e.g. a soft cover book may be cheaper than a hard cover book.
- Discrimination according to the number of uses of the product e.g. electricity used for industrial purposes is cheaper to electricity for domestic use.
- Discrimination by differentiation of commodities e.g. high prices on travellers in first class in the train and low charges of other classes like the economy class.
1.3.5.3. Conditions for Price Discrimination to be successful.
- The commodity must be sold by a Monopolist so that even when the price is increased, the buyer has nowhere else to go
- Elasticity of demand should be different in different markets. A higher price should be charged in the market where elasticity of demand is low than where elasticity of demand is high.
- The cost of dividing the markets should be very low e.g. in case of dumping costs of transport should be low.
- Buyers should not know how much is charged on others. This is possible especially where goods are sold on orders with no advertising.
- It should be impossible for buyers to transfer the commodity from where the price is low to where the price is high. This is possible especially with services of doctors, teachers, etc.
1.3.5.4 Advantages and disadvantages of price discrimination.
ACTIVITY 1.8
Discuss the view that customers with different income status should be charged different prices for the same commodities.
Advantages of price discrimination
- It enables the poor to get essential services at low prices e.g. cheap houses to civil servants and doctors charging low prices on poor patients.
- To the sellers, it increases total revenue because output sold increases.
- It is one way in which the rich subsidize the poor thus a method of income distribution. The rich are charged highly on commodities while the poor are subsidized on the same commodities
- It increases sales and consumption e.g. for air time, the first units, may be charged higher price than other extra units. Therefore, the more units of air time you use, the less the charges you pay for any extra units.
- It helps producers to dispose-off surplus and poorly manufactured commodities e.g. dumping.
- Increased efficiency. The increased profits from the higher charges make the firms efficient and such profits are reinvested
Disadvantages of price Discrimination
- It may encourage consumption of some commodities in undesirable excessive amounts. For example, when children are charged less for entrance in film halls, they may spend more time watching films than on studies or leisure.
- It can lead to low quantity of products/services for example in some airlines, travellers in the economy class (where fares are lower) are sometimes not well treated like those in the first class (where fares are higher) by airline staff.
- Discrimination in form of dumping discourages local industries.
- It increases monopoly powers of firms by limiting entrance of other firms
in the market. One firm serves all categories of customers irrespective of
their incomes, ages or sex cause consumers’ exploitation.
- Poor quality output normally arises; such output is sold to the less privileged who yearn for the less prices
- Misallocation of resources. Price discrimination may bring about divergence of resources from their socially optimal uses to produce for those who can reward highly because producers aim at profit maximisation.
APPLICATION ACTIVITY 1.4
The table below shows electricity tariffs from REG. Analyse the tariffs
and answer the questions that follow
Tariffs for non-industrial customers.
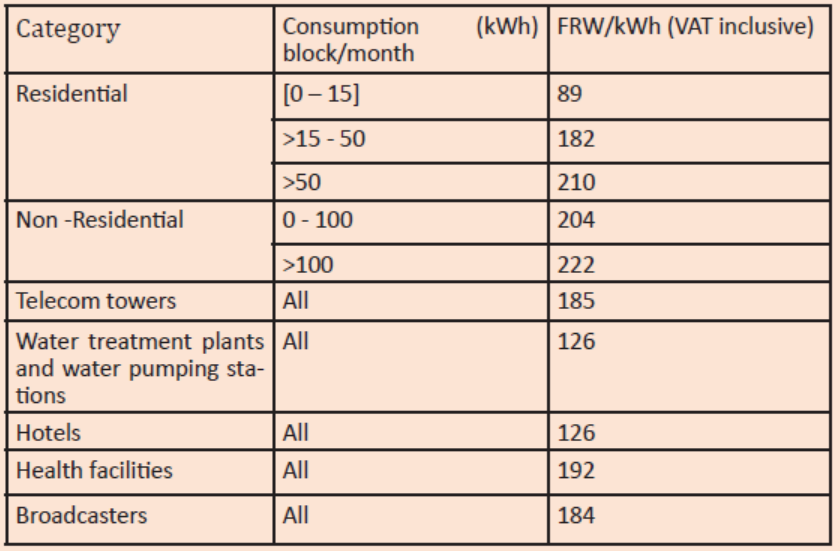
a. In your own view, why do you think
i. REG charges low tariffs for residential customers using below
15 kWh and higher tariff for those using 50 and above kWh?
ii. Water treatment plants are charged lower tariffs than telecom towers.
b. How is the above system of charging different tariffs by REG helpful to
i. REG.
ii. The customers
1.4. Monopolistic competition
1.4.1. Meaning and characteristics.
ACTIVITY 1.9.
Identify the 3 star and 4 star hotels in Rwanda. Make research on them in terms of
i. Their number.
ii. The means they use to compete against each other.
iii. Their services and their quality.
iv. Their prices.
Make class presentations on your discoveries.
Monopolistic competition market structure has characteristics similar to that of perfect competition except that the commodity dealt with in monopolistic competition is not homogeneous. It is a market structure in which a large number of firms sell differentiated products that are close substitutes.
Because of product differentiation, the seller has some control over the market price thus the firm is a price maker. Examples of monopolistic firms include:
- Soap industry.
- Bread industry
- Hotel industry
- Hair salons
- Restaurants etc.
Characteristics of firms under monopolistic competition
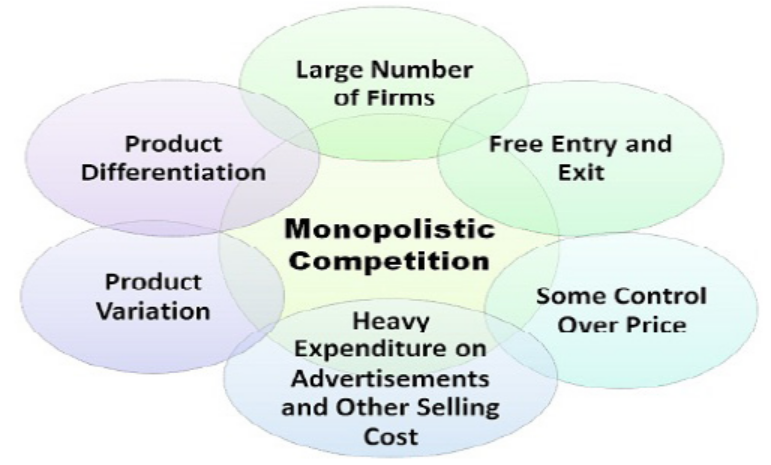
There are many firms in the industry.
- Firms deal in differentiated products though they remain close substitutes.
- There is freedom of entry and exit of new firms into and out of the industry.
- There is stiff competition due to production of close substitutes.
- There is a lot of intensive persuasive and informative advertising.
- The firms exercise a lot of non-price competition due to the stiff competition.
- There is production at excess capacity.ie production less than the required
output so as to charge at a high price.
- The firms in the industry are large but none of them dominates the market.
- The major aim is to maximize profits and this done at a point where marginal revenue is equal to marginal cost (MR=MC)
- There exists brand loyalty/ fidelity ie consumers exercise a lot of loyalty/fidelity by sticking on a particular commodity believing that a particular brand is superior.
- The demand curve is fairly elastic in nature because of the presence of many substitutes. When a firm makes a small increase in the price of the commodity, there is big reduction in quantity demanded because of the existence of many other firms in the market.
- The AR curve is greater than the MR curve, i.e. the MR curve is below the AR curve because the firm gets marginal revenue when it sells extra units of the commodity at the low price than the previous one.
1.4.2. Short run and long run profit maximisation under monopolistic competition.
1.4.2.1. The demand curve, AR and MR curve under monopolistic competition.
The demand curve under monopolistic competition is elastic because of competition. MR is below the AR
Equilibrium position of a firm under monopolistic competition
The firm under monopolistic competition is in equilibrium when the MC=MR and in the short run the firm will either make abnormal profits or losses. The supernormal profits will exist in the short-run because new firms cannot enter the industry. In the short run, the firms may attempt to maximize their profits by changing the quality and the nature of the product and by increasing advertisement expenditure.
Point E in the figure above shows the equilibrium point where MC=MR
1.4.2.2: Price and output determination of a firm under monopolistic competition in the short run.
Price and output determination of a firm under monopolistic competition in the short run.
To determine price and output under monopolistic competition, we need to first determine equilibrium where profits are maximized. Thus, unit cost curves are super imposed on the unit revenue curves to determine where MC=MR (equilibrium point). From there, a perpendicular line is dropped to the horizontal axis to determine output and to the vertical axis, another line is dropped to determine price.
A firm under monopolistic competition in the short run the firm can either make abnormal profits or losses. Abnormal Profits are made as seen below
Conditions
- The average revenue (AR) must be greater than average cost (AC) i.e. Average cost curve must be below the Average revenue curve.
- The average revenue curve determines the price while the Average cost curve determines the cost of the firm.
- Where AC curve meets the price-output line, we determine costs from the vertical axis.
- Marginal cost curve cuts the Average cost curve at the lowest point to mark the optimum point of the firm.
Abnormal profits of a firm under monopolistic competition in the short run.
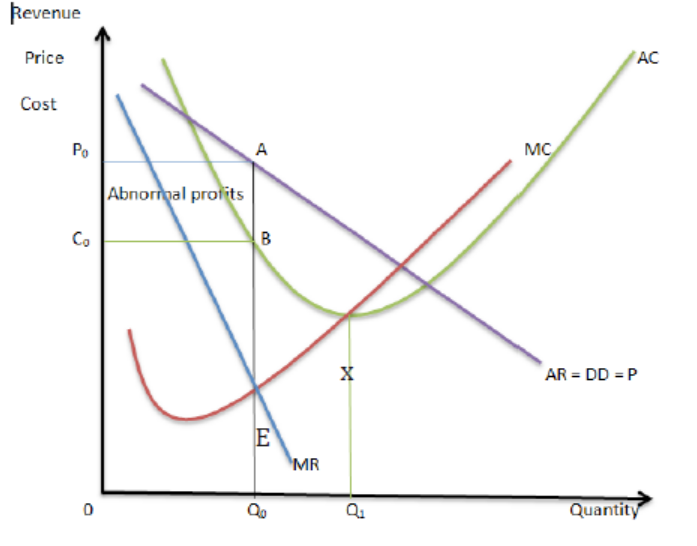
Output: The output that the firm produces is determined at the equilibrium point
(point E) where MC=MR at the biggest level of output. Thus output 0qo is the equilibrium output.
Cost: The average cost of producing each unit of output 0qo is determined at a point where the output line meets the AC curve (Point B). Thus 0co is the average cost of producing each unit of output 0qo.
Price: The price at which the firm sells its output is determined at a point where the output line meets the AR (Point A). Thus price 0po is the equilibrium price.
Profit: Along the equilibrium, AR is greater than AC and therefore the firm earns Abnormal profits in the short run represented by area C0P0AB.
NOTE: Firms under monopolistic competition produce at excess capacity/below their optimum point (point X) i.e equilibrium output oq0 is less than optimum output oq1
1.4.2.3. Losses under monopolistic competition in the Short run.
- The firm can also make losses. This is shown below.
Conditions
- The average revenue (AR) must be less than average cost (AC). I.e. The AC curve is higher above the AR curve.
- The average revenue curve determines the price while the Average cos curve determines the cost of the firm.
- Where AC curve meets the price-output line, we determine costs from the vertical axis. Since AC is greater than AR curve, the price-output line is extended up to touch the AC curve so as to determine the costs to the vertical axis.
- Marginal cost curve cuts the Average cost curve at the lowest point to mark the optimum point of the firm.
Losses of a firm under monopolistic competition in the short run
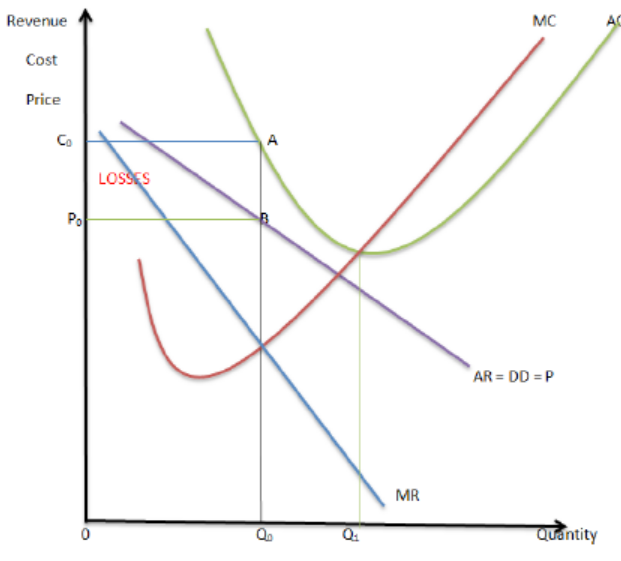
From the figure above, the firm produces output 0Q0 at cost 0C0 and sells it at lower price 0P0 getting total revenue 0P0BQ0. Hence the firm makes losses P0C0AB because total cost (AC) is greater than Total revenue (AR)
1.4.2.4. Equilibrium of the firm under monopolistic competition in the long run
Due to the supernormal profits in the short run, new firms join the industry with new brands, output increases, product differentiation increases, consumer choice widens and the firms reduce the level of their output since the market has remained the same.
The firms that were previously incurring losses leave the industry. Therefore, the demand curve would keep on shifting to the left until a point is reached where the demand curve is tangent to the long run average cost curve (LAC).
Equilibrium is attained at point where long run marginal cost curve (LMC) is equal to long run marginal revenue (LMR).
Conditions
- The average revenue (AR) must be equal to average cost (AC). I.e. The AC curve is tangential to the AR curve.
- The average revenue curve determines the price while the Average cost curve determines the cost of the firm.
- Where AC curve meets the price-output line, we determine costs from the vertical axis. Since AC is equal to AR curve, the price line is the same as the AC curve.
- Marginal cost curve cuts the Average cost curve at the lowest point to mark the optimum point of the firm.
Normal profits of a firm under monopolistic competition in the long run:
Output: The output that the firm produces is determined at the equilibrium point (point E) where MC=MR at the biggest level of output. Thus output 0qo is the equilibrium output.
Cost: The average cost of producing each unit of output 0qo is determined at a point where the output line meets the AC curve. Thus 0co is the average cost of producing each unit of output 0qo.
Price: The price at which the firm sells its output is determined at a point where the output line meets the AR. Thus price 0po is the equilibrium price.
Profit: Along the equilibrium, AR is equal to AC and therefore the firm earns Normal profits in the long run. The firm is operating at excess capacity since equilibrium output (0Q0) is less than optimum output 0Q1.
1.4.3. Advantages and disadvantages of monopolistic competition.
ACTIVITY 1.10
Discuss the view that monopolistic competitive market conditions are suitable for the Rwandan economy.
Advantages of monopolistic competition
- Product differentiation enables consumers to get a variety of products to choose from.
- Due to existence of many sellers in the market as a result of free entry of new firms, there are high quantities in the market. This makes prices lower than monopoly.
- Due to high level of competition, firms produce better quality output which improves people’s welfare.
- In case one firm collapses, substitutes are available for the consumers.
- Consumers buy at a lower price because of the presence of close substitutes which makes it difficult for sellers to charge very high prices.
- The freedom of entry gives a chance to any willing entrepreneur to enter the industry which creates employment opportunities in the country.
- Individual firms gain a lot of popularity due to specialization in their own brands.
- In the short run abnormal profits earned are used to improve on the quality of products, undertake research and expand the size of the firm.
- Disadvantages of monopolistic competition
- Advertising may mislead the public into paying higher price for the commodity when there is no improvement on the quality of the product.
- Firms produce at excess capacity in the short run and long run as they operate at less than optimum. Thus there is resource under utilisation.
- In the long run, there is no profit to make improvements because the firm earns normal profits. So it may not expand to enjoy economies of scale.
- The wide variety of commodities in the market often confuses consumers who may not make right choices in the end.
- The price charged on buyers is higher than in perfect competition which reduces consumers’ welfare.
- In the long run, there are no profits to invest in research since the firm earns normal (zero) profits.
- To maintain the market share, the seller has to persuasively advertise and this may increase costs and the price.
- There are limited employment opportunities as firms operate at excess capacity
- The output produced is less than that in perfect competition
1.4.4. Product differentiation under monopolistic competition
Product differentiation is a situation where a firm is in position to make its products appear different from other products of other firms. It may take the following forms; Packaging. Design/shape. Branding. Colour. Scent. Labelling, Salesmanship. Size. Quality, Advertising, Blending, Giving credit etc.
It is intended to win market for a firm by trying to make its commodities superior than those of rival firms. Therefore, there is need for persuasive advertising in monopolistic competition.
APPLICATION ACTIVITY 1.5
List down the mineral water producing firms you know.
i. Which one do you think takes the largest market share? Why?
ii. Which methods has it used to out-compete others?
iii. Are their products different? If yes, what makes them different?
1.5. Oligopoly
1.5.1. Meaning and features of oligopoly.
ACTIVITY 1.11
Identify the petroleum companies operating in Rwanda.
i. How many are they?
ii. Which one do you like and why?
iii. Is the petrol they sell different?
iv. Do they sell their products at the same price?
v. Are the lubricant oils they sell the same?
vi. What means do they use to compete against each other?
It is a market structure that is dominated by few, unequal and interdependent firms producing either a homogeneous product or a differentiated product.
a. Forms of oligopoly:
1. Perfect oligopoly occurs where there are few, unequal and interdependent firms in the industry producing a homogeneous product for instance Petroleum firms in the sale of petrol.
2. Imperfect oligopoly occurs when there are few, unequal and interdependent firms in the industry producing differentiated products for instance soft drinks firms.
3. Duopoly. This is an extreme form of oligopoly where there are only two firms in the market. For example in the telecommunication industry in Rwanda where Airtel and MTN are the only companies.
4. Duopsony. This is a form of oligopoly where there are two buyers in the market.
5. Oligopsony. This is a form of oligopoly where there are a few buyers in the market.
Examples of firms under oligopoly are;
- Mobile telephone companies: like MTN, Airtel.
- Petroleum companies like Kobil, SP, Mount Meru, Hass etc.
- Soft drink companies like Bralirwa Ltd, Azam Bakhresa Group etc.
- Newspaper firms. TAALIFA RWANDA, DOVE MAGAZINE LIMITED, Igihe Ltd., Rwanda Printing and publishing company, Nonaha Ltd, Inyarwanda Ltd, The Kigali Today group, Mucuruzi Online Market, Muhabura Ltd, The
New Times Publications, Umuseke Ltd, Digital Focus Limited.
b. Features/ characteristics of oligopoly.

Oligopoly markets have the following main features.
- There are few, unequal, competing firms. Each firm, though faced with competition from other firms, has enough market power and therefore cannot be a price taker.
- There is non-price competition such as advertising, quality of services etc. if one firm reduces the price, others would do the same and all firms would end up losing.
- There is interdependence among firms. Each firm is concerned with the activities of other firms so as to act accordingly, e.g. it can reduce the price when others reduce the price.
- In most cases there is product differentiation where firms produce similar products but each firm makes its product appear different from other firms’ products by using different colours, size, shape, labeling, quality etc.
- Presence of monopoly power. There are very few oligopoly firms and this makes it easy for collusion as a form of price determination leading to monopoly.
- Uncertainty. There is a lot of uncertainty in oligopoly industry, as one firm takes a decision say to increase the price, it cannot be certain of the reaction of other firms
- There is limited entry into the production process because most oligopoly firms operate at large scale, therefore this requires a lot of capital which others firms may not have.
- There is price rigidity. I e prices tend to be stable for a long period of time.
- There are price wars i.e. when one firm reduces the price other firms reduce theirs even lower.
- The demand curve under oligopoly is kinked. i.e. a curve that has a bend (kink) and it is elastic above the kink and inelastic below the kink.
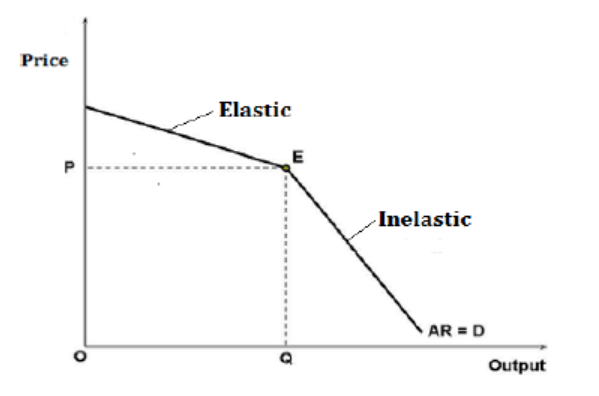
c. The demand curve of an oligopoly firm
The demand curve is kinked because the demand for their products largely depends on the behaviors of other rival firms. This brings in uncertainties in the industry because no single firm can predict reaction of another firm in case they take their own decision. The kinked demand curve is elastic above the kink and inelastic below it.
It is drawn on the assumption that there is an administered price, asymmetry in the behavior of oligopoly firms such that if one firm reduces its price, other firms will reduce their prices even further and if one raises its price others will not follow. Therefore, above the administered price, demand is fairly elastic while below the administered price demand is fairly inelastic. That is why demand curve has two parts joined together at the administered price (at the kink) i.e. one fairly elastic and another fairly inelastic. This is shown below
Illustration of the demand curve of an oligopoly firm:
From the curve above, P is the market price or administered price. Should any firm increase its price above that price, it would lose its customers to other firms. If a firm decides to set price below P, other firms will react by reducing their price even further or lower to win more customers hence increase in quantity sold will be lower than the reduction in price. Hence the demand curve
has a kink (at point E) meaning that the prices will remain rigid/ stable for a long period of time.
d. The MR curve under oligopoly
The MR curve will also have a kink with 3 parts. It will be fairly elastic before the kink and inelastic after the kink. Below the kink, MR curve is discontinuous and straight indicating that MR is falling although the price is constant. When the price remains rigid for a long time, there will be other changes in the market that may lead to changes in costs of production.
MR curve under oligopoly
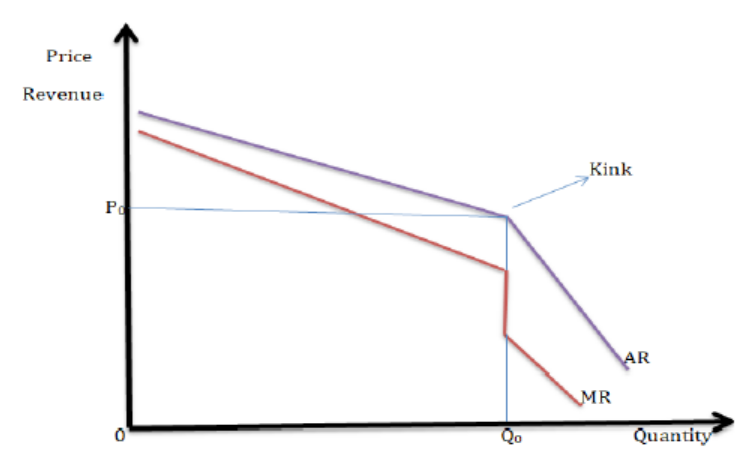
The figure above shows the MR curve which has three parts i.e. a part which is fairly elastic when AR is fairly elastic (before the kink),, a part that is vertical at the kink and a part that is fairly inelastic when AR is fairly inelastic (after the kink)..
e. Equilibrium position under oligopoly
The equilibrium under oligopoly occurs at a point where MR = MC. The MC cuts the MR in the vertical section of the MR. the position of the MC does not affect the equilibrium output as long as the MC passes through the vertical section of MR as illustrated below.
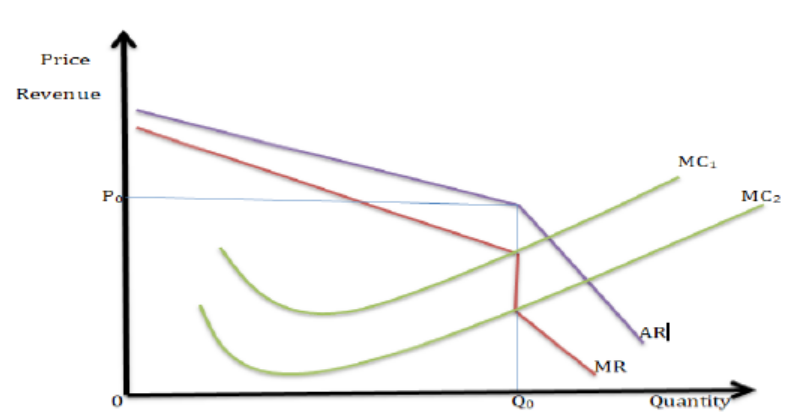
From the above figure, equilibrium is at any point between the vertical part of MR curve “R” to “Z”. The position of MC in the vertical MR doesn’t affect the equilibrium. At any point on this part of MR, MC=MR and there is equilibrium.
1.5.2: Profit maximization abnormal profits under oligopoly
A firm under oligopoly both in the short run and long run markets abnormal profits.
Conditions
Abnormal Profits are made in the following conditions as seen below:
- The average revenue (AR) must be greater than average cost (AC) i.e. Average cost curve must be below the Average revenue curve.
- The average revenue curve determines the price while the Average cost curve determines the cost of the firm.
- Where AC curve meets the price-output line, we determine costs from the vertical axis.
- Marginal cost curve cuts the Average cost curve at the lowest point to mark the optimum point of the firm.
Illustration of profit maximisation by an oligopoly firm.
Output: The output that the firm produces is determined at the equilibrium
point (at point E), where MC=MR at the biggest level of output. Thus output
0qo is the equilibrium output.
Cost: The average cost of producing each unit of output 0qo is determined at a point where the output line meets the AC curve. Thus 0co is the average cost of producing each unit of output 0Qo.
Price: The price at which the firm sells its output is determined at a point where the output line meets the AR. Thus price 0po is the equilibrium price.
Profit: Along the equilibrium, AR is greater than AC and therefore the firm earns Abnormal profits in the short run and the long run shown by C0P0AB in the above figure.
1.5.3. Advantages and disadvantages of oligopoly
ACTIVITY 1.12
Discuss the view that oligopoly market is better than a monopolistic market.
Advantages of oligopoly.
- Stable prices are charged due to presence of price rigidity.
- The high level of competition leads to better quality commodities.
- There are low prices to the consumers due to existence of intensive competition and fear of other firm’s reaction.
- Eases consumer budgeting due to due to price stability.
- Most oligopoly firms operate on large scale which enables the firm to enjoy economies of scale. This together with stiff competition reduces price in the market.
- Widens consumer choice due to production of a variety especially with imperfect oligopoly due to branding and product differentiation.
- Increase innovation and inventions in the economy due to competition and use on non-price competition measures to win market share.
- Provision of gifts by different competitive firms to customers improves people’s welfare.
- There is increased output due to production on large scale.
- Consumer awareness of the commodity is high due to extensive advertising.
- A lot of abnormal profits earned are spent on research and development which leads to technological advancement and a high standard of living in the country.
- Branding and product differentiation gives the consumer a wide variety of commodities to choose from.
Demerits of oligopoly firms:
- Consumers are denied a variety to choose from in case of perfect oligopoly.
- Consumer exploitation through over charging due to collusion.
- Profits are limited due to price rigidity and this may affect further expansion.
- There is a lot of duplication of commodities due to stiff competition hence wastage of resources and losses.
- Collapse of small firms when they are out competed due to stiff competition leading to unemployment.
- There is under exploitation of resources due to production at excess capacity which reduces the chances of firms to enjoy economies of scale.
- Industries with large firms exert pressure on government due to their large capital base and large market share.
- Distorts consumer choices due to excessive advertisements thus may end up consuming unwanted commodities.
- Worsens income inequality due to limited entry of other firms.
- Some firms at times engage in price wars where each firm keeps on reducing on prices of its products to outcompete rival firms which results into losses
- Firms incur high costs on advertising which increases on the price of the commodity.
- The market structure is characterized by uncertainties about the reactions and activities of other firms which limit the ability of an individual firm to make independent decision.
- Due to limited entry of firms, there may be lack of competition leading to inefficient and poor-quality products
1.5.4. Non price competition under oligopoly.
ACTIVITY 1.13
Identify the means used by the two firms below to attract more customers

Non price competition refers to the situation where firms in the industry compete using other means other than price. The price is kept constant but firms use other means of attracting customers. This can be done through,
- Persuasive advertisement using various media like radios, television, newspapers etc. to make people aware of the commodity and attracted to it
- Branding and blending i.e. use of appealing brand names like Rwanda tea……
- Offering credit facilities to customers to encourage them keep buying
- Offering gifts and free samples to encourage them buy more like petrol stations giving soap to customers
- Opening many branches in different locations in the country
- Offering after sales services like free transport to customer’s premises, guaranteeing spare parts all which attract customers to the firm involved
- Sponsoring social events like sports and music thus winning market etc.
- Organizing promotions through raffle draws which are intended to increase the number of customers who are attracted to buy the commodity in order to join the draw.
- Organizing trade fairs and exhibitions to make their products known to customers.
- Offering mobile shops. This is where the firm puts its products in a vehicle/ bicycle and moves from place to another selling its products e.g. bread firms
- Renovation of premises of customers by rival firms e.g. telecommunication networks (MTN, Airtel), beer firms (primus, Skol)
- Use of stop shopping centres at fuelling stations
- Use of differentiated attractive packaging and convenient designs of products by firms to outcompete each other.
- Quality improvement and introduction of new variables in order to increase their market share.
- Use of appealing slogans which attract commodities customers to their products e.g. MTN- everywhere you go, Airtel- express yourself, Coca- Cola- taste the feeling etc.
- Free distribution of samples and large purchases to customers’ premises.
1.5.5. Advantages and disadvantages of non-price competition.
Advantages.
1. It ensures quality products on the market. If consumers must choose between two products of the same price but they can see that one is of a higher quality, they generally pick the product of higher quality.
2. It increases total sales. Consumers may even pay more for goods perceived as higher quality with similar outward features. For instance Apple, makers of iPhones, and producers of organic food benefit from this phenomenon.
3. It encourages producers to reduce costs through innovations. If a firm can figure out how to produce an item at a cost comparable to what its competitor incurs, it widens its profit margins.
4. Perception and branding creates market for the commodity. A number of producers compete by manufacturing a perception of high quality with their brands. This allows some companies to charge higher prices for seemingly identical products because consumers see value in the brand itself.
5. Competition by product differentiation helps to widen market. By offering a range of similar products geared toward different market sectors firms can expand their market base.
Disadvantages of non-price competition
1. Competing by improving quality requires more time and resources. The problem with this approach is that it may take some time for consumers to realize any difference in quality.
2. It may be difficult to compete through maintaining brand loyalty. Long-term sustainability of a brand name may be difficult because, as such brand advantages arise through consumer trends, consumer trends may also lead to their demise. For instance, if consumers no longer see a clothing brand as fashionable, the market share may reduce.
3. Competing through product differentiation can result in significantly higher overhead costs for production.
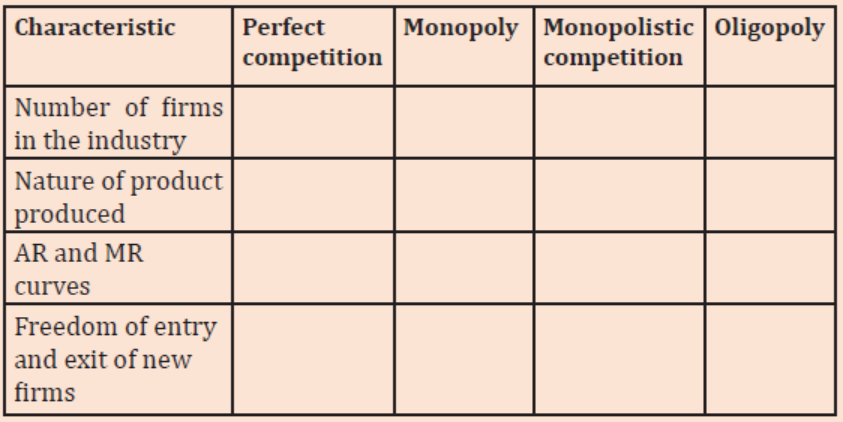
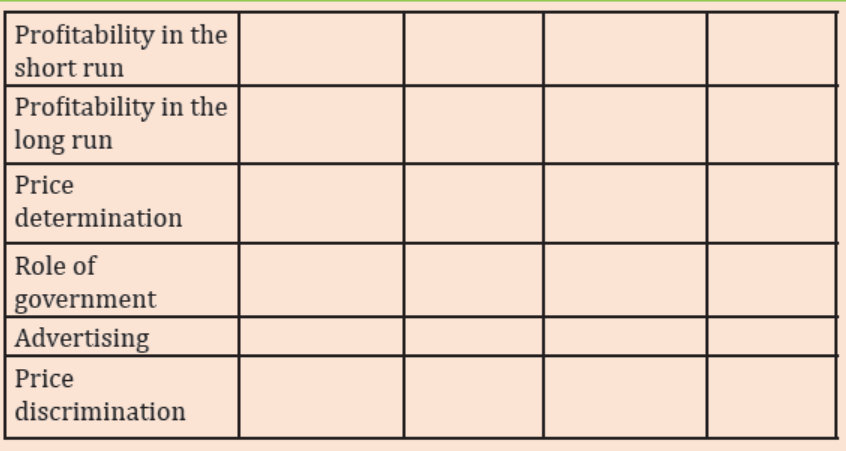
APPLICATION ACTIVITY 1.6
Fill the table below with a summary of the difference and similarities between the following market structures.
END UNIT ASSESSMENT
1. With the help of illustrations, explain how profits are maximized under monopolistic competition in the
i. Short run.
ii. Long run.
2. Examine the differences between perfect competition and oligopoly.
3. Describe the factors that may make a firm to continue in operation though it is operating below the breakeven point.
UNIT 2 MEASURING NATIONAL INCOME
Key unit Competency: Analyse the importance of measuring national income in an economy.
INTRODUCTORY ACTIVITY
Case study of Murwanashyaka
Murwanashyaka is a resident in Nyamasheke and practices farming (crop
production, cattle rearing and poultry farming), fishing and has small
boutique in a nearby trading centre. He wakes up in the morning together
with his wife Kantengwa, milks the cow as the wife is collecting eggs from
the poultry farm. When they finish, they keep both milk and eggs and then
the wife goes to the garden and Murwanashyaka goes to the Lake for fishing.
In the afternoon they take all their products to the market to get money that
will enable them to meet their needs. The money they get is used for buying
basic requirements at home, investing in other profit making activities and
saving for future use.
We can see that his time is divided between producing consumer goods for his
immediate use, capital goods that are an investment for his improved standard
of living in the future, and goods that would be purchased by government
in a more complex society. Murwanashyaka is obliged to decide how much
of his income and the things he produces, will be allocated to consumption
now, investment and saving. His opportunities to consume, invest, and saving
are limited by his ability to produce. The portion of his income that is either
consumed, saved, or invested in capital goods, will determine his income in the future.
Even though Murwanashyaka’s economy is just a one person economy, assess
his case and explain what it teaches to modern economies.
2.1. National income
ACTIVITY 2.1
Using the photographs in figure 1 below;
a. Describe the activities in photographs a, b, c and d.
b. What is the purpose of the named activities in a above to the economy?
c. Based to your knowledge of goods and services;
Activity (a) is........................
Activity (d) is........................
d. Who should participate in such activities?
e. Relate the activities to national income and give the meaning of national income.
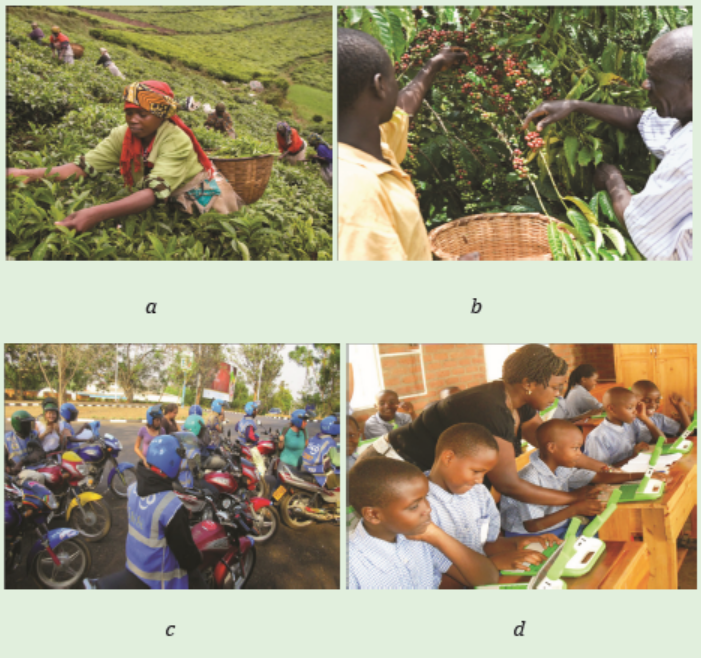
Figure 1: Economic activities
2.1.1. Meaning of national income
National income is an uncertain term which is used interchangeably with national dividend, national output and national expenditure. On this basis, national income has been defined as:
The total monetary value of goods and services arising from productive/ economic activities of a country in a given period of time, usually a year. In other words, the total amount of income accruing to a country from economic activities in a year’s time is known as national income. It includes payments made to all resources in the form of wages, interest rent and profits.
For an individual, the income during any given period of time largely consists of earnings received from participation in the productive/economic activity carried out in the economy.
National income of a country is the aggregate/total of all incomes of those individuals who are residents of the country. Incomes that are received in form of gifts or transfer receipts from other individuals, business firms and governments, do not form part of national income because they are not from corresponding productive activities.
2.1.2. Concepts used in national income
vi. Gross Domestic Product (GDP)
This is the monetary value of goods and services produced in the country by both nationals (residents) and non-nationals (foreigners). Foreigners include foreign investors and expatriates. GDP can be calculated by considering various sector net changed values during a time period.
GDP=C+I+G
Where;
- C = All private consumption/ consumer spending in the economy. It includes durable goods, non-durable goods, and services.
- I = All of a country’s investment on capital equipment, housing etc.
- G = All of the country’s government spending. It includes the salaries of a government employee, construction, maintenance etc.
GDP=GNP-Net income from abroad
GDP=GNP- (x-m)
Where, X-M= Net country export – Net country import.
vii. Gross National Product (GNP)
This is the monetary value of goods and services produced by the nationals within the country and those nationals that live outside the country (abroad). It excludes the incomes earned by foreigners living in the country.
GNP = C + I + G +(x-m)
Where: C= Consumer expenditure by households on goods and services
I = Investment by firms.
G = Government spending sector
X =Exports
M = Imports
(x-m) = net income property from abroad.
GNP = GDP + Net Factor Income from Abroad (x-m).
viii. Net National Product (NNP)
This is the monetary value of goods and services produced by nationals of a country in a given period of time less depreciation costs.
NNP= GNP-Depreciation
Or NNP = GNP - ΔK
Where ΔK = capital depreciation.
ix. Net Domestic Product (NDP)
This is the monetary value of goods and services produced in the boundaries of a country by both nationals and non-nationals less depreciation.
NDP = GDP-Depreciation
x. Income per capita
This is income earned per person in a given period of time.
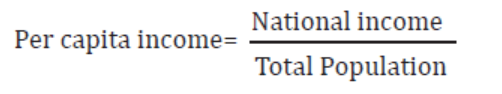
xi. Personal income
This is the total income received by an individual from both productive and unproductive activities.
Personal income = Private income – undistributed corporate profits – profit taxes.
xii. Disposable income
This is a fraction of income that remains for spending after deducting the taxes.
DY = Personal Income – Direct Taxes. Or
DY = Consumption expenditure + savings.
xiii. Nominal income
This refers to incomes expressed in monetary units such as dollars, francs, shillings, etc.
xiv. Real income
This refers to the amount of goods and services that nominal income can buy.
xv. Net factor (Property)
This is the difference between income earned by nationals abroad and income earned by foreigners in the country. Such earnings may be in form of salaries, rent from properties, dividends, profit, royalties, etc.
xvi. National income at market price (NNP mp)
This is the monetary value of goods and services valued at market prices. When the goods are in the market, we add indirect taxes but we subtract subsidies.
NNPmp=NNPfc + indirect taxes – subsidies
xii) National income at factor cost (NNPfc)
This is the monetary value of goods and services produced in a country at a given period of time valued at the cost of factors of production used to produce the goods and services.
NNPfc = NNPmp + Subsidies – Indirect taxes
xvii. Quid Pro Quo.
This is payment received in exchange of goods and services.
xviii. Non-Quid pro Quo.
This is any income received not in exchange of goods and services e.g. gifts, grants, students’ allowances. It’s any income received for no corresponding economic activity reflected in the production of goods and services. Its otherwise known as transfer payments.
xix. Black economy:
This is part of the economy or economic activity which isn’t recorded in the official statistics of the country. It’s an economy where illegal activities take place. Like smuggled output, income of prostitutes etc.
xx. Imputed value:
This is the value assigned to commodities which are not exchanged for money.
This is done when compiling national figures.
xxi. Closed economy.
This is any economy that does not have any economic relation with outside countries i.e. it does not take part in international trade.
xxii. Open economy:
This is any economy that has economic relations with outside countries i.e. it takes part in international trade.
2.1.3. Approaches of measuring national income
ACTIVITY 2.2
Using photographs in figure 2 below;
1. Describe the activities in the photographs a, b, c, and d.
2. How do the activities contribute to the measurement of national income?
3. Explain the approaches used in measuring national income as shown in the photographs.
4. Identify the problems of using the different approaches in measuring national income.
5. Explain how the three approaches give the same results.
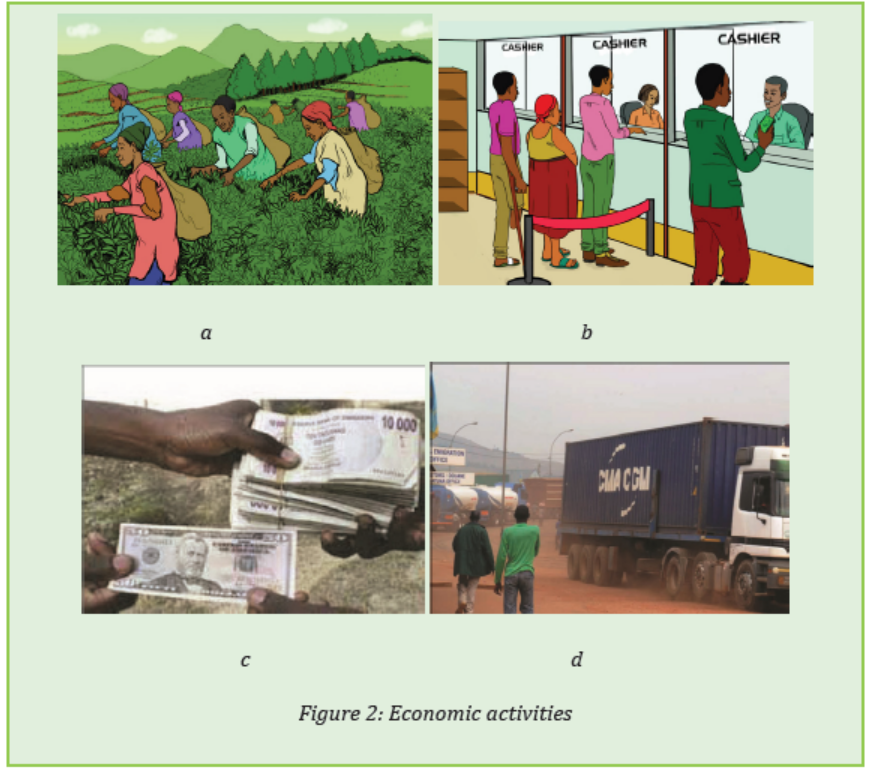
National income measures the income generated by a country through the production/economic activities that are carried out within a country during a specific period of time. In this sense, three important methods/approaches are used to measure national income and these are:
i. Product/Output/Value added method/approach
ii. Income Method/approach, and
iii. Expenditure Method/approach.
These approaches are explained in details as below:
i. Product /Output/value added method/approach
The product/output/value added method/approach is the total summation of the gross value of the final goods and services in different sectors of the economy like industry, service, agriculture, etc. is acquired for the current year by determining the total production that was made during the specific time period. This is the most direct approach of estimating the value of output produced by the country. In this approach, we add up ‘value added’ on output by
all sectors during the course of the year. All final goods and services produced must be included, whether they are sold to consumers, government, firms as capital goods or sold abroad as exports.
The value obtained is the gross domestic product. Thus, we can calculate GDP according to this method:
GDP= Total product of (industry + service + agriculture) sector
Symbolically,
GDP= Σ (P × Q), Where,
P= Market price of goods and services
Q= Total volume of Output
In using this method/approach to determine the national income, it is important to note that sometimes goods produced by one sector are further processed by another sector. These goods are termed as intermediate goods and are already included while determining the value of final goods. So, in order to avoid the problem of double counting of value of goods, the product method if further categorized into two approaches:
a. The Final Goods Approach
In this method, only the value of final goods and services are computed while estimating GDP, regardless of any intermediate goods and their processing. This method takes into account only those goods and services that purchased and consumed by the final consumers in the economy.
b. The Value Added Method
In the value added method of measuring national income, the value of materials added by producers at each stage of production to produce the final good is considered. The difference between the value of output and inputs at each stage of production is the value added.
Thus,
Value added= Value of output – Cost of intermediate goods
Example 1
Given that a farmer in Burera district produces wheat and sells it to the miller in musanze at 100 frw per kg; The miller produces floor and sells it at 150
frw per kg to the baker in Kigali for making breads, who bakes and sells bread each at 200 frw. If the differences are added up for all production sectors in the economy, the value of GDP is computed and the table below clearly explains this method:
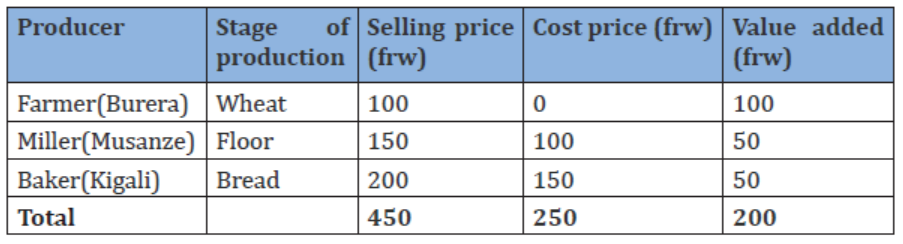
Table 1: Estimation of National Income by Value Added Method
In this example, GDP using product/output/value added method/approach is 200 frw where
GDP= wheat (100)+floor(50)+bread(50)
= 200 frw
Example 2
Stage 1: Masera a farmer in Byumba grows cotton and sells it to a ginnery at 10,000 FRW. This represents an income of 10,000 FRW to Masera. The value added is 10,000 FRW.
Stage 2: The ginnery sorts out the good cotton from the poor cotton and sells it to a spinner at 15,000 FRW meaning that the value added on the cotton is equal to 5,000 FRW.
Stage 3: The spinner uses the good quality cotton to make threads that it sells to Utexrwa, a cloth-making industry, at 25,000 FRW, meaning the value added to the cotton to make threads is 10,000 FRW.
Stage 4: Utexrwa turns the threads into a dress and sells it to Umutoni at 40,000 FRW meaning the value added onto the threads is now 15,000 FRW.
The total value added on to the cotton up to the time of its sale is: 10,000+5,000+ 10,000+ 15,000= 40,000 which is equal to the value of the final dress.
This can further be illustrated in the table below:
Table: calculating national income using value added
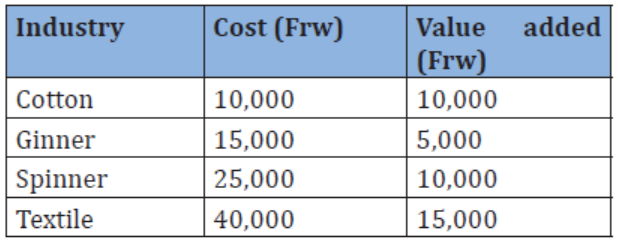
National income=10,000+5,000+10,000+15,000=40,000 Frw
ii. Income Method/approach
Income method sometimes termed as factor income method or factor share method is used to determine national income by measuring as the total sum of the factor payments received during a certain time period.
The factors of production include land, labor, capital, and entrepreneurship. Individuals who provide these factor services get payment in the form of rent, wages/salaries, interest, and profit respectively. The total sum of income received by these individuals comprises the national income for a given period of time.
Besides these, there are professionals who employ their own labor and capital like consultants, doctors, barbers, etc. The income of these individuals is called mixed incomes and is also accounted for calculating the national income. However, income received in the form of transfer payments is not included.
Thus, according to this method,
GDP= RI+W+I+Up+D+Dt+D…
Where;
RI= Rent (Rental incomes on agricultural and non-agricultural properties)
W=Wages/Salaries (Wages and salaries earned by employees including supplements
I= Interest (Net interest earned by individuals other than governmental bodies)
Up=Undistributed Profit (Profits earned by businesses before payment of corporate taxes and liabilities)
D=Dividends
Dt=Direct taxes
D=Depreciation
iii. Expenditure Method/appraoch
The expenditure method measures the national income as the sum total of expenditures made by individuals on personal consumption, firms on private investments, and government authorities on government purchases.
Since incomes from production are earned as a result of expenditure made by other entities on the produced goods and services within the economy, the result of expenditure method should be same total as the product method. However, with an exception of avoiding intermediate expenditure in order to avoid the problem of double counting, national income under expenditure method can be expressed as
GDP= C + I + G + (X – M)
Where,
C= Consumption Expenditure (Expenditure on durable goods such as furniture, cars, and non-durable goods such as food);
I= Investment Expenditure (Private investment in capital goods or producer goods such as buildings, machinery, etc.);
G= Government Expenditure (Government expenses for maintaining law and order, developing pre-requisites of development, etc.);
(X-M)= Net Export (Difference between imports and exports)
Identical results of the approaches to national income
The national income accounts are based on the idea that the amount of economic activity that occur during period of time can be measured in terms of:
1. The amount of output produced during certain period excluding output used up in intermediate stages of production (product approach);
2. The income received by sellers of output (income approach);
3. The amount of spending by the buyers of the output (expenditure approach).
Meaning that, unless there are errors such as incomplete or misreported data, all the three approaches of measuring national income are expected to give the same (identical) results. This is shown below.
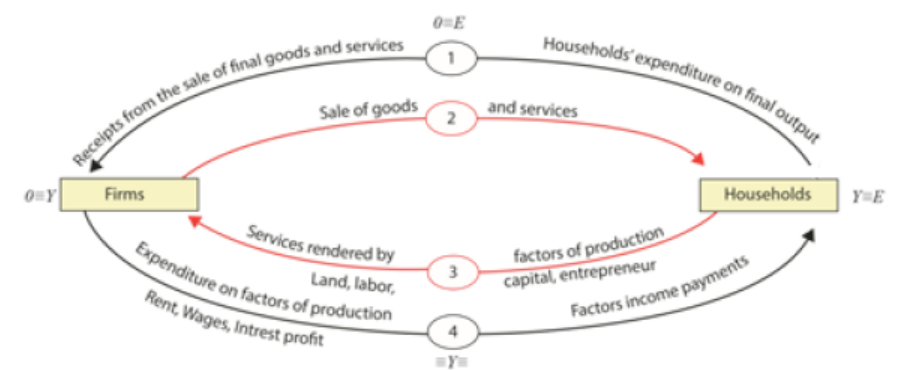
Figure 3: Identical results of the approaches to national income
From Figure 4 above:
- The expenditure on goods and services in the market is paid out to the
factors of production as rewards for their contribution to the production of
goods and services in form of wages, interests, rent, profits, and, therefore,
the income approach is equivalent to the expenditure approach, i.e. Y≡E.
- The money value of goods and services produced by the firms is reflected
in the prices paid for them in the market a n d , there fore, the output approach is equivalent to the expenditure approach,
- i.e. O≡E.
- The value of goods and services produced by firms is also reflected in the incomes received by the different factors of production, therefore, the output approach is equivalent to the income approach, i.e. O≡Y.
- Since Y≡ E, O≡ E, O≡ Y, therefore, O≡ Y≡ E
Example:
Given the table below, we can calculate GDP by use of 3 approaches and you will notice that all the 3 approaches give the same results.
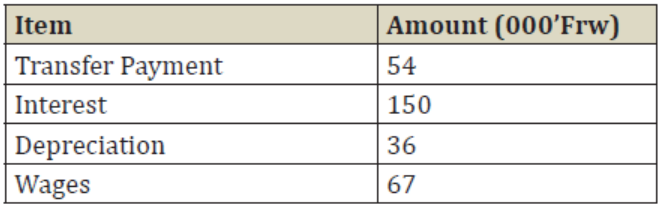
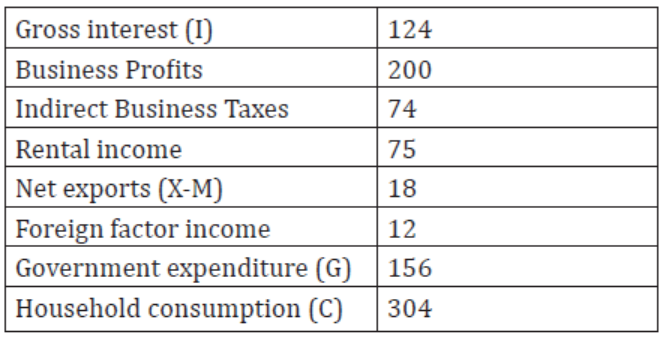
As you can see, the table contains variety of data, so you have to select which data fit into the approach you want to use. In this sense, by expenditure approach;
GDP =C+G+I+(X-M)
Where C = 304
G = 156
I = 124
X-M = 18
Therefore: GDP = 304+156+124+18=602Frw
By using income approach, we can get:
NI = W+R+I+PR
Where W = 67
R = 75
I = 150
PR = 200
NI =67+75+150+200=492 FRW
Recall, determining GDP using income approach:
GDP =NI+Indirect business taxes +depreciation
GDP = 492+74+36=602 Frw
As you can see, in this example, both approaches to calculate GDP will give the same result/estimate. However, this is not always what happens and sometimes GDP will differ slightly when different approaches used.
2.1.4 The circular flow of income
This is a system that illustrates the flow of resources and commodities and the flow of expenditure and incomes between households and firms. The flow of resources and commodities is known as real flow while the flowof receipts and incomes is called money flow. Therefore, the circular flow of income involves both real and money flows.
a. Circular flow of income in a closed economy
A closed economy is that economy that doesn’t take part in international trade. In this economy, the flow of resources and commodities and flow of expenditure and incomes is between households and firms.
Assumptions underlying the circular flow of income in a closed income.
- Only 2 sectors exist i.e. the business or firm sector and the household sector (C+I).
- The household sector consists of the owners of factors of production and consuming class.
- No production takes place in the household sector.
- The firm sector is the sole producer of goods and services for all the household sector.
- Output produced is sold i.e. no inventories or unsold stock.
- All incomes earned are spent i.e. no savings (it is a spend thrift economy)
- There is no international trade i.e. no economic relations with other countries.
- There is no government intervention;
Basing on the above assumptions, the circular flow of income would appear as follows;
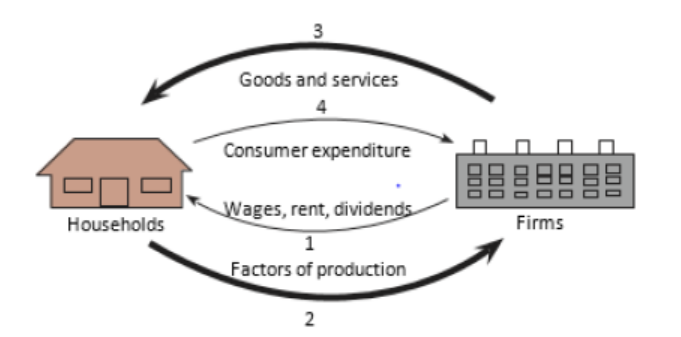
Figure 4: Circular flow of income in a closed economy
From Figure 4 above, we note the following:
- Firms buy factors of production from households (2) and pay for these factors of production (1). Firms use the factors of production to produce goods and services which they sell to households (3). In turn, households pay for these goods and services (4).
- Arrow (2) and arrow (3) show real flows, i.e. the flow of factors of production and commodities, respectively.
- Arrow (1) and arrow (4) show monetary/financial flows, i.e. flow of income and expenditure, respectively.
- The value of goods and services (output approach) is equal to households’ expenditure on them (expenditure approach), O=E.
- Receipts received by firms from sale of goods and services (expenditure approach) are spent on buying factors of production (income approach), E=Y. The value of the goods and services is also reflected in the incomes received by the factors of production, O=Y. Therefore, the three approaches should give equivalent results if there are no errors,
i.e. O ≡ Y ≡ E.
b. Circular flow of income in an open economy
An open economy is that economy that has economic relationship with outside countries, i.e. there is international trade, so as to protect infant industries, check on profit repatriation by foreign investors and save the volume of foreign savings injected into the domestic economy. It tends to utilise other sources apart from the household to provide capital, which is injected into the circular flow of income.
The sources could be foreign investment and the government. In an open economy, both domestic and foreign firms interact, thus it involves domestic
households, domestic producers, government interference and the foreign sector as well. Thus, showing how the economic agents interact, i.e.
C+ I+ G + (X-M).
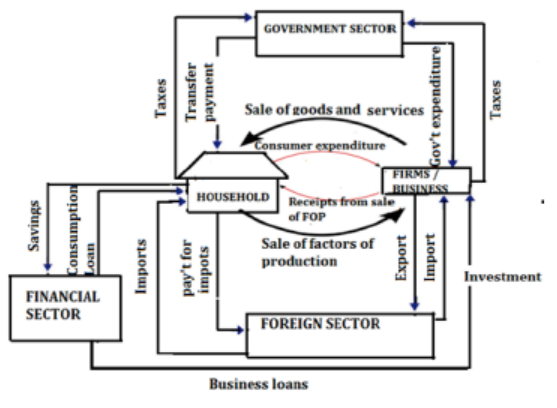
Figure 5: Circular flow of income in an open economy
From Figure 5 above, it is noted that:
- The household owns all factors of production and hires them to the domestic producers. In turn, they receive income in form of rent, salaries, interest and profits from the business sector (domestic producers) which is used to pay for goods and services from the producers. The remaining income after consumption is used to make savings through financial system which lend to the business firms.
- Firms buy factors of production from domestic households and use them to provide goods and services which are consumed locally and at times exported to the foreign sector. When they run short of funds for paying for factor services and investment, they have to borrow from the financial institutions in order to raise capital to produce.
- Taxes are paid to the government by firms’ profits.
- The state spends the tax revenue received to provide social services to the people.
- The foreign sector provides market, i.e. for domestic exports and providing imports to the domestic households.
- The financial sectors stand between savers (households) and borrowers (investors) by receiving savings from households on which it pays interest. It provides business loans for firms for investment on which it charges interest which is higher than that paid to depositors. The difference is the surplus for this sector.
2.1.5. Factors determining the level of national income
There are many determinants or factors which influence the size of the national income. They, in brief, are as follows:
1. Stock of natural resources: These include resources such as land, minerals, soils, etc. When such resources are available and exploited, national income will be high but if they are scarce and not exploited, national income will be low.
2. Availability of capital: When capital in form of machines and money is available, national income will be high compared to when capital is scarce.
3. Technological progress: Once technology is advanced, output will increase and national income will be his/her than when technology is outdated.
4. Human resource: If the country’s labour force is highly productive with good entrepreneur skills, national income will be high compared to when the quality of labour is low.
5. Political situation: Political stability will lead to increase in productivity and high national income while instability will cause low production and national income.
6. Level of market: A big market for goods and services will lead to high productivity and national income; while a small market will discourage production, hence low income.
7. Level of infrastructure development: Once infrastructure such as roads and communication, among others, are well developed, it will encourage investment, hence increasing national income. But when they are under developed, national income will be low.
8. Government policy of taxation and subsidisation: Once the government overtaxes the people, it will discourage investment and national income will be low but once the government subsidises the people, investment and national income will increase.
9. Organisation of factors of production: Once factor inputs such as land, labour and capital are well coordinated and organised, national income will be higher than when these factors are poorly coordinated.
10. Institutional factors such as culture, religion and people’s attitude towards work. If people’s attitudes towards work are high, national income will be high but low attitude will lead to low national income.
2.1.6 Importance and difficulties in measuring national income
ACTIVITY 2.3
Rwanda is ranked among the fastest developing economies in the world. Both the country’s nationals and non-nationals have witnessed the outstanding development in in all sectors of the economy. The GDP growth rate is at 8.6% in 2018 (Minecofin, key statistics of 2018).
1. Do you think producing figures of the country annually is necessary? why
2. What do you think are the difficulties encountered in measuring national income?
a. Importance of National Income Statistics
National income data/statistics are of great importance for the economy of a country. It tells us aggregates of a national income, output and product result from the incomes of different individual products or industries and transactions of international trade. It is thus important to compile national income data because of the following reasons:
1. National policy analysis: For example, policies on employment can be based on the level of output, investment, etc;
2. Research: Both economy and social research can be carried out in respect of incomes, savings, investments, consumption patterns, etc. Data on these indicators can be got from the statistics of national income;
3. Per capita income (national income divided by total population) is a good indicator of improvement or decline in the standard of living;
4. National income statistics show the distribution of income among the various factors of production and sectors of the economy, namely: the household, business and the government sectors. This is important in planning for taxes and governments expenditure;
5. They are important in estimating the level of international transactions and the degree to which an economy depends on other economies. This can be estimated from the figures of imports and exports;
6. They show the patterns of expenditure: This is shown by figures of private and public expenditure. This is important in the making of the national budget where there is the need to estimate private and public expenditure;
7. They show regional performance and improvements: Incomes of different regions in the country can be compared so as to make plans on how to improve backward regions;
8. They are used for international comparisons which are necessary if improvement in economic performance is to be achieved;
9. They are used for comparisons of economic performance in one country over time so as to make improvements;
10. They show the rate of resource utilization: The increase in national income may be the result of increased utilization of national resources;
11. They measure the size of various economic sectors, i.e. agriculture, industry and infrastructure or monetary and subsistence sector. This is helpful in tracing the source of economic growth and allocation of resources among these sectors.
b. Difficulties of measuring national income in LDCs
There are a number of statistical and conceptual problems which are encountered when measuring national income. Conceptual problems are those problems that arise from the interpretation of the subject matter of national income for example, defining the boundary of production.
While statistical problems are those that arise from the exercise of collecting and processing national income data, such as inadequate information, lack of enough qualified personnel, etc.
A combination of both statistical and conceptual problems includes the following:
1. Defining the term nation: There is difficulty in defining the term nation in national income. Every country has its own political boundaries but in national income estimation, the term nation includes the income earned by nationals of a country in a foreign country beyond the territorial boundaries of the country in question;
2. Double counting: There is a possibility of counting some commodities more than once. For example, wheat as an intermediate good may be counted and at the same time bread as the final good;
3. Non-monetary output: National income is measured in monetary terms, but there are some goods and services which are difficult to measure in monetary terms, for example, Subsistence output, services of housewives, etc. All these activities add to economic welfare and all use economic resources yet none of them is included in official measures of national income and product. This leads to underestimation of national income;
4. Inadequate information especially on private expenditure and other private incomes, information on fisheries, crops and animal husbandry, among others, on which very little data is available leads to national income figures underestimated;
5. Shortage of facilities such as computers to collect and process national income data may also bring about statistical errors when computing national income;
6. Price changes: When the price level in the country rises, national income also shows an increase although the production level may have fallen. Also, there might be a decrease in the price and national income also shows a reduction although production levels may have increased. Thus, due to price changes, national income cannot be adequately measured;
7. Timing of production: It is very difficult to determine output produced in the country during the year. For example, crops may stay in the field for more than one year and there is a likelihood that they may be counted year after year;
8. Inflation: Changes in prices affect the value of GNP and the effect of inflation is difficult to adjust accurately;
9. It is difficult to determine transfer payments such as unemployment benefits, gifts, etc. It is hard to tell whether such payments were received as a result of providing services or not yet they are part of the incomes of the giver;
10. Omissions from GDP: There are activities that may be omitted from national income such as prostitution and smuggling, among others. Although those bring welfare and incomes to the people, they are not included when calculating national income. Therefore, it leaves national income figures underestimated;
11. It is difficult to determine net exports and income earned from abroad since import and export trade is carried out by many people or groups of people also there are lots of goods that come in and go out undetected due to smuggling.
c. Shortcomings of using national income figures
National income data are highly useful in several ways, but it is necessary to use them with caution. They have the following shortcomings:
1. Comparison between countries: The per capita income of a country whose principal diet is rice and fish as in Korea is not comparable with Rwanda’s, where the diet is so much varied. Money units do not measure these differences in the kinds of products consumed;
2. Changes in the country’s stock of capital: National income statistics do not consider the changes in the country’s stock of capital equipment. The calculation of depreciation on capital goods is not accurate;
3. Changes in quality: The qualitative aspect is totally ignored. The GNP figures do not take into account the quality of goods and services;
4. Marketed activities: National income data are confined to goods and services sold in the market. But, in the majority of underdeveloped countries, most production takes place in the homes of people. Measures of national income confined to production for home consumption underestimate per capita income in such countries, since the national income is underestimated;
5. Use of national income figures over a long period: For shorter periods of two or three years, comparisons of income totals are valid for most purposes. But over a longer span of time, they can be misleading. Over a longer period, a number of new products may appear in the economy and a number of old products may disappear. It, therefore, becomes difficult to compare two periods with unlike items.
APPLICATION ACTIVITY 2.1
1. Differentiate between GDP and GNP
2. Suppose an economy has only three producing units, (a) an enterprise engaged in cutting trees, (b) another engaged in converting trees cut by the first enterprise into wood and (c) a third engaged in converting wood, produced by the second enterprise into tables. Further, suppose that the first enterprise engaged in cutting trees does not require any raw materials for undertaking its activity. Analyse the table below and determine the value added of these three enterprises over a year.
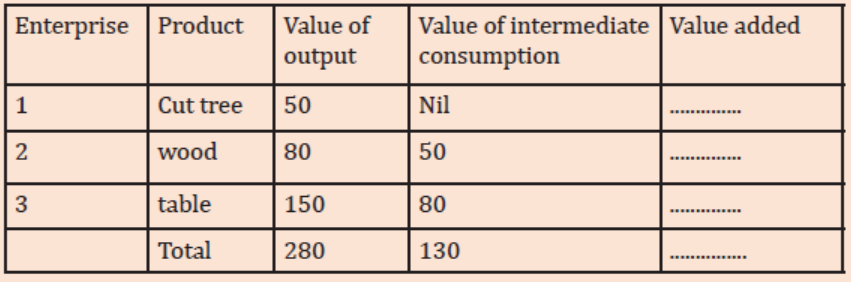
3. Explain the factors determining national income
4. Give the importance and difficulties in measuring national income
2.2. National Income equilibrium Approaches
ACTIVITY 2.4
Carry out research and answer the following:
1. What is equilibrium?
2. Explain situations when national income is in equilibrium.
3. Illustrate the situations for national income equilibrium.
4. The additions to the circular flow of income are called………..,
while the withdraws are called……………….
5. The situation when aggregate demand is greater than aggregate
supply at full employment is known as……… and when
aggregate supply is greater that aggregate demand at full
employment is known as………
6. With illustrations, explain how the gaps in (5) above can be closed.
2.2.1 Meaning of equilibrium
Equilibrium can be defined as a state of stability in economic conditions irrespective of the forces influencing different economic agents.
That is, there is no tendency for consumers and firms to change their economic behaviour. This means that the variables in an economy are equal and have no tendency to change. As already pointed out, during equilibrium, national product and national income must be equal and also national income is equal to national expenditure since it is derived from this income.
2.2.2 Equilibrium level of national income
We combine the aggregate demand and supply curves to determine the equilibrium level of national income. When we impose the AD on the AS as shown in figure below, we note that AD is greatest at lower prices, whilst AS is at its highest when prices are higher. The equilibrium, in the macro sense, will
occur at the level of real national income or output at which the total planned expenditure on output equals the quantity of goods and services firms are willing and able to supply.
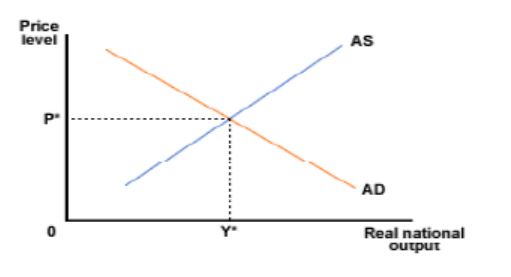
From the figure above, equilibrium level of national income is obtained at an output level of Y* and a price level of P*. If nothing changes then the economy will be stable at this equilibrium, but any changes in aggregate supply and demand will lead to changes in output and the price level.
2.2.3. Approaches of measuring national income equilibrium
We can measure national income equilibrium level using various approaches. Under this unit, we shall consider; leakages-injections and inflationary and deflationary approaches in measuring national income equilibrium.
a. National income equilibrium: leakages – injections approach National income is in equilibrium when total leakages are equal to total injections.
Leakages refer to elements which withdraw money from the circular flow of income. They include savings -S, consumption-C, taxation -T, imports-M and capital outflow-Ko. These elements remove money from the circular flow of income, i.e. C+S+M+K0
Injections refer to elements that add to the circular flow of income. They include investment-I, consumption-C, Government expenditure-G, exports-X and capital inflow-Ki. These elements add money to the economic activities in an economy, i.e. C+I+G+ +X+ Ki
Thus, national income is in equilibrium when C+S+M+K0=C+ I+ G+ X+ Ki
i. National income equilibrium in a closed/two sector economy
A closed economy is one where transactions take place within the country without any foreign trade. The major factors, which determine the level of income (Y), are consumption (C), saving (S) and investment (I). The country’s
income can be used for the consumption and saving. These are known as leakages or withdrawals. The identity is Y = C + S. If the level of income is to be maintained, saving must be put back into the economy in form of investment so as to create more income.
Consumption must also take place. These are known as injections. The identity is C+I =Y. Therefore, we have Y = C + S and Y = C +I; equating the two expressions yields C + S = C + I = Y. In a closed economy without government, equilibrium income is a situation where savings are equal to investments. This can be illustrated as below:
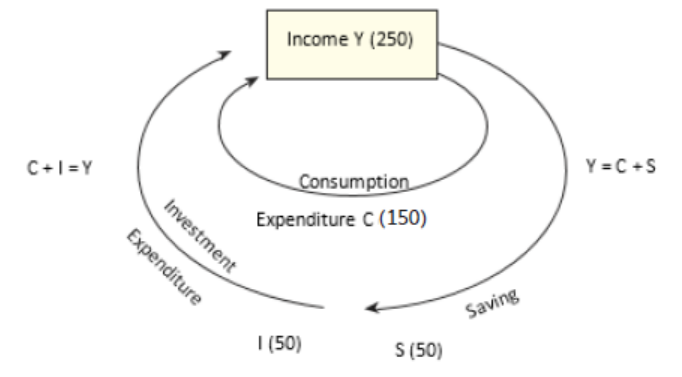
Figure 6: National income equilibrium in a closed economy
The left hand side of the Figure shows how income is being created through consumption and investment. The right hand side shows how income is being used through consumption and saving. Our objective is to determine precisely the equilibrium level of GDP and to see what factors it depends upon. Thus, C+I=C+S=Y which then means I (an injection) =S (a leakage) in a closed economy.
Equilibrium income determining: Saving-investment approaches
Total withdrawals from and injections into the circular flow determine equilibrium national income. In a two-sector/closed economy, withdrawal comprises only saving while injection comprises only investment. Equilibrium national income is determined at that point when planned saving and planned investment are equal to each other. Diagrammatically, at the intersection of the saving and investment line, equilibrium national income (Y0) is determined.
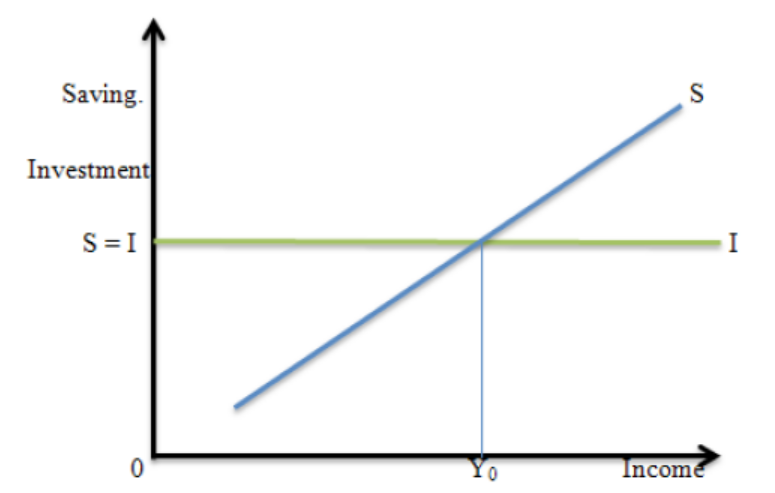
Figure7: Saving-investment approaches
From Figure 7 above, it is seen that equilibrium income can also be determined through the saving- investment approach. Planned saving is equal to planned investment. The intersection of the saving and investment schedules determines equilibrium income and output at (Y0). The savings are positively related to the income, while investment is autonomous.
The economy will reach equilibrium at full employment only if the amount that consumers wish to save out of their income is precisely equal to the amount that investors want to invest. At any income below (Y0) , planned investment exceeds planned saving. Aggregate demand exceeds aggregate supply. This forces investors to increase the rate of production until Y . At any level of income beyond Y , savings exceed investment. Aggregate supply exceeds aggregate demand. Consequently, there are unsold inventories and investors will be forced to reduce the rate of production until S =I.
Example
In Determining an equilibrium national income in a two-sector /closed economy model, lets assume consumption (C) is given by the consumption function C = 5 + 0.8Y
Where Y is income
Assume that investment is autonomous (I) and is given by I = 10
It says that investment is an exogenous variable. As it is determined outside the
model, investment is simply considered as given.
With this information, we want to derive the equilibrium values of income,
consumption, saving and investment.
Solution:
Equilibrium condition is Y = C + I, where C = a + bY and I = Î.
Putting the values of C and I, we obtain
Y = a + bY + Î (i)
Y – bY = a + Î
Y (I – b) = a + Î
Therefore,
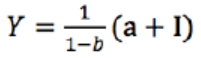
Here, Y is the equilibrium level of income. Substituting the consumption and
investment equations into equation Y, we get
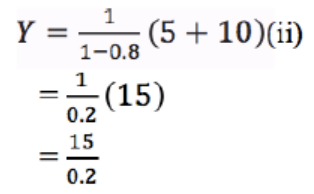
Y=75
Thus, C = 5 + 0.8(75) =65, and
S = Y – C = 75 – 65 =10
I =10
The above approach has an alternative approach, known as saving-investment approach.
Alternative Solution:
Equilibrium condition now is S = I
S = Y – C
= Y – a – bY
= – a + (1 – b) Y
Assuming Î = Î, the equilibrium condition becomes
– a + (1- b) Y = Î
So the equilibrium level of income is
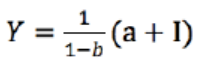
From the consumption function C = 5 + 0.8Y we find the values of -a and (1 – b). If a = 5 then (-a) = -5 and if b = .8 then (1 – b) = 0.2. Now putting these values into saving and investment equation, we get
– 5 + 0.2Y = 10
0.2Y – 5 = 10
0.2Y =10 + 5
Or, Y = 15/0.2 = 75
If Y = 75, saving must be equal to 10 since consumption is 65.
Note that since the two forms of equilibrium condition are equivalent, the level of income must be the same.
Exercise 2.1
Suppose S = - 40 + 0.20Y and I = 60. Find the equilibrium income, saving and consumption.
ii. National income equilibrium in an open economy
An Open economy is one where there is foreign trade. So far, we have dealt with a very simple economy consisting of only households and businesses. All the income created in the process of production was passed on to households as disposable income. Thus, GNP and disposable income were identical.
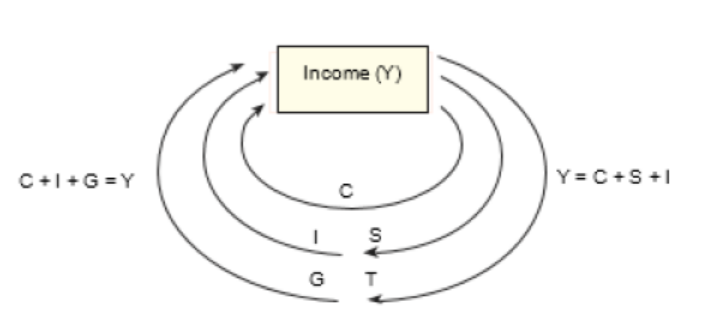
Figure 8 National income equilibrium in a closed governed economy
From Figure 8 above, in our simple economy, when the government sector is added, it levies taxes and makes expenditures on the purchase of goods and services. The government also makes transfer payments. Aggregate demand now consists of consumption (C) investment (I) and government demand for goods and services (G). Therefore, C + I + G = Y. Not all the income from the production of output is disposable income to the households. A portion is now absorbed by the government as net tax receipts.
Net tax receipts are total tax receipts less that portion which is returned to the private sector in the form of government transfer payments. While government tax receipts reduce disposable income, government transfer payments such as unemployment allowances increase disposable income.
The income is used for consumption, saving and tax.
Y = C + S + T. Therefore, equilibrium income is where S + T = I + G, i.e. leakages = injections. When government expenditure is added on, the equilibrium income increases from Y1 to Yθ where I + G = S+ T.
Equilibrium income determining: The leakages-injections approach
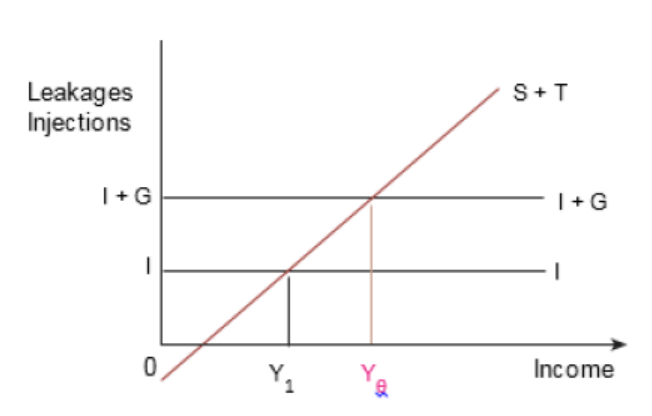
Figure 9. The leakages-injections approach
When the foreign sector is introduced, income is created through consumption, investment, government expenditure and exports. Thus, C + I + G + X = Y. The income is used for consumption, saving, tax and imports. This is indicated by the following equation Y=C+S+T+ M.
Equilibrium income is, therefore, equal to S + T + M = I+ G + X. Leakages =
injections. The equilibrium income is indicated in Figure below;
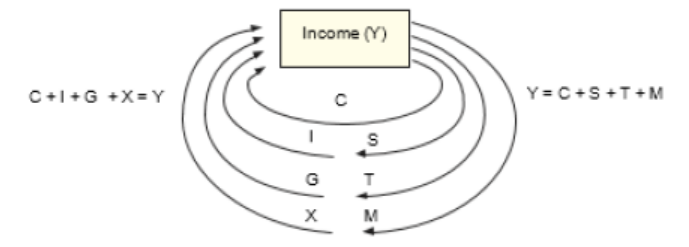
Figure 10 Equilibrium income with the foreign sector (open economy)
From Figure 10, it is seen that when the foreign sector is added on, injections become C + I +G + X and leakages become C + S + T + M. Therefore, the equilibrium income increases to Ye where, I+ G + X = S + T + M.
Equilibrium income determining: Leakages-injections approach
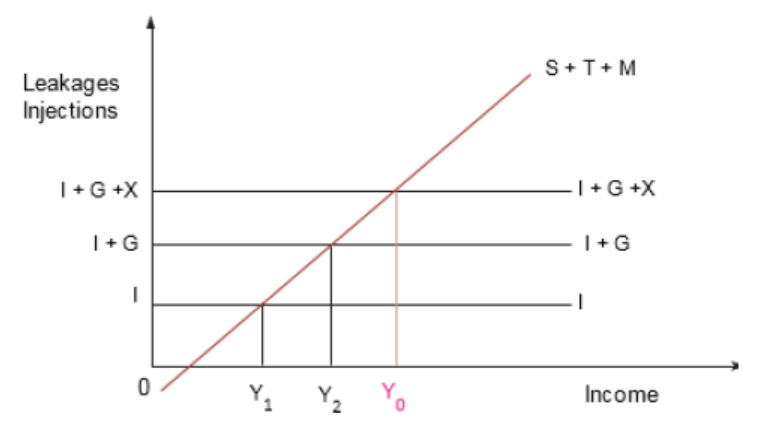
Figure 11: Leakages-injections approach
From Figure 11 above, investment, government spending and exports are known as the injections into the flow of income. They increase the circular flow of income. Savings, taxes and imports are referred to as withdrawals or leakages from the flow. They reduce the country’s income—the circular flow of income.
The condition for the equilibrium income is that injections = leakages. When injections exceed leakage, the level of income increases whereas if leakages exceed injections, the income level reduces.
Mathematically, when determining equilibrium income in an open economy we can demonstrate it as below;
Y=C+Id +G+(X-M)
Where; C =a+bYd
Id =Î
G =Ĝ
x=x^
Yd =Y-Ť
M =Ḿ+gY
By substituting the values of different constant variables in national income equation we get
Y= a+bYd+ Î+ Ĝ+ Ẋ+ Ḿ+gY
Given Yd =Y.Ť, then;
Y=a+b(Y- Ť))+ Î+ Ĝ+(Ẋ-(Ḿ+gY))
Y=a+bY-b Ť+ Î+ Ĝ+Ẋ+Ḿ-gY
Y - bY + gY = a- b Ť+ Î+ Ĝ+Ẋ+Ḿ
Y(1 - b + g) =a - b Ť+ Î+ Ĝ+Ẋ+Ḿ
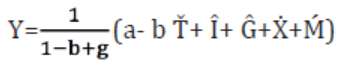
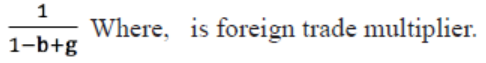
Recall, total demand for national output equals national output. But national expenditure (C + Id + G) does not have to equal national output, even in equilibrium, if the economy is open. Equilibrium still means what it did with a closed economy, which is to say that there is no change in inventories. Equilibrium in no way implies trade balance.
Example
Suppose
C = 10 + .8(Y- Ť)
S=-10+.2(Y-Ť)
Id =23
G=10
T=10
M=.3Y
X = 15
Find the equilibrium income (Y)
Solution
Y= C+Id+G+(X-M)
Y=10+0.8(Y-10)+23+10+15-0.3Y
Y=50+0.5Y
0.5Y=50
Y=1000
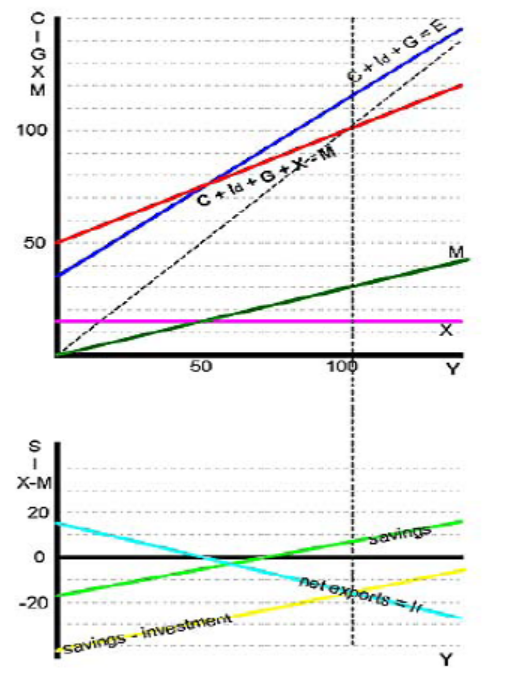
Figure 12: Diagrammatically, the above situation can be shown below;
From the diagram, it is important to note that, the lower part of the diagram graphs net exports and the gap between savings and domestic investment. Savings is also graphed by itself. Here equilibrium is the point where the amount of financing forthcoming from foreigners is enough to fill the domestic savings-investment gap.
b. Inflationary and deflationary gaps approach
National income equilibrium: Inflationary gap and deflationary gap approach. According to the classical economists, equilibrium income is determined where aggregate demand is equal to aggregate supply. At such a point, savings are
equal to investment, and all the resources are fully employed.
Keynes, on the other hand, disagrees with this analysis. According to him, full employment level of income (Yf ) may not equal to the equilibrium income (Ye). It is possible to have (Yf ) being greater than (Ye ) and hence the deflationary gap. It is also possible to have (Ye ) being greater than (Yf) and hence the inflationary gap.
A deflationary gap is a situation where aggregate supply exceeds aggregate demand at full employment. All that is produced is not demanded. Realised investment is greater than the actual demand. A deflationary gap is caused by deficiency in demand.
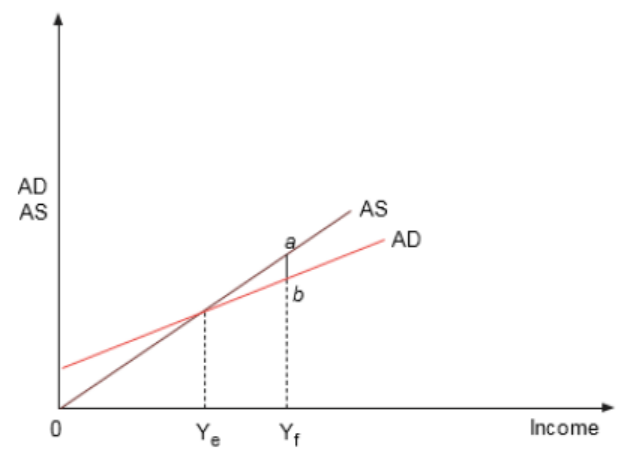
Figure 13 Deflationary gap
From the figure 13, gap a-b is deflationary gap and it can be closed by increasing aggregate demand from aggregate demand (1) to aggregate demand (2) and this can be done through using the policies that increase demand for goods and services.
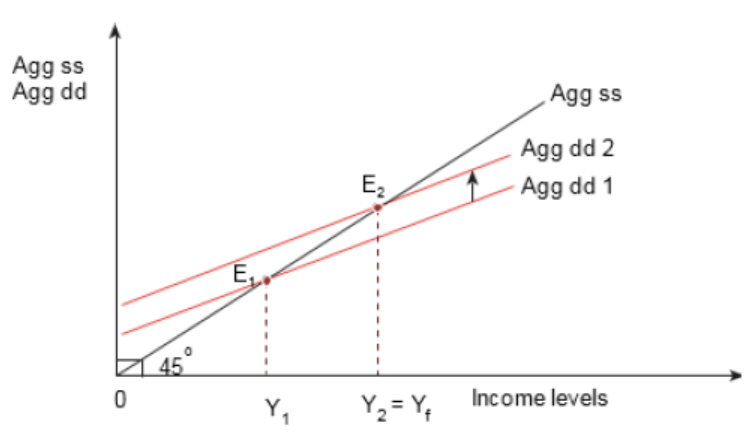
Figure14: Closing a deflationary gap
From Figure 14 above, Agg ss- aggregate supply, Agg dd- aggregate demand, E1- equilibrium 1, E2 equilibrium 2, Y1 – income 1, Y2= Yf – shows full employment levels of resources.
Policies that can be used to increase aggregate demand
- Increasing the volume of exports so as to get rid of the surplus;
- Discouraging imports so as to avoid increasing the volume of goods in the country;
- Adopting an expansionary monetary policy – This will help to increase money in the hands of the people, hence increase their demand;
- Increasing government expenditure – This will also increase money in the hands of the people, hence increasing their demand;
- Increasing wages such that the people can have access to income and increase demand;
- Reducing taxes – This will increase the disposable income in the hands of the people, hence increasing their demand;
- Adopting price control especially maximum price which is low and will encourage demand.
An inflationary gap is a situation where aggregate demand exceeds aggregate supply at full employment level. Realised investment is less than actual demand. Supply is not enough.
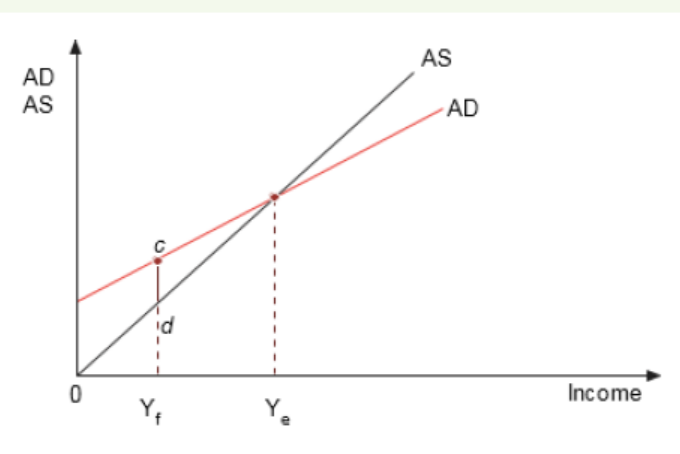
Figure 15: An inflation
From Figure above, gap c-d is an inflationary gap.
At point (Ye ), national income is in equilibrium when aggregate demand is equal to aggregate supply. Before (Ye ), aggregate demand exceeds aggregate supply and this is called an inflationary gap. It can be closed by reducing aggregate
demand from aggregate demand (1) to aggregate demand (2) as shown below and this can be done through the policies which reduce the money in the hands of the people so that because of little income, demand is also reduced.
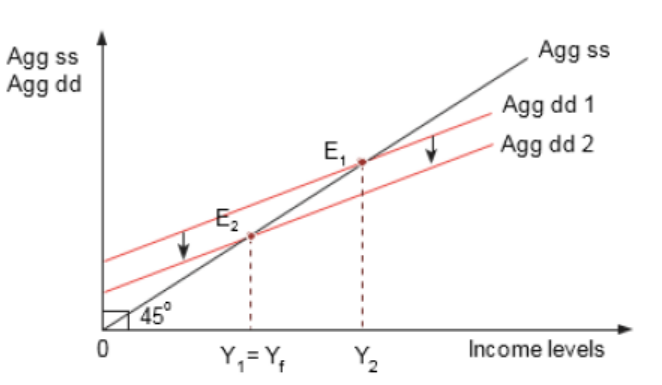
Figure16 : Closing an inflationary gap
From Figure 16, Agg ss- aggregate supply, Agg dd- aggregate demand, E1- equilibrium 1, E2 equilibrium 2, Y1= Yf shows full employment levels of resources, Y2- income.
Policies that can be used to reduce aggregate demand
- Adopting a restrictive monetary policy – This will reduce the amount of money supply and hence lower aggregate demand;
- Increased imports – This can help to increase the volume of goods available when demand is greater than supply;
- Reduced exports – This is to reduce the amount of goods going out of the country so as to make them enough for the people;
- Increased taxes – This is to help reduce the disposable income of the people so that they do not have a lot to spend;
- Reduced government spending – This is aimed at reducing and controlling the amount of money in circulation which leads to limited liquidity and low demand;
- Adopt price control especially minimum price legislation which is a high price that can reduce the demand for goods and services;
- Reducing wages by adopting a tight income and wage policy.
c. Fluctuations in level of economic activities
In any given economy, economic conditions and circumstances do not remain constant over a long period. There are always upward and downward swings in business activities or trade.
According to Professor Mitchell, it is a type of fluctuations found in aggregate economic activities of nations that organise their work mainly in business enterprises.
The course of trend of business activities passes through phases of prosperity and adversity which are referred to as trade/business cycles. They occur in every economy periodically and they follow a particular pattern. Each cycle takes a different period from the other and a time taken in each cycle is different in different economies.
A typical business cycle is generally divided into 4 phases although some scholars argue that they are five as seen below.
- Boom phase (upswing)
- Recession phase (upper turning point)
- Depression or slump or trough phase ( downswing)
- Recovery phase (lower turning point)
- Prosperity
There are basically four stages of business growth although some scholars argue that they are five as seen below.
1. Expansion (Boom)
This is a stage where business activities are at high levels and they tend to acquire profits. The business is normally in the upswing mode as shown by the high levels of economic activities. It is characterised by the following:
- There is increase in the demand for both capital and consumer goods.
- Companies invest in more production facilities with a view of making profits from the increase in sales.
- Banks lend capital for expansion at low rates because they have confidence in the investors paying back.
- There are high rates of employment brought about by high aggregate demand and investments.
- Business is at its peak and makes supernormal profits.
2. Recession
This stage is the upper turning point and shows that the economy is in a decline as shown by the characteristics below:
- Level of sales and production orders start declining.
- Production facilities become underutilised.
- Companies reduce the work rate.
- Workers hired on casual basis are laid off.
- There is reduction in the level of output.
- Banks raise the interest rates to counter the rise in risk of default on loans.
- Most of the companies reduce the price of their goods so that they can increase demand.
3. Depression
This is the bottom of a cycle where economic activity remains at a low level.
It has the following characteristics:
- Demand for products and services reduce, forcing some companies to shut down some production facilities.
- There are rampant cases of unemployment brought by closing of industries.
- There are high rates of poverty.
- The purchasing power in an economy becomes very low.
- The gross domestic product declines and so does the standard of living of the people.
- The fall in price of capital goods is more than that of consumer goods.
- Demand for loans declines because the investors become irritated by the economic situation.
4. Recovery
This is the stage where business begins regaining its strength. Business may sell output at very low prices to retain the operating costs; carry out some repairs; or gets some credit, among others. This helps it to begin moving from the trough. The stage is characterised by the following:
- Business become confident in the market and they begin buying goods so the business begins making profits.
- The bank rates become low so the companies can afford to borrow and finance projects.
- There is an increase in production because of increase in aggregate demand.
- Companies begin employing people and so there is a reduction in unemployment levels.
- Standards of living of the people improve since they can afford to buy goods and services.
- Profit margins of business start rising and the gross domestic product also begins to rise.
5. Prosperity
This is where business regains its strength and activities are at their peak.
The following are its characteristics:
- There are high employment levels in an economy.
- There are high incomes due to the employment levels.
- High levels of production is common at this stage.
- There is high aggregate demand and cost which leads to a rise in
investment and prices for goods and services.
- The existing capacity of plants is under utilised.
This can be illustrated in the figure below.
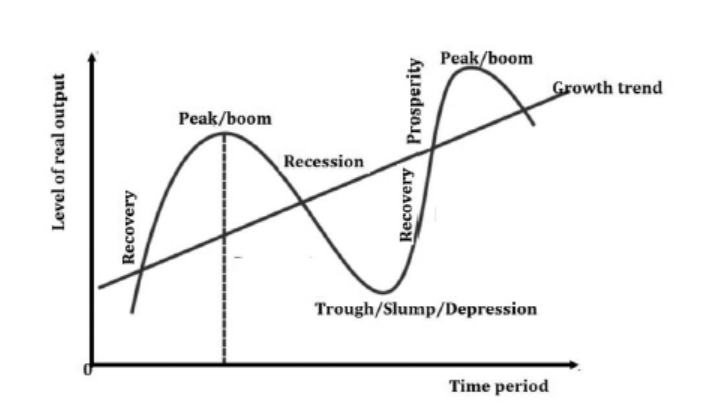
Figure 17: Business cycle
From the figure above, we notice that the phases of a business cycle follow a wave-like pattern over time with regard to GDP (real output), with expansion leading to a peak and then followed by contraction.
APPLICATION ACTIVITY 2.2
1. Why is it important to determine equilibrium level of national income where AD=AS? Graphically explain your argument.
2. Given an economy where consumption function is given by C=25+0.75(Y-T) and taxes are autonomous equaling to 20M frw, government spending is constant (autonomous) and equal to 30M frw, investment spending (autonomous) is 40M frw, and net exports (autonomous) are -5M frw. In this kind of economy, assume there is no inflation and aggregate price level is constant.
a. Calculate the level of equilibrium income
b. Illustrate the graph of consumption function
c. Describe the economy’s trade situation by explaining the value of exports and imports.
d. Suppose that the full employment level of output for this economy is Yfe = 292 million frw. The Minister of Finance and Economic Planning has a goal of keeping prices constant and doesn’t want the economy to be dragged by inflation. As a staff in the ministry of finance and economic planning you are requested to prepare a report on 3 fiscal policies (spending policy, tax policy, and balanced budget policy) to restore the economy to full employment. Prepare that report outlining the three fiscal policies that could be pursued. Show the mathematical analytics behind each of these policies.
3. By use of graph, distinguish between inflationary and deflationary gap.
2.3. National income and standards of living
2.3.1. Meaning of standard of living
ACTIVITY 2.5
Mr Bucyana and Mrs Mutesi are two nationals of Rwanda who earn 30,000 and 100,000 FRW, respectively. However, after compiling statistics by the national institute of statistics of Rwanda (NISR), it is shown that they all earn the same amount 65,000 FRW.
When you compare their average earnings and that of an American, it is very low and hence their standard of living and way of life is still low. From the case study above, respond to the following questions.
1. What economic term is given to the average amount that they both earn?
2. Explain reasons to explain why you think the average income they earn is low.
3. Give reasons to explain why the average income they get is not a good measure of standard of living in:
a. A country over a period of time.
b. Between two countries.
4. What should be based on to determine good or bad conditions of living in a country or between countries.
National income of a given country reflects the way of life of its people during a specified period. The way of life people lives or hope to live is what we call standard of living. The higher the level of national income, the higher the standard of living and vise-versa. Holding other factors constant. The standard of living will depend on the average income of the people in the country at a particular time.
To maintain a given standard of living an individual or region or country has to incur certain expenses in real or nominal terms (cost of living). The key difference between cost of living and standard of living is that cost of living is the cost (expenses) of maintaining a certain level of living in a specific geographical region whereas standard of living is the level of wealth, comfort, material goods and necessities available in a geographical region, typically a country. The cost of living is defined as the cost incurred to maintain a certain level of living in a given geographical location, e.g. a country. It indicates how a country is fairing economically and it changes as time changes.
2.3.2: Factors that determine standard of living in a country:
Standard of living is a composite of different factors that are generally believed to enhance the quality of life of individuals in a population. A number of factors include among others the following.
- Level of Productivity: The total amount of goods and services which a country is able to produce, and hence the standard of living it can provide to its people, depends upon the levels of productivity in different branches of economic activity such as agriculture, industry, transport, etc. The higher the productivity per person engaged in agriculture, industry, etc., the higher will be the national output and the standard of living of the people and vice versa.
- Terms of Trade: The average standard of living in a country depends not only on the physical productivities of its people but also on the prices of goods it exports and the prices of goods it imports (i.e., terms of trade). If the terms of trade are more favorable for a country, it can import comparatively larger amount of goods for a given amount of exports and hence its standard of living will be higher and vice versa.
- Size of Population: Given the total national income or output of a country, the greater the size of its population, the lower will be its average standard of living. It is the per capita income which in fact determines the average standard of living in a country. Relative to its resources, a country which is over-populated i.e. has crossed the optimum size of population, has a poor standard of living than a country with optimum population. This brings down the per capita income which is the most important single factor that determines the standard of living. Thus, a comparatively smaller size of population accompanied with a high level of national income and productivity leads to higher the standard of living and vice versa.
- Distribution of National Income: If there is large inequality in the distribution of income among the population, then the standard of living of a few rich people will be very high, while the standard of living of the masses of the people will be extremely low. Thus, fair income distribution indicates better living standard than unfair income distribution.
- Natural resource endowment: A country endowed with natural resources has its people with high standard of living than a country with low levels of resource endowment. This is because natural resource, once well exploited, i.e. existence and proper exploitation of resources indicate high production and thus standard of living of a country and vice versa.
- Level of Education: Educated people tend to have higher standard of living than the uneducated. You cannot expect a higher living standard from the illiterate and ignorant people because their health care system and social services is poor. Even if the illiterate and uneducated people happen to have large incomes, they would either hoard them or waste or misuse them in useless social ceremonies or by indulging in evil habits such as drinking, gambling, etc.
- General Price Level: The higher the general price levels of goods and services, the lower the standard of living and vice versa. This is because as prices increase, the cost of living also increases. For determining peoples’ standard of living, it is not enough to take into account only their money income, but what the income is capable of buying in terms of goods and services, i.e., their real income is more important for this purpose. That depends largely on the price level, particularly that of the goods and services which enter into peoples’ consumption. Other things being equal, if the price level in country “Y” is higher than in “Z”, the standard of living will be lower in “Y” than in “Z”.
- Real income: Real income is the purchasing power of nominal income. Or its income expressed in terms of goods and services. The higher the real income, the higher the standard of living and vice versa.
- Poverty rate: Poverty is the inability of a person to obtain the basic necessities of live. A country with higher the rates of poverty indicate low standard of living than a country with reduced or no poverty
- Quality and affordability of housing: Housing is one of the basic necessities of life. Better quality and affordable housing imply a high
standard of living and vice versa. Some people in some countries in LDCs don’t have easy access to proper housing facilities which indicates poor living standard.
- Quality and availability of employment: The higher the levels of employment the higher the levels of earnings and standard of living and vice versa. This means that people are able to afford the necessities of life and meet the costs of living thereof.
- Inflation rate: The higher the inflation rates the higher the cost of living and thus low standard of living and vice versa.
- Life expectancy. This refers to the average number of years a human being is expected to live after birth. i.e. it’s the person’s expected life span. A high life expectancy indicates high standard of living and vice versa.
- Incidence of disease: A healthy population indicates high standard of living than a diseased one.
- Economic climate Economic stability promotes better standard of living than an economically unstable economy. For example, where there is low or no levels of unemployment, stable prices and exchange rates etc. people have high incomes and are capable of maintaining their living standards and vice versa.
- Political climate: Politically stable country has its people with high standard of living than a politically unstable. This is because people are denied chance to acquire necessities to maintain their standard of living and freedom of expression and interaction which affects their state of mind.
- Social freedom: In a country that has high social freedom and personal freedom of man be enhanced, respected and promoted by the government, makes people feel happy because they are given comprehensive development in a free society, thus a high standard of living and vice versa.
- Income levels: The number of necessaries, comforts and luxuries which people enjoy are very largely governed by their income. The poor people’s standard must be very low and that of a rich very high. This is because the purchasing power or earning power of the poor people is less than that of the rich.
- Size of the Family: Coupled with people’s income, the size of the family also helps in determining standard of living. In a large family, the family income will be thinly spread over the family and the standard of living will be lowered. Other things being equal, the smaller the size of the family, the higher is likely to be the standard of living and vice versa.
- Family Traditions: People who inherit certain standard of living from their parents will be maintained somehow. Departure from the traditional standard of the family is not easy. One can inherit a better or poor standard of living.
- Social customs and conventions: Peoples’ standard of living, are affected by social customs and conventions since they live in a society and normally follow the norms and practices obtaining in it. Rigid and traditional social customs and conventions hinder improvement in standard of living. While flexible social customs and conventions make ways for better standard of living. Social conventions compel people to spend heavily on their children or even on donations to others children’s marriages, boost their funerals etc. all which are very expensive. Such acts drain peoples’ income and worsen their living standards and vice versa.
- Development levels: The higher the development levels of a country, the higher the living standard of its people and vice versa. E.g. developed agriculture, Trade, industry, transport, banking, infrastructure etc. This is because the country’s output increases as such sectors and activities are developed resulting into a high standard of living.
- Climatic Factor: Living standards of people who depend on out-door activities are largely affected by climatic changes. When climate is favourable for them and their activities, standard of living is high than when the climatic conditions are unfavourable
- Religious freedom. If people are given freedom of worship, their standard of living is higher than where there is no religious freedom. Or Religions which are flexible promote good standard of living than religions which are rigid.
- Level of crime. The higher the level of crime, the lower the level of standard of living and vice versa. This is because crime creates insecurity for people in protection of lives and property, human rights and other things they care. Human cannot live and work with an anxious and restless mood. Therefore, labor productivity, satisfaction and quality of life begin to fall gradually. They are negative impact on living standards.
- Political freedom: this means the non-interference in the sovereignty of each individual by oppressive or aggressive individuals. in a country with political and freedoms, every citizen must have their full rights in the community and their own lives. This involves freedom of press, religion, speech, association, and thought etc. this makes people more comfortable, promotes education, journalism, speech and movement. all which promote high level of standard of living.
- Leisure accessibility: Leisure time shows happiness and stable mind of people. Therefore, people who have access to labour, enjoy a better standard of living than those who don’t.
2.3.3: Per capita income and standard of living.
Per capita income is income received per person in a period.
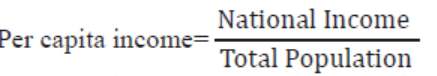
Per capital income is used as an indicator of the standard of living in a country and to compare standard of living between countries because it is available for all countries and it is the most relevant among other available measures.
Calculations of percapita income.
Example:
Given the Rwanda’s population in 2018 as 12,000,0000 and the nominal GDP as 9,000,000,000. We determine the per capita income as:

It is important to note that per capita income is expressed in monetary units and for the case of Rwanda, it is expressed in francs. From the example above, every nationals of Rwanda earns 750 Frw per annum.
Exercise 2.2:
Study the table below showing population and GNP of countries A and B and answer the questions that follow.
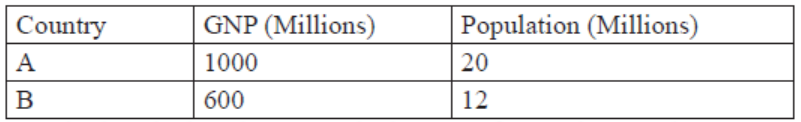
Required: Calculate the per-capita income of countries A and B
2.3.4: Comparisons of per capita income between periods in a
country and between countries.
a. Limitations of using per-capita income figures as a measure of good standard of living in a country for period of time
- Differences in income distribution: Per-capita income does not take into account the distribution of income. It may be high in the current period but when in hands of a few people and many are poor yet in the past it was low but equitably distributed so it may not reflect a good standard of living in the country between the two periods.
- Differences in the patterns of goods produced: Per-capita income does not take into account the pattern of goods produced either capital or consumer goods. It may be high in the current period but when capital goods are produced as compared to consumer goods that yield satisfaction to the consumers unlike in the past where more consumer goods which contribute to human welfare were produced.
- Differences in working conditions: Per-capita income does not consider the working conditions of the people. It may be high in the current period but when the working conditions of the people are poor as compared to the past when working conditions are favourable, so it may not reflect a good standard of living in the present than the past.
- Differences in leisure time enjoyed: Per-capita income does not take into account the amount of leisure. It may be high in the current period but when the people don’t have leisure yet we know that leisure is one of the attributes of good welfare so meaning the standard of living will be low. Unlike in the past where people would enjoy leisure comparatively.
- Differences in monetization of the economy: Per-capita income does not consider the level of subsistence sector. It looks at the monetary terms of the output but the subsistence sector where food is grown for home consumption is not considered yet it is a basis for good welfare in the rural areas. Per capita income may be high today due to more production for market, and less remains home for consumption which reduces people’s welfare, unlike in the past where more was produced for home consumption to improve people’s welfare.
- Differences in price levels: Per-capita income does not consider the level of prices. It may be high in the current period because the prices of goods and services are very high implying that the people cannot afford buying them hence leading to poor standard of living. Whereas in the past, prices of commodities might have been low thus affordable, indicating an improved peoples’ welfare.
- Differences in political climate: Per-capita income does into put into consideration the political climate. It may be high in the present day but when there is political instability in the country meaning that the people are always on the run. This may not show good standard of living unlike in the past though there’s low per capita income, but people were living peacefully.
- Difference in the quality of goods produced: Per-capita income does not consider the quality of goods produced. It may be high in the present day but when the quality of goods produced is low. This means that the quality of life of the people will also be poor, unlike in the past betterquality commodities were considered, a clear indication that peoples’ welfare was better than today.
- Differences in statistical data: Inaccurate statistical data e.g. population figures. It may be high but when the population figures given are inaccurate. This means that the per-capita income figures will not reflect what is actually on ground.
b. Limitations of using per-capita income figures as a measure of good standard of living between two countries in a period of time
Per-capita income can also be used to compare the standard of living between two different countries. The figures got from the different countries are compared and the country with a high per-capita income figure is assumed to be having a high standard of living. However, this is not true in reality as seen below:
- Differences in goods produced: Per capita income does not consider the types of goods produced. It may be high in the country which produces many capital goods which do not improve welfare directly in the short run, where as in another, they produce many or variety of consumer goods which improves welfare directly.
- Leisure enjoyment: It does not take into account leisure which contributes to welfare. Per capita income may be high in a country where people work hard and forego leisure, which may be on top of their scale of preferences than another country which values leisure time.
- Transport differences: Two countries may produce the same quantity and quality of product but may have different figures of per capita income because of the difference in transport costs.
- Per capita income figures do not reflect some factors, which influence the welfare of the people. For example, it may be high in a country where there are wars, accidents, diseases, pollution etc.
- Differences in population figures: In LDC’s, it is likely that population
figures are inaccurate because of inadequate facilities and therefore the
figures for per capita income are unreliable.
- Per capita income may be underestimated in a country where there are omissions in measuring GNP e.g. due to a large fraction of subsistence sector, high non-monetary output etc.
- Differences in boundaries of production: There are people who live on illegal activities like gambling and smuggling, which are not included in national income figures.
- Countries use different concepts and definitions of national income. For example, some countries value subsistence output while other do not, others use GNP at factor cost while others use GNP at market prices, etc.
- Differences in Income distribution: A country may have high-income per capita figures when income is in the hands of few people while the majority of the population is suffering which may not be the case with the other country.
- Price structures: figures of national income may be high because of inflation and this does not mean that people are better off. Also, a commodity may be cheap in one country and expensive in another but generate the same welfare.
- Per capita income may be high in a country where there is unemployment which affects welfare of affected people/household while in another, percapita may be low but the majority are employed.
2.3.5. Factors influencing the increased per capita income
- Levels of education: This allows people to get employed in different sectors of economy, thus increased levels of income and in the end increased per capita income.
- Infrastructure development, such as roads facilitates movement of people and their goods from one place to another. This further increases the level of earnings of the people and as output will be able to reach the market where it is highly demanded.
- Development of entrepreneurship: Entrepreneurship development boosts the business sector and employs more factors of production such as labour.
- Technological development: When the level of technology increases, level of production also increases leading to increased income and thus increase in the levels of per capita income.
- Improved terms of trade: When the country’s revenue from exports is more than that from imports, it means that the country doing well and this will positively affect the per capita income of the country.
2.3.6. Causes of low per capita income in developing countries
- Low levels of education: This makes the people get casual low paying jobs leading to low levels of income and in the end the per capita income will be low.
- Under developed infrastructure especially in the rural areas: This complicates movement of people and their goods from one place to another. This, further limits the level of earnings of the people and some of the output may remain unsold.
- High levels of unemployment: Lack of jobs means that the output in the country will be low leading to a low national income and per capita income figures.
- Low levels of income: Some institutions give people low incomes despite their high contributions to the economy. Some may end up getting subsistence wage that will reflect a low income per person.
- Dependence of agriculture which depends on climate: Agriculture in Rwanda depends on climate and in situations where there is a mismatch between the seasons, the farmers suffer with no output and income leading to low income per person.
- Large subsistence sector: This yields little income since only the incidental surplus is sold. Most of the foods grown here are for home consumption implying that the there are no incomes expected during the production process.
- Unbalanced development: Some areas are highly developed with many economic activities while others are lagging behind in terms of development. The least developed areas yield low productivity and the general national income will be affected, leading to a low per capita income.
- Lack of capital to invest in businesses: There is still lack of enough capital to invest in production activities. This is evidenced by the low level of manufacturing industries. This leads to low productivity, low national income and finally low per capita income.
- Low prices of agriculture products: This accompanied by high rates of price fluctuation and little earnings from the agricultural sector, leading to low national income and hence low income per person.
APPLICATION ACTIVITY 2.3
“The per capita income of USA is almost ten times than that of Rwanda, meaning that the level of well being of Americans is far better than that of people in Rwanda”. With examples, examine the relevancy of the statement.
2.4. Income inequalities
Using the photographs a, b, c and d: in the figure beow
1. Describe the photographs provided.
2. What term is given to the differences in the appearances in the
photographs below? What causes it?
3. Explain the advantages and disadvantages of some people or
areas being richer than others.
4. Suggest what can be done by the government of Rwanda to ensure that all the people and regions are equally the same in terms of resources.
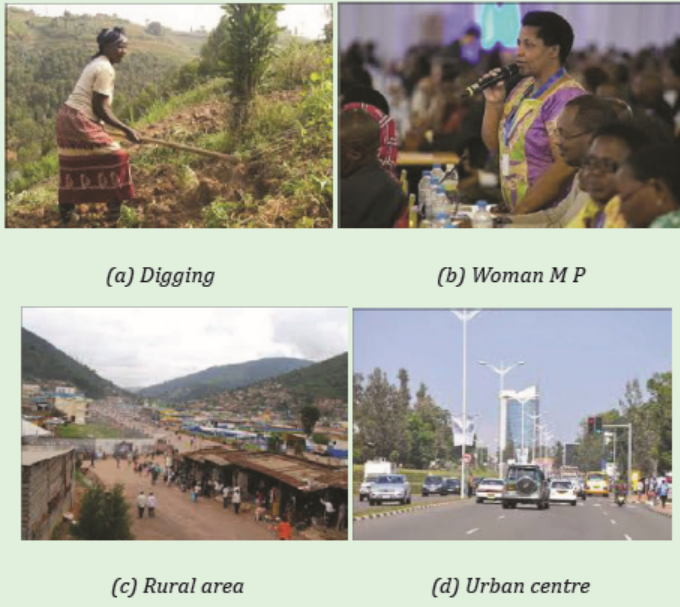
Figure18: Income distribution
2.4.1. Meaning of income inequality
Income distribution refers to the way income is spread among various social groups in an economy. It may be between different people in the same region or in another region or it may be how resources are distributed in different regions.
Inequality means an instance of being unequal which may imply difference in size, degree or circumstances, among others. In economics though, inequality is always talked of in terms following forms or types:
Types of inequality
1. Personal inequality: refers to the economic difference between the very poor and the rich people in society.
2. Regional inequality: refers to a situation where there is a difference in terms of resource endowments, developments through infrastructure such as roads and industries, among others. These make one region appear different and more developed than others.
3. National inequality: This is where some countries are richer than others in terms of resources and development.
4. Sector inequality: This where some sectors are richer and developed compared to other sectors e.g. Industrial sector being more developed than agriculture sector.
5. Occupational inequality: This where some occupations are more advanced in terms of technology used and payments etc. than other occupations.
2.4.2. Causes to income inequality
Income inequalities may be among different social groups or even among people in the same social group. Income inequality is caused by historical, geographical, social, economic and political factors as explained below:
- Differences in distribution of resources, for instance, people who have access to fertile land are likely to get more income than those who live on marginal land, for example pastoralists.
- Differences in social and economic infrastructure such as roads to ease the transportation of goods and services from one area to another.
- Government policies such as a regressive tax which taxes the poor more than the rich causes income differences.
- Historical factors for example one can get much income because of inheriting property from rich parents. In rural areas, most people become rich because of inheriting land.
- Differences in natural abilities, for example, when one is physically handicapped, he/she is likely to have less income than one who is physically well.
- Differences in employment, i.e. some jobs bring in more money than others, hence income inequality.
- Differences in education levels: Educated people have higher chances of being employed and earning higher salaries than the illiterate.
- Uneven distribution of investment opportunities: Most of the investments are done in the urban centers and others are neglected, hence leading to regional inequalities.
- Difference in sex: Females are generally poorer than males because of limited access to income-generating properties such as land and credit.
Lorenz curve
The Lorenz curve is a graphical representation of the distribution of income or wealth in an economy. It was developed by Otto Max Lorenz in 1905 to represent the inequality of wealth distribution.
- It is based on two pieces of information, income and population.
- To draw it, information is required on both (income and population) and then formed into two variables that reflect the cumulative value of income and the population.
- On the horizontal axis we sort the cumulative population in the ascending order of income, with the lowest income first followed by the second lowest and so on. Hence the first 20% of the population will necessarily be the poorest 20% of the entire population.
- It looks at the line of perfect equality where there it is assumed to be income equality and as we move away from the line, the gap between the rich and the poor also increases.
Figure 19: Lorenz Curve
From Figure above, the further away the Lorenz curve from the line of perfect equality, the more the income inequality. And the nearer the Lorenz curve to from the line of perfect equality, the less the income inequality.
Gini coefficient
This is also known as the Gini index or the Gini ratio and it is the measure of statistical dispersion intended to represent the income distribution of a nation’s residents. The Gini coefficient is a number between 0 and 1 where 0 corresponds to perfect equality (where everyone has the same income) and 1 corresponds to perfect inequality (where one person has all the income and everyone else has zero income).
2.4.3. Effects of income inequalities
Positive effects
- Income is in hands of few people who can invest it and produce commodities for other people and the society at large.
- It encourages the poor to work hard so as to survive in the ever changing economy.
- It encourages savings among the rich which can be used for further investments, employment creation and production of goods and services.
- The rich can invest in research and innovations and improve technologies and this can help to speed up production and economic growth.
- The few rich employ the poor through investments in industries and factories, hence improving their standard of living.
- More tax revenue is realised by taxing the rich and this can lead to increase in national income through progressive taxation.
- The poor take up low category jobs such as cleaners, mortuary attendants etc. which would have nobody to take them up if all people were in the same average class.
- The rich invest in assets, which increase the wealth of the country.
- Foreign exchange is earned by rich export firms. This, through export promotion industries, can lead to increase in the foreign exchange earnings and reduce the balance of payment problems of a country.
Negative effects
- There is minimum economic welfare of some group of people because of absolute poverty, i.e. inability to purchase basic needs.
- Reduction in aggregate demand: The rich have a lower marginal propensity to consume than the poor. The poor people are left with little money to purchase commodities. The reduction in aggregate demand discourages investment.
- Misallocation of resources: The very rich people spend on luxuries, leaving the poor to go without basic needs.
- Capital outflow especially when the very rich are non-citizens who always repatriate their earnings to their home countries – In countries which are politically unstable, rich people prefer to invest/ bank their money in other countries where there is political stability.
- It leads to a reduction in government revenue since the majority of the people would be having little or no incomes to tax.
- It leads to social disharmony whereby the poor feel neglected and not catered for which results into political instability.
- It leads to failure of government programs when the majority have no adequate means to participate in development activities.
- Regional imbalances come up because the regions with resources develop at the expense of others without resources.
2.4.4: Solutions to income inequality in Rwanda
- Education reforms have been undertaken. This has helped many people to access education so that they can be prepared to get jobs
- Land tenure reforms: This is through land redistribution policies and making it accessible to all people in society so that they can be able to carry out agriculture.
- Kick-start funds such as the “one cow per family” have helped people to access cows that can be used as a source of income through selling the milk.
- Progressive taxation: This has reduced the gap between the rich and the poor people since the revenues collected are used to subsidise the poor.
- Improving infrastructure such as roads which helps in the movement of people and goods from areas of production to markets helps people to increase their earnings.
- Liberalisation of the economy: This has helped people to participate in economic activities and trade, hence increasing their incomes and standards of living.
- Controlling population growth: This has helped to reduce the ratio of resources to the population and also dependence burden among the families.
- Modernising agriculture: This has helped reduce the level of poverty in rural areas where the activity is fully based. The people are able to increase the quality and quantity of their products, hence receiving more incomes.
- Improvement of the investment climate: This has been through giving tax holidays and free land such as the free investment zone in Masoro. This has attracted more investors, hence creating employment opportunities.
- Improvement of the political climate: This has created good environment for production whereby the people are not scared of carrying out any activity.
- Encouraging development of small-scale enterprises: These have also created more employment for the people in Rwanda, hence improving their standard of living.
- Formation of co-operatives: This has been the basis for reducing income inequalities among the people. These cooperatives such as Saccos, for example, umurenge sacco, umwarimu sacco, producer co-operatives, among others, have encouraged micro savings and given small loans to the local people.
APPLICATION ACTIVITY 2.4
1. Visit your sector and collect data on population and income earned by different groups, use the data to plot Lorenz curve.
2. Assume you are among the policy makers in the country, which policy measures can you put in place to reduce income inequality
END UNIT ASSESSMENT
1. Examine why the government of Rwanda undertakes compilation of annual gross domestic product.
a. Analyse the measures that the government of Rwanda can undertake to improve the level of gross domestic product.
b. Given that the per-capita income of an average Kenyan is three times greater than that of an average Rwandan, does it necessarily mean that an average Kenyan is better off than an average Rwandan?
2. Why are the figures not a good measure for standard of living in the country?
3. Explain how the construction of good roads may help to increase national income of Rwanda.
UNIT 3 PRICE INDICES
Key unit Competency: Analyze the effects of price changes in an economy over time.
INTRODUCTORY ACTIVITY
Study the photographs shown below.
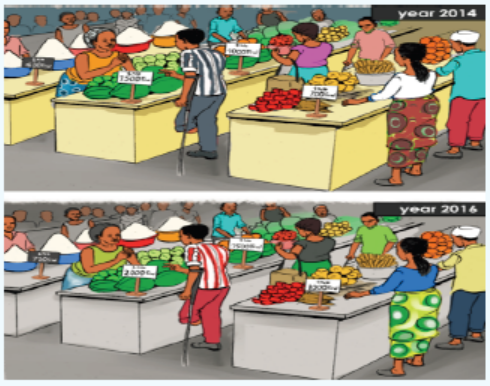
The general prices of fruits, vegetables and other commodities in Rwandan markets in 2014 were not the same as they were in 2016. There has been a tremendous change overtime.
1. Using photographs above determine the prices of the commodities in 2014 and those of the 2016.
2. How do we call the change in prices of commodities from one year to another?
3. Relate the prices of the year 2014 to those of 2016.
4. Calculate the price changes from 2014 to 2016.
5. How would you interpret such changes in prices from 2014 to 2016?
3.1. Meaning and types of price indices
ACTIVITY 3.1
Carry out research and discuss the following terms:
i. Price index
ii. Consumer price index (CPI)
iii. Producer price index(PPI)
iv. Gross Domestic Product deflator ( GDP deflator)
v. Retail price index (RPI)
Price index can be defined as the measure of average percentage change in price, from one period to another. i.e. from a base year to current year. It can also be defined as the measure of the variation in the prices of a given class of goods and services over a period of time in a given region. It shows average changes in price over a period of time i.e. from a base year to a current year.
Types of price indices
The following are some of the price indices
1. Consumer price index (CPI); This measures the changes in the price level of a basket of consumer goods and services bought by households. The National Institute of Statistics of Rwanda (NISR) collects the CPI price information and calculates the CPI statistics for Rwanda on a monthly basis
2. Producer price index (PPI); this measures the average changes in the prices received by domestic producers for their output.
3. Gross Domestic Product deflator (GDP deflator); it is sometimes referred to as implicit price deflator. It is a measure of the level of prices of all new, domestically produced final goods and services in an economy. It can be measured by;
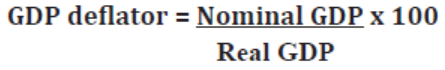
4. Retail price index (RPI); this is the measure of the variation of consumer prices or consumer retail goods and services over a period of time. RPI is computed on a monthly basis but an annual rate is also published which serves as a yard stick for adjusting salaries and wages, tax allowances and pensions among others.
APPLICATION ACTIVITY 3.1
Using the knowledge of price index, describe how the government of Rwanda measures prices for a basket of goods
3.2. Steps of compiling price index figures.
ACTIVITY 3.2
Carry out a research and determine the following:
1. Basket of commodities
2. Price relative
3. Weighted index
4. Weighted cost of living index
5. Procedures of compiling price indices for various commodities of a given country.
- Selecting the base year: This is the year when prices were relatively stable and it is equated to 100% so as to show the change in the prices. It should not be in a remote period or past because methods of data collections, definitions, scope and coverage, market conditions, peoples’ expenditure etc. change over time.
- Selecting the basket of commodities. This is a basket which represents commodities that were wholly consumed by the people in a country during a period of time.
- Collecting information about the basket of commodities i.e. on quantities and prices of goods consumed.
- Calculating the simple price index/ price relative. This measures the percentage change in prices of one commodity from one year to another ie. From base year to current year. This is calculated by:
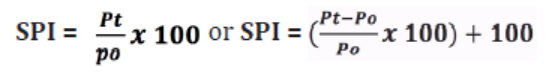
Where Pt = current year price
Po = base year price.
If the price relative or simple price index is greater than 100%, it means that there has been a rise in the price of that commodity. If the price relative or simple price index is equal to 100%, it means that there has been no change in the price of that commodity. If the price relative or simple price index is less than 100%, it means that there has been a fall in the price of that commodity.
NB: Price relatives have no units.
Attaching weights. Weights are attached to show the relative value of the goods. The commodity with the biggest weight has more value than the one with a small weight. This is done by.
Weighted index = SPI x Weights.
- Calculating the simple cost of living index/ average simple index / average price relatives:
This measures the relative changes in money value (inflation / deflation). This is done to measure the changes in standard of living of citizens over time based on the cost of living. If the simple cost of living index is above 100%, it shows there is inflation and a fall in money value by that percentage exceeding 100, which indicates an increase in cost of living and fall in standard of living by the same percentage from the base year to the current year. On the other hand, if the simple cost of living index is less than 100%, it shows there is a deflation and an increase in money value by that percentage less to 100, which indicates a fall in cost of living and an increase in standard of living by the same percentage from the base year to the current year.

Calculating the weighted cost of living index/ average weighted index.
- This measures the changes in the general price level in an economy. i.e. whether there is inflation or deflation. If the weighted cost of living index is above 100%, it shows there is inflation which indicates an increase in cost of living and fall in standard of living by the percentage over 100% from the base year to the current year. On the other hand, if the weighted
cost of living index is less than 100%, it shows there is a deflation which indicates a fall in cost of living and an increase in standard of living by the same percentage less to 100% from the base year to the current year.
This is done by
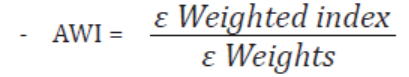
Interpreting the findings to determine whether there was an increase or a decrease in the prices of the consumer basket during a given period of time
3.3. Computation of price indices
Example
Study the table below and answer the questions that follow:
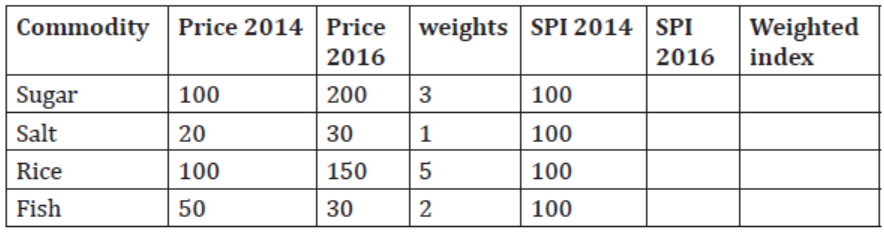
Calculate
i. The Simple Price Index for 2016
ii. Weighted index
iii. Simple cost of living index for 2016
iv. Average weighted index for 2016
N.B. Interpret your findings
i. The Simple price index(SPI) can be calculated in the following steps
Step one
Calculate the SPI for each commodity for each year
Sugar
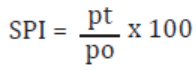
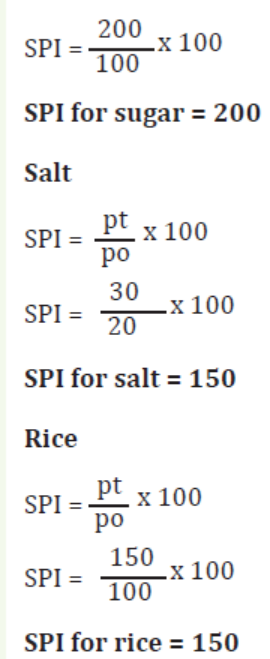
Fish
SPI for fish is = 60.
Interpretation
This indicates that there is an increase in price of sugar, rice and salt by 100%, 50% and 50% respectively. While there was a fall in price of fish by 40%
ii. Attach weights for the different commodities by;
Weighted index (WI) = SPI x weights
Sugar
WI= 200x 3= 600
Salt
WI= 150x 1= 150
Rice
WI= 150x 5= 750
Fish
WI= 60x 2= 120
iii. Calculating the simple cost of living index/ average price relatives
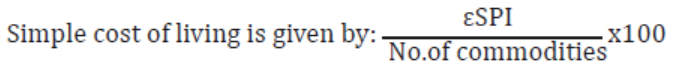
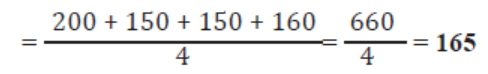
Interpretation:
There was an increase in the general price level prices of goods and services by 40% and fall in money value by the same percentage. This indicates that there was an increase in the cost of living and fall in standard of living by 40% from the base year to the current year.
iv. Calculating the weighted cost of living index/ average weighted index
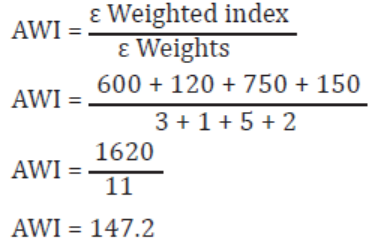
Interpretation:
There was inflation by 47.2%. This indicates that there was an increase in the cost of living and fall in standard of living by 47.2% from the base year to the current year.
APPLICATION ACTIVITY 3.2
Price Index figures are useful means used by Rwanda to compare and contrast information in different periods and facilitate in taking development policies.
1. Explain how price index figures compiled in various periods are related to the cost of living and standard of living of the Rwandan population.
2. Explain how the government of Rwanda uses the knowledge of Price indices to create employment in the country.
3.4. Uses of price indices.
ACTIVITY 3.3
The consumer price index (CPI) is used to measure the average change in prices of commodities which consumers pay for the basket of goods and services. For what reasons are the change in price information useful to Rwanda’s situation?
- Measuring changes in the value of money. When the general price level increases, the real value of money (commodities which a unit of money can buy) reduces. When the general price level reduces the real value of money increases.
- It is the measure of the rate of inflation which is the difference between relative price changes of 2 years. When the price increases, it means there is inflation. When the price reduces, it means there is a deflation.
- Wage determination and change i.e. wage changes should match with changes in the general price level to avoid a decline in the standard of living of workers when there is inflation and this can be done basing on the price index figures.
- The price index can be compiled for different regions and towns so as to determine allowances, wages, taxes etc which should match with inflation.
- Comparison purposes. The price Index can be used to compare the standard of living between countries at a point of time, and in one country over time.
- The producers’ price index for inputs is used to measure the variations of input prices. This helps policy makers when designing policies to influence input prices.
- The price index helps the government in pricing contracts and awarding tenders e.g. for construction, input price variation is important when determining total costs to fix and to revise contract values.
- The central bank uses price indices to design policies which can stabilize prices.
- The price index for different regions in the country helps manufactures to locate sources of cheaper inputs and areas with higher output prices where to sell commodities.
- Price indexes help the government to trace the cause of scarcity of inputs which are reflected in their prices e.g. the drought can be the cause of increase of agricultural raw materials
APPLICATION ACTIVITY 3.3
Discuss how the government uses the knowledge of price indices in wage determination.
3.5. Problems encountered in compiling price index figures.
ACTIVITY 3.4
1. Apart from selecting the base year, discuss other difficulties Rwanda faces in compiling price index.
2. Explain how the technological advancement affects the price index figures.
- There are different ways and formula of compiling index numbers. The values calculated may differ by the method used and this makes comparison difficult.
- Choosing the base year. Because of inflation, it is difficult to get the year when prices were stable.
- It is hard to include all commodities in the index. Representative commodities may not show the cost of living of same groups of people though attempts are usually made to include in as many commodities as possible.
- Because of changes in tastes and preferences, weights (relative importance that people attach to commodities) change over time and therefore there is need to compile new index numbers over time.
- Weights always change because of new discoveries, innovations and changes in consumption patterns meaning that the importance or the value of the commodity may vary in the same year
- The change in the general price level may be due to change in quality of products. This may be misinterpreted to be inflation.
- Differences in income e.g. the rich and the poor consumer different commodities. Therefore, one index cannot reflect the change in cost of living of all income groups.
- The introduction of new commodities and the changes in the tastes and preferences also lead to shift to other commodities hence a problem when comparing the prices in the different years.
APPLICATION ACTIVITY 3.4
Assuming you are employed as a Statistician by National Institute of Statistics for Rwanda (NISR).Describe the limitations you will face in gathering data of various baskets of goods.
END UNIT ASSESSMENT
1. Discuss how the concept of GDP deflator is directly related to the general welfare of people of a given country.
2. Explain how inflation and deflation are determined under price index computation.
3. Discuss why commodities that make up the basket of goods do not always yield identical weights.
4. Study the table below and answer the questions below it.
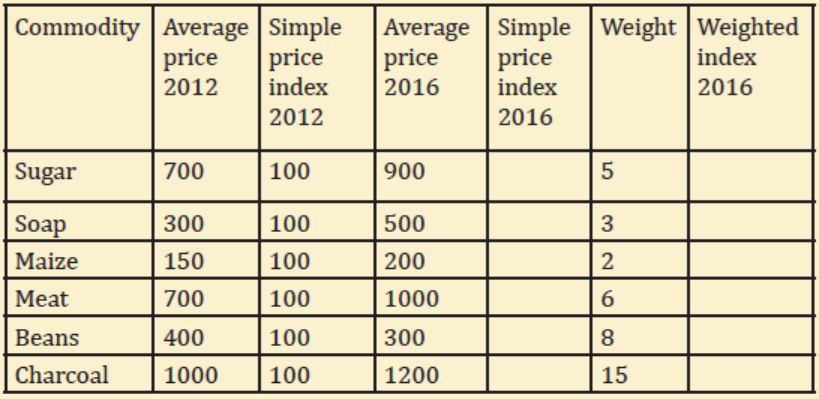
Calculate:
i. Simple price index for 2016
ii. Weighted index for 2016
iii. Simple cost of living index for 2016
iv. Weighted cost of living index for 2016
v. Interpret the finding to determine whether there is an increase or a
decrease in the prices of consumer basket of goods and why.
UNIT 4 CONSUMPTION, SAVING, INVESTMENT AND MULTIPLIERS.
Key Unit Competency: Evaluate the impact of consumption, saving and investment on national income.
INTRODUCTORY ACTIVITY
Mr. Kayumba a resident of Matimba, Nyagatare district earns a monthly income of rwf 100 000 from his mentorship activity.
He decides to use rwf 70 000 per month on buying goods and services such as beans, rice, cassava, sugar, Salt, vegetables, pay for electricity and water bills. The remaining money is reserved for starting a poultry business at the end of the year when money has accumulated.
1. Explain economically the usage of Mr Kayumba’s income.
2. Apart from Mr. Kayumba’s income level, what other factors will
influence the decision to buy those goods and services?
3. If he buys an incubator for his poultry business, what economic term can you use to refer to that act?
4. Describe the act of keeping the part of Mr Kayumba’s income for starting a poultry business in future?
5. What could be the factors that may influence Kayumba’s decision to keep his money for future use?
6. What name is given to the part of Kayumba’s income that he:
i. Uses for buying goods to satisfy his needs?
ii. Keeps for starting his future poultry keeping?
4.1. Meaning of consumption
ACTIVITY 4.1
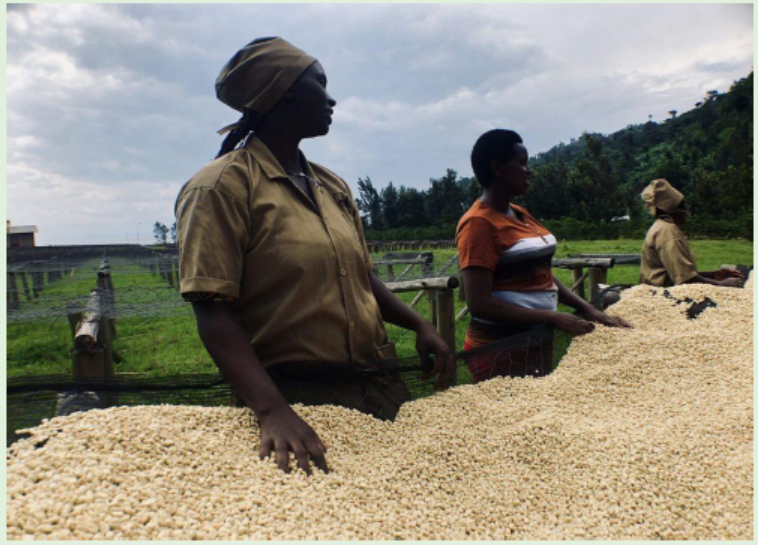
Source: https: // www.google .com / search?q= images+of+consumption +in+ Rwanda
&oq = images++of+ consumption+in+ Rwanda&aqs=chrome. .69i57.56574j1j8 & sourceid =chrome&ie=UTF-8
Jeanne and her friends are all coffee growers. In August 2019 they earned a disposable income of rwf 600 000. They decided to keep rwf 300 000 for their future use and shared the remaining amount for spending in their homes to buy goods and services they want. In the following month, they earned nothing, but never stopped from spending money in buying goods and services.
i. Explain the process of spending money to buy goods and services to use in the current period?
ii. How much money did Jeanne and her friends share for spending at home?
iii. What factors may affect Jeanne and her friends’ spending decision?
iv. If Jeanne and her friends did not receive any income in the following month and never stopped spending money, what economic name is given to that phenomenon?
4.1.1 Meaning of consumption
Consumption means using up of economic resources so that they are not available in future. From the individual point of view, consumption refers to the expenditure on the purchase of goods for final use by the consumer. Or, it is the act of using goods and services to satisfy human wants. It takes that part of income which is not saved.
Consumption = Disposable income – savings
When consuming, people spend, thus consumption is expenditure (amount of money that individuals or groups of individuals spend on consumer goods). This income in consumption expenditure multiplies itself to give a final change in investment thus increased GDP of the country.
Consumption can either lead to advantages to the individuals and the society as a whole thus consumption economies or it can lead to costs or disadvantages due to unpopular consumption habits by an individual to the individual himself or herself and the society as a whole thus consumption diseconomies.
Consumption function
Consumption function is the relationship between current consumption and all
the factors that influence consumer spending. Using the functional notation, we
can express the consumption function as C= F (yd., w, cr, r, dg, ex, ygf) where;
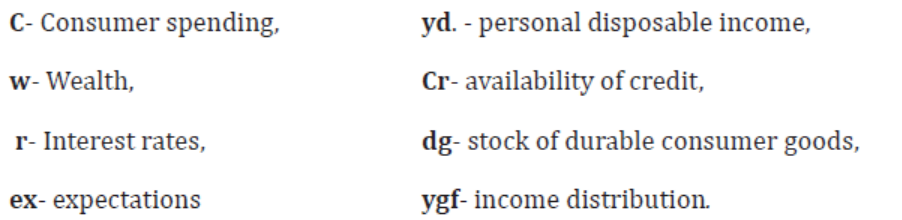
Consumption depends on many factors, thus, a change in any of these factors changes total consumption expenditure. However, it should be noted that consumption largely depends on income. Thus, consumption function can as well be defined as the relationship between the level of consumption and national income. I.e. C = C0+ bYd, where;
C is consumption and the dependent variable C0 is the consumption at zero
income or autonomous consumption;
b is the marginal propensity to consume (MPC);
Yd. is the disposable income which is an independent variable.
When a household’s income is zero, it will still consume some minimal amount (via begging, borrowing, or drawing down savings). This level of consumption expenditure is known as autonomous or dissaving because it persists even when there is no income. The higher a household’s income, the more it will want to consume. This part of consumption which depends upon income is induced. It varies with disposable income.
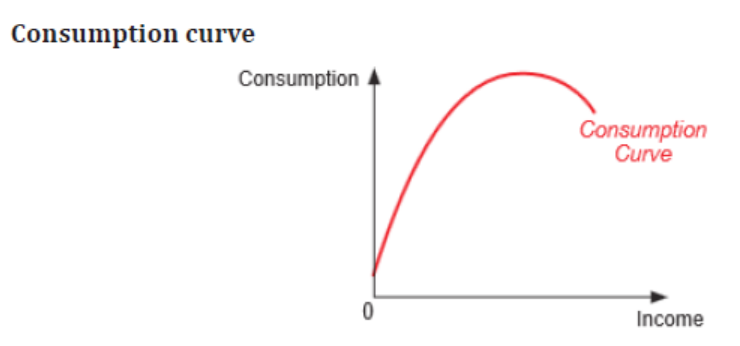
From the above figure, as income rises, Marginal Propensity to Consume (MPC) declines. Rich individuals have a low MPC. This means that as their income increases, they consume a small proportion of the additional income. A straightline consumption curve implies that as income rises, MPC is constant. It means that as income increases, one consumes a constant amount of the additional income. Nevertheless, this is not realistic.
According to Keynes, consumption largely depends on income. This is expressed as,
C= f
where; C= Consumption
f =function
y = income
This indicates that the higher the income, the higher the consumption and vice versa.
According to classical economists, consumption largely depends on interest rate i.e, the higher the interest rate, the lower the consumption and the lower the interest rate, the higher the consumption. This is expressed as:
C= f(i) where: C= consumption
f= function
i = interest rate.
4.1.2 Factors influencing the level of consumption
ACTIVITY 4.2
Carry out research and discuss the determinants of consumption in an economy.
- General Price level: The higher the price, the lower the demand and consumption and the lower the price the higher the demand and consumption.
- Liquidity preference. The higher the liquidity preference than investing money, the higher the consumption and the lower the liquidity preference, the lower the consumption.
- Disposable income: The higher the disposable income, the higher the consumption and the lower the disposable income the lower the consumption.
- Population size: The bigger the population size the higher the consumption and the smaller the population the lower the consumption
- Nature of income distribution: When income is fairly distributed among the people, consumption will be higher than when income is in hands of the few.
- Availability of goods and services: When goods and services are available, consumption will be high than when goods are not in plenty.
- Degree of speculation: When people expect prices to go down in future, consumption will be low at present but if prices are expected to be high in future, consumption will be high at present.
- Government policy of taxation: If the government over taxes the people, they will be left with little income hence low consumption, but when there are low taxes, income will be high and consumption.
- Availability of credit facilities: Consumption will be high if there are credit and hire purchase facilities but it will be low when they can’t be accessed.
- Marginal propensity to consume: The higher the marginal propensity to consume, the higher the consumption and the lower the MPC, the lower the consumption
- Savings level: When people’s savings are high, their consumption is low compared to when saving is low.
- Rate of interest: If the rate of interest on borrowed money/loans is high, people will be discouraged from borrowing thus leading to low levels of consumption. But if interest rate on borrowed money or loans is low, holding other factors constant, people are encouraged to borrow leading to high consumption levels. On the other hand, if interest rate on saved money is high, people are encouraged to save thus reducing consumption levels in the country and reverse is true.
- Wage levels: An increase in wage levels in the country leads to high consumption and vice versa.
- Investment levels: High investment levels indicate that little income is reserved for consumption thus low consumption levels since much of the income is put aside for future use (saving) and investment and vice versa
- Human desires: If most people desire to consume today than tomorrow, consumption levels are high in the present but if they desire to consume tomorrow than today, consumption levels are low in the country at present.
- Income levels: When people’s incomes are high, ceteris peribus, their consumption will be high and vice versa.
4.1.3 Average propensity to consume (APC) and Marginal propensity to consume.
ACTIVITY 4.3
Use the table below to answer the following questions:
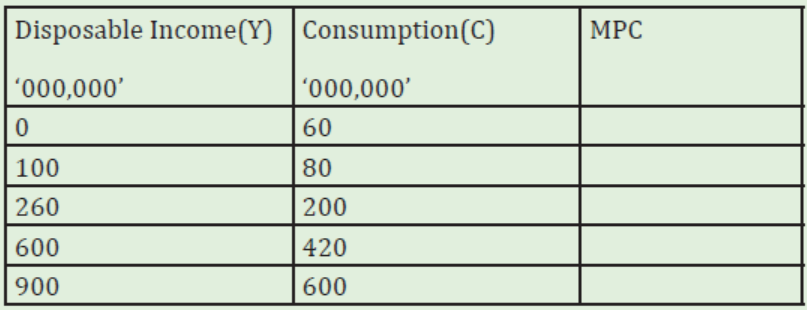
1. Using the formulae given, fill in the table with MPC. MPC = ΔC/ ΔY
2. Illustrate the information on the graph.
3. Calculate APC. Where, APC = C/Y
4. At zero (0) income, consumption is 60,000,000. In you own view, where did it come from? What term can you use to refer to such kind of consumption?
Average Propensity to Consume (APC); this refers to the ratio of total
consumption to the level of disposable income. APC=C/Y. The average
propensity to consume declines as income increases. This is because as income
increases, more is saved than consumed.
Marginal propensity to consume (MPC); this refers to the fraction of an
individual’s additional income that is spent on consumption
MPC= ΔC/ΔY
As the income rises, MPC falls; rich people tend to consume a smaller proportion
than the poor people. Normally MPC is less than 1. It can be equal to one only
when all the additional income is consumed.
4.1.4. Measures to raise APC and MPC
- Advertisement and propaganda which help to make the consumers familiar with the use of the products and attracts them to consume more.
- Development of infrastructure e.g. from producing centers to different parts of the country which encourages and enlarges markets for the product and this reduces prices due to reduced costs of transport thus encouraging consumption
- Urbanization which increases people’s consumption because of changes in conditions that attracts them to new articles and because of demonstration effect.
- Increase wages leading to increased incomes which leads to increased purchasing power.
- Increase government expenditure like giving unemployment benefits/
allowances, old age pension etc. which help reduce uncertainties.
- Offering cheap and easy credit facilities, thus as people are availed with loans, their consumption increases.
- Income redistribution policies i.e. this tends to increase consumption among the poor e.g. subsidizing them through taxing the rich highly
- Ensuring peace and security in all parts of the country to ensure efficient earning of income to encourage consumption.
APPLICATION ACTIVITY 4.1
Study the table showing non-food consumption.
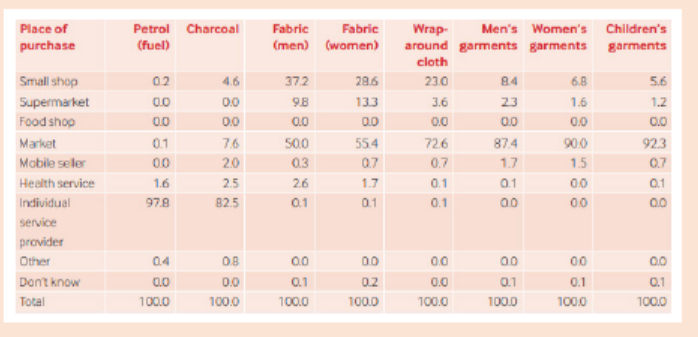
file:///C:/Users/Teacher/Downloads/EICV3_ThematicReport_Patterns%20of%20 Consumption.pdf
1. What are the predominant places of Fabric (men) and children’s garments purchases in the table?
2. Which places sell the most quantity of petrol (fuel).
3. Which place sells nearly all commodities.
4. Apart from non-food items provided in the table, list other nonfood items that people need on daily basis.
4.2. Saving
ACTIVITY 4.4
Dushimemungu is a greengrocer of Musanze market. She is well known for fresh vegetables and fruits. Every day she keeps rwf 1000 in the nearby Umurenge sacco from where she expects to get a loan to expand her business and also avoiding unnecessary spending.
1. Explain the process of keeping money to be used in the future time?
2. Why should Dushimemungu decide to keep her money in the nearby Umurenge SACCO?
3. Why did Dushimemungu find it safer to keep her money in Umurenge SACCO not her home?
4. In your own view what do you think is the relationship between the level of saving and income of individuals?
5. What are the factors that influence the level of saving in the country?
4.2.1 Meaning of saving
Savings refers to the proportion of disposable income which is kept for future use. The total income of an individual is a summation of his or her consumption and the savings. What remains after consumption of the goods and services that is kept for future use is what is known as savings. It takes forms of personal savings, cooperative savings, and compulsory savings like RSSB, mituelle among others.
Savings Function
The savings Function shows the relationship between the level of saving and the factors that affect saving. Mathematically this can be expressed as,
S= f (Co, Gp, y, px, ps, i, fi…… etc.)
Where S= saving
f= function
Co =consumption levels
Gp = government policy on saving
y =income levels
ps: political situation
i=interest rate
fi= financial institutions
However according to Lord Keynes, saving function is the relationship between saving and the level of income. S=f
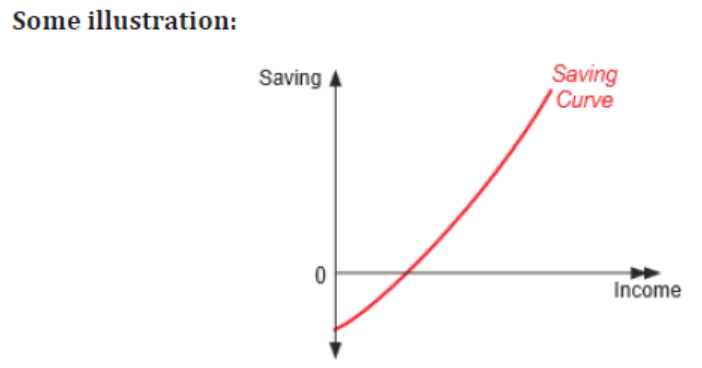
The figure above shows the savings curve. As income rises, Marginal Propensity to Save (MPS) increases. Rich individuals have a high MPS. This means that as their incomes increase, they save a bigger proportion of their additional income.
4.2.2 Factors influencing the level of savings
- Level of income. The higher the level of income, the higher the savings and the lower the level of incomes, the lower the savings.
- General Price level. The higher the general price level, the lower the savings and the lower the price level, the higher the saving
- Level of interest rates offered by banks. The higher the interest rate offered by banks on deposits, the higher the savings and the lower the rates, the lower the savings
- Level of development of financial institutions. If many financial institutions are set up, savings will be high than when financial institutions are undeveloped.
- Political situation. Political stability encourages production, capital accumulation and savings but political instability discourages savings
- Marginal propensity to save. The higher the marginal propensity to save, the higher the savings and the lower the MPS, the lower the savings.
- Existing stock of capital. The bigger the stock, the more the output and savings and the smaller the capital stock, the lower the savings
- MPC. The higher the MPC, the lower the saving and the lower the MPC, the higher the savings
- Spending habits. The higher the spending habits, the lower the savings and the lower the spending habits, the higher the savings
- Level of wages. The higher the level of wages, the higher the savings and the lower the level of wages, the lower the savings.
- Disposable income: The higher the level of disposable income, the higher he savings and the lower the level of disposable incomes, the lower the savings.
- Government policy on savings: if government encourages savings, savings level will be high and vice versa.
- Family size: if there is a big family size, much money will be spent on consumption than saving thus low levels of savings than a small sized family.
4.2.3 Average propensity to save (APS) and marginal propensity to save (MPS)
ACTIVITY 4.5
1. Research and differentiate between average propensity to Save and marginal propensity to save.
2. Given that APC + APS = 1 and MPC + MPS = 1, answer the questions that follow.
a. Given APC as 0.24, what is the value of APS?
b. Given APS as 0.77, what is the value of APC?
c. The MPC in the country is 0.4, estimate the MPS.
d. MPS is 60%, find the value of MPC.
Average Propensity to Save (APS) refers to the ratio of saving to the level of disposable income. The APS increases as the income of the individuals increase.
Average propensity to save (APS) = S/Y
Marginal propensity to save (MPS). This refers to the fraction of an individual’s additional income that is spent on savings.
Marginal propensity to save (MPS) = ΔS/ΔY
Relationship between MPC and MPS
MPC+ MPS=1
Y= C+S
ΔY= ΔC+ΔS
Divide both sides by ΔY
ΔY/ΔY= ΔC/ΔY+ΔS /ΔY
1=MPC+MPS.
APPLICATION ACTIVITY 4.2
Study the photography shown below.

Students of EFOTEC earn income from their businesses and keep a record of their income using a cashbook. This enables them to own money, count it, make transactions, recognize the money value and make financial decisions on expenditures.
1. Analyze the photograph and describe the activities done by those people
2. Explain why saving is important tool of managing finance.
3. What message is portrayed from the statement above?
4. Share with your class how you can manage your money once earned.
5. Why is it necessary for young people like you, need to carry out saving?
6. Discuss the relationship between saving and consumption.
7. Why do you think most entrepreneurs postpone consumption in the future time than in the present?
4.3. Investment
ACTIVITY 4.6
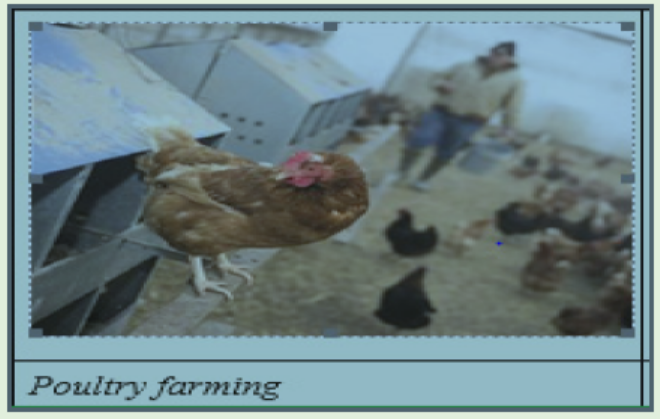
Murerwa is a young entrepreneur in Musanze district. From her money she had saved from Umurenge SACCO equaling to Rwandan francs 500000, she decided to withdraw part and use it to purchase an incubator for her poultry keeping business to supplement her other agriculture income.
Respond to the questions
1. Apart from poultry keeping, what are the other profitable activities that are in your environment?
2. Why did Murerwa decide to withdraw her money from Umurenge SACCO to start poultry keeping?
3. What name is given to purchasing capital goods like incubator with the aim of making profits?
4.3.1 Meaning and types of investment
Investment can be defined as the expenditure on capital goods with an aim of increasing production. or this is the addition to the stock of capital. It also refers to the purchase of capital goods or putting into use capital to produce capital. Investment involves the purchase of an asset or undertaking a financial
commitment which involves initial sacrifice that can later generate benefits. Investment can be taken up by the government or individual or companies.
Classification of investment
1. Fixed income investment. This involves investments in assets such as bonds, fixed deposits and preference shares among others.
2. Variable income investments. This involves investments such as business ownership or property ownership. It should be noted also that expenditure on education and health is recognized as an investment in human capital
Types of investment:
1. Autonomous investment: this is the investment that is independent of the level of income. It is income inelastic. It is influenced by exogenous factors like wars, weather changes, population growth, quality and size of labour force etc.
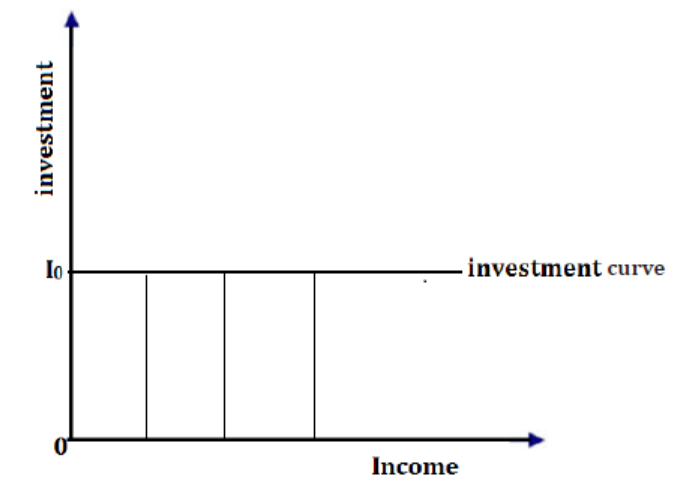
2. Induced investment: This is the type of investment that varies with the level of income and profits. There are factors like wages and interest rate which affect profits, and so influence the individual’s investment. When incomes increase, consumption demand increases and to meet this, investments increase. It thus follows that induced investment is a function of income.
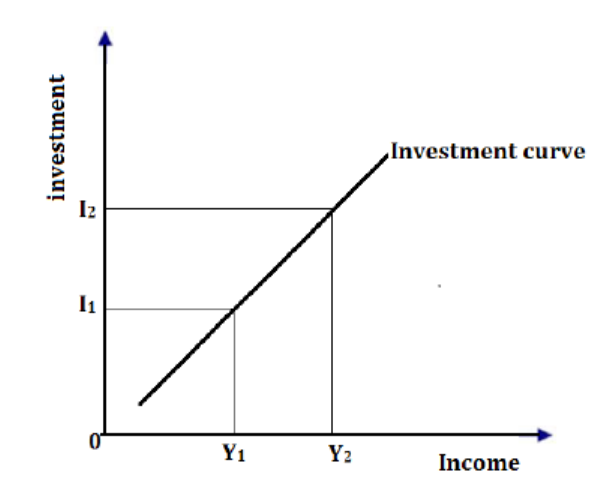
From the above figure, when income is 0Y1, the investment level is0I1 and as income increases to 0Y2, investment also increases to 0I2 and vice versa.
4.3.2 Factors, limitations and measures to improve investment in an economy.
ACTIVITY 4.7
1. What do you think are the determinants of investment in Rwanda?
2. If you are appointed as director general of Rwanda development board (RDB);
a. Discuss the major elements you will deal with in order to attract investments in Rwanda.
b. Provide the Challenges you think are facing investment in your country.
c. What do you think could be the sustainable remedies to those challenges?
4.3.2: Factors that determine investment levels in an economy.
General Price level. The higher the price, the higher the level of investments by the investors so as to enjoy the profits and the lower the price, the lower the investment.
- Liquidity preference. The higher the liquidity preference than investing money, the lower the investment and the lower the liquidity preference, the higher the investment.
- Disposable income. The higher the disposable income, the higher the level of investment and the lower the income, the lower the investment.
- Level of demand. The higher the demand, the higher the level of investment and the lower the demand for the goods and services, the lower the demand.
- Degree of speculation. When investors expect a boom, there will be high rates of investment than when they expect a slump or depression.
- Government policy of taxation and subsidization. If the government over taxes the investors, investments will be low but if the government subsidizes people, investments will be high
- Availability of credit facilities. Investments will be high if there are credit facilities accessed by people inform of loans but it will low if these facilities are scarce.
- Political situation. Peace and stability encourage investment while insecurity discourages investment.
- Presence of capital. The presence of adequate capital resources increases the rate of investment and if capital isn’t enough, the rate of investment will be low.
- Level of entrepreneurs. Once the level of entrepreneurs in an economy is high, investments will be high and once they are low, investment will be low.
- Marginal efficiency of capital (MEC). This refers to the rate of return expected from an additional unit of a capital asset over its cost. Thus, it’s the percentage of profits from a given investment on a capital asset. Therefore, if MEC is high, investors would wish to get high returns in form of profits and therefore they will increase their investments and vice versa.
- The rate of interest (payment made for the use of capital): the higher the rate of interest, the lower the level of investment and vice versa. Hence if the cost of borrowing money is low, most people will acquire loans and invest, ceteris paribus and vice versa.
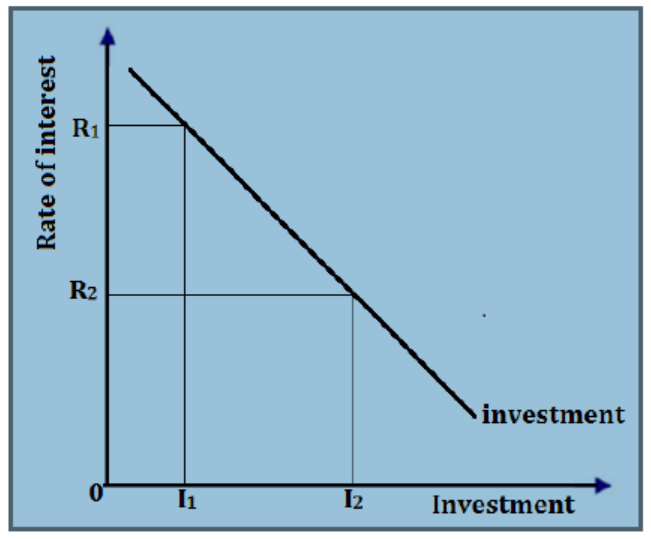
- Availability of financial institutions: If there many financial institutions and are accessible and conducive to citizens for savings, it will encourage savings and thus making loanable funds available which encourages investment and vice versa.
- Presence of markets: Availability of markets stimulates increase in investment. This is because as market grows, e.g. due to increase in population or money income, it increases aggregate demand, which encourages entrepreneurs to produce more of that commodity hence increasing the level of investments in the economy and vice versa.
- Innovations and inventions: These result into technological improvement which increases the volume of investment. As there are changes in demand, businessmen need to make improvements technically to cater for these changes. This increases investment levels in the economy than little or no innovations and inventions.
- Availability of institutions to assist investors: when there are institutions that assist and advise investors, the volume of investments will be increased and vice versa.
- Inflationary rate: High levels of inflation in a country discourage investment because it increases the cost of production and reduce profit margin of investors. But no or low rates of inflation attracts investor in the economy.
- Level of saving: When the level of saving is high, investment will be high and vice versa.
-- The level of infrastructural development: If infrastructures are highly
developed, investors are attracted to invest their capital and vice versa.
-- Global awareness on investment prospects in a country: if there is global
awareness about investment prospects in a given country, it attracts
investors from world over, thus increasing investment levels and vice
versa.
4.3.3. Limitations of investment in Rwanda.
ACTIVITY 4.8
The government of Rwanda through her development agenda has promoted made in Rwanda campaign to boost her economy. Although much has been done to make the policy a success, there are still challenges. Discuss those challenges and provide remedies to overcome them.
- Limited markets due to low incomes of the people and this limits the
investors from putting up mega structures in terms of investments.
- Under developed infrastructure in some areas especially in rural areas limits the movement of potential investors, goods and services from areas of production to the markets.
- Unfavorable investment climate in form of high taxes charged by the governments to investors discourage them from investing. However, the trend is changing where investors are given tax holidays depending on their capacities
- Limited capital. There is still a problem of limited capital where by the local people do not have the necessary capital to invest. This leads to domination of foreign investors who carry of capital outflow through profit repatriation.
- Political insecurity in some areas especially those surrounding Burundi and Congo. The instabilities in those countries cause panic in the Rwandan areas adjacent to those areas. Hence the investors fear to invest in such areas.
- High population growth rate leads to increase in the dependence ratio among the families leaving little disposable income for savings, and investment government.
- High level of liquidity preference. Many people prefer to hold their money in cash or near cash form because of different motives such as precautionary, speculation among others. This limits their capacity to invest.
- Limited entrepreneur skills needed for inventing and innovating. Still the levels are low meaning that there are no new things that may come on the market. The man power needed to carry out the inventions is still low hence living the levels of investments
- Competition from outside countries that bring in their goods on the local market at a low price compared to the one at which home made goods are sold. This diverts peoples’ attention to buy cheap imported goods leaving the local goods without market.
4.3.4: Measures to improve investment in Rwanda:
- Expanding the market through integration and signing treaties with other countries. This will help to solve the problem of lack of market for the home-made products and furthermore it will bring in more foreign exchange.
- Developing more feeder roads in addition to the ones that already exist. These will help to link the rural inaccessible areas to the main roads and will ease the movement of goods and services hence attracting more investors to those respective areas.
- Availing a conducive investment climate. This is through reducing the rates of taxes that the beginner firms can pay. This has further been helped by the government setting up investment zones in the areas of Kabuga.
- Availing capital. This can be through the commercial banks giving loans and credit at low rates of interests to attract the potential borrowers. Furthermore, requesting for lower collateral security when seeking loans. This will attract many people to get soft loans that can be used for setting up investments.
- Strengthening security in areas near countries with instabilities. This can be through working hand in hand with the respective governments or more deployments in those areas. It will create confidence on the local people and the investors hence increase capital and investments in those respective areas.
-Controlling the rate of population growth through a maximum number of children per family. This will reduce the rate of dependence in the families and it will leave the people with enough incomes that can be used for savings and investments in the long run. Still it will reduce the government expenditure on social services leaving it with enough to invest in government owned palastatals.
- Encouraging people to reduce the rate of liquidity and carry out savings. This could be through increase in the interest rates offered on savings. In the long run it will lead to capital accumulation which can further lead to investments.
- Improving entrepreneur skills needed for inventing and innovating.
This can be through on job training and through seminars and workshops. Furthermore, the government has embarked on competence-based form of education which helps learners to carry out research and critically think. This form will help students develop their own ideas leading to constant innovation and inventions.
- Competition can be reduced through economic integration and
specialization where countries within the same region produce different goods and sale to others. Furthermore, it can be reduced through producing good quality output through research. The government can also carry out protection to shield domestic industries from competition.
- Subsidization policy buy the government can help to reduce the problem of inadequate capital. At the same time the goods produced will be sold at a lower price since the cost of production are also low meaning that they may be sold at a price lower than the foreign goods hence increasing their demand.
APPLICATION ACTIVITY 4.3
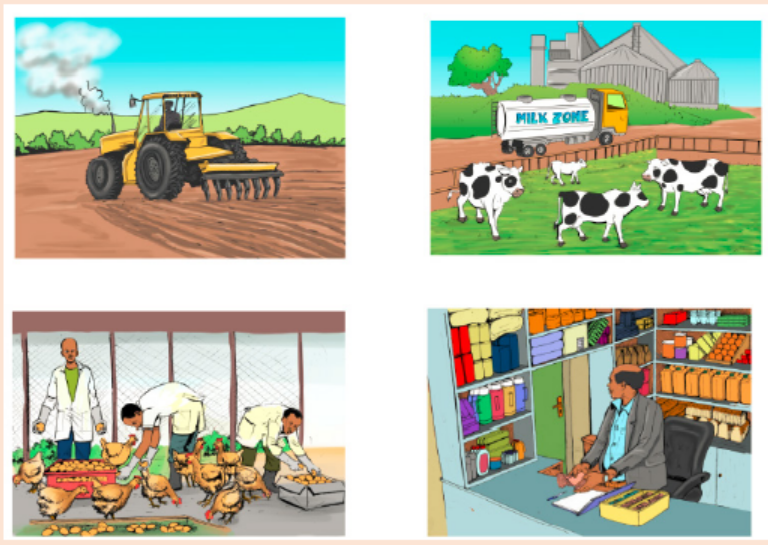
1. By analyzing the photographs above , describe the profit
generating activities
2. In your own view, from which sources of finance does the
entrepreneurs in each of the above pictures get the initial capital
to start the projects?
3. According to Keynes, discuss the relationship between
consumption, saving and investment.
4. Explain why education is considered as:
a. A Consumption good
b. An investment
5. What should the government of Rwanda do to attract investment
in the country?
4.4. Multipliers and Accelerator principle.
ACTIVITY 4.9
Given that Kayitesi’s income increased from francs 50 000 to francs 100 000 and as a result her consumption expenditure on commodity X increased from francs 30 000 to francs 65 000.
In a similar situation, her expenditure on poultry keeping also changes from francs 10 000 to francs 25 000 and the multiplier is 4. In the next period, her consumption of another commodity Y changes
from francs 100 to 300 and as a result, her business expenditure changes from francs 500 to 900. Answer the following questions:
1. a) Calculate the ratio of change in income to the change in expenditure on commodity X.
b) What name is given to that change?
2. a) What name is given to expenditure on poultry keeping?
b) Calculate her final level of income on poultry keeping.
3. Calculate the ratio of the change in business expenditure to the consumption of commodity Y.
4.4.1 Meaning of multiplier
Multiplier refers to the number of times initial change in expenditure multiplies itself to give a final change in income. The multiplier can be shown as: Multiplier (M) = ΔY/ΔE
The size of the multiplier is determined by the proportion of extra income going on extra consumption i.e. MPC. The higher the MPC, the higher will be the multiplier. The multiplier process reflects the fact that extra spending becomes extra incomes, which in turn becomes partly extra spending. The MPC determines the increase in national income. The formula for determining the actual size of the multiplier is:
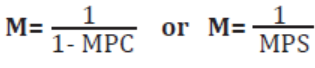
Example 1
Given that MPC=0.4, calculate the multiplier magnitude.
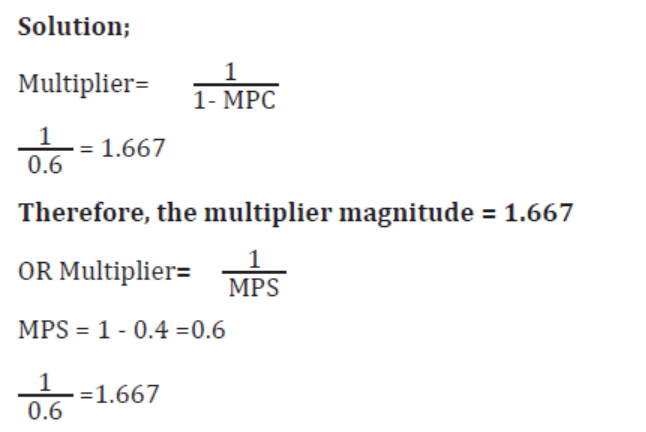
Example 2
If the initial increase in capital investment was 20 million francs and this bought a final increase in total expenditure of 100 million francs, calculate multiplier.
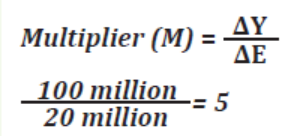
NB. It is important to point out that no increase in expenditure of any type (investment, consumption, government or exports) will increase the national output and income if the economy is already at full employment. For an economy already at full capacity, where no further increase in output can take place, any further increase in spending can only raise price so that although national income would rise in “money” terms, there would be no increase in “real” terms. Thus, in examining the effect of increased investment on national income, we must make it clear that there must be unemployed resources fornational income to rise (excess capacity).
4.4.2 Types of multipliers
Multipliers can be classified according to the form of sectors that spend. These sectors are; government, firms, and foreign sector. The types of multipliers are seen below:
- Government multiplier. It refers to the number of times initial government expenditure multiplies itself to give a final change in income.
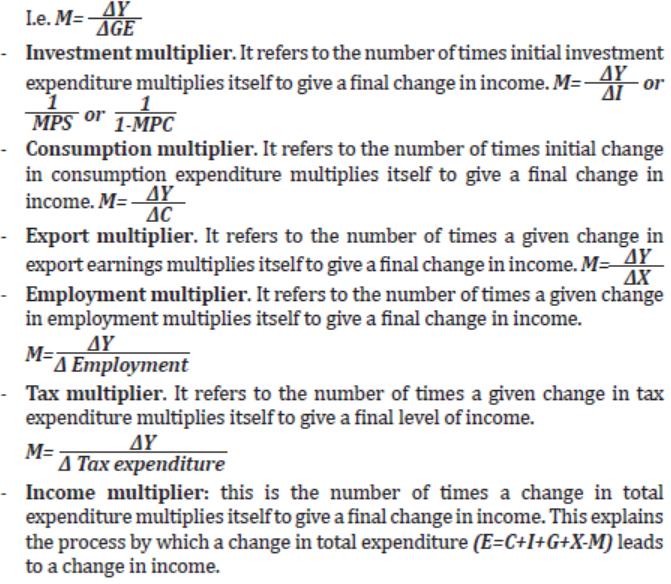
4.4.3 Calculations of multipliers
Work out and interpret the following calculations
1. Given that MPS is 0.2, find the MPC and determine the magnitude of the multiplier. Interpret your answer.
2. Given that the marginal propensity to consume is 0.75, calculate the size of multiplier. Interpret your answer.
Example 1
Given that as a result of increase in investment expenditure from 20 million francs to 60 million francs, national income increased from 3000 million francs to 7000 million francs. What is the investment multiplier?
Solution;
ΔY=7000million frw-3000million francs= 4000million francs
ΔI= 60 millionfrw-20 million francs= 40 million francs

This means that the initial investment expenditure has multiplied its self-100 time to give a final change in national income.
NB: multiplier has no units; it is simply a number of times.
Example 2;
Given that the final change in investment from 3 million francs to 8 million francs led to an increase in income from 200 million francs to 400 million francs. Calculate the investment multiplier.
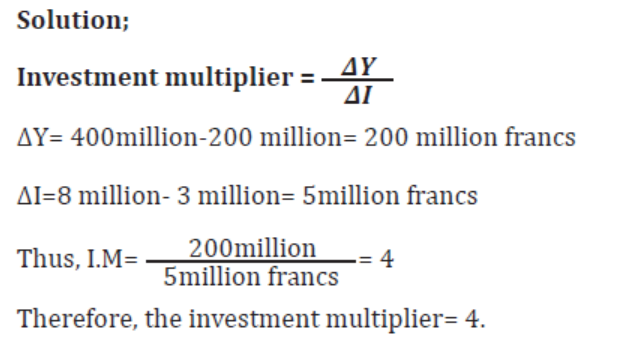
This means that the initial investment expenditure of 3million francs has multiplied its self-3 times to bring about a final change in income of 400 million francs.
Exercise
1. Given that government expenditure in an economy is increased by 100
million, where the MPC is 0.8. Find the final change in national income.
2. Given that MPS is 0.2, find the MPC and determine the magnitude of the
multiplier.
3. Given MPC is 70%, find MPS.
4. a) Calculate the magnitude of the multiplier where MPC is 40%.
b) Given that the multiplier in an economy is 2 and the final level of income is 100 million. Find the MPS and change in expenditure.
4.5. Accelerator principle
ACTIVITY 4.10
The consumption expenditure increased from 30 million to 70 million Rwandan francs which resulted into an increase in investment from 500 million to 800 million Rwandan francs.
a. Estimate the change in investment to the change in consumption expenditure.
b. What name is given to the change above?
As investment leads to a change in income directly, change in consumption leads to a change in income indirectly by inducing investment which also leads to a change in income
The accelerator principle (AP) is the number of times the original change in consumption multiplies itself to give a final change in investment
Example:
If consumption of beans increases from 15 kg to 22 kg and increase in investment
moves from 100Frw to 150Frw.The accelerator principle would be:
Accelerator principle = 7.1
APPLICATION ACTIVITY 4.4
1. Given that the current level of GDP is 300 million francs. The increase in national investment expenditure is 50 million francs and the marginal propensity to save is 0.2.Calculate the final level of income.
2. As a result of increase in milk consumption in the country from 80 000 to 100 000 litres per week, investment in diary sector increased by 200 million Rwandan francs. Given the price of milk as francs 300 per litre, calculate the accelerator principle.
SKILLS LAB
Visit the nearby businessmen and collect data on the procedures for starting business, discuss the collected information in your groups and then come up with convincing ideas on how better the business can be established at your school environment.
END UNIT ASSESSMENT
1. Distinguish between the multiplier and accelerator principle.
2. Study the table below showing changes in the level of income, consumption and savings in an economy and answer the questions that follow.
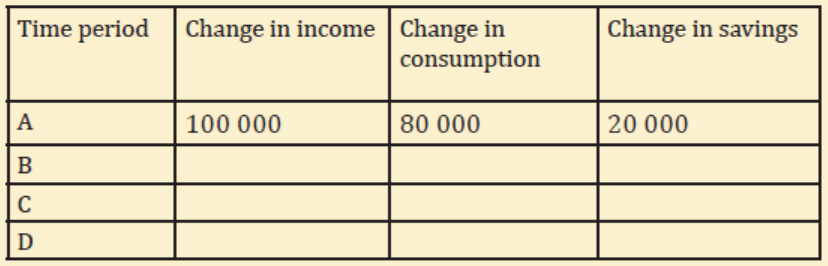
3. Given that the marginal propensity to consume (MPC) is 80%, and change in income is 100 000 Frw.
a. Calculate the change in the level of income, consumption and savings for the period B, C, and D to complete the table above. Show your working.
b. State the multiplier when MPC=80%.
c. Calculate the overall change in the level of income in the economy.
4. Given that the multiplier is 2 and the final level of income is 150
million, find MPS and change in expenditure.
5. Keynes asserted that “consumption depends on income” discuss
the validity of this statement.
6. Explain the effects of consumption, savings and investment on national income.
UNIT 5 MONEY
Key Unit Competence: Students will be able to describe the role of money in an economy.
INTRODUCTORY ACTIVITY
Study the photographs below and answer the questions that follow:
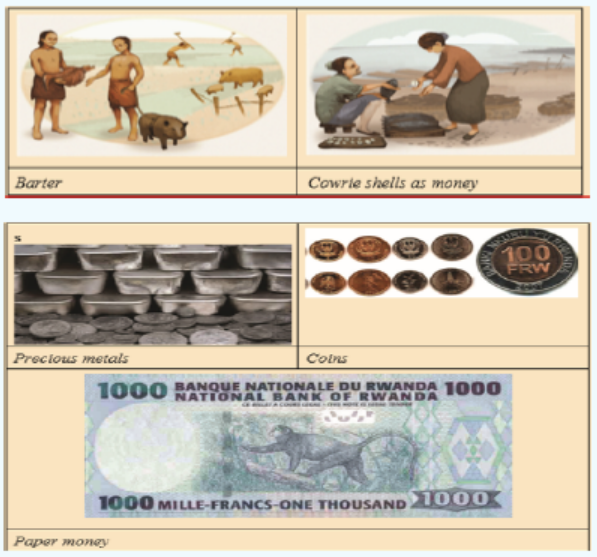
1. What do the photographs indicate?
2. Describe how money evolved from the past to present.
3. What type of exchange was used before the introduction of paper money?
4. What problems were associated with the exchange system mentioned in question 3 above?
5.1. Meaning of money
ACTIVITY 5.1
Carry out research in the library, internet or any other source and explain the following:
1. What do you give to the business men when exchanging goods and services?
2. What kinds of notes and coins that are being used in Rwanda today?
3. What are some of the elements that a 500 Rwandan franc consist of?
4. If the price of 1 exercise book is francs 300, how many notes of 1000 will you need to buy 10 exercise books?
5. Do you think the medium of exchange of goods and services used before Rwanda got independence is the same as today?
a. If the answer is yes, why do you think it never changed?
b. If the answer is no, where is the difference?
6. List all the medium of exchange that was used from the past up to present.
7. Which medium of exchange is most convenient in the buying of goods and services and why?
8. What medium of exchange that was used to exchange goods for goods and services for services.
9. What benefits are associated with the system named in 8 above?
Money is defined as anything that is generally accepted as a medium of exchange for the goods and services and in settlement of obligations. This abstract definition of money avoids identifying money with a particular object which may at one time or another be used as money.
All sorts of articles or objects have served as money throughout the ages. These include among others beads, salt, stones, gold, silver, paper and cattle.
5.2. Evolution of money
Money was not invented overnight. It is as a result of a process of evolution through several hundred years. Money has passed through numerous historical stages such as barter, commodity, paper and bank money. Below it can be seen how money evolved to present.
a. Barter trade. This was the first form of exchange where commodities were exchanged for commodities. For example, cassava for sheep. With barter, an individual possessing any surplus of value, such as a measure of grain or a quantity of livestock, could directly exchange it for something perceived to have similar or greater value or utility, such as a clay pot or a tool, however, the capacity to carry out barter transactions is limited in that it depends on a coincidence of wants. For example, a farmer has to find someone who not only wants the grain he produced but who could also offer something in return that the farmer wants. Finding people to barter with is a time-consuming process and this factor is most likely the main driving force in the creation of monetary systems -- people seeking a way to stop wasting their time looking for someone to barter with.
b. Commodity money. This replaced barter trade and sorts of commodities of high value like salt, tobacco, cattle, seashells, pearls, precious stones, tea, tobacco, cow, leather, cloth, wine, etc. have been used as a medium of exchange (i.e., money).
c. Durable commodities. These included iron, copper, and cowrie shells among others. However, these were too common hence they could not act as good money.
d. Precious metals: Inadequacy of commodity money led to the evolution of metallic money like gold and silver because they were found to have qualities of good money. Such metals were later cut into small pieces of different shapes called coins. At first, the metal value of the coin was equal to its face value and such coins were called full bodied money. Later coins whose real value was less than the face value was called token money:
e. Paper money. In the middle Ages, the keeping of values with goldsmiths, persons trading with gold and silver items, was common. The goldsmith, as a guaranty, delivered a receipt. Such receipts stated the name of the owner and the amount of gold deposits kept. Later these were used as money because they were as good as the gold kept. After some time, the gold smith started issuing notes in excess of the gold reserves kept and this money not backed by gold is known as fiduciary issue. With time, these receipts came to be used to make payments, circulating from hand to hand, giving origin to paper money. This process was finally taken over by the state as one of its essential features and ultimately commodity and metallic money gave way to Paper Money which means currency notes. Nowadays, use of paper money has almost become universal along with coins made of copper, bronze or nickel, etc.
f. Banknotes. As the volume of transactions increased, even paper money started becoming Inconvenient because of time involved in its counting and space required for its safe keeping. This led to introduction of Bank Money (or credit money) in the form of cheques, drafts, bills of exchange, credit cards, etc. These days plastic money in the form of debit cards are becoming popular. Thus, bank money has become the most important form of money in modern times because it is not only a very convenient form of money for large payments, but also eliminates risks and is durable.
5.3. Qualities of good money
ACTIVITY 5.2
Carry out research in library, internet or any other source on the following questions and thereafter present your findings to your colleagues;
1. It is believed that “money must be scarce in order to maintain its value” Discuss this statement.
2. Make research and explain the following features of good money.
a. Acceptability,
b. Durability,
c. Homogeneity,
d. Divisibility,
e. Portability,
f. Hard to counterfeit.
3. “Money is not what it is but what it does”. Discuss this statement.
4. Which one of the following do you think is not a function of money?
a. Store of value,
b. Measure of value,
c. Hard to counterfeit,
d. Unit of account ,
e. Double coincidence of wants.
- Acceptability. Good money should be acceptable by everyone as a medium of exchange. This is the prime requirement for money. The use of money is based on confidence. One is prepared to accept money provided one is confident that others will also accept it.
- Durability. The goods that are used as money should be durable. It would not be acceptable if it could deteriorate. For instance, if a metal is used, it should not wear away. It should be noted that the money’s durability lies in its value.
- Scarcity. Good money should be scarce because if it is common, it would lose value due to increase in demand. Its supply must be less than the demand but it must be available
- Homogeneity. Good money should be similar; the features on the same denominations should be the same as on another denomination. Varying degrees of quality will lead to confusion and uncertainty in the public and eventually there will be loss of confidence
- Divisibility. Good money should easily be broken down into smaller denominations (divisible in small units). Whatever physical commodity is being used as money, it must be capable of being divided into smaller amounts to make possible smaller transactions.
- Portability. Good money should be able to carry from one place to another. It must not be heavy in relation to its value. It must be transportable in terms of bulk and weight. Modern money consists of coins, bank notes, cheques and bank drafts and these can easily be carried without attracting attention
- Difficult to forge. (Hard to counterfeit)- Good money should not easily be faked or copied i.e. be hard to forge. It should be made of features and quality that cannot easily be forged otherwise forged money will increase money in an economy which leads to inflation and in turn money will lose value. Money which is forged is called counterfeit money
5.4. Functions of Money
- Medium of Exchange. Money’s most important function is as a medium of exchange to facilitate transactions. Without money, all transactions would have to be conducted by barter, which involves direct exchange of one good or service for another. The difficulty with a barter system is that in order to obtain a particular good or service from a supplier, one has to possess a good or service of equal value, which the supplier also desires. In other words, in a barter system, exchange can take place only if there is a double coincidence of wants between two transacting parties. The likelihood of a double coincidence of wants, however, is small and makes the exchange of goods and services rather difficult. Money effectively eliminates the double coincidence of wants problem by serving as a medium of exchange that is accepted in all transactions, by all parties, regardless of whether they desire each other’s goods and services
- Measure of Value. Money is the measuring rod of everything. By acting as a common denominator, it permits everything to be priced, that is, valued in terms of money. Thus, people are enabled to compare different prices and thus see the relative values of different goods and services. This serves two basic purposes: i.e. Households (consumers) can plan their expenditure; and business people can keep records of income and costs in order to work out their profit and loss figures. But under barter system, it’s very difficult to measure the value of goods. For example, a cow may be valued as worth five goats. Thus, one of the disadvantages of the barter system is that any commodity or service has a series of exchange values.
- Store of Value (purchasing power). In order to be a medium of exchange, money must hold its value over time; that is, it must be a store of value. If money could not be stored for some period of time and still remain valuable in exchange, it would not solve the double coincidence of wants problem and therefore would not be adopted as a medium of exchange. As a store of value, money is not unique; many other stores of value exist, such as land, works of art, and even baseball cards and stamps, domestic animals etc. Money may not even be the best store of value because it depreciates with inflation. However, money is more liquid than most other stores of value because as a medium of exchange, it is readily accepted everywhere. Furthermore, money is an easily transported store of value or wealth that is available in a number of convenient denominations. Therefore, Money is used as a store of purchasing power because it can be held over a period of time and used to finance future payments. Moreover, when people save money, they get the assurance that the money saved will have value when they wish to spend it in the future. However, this statement holds only if there is no severe inflation (or deflation) in the country. In other words, it is quite obvious that money can only act effectively as a store of value if its own value is stable. If, for example, most people feel that their savings would become worthless very soon, they would spend them at once and save nothing.
- The Basis of Credit: Money facilitates loans. Borrowers can use money
to obtain goods and services when they are needed most. For example, a
newly employed person would need a lot of money to completely furnish
a house at once. They are not required to wait for, say ten years, so as to
be able to save enough money to build a house, buy costly items like cars,
refrigerators, T.V. sets, etc., they can therefore borrow and pay with time
as they continue to work and pay as well.
- A Standard of deferred/ Postponed Payment: Here again money is used as a medium of exchange, but this time the payment is spread over a period of time. Thus, when goods are bought on hire-purchase, they are given to the buyer upon payment of a deposit, and she/he then pays the remaining amount in a number of instalments. In other words, the use of money permits postponement of spending from the present to some future occasion. In a modern economy, most transactions (buying and selling) are made on the basis of credit. For example, it is possible to purchase consumer durables such as T.V. sets or gas cooker on hire-purchase; most business dealings permit payment in the future for goods delivered now; and employees wait for a month or a week to receive their wages and salaries. Thus, the use of money permits the members of society to defer their spending from the present to some future date.
- Distribution: In a modern society, money is a mechanism through which
most goods and services are distributed through the pricing mechanism.
Goods can be moved from one area to another mainly from areas of low
price to areas of high price through a process called arbitrage. All this can
only be done through price mechanism which uses money
- Transfer of immovable property
- Money can facilitate the physical transfer of property. For example, it may be hard to move a building from Nyamasheke district to Kirehe district but the owner can sale the building and easily moves with his money to the new area of location.
- Unit of account. Money also functions as a unit of account, providing a common measure of the value of goods and services being exchanged. Knowing the value or price of a good, in terms of money, enables both the supplier and the purchaser of the good to make decisions about how much of the good to supply and how much of the good to purchase. All business transactions and accounting are made possible by use of money. When computing business transactions, statistics of national income to mention but a few, money is the most suitable medium. It may be easy to record the amount got after selling a commodity than recording the actual commodity.
- Money enables specialization to take place by ascertaining the demand for goods and services. People are able to carry out specialization basing on the level of incomes that they possess. For example, if a person performs only a single task in a maize growing, s/he has not actually produced anything himself. So, what could s/he exchange if a barter system were in operation? With money system therefore, the problem is removed. One can be paid in terms of money and can use that money to buy what s/he wants that s/he doesn’t produce.
APPLICATION ACTIVITY 5.1
1. Explain how the concept of money is related to inflation
2. Explain the problem of double coincidence of wants in relation to the use of money as a medium of exchange.
3. Money should be made in a way that it becomes difficult to forge. Discuss the implication of forged money to the economy of Rwanda?
Demand for money
ACTIVITY 5.3
Case study
Mukeshimana is a resident of Nyarugenge district in kigali city. She wants 25million francs to start a business in Kicukiro district and remain with some money to care for home needs and emergency issues. She decided to sel her plot of land located in Remera to get all her money.
Required:
1. Explain reasons why Mukeshimana decided to sell her plot of land.
2. How do we call the desire by people to hold money in cash form rather than in assets like land?
3. Give examples of emergency circumstances in which Mukeshimana had to cater for with her Money.
4. What economic name is given to the motive of holding money for :
a. Emergence reasons?
b. Buying things like food, clothes needed in everyday life at home?
5.5.1: The demand for money
The demand for money is also called liquidity preference. It is the desire by the people to hold money in cash or near cash form rather than investing it.
5.5.2: Keynesian theory of demand for money
According to Keynes, people demand for money because of the four main motives as explained below:
a. Transactions Motive. According to this motive, people demand for money so as to carry out every day transactions like buying food, clothes among others needed in the everyday life. You can also keep an inventory of money inform of deposits at the bank to make transactions such as paying rent, water and other bills. Keynes argued that the demand to hold money to make transactions is determined by the level of income and by institutional factors.
b. Precautionary Motive. According to this motive, people demand for money to cater for unforeseen circumstances like sickness, travel among others. For instance, if a person plans to travel for a long distance, he will expect to spend money on travel ticket, lodging, food among others but still he may need to have some money aside for instances that may come unknowingly such as sickness on the way, increase in the travel tickets among others.
c. Finance motive: According to this motive, people especially businessmen demand for money to finance the ongoing investments on which a lot of capital is already invested. Like purchasing fuel, raw material paying wages etc. This is especially with business men who need a certain amount of money in cash or liquid for purposes of financing day to day business e.g. paying for fuel, hiring labour etc.
d. Speculative motive. According to this motive, people demand for money
in anticipation of future trends in the business so as to profit from them.
Normally a change in prices in future will help the business men to benefit when they buy at lower prices and sale in future when the prices increase. In this case, business people have a belief that money tomorrow will be better. Speculation helps business people to make abnormal profits in future. Keynes assumed that individuals can hold their wealth in two ways; i.e. in cash balances in excess of those needed to meet transactions demand and in bonds.
Money demand based on this motive, depends on interest rate i.e. when the interest rate is expected to fall, speculations hold or convert their bonds into cash and therefore demand more money to avoid capital loss. Likewise if the rate of interest is expected to rise speculators buy bonds in order to sell them at a higher price in order to get gains.
NB: The point where the rate of interest is too low to break liquidity preference
is known as liquidity trap. At this point there is a likelihood of low levels of
investment.
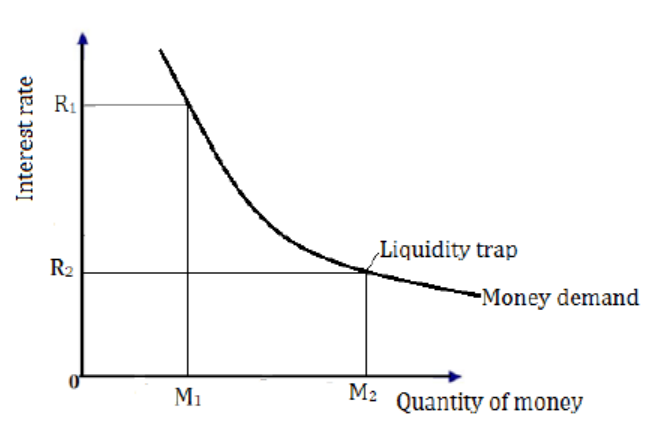
At a higher interest e.g. R1 money demand is low e.g. at M1. An investor with
excess money will seek to hold bond and therefore the price of bonds will rise.
This makes the interest rate to fall to R2 and as it falls the demand for money
rises to M2. Below R2 the interest rate is too low to break the liquidity preference
thus liquidity trap.
APPLICATION ACTIVITY 5.2
1. With reference to Keynesian liquidity preference theory, discuss
the transaction, precautionary and speculative motive for holding
money.
2. When all four motives are put together, what theory of money
demand emerges?
3. With the help of illustration, support the idea that “ demand for
money depends on interest rate.”
4. Describe the keynesian theory of speculative demand for money
5. Describe how liquidity trap arises?
5.6. Money supply
ACTIVITY 5.4
Carry out a research on money supply and answer the following
questions:
1. Provide a description on the quantity of money in circulation.
2. Discuss the factors that influence money supply.
3. Explain the levels of money supply and types of money supply.
5.6.1. Money supply
Money supply refers to the total amount of money in circulation together with
that money held by commercial banks plus quasi money. It comprises of the
total currency notes, coins and demand deposits with the banks, held by the
public.
In modern economies, money supply is divided into three levels, namely:
1. M1 (Narrow money); This is money supply that involves cash (i.e notes
and coins) and demand deposits. It looks at money as a medium of
exchange.
2. M2 (Broad money); This is money supply that involves cash ( .e notes
and coins), demand deposits and time deposits (deposits that require
notice before withdrawn). Ie M2= M1+ time deposits
3. M3 (Broader money) This involves cash ( ie notes and coins), demand
deposits, time deposits and money market instruments like certificates
of deposit i.e M3= M2+ fixed deposits
There are two types of money supply
1. Exogenous (Discretionary) money supply.
This is money supply which is fixed and determined by issuing authority
like central bank. Such money supply is fixed regardless of the economic
activities.
2. Endogenous (automatic) money supply
This is the money supply determined by the level of economic activities. The
higher the level of economic activities, the higher the money supply and the
lower the activities, the lower the money supply
5.6.2. Determinants of money supply
- Level of economic activities. The higher the level of economic activities, the higher the money supply and the lower the activities, the lower the money supply.
- Buying and selling of security by the central bank. When the central bank buys security like bonds from the public, it increases money but when it sells, it reduces money supply.
- Balance of payment surplus. When the export earnings are greater than the import expenditure, the money increases in supply but when they are low, money supply will be low.
- Rate of printing money. When more money is printed, it increases money in circulation, this is called financial accommodation
- Rate of capital inflow and out flow. When the rate if inflow like from tourists is high, there will be high money supply while high capital outflow reduces money supply.
- Level of monetarization of the economy. When the economy uses money as a medium of exchange, money supply will increase while use of barter leads to low money in supply.
- Rate of credit creation by commercial banks. Where there is a high rate of credit creation, there will be increase in money supply while a low credit creation leads to low money supply.
- Rate of government borrowings. High rate of government borrowing increases money supply while low government borrowing leads to low money supply.
APPLICATION ACTIVITY 5.3
1. Rwanda is a developing country that experiences budgetary deficit year after year. Explain reasons as to why the central bank doesn’t print money to finance its deficit other than relying on taxation and debt financing?
2. How does the demand for money and money supply affect interest rates?
3. Describe how an increase in money supply increases production levels in an economy?
5.7. The quantity theory of money
ACTIVITY 5.5
1. Explain how the value of money is related to the quantity of money in circulation.

2. What are the factors that influence the value of money?
3. Carry out research and explain the Irving Fisher theory of money
and factors that make his theory a success.
4. Discuss the limitations of the theory.
The quantity theory of money was first put forward by classical economists. It was later revised by Irving Fisher an American economist. As developed by Fisher, the quantity theory of money explains the determinants of the value of money.
In his book” The purchasing Power of Money” (1911), he stated that the value of money in a given period of time depends on the quantity of money in circulation in the economy. Other things remaining unchanged, as the quantity of money in circulation increases, the price level also increases in direct proportion and the value of money decreases and vice versa.
If the quantity of money is doubled, the price level will also double and the value of money will be one half. If the quantity of money is reduced by one half, the price level will also be reduced by one half and the value of money will be twice.
According to the theory, the value of money depends on the following factors:
1. The quantity of money in circulation (M) i.e. an increase in the quantity of money in circulation would bring about a proportionate increase in the prices.
2. The velocity of circulation of money (V).
3. The number of transactions (T) that take place in the economy.
4. General price levels (P) in the economy.
Irving Fisher’s theory therefore states that; “an increase in money supply will bring about appropriate change in prices, provided the velocity and number of transitions which take place remain constant”.
This means that the general price level (P) is determined by the quantity of money in circulation (M) assuming that the velocity of circulation (V) and the level of transaction which take place (T) are held constant
As modified by Fischer, the quantity theory of money can be expressed by the
equation below:
MV = PT or P = MV/T
Where; M= Quantity of Money
V= Velocity of circulation of money i.e. number of times one unit of money is
used to make transactions
T= number of transactions
P= General Price Level
It is important to note that, the effects of a change in money supply on the price
level and the value of money are graphically shown in figure below (1-A and B)
respectively:
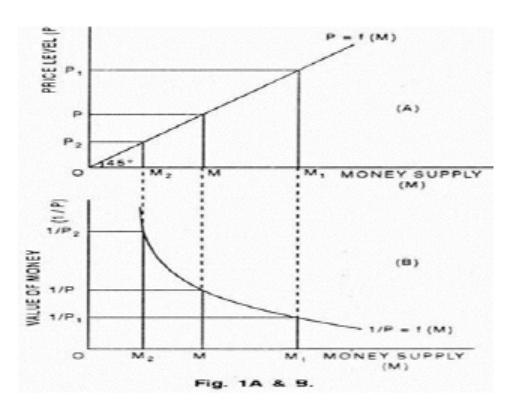
i. In Figure 1-A, when the money supply is doubled from OM to OM1, the price level is also doubled from OP to OP1. When the money supply is halved from OM to OM2, the price level is halved from OP to OP2. Price curve, P = f(M), is a 45° line showing a direct proportional relationship between the money supply and the price level.
ii. In Figure 1-B, when the money supply is doubled from OM to OM1; the value of money is halved from O1/P to O1/P1 and when the money supply is halved from OM to OM2, the value of money is doubled from O1/P to O1/ P2. The value of money curve, 1/P = f (M) is a rectangular hyperbola curve showing an inverse proportional relationship between the money supply and the value of money.
5.7.1 Calculations of the quantity theory of money
Example:
Assume V and T remain constant, if the quantity of money is increased the price
level will go up but the value of money will fall and vice versa. Assume that:
M= 100
V=10
T=50
Find the value of P.
P=MV/T = 100x10/50 =20
If M=200, then P=200x10/50 = 40
If M=50, then
P=50x10/50 =10
Exercise:
1. a) Given that the price level is 120, the velocity of money is 80 and number of transactions is 90. Calculate the money supply at time “t”
b) If the general price level increases to 150, Calculate money supply and explain what is the happening to the value of money.
5.7.2 Assumptions of Fisher’s Approach
Fisher’s theory is based on the following assumptions:
- Price is a passive factor in the equation of exchange which is affected by the other factors.
- Velocity is assumed to be constant and is independent of changes in money in circulation
- Number of transactions also remains constant and is independent of other factors such as Money in circulation and Velocity
- It is assumed that the demand for money is proportional to the value of transactions.
- The supply of money is assumed as an exogenously determined constant.
- The theory is applicable in the long run.
- It is based on the assumption of the existence of full employment in the economy.
- There is no hoarding of the increased money supply but it must be spent on buying goods and services.
5.7.3. Limitations of Fisher’ theory
1. Fisher’s equation of exchange is a simple truism because it states that the total quantity of money (MV) paid for goods and services must equal their value (PT). But it cannot be accepted today, that a certain percentage change in the quantity of money leads to the same percentage change in the price level.
2. The direct and proportionate relation between quantity of money and price level in Fisher’s equation is based on the assumption that “other things remain unchanged”. But in real life, V and T are not constant. Rather, all elements in Fisher’s equation are interrelated and interdependent. For instance, a change in M may cause a change in V. Consequently, the price level may change more in proportion to a change in the quantity of money.
3. Fisher multiplied M and V yet M relates to a point of time and V to a period of time. The former is a static concept and the latter a dynamic. It is therefore, technically inconsistent to multiply two non-comparable factors.
4. Fisher’s equation does not measure the purchasing power of money but only cash transactions, that is, the volume of business transactions of all kinds or what Fisher calls the volume of trade in the community during a year. But the purchasing power of money (or value of money) relates to transactions for the purchase of goods and services for consumption. Thus, the quantity theory fails to measure the value of money.
5. The quantity theory places a misleading emphasis on the quantity of money as the principal cause of changes in the price level during the trade cycle. Prices may not rise despite increase in the quantity of money during depression; and they may not decline with reduction in the quantity of money during boom. Further, low prices during depression are not caused by shortage of quantity of money, and high prices during prosperity are not caused by abundance of quantity of money.
6. One of the main weaknesses of Fisher’s quantity theory of money is that it neglects the role of the rate of interest as one of the causative factors between money supply and prices. Fisher’s equation of exchange is related to an equilibrium situation in which rate of interest is independent
of the quantity of money.
7. The quantity theory of money is unrealistic because it analyses the relation between M and P in the long run. Thus, it neglects the short run factors which influence this relationship. Keynes also does not believe that the relationship between the quantity of money and the price level is direct and proportional.
8. Velocity is not constant. When there is underemployment equilibrium, the velocity of circulation of money V is highly unstable and would change with changes in the stock of money or money income. Thus, it was unrealistic for Fisher to assume V to be constant and independent of M.
9. Neglects Store of Value Function: Another weakness of the quantity theory of money is that it concentrates on the supply of money and assumes the demand for money to be constant. In other words, it neglects the store-of-value function of money and considers only the medium-ofexchange function of money. Thus, the theory is one-sided.
10. Neglects role of government: The theory ignores the role of the government in price control. There can be increase in money supply but the government fixes the prices hence there will be not price increase.
11. A country may have a lot of unemployed resources and an increase in money supply can increase demand which leads to an increase in goods and services and this may make prices fall or not change.
12. It assumes all money is spent which is untrue since some money may be saved. e.g. If it is instead saved, “V” may be affected hence “p” may remain unchanged.
APPLICATION ACTIVITY 5.4
1. Discuss how the increase in money supply will affect the general
price level in an economy.
2. Explain the impact of increase in money supply on income and
interest rate.
3. Explain how the government limits the success of Fisher’s theory
in most economies?
END UNIT ASSESSMENT
1. a. Explain the quantity theory of money.
b. Assuming the level of transactions is 200, the velocity of money is 40 and money supply is 600. Calculate the price levels in an economy.
c. If money supply is increased from 600 to 1200. Calculate the general price levels and tell what is happening to money value.
2. a. Explain how increase in money supply and government spending affect output in the long run.
b. Examine the impact of increased money supply on an economy
UNIT 6 FINANCIAL INSTITUTIONS
Key Unit competence: Student teachers will able to describe the role of
financial institutions in economic development.
INTRODUCTORY ACTIVITY
Muhire after graduating with bachelor of finance, had two things in his mind. One was to look for a job that is in relation to his qualification, second was to start up his own business and manage it by himself. He went to consult various experts to seek advice on which route to follow. Assume you are consulted to advise him, which route would you advise him to follow? If you choose to advise him to start his own but has no capital, where would you advise him to get capital from?
6.1. Introduction to financial institutions
6.1.1. Meaning of Financial institutions
ACTIVITY 6.1
Using photographs a, b and c in figure 1 below, identify the following:
1. What do the institutions below deal in?
2. Describe what financial institutions are.
3. Explain the functions of such institutions in Rwanda?
4. Distinguish between the activities of institutions a and c.
5. Identify any other institutions that deal in such an activity in your locality.
6. Classify the various financial institutions in Rwanda.
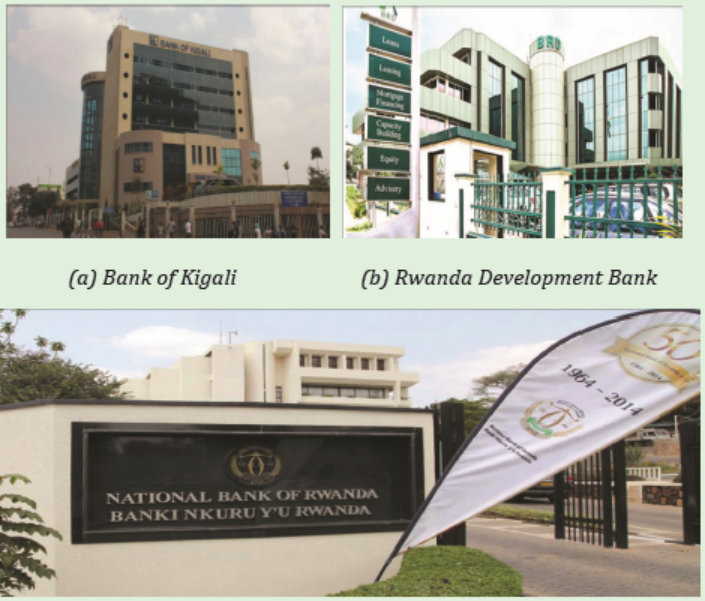
(c) National Bank of Rwanda
Figure 1: Financial institutions in Rwanda
Various economists define financial institution (FI) in different ways but the common is: A financial institution (FI) is a company engaged in the business of dealing with financial and monetary transactions such as deposits, loans, investments, and currency exchange.
Financial institutions normally:
1. Encompass a broad range of business operations within the financial services sector including banks, trust companies, insurance companies, brokerage firms, and investment dealers.
2. Vary by size, scope, and geography.
6.1.2. Functions of financial intermediaries
Specifically, financial intermediaries have vital roles to play in a modern economy which include:
- They act as a go-between savers and borrowers. They facilitate direct contact between savers and borrowers.
- They purchase government bonds and securities.
- They improve the utilisation of scarce resources by providing facilities for investment in plant, equipment, and so on, through loans, mortgages, purchases of bonds share.
- They spread their risk between different borrowers; create financial assets and substantially add to the stock of financial assets available to the lenders.
- They provide liquidity easily and quickly through the conversion of an asset into cash without any loss in their value.
- They maintain equilibrium between the demand and supply of financial assets, bring about stability in the capital market;
- They increase the liquidity of the financial system. Financial intermediaries increase the liquidity of the financial system through giving out loans. They also invest the proceeds into treasury bills, bonds, business firm shares; and
- They facilitate the pooling of risks. Lending is wrought with risks. Important among these is default by borrowers. In a situation where individual savers would have to find corresponding borrowers, the risk of one losing the savings would be high.
APPLICATION ACTIVITY 6.1
You noticed that financial institutions deal with monetary transactions. Assume you are hired as branch manager in one of the financial institution in Rwanda, clearly describe what will be the roles of your branch to the development of the community.
6.2. Types of Financial Institutions
There are basically two types of financial intermediaries and these include:
1. Banking financial intermediaries such as commercial banks and the central bank; and
2. Non-banking financial intermediaries.
6.2.1. Banking financial institutions
ACTIVITY 6.2
Using photographs a, b and c in Figure 1 above visit the library or any other source of information and write in your exercise books about the
following;
1. Describe what banking financial institutions are.
2. Name the examples of commercial banks you know in Rwanda
and explain why ?
3. What is the relationship between photographs a b and c?
4. What are the functions of commercial banks in Rwanda?
5. Describe the different accounts run by commercial banks.
Banking financial institutions are institutions which receive deposits from the public; give loans on short-term basis and create new deposits by loaning more amounts of funds deposited by customers. They include:
1. Commercial banks
2. Central banks
6.2.1.1. Commercial banks
A. Meaning
These are financial institutions that provide retail banking services such as providing types of accounts for their customers and facilitating a payment mechanism. Examples are Bank of Kigali-BK, Eco Bank; Atlas mara/Banque Populaire du Rwanda SA (BPR), GTBank Rwanda, Access Bank Rwanda, Commercial Bank of Africa (Rwanda), I&M Bank (Rwanda), Crane Bank Rwanda, etc.
B. Functions of commercial banks
1. Credit creation
In this role, the commercial bank accepts deposits and lends money out (grant loans) to custmers at an interest.
2. Transfer of money
Commercial banks provide facilities for domestic and foreign transfer of money. Provision of such facilities can be done through issuing of cheques, credit transfer, standing order, or direct debit transfer. Banks can also transfer funds outside the country by making payments abroad on behalf of their customer thus facilitating international trade. They sell traveller’s cheques to their customers wishing to travel abroad.
3. Advisory services
Banks also offer advisory services to their customers usually charging for these services. The range of such services includes: trusteeship, foreign exchange, and investment management, among others.
4. Other financial products
Commercial Banks can offer other financial products to their customers such as mortgages and insurance.
5. Provision of credit facilities
Commercial banks channel the accumulated funds or deposits received under the different accounts into productive uses in the form of loans, advances, overdraft facilities and cash credits to their customers.
6. Provision of facilities for safekeeping deposits
Commercial banks provide facilities for safeguarding of valuables like jewelery and documents such as land titles. They also look after the property of dead customers and distribute their assets as laid down in their respective wills.
7. Open up and run different accounts
Commercial banks open up and run different accounts on behalf of their clients.
These accounts include:
a. Current accounts: The opening of a current account provides the customer with the facilities of drawing cheques, arranging for regular payments by standing orders and having payments such as salaries credited direct into the account.
b. Savings accounts: The main feature of this account is that it stipulates a minimum/maximum monthly subscription which must be maintained for a set term usually a minimum of 12 months.
c. Fixed deposit accounts: Here the customers deposit a certain amount of money for a period of time without withdrawing it. There is a high interest earned on this deposited money. The money is only withdrawn after a certain period of time.
C. Liquidity and profitability in commercial banks
ACTIVITY 6.3
Visit any of the nearest commercial bank branches in your locality.
Research on the following:
1. How do commercial banks reconcile the conflicting objectives of liquidity and profitability?
2. What is the difference between assets and liabilities of a bank?
Give examples in each case.
Liquidity and profitability are two critical concepts in finance especially in banking sector. Each commercial bank has to maximise its profits without losing sight of its liquidity. Therefore, commercial banks must be highly efficient in their portfolio management by maintaining an optimum balance between the two conflicting objectives of liquidity and profitability.
Liquidity: Liquidity is the bank’s ability to convert its assets into cash quickly without any loss of value. The presence of a high proportion of liquid assets in the total assets of a commercial bank is a sign of its strength. Liquid assets are assets which can conveniently, easily and quickly be converted into cash. The higher the proportion of such assets, the lower the liabilities of a commercial bank and vice versa. This partly means that the bank cannot invest most of its funds in long-term projects or securities. It also implies that the bank will be unable to earn high profits. Therefore a commercial bank must manage its objectives of liquidity so as to gain public confidence and, therefore, the bank should keep all its deposits in cash or in a liquid form, i.e. near cash.
Profitability: Profitability is the prime goal of any commercial bank. All its operations must bring income to enable it to meet its running costs; make payments of interest to its depositors; and yield reasonable return to its owners. Therefore, the bank should manage its portfolio in such a way that it maximises its profits.
Liquidity-profitability dilemma
The objectives of liquidity and profitability are conflicting in nature. They are not compatible. A bank can either achieve the objective of liquidity or that of profitability but not both. Cash, money at call and short notice and bills are
all liquid assets, in varying degrees, but they yield very low income or bring very low profits to the bank. Loans are quite profitable but are less liquid and investments fall in between these two. Banks must be prepared to make payments to its customers as and when they are needed by maintaining a high degree of liquidity, that is, it should have all its funds as cash reserves. However, this will not bring any profits to the bank. On the other hand, banks want to maximise profits by investing their funds in long-term assets, with high profitability but less liquidity. Thus the Liquidity profitability dilemma.
How commercial banks’ balance liquidity and profitability
Given the conflicting nature of the above objectives, the bank has to act very carefully to strike an optimum balance. To solve this conflict, the bank does the
following:
Maintains a certain percentage of deposits in cash form (cash reserve ratio) to cater for the withdraw needs of customers – This maintains liquidity while the lent out amount caters for the profitability interests of the bank. Maintains reserves at the central bank so that in case it is unable to meet the liquidity needs of depositors, it may make use of such reserves. The bank may invest in security and other assets in an effort to make profits. However, the bank should make sure that while it invests for profits, it invests in liquid assets which can easily be turned into cash in case need arises for liquidity, thus striking a balance between liquidity and profitability. As commercial banks lend out money in form of loans, it advances them in such a way that they receive repayments more regularly, e.g. advancing both shortterm, medium-term and long-term loans to ensure a regular and constant payment system.
Commercial banks set a minimum deposit balance on the customers’ account below which customers are not allowed to draw. This maintains sufficient liquidity since accumulated balance cannot be withdrawn, pool up to a large sum that can meet the liquidity needs of depositors. Commercial banks borrow from the central bank, as a lender of the last resort, in situations where they are unable to meet the daily needs of its customers. Commercial banks invest in non-banking activities such as transport, buildings, industries, etc. so as to maintain profitability through earning extra money to supplement bank activity-generated revenue.
Commercial banks charge a fee for the services they provide as a means of raising more revenue to increase profitability and liquidity e.g. bank statements, ledger fee cheques clearing, ATM withdrawals, storage of valuables, etc. Commercial banks discount bills of exchange and earn a profit at the maturity of the bills, i.e. buy the bills from holders at less than their value of maturity, thus achieving profitability. Paying low interest to depositors and charging a high interest on borrowers, thus making profits and bringing in cash. Demanding collateral security to avoid loss of money.
D. Assets and liabilities of commercial banks
Assets
These are possessions of the bank plus its claims on other financial institutions and clients. They include:
Cash in hand and reserves with the central bank;
Deposits with other banks and non-banks;
Loans advanced and overdrafts to customers; and
Fixed assets and long-term investments.
Bank Assets = Bank Liabilities + Bank Capital
Liabilities
These are claims by the outside world. Or they are properties that belong to the
people but not the bank. They include:
Money on fixed, current and saving accounts;
Deposits by other banks and non-banks; and Government deposits in the bank.
A bank uses liabilities to buy assets, which earns its income.
Assets and liabilities are further distinguished as being either current or long term.
Current assets are assets expected to be sold or otherwise converted to cash
within 1 year; otherwise, the assets are long-term (noncurrent assets).
Current liabilities are expected to be paid within 1 year; otherwise, the
liabilities are long-term (noncurrent liabilities).
Working capital is the excess of current assets over current liabilities, a
measure of its liquidity, meaning its ability to meet short-term liabilities:
Working Capital = Current Assets – Current Liabilities
E. Credit creation by commercial banks
ACTIVITY 6.4
Visit any of the nearest commercial bank branches in your locality.
Research on the following:
1. The meaning of credit creation.
2. How commercial banks create credit.
3. Different factors that determine ability of commercial banks to
create credit.
4. Analyse the difficulties met in the process of credit creation by commercial banks in Rwanda.
Credit creation is the process by which commercial banks create credit by lending out custormer’s deposits using the cheque system. Or it is the process by which commercial banks create additional deposits by way of extending loans to borrowers. The volume of money accumulates with time basing on the interest charged.
Commercial banks are required to keep a certain amount of money to meet the daily cash requirements of its customers and this is known as cash ratio.
Assumptions of credit creation
- Assumes one bank with many branches which have cooperation among
themselves;
- A certain cash ratio is given and maintained;
- All banks are willing to advance loans to the borrowers who meet the minimum conditions for borrowing;
- All payments are made through the banks using cheques;
- The money that the bank loans out is deposited back in the same bank or another bank;
- The public is willing to borrow from banks; and
- There should be no government interference.
Example
Assume a single bank with an initial deposit of 10,000 FRW with a cash ratio of
20% and 4 people A, B, C and D.
a. Describe the process of credit creation.
b. Find the rate of credit multiplier and final deposit
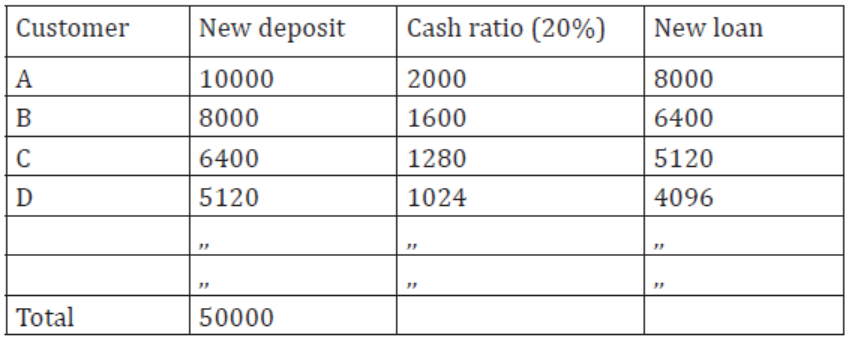
Customer A deposited 10000 FRW to the bank. The bank kept 20 %(2000) as cash ratio and lent out 80% (8000) to customer B. Customer B deposited the same cheque in the same bank. Out of 8000 FRW, the bank kept 20% (1600) as cash ratio and loaned out 6400 to customer C. The process continues until no further loans are available for lending out.
Exercise
Work out, and interpret the following in your exercise books:
1. Given a cash ratio of 20% and an initial deposit of 10,000. Calculate the credit multiplier and final deposit.
2. Given that the initial deposit in the bank is 20,000 FRW and total credit created amounts to 100,000 FRW. Calculate credit multiplier.
3. Given that the final deposit is 80,000 FRW, and cash ratio is 20%, calculate the initial deposit.
4. Given the inital deposit of 20,000 FRW and multiplier of 4, calculate the total credit created.
Determinants of commercial banks’ ability to create credit
Deposits make loans and loans make deposits. Nevertheless, commercial banks do not have limitless powers to create credit. The ability to create credit is thus determined by many factors which include the following:
- Conditions of trade and business in the economy
During times of business prosperity when opportunities for profitable investments are greater, there is a high demand for bank loans from individuals and businesses, thus banks are better positioned to create more credit. Contrariwise, during periods of recession, because of the limited scope of profitable investments, the demand for credit is low, thus the powers to create credit are diminished.
- Banking habits of individuals (Whether people believe in the use of
cheques or cash)
The power of a commercial bank is reduced if people are accustomed to the use of cash in their transactions. On the other hand, the power of a bank to create credit is harnessed if there is increased use of cheques.
- Availability of good securities
If there is availability of adequate amounts of valuable collateral, for instance stocks, bill, bonds and shares, commercial banks can expand their lending activities and hence their powers to create credit are augmented. And if securities are not available in adequate amounts, then their powers for credit creation are limited.
- Willingness to deposit (propensity to deposit)
If individuals are willing to deposit, then credit creation will be high and vice versa.
Cash reserves
The power of commercial banks to create credit depends on the cash reserves. The larger the cash reserves, the greater the credit creation and vice versa.
- Cash ratio
Cash ratio is the proportion of cash kept by commercial banks to meet the daily requirements of the customers. If the cash ratio is high, there will be less credit creation and vice versa.
Propensity to demand loans
If the propensity to demand loans is high, then credit creation will be high and vice versa.
- The country’s monetary policy
If the country pursues an expansionary monetary policy, credit creation is likely to be high. However, if the country is pursuing a restrictive monetary policy, credit creation will be limited.
F. Limitations of commercial banks to create credit in Rwanda
- Difficulty in mobilising savings because of widespread poverty among the people and this reduces money available to lend out.
- Too much government interference in the activities of the banks makes it hard for them to carry out their activities.
- Existence of a large subsistence sector which does not generate enough incomes to the people necessary to save in the banks.
- Lack of credit worthiness among borrowers – Some people take loans from the banks and fail to pay back hence banks get losses.
- Too much liquidity preference. People prefer to hold money in cash rather than depositing it. This reduces the money available with the commercial banks to lend out.
- Low demand for loans because of lack of collateral security such as land, and other property.
- Inflation which limits saving because money may have lost value so people prefer to invest than saving.
- High competition for customers because most of them are located in urban centres and this leads to low deposits; and
- Poor infrastructure characterised by poor roads, telecommunication all limiting the activities.
G. Role of commercial banks in Rwanda
ACTIVITY 6.5
1. With examples in the country, analyse the role of commercial
banks in developing process of Rwanda.
2. State the problems that hinders the smooth operation of
commercial banks activities in Rwanda.
In addition to the services that commercial banks provide to the public, they
play a big role in fostering the economic development of Rwanda as below:
- They advance short-term and long-term loans to the business community.
This facilitates new investment and expansion of the existing ones, thus promoting economic growth and development.
- They also offer loans to customers to improve their standards of living, e.g. to purchase houses, and other expensive consumer goods that they otherwise could not afford.
- They create employment opportunities by employing people as auditors, accountants, managers, tellers, drivers, security guards, cleaners, etc. This helps solve the unemployment problem in Rwanda.
- They mobilise savings from the public by paying interest on deposits.
This encourages flow of funds from savers to borrowers, therefore, encouraging productive investment activities that promote economic growth and development in the country.
- Commercial banks provide technical and professional advice to customers, i.e. investors and business people, which helps them make sound investment decisions, e.g. on best projects to be financed and efficient running of companies, thus creating a healthy and efficient economy.
- Commercial banks pay taxes to the government from their profits made, of which revenue is used to finance various government expenditures.
- Commercial banks facilitate international and domestic trade by making available foreign exchange, letters of credit and money transfer services. This increases the flow of technology, ideas and skills and other resources in the country that facilitates increase in the productive capacity of Rwanda.
- Commercial banks act as agents of the central bank to implement monetary policy since they deal directly with the public. This enables the government through the central bank to regulate economic activities within the economy and achieve specific development goals, for example, controlling inflation in Rwanda.
- They receive payments for their customers, for instance, salaries which promotes effective and efficient planning by consumers and producers.
- Commercial banks facilitate quick and easy means of payments through use of cheques and standing orders. This helps to create money in the public without the central bank having to print more currency.
- They help keep valuable documents and articles of customers such as marriage certificates diplomas, wills, etc.
- They manage the property of the deceased customers and distribute assets as laid down in the will. This avoids conflict and social tension among the public, thus bringing about peace and harmony that is necessary for a conducive investment climate in an economy.
- They help in transforming the economy from a subsistence economy to a monetary economy especially in rural areas through advancing loans to the public for productive activities. This calls for the establishment of banks in most rural areas, thus promoting development.
- They promote technology in the economy, for example through the use of ATMs, SMS banking, all which bring about economic development of the country.
- They facilitate the process of capital formation through the promotion of savings and investment. This, therefore, expands productivity in the economy and breeds economic growth and development.
H. Challenges of commercial banks in Rwanda
Much as the banking business in Rwanda provides a lot of benefits to the
Rwandan economy, it is faced with many challenges which limit its operation and they include, among others, the following:
- High liquidity preference among the public Many people in Rwanda prefer to hold wealth in cash than depositing it with the commercial banks. This reduces the volume of transactions the commercial banks handle, thus reducing their would-be profit earnings to sustain their activities.
- Unfavourable policies against private commercial banks In Rwanda, there is a rate of taxes charged on commercial banks which reduces their profit margin, thus adversely affecting their operation.
- La of well qualified, competent and trustworthy employees for commercial banks
The qualified personnel at times tend to be corrupt and end up misusing the banks’ resources.
- Stiff competition in the banking business
This has led some banks to reduce on the interest rate on loans, increase interest on deposits and introduce very many services. This has increased operating costs, reduced profit and in some cases, banks have even failed to meet running costs, leading to their closure.
- Low savings
In Rwanda, due to massive poverty, the level of savings and deposit is low. This has greatly affected the commercial bank in sustaining its operations due to insufficient deposits.
- The subsistence nature of most Rwandan societies This, together with ignorance of most people in Rwanda, has greatly affected the banking activities in Rwanda.
- The prevalent fear of borrowing and loaning culture Many people in Rwanda are unwilling to go for loans due to limited investment opportunities. This greatly affects the lending potential of commercial banks thus lowering their profits as well.
- Poor communication network in form of roads, telephone system and internet connections This makes the flow of information and transactions difficult between or among the commercial bank branches countrywide.
- Bureaucracy, inefficiency and arrogance by some bank officials This has scared away the would-be customers in some commercial bank branches in the country, thus hindering their operation as well.
- Banking conditions
Some commercial bank conditions tend to discourage the would-be customers who may wish to open up accounts with commercial banks, for example, a high minimum initial deposit.
- High marginal propensity to consume ( MPC) In Rwanda, there is a high MPC implying a low MPS, thereby limiting commercial banks capacity to mobilise adequate savings.
- High government interference
The government of Rwanda at times has fixed high interest rates in order to fight inflation, as opposed by commercial banks, thereby discouraging people from getting loans from commercial banks.
- Insecurity
In most LDCs and Rwanda inclusive, there is political insecurity which has always scared people from depositing their money in the banking system thus reducing on operations of commercial banks.
APPLICATION ACTIVITY 6.2
1. Assess the roles of commercial banks in the economic development
of Rwanda.
2. Explain limitations of the credit creations in the commercial banks
6.2.1.2. Central banks
ACTIVITY 6.6
Refer to the photo below, analyze them properly and explain the
following:
1. Explain what is meant by central bank?
2. Explain the functions of the central bank of Rwanda.
3. Explain the difference between commercial bank and central
bank.
A central bank may be defined as that central monetary institution responsible for the management of the monetary system of the country. It is an institution, which controls all other banks in the country. A central bank is an institution formed by the government with wide ranging powers including the issue of currency and control of other financial institutions in the country. National Bank of Rwanda (NBR) is the central bank of Rwanda.
A. Functions of central banks
Most central banks perform various functions which include the following:
- Acts as government banker, fiscal agent and advisor: Central Banks in
all countries act as the fiscal agent, banker and advisor on all important financial matters to governments of their countries. It conducts the banking accounts of government departments and enterprises; is financial advisor to the government; manages the national debt; and conducts transaction on behalf of the government involving the purchases or sales of foreign currencies.
- Banker’s bank:
A central bank accepts deposits from commercial banks and will, on order, transfer them to the account of another bank. In this way, the central bank provides each commercial bank with the equivalent of a checking account and with a means of settling debts to other banks.It acts as a banker to overseas central banks and international financial institutions, for example, the World Bank, the IMF, etc.
- Issue of the country’s currency:
A central bank enjoys the monopoly of the issue of a country’s currency. No bank other than the central bank is authorised by law to print currency notes. This allows the central bank to have control over the excessive credit expansion by commercial bank and allows for the issuance of uniform currency, thereby achieving the homogeneity characteristic.
- Lender of last resort:
The central bank acts as a lender of last resort to commercial banks and other financial institutions when they run out of cash. In its capacity as the lender of the last resort, the central bank meets all reasonable demands from commercial banks by providing temporary liquidity to commercial banks by making short-term loans to them.
- Keeps a nation’s foreign exchange reserves:
A central bank performs this function in order to keep a favourable balance of payments and to maintain a stable exchange rate. It maintains the stability of internal and external value of the currency.
- Controller of credit:
This is one of the major functions of a central bank. The central bank controls credit by means of various monetary policy instruments such as open market operations, bank rate, legal reserve requirements, moral suasion, selective credit control and special deposit. This is done by supervising the activities of commercial banks and other financial institutions.
- Bank of central clearance, settlement and transfer:
Central clearance implies that it settles the differences of a financial nature between the various commercial banks by making transfers of accounts at the central bank since commercial banks keep their surplus cash reserves with the central bank. It is easier to clear and settle claims between them by making transfer entries in their accounts maintained with the central bank than if each commercial bank entered into separate clearance and settlement transactions with other banks individually.
B. Differences between a central bank and commercial banks
- A central bank is established for public service. Its operations are not basically guided by the profit motive. A commercial bank is guided by the profit motive.
-A central bank is responsible to the government whereas a commercial bank is responsible to its shareholders.
- A central bank controls other banks while a commercial bank does not. I.e. the central bank has a supervisory role over commercial banks.
- A central bank is the only body legally permitted to issue a nation’s currency. Commercial banks are not permitted.
- A central bank does not compete with commercial banks for business and will usually maintain the governments account.
- A central bank generally does not deal directly with the public. It deals with the public indirectly through commercial banks.
- A central bank acts as a lender of last resort to commercial banks when they are in liquidity problems.
- A central bank can formulate and execute a monetary policy whereas a
commercial bank does not.
- A central bank is exclusively owned by the government, and it has a special relationship with the government of the country. A commercial bank can be owned by the government or individuals.
- A central bank deals directly in the foreign exchange market. All foreign exchange earnings are submitted to it and it then meets the foreign exchange requirements of individuals, firms and commercial banks. Commercial banks do not deal directly in the foreign exchange market. If they want to transfer money to foreign countries, they do so through the central bank.
- A central bank is a banker’s bank unlike a commercial bank.
C. Role of central banks
In addition to its traditional functions, the central bank plays crucial roles in development. These include:
- The central bank helps the government in the economic planning process. It provides the necessary financial economic data which greatly facilitates government in its planning process.
- The central bank develops the financial sector for example, it encourages the development of commercial banks which tend to extend credit to stimulate rural activities for the mobilisation of domestic capital required for economic development.
- The central bank through its monetary policy tools, such selective credit control, helps channel credit to the priority areas aimed at improving productivity and investment.
- It regulates and controls the supply and demand for money with the objective of attaining high growth rates in GDP, adequate employment opportunities, price stability, etc.
- Through favourable rate policies aimed at foreign exchange stability, both
the public and private sectors are encouraged to save and invest, thus
promoting economic growth and development.
- It educates and trains bankers which increases efficiency in the banking
sector.
D. Monetary policy
ACTIVITY 6.7
Make research and respond the following questions:
1. What is monetary policy?
2. Explain the objectives of monetary policy in Rwanda.
3. Explain the monetary policy tools that the Central Bank of Rwanda has used in attaining the monetary policy objectives stated in (2) above.
i. Meaning
Monetary policy is the management of demand and supply of money together with the rate of interest in order to influence the level of economic activities. Monetary policy as an instrument of economic stabilisation has been used by various countries to manage their economies. Monetary policy is exercised by the central bank through various tools of monetary authority.
ii. Objectives of the monetary policy
- To maintain domestic price stability;
- To influence the level of employment and attain full employment;
- To influence the balance of payment position of the country;
- To ensure stability of foreign exchange in the country;
- To influence the nature and levels of investment in the country;
- To encourage growth of the financial sector;
- To achieve economic growth;
- Ensure that government deficits are financed at low interest rates;
- Create a broad and continuous market for government securities;
- Maintain a continuously low structure of interest rates;
- Encourage the public to save a larger fraction of its real income; and
- Provide credit at differential interest rates.
iii. Tools/instruments of monetary policy
The central bank has a number of instruments, which can be used to control money supply. The following are some of the tools/ instruments of monetary policy:
- Bank rate/discount rate
This is the interest rate at which the central bank advances money to commercial banks whose reserves are temporarily below the required level. To lower the amount of money in circulation, the central bank increases the rate, therefore, increasing the rate at which banks give loans to the people. To increase money in circulation, the central bank lowers the rate and also the commercial banks lower the lending rate for people who borrow.
- Open market operations (OMO)
This involves buying and selling of treasury bills and bonds to the general public. This is done in order to curb deflationary and inflationary pressures in the economy. When the government wants to increase money in circulation, it buys securities from the people while selling the securities to the people will reduce money from circulation.
- Legal reserve requirement (LRR)
This is the amount of money which by law is supposed to be kept by commercial banks in the central bank. When the central bank wants to reduce money in circulation, it increases the legal reserve requirement, while reducing the legal reserve requirement will increase the money available to lend out.
- Special deposits
The central bank may require commercial banks to create special deposits over and above the reserve requirements. This will reduce the amount of money available to lend to the people, hence reducing money in circulation. This is done during inflation.
- Moral suasion
This is the issuing of persuasive instructions by the central bank to commercial banks soliciting their co-operation in making its monetary and credit policy successful. The central bank informally asks the commercial banks to contract credit during inflation, and to expand credit during a slump. Although not backed by law, commercial banks will always agree.
- Selective credit control
The central bank can instruct commercial banks to favour or disfavour certain sectors to control the flow of credit into different activities in the economy. It aims at encouraging certain productive activities and discouraging others. The central bank issues directives to commercial banks to give or not to give loans for any specific purposes.
- Marginal reserve requirement (MRR)
This is collateral security (requirement) needed by the commercial banks before giving out loans. When the banks want to increase money in circulation, it sets a lower requirement while to reduce the amount of borrowing, the bank asks for a high margin requirement.
- Currency reform
This is the last policy carried out when all others have failed to reduce money in circulation. Here the central bank introduces a new note (currency) to replace the worn out notes or (money that has lost value). One single note will be equal to large sums of currency which has lost value. People are required to take back the old notes for new currencies.
iv. Applicability of monetary policy tools
Some monetary policy tools have efficiently helped in achieving monetary policy objectives in Rwanda. This is seen below;
- Open market operations (OMO)
This consists of the BNR intervention on the money market to mop up or to inject liquidity in the banking system and keep the reserve money on the desired path. These open market operations include notably repos or reverse repos operations, treasury bills issuance, standing deposits facility and standing lending facility and refinancing window.
- Reserve requirements
Depository institutions (commercial banks) are obliged to hold minimum reserves against their liabilities, predominantly in the form of balances at the central bank. There are three reasons for imposition of reserve requirements (RR): monetary control, liquidity management and prudential. The current reserve requirement ratio is 5%. Changes in reserve requirements affect the liquidity of the banking system and its capacity to create loans.
- Foreign exchange intervention
The National Bank of Rwanda intervenes in the foreign exchange market, among other reasons, in order to defend the exchange rate and to achieve a desired amount of international reserves. The intervention in the foreign exchange market directly affects reserve money and hence has a direct impact on overall liquidity in the economy and the stance of monetary policy.
v. Limitations of monetary policy in Rwanda
The implementation of monetary policies in Rwanda has not been very successful due to many reasons which include some of the following:
- Existence of large subsistence sector which limits the operation of the
monetary policy, since most transactions are still carried out through barter exchange.
- Most commercial banks in Rwanda are foreign-owned or act as branches of other banks abroad. This means that their liquidity needs are addressed by their mother banks abroad which make implementation of monetary policies difficult.
- Corruption and lack of self-commitment among bankers which makes some monitory policy tools ineffective, for example selective credit control, as loans go to non-priority sectors.
- High rate of liquidity preference among people due to ignorance and or general lack of confidence in the banking sector, thus making it difficult to implement the monetary policy tools.
- Lack of collateral security by most people in Rwanda to act as guarantee for loan acquisition hence few qualify for loans. Therefore, even if the central bank wanted commercial banks to increase the level of lending, many people will not qualify for bank loans since they lack collateral security.
- Limited investment opportunities together with an unconduncive investment climate that discourages people from getting loans, for example, high interest rates on business loans, high taxes on investors, etc. which make monetary policy tools ineffective.
- Poorly developed money markets which renders some tools ineffective such as Open Market Operation (OMO), therefore there will be no buying and selling of securities and thus the central bank cannot use such a policy to regulate the amount of money in circulation.
- Most people in Rwanda prefer investing their money in real assets such as land, cattle, houses, etc. than saving it with banks. This is due to low interest given to depositors thus discouraging them from saving and thus affecting the operation of monetary policy tools.
- Conflict between political interest and monetary policy. The government in most cases wants to increase wages of workers, increase prices of agriculture products, etc. However, such policies may conflict with the existing monetary policy.
- Insufficient supervisory capacity of central bank over commercial banks that leads to excess liquidity with commercial banks thus ending up giving excess credit than what the central bank would wish to.
- Existence of insecurity which leads to high economic uncertainties and thus reducing deposits with the commercial banks, therefore, affecting the success of monetary policies.
- Poor infrastructure in some parts of the country which reduces the bank services thereby reducing savings mobilisation in rural areas; and
- Foreign interference that affects the smooth operation of central bank and execution of monetary policies as exemplified by conditions from the World Bank, the IMF and other donor agencies.
APPLICATION ACTIVITY 6.3
The National Bank of Rwanda (NBR) is mandated to ensure prince stability among others through the monetary policy. Identify the problems faced by central banks in developing countries.
6.2.2. Non-Banking Financial Institutions (NBFIs)
ACTIVITY 6.8
Analyse the photographs in Figure 4 below, identify and explain:
1. Such institutions.
2. Give other examples of such institutions in your locality and the
role to your community around them and Rwanda in general.
3. What are the functions of such institutions?

Rwanda Development Bank
Figure : Non-banking financial institutions
6.2.2.1. Meaning of non-banking financial institutions (NBFIs)
Non-banking financial institutions (NBFIs) are financial institutions that accept deposits from people but do not create credit. They include development banks, for example Banque Rwandaise de Development (BRD), insurance companies, cooperatives, post office savings bank, housing and building societies, credit and savings societies, discount houses, and development housing companies, for example Housing Bank of Rwanda.
These institutions operate in all sectors of productive investment in the economy of Rwanda, for example agriculture and livestock, manufacturing industry, education and health, ICT, transport and related facilities, micro finance, etc.
6.2.2.2. Examples and roles non-banking financial institutions
a. Development Bank of Rwanda, commonly known as Banque
Rwandaise de Development (BRD)
The Development Bank of Rwanda began its operation in 1967, as a longterm financial service provider, with the financing geared towards national development projects.
As of April 2011, the total assets valuation was approximately 72 billion, FRW with shareholders’ equity of approximately 25 billion FRW. The BRD has undergone re-structuring, re-Organisation and re-capitalisation, to repair the damage incurred during the 1994 Rwanda genocide. It has also financed rural development projects, since almost 90% of thepopulation live in rural areas.
b. Insurance companies
These are business institutions that provide coverage, in form of compensation resulting from loss, damages, injury, treatment, or hardship in exchange for premium payments. They pool clients’ risks to make payments affordable for the insured. The role of the insurance companies has been very remarkable in mobilisation of savings and investments in the social sector for so many years. They also offer various types of services ranging from life, retirement fund and medical fund, automobile, to property coverage There are many insurance companies in Rwanda for example Rwanda Social Security Board (RSSB former RAMA), SONARWA SA, SORAS SA, UAP, Phoenix, AAR Health Services, Military Medical Insurance (MMI), Prime Life Ltd, etc.
c. Savings and credit co-operatives organisations (SACCOS)
These are co-operatives formed to mobilise savings from members and lend some of the savings to members. Members normally make deposits on a weekly or monthly basis. They provide financial services to their members particularly facilities for saving and borrowing. Because the SACCOs are owned by the members, they are able to charge a lower rate of interest than the commercial banks. In many cases, members must be from a specific geographical location or working in the same industry for example Umurenge SACCO, Umwalimu SACCO, etc.
d. Microfinance institutions (MFI)
Micro-finance or micro lending is defined as the provision of credit to people who are unable to obtain loans or credit from commercial banks because their only security is the fact that they have a regular source of income. In Rwanda, there are many microfinance entities varying from money lenders, merchants, pawn brokers, loan brokers, burial societies, and savings groups to the more complicated rotating savings and credit associations. All these are run on a very small scale compared to the bigger financial institutions in terms of the amount they handle. Examples of microfinance institutions in Rwanda
include:
- AB Bank Rwanda
- Unguka Bank
- Urwego Opportunity Bank
- Zigama CSS
- Goshen, and
- Vision Finance Company, etc.
Characteristics of MFIs
- They are not deposit taking institutions and are, therefore, self-funding, unlike the formal banks.
- Interest rates charged are high compared to formal banks because the average value of the loans is low while costs of granting and administering are high and fixed and a higher incidence of bad debts because of the target market’s higher risk profile.
- MFIs operate out of low cost, unsophisticated branches. Customers do not feel intimidated to walk into a branch and are served by tellers who speak their language.
e. Functions special to NBFIs
- Brokers of loanable funds: They intermediate between savers and investors. They sell indirect securities to the savers and buy primary securities from investors. They thus take risk on themselves and reduce the risk of the lenders because low returns on some assets are offset by high returns on others.
- Mobilisation of savings for the benefit of the economy: By providing expert financial services such as easy liquidity, safety of the principal amount and ready divisibility of savings into direct securities of different values, they mobilise more funds and attract a larger share of the public’s savings.
- Direct funds into investment channels: By mobilising the general public’s savings, NBFIs channel them into productive investments and this directs public savings into investment, aids capital formation and economic growth.
- Stabilisation of capital markets: NBFIs trade in the capital market in a variety of assets and liabilities and in turn equilibrate the demand for and supply of assets. By functioning within a legal framework and rules, they protect the savers’ interests and create stability in the capital market.
- Provision of liquidity: NBFIs provide liquidity and they do this by advancing short-term loans and financing them by issuing claims against themselves for long periods and diversifying loans among different types of borrowers.
f. Role of non-banking financial institutions
- Provision of employment opportunities to the nationals through setting up banks and people are employed as accountants, managers, loans officers, etc.
- Provision of security to property and people’s lives, for example insurance companies.
- They act as intermediaries between potential savers and investors which creates assets and liabilities.
- They give or offer loans for development of production ventures such as small scale industries, agriculture, etc. which commercial banks are reluctant to support.
- They act as avenues through which the donor, government and nongovernmental organizations channel their funds to facilitate development programs.
- They help in transformation of the rural sector from subsistence to monetary economy.
- Non- banking financial institutions are spread all over the country, for instance credit unions, development banks, insurance companies, thus
helping in mobilisation of savings which are then channeled to local rural-based projects.
- They help in indigenization of the economy, i.e. they advance loans to local entrepreneurs, women groups, the youth, etc. who are neglected by commercial banks.
- They expand government revenue through paying taxes, on which government can invest in development programs.
g. Challenges of non-banking financial institutions in Rwanda
- Corruption, mismanagement and lack of self-commitment among employees which makes some non-banking financial institutions ineffective.
- Lack of credit worthy customers who normally fail to pay back in time or even completely fail to pay back.
- High illiteracy and ignorance levels among the majority of the population, thus not able to save with non-banking financial institutions and at times are not aware of services rendered by such institutions.
- Government influence through high taxes, interest rate determination, all which do not favour these financial institutions.
- Low savings among the population due to poverty among the majority of the population in Rwanda.
- Existence of insecurity which leads to high economic uncertainties and thus reducing activities of non-banking financial institutions, therefore, affecting the successful operation.
- Poor infrastructure in some parts of the country which reduces the bank services thereby reducing savings mobilisation in rural areas.
- High marginal propensity to consume ( MPC): In Rwanda, there is a high MPC implying a low MPS thereby limiting the capacity of nonbanking financial institutions to mobilise adequate savings.
- Existence of large subsistence sector which limits the operation of nonbanking financial institutions, since most transactions are still carried out through barter exchange.
- High competition from banking financial institutions and nonbanking financial institutions themselves.
- Foreign influence especially from the International Monetary Fund (IMF) and the World Bank.
- The prevalent fear of borrowing and loaning culture: Many people in Rwanda are unwilling to go for loans due to limited investment opportunities. This greatly affects the lending potential of non-banking financial institutions, thus lowering their profits as well;
- Lack of well qualified, competent and trustworthy employees for non banking financial institutions. The qualified personnel at times tend to be corrupt and end up misusing the banks resources.
APPLICATION ACTIVITY 6.4
1. There are quite a number of non-banking institutions in Rwanda who accept deposits from their clients on daily basis and these institutions have dramatically played significant role in the economy of the country. With specific examples of nonbanking financial institutions, explain the roles of NBFIs to the development of Rwanda.
2. What are the challenges that NBFIs faces in Rwanda.
END UNIT ASSESSMENT
1. Distinguish between banking and non-banking financial institutions
2. Explain the functions, role and limitations of commercial banks in Rwanda.
3. Given a cash ratio of 20% and an initial deposit of 100,000.
Calculate the credit multiplier and final deposit.
4. State the functions of the Central Bank of Rwanda.
5. Explain how BNR has influenced economic activities in Rwanda through monetary policy tools
6. By giving examples, explain the roles on non-banking financial institutions in the economic development of Rwanda.
UNIT 7 INFLATION
Key Unit Competency: Describe the impact of inflation on an economy.
INTRODUCTORY ACTIVITY
In a country X, the price of fuel increased from 1000 Francs to 1100 Francs per liter and as a result, the price of nearly all commodities increased as well. People go shopping with a sack full of money and purchase few commodities.
Respond to the following questions:
i. Explain why the increase of price of fuel leads to increase of the prices of commodities.
ii. Discuss the effect the increase in the general prices brings to the economy.
iii. Apart from increase in price of fuel, in your view what are other causes for the increase in price?
iv. What is the relationship between prices and purchase power of money.
v. What do you call the situation where there is persistent increase of prices of commodities in different periods?
7.1. Meaning of inflation
ACTIVITY 7.1.
Discuss how the following shall affect the general price level in the country,
1. When there is continuous unnecessary spending by the public and the government.
2. When there is a continuous political turmoil in the country that disrupts human settled life and peace.
3. When there is too much environmental degradation, deforestation that changes the climate and seasons.
4. When the central Bank has printed too much money than production capacity.
7.1.1. Definition
Inflation is a situation where there is a persistent rise in the general price level. The general price implies an average of different commodity prices.
Or Inflation refers to persistent increase in the general price level. Prices of most goods and services continuously rise. Inflation takes into account a general increase in price of a variety of commodities and not a single commodity. The following should be considered when defining inflation:
- There is scarcity of commodities in markets,
- Aggregate demand is greater than aggregate supply,
- The country’s currency loses its real value
- Prices are ever increasing
Inflation rate is the speed at which the general price level is increasing. It is calculated as shown below.
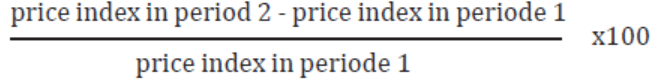
7.1.2. Terms used in inflation
- Stagflation: This refers to the situation where there is coexistence of both inflation and unemployment in an economy.
- Deflation: This refers to the persistent fall in the general prices of goods and services in an economy.
- Reflation: This is the deliberate government policy of forcing prices upward to recover to recover the economy from depression.
- Suppressed inflation: This refers to the situation where aggregate demand exceeds aggregate supply but prices are not allowed to rise because of government price control.
- Open inflation: This refers to inflation that is not suppressed ie prices are permitted to rise without being interfered with by the relevant authority.
- Underlying inflation: This is inflation calculated by not considering the prices of foodstuffs.
-7.1.2. Terms used in inflation
- Stagflation: This refers to the situation where there is coexistence of both inflation and unemployment in an economy.
- Deflation: This refers to the persistent fall in the general prices of goods and services in an economy.
- Reflation: This is the deliberate government policy of forcing prices upward to recover to recover the economy from depression.
- Suppressed inflation: This refers to the situation where aggregate demand exceeds aggregate supply but prices are not allowed to rise because of government price control.
- Open inflation: This refers to inflation that is not suppressed ie prices are permitted to rise without being interfered with by the relevant authority.
- Underlying inflation: This is inflation calculated by not considering the prices of foodstuffs.
- Headline inflation: This is inflation calculated by considering the prices of foodstuffs.
- Inflationary spiral: This is a situation where the increase in price leads to increase in the demand for high wages which in turn increases the cost of production and employers react by increasing the prices and the process continues.
APPLICATION ACTIVITY 7.1 Headline inflation: This is inflation calculated by considering the prices of foodstuffs.
- Inflationary spiral: This is a situation where the increase in price leads to increase in the demand for high wages which in turn increases the cost of production and employers react by increasing the prices and the process continues.
APPLICATION ACTIVITY 7.1
After making research, describe whether inflation is desirable or undesirable to an economy and suggest reasons to support your argument.
7.2. States, Types and Causes of inflation
ACTIVITY 7.2.
Study the table below and answer the questions below it.
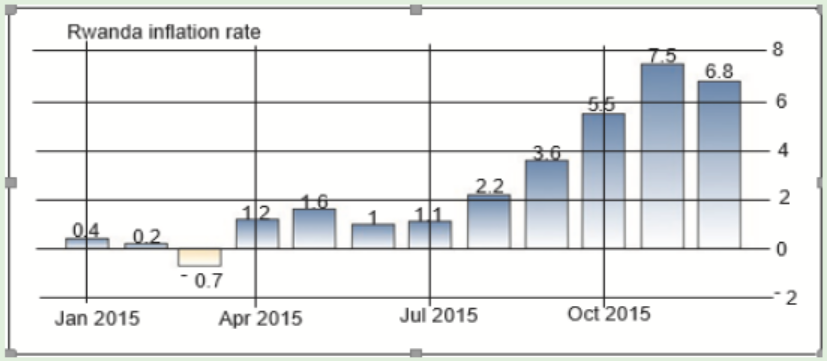
1. Which month of the year 2015 had the lowest inflationary rate?
2. What could be the reasons for the low rate of inflation
3. Which month had the highest inflationary rate
4. How do you call the inflationary rate of June and July2015
5. What might have been the causes of the change in prices between October and November 2015?
7.2.1 States of inflation
We may categorise inflation by looking at the speed of the change in the general price level or by the cause of the increase in the general price level. Using the degree/ speed of the increase we get the following states:
Creeping/ mild/ gradual inflation: This is where there is a slow increase in the general price level and the inflation rate is lies between below 3%. It gives an incentive to producers by widening their profit margins. It encourages investment and production.
Walking/Trotting inflation: This occurs when the rate of inflation lies between is 3-9%. It is a warning to the government to starting implementing policies that may reduce this rate. It shows that conditions are moving towards the worse.
Running/galloping inflation: This occurs where the rate of inflation is between 10-20%.
Hyper/ runaway inflation: This is where the speed at which prices are increasing is 20% and above. It is the worst inflation which calls for stringent government interventions to control it. There is too much money in circulation purchasing too few commodities.
7.2.2 Types of inflation
ACTIVITY 7.3
A. “It is in May and the current financial year is coming towards the end. A new financial year is yet to start on 1st July. A new national budget is yet to be presented to the Parliament. It is expected that the new budget will pronounce some increment on the existing indirect taxes and introduce some new ones.”
B. “There is a change in the weather conditions that have brought about dry spell that has affected crops in the field. This has been followed by Elnino that has left most agricultural fields flooded.”
Discuss the likely outcomes of the above on the economy in the current period and in the forthcoming period.
As stated earlier, inflation may be categorized according to the cause of the increase in the general price level. This gives us the following types.
- Structural inflation.
- Cost push inflation.
- Demand pull inflation.
- Imported inflation.
- Monetary inflation.
- Speculation inflation.
a. Structural inflation. This occurs when supply is kept low by factors that disrupt production of goods and services. There is low supply of commodities which does not correspond with the available demand. This keeps pushing prices upwards. It is also called bottleneck or scarcity inflation. Such factors bring down the volume of production.
Causes of Structural inflation
- Unfavorable changes in weather conditions.
- Foreign exchange shortages.
- Collapse of supply routes.
- Outbreak of instabilities.
- Poor land tenure systems.
- Breakdown of machinery.
- Mismanagement in the economy.
b. Cost push inflation
Cost push inflation is also called supply inflation or sellers’ inflation. It is the persistent increase in the prices of goods and services brought about by increase in the cost of production. Higher costs of production can decrease the aggregate supply (the amount of total production) in the economy. Since the demand for goods hasn’t changed, the price increases from production costs are passed onto consumers creating cost-push inflation.
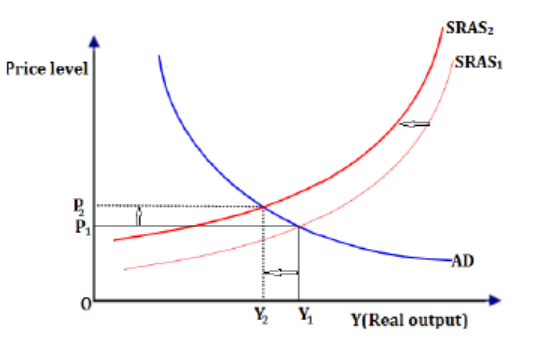
P represents price
Y represents output
AD represents aggregate demand
SRAS represents short run aggregate supply
From the figure above it can be seen that when the costs of production increase,
aggregate supply reduces from SRAS1 to SRAS2 output reduces from Y1 to Y2
leading to price increase from P1 to P2.
Causes of Cost push inflation
- Continuous increase in wages.
- Continuous increase in price of fuel which increases transport cost.
- Increase in price of raw materials.
- High interest rates on borrowing which makes the cost of borrowing high.
- Increase in rent.
Cost push inflation appear in the following forms:
i. Wage – price inflation. This occurs when an increase in wages leads to increase in the costs of production resulting into increase in prices of commodities.
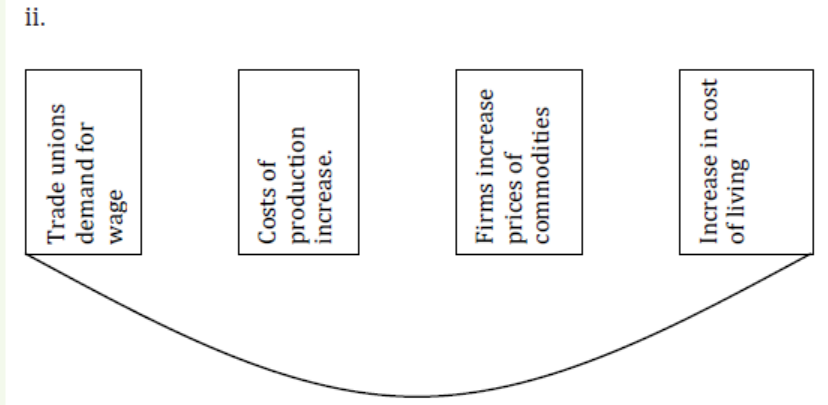
iii. Price – wage inflation. This occurs when there is an increase in prices of commodities which leads to increase in the cost of living forcing workers to demand for increase in wages. This in turn increases the cost of production leading to further increase in prices.
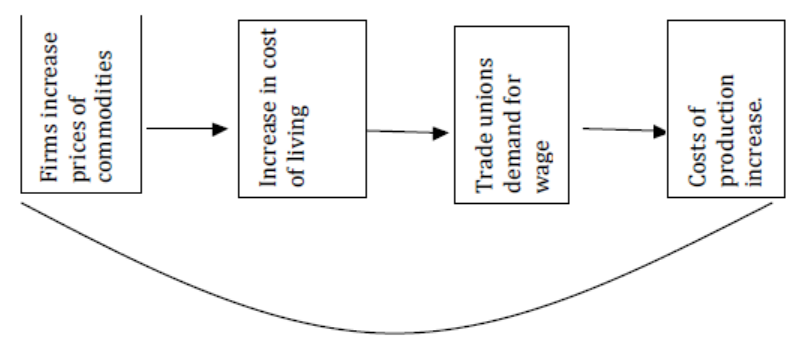
vi. Profit – push inflation. This occurs when prices are continuously increased as a result of producer’s desire to make high profits. It may also be called profit mark inflation.
c. Demand pull inflation
This is where there is a continuous increase in general price level as a result of a continuous increase in aggregate demand where aggregate demand exceeds aggregate supply in conditions of full employment. As aggregate demand keeps rising, the general price level also keeps rising further. This is because there is no corresponding increase in aggregate supply.
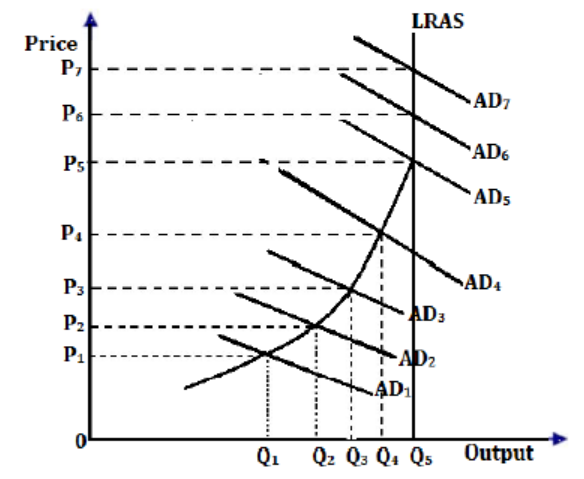
P represents price
Q represents output
AD represents aggregate demand
LRAS represents long run aggregate supply
From figure above, it can be seen that when demand aggregate increases from AD1 to AD7, the price level increases from P1 to P7. Up to AD5, quantity supplied increases with quantity demanded and its at that point that resources are fully utilized. Increase in AD beyond Q5, is what Keynes described as true inflation, where ASS is constant so any increase in demand will be inflationary since supply cannot be increased to cater for the increasing demand. Demand pull inflation in terms of income determination, occurs when aggregate expenditure C+I+G+(X-M) is too high that it exerts an upward pressure on the price level.
Causes of demand pull inflation
- Increase in population.
- Increase in government expenditure which increase money supply.
- Increase in investment expenditure.
- Increase in money supply.
- Uncontrolled inflow of foreign exchange.
Demand pull inflation can be reduced by
- Increasing direct taxes to reduce disposable incomes.
- Implementing a restrictive monetary policy by the central bank e.g selling securities to the public or increasing the minimum lending rate
(bank rate).
- Controlling population growth rates. This reduces consumption expenditure.
- Reducing government expenditure on non productive ventures.
- Reducing money supply.
- Reducing wages and/ or keeping them constant (wage freeze).
- Reducing exports to avoid scarcity of commodities.
- Increasing imports to expand aggregate supply.
d. Imported inflation
This is inflation that results from importing goods from countries affected by inflation. Commodities are imported when their prices are already high. Transports costs, import and /or export taxes, and other expenses involved in lead to further increase in price of the imported commodity.
e. Monetary inflation
This is inflation that results from continuous increase in money supply. The explanation for this kind of inflation is expressed in Irving Fisher’s theory of money
MV = PT according to Irving Fisher’s quantity theory of money. Where
- M is the amount of money in circulation.
- V is the speed at which money changes hands and this depends on the level business activity.
- T is the transaction level.
- P is the general price level.
But V and T are assumed constant. Thus continuous increase in M leads to a corresponding increase in P. When there is an increase money supply, it translates into an increase in aggregate demand. This may push the prices upwards if there isn’t a corresponding increase aggregate supply.
f. Speculation inflation
This is inflation that comes as a result of speculation by sellers. Sellers foresee a drop in supply in the future. Commodities are available in the current period but sellers hoard them with the intention of selling them in the future when there is scarcity. This creates an artificial shortage which in turn creates a favourable ground for sellers to increase prices.
7.2.3 Causes of inflation
ACTIVITY 7.4
Make research on the various factors that bring about continuous inflationary tendencies in an economy.
- Political instabilities. Political instability reduces production thereby creating scarcity of goods and services. It also increases government expenditure and money supply leading to inflation.
- Increase in government expenditure. This increases money supply and aggregate demand. If this is not followed by a corresponding increase in aggregate supply, then it will result into inflation.
- Reduction in production. This may be due to a number of factors. It reduces supply of goods and services creating shortages in markets. This leads to increase in prices.
- Growth of underground economy. This may lead to uncontrolled inflow of incomes and increase in aggregate demand e.g smuggling of commodities to foreign markets reduce supply in the domestic market.
- High population growth rates which will lead to increases aggregate demand. It may also reduce aggregate supply by putting pressure on the available resources like land.
- Inadequate supply of resources. Scarcity of factor of production like raw materials, land, capital etc keeps production and aggregate supply low leading to increase in the general price levels.
- High fuel costs increases costs of production leading to cost push inflation.
- Natural calamities reduce aggregate supply leading to shortages resulting into high prices.
- Practice of monopoly companies. These firms continuously increase prices of their commodities in order to widen their profit margins. This results into profit push inflation.
- Deficit financing. This increases money supply pushing aggregate demand to high levels exceeding aggregate supply. This leads to continuous increase in the general price levels.
- Mismanagement of the economy. This reduces aggregate supply by limiting production of goods and services.
- Structural breakdowns in production lines. Breakdown of machinery, disruption of supply routes, etc brings down production creating scarcity of goods and services. This leads to structural inflation.
- Import of raw materials and other inputs as well as luxuries at high prices increases prices of commodities in the domestic market.
APPLICATION ACTIVITY 7.2
1. Basing on the findings from research conducted, Inflation
arises when aggregate demand exceeds aggregate supply in the
condition of full employment level of national income.
Explain that type of inflation and discuss the factors that increase
aggregate demand.
2. Rwanda imports food items like Cooking Oil, Rice, and Caned Fish.
Describe what would be the effect of the following on the price of
these commodities.
- Continuous increase in price of these commodities in exporting
countries.
- Increase on transport costs on importing routes.
- Increase in taxes both import and export duties on these items.
7.3. Effects of inflation and measures to control it.
ACTIVITY 7.5
The income of the consumer is fixed at 300,000frw per month while the price of a kilogram of rice is 1500frw per kilogram. Assuming this consumer was to spend all her income on rice:
i. Determine how many kilograms she would purchase.
ii. Determine what will happen to the amount of rice she can purchase if the price kept increasing to 2000, 2500 3000 and eventually to 4000.
From your findings, explain to your bench mate the effect that continuous increase in the general price level has on the purchasing power of the consumers with fixed incomes.
7.3.1 Effect of inflation
Positive effects of inflation (mild inflation)
- Encourages investments because of increase in the profit margins
- Gives incentive to work
- Encourages borrowing since the borrowers pay back in the inflated amount.
- Increased to stock of assets
- Creates employment through investments
Negative effects of inflation
- Fixed income earners loose because their income loose its real value. The amount of goods and services that an amount of nominal income can purchase reduces.
- Discourages savings. Savings loose their real value. People tend to prefer converting their incomes into fixed assets.
- Discourages lending. Those who lend out part of their incomes are paid when it has lost value.
- It creates BOP problems. This is because exports are discouraged and reduces export revenues.
- It increases the costs of production. Workers demand for wage increments through their trade unions, because of increase in the cost of living. The cost of raw materials and other inputs increase. All this makes production expensive.
- Plans fail. This is because money that is planned to be used in the implementation of economic plans looses its real value. For instance, contracts have to be readjusted to cater for the effect of inflation.
- Farmers loose. By harvest, farmers receive incomes that have lost value (depreciated) different from what they expected during planting season.
- It encourages rural urban migration. The disillusioned rural populations move to urban areas with the hope of accessing improved livelihoods. This worsens the situation by creating other evils like open urban unemployment.
- Local currency looses its value in terms of other currencies. Importation becomes expensive. This creates further scarcity of essential imported commodities like medicines, raw materials etc.
- It may cause instabilities in the society. For instance, it may lead to workers strikes, social unrest and discontent etc.
7.3.2 Policy measures to control inflation
ACTIVITY 7.6
Hold discussion on the measures that can be applied to reduce the rate of inflation.
The following are measures to control the inflation in the economy:
- Reduction of money supply. This can be done through restrictive monetary policy e.g selling securities to the public, increasing the Bank rate and Legal reserve requirement etc.
- Price controls. The government may use maximum price legislation to prevent further increase in prices.
- Reduce export of scarce commodities. This helps to prevent creating further shortages of commodities that are already scarce.
- Reduce wages or keep them constant (wage freeze). This helps to keep costs of production and aggregate demand low. This stabilizes prices.
- Increasing direct taxes. This reduces the disposable incomes of consumers and help to reduce aggregate demand and prices.
- Reduce government expenditure on non-productive ventures. This helps to reduce aggregate demand.
- Control population growth rates. This also checks on increase in aggregate demand and controls demand pull inflation.
- Maintain political stability. This ensures continued production and supply of goods and services which keeps prices low. It also reduces unnecessary expenditure on non-productive ventures.
- Encourage domestic and foreign investments. This increases supply of commodities in markets and keeps prices low.
- Increase production. Measures should be put in place that can increase production and supply of goods and services.
- Import scarce commodities. Supply of scarce commodities can be increased through importation. Increase in supply keeps prices low.
- Reduce imports from countries affected by inflation. This prevents imported inflation.
- Carry out currency reforms. This may be applied during periods of hyper inflation. The highly depreciated currency that has lost value may be replaced by a new currency.
- Control the distribution channels of scares commodities. This helps to avoid situations where profit motivated sellers increase prices to make huge profits.
APPLICATION ACTIVITY 7.3
To what extent is inflation harmful to an economy especially to people with a fixed income like pensioners?
7.4. Relationship between inflation and unemployment.
ACTIVITY 7.7
Make research on the illustration of Philips curve and indicate how it explains the relationship between inflation and unemployment.
The Phillips curve was introduced by an American, A W Phillips in 1958. It shows the relationship between inflation and unemployment. According to Phillips, there is an inverse relationship between inflation and unemployment. A rise in the rate of inflation leads to a decrease in the rate of unemployment. During inflationary periods, there is too much money in circulation, and aggregate demand is high to stimulate investment and employment creation. This reduces the rate of unemployment.
PHILLIPS CURVE.
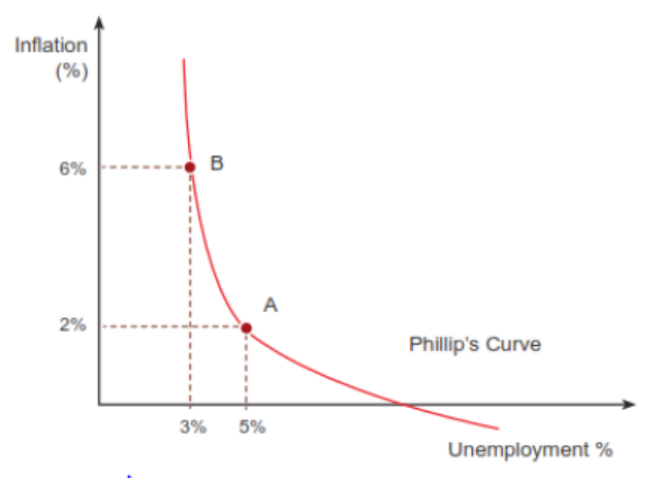
Phillips argument informed monetary and fiscal policies in the 1960s but only worked in the short run. Later events went against this argument of Phillips especially in the 1970s when there was a rise in both inflation and unemployment a condition termed as stagflation. Phillips argument could not generate policy measures to solve both unemployment and inflation at that time.
However, as opposed to Phillips argument, experience has proved that hyperinflation may lead to unemployment as shown below.
- During periods of hyperinflation, money loses its real value. People prefer to invest their money into assets than using it to carry out ventures that may create employment opportunities. The rate of employment creation reduces.
- Cost push inflation makes production expensive. This may forces producers to scale down the production volumes. As a result, some resources are laid off creating unemployment.
- Unemployment implies that most resources are idle and not involved in production. There is no output from such resources. Thus total output is kept low. This also implies that aggregate supply is low. Any change in aggregate demand therefore will create an inflationary tendency.
- During inflation, money loses real value. The real wage of the workers keeps reducing. This makes trade unions to demand for wage increments. This increase further the costs of production forcing producers to scale down their scales of production. Reduction in production size implies lying off some resources which become unemployed.
- Inflation reduces the purchasing power of consumers. This reduces the market for producers who respond by keeping their production low. This reduces the rate of employment creation which in turn breeds unemployment.
APPLICATION ACTIVITY 7.4
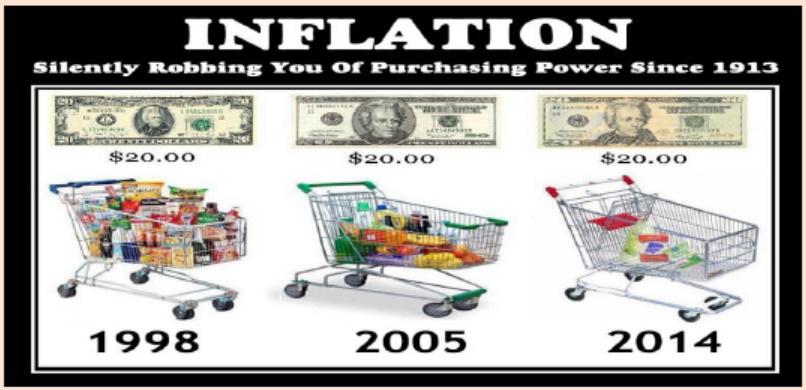
Source:https://www.google.com/search?q= inflation,money +and+shopping +photos
&tbm = isch&source =iu&ictx=1&fir=_ F0A5F42MEKTzM% 253A%252 CJRvuNcYgie
-F4M%252C_&vet= 1&usg=AI4_ -kSII1q38tTirmf2wHbM_ t5PvWTaKQ&sa = X&ved=
2ahUKEwj_gKbF46LlAhWtAm MBHT8ADBQQ9QEwAXoECAYQCQ #imgrc = _&vet=1
i. From the figure, comment on the differences in the basket of goods among three periods.
ii. From the research and discussions carried out discuss the view “Inflation not only affects just goods and services but also wages and incomes.
iii. Comment on the relationship between inflation and the general welfare.
SKILLS LAB
Visit nearby traders in your school community and investigate how they fix prices of commodities .After, select any 4 food staffs and fix their prices in different periods and provide a convincing advice on the dangers of frequent increase in prices on traders’ profitability, the welfare of the buyers and the economy as a whole. Student teachers should apply the knowledge from research to create their businesses in the school environment.
END UNIT ASSESSMENT
1. Explain reasons why inflation and deflation are considered to be economic problem.
2. Discuss the likely impact on the rise in the global commodity prices on industrial economy
3. Assess the effectiveness of monetary policy in controlling inflation.
4. Explain the factors responsible for the continuous rise of the general price levels in most developing economies.
5. Analyse the outcomes of hyperinflation on an economy.
6. 6. Examine the measures that your country has adopted to control the rate of inflation.
7. With the help of an illustration, explain the relationship between inflation and unemployment according to A. W. Phillips.
8. Discuss the view that hyperinflation leads to unemployment.
UNIT 8 UNEMPLOYMENT
Key Unit competence: Analyze the impact of unemployment on economic development.
INTRODUCTORY ACTIVITY
When you move in the streets of Kigali/or the cities in Rwanda:
- What do you normally observe people doing?
- What do young women and men normally carry on those streets?
- How can the puzzle of people carrying files looking for job be solved?
- Many young people graduate with high hopes of getting a job, do they really get the job?
- What do you think are causes of not getting the job they want?
8.1. Introduction to unemployment
On any given day, during economic busts and economic booms alike, many people are unable to find desirable employment despite their best efforts to look for employment. Understanding the reasons for this fact is a primary concern for economists and policymakers, since it is necessary for designing good labor market policies. Unemployment not only creates hardships for those it encompasses, but it also seems to represent a vast pool of idle economic resources.
Unemployment is one of the economic problems facing countries and their governments.
ACTIVITY 8.1
Visit a nearby firm/industry/hotel/restaurant/trading Centre/market/
construction company and ask some of the young people in those areas
who are looking for jobs, the nature and kind of jobs they are looking
for. What do you notice? Are all those people willing to take any kind of
the job at any given wage? Why do you think some are selective in taking
the job
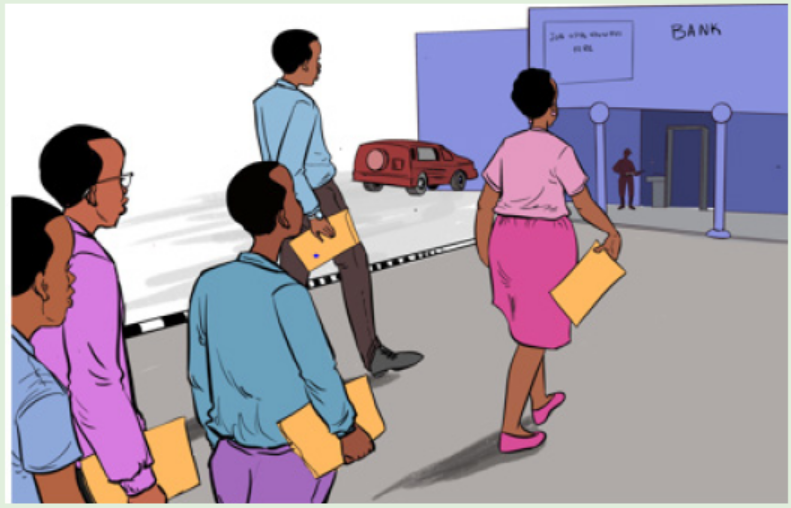
8.1.1. Meaning and Nature of unemployment (voluntary and involuntary )
Unemployment is an economic condition where resources (labour) lies idle and is not doing any work irrespective of the ability and willingness to do work. All resources (factors of production) can be unemployed. However, unemployment is usually used with labour force. It is used with the active population and does not consider the sick, the very old, fulltime students etc.
Classical economists believed that unemployment was a result of excess supply of labour at high wages. High wages reduce the demand for labour. The difference between labour supply and labour demand causes unemployment. A reduction in wages will enable employers to absorb the excess labour and drive the economy towards full employment.
Keynesian economists however explain unemployment from demand side. A deficiency in demand for goods and services leads to unemployment. Demand for labour is derived demand and rises out of demand for goods and services that labour helps to produce.
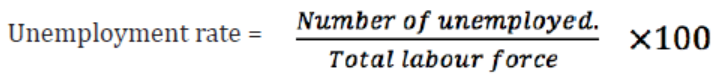
8.1.2: Nature of unemployment:
Keynesian economists divide unemployment into many different categories. The two broadest categories of unemployment are voluntary and involuntary unemployment.
a. Voluntary unemployment
This refers to the situation where jobs are available but people are not willing to work at the ongoing wage rate.
Causes of voluntary unemployment
- Presence of low wages: The low wages may not attract the labour to work even if the job is available.
- Desire to live on personal or family wealth: Sometimes labour may live on already accumulated wealth that may be personal or for the family. So even if the jobs are available, the labour may not prefer to work.
- Presence of target workers: These are people who work for a specific period of time because they want to achieve a certain target. After achieving their target, they may not go back to work even if the jobs are available.
- Poor working conditions: Sometimes workers prefer to work in luxuries or good working conditions so when the conditions of work are poor, they may not work even if the jobs are available.
- Too much desire for leisure: Some people prefer to enjoy leisure to work since it is part of welfare. Those who prefer leisure may not work even when the jobs are available. To them the opportunity cost for leisure is work.
- Unfavourable geographical conditions: Some jobs are located in remote areas which may not be accessed by road because of the relief. Workers may not be willing to work in areas that are not accessible even if the there are jobs.
- High risks involved in doing the jobs: Some jobs are risky for the workers. For example jobs like mining, digging pit latrines, fishing among others. Some of these may be risky since they may involve death in case of accidents. So even if there are wages being offered, labour may not work.
- Early retirement by an individual: Different countries have different retirement ages, for example in Rwanda the current retirement age is 55 years while the normal retirement age is 65 years. If the people have reached the retirement age, they may not be legible to work even if the jobs are available.
b. Involuntary unemployment
This is a situation where members of the labour force are idle but are willing to work in the existing situations at the current wage. Individuals want to work but there is no employment.
Business cycles and growth are directly related to unemployment in any given country’s economy. When an economy is growing, unemployment usually falls and; when an economy is in a downturn, unemployment usually rises. The causes of involuntary unemployment are the causes of unemployment in general.
8.1.3. Types and Causes of unemployment
There are many different possible causes of unemployment, though it is never easy for policy makers to identify which is the most important and what to do about it. The causes of unemployment can be split into two main types:
a. Demand-side
The first cause of unemployment (demand-side) is simply a lack of aggregate Demand. When there is not enough demand, employers will not need as many workers, and so demand-deficient unemployment results. Keynesian economists in particular focus on this cause.
b. Supply-side
Unemployment caused by supply-side factors results from imperfections in the labour market. A perfect labour market will always clear and all those looking for work will be working—supply will equal demand. However, if the market does not clear properly, there may be unemployment. This may happen because wages do not fall properly to clear the market. These two types can further be divided into different categories as shown below;
i. Open urban unemployment
This is when the members of the labour force are unemployed in the urban areas—both voluntary and involuntary. Open urban unemployment can best be explained by the theory of rural-urban migration. Rural-urban migration is a process whereby individuals move from rural to urban areas. It occurs as a result of a combination of push and pull factors.
Rural-urban migration is brought about by push and pull factors (from towns), which are both economic and non-economic. Some of them are; unequal distribution of resources and services, social problems and population pressure among others. This can be basically reduced or controlled by developing rural areas such that people are no longer attracted to urban areas since all the services are equally distributed.
ii. Seasonal unemployment
Seasonal unemployment is unemployment which is caused by economic slowdowns related to seasonal variations. Certain jobs, like fruit packing, may be seasonal. At the end of the season, the workers may become unemployed. Agricultural workers are employed during clearing, planting, weeding and harvesting periods but are unemployed for the rest of the year. Others are construction workers, people who fish for a living.
This kind of unemployment can be solved by:
- Offer employees yearly contracts to avoid lay off of workers;
- Diversify agriculture sector to allow the full employment opportunities
throught the year;
- Set up a comprehensive industrial program to provide part-time employment.
iii. Disguised unemployment
This type of unemployment does exist mainly in countries which are overpopulated. It is the type where labour’s productivity tends to zero. Or the capacity of labour to work is underutilised. E.g. office messengers. The marginal product of labour is either zero or negative. One finds that there are more workers than those that are needed for a particular job. Less labour could have done the same work and therefore labour is said to be underutilised. In some cases, labour works less time than desired due to poor methods of production and poor capital equipment. Disguised unemployment is common in Rwanda, especially in the agricultural sector, service industry and government.
This kind of unemployment can be solved by:
- Introduce a comprehensive industrial program to facilitate redudant people;
- Introduce better methods of production by use of modern tools;
- Prompt the idle land and make it productive.
iv. Frictional unemployment
Frictional unemployment is essentially short-term unemployment. It results when the people are switching from one job to another. This may occur when people constantly change their jobs, some quit or others are fired. These constant changes result in frictional unemployment. There are always some firms with unfilled vacancies and some people looking for work. The period of unemployment between losing one job and finding another is included under frictional unemployment. There are a variety of reasons to explain the existence of frictional unemployment but these can be explained in the two categories below;
- Normal labour market turnover. This arises from two sources. First, people are constantly changing their economic activities —young people are leaving school and joining the labour force and secondly, old people are retiring and leaving the labour force temporarily for some other reason, and then joining it.
- The fortunes of businesses are constantly changing—some are
closing down and laying off their workers; new firms are starting up and are hiring.
- This kind of unemployment can be solved by:
- Provide information about job opportunities to available workers.
Employers should be fully informed of the potential labour supply. Unemployed workers should be informed of the availability of employment opportunities. There should be an efficient system of job notification and placement and there should be job centres in all small townships;
- The remedy of occupational immobility is to provide retraining facilities so that workers learn new skills. However, the problem could be lessened in the first place if the education system gave the potential workforce more appropriate training. Considering the changes in technology and the growth in demand for skilled and professional workers, retraining program will be of increasing importance in the future;
- Barriers to geographical labour mobility should be reduced. This should be either moving the unemployed to the jobs or moving the jobs to the unemployed. The government may give moving grants, provide information of jobs in other areas; and set up houses, schools and hospitals in those areas where employment exists. To move firms into the depressed regions, the government may attract them there with grants, tax relief, rent-free factories etc;
- Human resource planning. Human resource planning should be undertaken so that workers can be guided as to what skills are required by the economy.
v. Structural/secular unemployment
ACTIVITY 8.2
Umucyo company in Nyamagabe has been specialized in making dresses and it has been employing many workers. However with the change in trend, where ladies have resorted to putting on trousers, the company has lost market hence laying off workers.
1. What do you understand by the terms structural unemployment?
2. What are the causes of this type of unemployment?
3. What can be done to reduce this type of unemployment?
This is unemployment caused by changes in structural set up such as change in demand. For example if there is a change in demand from dresses to trousers, the workers in the dress industry will become unemployed.
Structural unemployment represents a mismatch between supply of labour and demand for workers. Because the economy is constantly changing and adapting, at any moment there will always be some mismatch between the characteristics of the labour force and the characteristics of the available jobs.
The mismatch may occur, for example, because labour does not have the skills that are in demand or because labour is not in the part of the country where there is demand. Individuals who fall into this category have trouble finding jobs because of a lack of adequate skills or regional employment problems. This is because of the immobility of labour. There are three distinct reasons for such immobility; occupational, geographical/regional (within a country), and international competition.
1. Occupational unemployment results from a mismatch between the demand and supply of labour in specific industries. The demand for workers in growing fields such as health care may exceed the supply of available workers, while the supply of labour in declining areas may be in surplus. As a result, there is high unemployment in stagnant or declining job areas, while demand is strong for alternative occupations.
2. Geographical/regional imbalance between the supply and demand for labour also occurs geographically, and is known as regional unemployment. For many countries, growth is not uniform across the landscape. Some areas may enjoy rapid growth and thus have a strong demand for labour, while other locations are stagnant and the surplus labour leads to high local unemployment rates. The unemployed workers will not move to a different area due to social ties, housing problems and social problems.
3. International competition is an additional source of long-term structural unemployment. The argument is that less-skilled workers in developed countries are increasingly being displaced by foreign workers in less-developed countries (LDCs) who are paid significantly lower wages. In developed countries, the average wage for less-skilled workers is relatively high compared to that in LDCs due to greater living costs, union power, and tradition.
4. Structural unemployment is the most difficult for economic policy makers to deal with, and solutions evolve slowly, and below are some of the solutions:
- Individuals stuck in occupations that allow for little future growth need to be retrained and educated to gain the skills necessary to work productively in areas where they are needed. Time, information, and money are required to deal with structural unemployment;
- The government can take an active role in providing vital information about jobs and help in financing education and training for displaced workers;
- There should be facilities for the retraining of workers whose skills are no longer in demand;
- It is important to identify in advance where shortages will occur in the future, so that retraining of unemployed workers can be in the right direction. This will enable workers to move to other expanding industries.
vi. Technological unemployment
This is the type brought about by machines replacing people because of
technological advancement.
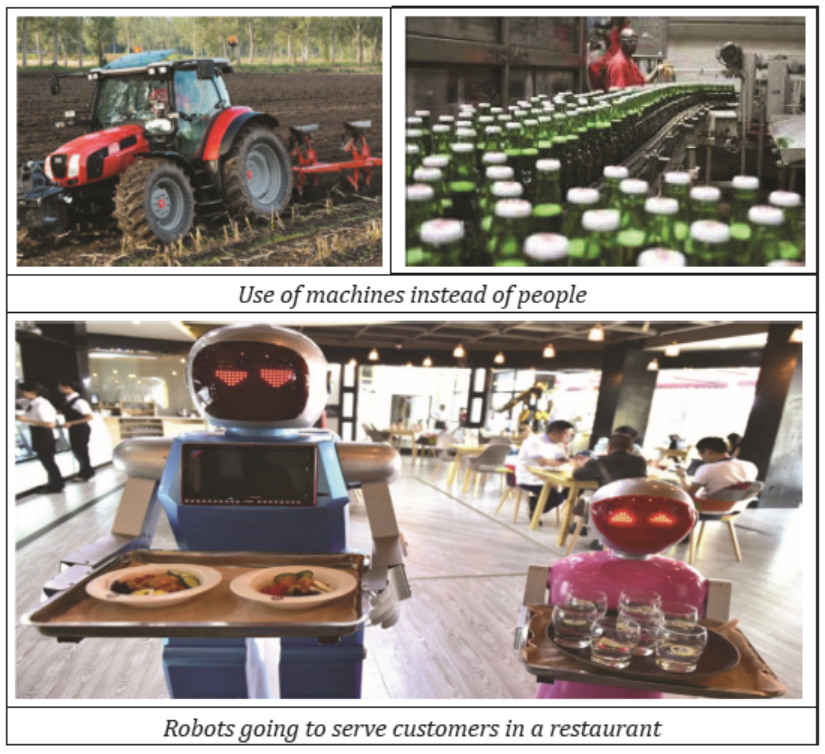
Figure 18: Technological unemployment
As firms introduce new technologies into their production processes, they may replace labour with machines. This has been occurring with computerization, automation and robotics in many industries as seen above in figure 2. For the firm, costs are cut and output and profits raised but for labour the demand is decreased.
This kind of unemployment can be solved by:
To cure this type of unemployment is not easy. Either the policy makers stops the technological developments, which would slow down economic growth, or find alternative work for those who have lost their jobs. The main solution would involve retraining.
vii. Casual/ Erratic unemployment

Figure 19: Casual Unemployment This is a form of unemployment that results from expiry of contracts and target workers. It commonly occurs to people like private doctors, lawyers, and car washers, who work if they have clients. The private doctor works when he has a patient to attend to. If he has no patients, he becomes unemployed and hence casual unemployment. This type of unemployment is hard to cure because it comes at irregular intervals. It cannot be predicted unlike the seasonal unemployment.
viii. Residual unemployment
This is a type of un employment that occurs to a factor of production especially labour because it is mentally or physically handicapped like the lame, with mental health issuers among others. Labour may become unemployed when the work that is available needs someone who is physically and mentally able.
ix. Transitional unemployment/ Normal unemployment
This is brought about by production stopping temporarily for sometime. Production may always stop because of many different reasons like repairing due to breakdown, renovation, and painting the industry among others.
8.1.4. Effects and Solutions to unemployment
Being unemployed can lead to depression, low self-esteem, anxiety and other mental health issues, especially if an individual truly wants a job but can’t find employment. Tension can occur, causing stress and strain on the body. Below are some of the effects of unemployment:
1. Increases dependence. Unemployment widens the dependence ratio. The unemployed rely on the working members of the public. This reduces personal savings and investments.
2. It kills personal esteem and dignity. Unemployed people may be looked at as a disgrace to the society. Employed members of the society under look them. They lose their self esteem and some may even become desperate in their lives.
3. It changes the attitude of the public towards education and training. The public may take education as wastage of time and resources. This may bring about large numbers of school drop outs. In the long run it may create a society that is dominated by the less educated.
4. Deterioration of the skills and knowledge of the unemployed. The skills of those who are unemployed will tend to disappear due to lack of practice. In the long run they will find it more difficult to get work in the future. This is what is known as the hysteresis effect.
5. The volume of production reduces. Unemployment keeps low the total volume of output that is produced. Because some resources are idle, and there is no output produced by them, GDP remains low.
6. Tax revenue reduces. The unemployed members of the public do not earn any incomes. Their taxable capacity tends towards zero.
7. Political oppositions may use the vulnerable unemployed especially the youth to lure them into activities that endanger the security of the country. Most anti government activities in developing countries involve the unemployed youth.
8. Income inequality. The income gap between the employed and the unemployed widens with time. This also creates its own evils.
9. Increase in government spending. The government incurs a lot of expenses on availing social services to the unemployed members of the public. Government spending on services like education and health facilities increase yet there is no tax revenue accruing to the government from the unemployed members.
10. Crime rates. The unemployed especially the youth are vulnerable and can easily be taken over by criminal behavior. Prostitution, theft and robberies, and other forms of criminality usually involve unemployed youth.
8.1.5. Solutions of Unemployment
1. Applying an expansionary fiscal policy. This involves stimulating aggregate demand, by:
- Lowering taxes to increase disposable incomes and increase aggregate demand.
- Increasing government spending to increase money supply which also widens aggregate demand.
- Increase in aggregate demand stimulates expansion of production and employment of more resources only if there if there is excess capacity in production.
2. Applying an expansionary monetary policy. This involves using the different instruments of the monetary policy to increase money supply and aggregate demand. For instance.
- Reducing interest rates to reduce the cost of borrowing. This encourages people to borrow and invest which in turn increases aggregate demand.
- Buying securities from the public to increase money supply.
3. Carrying out educational reforms and promoting vocational education. It helps to create relevant skills that suit the demands in the labour market. The creation of WDA , TVET and he introduction of the competence based curriculum is in this direction.
4. Modernize agriculture. This helps to reduce rural urban migration and therefore checks open urban unemployment. For instance changing the land tenure system to create private ownership builds producer and investor confidence which stimulates agricultural expansion and modernization. The system of land consolidation avails enough land for agricultural expansion. This will increase the rate of employment creation in the agricultural sector.
5. Reduce the power of trade unions. If trade unions are able to increase wages above the market clearing levels, they will cause real wage
unemployment. thus reducing the power of trade unions helps to fight this kind if unemployment.
6. Expand the industrial sector. This widens employment opportunities and helps to absorbs both skilled and unskilled labour force.
7. Promote local and foreign investors. This helps to increase the rate of job creation in the economy.
8. Check population growth rates. This helps to match it with the rate of job creation.
9. Economic integration. It expands markets by giving local producers to access markets in the region. A ready and wider regional market encourages the producers to expand the scale of production thereby creating employment opportunities.
10. Diversification of the economy. This helps to create different employment opportunities in different sectors. It helps to solves seasonal unemployment.
11. Increase wages and improvement in working conditions reduces voluntary unemployment.
12. Provide information about labor markets and jobs. This reduces frictional unemployment. It helps to improve the flexibility in the labour market. For instance making it easier to recruit labour.
13. Provide free universal education. This helps to increase skills development in the economy.
14. Encourage private sector. This also increases the rate of employment
creation in the economy by expanding production.
APPLICATION ACTIVITY 8.1
“It is idleness that is the curse of man - not labour. Idleness eats the heart
out of men as of nations, and consumes them as rust does iron” Samuel
Smiles, a Scottish author. Justify this statement.
Assess the causes and effects of unemployment in the Rwandan economy.
8.2. Under and full employment
ACTIVITY 8.2
Visit the library or any other source of information and make research
on the following items below and present your findings to the class.
1. Differentiate between full employment and Under employment.
2. Identify the measures that can be adopted to increase resource
employment so as to drive the economy towards full employment.
8.2.1. Meaning of under and full employment
Full employment has been defined differently by different economists.
- Lord Maynard Keynes calls it “The absence of involuntary unemployment.”
- Lord Beveridge defines it as “Having always more vacant jobs than men.”
However, what is evident is that no economy world over can attain 100% full employment. Some element of unemployment has to exist in one way or another. For instance,
- There is always involuntary unemployment in any economy.
- Frictional unemployment has to occur because labourforce keeps changing from one job to another.
Underemployment occurs when the capacity of a resource (labour) is not fully utilized. The capacity of a unit of labour to perform work is not fully put to use. This lowers the output that it produces.
8.2.2. Causes of under employment
Under employment occurs when:
Nothing is being added to total output by the extra units of labour employed i.e disguised unemployment. This can be illustrated as shown below.
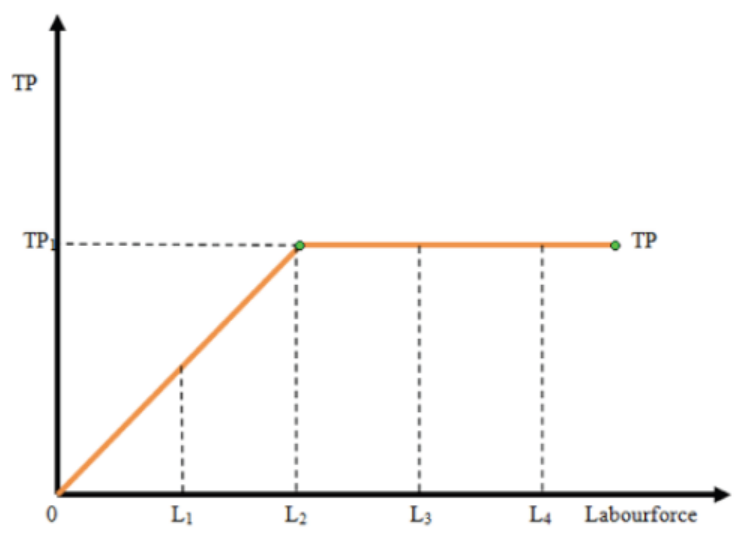
The above diagram shows that units of labour OL3 and OL4 are disguisedly unemployed because they are not adding anything to total product. Even if units of labour oL3 and oL4 are taken away from the production process, total product remains the same. Their MP is zero.
- Labour is using poor equipment such that the capacity to produce disrupted by the poor tools e.g using a spoon to load sand on a lorry as illustrated in the activity above. In this illustration, the second man is being unemployed. His strength, skill and will are not being used fully because of using a poor tool. This affects his total output.
- Labour is working on socially unacceptable activity. There are activities that are unacceptable to the society. For instance, prostitution. Prostitutes earn incomes from the “sale of their services” but their business cannot be taken to employment. More so, most prostitutes enter into that business not by will but are pushed into it by the unbearable conditions like low remuneration, unemployment and poverty.
- Labour is doing a job it is not trained for. Many workers are employed in fields that they were not trained for. A mechanical technician in a business of selling clothes, a professional teacher working in the local government as sector executive secretary etc.
- Lack of skills: Underemployment often illustrates the employment of workers with skilled backgrounds in low-wage or hourly jobs that do not require such prerequisites, thus undertaking jobs that undermine their skills.
- Lack of experience: Recent graduates may find themselves underemployed while looking for their first job after college. Even entry-level jobs sometimes require more experience than students may have to offer right after graduation. Job seekers who find themselves in this position might have to take part-time work while doing additional internships, taking classes, or networking their way to a new position.
- Credentials aren’t acceptable: In many cases, highly skilled individuals look for work, but face underemployment because their credentials cannot be accepted nor considered to be an equivalent fit for the position in question, so many professional individuals such as doctors, lawyers, or engineers take necessary jobs that would otherwise be seen as inferior positions.
- Discrimination issues: for example, people with disabilities, mental illnesses, or former inmates are often discriminated against and are forced to take the first job made available to them for fear of not finding another.
- Low demand: Some individuals with acceptable experience and skills are underemployed because of low demand in their local job market. They have to take a part-time job until they are able to move to a location that can better accommodate their skill set.
- Poor economy: In addition, anyone can find themselves underemployed if the economy takes a turn for the worse. During a recession, many skilled workers who would ordinarily have little trouble landing a good job in their field may wind up underemployed.
- Market changes: Underemployment can also be caused by larger market changes. For example, automation has affected workers in industries ranging from retail to manufacturing to transportation and warehousing.
8.2.3. Measures to attain full employment
For any economy to flourish towards full employment, it requires a number of policy interventions. The following policies can be applied to attain full employment.
1. Fiscal policy.
2. Monetary policy.
3. Through pump priming policy.
- Offering tax exemptions and tax holidays to potential investors. This attracts both foreign and domestic investments. Local production expands which increases resource utilization. More employment opportunities are created as production expands.
- Reduction of tax rates on production and inputs. This reduces the costs of production which stimulates expansion of the scales of production. This increases demand for inputs and widens employment opportunities.
- Offering subsidies to infant domestic firms. Subsidies to young firms help them to grow and expand their scales of production and employ more resources. Subsidizing consumers also has an effect on demand. Demand increase which stimulates further production and employment of resources.
- Reducing direct taxes to increase people’s disposable incomes. This helps to stimulate consumption. It offers a ready market to producers who are encouraged to increase their production. Increasing production implies utilizing more resources.
- Reduction and or removal of export tariffs. This offers producers in the export sector free access to foreign markets and to promote production of exports.
- Increasing government spending on productive ventures. Government spending on infrastructure like roads, power, water and sanitation and telecommunication sector facilitates domestic production and promotes utilization of the available resources.
- Use of expansionary monetary policy. This helps to increase money supply to stimulate aggregate demand. It can be done by buying securities from the public, lowering the central bank lending rate, lowering the variable reserve ratio etc. This has an impact of stimulating investmentand production aggregate demand.
- Liberalising the economy. This helps to improve private sector participation in production activities. Employment creation expands and helps to drive the economy towards full employment.
8.2.4. Why is it difficult to attain full employment in Rwanda
In macroeconomic concept, there is no economy that attains full employment due to the following:
1. Low levels of skills. Because of low levels of education a proportion of labour force which is unskilled cannot be employed irrespective of the expansion in production.
2. Lack of information on labour markets. When the labour market is imperfect, some units of labour force remain unemployed irrespective of the availability of job vacancies. This makes it difficult to attain full employment in the economy.
3. Existence of voluntary unemployment. Either because of attitude towards work or the prevailing wage rate some units of labour force may prefer to remain unemployed irrespective of the availability of job opportunities.
4. Changes in seasons. There are activities that are done on a seasonal basis especially in the agricultural sector. This brings about seasonal unemployment especially in the agricultural sector. Thus it becomes difficult to get resources employed fully in the free season, for instance in the period between harvesting and the next planting season.
5. Limited markets. Domestic markets are low because the consumers have low incomes. There are obstacles to accessing foreign markets. This keeps production low leaving some resources unemployed.
6. Political instabilities. Political disagreements, unrest and conflicts disrupt settled life and productive activities. Potential investors are scared away. This reduces the possibility of moving the economy towards full employment
7. Attitude of the public towards work. if the attitude towards work, especially among the youth, who under look employments, who want to get rich quick, etc, makes it difficult to achieve full employment.
8. Dependence on primary production. LDCs produce and export unprocessed output. This limits the rate of job creation.
APPLICATION ACTIVITY 8.2
Rwanda is determined to create 1,500,000 (over 214,000 annually)
decent and productive jobs for economic development by 2024
(MINECOFIN: NST1-7YGP 2018/2024).
1. Assume you are among the policy makers planning for the GoR,
what will you do for Rwanda to realize that milestone.
2. What do you consider as bottlenecks for Rwanda to realize that
activity.
8.3. Keynesian theory of unemployment
ACTIVITY 8.3
Visit the library or any other source, make research about the following:
1. The meaning and causes of unemployment according to LM Keynes.
2. The solutions put forward by Keynes to lessen unemployment.
3. Critically argue on the relevancy and limitations of Keynesian theory in Rwanda.
8.3.1. Assumptions and Illustration
The Keynesian economics argues that economies are boosted when there is a healthy amount of output driven by sufficient amounts of economic expenditures. Keynes believed that unemployment is caused by a lack of expenditures within an economy, which decreased aggregate demand.
This exists when individuals lose their jobs as a result of a downturn/reduction in aggregate demand (AD) especially during a depression when incomes and output fall which results into employers laying off workers. The demand for most goods and services falls, less production is needed and consequently fewer workers are needed, wages are sticky and do not fall to meet the equilibrium level hence unemployment.
If the decline in aggregate demand is persistent, and the unemployment longterm, it is called either demand deficient, general, or Keynesian unemployment.
This type results from fluctuations in the business cycle. Cyclical unemployment rises significantly during economic downturns (recessions) and falls during growth phases. It is therefore natural to refer to the high unemployment, in these recurring periods of recession as cyclical. The term “cyclical” means that such unemployment occurs periodically.
When there is a fall in aggregate demand, the entrepreneurs will find themselves with unsold goods. They will be forced to reduce investment and consequently lay off workers.
Keynes stressed two concepts, the marginal propensity to consume (MPC)
and the investment multiplier. If individuals consume a greater proportion of the additional income, entrepreneurs will be encouraged to increase their investment and hence more employment opportunities. However, if MPC is low, unemployment is bound to occur since the investment multiplier process will be small.
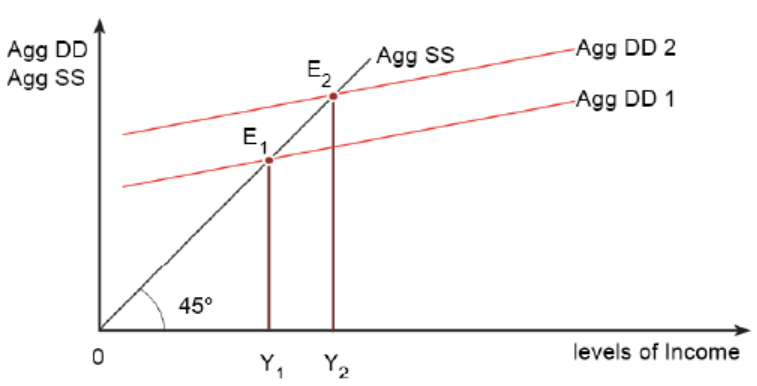
Figure 20: Keynesian Unemployment
From Figure 20 above, E1 is the equilibrium point with employment level Y1;
some of the workers willing to work have not been absorbed. It means that E1
(effective demand point) is an under employment equilibrium and Y1 is under
employment level of income.
The unemployed workers can be absorbed if the aggregate demand increases
from Agg dd1 to Agg dd2 and a new equilibrium point E2 is established with
employment level Y2 which we assume is the full employment level. Hence
increase in aggregate demand from Agg dd1 to Agg dd2 leads to increase in
employment (Y2-Y1).
To curb down this type of unemployment according to Keynes, aggregate
demand should be increased in the following ways:
1. Increase government expenditure, to increase in the demand and in the end, incomes if the firms will increase and finally may need more workers to producet he needed goods;
2. Reduce tax on people’s incomes which will lead to more disposable income, and hence an increase in demand that will stimulate the producers to set up more investments and create more employment in turn;
3. Buy securities from the public. This will lead to increased money in the hands of the public and in end their demand will increase hence the need for increased output will cause the producers to demand for more workers;
4. Reduce the bank rate. This will attract people to seek for loans from the financial institutions which will further increase money in circulation, increase demand and employers will react by increasing the demand for workers;
5. Reduce legal reserve requirements. This is the amount that is by law supposed to be kept by commercial banks in the central bank. Reducing implies that there will be enough money held by commercial banks to lend to the public which will further increase aggregate demand;
6. Encouraging exports. This could be through lowering the tax rates and joining regional cooperation for an extended market. It will increase incomes and investment and in turn create employment opportunities;
7. Improvement in investment climate. This is through encouraging investors to invest in the country through giving them subsidies like tax holidays, gazetted land in economic zones among others. These investors will in turn create employment opportunities for the people;
8. Increasing wages of the people so as to increase their demand.
8.3.2. Applicability and Limitations
a. The Keynesian theory is relevant in the following ways:
i. As suggested by Keynes, in LDCs, demand for labour is derived demand. This implies that a fall in demand for goods and services will lead to a fall in incomes of the employers because their products have no market and in the end they will react by laying off workers.
ii. Through exports, new markets are got for the local goods and this implies that the local investors will earn more income. They will be able to set up more investments in order to satisfy the market and hence they will need to employ more workers.
iii. Reduction in tax as suggested by Keynes can lead to increase in household income and expenditure. This will in turn increase aggregate demand, the investors will react by needing to produce more to satisfy the increased demand and in the end they will need to hire and employ more workers leading to increased employment opportunities.
iv. Increasing government expenditure as suggested by Keynes increases money supply in the economy. This will further increase aggregate demand provoking producers to increase production which they can only do after employing more workers.
v. A conducive investment climate as suggested by Keynes encourages investment through attracting investors. These will in turn need to increase production and in the end they will end up employing more workers.
b. Limitation Keynesian theory of unemployment
i. Keynes viewed unemployment from the demand side when he said that unemployment is as a result of reduction in aggregate demand. This cannot be applicable in developing countries because in these countries unemployment is mostly as a result of inadequate capital.
ii. Increasing government expenditure as suggested by Keynes so as to increase aggregate demand will instead worsen the problem. This is because the increased money in circulation will instead shoot up the prices and it may further be too high for the people to buy hence the goods will lack market and still the employers may lay off the workers which will cause inflation.
iii. Keynes didn’t consider institutional and structural problems in LDCs such as poor road network, poor land tenure system which affect the level of investment and job creation.
iv. Increasing government expenditure will not increase employment opportunities especially in the agricultural sector. This is because people prefer white collar jobs than blue collar jobs so there may not be increase in employment despite increase in expenditure by the government.
v. Assumes a fully monetarised economy. This is because according to him, the aggregate demand can only be increased when there is increase in money in circulation but he does not consider the fact that in LDCs there is a large subsistence sector where people survive on the foods that they grow and they don’t take it to the market to earn incomes.
vi. Investments in industries may not absorb all the labour. This is because the need to increase output by these industries to gain more profits, may force the industries to use capital intensive techniques of production as opposed to labour intensive techniques and so unemployment may persist
vii. LDCs have got inelastic demand for imports. Even if the prices increase, their demand remains almost the same. Increase in aggregate demand means that the they will be more investments in those countries that supply the goods and employment will be created there and not in the countries where they export their goods. Thus unemployment will persist in the countries that receive the goods.
viii. Increasing money supply may not increase aggregate demand. This is because people in developing countries prefer to hold money in form of wealth or cash. Therefore there will still be deficiency in demand and unemployment.
ix. Keynes didn’t consider the causes and solutions to other types of unemployment. He only considered deficiency in demand yet we know that unemployment is broad with many causes and needs a variety of solutions if full employment is to be achieved.
APPLICATION ACTIVITY 8.3t
The Keynes way of thinking has brought to the attention of the most economies in the 20th century. As a student teacher in social studies who may also progress to economics in furthering your studies, how can you influence the economy of your country to pursue the trend of Keynes theory?
Do you think the theory is still applicable in 21st century given the advancement in technology where demand for goods and services keeps on changing? If yes/no, justify.
8.4. Theory of Rural Urban Migration
ACTIVITY 8.4
Using the photographs in figure below, describe the following:
1. What do you think caused such situations in the photos below?
2. The activity of people moving from a rural area to an urban area
to stay is known as ......
3. What do you think are the effects of such an activity in (1) above?
4. What do you think should be done to limit the movement of people
from rural areas to urban areas with an intention of staying?

8.4.1. Meaning of Rural Urban Migration
Rural-urban migration is a process whereby individuals move from rural to urban areas with an intention of staying. It occurs as a result of a combination of push and pull factors. This causes three things to happen;
- Urban growth - towns and cities are expanding, covering a greater area of land.
- Urbanization - an increasing proportion of people living in towns and cities.
- Depopulation in the rural areas because of people constantly moving to urban areas.
8.4.2. Causes of Rural-Urban Migration
a. Unequal distribution of economic activities. Unequal distribution of economic activities with urban areas having more than the rural areas. The government tends to allocate more development expenditures in the urban areas and forget the country sides where the majority of the people stay hence individuals have then tended to move to urban areas in hope of getting highly paid jobs.
b. Unequal distribution of social services. Unequal distribution of social services with urban areas having more than the rural areas. More and better education, medical, cinema halls, night clubs and transport facilities are allocated to urban areas than in the rural areas. Individuals then move to urban areas to enjoy these facilities.
c. Population pressure. Population pressure in the rural areas has also contributed to rural-urban migration. There is limited fertile land in the rural areas and yet there are increasing numbers of people on land. This causes diminishing returns. Individuals who have no access to land move to urban areas in search of employment.
d. Formal and inappropriate education. Theoretical subjects which lack any practical bias and prepare students for white collar jobs are being taught in schools. The school-leavers lack any specific qualifications. They search for jobs appropriate to their kinds of formal education received in schools. Therefore, after leaving school, individuals tend to stay in urban areas unemployed.
e. Minimum wage. To a small extent, there can be migration to urban areas arising from the setting up of minimum wages far above the average wage in the rural areas. Individuals tend to migrate to urban areas whenever they hear of any increase in the urban minimum wage. Unfortunately, the number of jobs in the urban areas is not increased. In some cases, the number of jobs is decreased.
f. Standard of living. The rural people view the urban standard of living to be better than the rural standard of living and hence rural-urban migration. The rural people have a belief that the urban standard of living is far much better than the rural one.
g. Social problems. This also plays a minor role towards rural urban migration and urban unemployment. Fear of witchcraft, circumcision and others are in most cases associated with rural areas. Individuals then try to escape to the urban areas where such are least experienced.
8.4.3. Effects/Consequences of Rural-Urban Migration
a. Open urban unemployment. Because of the constant movement of people from rural areas, there will be an increase in the number of people in urban areas who will be idle without jobs.
b. The problem of dependents. Normally when the people move to urban areas, they tend to stay with their relatives. Therefore they may cause increased dependency on the side of their hosts which leads to low standards of living.
c. Creation of slums. The presence of many people from villages to towns may cause scarcity of housing facilities. This in conjunction with low incomes, may cause the people to develop shanty housings leading to creation of slums.
d. Government expenditure on social services increases. There will be
increase in government expenditure on social services like hospitals and schools among others to cater for the growing population in the urban centers.
e. High cost of living in urban areas. The increase in the number of people in urban centers will lead to an increase in the demand for the goods and services. This may not be accompanied by corresponding increase in the supply of goods. In the end, the prices will go up.
f. The demand for social services exceeds the supply. There will be strain on the social services in the urban centers. This is because there is increase in the number of users and in the end there will be high costs of maintenance.
g. Food prices increase as well as house rents. The prices of food as well as house rent will shoot up due to the increase in the number of users and in the end problems of poor standards of living and welfare will come up.
h. Low agricultural output. Agriculture is mostly carried out in rural areas, therefore the increase in rural-urban migration means that the number of energetic young men and women who would stay and produce food will be moving to urban centers. Therefore there will be reduced productivity in rural areas.
i. Rural development will be delayed. This is because as more and more people move to urban centers, the government will concentrate on the urban centers and neglect the rural areas since there are fewer people hence rural under development.
8.4.4. Measures to control Rural-Urban Migration
i. Rural development policy: This can be through:
- The economic base of the rural areas must be strengthened so that productivity and earnings from agriculture are raised. A big percentage of the export earnings should be returned to the rural areas in form of farm implements so that increased capital formation can take place in the rural areas. Agricultural output can be improved by provision of more and better tools; provision of credit facilities; improvement of transport facilities; higher agricultural prices to farmers etc.
- A comprehensive industrial program to employ otherwise redundant people should be introduced. Small-scale labour-intensive industries should be set up.
- Special attention should be paid to building in small-country towns in rural areas, schools, hospitals, cinema halls and the like since people are more likely to remain in the countryside when amenities are reasonably close to where they live. In other words, rural areas should be made attractive.
ii. Population control: The high population growth rates must be brought to a halt using various policies like use of family planning methods, giving a maximum number of children per family, reducing incentives like free education among others.
iii. Education policy: To overcome the problem of school leavers, educationalists should change the educational curriculum to subjects with a more practical bias like farming, carpentry, simple mechanics and the like, to create more job seekers.
iv. Financial infrastructure: The government should create an effective financial infrastructure that can assist people in rural areas with micro loans that are to be paid back with a small interest rate. This will help in the mobilisation of savings, which can be loaned to the farmers and they will be able to stay in rural areas.
v. Wage policy: The minimum wage policy should either be abolished or made effective throughout the country such that even in the rural areas, people can earn the same wage as their colleagues in towns. This will reduce their movements to towns.
vi. Rural-rural migration: There should be rural-rural migration. For instance, moving from Nyamirama to Ruramira not from Nyamirama to Kayonza town. However, this is difficult to manage.
APPLICATION ACTIVITY 8.4
In most developing world, you notice many young people in rural areas carrying their bags heading to cities. What do you think are the reasons pushing those young people in towns. What will happen to villages that those young people have left and what will happen to the cities where those people go. Assume you are one of policy makers in Rwanda, what measures will you put in place to reduce that practice of rural-urban migration.
END UNIT ASSESSMENT
1. Examine reasons why some people in Rwanda do not want to work.
2. Why is it difficult to get all people in Rwanda employed?
3. What do you think the Rwandan government should do to reduce the unemployment problem?
4. How has the unemployment problem affected the development process in Rwanda?
5. With reference to Rwanda, critically assess the Keynesian theory of unemployment.
6. In your views what are the pull factors for rural-urban migration and how can curb down the rural-urban migration.
UNIT 9 PUBLIC FINANCE 1
Key Unit Competency: Analyse the role of public finance in economic development.
INTRODUCTORY ACTIVITY
The following are some of government corporations through which the government provides services to the population.
RDB. RURA. REB. WDA. REMA.RSB. RRA. RAB. RTDA. RNRA. RHA.RSSB.
Sharing with the one seated next to you, write down the following
i. Which ones do you know and can write in full.
ii. The services you have ever received from any of them?
iii. From which sources do you think they get their income that they spend on the services they offer?
iv. What do you think is the major source of their finance?
v. In cases where government doesn’t have enough money to give to these corporations, how would you advise it to raise more money?
vi. If you were the one in charge of distributing money to these corporations, and you had 100m Rwf. Show how you would distribute it and support your decision with reasons.
9.1. Meaning of Public Finance
LEARNING ACTIVITY 9.1
As members of economics club make a visit to the nearby district headquarters and talk to the finance department. Ask about the following,
i. The different sources of district incomes and how much it earns.
ii. How the district spend its incomes.
iii. Do they sometimes run short of money? In case they do, what do they do to cover up the shortage?
Public finance is an economic discipline that deals with the ways through which government gets its revenue and how it spends it (government revenue and government expenditure and public borrowing) to achieve specific objectives. In public finance, the planned expenditure determines the means that shall be used to raise the revenue.
Private finance deals with the income and expenditure of individuals, companies (corporate bodies) and other organizations.
9.1.2. Branches of public finance
Public finance is basically composed of the following branches,
- Public revenue. This studies the various ways of raising revenues by the government and other public bodies. It looks at the principles and effects of taxation and how the burden of taxation is distributed.
- Public expenditure. This is the branch of public finance that studies the various principles, effects and problems of expenditure made by the public authorities
- Financial Administration. This deals with the methods of budget preparation, various types of budgets, war finance, development finance, etc.
- Public debt. Public Debt is the branch of public finance that studies of the various principles and methods of raising debts and their economic effects. It also deals with the methods of repayment and management of public debt.
APPLICATION ACTIVITY 9.1
The table below gives data from a particular country. Arrange the data into expenditure and revenue.
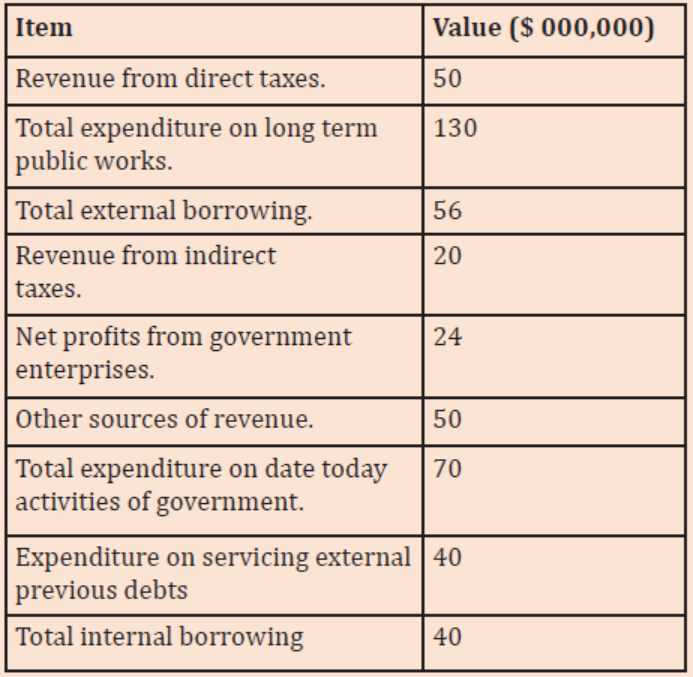
Determine:
i. How much was total domestic revenue for that fiscal year.
ii. How much was total expenditure for the same year.
iii. How much did the government borrow and why?
9.2. Government and economy.
ACTIVITY 9.2
On a piece of paper, write down what you know about Rwanda Development Board (RDB), Rwanda Agricultural Board (RAB) and Rwanda Utilities Regulatory Agency (RURA).
Discuss how the above corporations help to improve economic activities in the country.
9.2.1. Role of government in the economy
Economists have had diverging views on the extent of the government controls of the economy. Economists like Adam Smith advocated for non-interference of the state in the economic life of the people. He however agreed that the state should take control of particular sectors like defence and security, education, and administration of justice. Those who believed in communism argued that the state should own all means of production and guides all production decisions. They argued that private interests and profit motive brings about exploitation especially of the less advantaged of the society. In today’s world, the government intervenes either directly or indirectly through a set of policies to influence economic and social activities for the benefit of all. The extent of this intervention is varies. However, what remains a fact is that in all economies, the government plays a role in influencing economic activities to improve the general welfare of the citizens.
The government influences the economy through ministries, a number of public corporations and other organs. The following are some of examples of government statutory bodies that the government uses to influence the economy.
1. Rwanda Development Board. RDB,
2. Rwanda Utilities Regulatory Agency. RURA,
3. Rwanda Education Board. REB,
4. Workforce Development Agency, WDA
5. Rwanda Environment Management Authority. REMA,
6. Rwanda Standards Board. RSB,
7. Rwanda revenue authority. RRA,
8. Rwanda agricultural board. RAB,
9. Rwanda transport Development Agency. RTDA,
10. Rwanda Natural Resources Authority. RNRA,
11. Rwanda Housing Agency. RHA
12. Rwanda Social Security Board. RSSB
Therefore the Government influences the national economy by:
- Establishing infrastructure. There are economic infrastructures that are essential in facilitating the growth of the economy. Roads, Dams, airports, railway lines, water and sewerage facilities are essential in promoting economic activities. The government is tasked with establishing these basics in order to drive the economy to another level.
- Enacting and implementing laws that govern the way businesses run. In this exploitative economic world, the government takes the first hand in protecting the economically weak from profit motivated exploitation. This exploitation may in form of;
- Workers being exploited by the employers through over working them with little pay and poor hygienic and working conditions.
- Consumers being exploited by the profit motivated private producers in form of charging high prices, sale harmful products like intoxicants.
- Producing commodities that cannot be provided by the private sector. In areas where the private sector cannot invest their capital may be because of limited returns, it becomes the role of government to provide the necessary capital to promote these sectors. For instance public health, public libraries, museums, afforestation, amusement parks.
- Regulating economic activities through use of monetary and fiscal tools. This aims at maintaining stability of economic variables like prices, interest rates, and exchange rates. The government formulates policies that bring about macroeconomic stability, a factor that is essential for the growth of the economy.
- Ensuring balanced growth in the economy. Through planning, the government influences resource allocation and distribution to bring about balanced growth in the economy and speed up economic development. It formulates programmes, and policies, fixes targets, and priorities to achieve this objective. For instance, EDPRS 1 and 2, and Vision 2020 take leading examples in this direction.
- And property from aggression, injustice, and oppression is an essential role Maintaining security. One of the primary functions of the government is maintaining peace and security within the country. The protection of person and property from aggression, injustice, and oppression is an essential role of the state. Peace and security lays a foundation stone for other productive activities to grow.
- Provision of social services that promote the welfare of the citizens. The government takes a leading role in the provision of education, housing and health facilities. These are essential for ensuring a steady supply of competent and productive labour force that can drive the economy to growth lines.
- The government ensures initiation, protection and growth of productive economic activities. It provides start up information and capital to potential domestic entrepreneurs. It protects them from competition and provides subsidies and tax relief etc all of which promote their growth. This pushes the economy forward.
9.2.2. Sources of Government revenue
ACTIVITY 9.3
Make research and identify the various ways through which the government raises the revenue that it uses to finance its activities. Make class presentations. The different sources of government revenue include,
- Taxation. Taxes are a compulsory transfer of part of one’s income to the government.
- Fees charged on services offered by government. For instance Company registration, passport issuance, land registration.
- Borrowing both external and internal sources.
- Fines and penalties on law breakers. For instance those who break traffic regulations suffer express penalties.
- Gifts, donations and grants. These may be from individuals, other national governments or multilateral agencies. They are usually offered to meet the cost of specific projects or schemes in public interest; for relief work in the event of natural disasters; for reconstruction or for However, this is an uncertain source of revenue to the government. - development. However, this is an uncertain source of revenue to the government.
- Profits from government enterprises. Governments at times set up commercial enterprises from which they earn some revenue.
- Government borrowing from central bank. This implication of the central bank printing more money. However this may be inflationary, and more so if the money is not directly invested into productive ventures.
- Revenue from state properties. For instance rent from government estates.
- Gambling national lottery.
- Licenses: This is a payment made to the government to secure permission to carry out any gainful activity.
- Loans: Governments can borrow either internally or externally.
- Public fundraisings. For instance The Agaciro fund.
9.2.3. Methods of expanding sources of government revenue
ACTIVITY 9.4
It has been observed that the main source of income for your school is the fees students pay. Identify and write down the other ways the school can use to raise more incomes to sustain school activities.
- Expanding economic activity. This can be done by diversifying the economy. Diversification of production expands incomes to the government and individuals. It has the effect of widening the tax base and increasing tax revenue.
- Reducing tax exemptions. Under certain circumstances, government offers tax exemptions to specific firms and /or products for a number of reasons like allowing young firms to grow and expand. However this should not be exaggerated as it may lead to loss of tax revenue.
- Ensuring efficiency in utilisation of government resources. This avoids wastage and creates favourable condition for raising government revenue.
- Attracting foreign investments. Foreign investments bring the necessary foreign exchange to close the gap. They are inflows of foreignforeign exchange which in turn creates more incomes through production. Foreign investments may be attracted in the tourism sector, manufacturing and agriculture.
- Expanding production especially in export sector. This will bring in more revenues from other countries than import expenditures.
- Introducing new types of taxes. This makes the tax system comprehensive and therefore expands the sources of government revenue.
- Diversification of the economy. This will help to widen the tax base. Widening the tax base increases tax revenue.
- Ensuring political stability. This helps to build investor confidence, expand production and the level of economic activity. It also reduces government expenditure.
APPLICATION ACTIVITY 9.2
As members of economics club, hold a meeting, discuss and identify the various activities that you can do to generate more incomes for your club.
9.3. National budget
ACTIVITY 9.5
Government expects to finance the 2019-20 budget through domestic resources worth Frw 1,963.8 billion representing 68.3% of the entire budget. This represents an increase of Frw 268.3 billion compared to Frw 1,695.5 billion in the 2018/19 fiscal year revised budget. Tax revenue collections are estimated at Frw 1,535.8 billion which accounts for 53.4% of the total budget while non tax revenue is estimated at Frw 190.4 billion representing 6.6% of the total budget.
The remainder of the budget will be funded through external sources worth Frw 906.7 billion which accounts for 31.5% of the total budget. These include grants worth Frw 409.8 billion (14.2%) and loans worth 497.0 billion (17.3%). (www.minecofin.gov.rw) Determine the following from the above passage.
i. Total amount the government expects to spend in 2019/20 fiscal year.
ii. From which sources shall this money come?
iii. What do you think ‘domestic resources’ and ‘external resources’
mean?
iv. Why do you think financing from domestic resources for 2019/20 fiscal year is higher than that of 2018/19 fiscal year?
9.3.1 Meaning and objectives of national budget
Each financial year, the government receives revenues from a variety of sources. It spends these revenues on a number of activities. The financial year in Rwanda and other East African Community members starts on 1st July of each calendar year and end on 30th June of the next calendar year. A national budget is a statement of government’s anticipated receipts (revenue) and payment (expenditure) for a financial year. The national budget for the next financial year is usually presented by government before the end of the current financial year.
9.3.2 Objectives of National Budget.
ACTIVITY 9.6.

The Minister of Finance and Economic Planning (Minecofin) Claver Gatete, presents the citizens’ guide for the 2015-2016 fiscal year.
“…The budget for 2015-2016 fiscal year will focus on four thematic areas; economic transformation, rural development, productivity and youth empowerment, and accountable governance. It is projected at Rwf1.768.2billion, showing an increase of Rwf5.9 billion compared to 2014-2015.
This year’s budget theme “Infrastructure Development for Economic and Social Transformation” reflects Rwanda’s objective towards achieving a higher growth rate while reducing the cost of transportation in particular and doing business in general…” The Rwanda Focus. Oct. 28. 2015. (www.focus.rw. )
With reference to the above, passage, in your own view, how shall the government use the budget to achieve higher growth and reduce the cost of doing business in the country?
A national budget has the following objectives,
- To raise revenue for social service provision.
- To maintain a favourable balance of payment status of the country.
- To ensure equitable distribution of incomes in the country.
- To maintain a high level of employment of resources.
- To stimulate economic growth.
- To protect domestic industries from competition.
- To regulate government expenditures.
- To ensure macroeconomic stability.
- To reduce income inequality and achieve equitable distribution of income.
- To discourage the consumption of undesirable commodities
- To trace the sources of revenue
- To cater for the sectors that need urgency towards the development of the country
- To control government expenditures.
- To stimulate the rate of economic growth.
- To control inflation
9.3.3 Types and role of a National Budget
ACTIVITY 9.7.
Which of the two is heavier than the other and why? What can be done to balance the two sides by the government.
A national budget may be balanced in a sense that planned expenditure is equal to planned revenue or it may be unbalanced such that planned expenditure is not equal to planned expenditure. An unbalanced budget is in two forms,
- Balanced budget.
- Unbalanced budget.
- Surplus budget.
- Deficit budget.
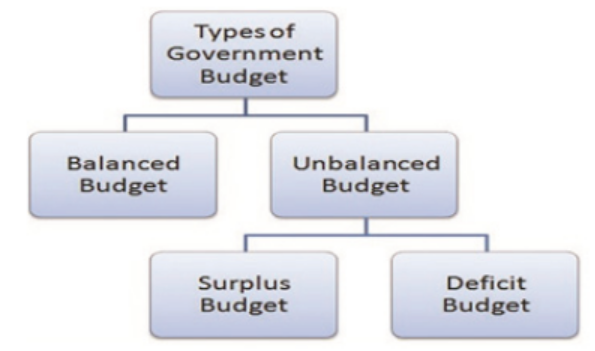
Figure: 3 indicates the types of budget and their classifications
There are basically two types of budgets namely
1. Balanced budget.
This is the type of government budget where the estimated government revenue is equal to expected expenditure in a financial year. For example, government plans to spend Rwf 200 million and expects to collect Rwf 200 million then that is a balanced budget. This type of budget is not common within the developing countries even the developed world.
A balanced budget implies,
- Constant money supply. Money only changes hands. It moves from public hands to government hands through taxation and then back to public hands through government expenditure.
- Other factors remain constant for instance the level of aggregate demand, employment and general economic activity.
2. Unbalanced budget.
This is the type of budget where the estimated revenue is either greater or less than the expected expenditure in a financial year. It has two categories namely;
a. Surplus budget is where anticipated government revenue is greater than anticipated government expenditure of the fiscal year.
A surplus budget has the following impact on the economy:
- Reduction of money supply. The surplus revenue is not re injected into the economy.
- Due to decrease in money supply, aggregate demand also reduces. This may have an effect on the level of production.
- Reduction in general price level because of a reduction in money supply.
- Reduction of the level of economic activity since aggregate demand is low.
- The surplus in the budget may be used to give gifts and grants to other countries or reserved for future use.
b. Deficit budget: This is when government anticipated receipts are less than anticipated government expenditure of the fiscal year. A deficit budget may create the following impact on the economy,
- An increase in money supply as more money may flow into the economy through external borrowing.
- An increase in general price level due to increase in aggregate demand as a result of increase in money supply.
- Increase in aggregate demand, employments, and the general level of economic activity due to increase in money supply.
- The government borrowing from the central bank which implies that the central bank prints more money.
- The government gets grants from others countries to finance the deficit in the budget.
- The government may sell its assets to raise money for spending.
Whether balanced or unbalanced, a national budget can be classified as;
3. Development budget.
This is government planned incomes and spending on long term projects that result into long term growth and development of the economy. It is an outline of how the government plans to raise money for spending on long terms projects like construction of dams, airports, railways and water and sewerage facilities. It involves huge expenditures and is usually financed by borrowed funds.
4. Recurrent budget.
This is the budget that outlines planned incomes and planned expenditures of the day to day running of government activities. For instance expenditure on salaries of public servants, transports costs involved in administration, hiring and maintaining of properties like offices, as well as other administrative costs. Recurrent budget is usually financed through taxation.
9.3.4. Role of National Budget.
National budget aim at driving the economy towards growth through,
- Increasing the rate of economic growth. This is done by outlining a government spending in such a way that will prioritise productive sectors will foster growth of the economy by expanding production. Government spends more on such sectors like industrial production, energy production, transport infrastructure etc. In taxation as a source of income, taxes are outlined, with the objective of bringing about economic growth. For instance tax reliefs are offered to potential entrepreneurs.
- Ensuring full employment of resources. This is achieved through directing government expenditure and taxation towards creating more employment opportunities by expanding production.
• Infrastructural development. Government expenditure outlined in the budget is directed towards growth of both economic and social infrastructure. Infrastructure development promotes production especially in the private sector. It is a pillar for the growth of the private sector.
- Increasing aggregate demand. This is aimed at stimulating production. It is achieved by increasing government expenditure. Consumption subsidies are offered more especially to low income earners. Direct taxes are also relaxed to increase consumers’ disposable incomes.
- Guiding resource allocation and utilization. The revenues and expenditures outlined in the national budget may be intended to influence resources allocation. Resources are redirected from a non priority sector to a priority sector using the national budget.
- Protection of domestic infant industries. This is done in order to allow them grow by shielding them from competition from big, old and low cost foreign firms. The budget outlines taxes on imported commodities that are likely to out compete domestic products.
- Encouraging capital inflow through attracting foreign investments. Tax incentives may be outlined for sectors that attract foreign investment as a way of pulling them. Expenditures are outlined tor basic infrastructures in these areas that facilitates investment. For instance extending power lines, improvement of communication networks, establishment of organisations and legal frameworks that ease investments.
- Reducing income inequalities and regional and sectorial imbalances. High expenditures are outlined for the poorly performing sectors and regions. Tax incentives may also be offered to such sectors.
- Increase the level of economic activity. By increasing expenditure in the budget, the government may intend to stimulate economic activity. Increase in government spending increases money supply and aggregate demand. This in turn encourages production.
- Fostering social transformation and improving the general standards of living of the population. This is done by directing government expenditures towards financing activities that improve the economic welfare of everybody.
9.3.5. Problems of budgeting.
LEARNING ACTIVITY 9.8
Make research and identify the problems faced by developing economies in their budget processes. In your own view, what measures can the government adopt to address the above problems?
In developing economies, governments are usually faced with problems in the budgeting processes. Some of these are exogenic while others are endogenic in nature. Such problems may include:
- Institutional problems: Limited supply of skilled man power. This is a result of low levels of education in developing economies. The budget process is long and involves many levels and stakeholders. For instance it should involve the public, local governments, civil society organisations etc but such entities may not have adequate knowledge and technical knowhow to Facilitate the budgeting process
- Constant political instabilities which increase government expenditure. Instability also disrupts production and thus reduces tax base and tax revenue. Instabilities disrupt the whole budgeting process.
- Corruption. This is an evil that affects the whole economy budgeting inclusive. Corruption affects collection of revenue, limits effective implementation of budget outlines, and increases spending. Outlined expenditures may be inflated.
- Influence from donors. Funding from international sources may be unreliable. It may delay or come in instalments. More so it may come with strings attached that may not serve national interests.
Low tax revenue: This is caused by,
- Low tax base which reduces tax revenues. This makes expected incomes low. It is a result of low levels of economic activity in developing economies. It strains the budgeting departments on how to raise enough revenue to support the expected expenditure.
- Weak tax administration, high levels of tax evasions and avoidance which reduces tax revenue.
- Low taxable capacities because of low incomes and high poverty levels which reduces government revenue.
- Low level of economic activities. This reduces the tax base and reduces tax revenue.
Ever increasing expenditure. This is a result of,
- High demand for infrastructures. Developing countries require rapid expansion of basic infrastructures like roads and railways, education institutions, health care facilities etc to foster growth which increases government expenditure.
- Persistent debt servicing which increases capital outflow and therefore leads to increase in government expenditure.
- High population growth rates increases government expenditure on public utilities.
- High marginal propensity to import in LDCs is high. This increases import expenditure by the government
9.3.6. Measures to reduce budgeting problems.
- Maintaining budgetary discipline by the government to reduce unnecessary spending. This reduces government expenditure.
- Increasing training of labour in the budget and revenue departments. This avails the necessary skills and labour force for the budget department.
- Increasing the tax base through industrialization and the introduction new taxes. This increases government revenues.
- Reduction of corruption among the revenue department. This helps reduce revenue losses which in turn expands the revenue base of the government.
- Reducing smuggling by harmonizing some tax rates with those of neighbouring countries. Smuggling reduces government revenue.
- Increasing the taxable capacity of the people. This can be done increasing the level of economic activity as a way of increasing their incomes.
- Encouraging domestic and foreign investor through tax holidays and provision of infrastructure and other means. This increases production and tax base.
- Restructuring the revenue department to make it more efficient. This strengthens tax administration and increases tax revenues. For instance increasing the number of tax collecting centre. This makes it convenient for tax payers to pay; enhances tax education and encourage taxpayer to keep books of account and regulating and redirecting as well as reducing tax exemptions.
- Increasing transparency in utilization of taxes so as to increase compliance to tax payment.
APPLICATION ACTIVITY 9.3
Assume you are the head of an education institution, with a total enrollment of 200 students all staying inside the school. The tuition fee is 100000frw per child per term. The term is 12 weeks. Below are some of the items upon which money is spent.
- Staff salaries (both academic and nonacademic 30 members)
- Feeding.
- Power.
- Water.
- Examination costs.
- Accumulated debts.
- Administrative costs.
- Etc.
Analyse the information given above add other items in the “etc” above. Prepare a draft statement (Budget) that shows how you intend to spend the money effectively till end the term.Which other means can you use to raise more money to finance school requirements in order to avoid debts?
9.4. PUBLIC DEBT
LEARNING ACTIVITY 9.9
Composition of debt portfolio
External debt: Concessional loans are mainly provided by the World Bank IDA and African Development Bank AfDB (together, reflecting 60percentof total external debt). Other key external funders include the Arab Funds, ADB, JICA, EU, China, and India. The funds were used for projects in the areas of transport, construction, energy, poverty reduction and rural development. In terms of currency composition, the SDR has the largest portfolio share.
Domestic debt: Domestic debt is mainly composed of short and longterm debt, while short-term debt constitutes 45percent of domestic debt with issuance of treasury bills. (Medium Term Debt Strategy. Ministry of finance and economic planning 2018/19–fy 2020/21)
a. From the above passage, what do the following mean to you?
i. External debt.
ii. Domestic debt.
iii. Concessional debt.
iv. Short term debt.
v. Long term debt.
b. In your own view, why do you think government borrows either
from domestic or external sources?
9.4.1 Meaning and Types of public debt.
Public debt is the borrowing of the public sector which includes debts of the central government plus debt of the public bodies like local authorities and public corporations.
A national debt is total borrowing by the central government both internally and externally.
9.4.2. Types of public debt.
ACTIVITY 9.10
Make research on the different types of public debts. Each group makes a class presentation.
- Internal debt: When it is raised within the country of through the sale of securities with in the country. Domestic corporate bodies buy such securities and help the government to raise money to finance its activities.
- External debt: When it is raised from other countries and/or from multilateral bodies like the World Bank and IMF.
- A reproductive debt: This is when the money is used to finance productive activities which would generate revenue to pay back such debt (self-liquidating debt) e.g when the funds are used to establish a firm that can make profit part of which can be used to repay the debt.
- A dead weight debt: This is when the borrowed funds are used to finance activities which would not bring in direct returns to repay the debt e.g if the borrowed funds are used to buy firearms or used for consumption.
- A funded debt: This is a form of public borrowing where the specific date of repayment is not fixed at the time of getting loan. The borrower keeps paying interest until a time comes when he feels he can now pay the principle.
- An unfunded debt: is where the redemption date (date of repaying the debt) is known (fixed) at the time of securing the debt.
- A short term debt. This is a debt that has a short maturity period e.g debts contracted by issuing treasury bills.
- A long term debt. This is a debt that has a long term maturity period.
9.4.3. Causes of public debts.
ACTIVITY 9.11
“… Rwanda’s main concessional creditors are IDA, AfDB and IFAD, whose funds were used for projects in the areas of transport, construction, energy, poverty reduction and rural development…” “… in April 2013, Rwanda issued its first international bond for $400 million in order to repay an expensive debt owed to Citi and PTA Bank by RwandAir as well as to finalize the construction of the Kigali Convention Center and to invest in a hydro power project..”. The New Times, January 11, 2015.
a. With reference to the above passage, identify the different reasons why the government borrowed money.
b. Can you give other reasons not highlighted in the passage that may necessitate borrowing by the government? Public debts are monies contracted by the government and other public bodies and local governments to finance projects that beneficial to the society. Certain conditions create a need for government to contract debts. These conditions may originate from within the establishment or may be informed by other factors.
- Lifting the economy out of an impending recession. In a situation where the economy is experiencing difficulties and there is a slowdown in economic activities, the government may contract debts to revamp the economy. Funds contracted from outside are injected into the economy to stimulate production.
- Recapitalising government firms that may be faced with financial crises. In some cases, debts are contracted to bail out firms public or private. There are firms that form pillars of the economy and /or are strategic to the country. For instance airlines, banks, etc. The collapse of such firm may spell doom to the economy. They are essential in absorbing much of labour force; contribute a lot to government revenues through taxation; stimulate production in other sectors and create incomes for the public through the multiplier effect. In case of financial crises in these firms, the government may contract debts to recapitalise them.
- Desire to establish big productive infrastructures. There are big projects that require a lot of funds at once and cannot be finance throughtaxation. For instance construction of airports, railway line, dams. Debts may be acquired to finance such projects.
- Servicing past accumulated debts of high interest. Debts conversion is the contraction of new debts at a lower rate of interest to service old debts of a higher interest rate. This may be the reason for acquiring public debts and it is one way of reducing the volume of public debts.
- Expanding populations that increase the demand for social services. One of the functions of government is to provide services like health care, security, education, water and sanitation services to the people. Expansion of the population implies an increase in the government responsibility to provide for the people. This increases government expenditure. In turn it may call for public borrowing to finance this increased expenditure.
- Natural calamities. Some debts are contracted to finance expenditures that comes as result of natural catastrophes like earthquakes, storms, droughts, etc. These happenings create a need for huge and urgent expenditures for relief services. This calls for immediate borrowing by the government.
9.4.4: Consequences of public debts.
ACTIVITY 9.12
Debt serving
“…External debt servicing burden increased between June 2013 and June 2014 mainly because that period marked the first fiscal year in which a full year of Eurobond interest repayments had to be made, the Ministry of Finance says. The country dedicated 4.5 per cent of export earnings to service the debt burden in 2013. For the year 2014, the government had committed to dedicate 5.3 per cent of all export revenues to reduce the debt burden. Apart from export earnings, governments usually use a portion of domestic tax revenues to pay off debts. In 2013, the government committed 4.2 per cent of total revenues to debt servicing while in 2014, that portion was increased to 5.3 per cent of all projected collections last year. The first ever projection by the ministry shows that the national debt outlook is sustainable from 2014 through 2034…” The New Times, January 11, 2015. Discuss the view that “Rwanda should rely more on domestic resources than external resources to finance her budget” Public debt/borrowing has the following consequence,
- Debt servicing reduces money available for consumption and private investment. It is a form of foreign exchange outflow.
- Taxes may be increased to pay the debt. This increases the tax burden on the public especially if it is an external debt.
- Repayment of the debt reduces foreign exchange available for imports and investment. In the long run, debt repayment may run down the available foreign exchange reserves and the economy as well.
- It leads to over dependence. The recipient country depends on the donor/lender country. The economy may be put at a risk in case the donor country with draws or changes the arrangements of the debt.
- Some loans may be “tied” with “strings” which may not be in line with national interest. Borrowed funds may be used by the donor country to export its interests to the recipient country.
- Long term debts shift the burden of repaying the debt the future generation. The future generations who will have not enjoyed anything on the borrowed funds may incur the cost of repaying
- There is a burden of paying interest in foreign currencies which is expensive. This is because the taxes are paid in the domestic currency. But the external debt is paid in foreign currencies whose values are usually high. This exploits the tax payer Public debts though may bear a growth effect on the economy. It’s the reason developing countries continue borrowing especially from external sources to finance their development expenditure and internal sources to finance recurrent expenditure as well as maintain macroeconomic stability. For instance,
- The government can channel the borrowed funds to the private sector to boost it up and increase the level of economic activity.
- External borrowing is a flow of foreign exchange into the country. It increases money supply which in turn expands aggregate demand and employment of resources. It is a form of foreign exchange in flow.
- Borrowed funds can be used to clear past debts through debt conversion.
- Internal borrowing through the sale of securities (e.g treasury bills)
reduces money supply and inflation. This brings about macroeconomic stability in the country.
- It helps the country that has suffered calamities like drought, floods and wars i.e humanitarian reasons
- In the short run it helps the government to finance its budget without taxing people so much
- It can be used to import manpower (skilled labour) and thus helps to fill the man power shortages in LDCs.
- It enables the government to finance the budget without printing more money. Printing more money is inflationary.
- Internal borrowing enables the private sector to earn interest. Those who buy government securities earn interest.
- Government securities are risk-free liquid assets in which companies invest their money. It is a source of government revenue for spending on infrastructure and investment as well as running other state activities.
APPLICATION ACTIVITY 9.4
As members of economics club, hold a meeting with your executive committee. Let them present to you the previous year’s performance appraisal including financial reports if any. Analyse the following
i. What were the planned activities for the year?
ii. Activities that were completed and those that were not completed and why?
iii. What were the total finance and expenditure for the year? Is there any balance or a deficit on the club’s account? If a deficit, what caused it? What contingency plans does the executive committee have to cover the deficit?
9.5. Public expenditures.
LEARNING ACTIVITY 9.13
Make research and find out how much money is spent by your district,
i. On wages of workers and date today activities of the district.
ii. Long term investments like construction of market infrastructure.
iii. Find out other areas where the district spends money.
9.5.1. Meaning and types of public expenditures.
As mentioned earlier, classical economists advocated for a free enterprise economy where the role of government is minimal in the growth of economies. Reduced government participation means that government expenditure is limited. However, with the expansion of economies, there has been a need for government participation in regulating them. This has called for more government spending on such activities.
Public expenditures is the spending made by the government on collective needs and wants of the public. It is expenditure on developmental and non developmental activities of the country such as infrastructure, pension etc
9.5.2: Types of public expenditure:
There are basically two types of government expenditure and these include
- Development expenditure.
- Recurrent expenditure.
Development expenditures. This is government spending on long term projects that result into long term growth and development of the economy. For instance expenditure on projects involving construction of
- Dams.
- Airports.
- Railways.
- Water and sewerage facilities. Etc.
In developing economies, development expenditure is usually financed by borrowed funds. This is because it requires huge sums of money at once. Yet revenue from taxes is low and comes in slowly.
Development expenditure establishes long term projects.
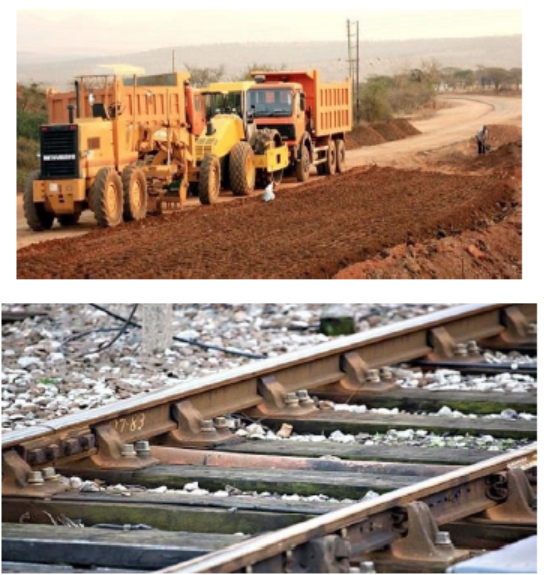
- Recurrent expenditure.
This is expenditure on the day to day running of government activities. For instance expenditure on salaries of public servants, transports costs involved in administration, hiring and maintaining of properties like offices, as well as other administrative costs. Recurrent expenditure is usually financed through taxation. This is because it does not require so much money at once.
Public expenditure is based on the following principles:
- Principle of healthy effect on production and distribution.
Government spending should promote economic activities and distribute incomes equally. It should avoid bringing inequalities and other negative effects like inflation.
- The principle of maximum social advantage. The whole society/public should benefit from the outcomes of public expenditure. The benefits of government spending should accrue equally to all citizens of the country.
- The principle of sanction. All government expenditures should be sanctioned by an authority with vested powers to do so. This helps to promote accountability and avoids wasteful spending.
- The principle of elasticity. Public expenditure need not to static.it should changes with changes in the economic conditions in the country. For instance during the period of recession, public expenditure should be increased so as to expand economic activity and prevent the economy from receding into a depression. During inflationary periods, public expenditure should be regulated in such a way that inflationary pressures are put under control.
- The principle of economy. There should not be wasteful spending and extravagance in sending government revenue. Government spending should be for the justified cause and for planned activity. Unplanned expenditures have no productive effect on the economy and may bring inflation.
- The principle of balance. A balance should be kept between expenditure and revenues. Implications of surpluses and deficits should be minimize
9.5.3. Purpose of Public expenditures
LEARNING ACTIVITY 9.14
Identify some of the economic problems highlighted in the picture below. Discuss how the government can use its expenditure to lift the economy out of these problems?

Government spends money to achieve the following:
- Maintaining security of person and property. One of the most important roles of government is to provide and maintain security in the country. This is done by the security organs of the state may include but not limited to the army and the police. This function attracts public expenditure for instance, in most developing countries; the defence ministry usually takes the lion’s share of the national budget. .
- Public expenditure is used for making payments to administrative
functions. Public servants salaries, transport costs, and other administrative costs are financed through public expenditure.
- Influence economic activity. Public expenditure may be aimed at directing economic activities towards the desired objectives. This can be achieved by increasing money supply through increasing public expenditure. For example, education can help increase labour productivity, reduce structural unemployment and increase rate of growth.
- Establish public goods that cannot be provided by private sector. The establishment, installation and maintenance of facilities like street lights, weather stations, etc is done through public expenditure.
- Provision of social services. Public expenditure is used to establish facilities that provide social services as education and health care. These are important for increasing the quality of life and economic wellbeing of the public.
- Increase Productive Capacity of Economy. Government spending may be aimed at correcting market failures. For instance stimulating aggregate demand and encouraging production, recapitalizing banks, all aimed at increasing employment of resources. This raises the rate of economic growth
- Ensuring a balance growth in the economy. Public expenditure may be used to bring about equality among individuals, sectors and regions. This is done by regulating and directing government spending towards realization of this objective.
9.5.4: Ways of reducing public expenditure.
Public expenditure can be reduced through the following ways,
- Privatisation. Transferring government enterprises into private hands to reduce government responsibilities.
- Controlling population growth rates as a way of reducing government expenditure on social services.
- Maintaining political stability to reduce defence expenditures and stimulating production.
- Reducing reliance on external borrowing to avoid high foreign exchange outflow in form serving foreign debts.
- Sourcing concessional loans that are cheap in terms of interest.
- Reducing government expenditure on non-productive ventures that don’t bring in direct returns.
APPLICATION ACTIVITY 9.5
Discuss the effect of the following on the economy,
i. Government spending millions of francs on construction of a standard gauge railway line from the Ugandan border to the border with Burundi.
ii. The government increasing the wage bill, pension and transport allowance to public employees in a fiscal year.
iii. The completion of the construction of a modern class airport in
Bugesera.
SKILLS LAB
As members of the economics club, brainstorm and identify the following
for next term
i. Planned activities for next term.
ii. Expenditures for the planned activities
iii. Sources of finance to run the above activities.
iv. Supposing the planned sources do not bring in enough funds, what
other contingency strategies have you put in place to raise the money?
After, design a budget for the club for the next term.
Make a presentation to the class.
END UNIT ASSESSMENT
1. Explain the ways how the government may influence the level of economic activity in the country.
a. Explain the different ways through which the government raises its revenue.
2. Distinguish between a deficit budget and a surplus budget.
a. Explain the implications of the following
i. Balanced budget.
ii. Surplus budget.
iii. Deficit budget.
3. Explain the following terms as used in public finance.
a. Public debt.
b. National debt.
c. Internal debt
d. Reproductive debt/self-liquidating debt
e. Dead weight debt
f. Funded debt
g. Unfunded debt
h. Long term debt.
i. Debt servicing
UNIT 10 PUBLIC FINANCE 2
Key Unit Competency: Analyze the role of public finance in economic development.
INTRODUCTORY ACTIVITY
Read the passage below, discuss and answer the questions that follow. In 2017/18 fiscal year, the Rwandan economy recorded a good performance, as indicated by moderate inflation and a high real GDP growth of 8.9%, which was higher than the projected GDP growth of 6.5%. This economic performance, combined with other internal administrative measures positively contributed to the good performance of revenue collection. The total revenue collection (tax and non-tax, excluding local government collections) amounted to Frw 1,252.3 billion against the target of Frw 1,215.2 billion which is an achievement of 103.1%, and an excess of Frw 37.1 billion above the target.
Local Government taxes and fees collections totalled Frw 53.9 billion, which is an achievement of 104.2% of the Frw 51.7 billion target and a surplus of Frw 2.2 billion. This represents year-on-year growth of 12.5% and a nominal increase of Frw 6.0 billion. With regard to administrative measures, a total of 20,450 new taxpayers were registered and newly registered taxpayers contributed Frw 9.6 billion...” (RRA. ANNUAL ACTIVITYREPORT 2017/18 OCTOBER 2018)
i. What do you think a “fiscal year” and “revenue collection” mean?
ii. According to the passage, what contributed to ‘good performance of revenue collection’?
iii. Why do you think your district need money for?
iv. In your own view, what could be the examples of ‘internal administrative measures’ implied above?
v. What do you think are the non-tax sources of revenue?
vi. Which examples of district revenue collections do you know?
vii. Why do you think more tax payers were registered?
viii. In your own view, how was Rwf 1.252.3 billion collected revenue spent
by the government?
10.1. Taxation
ACTIVITY 10.1

Move around the school community and find out the following,
i. Which body uses the above logo?
ii. When and why was RRA created?
iii. What are the various services offered by RRA to tax payers?
10.1.1. Meaning of taxation.
In unit 9, we looked at the role of the government in driving the economy towards full growth. The government carries out a number of activities that need financing. One of the major sources of government income is taxation.
Taxation is a compulsory and legal transfer of money from the public (individuals and companies) to the government. Taxation is one of the major sources of government revenues. A tax is taken to be a non quid pro quo payment. The gain that the tax payer gets from the tax paid does not necessarily have to be equal the value of the tax paid. Taxation issues in Rwanda are responsibility of Rwanda Revenue Authority (RRA).
10.1.2 Common Terminology used in taxation.
ACTIVITY 10.2
Make research explain the following terms as used in taxation. Tax base. Tax evasion. Tax avoidance. Advalorem tax. Taxable income. Taxable capacity. Burden of a tax. Money burden. Real burden. Forward shifting of a tax. Backward shifting of a tax. Effect of a tax. Tax incidence. Specific tax. Marginal rate of taxation. Lumpsum tax. Rate of taxation. Average rate of taxation.
Using the formulae given, study the figures in the table and compute
i. Rate of taxation in each country income level of 200000.
ii. Average rate of taxation for both countries at 350000 level of income.
iii. Marginal rate of taxation in country B when income increases to
500000.
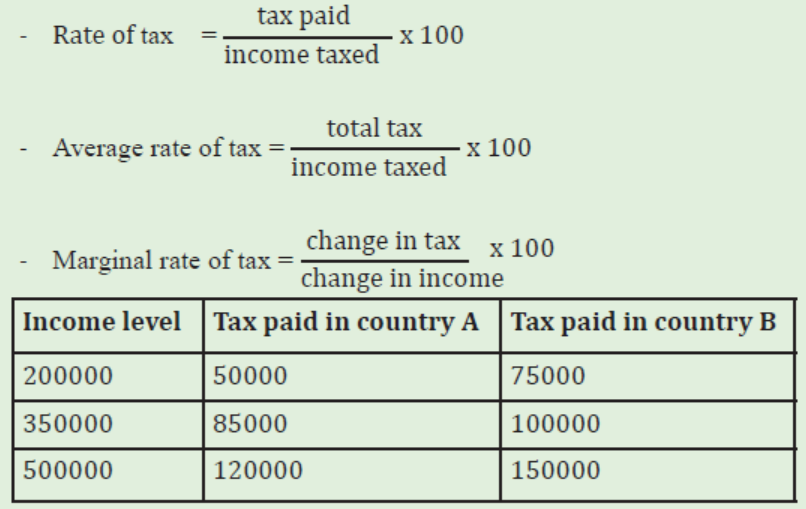
Terms used in taxation include the following:
- Tax evasion. This refers to the tax payer’s refusal to pay the tax assessed on him. It is an illegal action and punishable by law.
- Tax avoidance. This is where the tax payer uses the weaknesses of the tax law/ system to dodge the tax assessed on him.
- Advalorem tax is a tax that is levied according to the value of the commodities involved. For instance, the tax payer pays 10% of the nominal value of the commodity. The higher the value of the commodity, the higher the tax paid.
- Taxable income. This is the proportion of the tax payer’s income that is liable to taxation.
- Taxable capacity. This is the ability of the tax payer to pay the tax assessed on him and remain with enough income to maintain him in the life he is used to.
- Burden of a tax. Money burden of a tax is the struggles that the tax pay undergoes to raise the money to pay the tax while Real burden of a tax occurs when one foregoes consumption of a commodity because of the tax imposed on it.
- Forward shifting of a tax. This is where the seller pushes the tax burden on to the buyer in form of high price charged on the buyer.
- Backward shifting of a tax. This is where the seller pushes the burden of the tax to the supplier of inputs by negotiating for a reduction in the price of the inputs.
- Effect of a tax. This refers to the outcome/ repercussions of a tax on certain variables like production, employments, investments, etc.
- Tax transformation: This refers to substituting the production of a taxed commodity by a nontaxed commodity so as to avoid the effect of a tax. For example if a person has been importing clothes in Rwanda and they are taxed, he or she can shift to electronics like computers that are tax free.
- Tax rebate: This is a refund on taxes when the tax liability is less than the taxes paid. Or this refers to the reduction of tax rates to private investors to encourage investments.
- Tax burden: This refers to direct impact/ effect felt by the person who pays the tax. e.g. when a person pays tax, he may remain with little disposable so tax leads to loss of money by the tax payer.
- Rate of taxation is the percentage of income (tax base) that is paid as tax.

- Average rate of taxation is the total tax paid as a percentage of income (tax base)
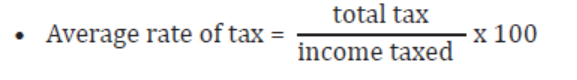
- Marginal rate of taxation is the rate of tax that is paid on any extra unit of income (tax base) earned.

ACTIVITY 10.3
In the diagram below, identify the items that can be taxed. What can we call these Items that make the basis of taxation? And discuss why items that can be taxed are still few in developing countries.

- Tax base. This refers to the item upon which the tax is imposed i.e what makes the basis of taxation. This may be income, property, goods, etc. In developing economies, the tax base is still narrow because,
1. Low GDP. This implies a low level of economic activity.
2. High unemployment levels. They unemployed have no incomes to make up the tax base.
3. Low taxable capacity because of low incomes.
4. Developing economies are dominated by a large subsistence sector which keeps the scale of production and incomes very low.
5. Low levels of industrialization.
6. Low investments keep the level of economic activity low.
7. Poor tax administration and high tax exemptions.
- Tax incidence refers to the final resting of the tax. Who actually bears the burden of a tax when it is imposed? When the government imposes a tax on the firm, the firm may push it to another payer depending on the price elasticity of the commodity involved. For instance,
1. When price elasticity of demand is perfectly inelastic, the whole tax burden is borne by the consumer alone as illustrated below.
2. When price elasticity of demand is fairly inelastic, the burden of the tax is shared between the consumer and the seller but the consumer bears the largest portion.
3. When price elasticity of demand is unitary elastic, both the producer and the consumer share the tax burden equally as shown below.
4. When price elasticity is fairly elastic, the producer and the consumer share the burden of the tax but the producer bears the largest portion of it, as shown below.
5. When price elasticity of demand is perfectly, elastic, the whole burden of the tax is borne by the producer.
10.1.3. Role of Taxation.
ACTIVITY 10.4
Discuss the view that taxes bring more good than harm to our economy. Make class presentation.
The government levies a variety of taxes with different objectives. Taxation plays a big role in the growth of the economy. Government uses tax revenue to
finance her recurrent and development expenditure.
Positive Role of taxation:
- Source of government revenue. Most of the country’s recurrent expenditure is financed through tax revenue. Tax revenue forms the bigger percentage of the revenue that is spent on running the day today activities of the government.
- Taxes can be used to protect domestic infant industries. Tariff barriers protect the domestic infant firms from competition from foreign big, old and efficient firms.
- Reduce income inequalities. This can be done by taxing the high income earners highly and using the revenue from the taxes to subsidize the low income groups.
- Restrict consumption of harmful product. Such commodities may be highly taxed to reduce their demand.
- Reduce BOP problems. Taxation can be used to reduce a country’s import expenditure by taxing the imports heavily to reduce them. Heavy taxes on imports reduce their demand by making them expensive depending on their elasticity of demand.
- Reduce population growth rates. This is done by taxing large families and giving incentives to smaller families.
- Balance regional development. Taxes can be used to redirect resource distribution and allocation to achieve balanced growth in the economy.
- Taxation is used to charge those who use public utilities established through public expenditure. Such utilities like airport, railways, etc are established by the government through public expenditure but are used by a few. For instance, a big number of the population in developing counties who pays taxes do not travel by air.
- Stimulates hard work. It arouses a spirit of hard work among tax payers as they try to raise money for payment of taxes.
Negative role of taxation
- Taxes increase prices of commodities. High tax rates especially on inputs increase cost of production resulting into high prices on commodities. Continuous increase of taxes on inputs may result into cost push inflation.
- Reduce disposable incomes and the general standards of living. Increase in direct taxes reduces peoples’ disposable incomes. This has a negative effect on consumption and the general standards of living of the consumers.
- Reduce personal savings and investments. High rates of direct taxes reduce people’s disposable incomes and their personal savings. High rates of indirect taxes increase the price of commodities leading to increase in their consumption expenditure and reduction in savings.
- Indirect taxes increase the costs of production if imposed on inputs. This will reduce the volume of production and supply of goods and services leading to further increase in prices resulting into inflation..
- Tax on imports may protect firms from competition. Lack of competition make firms inefficient and produce low quality products.
- Direct taxes kill the incentive to work especially if the rates are high. When taxes take more of the workers’ income, they lose the morale to work more.
- High tax rates discourage accumulation of wealth. Direct taxes reduce disposable incomes that would have been used to acquire wealth. Indirect taxes increase prices of commodities and consumers’ expenditure thereby reducing peoples’ capacity to acquire wealth.
- High tax rates may cause discontent and unrest tax payers. This may have negative political implications on the country.
10.1.4. Principles or Canons of taxation.
ACTIVITY 10.5
Mutoni: Do you know Ntwali? I am going to expand my business. With these new tax rates I can now manage to pay all the taxes. Last week I paid the tax and remained with more money to clear other costs including rent for the new store and fees for the children.
Ntwali: For me I now understand very well these new taxes that have been introduced. How and where the taxes are levied, and how much I am supposed to pay this time. Even Christine, who has a similar business as mine, shall pay the same amount as do.
Mutoni: And you see, for me I get money after harvest, now they fixed the date of payment immediately after harvest. Now I will get the money at the right time. On top of that, even the revenue office was shifted and brought nearer. I will not spend any more money and time in order to pay.
John: And I hear that you can even pay using mobile money. Do you know that they will even collect enough revenue this time? They will not spend a lot of money hunting for the defaulters this time…. Read the conversation above, and identify what you find to be the good things that the two are happy about the system of taxation.
Principles (canons) of taxation are rules and regulations or guidelines that
must be followed in the assessment, collection and administration of each and every tax.
- Convenience. The time and place of payment should be convenient to the tax payer in order to make it easy and less costly for him to pay the tax.
- Simplicity. The tax, method of assessment, need to easy to be understood by the tax payer. This simplifies tax education.
- Certainty. The tax payer should be sure of the amount, the tax base and time of payment and any other issues related to the tax. This helps to avoid tax evasion.
- Economy/cheap. Tax collection should be as cheap as possible. The cost of collection should not to exceed 5% of the collected revenue.
- Elasticity. The tax rates should be able to change with changes in the tax base.
- Ability to pay. Tax assessment should consider the ability of the tax payers to pay the tax assessed on them. It should consider the taxable capacity of the tax payers.
- Productivity. Each and every single tax should produce high revenues.
- Equity. The tax should impose equal burden to all tax payers.
1. Horizontal equity implies that people with the same tax base should pay the same amount in tax.
2. Vertical equity implies that people with different tax base should pay
different amounts in tax.
APPLICATION ACTIVITY 10.1
Make a visit to a nearby market or trading centre and inquire from the traders about
i. The different taxes they pay, places and means of payment.
ii. The challenges they face in paying taxes.
iii. What they think can be done to improve the tax system in the country.
iv. Make an analysis of the information derived from your visit to see if the principles of taxation are followed.
10.1.5. Types, Classification of Taxation.
ACTIVITY 10.6
For the following groups of tax payers, compute the tax rate for each of the tax payers below.
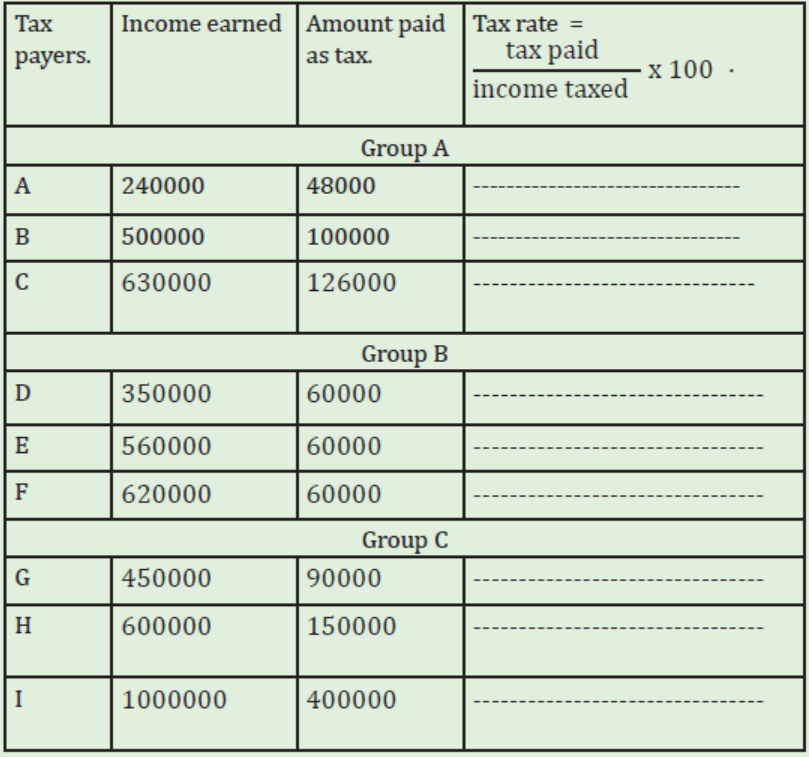
Compare the tax rates in the three groups.
i. What is the relationship between the tax rates in each group?
ii. According to you in which group do the tax payers feel the burden of the tax more?
iii. From which group is the government likely to collect more tax revenue and why?
a. Classification of Taxation.
Taxes can be classified according to:
- The proportion of the tax base that is taken by the tax.
- The tax incidence.
i. Classification according to the proportion of the tax base that is taken
by the tax gives the following,
- Proportional tax.
- Regressive tax.
- Progressive tax.
- Deregressive tax
b. Proportional tax: This is where the tax rate does not change with changes in income/tax base i.e. income increases but the tax rate remains constant. The tax is paid in proportion to the income. Assuming the tax rate is 10%, one who earns 300000frw shall pay 30000 as the tax while one who earns 500000frw pays 50000frw as tax.
Proportional taxation is taken not to promote equity in full sense of the word. It hurts the low income earners more than the high income earners. It is argued that there is an inverse relationship between income and the marginal utility of money. As income increase, the marginal utility of money reduces. This implies that, for instance, the marginal utility of 10000frw has a more value to someone earning 100,000frw than one earning 300000frw.
c. Regressive tax. This is where the tax rate reduces as the income increases i.e the proportion of the tax base taken by the tax reduces as the tax base expands. For instance, if the tax on all tax payers is 50000frw, it would be regressive. One who earns 200,000frw he shall be paying 25% of his income as tax. One who earns 500,000frw shall be paying 10% of his income as tax. This kind of taxation hurts the low income earners more.
d. Progressive tax. This is where the tax rate increases with increase in income/tax base i.e. as income/tax base increases, the tax rate also increases. For instance, if the tax rate is 0% for one earning 10000frw and bellow, 5% for one earning an income between 10001frw and 50000frw, 10% for income between 50001 and 100000frw, and 20% for incomes between 100001 and 200,00frw, then it is progressive taxation.
e. Progressive taxation is supported basing on the following, progressive taxation leads to equality of sacrifice. As the income of a person increases, the marginal utility of income gradually decreases. Then if higher incomes are taxed at a higher rate, it conforms to the principle of justice.
- Progressive taxation yields more revenue to the government.
- Progressive taxation is helpful in reducing the inequality in income by higher taxation oh the rich members of the society.
- Progressive taxation conforms to the principle of elasticity. The tax increases as the base increase and this raises more revenue.
- By reducing inequality of incomes and redistributing incomes equally, progressive taxation increases the MPC in the country. This increases aggregate demand which stimulate investment and employment. However progressive taxation is criticized on the basis of the rate of progression.
- If the rate of progression is very high, it will discourage saving, hamper the accumulation of capital and thus reduce the economic development of the country
- It is argued that high rates of progression encourage tax evasion. Tax payers will try to hide their incomes by making false declarations. This makes the government lose revenue.
f. De-regressive tax This is a tax system which has progressive elements at
lower levels of income but the amount remains uniform at higher levels of income.
The rates can further be illustrated as seen below:
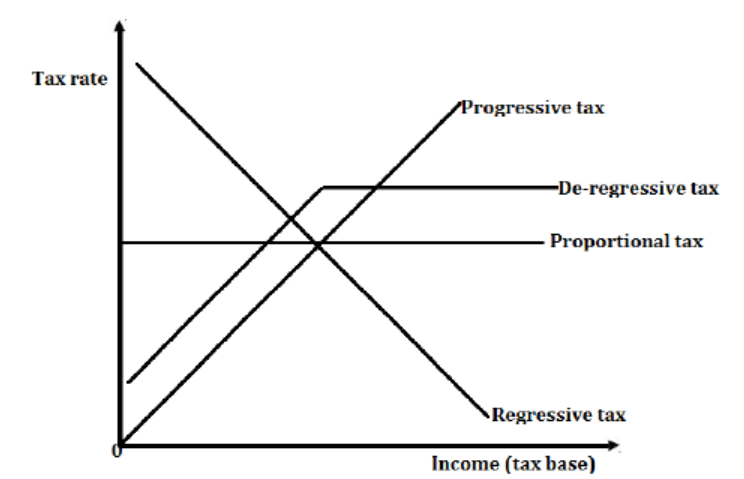
From the figure above, it is seen that;
- Proportional tax, the tax rates are the same for different income groups,
- Progressive tax, the rates increase with increase in incomes
- Regressive tax, the tax rate reduces with increase in income
- De-regressive tax, the tax rates increase first then they become constant at some state. I.e. it has progressive nature and then proportional rate at a later stage.
As income increases, the tax rate also increase with progressive taxes, the tax rate remains the same with proportional taxes and the tax rate reduces with regressive taxes.
Classification according to the tax incidence.
ACTIVITY 10.7
Public servant: I was charged 10% of my salary. And the accountant told me it was forwarded to RRA as tax as PAYE.
Entrepreneur: Yah. That is it. For us when we produce juice, we pay 5% of the net profits. We used to pay 1000rwf per litre produced. Earlier on it had been 10% of the market price of each litre.
Land lord: For me, I pay 20% of my annual rent that I get from my house that bought near the tax park. Any way last year, when my son sent for me a brand new car on my 50th wedding anniversary as a present, we had to pay some money for it to RRA.
Entrepreneur: And do you remember the other year when there was Elnino that destroyed much of people’s agricultural crops. Experts announced that it was a result of over cutting of trees that caused changes in weather conditions and seasons. And we had to pay a special contribution to provide relief to the affected people.
Public servant: By the way, always check well on some commodities like air time cards when you are buying, you will read some words like ‘18% VAT inclusive’.
Land lord: And when I import some of the building materials I use on my houses, I pay money for clearing them at the point of entry.
Read through the conversation above, and identify the following,
i. The kind of ( payments/taxes) implied.
ii. The items that are being taxed.
iii. Any other kind of tax that you know which is not highlighted in the conversation.
Classification of taxes according to the tax incidence gives the following:
Direct taxes.
Indirect taxes.
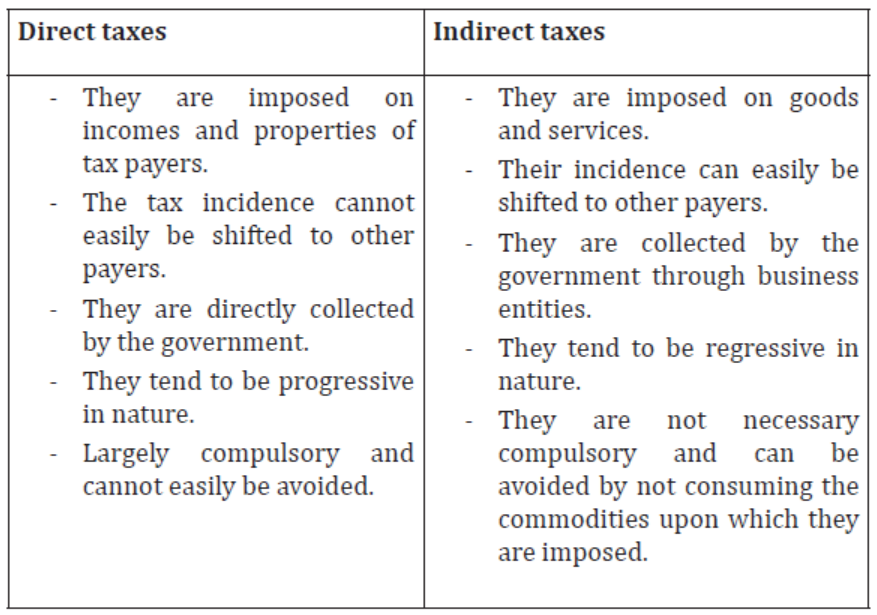
a. Direct taxes.
These are taxes that are levied on incomes and properties of individuals and their incidence cannot easily be shifted to other tax payer. e.g. land tax, incomes tax. It is a tax paid by the person on whom it is imposed. The government expects that the tax burden rests permanently on the person who pays the tax. The tax paid normally varies with the status of the tax payer.
Examples of Direct Tax include the following:
- Personal income tax. This is the tax that is imposed on people’s income beyond a certain amount i.e beyond the taxable income.
- Corporation (company) tax. This is levied on the profits of a company.
- Capital gains tax. It is imposed on the increase in the value of an asset that has appreciated at the time of sale. Capital gain is profit realized from the sale (disposal) of a capital asset, or from holding it during a period when its market value is increasing.
- Property tax. (Land tax). This is the tax that is levied on land whether developed or not and /or houses located in a district or urban centre. The tax rates are decided upon by the local authorities involved.
- Gift tax. It is a tax levied on the assets/ wealth of an individual when ownership is being transferred to another in form of a gift.
- Super profit tax.
- Capital levy. This is direct tax assessed on the capital resources of all persons possessing taxable wealth in excess of a minimum value and paid once as a contribution towards a national cause. Capital levy aims at making the public part with part of their wealth to enable the government to cope with some non recurrent major emergency, for instance settling the national debt. A capital levy is a one-time tax on all wealth holders with the goal of settling an issue of national interest. The example of a capital levy is the public contributions to the Agaciro Fund.
- Inheritance tax. is a tax paid by a person who inherits money or property on the estate (money and property) of a person who has died. The beneficiary is responsible for paying the tax. An inheritance can be taken under a will or in some other way such as, for example, where an asset in the joint names of the deceased and another person is taken, on the death of the deceased, by that other person as survivor.
- Trade license tax. This is a decentralized tax is paid by any person who commences a profit oriented activity in the country. It is paid annually following a calendar year.
- Rental Income tax. This is a local government tax that is charged on income generated from rented houses and located in the country irrespective of the country of their beneficiaries residence or home. This tax is charged on profit on rented houses and land and net profit of a person who rents out any assets or part of it
ACTIVITY 10.8
Discuss the view that Rwanda should rely more on direct taxes than indirect taxes.
Advantages of direct taxes.
- It is easy to determine the incidence. The tax payer on whom the tax has been imposed usually is the one who pays the tax.
- They are certain i.e taxpayers can easily determine the amount to pay.
- They are progressive in nature i.e the tax rates increase with increase in the tax bases.
- They are sources of government revenue.
- They are simple and easy to be understood by the tax payer. The amount to pay, how it is arrived computed, and the time of payment is easy to understand.
- They are easy to collect. This makes them cheap.
- They are flexible. They can be changed with changes in the tax base. This increases tax revenue.
Disadvantages of direct taxes.
- They affect the incentive to work and savings of rich people because they tend to be progressive in nature. They tend to increase with increase in incomes.
- The burden of tax is easily felt directly unlike indirect taxes which are paid as one buys the commodity.
- Direct taxes discourage accumulation of capital. High rates of direct taxes reduce the disposables incomes of tax payers. The incomes that would have been used to acquire private capital goods is taken by the direct taxes.
- They have low tax base e.g for income tax, the tax base remains the income and may not be widened what exists at the time.
- They discourage production.
- They are inconvenience to tax payers
a. Indirect taxes.
These are taxes that are imposed on commodities (goods and services) e.g excise duty or VAT.
They are levied initially on the importer, producer or whole seller but ultimately paid by the consumer since they are included in the price of the final products sold at the market. This depends on the price elasticity of demand
Examples of indirect taxes
- Import duty. It is a tax that is imposed on imported commodities. It is usually used for protectionist objectives.
Export duty. It is a tax that is imposed on a country’s exports. It is essential
in reducing the volume of export in order to protect a local industry from
shortages of raw materials, protect local population from shortages of
foodstuffs or other essential goods, maintain international commodity prices
or orderly marketing, maintain export restraint agreement with the members
of a producer’s cartel (such as OPEC), maintain export restraint agreements
with consumer countries etc.
- Sales tax. It is a tax that is imposed on a commodity at the time of its sale. It is borne by the seller or the buyer depending on the price elasticity of demand in the market.
- Excise duty. This is a tax that is levied on locally produced products.
- Value Added Tax.
It is a tax that is imposed on the ‘value added’ on the commodity at each stage of production and distribution. Value Added Tax will be equal to:
Output tax minus input tax.
Some goods and services are exempted from VAT while others are zero rated.
Exempt goods. These are goods or services that are not charged VAT. This also includes exports, diplomatic purchases and purchases under donor funded agreements, projects and technical aid.
Zero rated goods. These are goods or services consumed at 0% VAT rate. VAT
is accountable for and paid monthly
Arguments for Value Added Tax.
- It encourages traders to keep books of account. This improves their accountabilities.
- It widens tax base since it is calculated at each stage of the production process.
- It is difficult to evade as long as there is production and distribution of commodities.
- It is easy to collect if tax payers keep records.
- It enables taxpayers to use government revenue before they remit it to the revenue office.
- It can be used to reallocate resources form the taxed to exempted sectors.
Disadvantages of Value Added Tax.
- It hurts small firms because tax rates are the same since it is proportional.
- Unregistered firms for VAT out compete registered VAT tax payers.
- It leads to increase in prices and cost of production.
- It is not easy to understand and calculate especially to illiterate traders.
- It is costly to administer since revenue offices have to deal with many taxpayers.
- Most traders do not keep books of account.
- It delays to bring in government revenue since tax payers remit revenue after a period of time.
- It requires heavy investment in tax education.
Advantages of indirect taxes.
- They are easy and convenient to pay and collect. The tax payer clears the tax while paying for the commodity.
- They are not easy to evade as long as they the tax payer is ready to consume the commodity upon which the tax has been imposed.
- The tax burden of indirect taxes is not easily and directly felt.
- They are flexible. As consumption of the commodity increases, the tax revenue also increases.
- Indirect taxes can be used to check on consumption of harmful products. When tax rates of indirect taxes increase, the price of commodities upon which they are imposed also increase depending on the price elasticity of demand for the commodities. This reduces their demand.
- They are used to protect domestic industries from competition.
- Consumers have choice to pay or not. Consumers can decide not to pay by not consuming the commodity upon which the commodity has been imposed.
- They are sources of government revenue.
- Indirect taxes do not harm the incentive to work.
Disadvantages advantages of indirect taxes.
- They impose a heavy burden on the poor. They are regressive in nature.
This is because both the low income earners and high income earners pay
the same amount of tax on each unit of output purchased.
- High tax rates of indirect taxes encourage smuggling. Through smuggling
revenue is lost.
- Indirect taxes on inputs increase costs of production. Increase in costs
of production reduces supply and may push the prices further. This may
cause cost push inflation.
- It is not easy to determine who bears the incidence of tax.
- They discourage industries when imposed on capital and raw materials.
- Indirect taxes are uncertain in yield. It is not easy to accurately project
total revenue from indirect taxes.
10.1.6. Effects of taxation.
ACTIVITY 10.9
Make research and find out how changes in tax rates may affect the
following.
i. Production.
ii. Incomes.
iii. Employment.
iv. Savings.
v. Investment.
Taxation both direct and indirect taxes have an effect on different variables as shown below,
Positive effects
- It raises government revenue which can be used to finance public expenditure e.g. on health, education, infrastructure etc. and the general administration of the state
- It helps in redistribution of income or wealth by imposing heavier tax on the rich in order to fund services for the poor.
- It helps in reducing dumping and its negative effects by charging a high tax on dumped commodities that increases their prices and discourage their consumption
- Taxation discourages production and consumption of un desirable or demerit goods, either on health or moral grounds.
- It helps in reducing monopoly power by imposing specific, lump sum and profit taxes hence reducing their dominance in the market
- Taxation withdraws money from the hands of the public thus helps in controlling inflation especially by increasing taxes on incomes
- It helps in directing investments and resource allocation to desired sectors by highly taxing some specific sectors and tax exemptions and holidays to others
- Taxation regulates BOP problems by taxing imports more than exports thus discouraging imports and reducing on their demand and expenditure on them
- Taxation strengthens the relationship between or among countries by for example removing existing taxes on commodities from such countries thus promoting international trade.
- It helps in protecting the environment by for example charging high taxes on charcoal sellers so as to make it expensive and un affordable by the majority thus protecting the environment.
- It helps in mobilizing savings internally i.e. taxes are a form of of involuntary savings.
- It increases individual responsibility for the government
Negative effects
- Taxes reduce on company profits which may force companies to increase prices on commodities hence increasing costs of living.
- Taxes reduce disposable income of households and firms and if the taxes are proportional, it widens the income between the rich and the poor thus income inequality
- Taxes reduce aggregate demand or market i.e. when high taxes are imposed on consumer goods, less of them are purchased due to high prices
- Taxes on household incomes reduce savings which in turn reduce private investment
- Taxes may lead to unemployment since high taxes can kill productive activities which in turn reduces employment opportunities.
- Indirect taxes have an effect on increasing commodity prices which accelerates cost push inflation.
- High direct taxes discourage work effort which leads to low labour productivity and may in turn retard economic growth.
- High taxes cripple infant industries hence slowing down industrial growth.
- High taxes may lead to illegal activities like smuggling especially if there are lower taxes in the neighboring countries where smuggling originates from.
- High taxes make the ruling government unpopular hence leading to social discontent and eventually leading to insecurity and political instability.
- High taxes reduce the volume of imports and exports thus reducing the gains from international trade.
- High taxes on income may lead to industrial unrest or strikes because workers real income reduces.
- Taxes increase the cost of production which reduces the volume of output hence slowing down economic growth.
10.1.7. Problems encountered in collecting taxes in developing economies.
ACTIVITY 10.10
“…In such countries, poverty levels are high due to low education and skills level, as well as illiteracy. Gender inequality is high and something needs to be done. Prices are ever increasing which affects the real incomes of the people. Wars and other related instabilities affect production and In your opinion, what do you think can be done to overcome the above limitations?
There are a number of factors that hamper tax collection and so lead low tax revenues in developing countries. These may originate from within the tax system itself or from outside the tax system. Such factors may include,
- Low taxable capacity. This leads to low tax revenues. It is a result of low incomes.
- Limited of facilities. This makes tax administration difficult.
- Inadequate supply of skilled manpower. This is because of low levels of education in LDCs.
- Inflation. This reduces the real value of tax revenue. It also reduces the level of economic activity which in turn reduces the tax base.
- Weak tax laws. These increases tax avoidances which reduces tax revenues.
- Corruption in tax authorities. Bribery, embezzlement and mismanagement wastes tax revenues. Tax officials may collude with potential tax payers to evade the taxes.
- Political instabilities. This interrupts production and the level of economic activity reduces. The tax base reduces and tax revenue remains low.
- Tax evasion and avoidance. This reduces tax revenues.
- Illegal activities. Some activities in LDCs are illegal and others are not
registered. This reduces tax revenue.
- Illiteracy of tax payers. This increases the cost of tax education.
- Limited capacity of revenue authorities. Tax authorities in developing countries are sometimes weak and poorly function, due to a variety of factors that may include,
i. Under-resourced or under-trained administrations where officials lack the required technical skills to unravel complex international fiscal structures that are used to escape taxation.
ii. Poor tax collection systems.
iii. Failure of legal enforcement mechanisms for tax collection.
iv. Small penalties for non-payment where the stated penalties are insufficient to stop tax evasions.
10.1.8. Policies to improve tax collection in developing economies.
ACTIVITY 10.11
What is pictured above? In your own view, do you think the above equipment shall help in tax collection?
What other means do you think can be used to improve tax collections in the country?
There are a number of policy measures that can be used to improve tax collections in developing economies. Such measures may include,
- Maintaining a fairer assessment. This will reduce the rate of tax evasions and discontent among tax payers.
- Fight corruption in the tax department. It is necessary to reduce
embezzlement, and bribery and other forms of mismanagement in order
to make the tax system effective and efficient.
- Improve the methods of tax collection and make them friendly and cheap. Harsh and rough handling of tax payers increase discontent among the tax payers and evasion.
- Mass sensitisation of the public on the role of taxation. This increases compliance with the tax requirements.
- Train the workforce in the tax body to provide them with necessary
skills and competence required to run the activities related to taxation.
-- Reviewing the tax structure constantly to make it suit in the existing economic conditions this makes the tax system flexible.
- Ensuring political stability to promote production. This widens the tax base and helps to increase tax revenues.
- Widening the tax base by increasing the volume of economic activities. It can be done by industrialisation, modernising agriculture, infrastructural development etc.
- Proper and efficient use of tax revenue. This will help to build
confidence of the tax payers and reduce tax evasion.
- Effective implementation of the tax laws. It reduces tax avoidance.
- Building a strong institutional capacity of tax bodies. This makes them
effective and efficient in tax administration.
APPLICATION ACTIVITY 10.2
The tax rates for personal income tax are as shown below,
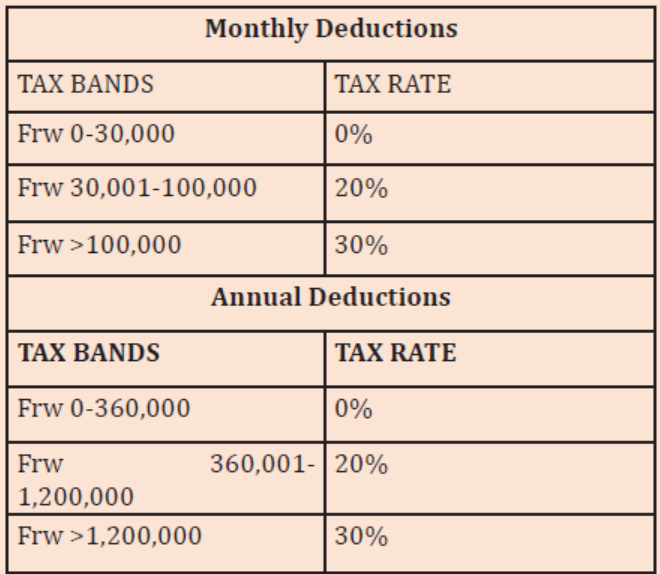
(Source: https://www.rra.gov.rw/index.php?id=169&L=606) ;Basing on the above tax rates, calculate the tax paid by the following employees earning monthly gross salaries shown below per month,
a. 25000rwf
b. 100000rwf
c. 300000rwf.
10.2. Fiscal Policy
ACTIVITY 10.12
Discuss the impact that the following will have on the economy.
i. The government reducing the rates of direct taxes.
ii. The government increasing its spending on infrastructural developments.
iii. The government increasing subsidies on both domestic production and consumption.
iv. The government reducing the tax rates on all domestically produced commodities.
v. The government doubling wages for all public servants.
vi. If the above (i-v) were done in the opposite.
10.2.1. Meaning of fiscal policy:
Fiscal policy is a set of guidelines governing the use of government revenue and expenditure to influence economic activities. It is the regulation of government spending and government revenue through taxation to drive the economy towards full employment.
10.2.2. Forms of fiscal policy.
There are basically two types of fiscal policy and they are,
- Expansionary (loose) fiscal policy.
- Contractionary (tight) fiscal policy.
a. Expansionary fiscal policy.
This involves tax reductions and increase in government expenditure. Government spending exceeds tax revenue. This will increase aggregate demand which in turn stimulates production. It can also be called a loose fiscal policy.
Aggregate demand is the total expenditure in the economy. Aggregate demand = Consumption + Investment + Government spending + Net exports.
- Decrease in taxes both direct and indirect will have an impact increasing aggregate demand by.
1. Increase on consumption.
2. Stimulation of investment especially in the private sector.
3. Increase in net exports.
All the above increases aggregate demand.
- Expanding aggregate demand leads to,
1. Expansion of the size of production.
2. Expansion of employment of resources.
- Increasing government spending especially on productive ventures also,
1. Increases money in circulation which in turn stimulates aggregate demand.
2. Public expenditure on infrastructure has a multiplier effect on private investment.
3. Stimulates production in both public and private sector which also creates employment opportunities for the available resources.
- Increasing subsidies on investments and consumption. Investment subsidies stimulate the expansion of investment scales while consumption subsidies increase the volume of consumption.
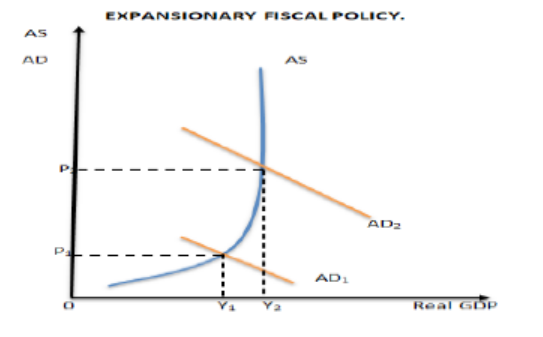
b. Contractionary fiscal policy.
This involves tax increase and decrease in government expenditure. Government spending lowers and tax revenue increase. This will reduces aggregate demand. It can also be called tight of deflationary fiscal policy.
Aggregate demand = Consumption + Investment + Government spending +
Net exports.
- Increase in taxes both direct and indirect will have an impact of decreasing
aggregate demand by.
1. Decreasing on consumption through reducing disposable incomes, and
increasing the general price level.
2. Negating the investment especially in the private sector.
3. Decrease in net exports.
All the above will lead to a decrease in aggregate demand which may leads to,
1. Scaling down of the size of production.
2. Reducing employment of resources.
- Reduction on government spending also,
1. Reduces money in circulation which in turn affects aggregate demand.
2. A reduction in aggregate demand is an anti-inflationary tool that can be
used to fight inflation.
- Decrease in public expenditure on infrastructure has a multiplier effect on private investment. It may affect production in both public and private sector. This also creates a negative impact on the employment level of the available resources.
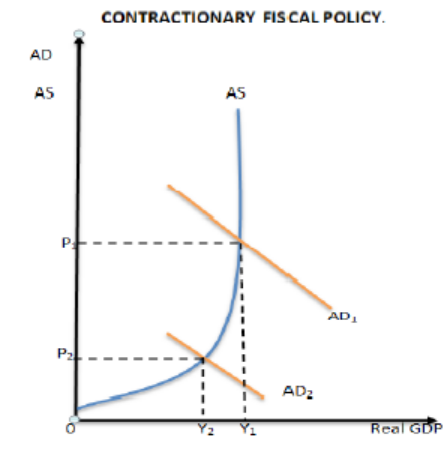
10.2.3. Objectives and tools of fiscal policy.
ACTIVITY 10.13
Make research and discuss and find out how changes in taxation and government expenditure impact on following the following,
i. Aggregate demand.
ii. Unemployment.
iii. Rate of inflation.
iv. Income inequality.
v. Private sector growth.
vi. Balance of payment status.
vii. The volume of production.
viii. Macroeconomic stability.
ix. Investment
In his book “General Theory of Employment, Interest and Money” Lord J M Keynes called for government intervention in economic matters to drive the economy to full employment and promote economic growth.
One way the government can use to achieve this is fiscal policy. The fiscal policy aims at achieving the following objectives.
- Create stability in the economy. By regulating fluctuation in demand and prices, employments and growth, macroeconomic stability is maintained in the economy. This is done by change in levels of government spending and tax rates to drive the economy towards this objective.
- Fiscal policy is important in lifting an economy out of a recession and avoiding dropping into an economic depression. Increasing government spending stimulates aggregate demand. This may push prices up. A rise in aggregate demand also encourages production. Producers are assured of a market for their output and this encourages them to produce more.
• Increasing government subsidies on production and consumption also stimulates growth of firms through increasing demand and reducing costs..
• Taxes on inputs, profits, domestic production etc may be relaxed. This reduces the costs of production and makes producers to expand of the size of their production. Tax reliefs and tax holidays may be offered to firms as a way of facilitating them to produce more.
- Maintaining a stable BOP status. Fiscal policy helps to avoid balance of payment deficits. Reducing or removing tariffs on exports increases exports. Tariffs on imports, especially on commodities with elastic demand reduce import expenditures. Such tariffs also assures domestic producers a ready local market by cutting down on competition from foreign products.
- Mobilize resources to fund development. Borrowing brings in funding
1. Remove taxes on saving schemes to encourage private saving and investment.
2. Increasing spending on basic infrastructure like roads that facilitate production.
3. Increasing returns on voluntary contributions, and insurance premiums, to promote private savings and investment.
4. Reducing taxes on retained profits.
5. Offering tax holidays, tax rebates and depreciation allowance producers.
- Fiscal policy ensures equitable distribution of resources. Progressive taxation takes away incomes from the high incomes earners and they are distributed to low income earners through subsidies. Increase in spending on social overheads like schools and hospitals avails services to the poor.
- Fiscal policy is helpful in controlling inflation. Decreasing government spending during inflationary periods brings down aggregate demand and prices. Increasing direct taxes reduces disposable incomes of consumers and so decreases their effective demand. Reducing corporate taxes on goods with inelastic demand increases their supply and helps to keeps prices static.
- Raise resources for capital formation. This is done by increasing indirect tax on goods with higher income elasticity of demand and on those with low price elasticity of demand. This helps to raise enough revenues that can be directed towards capital formation.
- Fiscal policy is important in ensuring full employment of resources.
Increase in private investment and private capital formation, maintaining macroeconomic stability and maintaining equitable distribution of resources expands aggregate demand and production which in turn increases resource utilisation and drives the economy towards full employment.
10.2.4. Tools of fiscal policy
The policy instruments of fiscal policy include the following;
a. Taxation. This is the most effective instrument of the fiscal policy. Taxes can either be direct or indirect
b. Public borrowing. This is either internal or external and can be either national borrowing or public borrowing.
c. Government expenditure. This involves ways of how the government uses the revenue got. It can either be through re-current expenditure (expenditure for day to day activities) or capital expenditure or development expenditure (expenditure on development like infrastructure).
APPLICATION ACTIVITY 10.3
As members of Economics club, with the help of your Patron, prepare a
suitable questionnaire having questions on,
a. Effect of high tax rates on
i. Aggregate demand.
ii. Unemployment.
iii. Rate of inflation.
iv. Income inequality.
v. Private sector growth.
vi. Balance of payment status.
vii. The volume of production.
viii. Macroeconomic stability.
ix. Investment
b. Impact of high government expenditure on the above variable. Move around the school community and interviewing those around school using the prepared questionnaire. Collect their views and make presentation to the class to judge community understanding of the concept of fiscal policy and make recommendations.
END UNIT ASSESSMENT
1. (a) Differentiate between an advalorem tax and a specific tax.
(b) Analyse the reasons why taxable revenue is always low in
developing economies and suggest policy measures that can be taken to improve the taxable collections of the economy.
2. (a) Analyse the effect that decrease in tax rates and expansion of government spending may have on the economy.
3. (a) Distinguish between horizontal equity Vertical equity as used in taxation.
(b) Explain how the fiscal policy can be used to influence the level of economic activity in the country.
UNIT 11 POPULATION
Key Unit Competency: Analyse the impact of population growth on economic development
INTRODUCTORY ACTIVITY
Hospital attendant: These days we receive many expecting mothers. They all deliver well and in around two days, they are discharged. I don’t know why? I think the number of people living in this country is going to increase.
Sector executive secretary: In my sector, the number of residents has increased. There are many people coming to reside here these days. But other residents migrated and left this village. I cannot tell exactly the number of people living in this sector now.
Hospital attendant: And of course, this being an urban area, it receives many people during the day who come for businesses and then go back to their respective areas in the evening.
Sector executive secretary: There is improvement in medical care, nutrition, public awareness, and others
Read through the conversation above and find out the meaning of population as implied therein.
11.1. Meaning of population and population census
ACTIVITY 11.1
Make research and describe the following terms as used in demographic
studies..
i. Population explosion.
ii. Fertility rate.
iii. Birth rate.
iv. Death rate.
v. Child mortality rate.
vi. Infant mortality rate.
Population is the number of people living in a given area at a certain point in time.
Population explosion. This is a geometric rapid increase in the size of a population caused by such factors as a sudden decline in infant mortality or an increase in life expectancy. It signifies an increase in the number of people that reside in a certain area, or country. It is determined by the formula: (birth rate + immigration) - (death rate + emigration). Population explosion may be a result of
i. High Birth Rate which may be due to early marriages.
ii. Polygamy a cultural practice where a man marries more than one wife.
iii. Poverty where majority of poor populations consider children as asset and they earn at a very low age and bring wages. It helps in the rapid population growth.
iv. Illiteracy which limits the use of contraceptives, encourages the belief in superstitions that promotes a culture of producing more children.
v. Limited access to contraceptives. This may be due to poverty and lack of information.
vi. Improvements in medical care. Advancement in medical facilities and public health service helped reduce death rate. Immunization has helped to check epidemics like measles, cholera, malaria, influenza, TB, Polio, etc, and this has reduced death rate tremendously.
- Crude Birth Rate is expressed as the number of births per 1000 people in a given population.
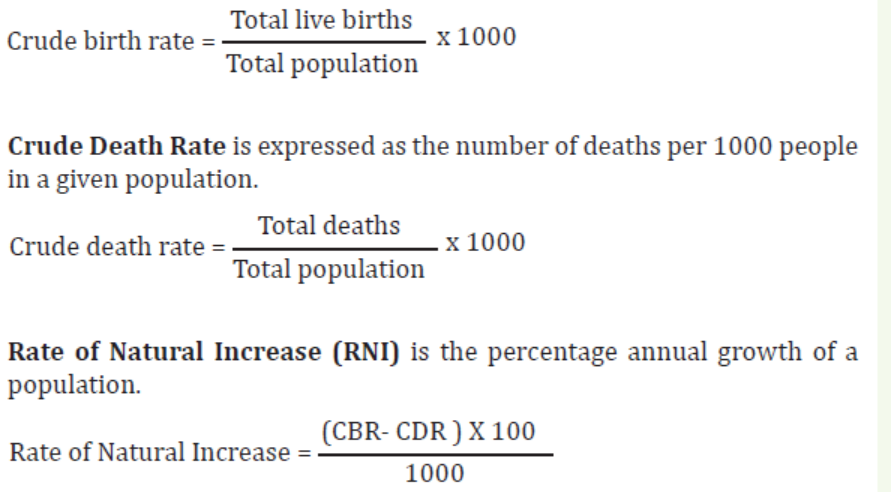
It is used to make population projections over a period of time.
- Fertility rate (FR) is the average number of children that would be born to
a woman if she were to live to the end of her childbearing years and bear
children in accordance with current age-specific fertility rates. It can also
be Total period fertility rate (TPFR) of a population. Age specific fertility
rates is number of births occurring during a given year or reference period
per 1,000 women of reproductive age classified in single-or five-year age
groups
- Child mortality rate is the probability per 1,000 that a newborn baby will
die before reaching age five, if subject to age-specific mortality rates of the
specified year.
- According WHO, globally, under-five mortality rate has decreased by
53%, from an estimated rate of 91 deaths per 1000 live births in 1990
to 43 deaths per 1000 live births in 2015. With the end of the MDG era,
the Sustainable Development Goals (SDGs) period have set in where the
target is to end preventable deaths of newborns and children under 5
years of age.
- The proposal is for all countries to aim reduce under-five mortality to at
least as low as 25 per 1000 live births.
- Infant mortality rate is the number of infants dying before reaching one
year of age, per 1,000 live births in a given year.
11.2. Reasons for population census.
ACTIVITY 11.2
Census in Rwanda dates back to the 1970s. To date, four modern censuses have successfully been conducted in Rwanda, in 1978, 1991, 2002 and 2012…
The RPHC4 is a reliable and comprehensive source of data which compared to other official statistics data sources (administrative data, surveys, etc.) allows for disaggregation to the lowest geographical level. The RPHC4 was undertaken to update the national mapping and demographic databases, to provide indicators for monitoring poverty reduction strategies and achievement of international development goals (MDGs, ICPD-PoA, NEPAD, etc.) and to strengthen the technical capacity of the National Institute of Statistics of Rwanda (NISR)…
In order to ensure focused functioning during the whole period of Census
execution, a Census Unit was created within the NISR, as an executing
unit, and benefiting from other financial, logistical and technical support
services from the NISR
Following the preparatory phase of the Census, which consisted of the
production of the project documents, schedule and Census budget, the
following technical activities were undertaken:
- Census mapping;
- A Pilot Census;
- Questionnaire and manual development;
- Census publicity and sensitization campaign;
- Recruitment and training of field staff;
- Census enumeration; and
- Post-enumeration activities...
This Atlas is organized into 4 main parts: Administrative Structures, Physical characteristics, , Socio Economic Infrastructures and Thematic indicators. The 4th part is the main one, dealing with thematic indicators organized into 11main themes:
• Migration
• Economic Activity and Labour Force Participation
• Non-Monetary Poverty
• Education
• Gender Status
• Socio-economic characteristics of persons with disabilities
• Socio-economic Status of Children
• Socio-economic Status of Youth
• Socio-economic Status of Aged People
• Housing
(source: Fourth Population and Housing Census, Rwanda, 2012. CENSUS ATLAS January 2014)
a. Read the passage above and determine the meaning of population census.
b. Apart from the number of people, what other important variables does a population census identify?
11.2.1. Meaning of population census:
This is the counting/ enumeration of people living in a certain area at a certain time. Population census: This is the counting/ enumeration of people living in a certain areas at a certain time.
11.2.2. Reasons for carrying out population census
The reasons for carrying out population census are:
- To determine the population growth rates i.e the speed at which the population is changing.
- To determine the correct size of population. This is helpful in planning for services that the government intends to provide to the public.
- To establish the quality of population in terms of skills, health, education etc. a quality population is essential for the growth of an economy.
-- To determine population distribution in terms of sex, age, region etc. this
helps to determine the degree of dependence and its important in the
planning process.
- To determine the rate of employment and unemployment.
- To establish the rate of internal and external migrations.
- To help in the planning processes.
- Collect data at the national level to facilitate calculation of essential
demographic rates, especially rates for fertility and infant and child
mortality, and to analyze the direct and indirect factors that determine
levels and trends in fertility and child mortality
11.3. Difficulties met when carrying out population census
- Lack of adequate number of skilled enumerators to conduct the
exercise effectively. This calls for training the enumerators first. Such
trainings increase the cost of conducting a census.
- Inadequate funds. In most cases, developing countries lack enough
funds to finance population censuses. They are forced to borrow money
for the exercise. This increases the debt burden. On other occasions, the
population census is postponed and the country only relies on estimated
figures/projections.
- Unwilling population. The population may not be supportive of the
exercise. The people may give it a wrong interpretation and/or relate it
with politics. This makes them give wrong information which will give
wrong analyses. This calls for massive sensitisation before the exercise
commences which in turn increases the cost.
- Hard to reach areas. A population census covers all areas of the country.
In developing economies where communication infrastructures are
not fully developed, there are areas that are so remote and accessing
populations there is difficult. This delays the exercise. It may even bring
in some inaccuracies where the unserious enumerators may be tempted
to get information from second hand sources.
- Questionnaires that ask inappropriate questions. Some questions
given by on the questionnaire may not bring out the suitable required
information. This is when they are not designed by competent firms.
- Corruption in the agencies concerned. In most developing economies,
corruption is a common evil. Finances meant for census activities may
be embezzled and put to private use, tenders for the supply of materials
like questionnaires, stationary, etc may be offered to incompetent firms
at inflated costs etc. This increases the total cost of the exercise and may
bring in inconsistencies which affects the final outcome.
- Political instability. In most developing countries, there are instabilities
that cannot allow population censuses to go on successfully. For instance,
the conflicts in Burundi, Central Africa Republic, South Sudan, DRC,
Alshabab activities in Somalia, Boko Haram in Nigeria to mention but a few
cannot allow a successful census if it was to take place in such countries.
- People giving incorrect information. Some people, for different reasons,
ranging from political inclinations, illiteracy, to limited sensitisation may
give wrong information. This misguides policy makers.
APPLICATION ACTIVITY 11.1
Rwanda has strategically chosen to look at its population as a vital
human resource, the desired outcome for which is a creative, healthy
and wealthy population. The 2012 census
showed annual population growth for Rwanda slowing from 3.2% in
2002 to 2.6% in 2011,
though it remains among the highest in Africa. Over the same period, the
population has
increased from 8.1 million to 10.5 million while population density
increased from 321 persons
per square kilometre to 416 persons per square kilometre. This is the
highest in Africa and
among the highest in the world. The decline in the population growth
rate indicates the
success from the sustained campaign on responsible family planning, the
increased uptake of contraceptive methods for both men and women,
and improved living conditions including universal access to health and
basic education…(EDPRS 2)
Read the information above and answer questions that follow:
i. Discuss reasons why Rwanda looks at its population as a vital human resource.
11.4. Population growth.
Table 11.1 World population by region today.
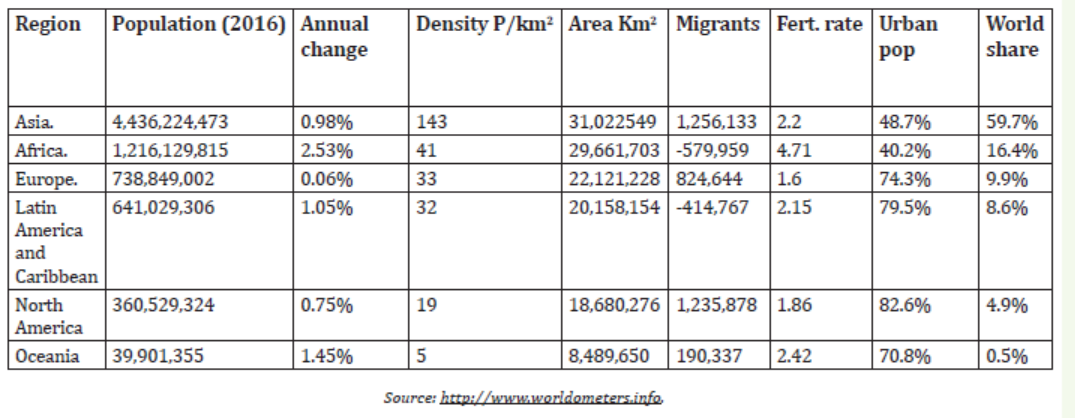
ACTIVITY 11.3
Study the table11.1 above showing world population by region and
discuss the following:
i. Why is the annual percentage change in population very high in
Africa and low in Asia, yet Asia has the largest population?
ii. Asia has the bigger land area than North America, yet it has the
biggest population density. In your own view, what causes that
phenomenon?
iii. Why do you think Africa has the lowest percentage of urban
population and what is the economic effect of this on Africa’s
economy?
iv. Why do you think the fertility rate is highest in Africa?
v. Africa and Latin America and the Caribbean have a negative in
Migrants. Explain the meaning, causes and its impact of increasing
population to the economies of those areas.
11.4.1 Meaning population growth
Population growth is the increase or decrease in population of a given area/ region/country over time. It is measured by percentage change in the population.
There are three types of population growth.
1. Artificial population growth rate. This is the increase or decrease in population coming as a result of the differences between immigration and emigration. When a country receives more immigrants, the population increases. But when there is a high number of emigrants, the population reduces.
2. Natural population growth. This is increase or decrease in population as a result of changes in birth rates and death rates.
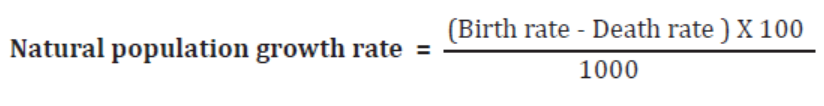
3. Actual population growth: This is population growth resulting from combination of natural and artificial growth.
Actual population growth = Birth Rate (BR)-Death Rate (DR) + Net migration (Immigration-Emigration).
11.4.2. Factors responsible for high population growth rate.
There are three major determinants of population growth:
- Birth rate.
Birth rate is the number of births in a year per thousand of the population. If
the birth rate increases, other things remaining constant, the size of population
increases. While if the birth rate decreases, other things equal, the size of the
population reduces.
- Death rate.
Death rate is the number of deaths in a year per thousand of the population. If
the death rate increases, other things remaining constant, the population size
will decline. While if the death rate decreases, other things remaining constant,
the population size will increase.
- Migration.
The change in population due to migration is referred to as artificial population
growth rate. The population will increase if immigrations exceed emigrations
and vice versa. Migration could be due to a number of reasons including: search
for employment; search for a better living condition; political and insecurity
problems in the home country.
11.4.3 Calculation of population growth
There are three types of population growth.
a. Artificial population growth rate. This is the increase or decrease in
population coming as a result of the differences between immigration and
emigration. When a country receives more immigrants, the population
increases. But when there is a high number of emigrants, the population
reduces.
b. Natural population growth. This is increase or decrease in population
as a result of changes in birth rates and death rates.
Natural population growth rate =
a. Actual population growth: This is population growth resulting from
combination of natural and artificial growth.
Actual population growth = Birth Rate (BR)-Death Rate(DR) + Net migration(
Immigration-Emigration)
Example1:
In 2017, there were 3,250 births in Kigali city with population of 223,000.
Estimate the Crude Birth rate.
CBR = (Live births ÷total population) X 1,000.
CBR = (3,250 ÷ 223,000) X 1,000
CBR = 14.57.
So, there were 14.57 births for every 1,000 people in Kigali city.
Example 2:
In Kayonza district, in 2018, there were 5663 births. The total population was
149,442. Estimate crude birth rate.
CBR = (Live births ÷total population) X 1,000.
CBR = 5663/149,442 * 1000 = 37.9.
So, there were 37.9 births for every 1,000 people in Kayonza district.
Example 3:
In Kayonza district, in 2016, there were 6889 deaths. The total population was
149,442. Estimate crude birth rate.
CDR = (Deaths ÷total population) X 1,000.
CDR = 6889/149,442 * 1000 = 46.09.
So, there were 46.09 death for every 1,000 people in Kayonza district.
Example 4:
In 2016, Country “Z” had 8,320 immigrants and 7249 emigrants, according to
their international arrivals and departure statistics. The total population (June
2016) was estimated as 1,258,000. Calculate the crude net migration rate at that time.
Crude net migration rate = I – E / P * 1,000
Where;
I is the number of immigrants or in-migrants
E is the number of emigrants or out-migrants
P is the total midyear population of the country or designated area.
The NMR is (8,320-7249)/1258000 * 1000 = 0.85.
Example 4:
Given that Country “X’s” birth-rate is 82 and its death rate is 57, its net migration
rate is 35.
Estimate
i. Natural population growth rate.
ii. Actual population growth rate.
Solution:
i. Natural population growth rate = (BR – DR) /1000 *100
= NPGR = (82 - 57) / 1000 * 100
NPGR = 2.5.
ii. Actual population growth rate.
Actual population growth = Birth Rate (BR)-Death Rate (DR) + Net migration
(Immigration-Emigration) / 1000 *100.
= (82 – 57) + 35 / 1000 *100
Actual population growth rate = 6.
11.4.4. Effects and measures to control population growth
a. Effects of high population growth rate
i. Positive effects:
- Labour supply. Labour supply increases leading to an increase in the
level of output. Output will only increase if there is an abundance of
complementary factors — land, capital, otherwise the law of diminishing
returns may occur. An increasing population means that the majority of
the people are young. Many people will be entering the labour force. Young
people are energetic, initiative, inventive and willing to accept new ideas.
An increasing population results into greater mobility of labour. All in all,
an increasing population results into economic growth and development.
- Wider market. The market size becomes bigger provided the additional
population is employed. If the market enlarges, then investment, savings
and output will all increase. Economies of scale will be enjoyed. Economic
growth and development will be attained.
- Increased investment. An increasing population stimulates investment
and therefore, more employment opportunities will be created.
- Revenue. Due to an increase in investment, government revenue is bound
to increase.
- Security. A growing population leads to the creation of big armies which
are crucial for the country’s security. However, this will depend on whether
the army is using up to-date modern military equipment.
ii. Negative effects:
- Low capital accumulation. Population growth retards capital
accumulation. People are required to feed more children with the same
level of income and hence a decline in the per capita income. This reduces
the already low savings and consequently a low level of investment.
Besides, a large amount of resources is diverted from productive projects
to the setting up of social infrastructure facilities. As a result, capital
accumulation is adversely affected. Employment opportunities are also
limited.
- Balance of payments problem. When population increases rapidly,
domestic consumption of exportable goods increases and consequently
there is a decline in the exportable surplus. Less foreign exchange is
therefore obtained. On the other hand, to meet the demand for a rising
population, more food and other consumer goods are required. It leads
to an increase in the volume of imports. More foreign exchange is spent.
Reduction in the volume of exports and an increase in the volume of imports
lead to a balance of payments deficit. Consequently, the government may
be forced to reduce the importation of capital goods and hence capital
accumulation is affected. Economic growth and development are retarded.
- Problem of inflation. As population increases, demand for goods and
services also increases. Failure of supply to match the demand leads to an
inflationary situation.
- Problem of unemployment. A rapidly increasing population growth
rate leads to the problem of unemployment. As population increases,
the proportion of workers to the total population increases. Due to the
absence of complementary factors (land, capital), it is difficult to increase
the employment opportunities.
- Adoption of poor technology. As a rapidly growing population reduces
the rate of capital accumulation, the technology is kept at a low level. A
rising population growth rate reduces incomes, saving and investment
and consequently the people are compelled to use poor technology, which
retards capital accumulation.
- Environmental threats. The expansion of human activity and associated
loss of habitat are the leading causes of the unprecedented extinctions of
plant and animal species worldwide. The loss of biological diversity leads
to instability of ecological systems, particularly those that are stressed by
climate change or invasion of non-native species.
- Problem of poverty and dependants. Rapid population growth
aggravates poverty in developing countries by producing a high ratio of
dependent children for each working adult. This leads to a relatively high
percentage of income being spent on immediate survival needs of food,
housing, and clothing. A rapidly growing population necessitates larger
investment in the social infrastructure. Lack of available capital continues
to frustrate the attempts of many developing countries to expand their
economies and reduce poverty. Resources are diverted from directly
productive assets (industries) to the setting up of the social infrastructure.
Education, health, medical, transport and housing facilities are not
enough due to the scarcity of resources. Too many people are chasing too
few of these social facilities. Consequently, the quality of the population
declines. Children attain a low level of education and start working at an
earlier age. Families are acquired at an earlier age and hence the problem
of dependants is aggravated. Consequently’ a low standard of living is
experienced.
- Massive Rural Urban migration problems. Increasing numbers and
declining resources have caused ever increasing migration from rural to
urban areas. Cities in developing countries are growing much faster than
their administrations can cope with. Consequently, there is overcrowding
and shortages of housing, water and sanitation in urban areas. With a
growing proportion of citizens living in slums and shanty towns, diseases
are of very serious concern.
- Threats to internal and international security. Population growth is a
major contributor to economic stagnation through its depressing effect
on capital formation. With growing numbers of young people attempting
to enter the labour force, many developing countries have extraordinarily
high levels of unemployment. Often high rates of unemployment give
rise to severe political instability, which ultimately threatens national
and international security. The combination of poverty and violence
is adding rapidly to the number of refugees seeking to move into more
stable and prosperous areas. Growth of refugee and migrant populations
are contributing to political instability and economic dislocation in many
countries.
11.4.5: Measures to control population growth
ACTIVITY 11.4
Basing on the photo below, explain what you think those people are
demonstrating about? What do you think should be done to ensure that
the population achieves a healthy and wealthy nation?
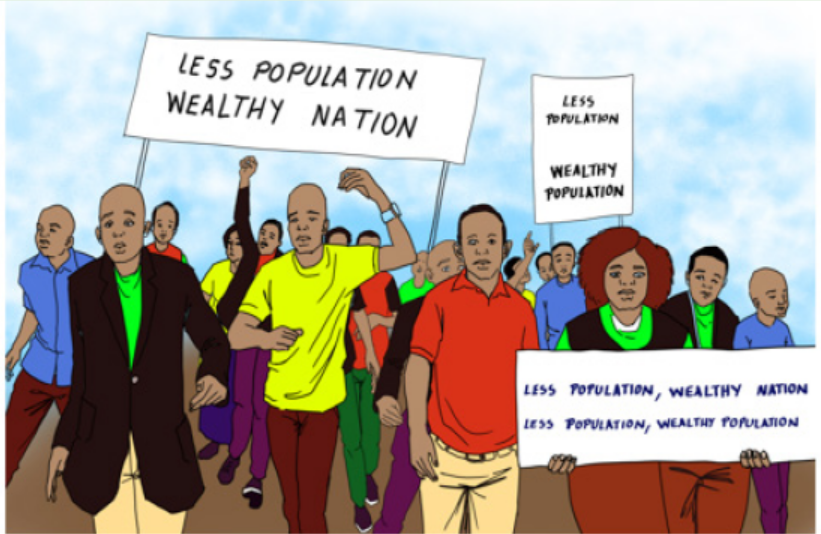
- Introducing sex education in the school curriculum to educate the youths/
teenagers about the dangers of early sex which normally results into
unwanted pregnancies which increases birth rate.
- Encouraging family planning which includes the use of contraceptives.
- Promoting girl child education since educated people produce few
children because of different reasons.
- Discouraging early marriage by raising the age of consent and punishing
those who break the law.
- Legalize abortion to prevent unwanted pregnancies where marriage laws
are difficult to enforce.
- Encouraging international migrations so that people can move to different
countries
- Setting up institutions to encourage population control e.g. family
planning clinics, hospitals etc.
- More campaigns to discourage polygamy which results into high birth
rates
- Improve health facilities to reduce infant mortality rates to assure parents
that the few children produced will survive.
- Reducing the demand for children by reducing their incentives like free
education and bursaries. Etc.
- Rural development programs e.g. modernization of agriculture and
establishing socio- economic infrastructure.
- Use of coercive measures e.g. fines, penalties, jail sentences or sterilization
of men who break population laws.
- Increasing government expenditure so as to increase productivity such
that economic growth copes with population growth.
- Encouraging social mobility among women by taking up formal jobs.
- Provision of social and economic incentives to small families as a means
of discouraging people from having large families e.g. giving free child
education to the first 2 children in a family, housing and free medical
facilities to such families.
- Economic disincentives are instituted on large families’ e.g. denial of free
education, medical care, high taxes on such families etc.
- Encouraging internal migrations from areas of dense population to
sparsely populated areas.
- Massive sensitization to the public by the government and nongovernment
organization about the dangers of high population growth
rate and consequences of many children.
APPLICATION ACTIVITY 11.2
Rwanda Education Board (REB), through its department of curriculum
development has of recent taken a decision of revising the schools’
curriculum in all subjects at all levels. One of the cross cutting issues
addressed in all subjects at all levels is comprehensive sexuality
education.
1. What do you think was the intention of REB to tackle this issue?
2. Why is it necessary for your country to control the rapid population
growth rate?
3. What measures can be taken by the government of Rwanda to
control population growth.
11.5. Theories of population
ACTIVITY 11.5
1. Study the information in the table below and answer questions
below it.
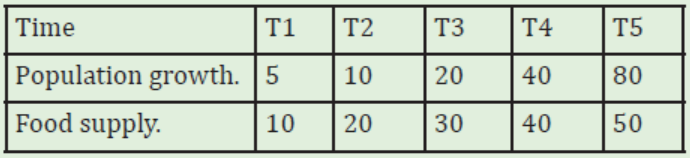
a. Plot the information on a single graph (Population growth and
Food supply against Time) to determine a point (Lo) where
Population growth is equal to Food supply.
b. identify the conditions that are likely to set in after time (Lo).
c. Suggest measures that can be used to avoid the conditions
identified above.
11.5.1 Malthusian population theory
11.5.1.1. Introduction to the Malthusian population theory
This theory was put up by Reverend Thomas Robert Malthus an English
Economist (1798 — 1823) who pointed out the dangers of over population
in relation to the supply of food. It explains the relationship between the
population growth in relation to food supply. i.e. Population depends on food
supply.
When food supply increases, population growth increases and vice versa. The
theory states that population increases faster than food supply and if unchecked
leads to misery. Man’s biological capacity to reproduce himself exceeds his
physical capacity to increase the food supply.
2. Different economists came up with different theories on
population. Make research on the following population theories:
a. The Malthusian population theory
b. The theory of demographic transition
c. The theory of optimum population
11.5.1.2. Assumptions of the Malthusian population theory
Reverend Malthus assumed that:
- Population growth depends on food growth and that when food supply
increase, population also increases
- The supply of land is fixed thus the operation of the law of diminishing
returns.
- Population grows at a geometric rate i.e. doubles itself per period of time
e.g. 4, 8, 16, 32, 64 etc.
- Food increases at an arithmetic rate i.e. adds a constant figure per period of
time e.g. 8, 16, 24, 32, 40 etc.
- At time ‘Lo’ population will be equal to food supply and this is what he calls
the population trap.
- Beyond the population trap, people be subjected to conflicts, starvation,
famine, death, accidents, wars etc. and he calls these positive checks i.e.
positive checks control population growth by increasing death rates
- Man’s capacity to reproduce himself is greater than his capacity to
produce food. Malthus therefore concluded that at one time population
growth will be too much to be fed by the available food and this will lead
to misery, suffering and death.
- Every effort to improve the conditions of people through state subsidies
and private charity would fail because of the increased population growth
it generates.
- He advocated for negative checks like late marriages, moral restrictions,
celibacy that control population growth by reducing birth rate.
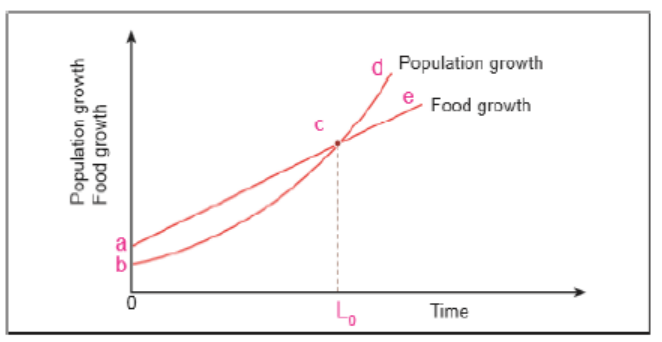
From the figure 11.1 above, line bcd represents the growth of population in the
absence of any checks. Line ace represents Food growth. The actual population
growth rate is represented by line bce in the presence of checks. Beyond time
L0, population growth exceeds food supply, and therefore people are likely to
starve to death. Malthus indicates that always there are positive and negative
checks operating.
11.5.1.3. Applicability/ Relevance of the Malthusian theory in LDCs.
To a small extent, the Malthusian population theory is applicable in LDCs
economies in the following ways;
- Family planning measures are being used in many countries as suggested
by Malthus to control population growth
- The positive checks like diseases, accidents etc. exist in many countries
- In many parts of the world, pressure on land forces many people into
disputes and migration
- Some areas in the world face food shortages as suggested by Malthus and
this has led to deaths as a result of positive checks
- Land being a fixed factor, faces diminishing returns in that when population
increases, productivity of the land decreases and so food supply may
reduce as population increases.
11.5.1.4. Criticisms/ limitations of Malthusian theory
To a big extent the theory is criticized because of the following reasons.
- He did not consider the role of foreign aid and charitable organisations
in assisting the increasing population through provision of food to over
come hunger in such areas affected by
- Malthus never stated the time when population growth would equal the
food supply such that the country enters a population trap. It does not
give a yardstick to determine the time when the population trap will be
reached. If the time were known, then probably the government would
devise ways and means of either increasing food supply or controlling
population.
- Food is not the only determinant of population growth as suggested by
Malthus but there are other causes like migration, level of education,
cultural values etc.
- He underrated the agricultural technological developments in the
production of food. He could not foresee the unprecedented improvements
in agricultural technology. Due to this rapid improvement in agricultural
technology, the food supply has increased much faster than the arithmetical
progression.
- The theory did not put into consideration international trade which can
increase food supply by importation but considered a closed economy.
Food supply can be increased through international trade where food
production in one country may be limited by limited supply of land.
However, with free trade and regional integration, supply can be increased
through international trade so as to avoid positive checks setting into
motion.
- The possibility of modernizing agriculture to increase agriculture was not
foreseen by Malthus. i.e. Productivity of land can be increased application
fertilizers and use of high yield varieties to increase food supply.
- There is no mathematical relationship between food growth and
population growth
- International migrations were ignored by the theory. The population
could not outstrip the food supply due to international migrations. I.e. he
didn’t not consider people moving from one country to another to reduce
population pressure
- Malthus never thought of the possibility of getting additional supplies of
land by opening up new areas.
- According to Malthus, preventive checks possibility only pertains to moral
restraint and late marriages. Malthus never thought of the introduction of
modern techniques of family planning devices.
- Malthus takes the increase in population as a result of rising birth rate.
Population, however, has increased tremendously due to a decline in
the death rate. He could not foresee the rapid improvements in medical
facilities.
- Population figures available do not support the view that population
grows geometrically
- The theory is based on subsistence production but current production is largely monetized.
11.5.2. The theory of demographic transition
ACTIVITY 11.6
Carry out research on the following questions and then present to the class.
1. What is demography transition theory?
2. Explain with the aid of illustration, the stages of demographic transition.
3. Which stage do you think Rwanda belongs and why?
4. Differentiate between demographic dividend and demographic trap
Demography is the study of population characteristics like birth rates and
death rates and their effects on population changes.
The theory of demographic transition was first developed by the American
demographer Frank W. Notestein in the mid-twentieth century, but it has
since been expanded upon by many others. The demographic transition theory
is a description of the changing pattern of mortality, fertility and population
growth rates as societies move from one demographic era to another. It is an
explanation of population growth in a historical manner.

Frank W. Notestein (1902-1983)
Figure 11.2: The five stages of demographic transition.
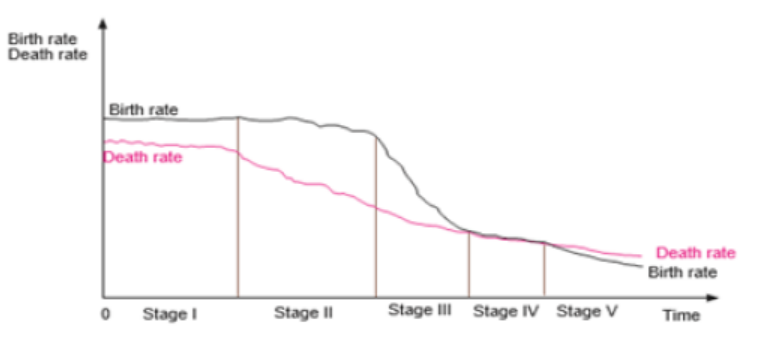
b. Stages and Illustration
Stage One
This stage dominated most of the pre-industrial societies. In stage one, death
rates and birth rates were both high, and influenced by natural events, such as
drought and disease, to produce a relatively constant and young population.
The majority of deaths were concentrated in the first 5–10 years of life. Family
planning and contraception were virtually non-existent; therefore, birth rates
were essentially only limited by the ability of women to bear children. Death
rates tended to match birth rates and population growth was small.
Reasons for high birth rate include:
- Limited birth control
- high infant mortality rate encourages the birth of more children
- Children are seen as a future source of income, therefore it would be more
economically beneficial to have more kids.
Reasons for high death rate:
- high incidence of disease
- poor nutrition and famine
- poor levels of hygiene
Stage Two
This is the early expanding stage of population growth. There is a decline in
death rate but birth rate remains high leading to an increase in population.
The changes leading to this stage in Europe were initiated in the Agricultural
Revolution. In the 20th century, the falls in death rates in developing countries
tended to be substantially faster.
The decline in the death rate is due initially to two factors:
- Improvements in the food supply brought about by higher yields in
agricultural practices.
- Significant improvements in public health reduce mortality, particularly
in childhood.
- Improvement general personal hygiene, growing scientific knowledge
through improved education and social status of mothers.
A consequence of the decline in mortality, there is rapid rise in population
growth that equalled to a population explosion. The gap between deaths and
births widens. This growth is a result of a decline in deaths.
In Stage Two of the demographic transition there is change in the age structure
of the population. The age structure of the population becomes increasingly
youthful and more of these children enter the reproductive cycle of their lives
while maintaining the high fertility rates of their parents.
Reasons for falling death rate:
- Improved public health.
- Better nutrition.
- Lower child mortality.
Stage Three
Stage Three moves the population towards stability through a decline in the
birth rate. Several factors contribute to this eventual decline, although some of
them remain speculative:
- Increasing changes the traditional values placed upon fertility and the
value of children in society.
- Due to education and access to family planning, people begin to reassess
their need for children and their ability to raise them.
- In both rural and urban areas, the cost of maintaining children raised due
to the introduction education and the increased need to educate children
so they can take up a respected position in society.
- Increasing female literacy and employment lowers the uncritical
acceptance of childbearing and motherhood as measures of the status of
women.
- Improvements in contraceptive technology are now a major factor.
Fertility decline is caused by changes in values about children and sex as
by the availability of contraceptives and knowledge of how to use them.
- In stage three there is a change in the age structure of the population.
There is;
1. A reduction in the youth dependency ratio.
2. An increase population aging.
3. An increase in the ratio of working age to dependent population.
Demographic dividend is the change in the population structure where there
is an increase the working age population and a decline in the dependent
population.
Demographic trap is where there is a decline in the death rate that is not
followed by a corresponding decline in birth rates.
Stage Four
This occurs where birth and death rates are both low, leading to a total
population which is high and stable.
Death rates are low for a number of reasons, primarily lower rates of diseases
and higher production of food. The birth rate is low because people have
more opportunities to choose if they want children; this is made possible by
improvements in contraception or women gaining more independence and
work opportunities.
Because of low birth rate and low death rate, population growth is small and
fertility continues to fall. There are changes in personal life styles, and more
women are in the work force, therefore less couples are having kids.
Stage Five.
at this stage, death rate slightly exceeds the birth rate, and this causes population
decline. This stage has only been recently recognised, and there are very few
countries that are considered in stage 5.
Reasons for low birth rate include:
1. A rise in individualism
2. Greater financial independence of women
3. Lack of resources for future generations
11.5.2.3. Limitations of demographic transition theory in developing
countries
- Developing countries differ in many aspects from western nations as they
moved through the demographic transitions.
- Population growth is higher now days in many countries than before.
- Mortality rate declines have been much more rapid.
- Fertility levels are much higher.
- Migration does not serve as a safety value
11.5.3. Theory optimum population
ACTIVITY 11.7
Study the picture above, comparing the number of hands fetching from
a single tap.

1. Interpret such a situation and explain the effect such a situation
could have on the economy.
2. What is the name given to a situation where population growth
matches with available resources?
3. Illustrate the situation mentioned in question 2 above?
4. What are the effects for reducing population in Rwanda?
11.5.3.1: Theory of optimum population:
Optimum population This is the population which provides enough labour to
optimally utilize the available resources to give maximum average product i.e
population is equal to resources and average product is at its maximum.
Optimum population yields the highest quality of life. Each person has access
to adequate food supply, water, energy, quality air, adequate medical care,
recreational facilities etc.
Given a certain amount of resources, the state of technical knowledge and a
certain stock of capital, there is a definite size of the population at which the
real incomes per capita is the highest
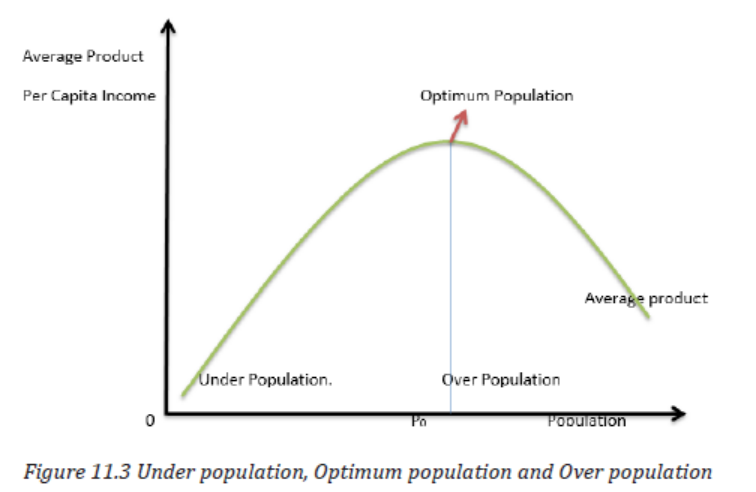
In the figure 11.3 above, before point P0, the population is still low compared
to the resources available. At point p0 there is optimum population where the
population matches the available resources and after that point the population
exceeds the available resources and utilisation of resources.
11.5.3.2. Under population.
Under population is a situation whereby available population is so small that it
cannot put the available resources to full utilization i.e resources are greater
than population. Average product increase with any increase in population. It
is a situation whereby the size of the population is small in relation to available
resources of the country. It is situation where the size of the population is below
the equilibrium.
i. Positive effects of under population
- There is no congestion in the country. The country’s population has
enough space to utilise and enjoy.
- The rate of employment of the population is high. The population is low
and has more resources work on.
- The available population has an increased social and infrastructural
access i.e there is a high per capita in terms of social and infrastructural
facilities.
ii. Negative effects of under population:
- Underutilisation of resources. There is less labour to exploit the available
resources. Some resources especially land remains idle.
- Lack of innovativeness and dynamism in the economy. There is no
competition in the economy since the supply of resources is more than
enough. The population feels satisfied with the existing conditions.
- There is low aggregate demand. The population is so low that it cannot
stimulate an increase in aggregate demand. This has an effect of keeping
production very low.
- There is a high average contribution per person for establishing
certain ventures that are needed by the public. Because the population is
small, the cost per head for establishing public utilities is high.
- It slows economic progress. Production is low and this does not
stimulate progress in the economy.
- Low tax revenue. Economic activity also remains low. This is because
there is no aggregate demand to stimulate production. The tax base
remains low and this keeps tax revenue very low.
- Excess capacity in production. Resource utilization operates below full
capacity. This is because aggregate demand is low.
11.5.3.3. Over population.
Overpopulation is a situation where the available resources are not enough
to sustain the population i.e population is greater than the resources. Average
product reduces as population increases.
Over population may be a result of,
- Rapid increase in birth rate. This increases the total population. This may
be due to ignorance about family planning, early marriages etc.
- Rapid reduction in death rates. This may be due to improvement in
medical care and public health.
- Skewed distribution of arable lands. This created regional imbalances in
access to land as a resource, which breeds over population in some areas.
- Culture (polygamy). Marrying many wives goes in hand with producing
many children. In situations where children are valued as a source of
security against any eventualities, couples produce very many children.
- Immigration i.e people from other countries settling into the country.
i. Merits of over population.
- High supply of labour. There is enough population to supply the necessary
labour force that is essential for production to expand.
- Large market. The large population provides a ready market for firms.
Ready markets encourage the expansion of the scale of production in
different industries. This increases the country’s GDP and tax base.
- Increased pressure for development which created innovative spirit.
There is high competition for commodities, utilities, space, and social
services. This makes everybody competitive and innovative which makes
the economy dynamic.
ii. Demerits of overpopulation
- High dependence ratios. The individuals who do not have any resources
depend on others. The country also depends mostly on donor funding.
This dependence syndrome limits the scale of personal and public savings
and investments. This impacts on the growth of the economy at large.
- Increased government expenditure. The government has to increase
spending on social services to carter for high population. Spending on
crime prevention, law and order, education, health and guarding against a
number of social costs multiplies.
-- Congestion. Because of very many people, there is a likelihood of
congestion. This breeds poor and unhygienic living conditions.
-- Food shortages. The population exceeds supply of food. This is because
the resources that would be used to produce food are over exhausted by
the excess population.
-- Low standards of living. Food shortages, overcrowding and social
tensions as well as unemployment imply a poor standard of living.
-- Social tension and conflicts. Competition for land, food and social
services results into conflicts quarrels and rifts. This undermines the
social cohesion of the society.
-- Over utilization of resources. The available population will be strained.
The y will be over exhausted. This affects all efforts towards sustainable
development.
-- Inflationary tendencies. Because of low production that is strained by
limited resources, aggregate supply remains low. Yet due to a high number
of consumers, and government spending on non-productive ventures,
aggregate demand increases. This brings inflationary conditions in the
economy.
-- Unemployment. High numbers of people will be idle. This is because
they lack resources to use to create more employment opportunities.
-- Land fragmentation. Shortage of land for both settlement and agriculture
increases. Competition sets in all of which results into fragmentation. This
also brings further decline in agricultural output.
-- Environmental degradation. Competition for resources may result into
over exhaustion and degradation of the environment.
APPLICATION ACTIVITY 11.3
1. Write proposals to the Ministry of Health on how best positive checks and negative checks as suggested by Malthus can be adopted in Rwanda as a long term solution for population growth and food shortage.
2. Suggest the factors that make population increase geometrically and food increase arithmetically.
END UNIT ASSESSMENT
1. Rwanda has an estimated 12.63 million people in 2019.The growth rate is 2.64%, its density of 479.42/km2 at a fixed area
26,338/km2. http://worldpopulationreview.com/countries/rwanda-population/
a. Is it a benefit to have this population growth rate or a threat to the future of Rwanda?
b. Explain the impact this growth rate will have on the general welfare of Rwandans
2. Rwanda believes that early pregnancies among the youth is a major cause of high population growth rate and poverty. Discuss.
3. To what extent has Malthusian population theory failed to solve manpower problems in developing countries like Rwanda?
UNIT 12 LABOUR AND WAGES
Key Unit Competency: Explain the impact of labour mobility on the economy.
INTRODUCTORY ACTIVITY
Isimbi is a senior mechanic in the ministry, Kagabo is a porter at a construction site, Uwase is an architect with a construction company in Kigali, Ishimwe is a secondary school teacher, Mukama is a rice farmer, Mbabazi is a Pilot with a reputable air flight company and Rangira works as a maid servant.
i. Can you identify the daily activities done by each of the above workers?
ii. Do you think Ishimwe and Mbabazi can exchange their jobs and work effectively? If no, why?
iii. Do you think the above categories of workers earn the same level of payments? If no, who earns more and why? Who earns less and why?
iv. What do you think can be done to make those who earn less also increase the rewards of their work?
v. What in your own view can be done to protect Kagabo and Rangira from being overworked by their employers and to improve their economic welfare?
12.1. LABOUR
ACTIVITY 12.1
i. Identify what is taking place in the pictures above.
ii. Do the people in the two pictures have and use the same skills?
Explain your answer.
iii. Of all the people in the two pictures, who is using
a. Physical energy?
b. Mental energy?
12.1.1. Meaning of labour .
In unit 26.2 of Year one book, we looked at factors of production. Production of goods and services require resources that we call factors of production and labour is one of them.
Labour refers to all human effort both mental and physical that is used in the production process in return for some reward. Labour is paid/rewarded with wage which may be in cash or kind. Labour is an important factor of production because,
- Labour is an active factor of production. Production from land and capital starts only when labour is applied. Production begins with the active participation of labour force. Therefore, Labour is an active factor of production.
- Labour is perishable is a commodity. Labour is more perishable and cannot be stored. For instance the labour of an unemployed worker is lost for the time when he does not work.
- Labour cannot be separated from the labourer. Labour and labourer are indispensable for each other. For example, it is not possible to bring the ability of a teacher to teach in the school, leaving the teacher at home.
Land and capital can be separated from their owner, but labour cannot.
- Labour force refers to the number of all economically active persons lying between the age group of 15-64 year less the disabled and others who are inactive (unemployable). The labour force comprises all those who work for gain, whether as employees, employers, or as self-employed, and it includes the unemployed who are seeking work.
- Labour economics involves the study of the factors affecting the efficiency of these workers, their deployment between different industries and occupations, and the determination of their pay
12.1.2. Categories of labour.
Labour force may be:
Unskilled labour.
This is labour which has received no special training and has few specific skills. As our society has grown into an increasingly technological one, the members of this group have developed more and more skills. A mechanic, for example, used to be considered unskilled labour. Today that is no longer the case. Mechanics require a great deal of skill and training to work with today’s modern engines.
Semi-skilled labour.
This refers to labour which has some training to handle certain tasks but with little or no skills.
Skilled labour.
This is labour that has received specialised training to do their jobs. They have developed a special skill and may or may not need to be licensed or certified by the state. Some examples of skilled labour are: carpenters, plumbers, electricians, business executives and managers, artisans, accountants, engineers, police, mechanics, etc.
Professionals.
These are the elite of the labour grades and include those workers who need an advanced training to do their jobs. The three primary groups of professionals are doctors, lawyers and teachers. These are white collar workers.
Labour can also be grouped under:
a. Productive and unproductive labour: Productive labour is that labour which is actively involved in the production process and it is paid wage or salary.
b. Unproductive labour is one that isn’t involved actively in the production of goods and services.
12.1.3. Labour force.
Labour force refers to the number of all economically active persons lying between the age group of 15-64 year less the disabled and others who are inactive (unemployable). The labour force comprises all those who work for gain, whether as employees, employers, or as self-employed, and it includes them unemployed who are seeking work.
Labour economics involves the study of the factors affecting the efficiency of these workers, their deployment between different industries and occupations, and the determination of their pay.
12.1.4. Characteristics of labour force in LDCs
Different countries have different population structures and labour force characteristics. But there are general characteristics of labour force that are common to developing countries and these include among others the following;
-- It is dominated by young people below 35 years of age due to high population growth rate
-- Male dominate the labour force especially this is due to cultural ties that limit women from working.
-- A big percentage of the labour force is illiterate and is classified as unskilled.
-- Low levels of productivity due to low levels of education and skills
-- Most of the labour force is employed in agriculture sector
-- Excess supply of labour compared to demand for it thus high unemployment rate
-- Wage differentials especially between the skilled and unskilled labour
- High rate of absenteeism due to lack of work ethics
- Labour is generally immobile due to cultural and tribal beliefs and ties and poor communication network
- The largest single employer is the government though private sector is taking up quickly at a faster rate.
12.1.5. Determinants of the size of the labour force
- Population size i.e. holding other factors constant, the higher the population size, the bigger the size of labour force and vice versa
- Age structure of the population; A population which is composed of the very young and the very old will have a small labour force than a
population which constitute a large number of people who constitute a large number of people in the working age group
- Retirement age; A higher retirement age results into a large labour force compared to a lower retirement age
- Government policy on child labour and effectiveness of the labour laws; where the working age is low, labour force is large and vice versa
- Health conditions of the population; if health conditions in a given society are good, there will be a large labour force and vice versa
- Duration of training i.e. the longer the students take at school, the smaller the labour force in the short run and vice versa
- Working conditions; Favourable working conditions lead to a larger labour force and vice versa
- Life expectancy at birth; If it is low, labour force will be small and vice versa.
12.1.6. Labour Demand
ACTIVITY 12.2
List down the factors you think can make your school to,
i. Employ more workers.
ii. Reduce the number of workers it employs now.
12.1.6.1. Meaning of Labour Demand
This refers to the total number of workers that employers are ready and willing to offer employments at the prevailing wage rates. Demand for labour is derived demand. It is derived from the demand for goods and services that labour helps to make.
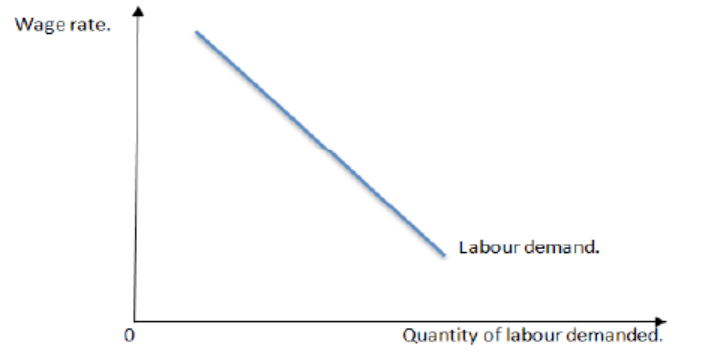
The labour demand curve is downward sloping due to:
- A substitution effect i.e substitution of other resources for a resource that
becomes relatively more expensive.
- A scale effect. The scale effect associated with a wage increase leads to
i. Higher wages resulting in higher average and marginal costs of production.
ii. An increase in the equilibrium price of the product.
iii. A reduction in the quantity of the product demanded.
iv. A reduction in the use of all inputs used to produce the product.
12.1.6.2. Factors that determine demand for labour.
Demand for labour depends on the following,
- The price (wage) for labour. The higher the price for labour, the lower the demand for labour. The lower the price for labour, the higher the demand for labour.
- The degree of substitutability of labour by other factors. If labour can easily be substituted by other factors, its demand reduces. But if it cannot be easily substituted, demand for labour becomes inelastic.
- Demand for labour is a derived demand. It is derived from the demand for the commodities and services that labour helps to produce. If the demand for a product is high in the market, the demand for labour producing that particular type of product will also be high. In case, the demand for a commodity is small, the demand for that labour will also be low.
- The capacity of the employer/firms. If firms are strong and have a big capital base, the demand for labour increases. The existence of small, young and high cost firms.
- The number of firms (employers) available. If the number of employers is high, there is competition among them for labour. Thus, demand for labour is high.
- Proportion of labour cost to total cost. If the wages of workers account for only a small proportion to total cost of a product, then the demand for labour will high because the firm can employ more workers.
- Government labour policies. The labour policies of the government influence demand for labour, for instance, minimum wage legislation may reduce demand for labour by making it expensive.
- Elasticity of demand for the product. If the demand for a particular product is inelastic, the demand for the type of labour that produces this product will also be inelastic. The demand for labour will be elastic, if the product has substitutes and its demand is elastic.
12.1.7. Labour supply
ACTIVITY 12.3
Use the data below to answer the questions that follow.
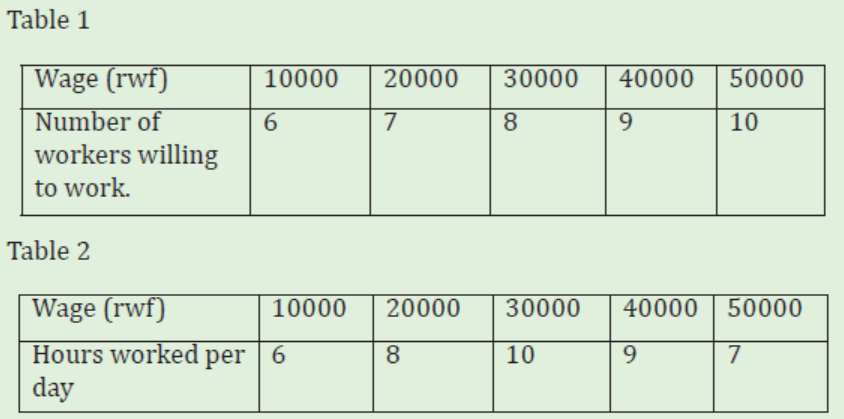
a. Illustrate the above information on graphs.
b. How are the two curves different?
c. Discuss the factors other than wage that can make more labour force ready and willing to work as shown in table one.
d. What do you notice in the second table after wage increases beyond 30000rwf? What do you think causes it?
12.1.7.1: Meaning of labour supply.
Labour supply refers to the quantity of labour that is used in the production process measured in the number of hours worked per day. It can also be taken to mean the number of people who are able and willing to do work at a certain time and ruling wage rate.
12.1.7.2. The labour supply curve:
The labour supply curve is upward sloping from left to right showing that as the wage increases, the quantity of labour supplied also increase.
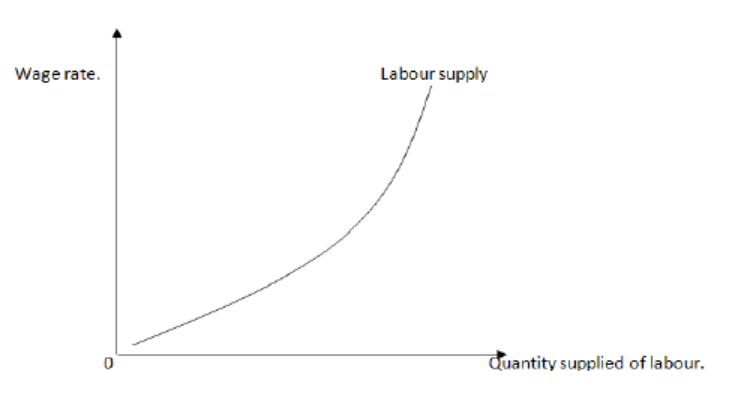
The market labour supply curve is expected to be upward sloping because an increase in the wage in a particular labour market may;
- Cause some workers in this market to work additional hours.
- Induce some workers to shift from other labour markets to this relatively more remunerative alternative employment.
- Will cause some individuals who are not currently in the labor force to enter this market.
In the second table in activity 12.3, labour is willing to work for 6 hours a day at a wage rate of 10000frw per hour. When the wage rate increases to 20000frw per hour, he puts in 8 hours of work. If wage rise to 30000frw per hour, he works for 10 hours. When the wage is pushed to 40000frw per hour, he then prefers leisure to work and is willing to work for 9 hours only. As the rises to 50000rwf per hour, he reduces the hours to 7.The supply curve shows that a worker puts in less labour when wage rate rises above 30000frw per hour. . This leads to the
supply curve of labour to bend backwards, as illustrated below;
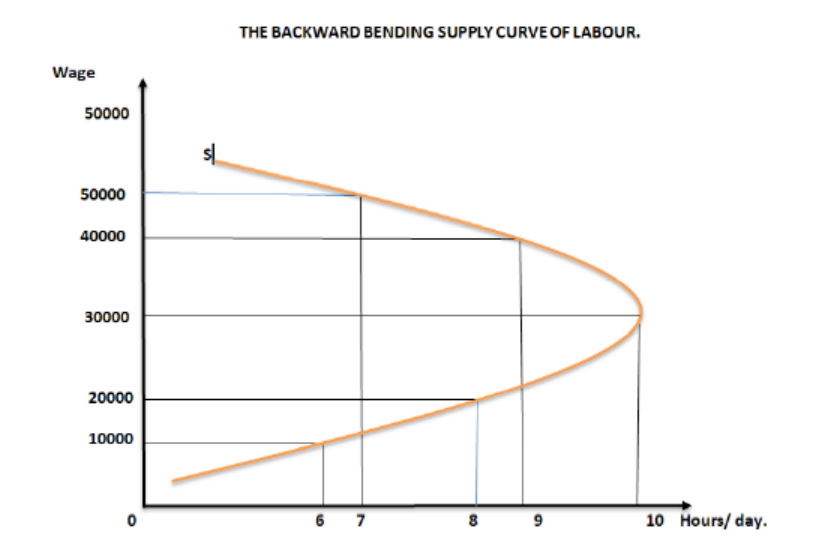
The above curve is due to:
- Substitution of leisure for work when workers’ incomes increase.
- The worker in effect prefers leisure at higher wages.
- It is also the case with target workers. After achieving the target, the worker either reduces effort or stops to work despite an increase in the wage.
- Desire to live on accumulated wealth.
- Old age where even if the wages are high, labour may not increase supply etc.
12.1.7.3. Determinants of labour supply.
- Heath conditions labour force. When labour force is in good health, it is capable of working for more hours.
- Working conditions. Good and favourable working conditions encourage workers to stay at work and spend more hours. But when the working conditions are hostile, workers lose morale and would take any chance available to work for fewer hours.
- Total size of population and its structure. The bigger the population, the bigger the number of working population. But this depends on the age structure of the population.
- Mobility of labour. The ease with which labour can move from job to job or from one geographical area to another increases the supply of labour
- Nature of job. Heavy duty jobs that require allot of energy make workers work for fewer hours of time, for instance crushing and lifting rocks using hand labour in a stone quarry. But when the job is simple and does not require allot of energy, workers can spend more hours on work.
- Immigration and emigration. When the migration laws are relaxed, for instance under regional integration, labour force can easily move within the region without restrictions. This influences labour supply.
- Trade unions. A closed shop trade union reduces labour supply by requiring the employment of members only while an open shop trade union that has no any restriction on employment increases the supply of labour.
- Level of wages. Wage levels influence the supply of labour. High wages attract more labour force to the industry.
- Political situation. Stability of the country guarantees security to person and their properties. This will increase labour supply by even attracting emigrants from insecure areas.
- Period of training. The longer the period of training, the lower the supply of labour in that field.
- Job security. Permanent and pensionable kinds of employments attract more labour force than the temporary jobs.
12.1.8. Labour efficiency.
ACTIVITY 12.4.
Ntwali and Mugabo are considered the strongest men in their community.
Recently they competed against each other in planting seeds. The executive secretary of their cell gave them seedlings of trees to plant. By the end of the exercise that took three hours, Mugabo had planted 500 more seedlings than Ntwali.
In your groups brainstorm and make a list of your views on,
i. Why Mugabo planted more seeds than Ntwali?
ii. If you were Ntwali what would you do to plant more trees than Mugabo?
12.1.8.1. Meaning of Labour efficiency:
Different people doing the same of kind of work may not produce the same output or may not take the same amount of time to produce a certain amount of output. Efficiency of labour refers to the amount of output that each unit of labour can produce per period of time (it can also be called labour productivity). The more efficient units of labour produces more output in the shortest possible time.
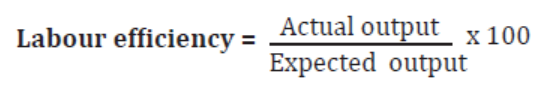
12.1.8.2. Determinants of efficiency of labour.
- Health of labour. When labour force is healthy and energetic, efficiency increases. The reverse is true.
- Work Incentives. Motivations stimulate the work effort of labour force. Motivated workers are likely to produce more output than those who are less motivated.
- Other co operant factors. The quality of other resources used affects the output of labour force. For instance the machines used.
- Education (skills). The higher the skills that labour force has the higher the output produced.
- Supervision. In most cases labour force requires close supervision. If workers are not self-motivated and are left to work on their own, how much they produce per period of times may reduce.
- Wage. High wages encourage workers to settle and work efficiently. Under paid workers may feel grumbled, this may reduce their output.
- Degree of specialisation. The higher the degree of specialisation the higher the output. This is because specialisation saves time and widens workers experience.
- Organization of work. The extent to which the work is properly organised influences the level of output produced. It reduces wastage of resources and saves time.
- Working conditions. Better working conditions encourage workers to work better and produce more.
- Technology used. The methods of production used
- Experience. The higher the experience the higher the output produced.
Efficiency of labour is related to labour productivity is a measure of how much value a firm can create with its workforce. It can be looked at as how much output comes as a result of the efforts of a unit of labour per hour. It depends on how much value is created by the employee per hour of his work.
Labour productivity can be measured as a ratio of the total output to the number of man-hours to produce the output. It can also measure labour productivity as the ratio of total output to the number of workers used to produce the output. Labour productivity may be calculated using the formulae below.
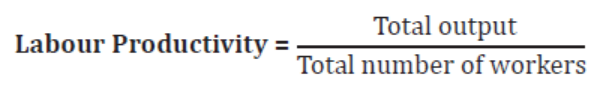
or
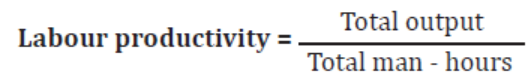
12.1.9. Mobility of labour.
ACTIVITY 12.5
“Most people who work in Kigali city are born outside. Agasaro lives and
works in Kigali but she is born in Huye district. She previously worked
as an accounts assistant in one of the districts in the southern province.
Today she works as a social worker with an NGO in Kigali…”
From the above passage, it can be noted that Agasaro,
i. Worked in the southern province and later changed the location to Kigali city.
ii. Worked as an accounts assistant and later changed to a social worker.
Discuss the factors that made it possible for the Agasaro to change her job and job locations.
12.1.9.1. Meaning of labour mobility:
Mobility of labour refers to the ease with which labour as a factor of production can move from one area to another or one job to another. Labour mobility can therefore be geographical or occupational. Labour can either be;
a. Specific labour. This is labour that cannot be changed from one production
activity to another for example doctors
b. Nonspecific labour. This is labour that can be transferred from one use to another for example unskilled labour like car washers.
12.1.9.2. Forms of labour mobility:
a. Occupational mobility of labour. This refers to the ease with which labour can move from one job to another of job. Normally according to the job search theory, labour will never stay in one area or job but it will still keep on looking for other jobs that my pay more .
It involves two categories:
i. Horizontal mobility. A situation where labour changes from one occupation to another but it does not change its status e.g. from a teacher from good hope high school to a teacher in corner stone leadership academy
ii. Vertical mobility of labour. A situation where labour changes from one occupation to another but affects or changes its status e.g. from a teacher to a headmaster. The movement of labour form one area to another is
influenced by many factors are seen below.
Factors determining occupational mobility of labour:
- Level of education, Because of the low level of education, labour may not be able to move to another job that may require higher qualifications.
But where labour is highly educated, it can easily change jobs. However,
highly educated and specialised labour becomes occupationally immobile
because it cannot be substituted.
- Degree of advertising, where the workers are knowledgeable about the existing jobs, labour mobility will be high to take up such jobs and if the workers are ignorant about the existing jobs mobility will be low.
- Cost and length of training, jobs which involve high cost and long duration of training don’t experience much labour mobility but where the cost and the length of training is low, mobility will be high.
- Skills required, jobs where highly specialized skills are required such as accountancy, and doctoring, mobility of labour is low but jobs where specialization is not required, mobility of labour is high.
- Age of the workers, as workers grow old, they tend to settle down on their jobs and they are unwilling to change occupation thus they become immobile but where workers are young, they tend to move from one job to another.
- Government policy of retrenchment, when such a policy is carried out by the government, labour mobility will be high but if such policies are not carried out, labour will be immobile.
b. Geographical mobility of labour. This refers to the ease with which labour can move from one geographical area to another in search for work. People always move from one place to another depending on the activities that may interest them. Some move for economic reasons, social reasons and political reasons among others. The movement of labour form one area to another is influenced by many factors are seen below;
Factors influencing geographical mobility of labour:
- Transport and communication. The lower the transport cost, the easier for labour to move from one area to another and the higher the transport costs, the harder for labour to move from one place to another.
- Degree of ignorance, in cases where people are ignorant about the available jobs, the lesser the rate of movement but if people are aware of the available jobs, mobility of labour will be high
- Nature of climate, areas with good climate tend to attract more labour
compared to areas which have harsh climate ie too hot and too cold
- Level of wages, areas with high wages attract more labour than areas which give low wages
- Cost of living, labour tends to move away from areas with a high cost of living to areas with low cost of living
- Degree of advertising, if the rate of advertising is high, labour will tend to move to those areas where the jobs are but when the rate of advertising
is low, labour will be immobile.
- Institutional barriers, this includes things like language barrier and if this exists, immobility of labour will be low because it becomes hard to communicate
- Political situation; areas which are stable tend to attract more labour than those which are unstable.
NB: Social mobility. All societies are composed of social classes like
- The peasants who are tied to land.
- The working class (proletariats).
- The middle class.
- The capitalist class (entrepreneurs) who are the business owners.
Social mobility is the movement of worker from one social class to another for instance, a member of the proletariats climbing the social ladder to join the middle class.
APPLICATION ACTIVITY 12.1
For the income generating activity your economics club created,
i. What kind of and how many workers do you intend to employ?
ii. How do you intend to make them produce more output per hour?
iii. What will you do to make them stay with you for long?
12.2. WAGES
ACTIVITY 12.6
Read the following dialogue and answer the questions that follow.
Mrs Gatera: Every day, you shall be doing general cleaning. You clean the rooms, the restaurant and that hall. You know we usually have many people here. I want you to keep this place very clean. Will you manage?
Twahirwa: Oh yes I will. I have been doing this kind of work for the last 10 years. I have accumulated a lot of experience.
Mrs Gatera: So how shall I pay you? In think I will pay you per month? That’s what I prefer.
Twahirwa: No Madam. I request we count the rooms and the hall separately.
Mrs Gatera: So how much do you want per room?
Twahirwa (keeps quiet for a moment): Each of the 10 rooms I will be cleaning it for 500rwf per day and the 1000rwf for the hall.
Mrs Gatera: Okay. You can start tomorrow.
i. Of the two people in the conversation above, who is the employer and who is the employee.
ii. How much shall Twahirwa be rewarded for the services offered if he spends 30days doing the work? What do you call his rewards?
iii. What things do you think Twahirwa considered before he arrived at the money he demanded for the work?
12.2.1. Meaning and forms of wages.
• Wage is the payment for labour as a factor of production. It is a reward for labour for what it renders during production process. Wages may be;
i. Nominal wage refers to the total amount of money earned by a unit of labour as payment for services rendered during production expressed in units of a currency e.g. Francs, shillings, dollars. For instance, you employ a worker and pay him/her 300000frw per month for the services he/she renders to you. This amount which is paid in terms of money is what is called nominal wage.
ii. Real Wage refers to the purchasing power of nominal wage. The amount of goods and services that nominal wage can purchase at a certain price ruling in the market. It is the total amount of satisfaction labour receives in return for the services offered.

Real wage is a good determinant of the standard of living of the workers.
Forms of wages
Wages can be described in three forms as shown below:
- Living wages: it is a wage that is enough for the provision of the bare necessities plus certain amenities considered necessary for the wellbeing of the workers in terms of his social status.
- Minimum wages: The minimum wage may be defined as the lowest wage necessary to maintain a worker and his family at the minimum level of subsistence, which includes food, clothing and shelter. When the government fixes minimum wage in a particular trade, the main objective is not to control or determine wages in general but to prevent the employment of workers at a wage below an amount necessary to maintain the worker at the minimum level of subsistence.
- Fair wages: A fair wage is something more than the minimum wages. Fair wage is a mean between the living wage and the minimum wage. While the lower limit of the fair wage must obviously be the minimum wage, the upper limit is the capacity of the industry to pay fair wage whichompares reasonably with the average payment of similar task in other trades or occupations.
- Nominal wage refers to the total amount of money earned by a unit of labour as payment for services rendered during production.
- For instance, you employ a worker and pay him 300000frw per month for the services he renders to you. This amount which is paid in terms of money is
what is called nominal wage.
Real Wage refers to the purchasing power of nominal wage. The amount of
goods and services that nominal wage can purchase at a certain price ruling in
the market. It is the total amount of satisfaction labour receives in return for
the services offered.

Real wage is a good determinant of the standard of living of the workers
Factors that influence the level of wages in an economy.
- Cost of living. When the cost of living is high, trade unions demand for wage increments. This is meant to enable workers maintain their usual kind of life that they have been accustomed to irrespective of the rise in cost of living.
- Experience. With a high experience, labour can produce more output in the shortest possible time. This makes their rewards to increase.
- Work done. Labour paid according to piece rate system earns according to the work done. The bigger the work done, the higher the wage
- Bargaining strength of workers. When workers have a strong bargaining power, their wages may be increased. For instance, if they are form a trade union.
- Employer’s ability/capacity. Big and low cost firms enjoying economies of scale have the capacity to raise the wages of their employees unlike young small and high cost firms.
- Trade union activity.
- Time worked. Workers who are rewarded according to the time rate system will earn more if they spend more time at work and vice versa
- Nature of the job.
- Responsibilities held by the worker. Those workers who handle big and sensitive responsibilities in the organisation earn more.
- Demand and supply of labour. When demand for labour exceeds its supply, wages increase, assuming there are no controls.
- Level of education and skills. The higher the skills, the higher the wage and vice varsa.
12.2.2. Methods of wage determination.
ACTIVITY 12.7
Discuss the view that rewarding workers according to the amount of work done is better than rewarding them according to time spent on work”
There are different ways through which wages are determined some of which are seen below:
a. Time rate
This is where workers are paid according to the time they work in the period of time. In here a fixed sum of money is paid to a worker for a certain period of time say an hour or a month. The period is agreed upon by both parties
- the employer and the worker.
Advantages of time rate
- High quality of work. Workers do not rush to finish the work and be paid. They take their time and therefore produce quality work.
- Delicate machinery may not be destroyed since the workers are not rushing.
- The system is more applicable where output is difficult to measure. For instance in the service sector.
- It is easy to arrange for workers to work in shifts.
- Government can easily tax income of workers to raise revenue. This is because it is convenient to determine the tax base.
- The system gives the employer ample time to look for money to pay workers when the period of payment is due.
Disadvantages of time rate
- It does not give incentives for better workers, since what is considered for payment is only time spent on work.
- There is need for closer supervision in order to ensure that worker produce more output per period of time.
- Workers can decide to work slowly knowing their wages will not be affected.
- Workers have to wait for a long time until they are paid. They are only
paid at the end of the agreed time e.g at the end of the month.
- Employers pay a lot of money at ago
b. Piece rate
This is where workers are paid according to amount of work they do. Here a wage is given to the worker basing on how much work he or she has done. The wage very much depends on the effort of the worker — the greater the effort, the higher the wage and vice versa
Advantages of piece rate:
- Better workers get more remuneration
- It eliminates the need for constant supervision
- Workers do work at their own pace
- Workers are encouraged to work well and quickly
- Workers get a chance of working in several places
- No full time staff when work is periodically
- Workers are paid immediately as they complete a task
- Part time and temporary staff do not form trade union
- Employer does not spend money for social security of workers
Disadvantages of piece rate
- Workers may over work themselves in order to earn more i.e the more
you work the more you earn.
- Workers do not bargain for higher wages
- Misunderstandings usually arise over payment. The worker needs
payment immediately the work is finished.
- The employer has no control over the workers
- Employers must have the money all the time to pay
- Workers produce low quality because they hurry to finish
- Sometimes work is difficult to measure
- When the worker is sick he cannot be paid
- No minimum wage for workers
- It is difficult to tax income from piece rate
- Workers cannot form trade union
c. Sliding Scale
This is a method of wage payment, which is related to the cost of living. Workers are paid more if the cost of living increases, and they are paid less if the cost of living decreases.
It is beneficial in that
- The worker does not have to suffer from the effect of high prices. It protects workers from the effect of rising cost of living.
- It maintains the real income of the workers.
d. Minimum wage legislation.
This is where the government fixes the wage above the equilibrium/ ruling market wage below which it is illegal to pay the workers. The wage set is known as a minimum wage. The goal in establishing minimum wages is to protect the workers from exploitation by their employers through paying very low wages.
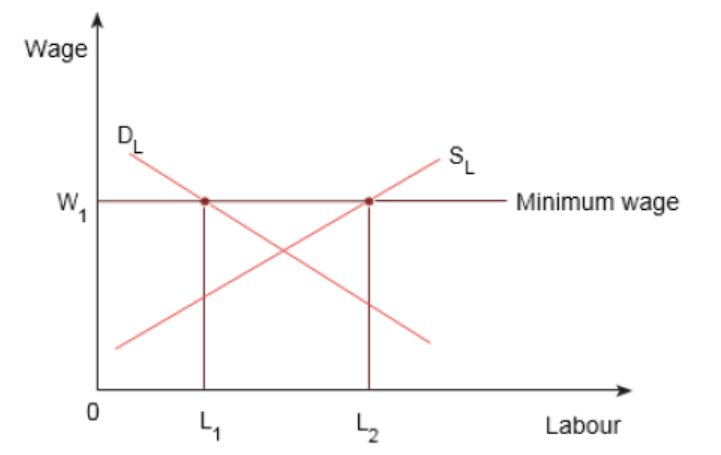
From figure above, the minimum wage is fixed at W1 above the equilibrium
e. Through Trade unions.
A trade union is a legally accepted association comprised of workers who come together in order to achieve specific objectives. The trade union as said earlier is made up of workers. These elect leaders who run the union on behalf of others. These trade unions through their representatives hold round table discussions (collective bargaining) with the employers in an attempt to achieve their objectives. Some of these may be increase in wages and good standard of living. So wages can be determined through the trade unions.
12.3. Wage theories
ACTIVITY 12.8
Undertake research and find the various theories that explain something on wage. Write down a brief description of what the theories say about wage.
Different economists have come written a lot about wages. There are many theories that explain how wages are determined in the labour market. They include the following,
12.3.1. The marginal productivity theory of wages.
Different economists have written a lot about wages. There are many theories that explain how wages are determined in the labour market. They include the following,
The marginal productivity theory of wages states that, there is a direct functional relationship between the level of wages and the level of employment, and that a rational employer will attempt to adjust one or both of these variables so that the marginal product of labour is equal to the wages of labour.
The marginal-productivity theory maintains that employers will only pay a wage that is, at most, equal to the amount of extra value added to the total product by one additional worker. The theory states that under conditions of perfect competition, every labour will receive a wage equal to the value of its marginal product. By marginal product of a labour is meant net addition or net subtraction made to the value of the total produce of a firm when one unit is
added or withdrawn from it. Thus labour should be paid a wage which is equal to the value of its marginal product i.e
W=MRPL
Where,
W = Wage.
MRPL = Marginal revenue product of labour.
The marginal product of one unit of labour is determined by adding to, or by withdrawing one unit of labour from a business, provided the supply of other factors of production is kept fixed. Assuming the supply of other factors of production constant and the price of the product remaining the same, the employment of more and more units of labour in a firm will increase the total product at a diminishing rate. The entrepreneur will go on adding more and more units of labour. The marginal productivity diminishes until a point will come when the increase in product due to the employment of the additional unit of labour is equal to the wages paid to the workers. That unit of labour is the marginal unit and since all labour units are homogeneous, they will be paid the same wage rate equal to the marginal product of the value of the marginal product of labour (or simply marginal revenue product (MRP)). If the wages are greater than the value of marginal product of labour (VMPL), the employers will reduce employment they offer. Similarly, if the wages are below the VMPL, the employers will employ more labour units. Thus in equilibrium, the value of marginal product of labour is equal to the wage. This can be illustrated by
Figure below;
Equilibrium wage according to marginal productivity theory of wages
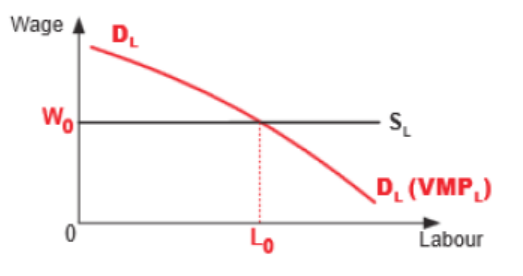
From the figure above’ it can be seen that the supply of labour is perfectly elastic because all labour units are homogeneous. The demand curve of labour is represented by DL. It is down sloping due to diminishing marginal productivity of labour. The equilibrium wage and units of labour is obtained at a point where DL is equal to SL. It is a point where VMPL = W. At this point, the firm employs 0L0 units of labour and pays 0W0 wage. Before 0L0, VMPL, and the firm gets profits, if it employs more units of labour. Beyond 0L0, VMPL, the firm is incurring losses as it employs more units of labour. It will benefit the firm to reduce employment until VMPL = W.
The marginal revenue product of labour (MRPL) is the increase in the total revenue of the firm per unit increase in labour. When a firm employs an extra unit of labour, how much he pays to him as wages depend upon the addition which this unit of labour makes to the total revenue of the firm. If the addition made by this unit of labour to the total revenue is 45000 frw, the wages paid will be equal to 45000 frw. The firm will not pay a wage that is more than the return which the unit of labour contributes to the total production.
MRPL = ΔTR/ΔL
MR = ΔTR/ΔQ
MPL = ΔQ/ΔL
MR x MPL = (ΔTR/ΔQ) x (ΔQ/ΔL) = ΔTR/ΔL
It assumes that
- Labour can measure its marginal product.
- There is perfect competition in the labour market.
- Labour units are homogeneous.
- The bargaining power of workers and employers is equal.
- Labour is mobile.
Assumptions of the Marginal productivity theory of wages.
- Employers are able to measure and predict in advance the marginal product of labour.
- There is a free and complete competition among the employers for workers.
- There is a free and complete competition among workers for jobs
- Labour knows its marginal product.
- Capital and labour are perfectly mobile.
- Labour and capital are fully employed.
- Labour is homogeneous.
- Government does not interfere in wage determination. It is the forces of demand and supply that determine the wage.
- The bargaining power of labour and management are equal. Weaknesses of the theory
- In some employments, it is difficult to measure the marginal product of labour especially in the service sector. Therefore it becomes impossible to determine the wage when one cannot measure the marginal product of each unit of labour employed.
- It is erroneous to assume that all units of employed are homogeneous. Labour has different skills, different competences, experiences and strengths. So it is not homogeneous as the theory assumes.
- The theory assumes that there is perfect competition among employers and workers. In real world, there is no perfect competition in the labour market as the theory suggests.
- The theory assumes that there is perfect mobility amongst labour. This also is not always correct in the labour market. Labour can be geographically or occupationally immobile.
- The assumption that employers and workers have equal bargaining power also is faulty. Employers usually have strong bargaining power than workers in the labour market. This is especially so where the supply of labour is elastic.
- Government usually intervenes and fixes minimum wage. The wage fixed by the government may be based on other considerations and not MRPL. So it may not be equal to the MRPL
- The theory emphasises the demand side of the problem and makes a wrong assumption that the supply of labour remains constant.
It can be said that the marginal productivity theory of wages is true only under certain assumed conditions. In spite of the weaknesses that have been discussed above, it offers a satisfactory explanation of the level of wages in a labour market.
12.3.2. Wage fund theory
The theory of wage fund first introduced in Economics by Adam Smith and later on it was developed by J.S. Mill.
The theory suggests that Wages depend upon the number of workers and capital (wage fund). This wage fund is that amount of floating capital which is set apart by employers for paying wages to the labour.
It is from this pool (fund) that wages are paid such that the size of the pool determines the wage. The size of the fund depends on the past accumulation of capital. If there size of this pool is high, then wages are increased.
Formula for Wage Fund Theory:
The wage rate can be changed either by increasing the wage fund or reducing the number of workers. This theory has the following weaknesses.
- The theory is inadequate to explain the differences in wages among workers in a firm and in different occupations.
- The theory assumes that labour is homogeneous but in real life units of labour differ in a variety of ways. For instance in skills, experience etc.
- Wage levels are usually influenced by the productivity of labour and do
not necessarily depend on the size remunerator capital.
- In real world of production and employment, there is no special fund which is particularly meant for the payment of wages to the workers. The wages are paid out of the total return on production which is a flow and not fixed like that of fund.
- The theory emphasises the supply side. It makes wrong assumption that
the demand for labour remains constant.
12.3.3. Bargaining theory of wages.
This states that the level of wages depends on the bargaining capacity of trade
union in the industry. It thus implies that there are wage differences because of
different strengths of trade unions in different industries.
I2.3.4. Iron law of wages.
This states that labour should be paid a wage which is enough to cater for their basic needs of life (Subsistence life). It is also called the subsistence theory of wages.
It is argued that if wages are increased beyond the subsistence level, the labour will marry earlier and will produce more children. This will result in the increase in population and labour supply will exceed demand. So the money wages will fall to the level of subsistence.
If wages remain below the subsistence level, the labour will not be able to maintain their families. Due to starvation and malnutrition, etc. the death rate
will increase. The-supply of labour will fall short of demand. This will lead to increase in wages.
Increase in wages will be followed by increase in population which will lead to increase in the supply of labour resulting into a reduction in wages again to the subsistence level.
Criticism of the Subsistence Theory of Wages
This theory has been criticized on the following grounds,
- The theory does not explain the differences wages in different employments. According to the theory, the wage rate tends to be equal to the subsistence level of all the workers. Then, why is it that wages differ
from industry to industry, worker to worker and occupation to occupation.
- The theory does not take into account the influence that trade unions have in the determination of wage rate in the labour market. Trade union activity is vital factor in wage determination.
- There is no direct relationship between change in money incomes and marriage. It is incorrect to assume that when the money income of a person increases above the subsistence level, then he marries early and the birth rate increases. On the other hand, the trend in modern life is that that when the income increases, it is generally followed by a higher
standard of living and the workers do not produce more children.
- The Subsistence theory of wages entirety ignores the demand side of the labour and emphasizes only the supply side for the determination of the wages
12.3.5. Residual claimant theories.
This was developed by an American economist Walker. According to Walker: “Wages equal to whole product minus rent interest and profit”. Workers are meant to share what is left after rent, interest, and profit are catered for. Labour is rewarded after all other factors of production have taken their share of national output.
The problem associated with this theory is that :
- In actual sense, the residual claimant is the entrepreneur and not the labour. The entrepreneur takes what is left after all other costs of production including wages have been catered for. Payment for labour is a cost of production and so it is paid during the production process.
- It does not consider the influence of supply side in the determination of wages i.e how increase in supply of labour in the labour market influences the wage level.
- Trade unions have an influence on wages of the workers. This theory seems not to have any explanation on this.
12.3.6. Market theory of wages.
Wages in the labour market depends on the forces of demand and supply of labour. Increase in demand for labour increases its price (wage) while increase in the supply of labour reduces its price (wage). The price of skilled labour is usually high. This is because its demand is greater than its supply. It assumes perfect competition in the labour market.
The determination of wage rate is explained with the help of diagrams.
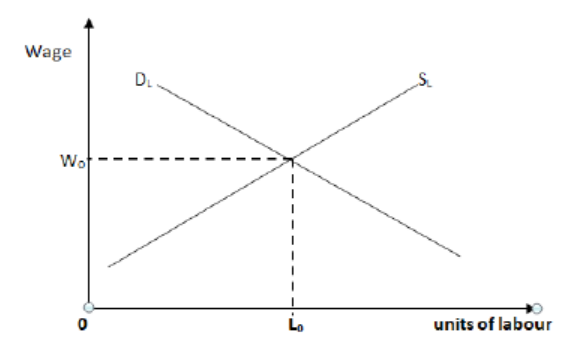
The supply of labour and its demand in the market are equal at wage rate OW0 and the quantity of labour demanded and supplied at this wage rate is 0L0
APPLICATION ACTIVITY 12.2
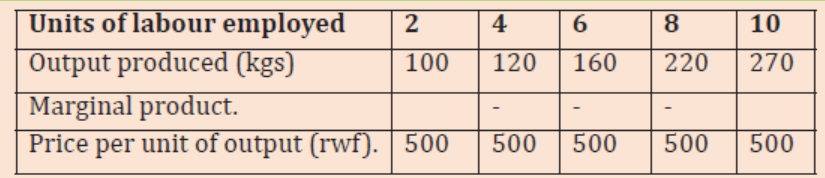
Basing on the marginal productivity theory of wages determine the wage that should be paid to extra units of labour employed.
12.4. Wage differentials
ACTIVITY 12.9
Make research on the wages earned by the following categories of
workers.
A technician working with a private firm, a graduate teacher working in a government aided public school, a porter on a construction site, a doctor in a government hospital, a social worker working with a relief organization, and an engineer with a private firm, cleaner in a government ministry.
List their wages down and make a comparison.
Discuss why the above workers earn different wages. Wage differential is a situation where different people in different or the same occupations or places earn different wages.
It is very common experience that earnings in different occupations are strikingly different. There are occupations where the earnings are extremely low. There are others where the earnings are exceptionally high. The causes of such disparities lie on the side of both demand for labour and supply of labour. If demand for a certain type of labour is very high, the earnings must also be correspondingly high. If, on the other hand, a particular type of labour is not much in demand, their earnings are bound to be very low. The
chief causes of variations in wages are:
Causes of wage differentials
- Differences in Skills. Workers with more skills require more payment than those with little skills.
- Differences in elasticity of supply of labour: Supply of workers in companies tend to be inelastic thus earning high wages while in some others it tends to be elastic thus earning low wages.
- Differences in prices of products produces: Workers whose products produced command higher prices are paid more than those whose prices are low.
- Differences in Marginal productivity of labour. Labour whose marginal product is high is paid more than those whose marginal products are low.
- Differences in Trade Unions’ strength: strong trade unions can demand higher wages than weak trade unions.
- Government interfere in the determination of wages. Government normally set different wages for different occupations and sectors causing wages differences.
- Differences in job locations: People whose jobs are located in urban areas normally are paid high wages than those in rural areas. This is normally due to differences in cost of living between the two areas.
- Differences in Risks involved: Working in some occupations is more risky than in others thus some jobs may prove dangerous to a worker and hence the worker must be paid a higher wage than the less risky ones.
- Differences in occupations.
- Occupational mobility.
- Period of training differ.
- Existence of non- monetary benefits
- Size of the firm.
- Difference in productivity of occupation.
- Gender bias.
- Differences in cost of living.
- Differences in talents.
APPLICATION ACTIVITY 12.3
From your knowledge of wage differentials, write what do you think can be done to reduce the gap between high wage earners and low wage earners. Make a class presentation.
12.5. Wage controls
ACTIVITY 12.10

a. RURA fixes transport fares in the public transport sector throughout the country. How is this important to the public?
b. Discuss what would be the benefits and demerits to the public if RURA was to fix wage for workers.
12.5.1. Meaning and Rationale of wages controls
Wage controls refer to the setting of a wage by the government above or below the equilibrium/ ruling market wage, below or above which it is illegal to pay the workers. There are different reasons why this may be done by the government but it is mainly to;
a. Reduce exploitation of the workers by the employers through paying them a very low wage. This is reduced by setting a minimum wage by the government at which to pay the workers.
b. Reduce exploitation of the employers by the employees through requesting and being paid very high wages. This is reduced by setting a limit beyond which the employers should not pay though this is not common.
Minimum Wage
A minimum wage is a payment for labour that is fixed by the government above the equilibrium wage below which the employer is by law not allowed to pay the worker. It is a form of price legislation. The price here, being the price for labour.
The government or the trade union may fix a minimum wage of all the workers on a national scale or in a few sweated industries. This step is taken to avoid or reduce the industrial friction.

When the government fixes the minimum wage at Wm, the demand for labour reduces because labour becomes expensive. However, the supply of labour rises because the wage is high. This creates unemployment.
Advantages Minimum Wage.
- Minimum wage increases purchasing power of workers. This improves their general standard of living, aggregate demand and production in general.
- It ensures Minimum Standard of Living for the workers. If minimum wages are fixed for all the workers, it will ensure minimum standard of living for all. Workers will be sure of their payments and this reduces exploitation of the profit oriented employers.
- It motivates workers. When the workers have a measurable standard of living, they feel contented and work, more efficiently.
- Minimum wage maintains industrial peace. It avoids the occurrence of strikes by trade unions when demanding wage increments.
- Inefficient, high cost firms are pushed out of business. Those that pay low wages to the workers because he is not able to manufacture the goods at the competitive price may have to close when the minimum wage is fixed.
Disadvantages Minimum Wage.
- Unemployment. When minimum wage is fixed, the employers try to increase the prices of the commodities in order to cover their increased labour costs. If the demand for the commodities whose prices are raised is elastic, then the total quantity demanded will fall. When the commodities are not disposed off at a profit, some of the firms will close down others may reduce the number of the workers. Some of the firms may try to substitute labour saving machines. The result of this will be that there will be greater unemployment in the country.
- It is difficult to fix. It is very difficult to fix a minimum wage for all the workers at different places in a country and different industries. If a higher minimum wage is fixed at one place, then it may not suit the other employers. They may refuse to employ labour or they may try to substitute machinery for labour. If they succeed in their mission, it will, result in mass unemployment in the country. If a minimum wage is fixed low, then it may not serve the purpose for which it is fixed.
- Employers may resort to using machines instead of labour. This may create technological unemployment
- Minimum wages increase the cost of production. This reduces the volume of production and may cause scarcity of commodities.
- It is difficult to put into practice. If a minimum wage is fixed, then difficulties may arise in its enforcement. If the labour is unemployed, they may agree to work at a wage lower than that fixed by the government.
- It discourages the most efficient workers. The most efficient workers may not be paid a wage that is more than the minimum wage. This may reduce the morale of the most efficient workers. This is because that amount is often considered to be the maximum by the employers.
APPLICATION ACTIVITY 12.4
RURA regulates prices of certain services like transport, energy, water and sanitation etc.
Basing on your knowledge of wage controls, discuss how this helps the economy.
12.6. Trade unions
ACTIVITY 12.11
A labour union is a group of workers who form an organization to gain:
- A voice in improving socio-economic interests and rights at workplaces.
-- Respect on the job.
- Decent wages and benefits.
- More flexibility to meet work and family needs.
- Protection against occupational safety and health at work.
Unions have made life better for workers by improving wages and working conditions, helping to formulate laws, fighting child labour, establishing mechanisms for solving labour-management disputes and protecting workers′ safety and health. When workers form unions, their companies and communities also benefit.
Read the passage above. Note down according to the passage,
i. What you think a labour union is?
ii. Why it may be formed?
iii. Who forms it?
iv. How unions make life better?
v. Who gains from a labour union?
12.6.1 Meaning and objectives of trade unions.
Trade unions are associations of workers who use collective bargaining to protect the interests of their members e.g increase in wages and improvement in working conditions. They are a continuing and permanent democratic organisation, voluntarily created by and for the workers to protect them at their work. Normally they carry out their work through round table discussions through their representatives and the employers
In Rwanda the trade union movement is organized by the CESTRAR (Rwanda Workers’ Trade Union Confederation) which is affiliated to International Trade Union Confederation. CESTRAR was formed in 1985. After 1996, the trade union movement expanded. It has continued to expand since then. Some of the trade unions that are affiliates of CESTRAR include,
- SPS: Health sector workers’ union
- STAVER: Workers union in Agriculture, fishing, veterinary and
environment in Rwanda
- SNER: Rwanda National Teachers’ Union
- RMNU: Rwanda Nurses and Midwives Union
12.6.2 Objectives of trade unions.
Trade unions in general possess the following objectives.
- To bargain for increase in wage of workers
- To demand for improvement in working conditions.
- To sensitise their members on their rights through seminars.
- To protect workers from unfair dismissal
- To ensure security of job for workers.
- To carry out advocacy for workers’ interests and negotiate with the government to make some legislation that is in support of workers interests for instance fixing a minimum wage.
12.6.3. Types and tools of trade unions.
ACTIVITY 12.12
It’s a duty of everybody to protect the rights of domestic workers.

1. Study the above pictures. What can you say about it?
2. What do you think can such workers as shown above do to,
i. Protect themselves from any form of harassment.
ii. Improve their working conditions.
iii. To improve their wages.
Trade unions are categorised into,
A craft union. This is the simplest form of trade union. It is formed by workers belonging to the same craft, occupation or specialisation for instance plumbers, electricians, weavers, etc. Members have a common skill though they are employed in different industries. In a craft union,
- Workers with identical training, educational background and similar working experiences and problems are easier to organise. They can share their everyday work experiences and are more united.
- Members have a high bargaining power since they share a common skill and cannot easily be replaced in case of a strike. Industrial union. This is a union of all workers in a particular industry. Members have different skills and occupy different positions but in the same industry. It brings together workers with different skills into working together as a union for instance, a union of workers in the tea industry, or rail workers.
General Union
This is a union that brings together all workers in different industries and with
different skills. The only uniting factor is that they are all workers.
White collar unions.
These are unions that represent certain professions like teachers, doctors. It registers all members in that profession who are willing to join. Trade unions can also be categorised according to the requirements for recruitment of workers. This gives the following,
- An open shop trade union does not require union membership in order to employ or keep workers. Where a union is active, workers who do not contribute to a union may include those who approve of the union contract and those who do not. This affects the function and services of the union.
- A closed shop is the type of trade union which employs only people who are already union members. In this case the employers recruit directly from the union, as well as the employees working strictly for unionized
employers.
- A union shop trade union employs both union and non-union workers, but sets a time limit within which new employees must join a union.
- An agency shop trade union is where non-members can access services of the trade union in negotiating for their contract when getting employment but on a fee
12.6.4. Tools used by trade unions to achieve their objectives.
Trade unions use a diversity of methods which are either peace or violent or both to achieve their objectives. Such methods include, among others the following:
Collective bargaining
This refers to the negotiation process between employers and employees association regarding establishment of procedures that concern conditions of work, terms and rates of pay. This is a peaceful method/ process that aim at strengthening worker employer relationship.
Giving ultimatum/ Grace period
Employers are given a time limit to respond to the workers’ demands beyond which workers may withdraw their labour services.
Go slow tactics
Workers in here slow down their pace of working by reducing their pace of working and reduce their productivity and total output as well. This is done by reducing hours of work and output so as to make the employer feel the impact of it on the organisation.
Sit down strike
Here workers lay down their tools, they will report at their work place but they
will not work at all.
Demonstration
These are open protests against unfair treatment of workers e.g. marching through the streets. They carry placards/posters along. The aim is to shame the employer, attract attention and sympathy from the public and government against the employer. Picketing
This is whereby the trade union members prevent their fellow members from working, by positioning or deploying of members at the entrance of business premises stop any potential workers from proceeding to work. This is designed to make the organisation feel the impact of the workers absence.
Boycott of the firm’s product/ sabotage
Trade unions may campaign against the firm’s product openly in the public so that the product loses market, pack wrong weights or members may also boycott from consuming any of the product. This is aimed at causing severe loss of revenue to the firm. This method however requires a lot of finance or it may be expensive.
Mediation or arbitration
This involves the intervention of a neutral party acceptable to both parties (employers and employees/ Trade unions) to resolve the industrial dispute or make the recommendations for resolving the disputes for example ministry of labour and social welfare. It is normally agreed beforehand that the two parties will accept and respect the decisions and recommendations of the arbitrator.
Industrial court
Here workers can present their claims or case to the industrial court which examines the case or dispute and makes the recommendations or ruling which is binding to both parties. The court may award or reject their claims.
Mass media campaign against the firm (press war)
Here, trade union members can approach are known radio, television newspaper etc. so as to get their demands clearly spelt out and it is intended to capture sympathy as well as public support.
Further education and training
Trade unions may organise seminars and workshops for members so as to improve their skills required in the labour market hence increasing labour productivity. This is aimed at improving their bargaining power as well as increased demand.
Restricting labour supply
This is where trade unions restrict employers to employ more new workers without permission. i.e. members require a particular employee to first join a given union in order to retain or obtain employment. This is aimed at strengthening the bargaining power of trade union members. Industrial strike This is done as a last resort in case all the above peaceful methods fail. It is a violent process which involves withdrawal of labour, putting down tools. It is intended to force employers to accept the needs of employees immediately.
12.6.5. Benefits and disadvantages of trade unions.
ACTIVITY 12.13
Discuss the view that “The economic welfare of the unionized workers is always better off than that of non-unionized workers”
a. Benefits of trade Unions
-- Trade unions negotiate for Increase in wages for their members. Industries with trade unions tend to have higher wages than nonunionised industries.
- Trade unions represent workers. Trades Unions can also protect workers from exploitation, and help to uphold health and safety legislation. Trades unions can give representation to workers facing legal action.
- They increase the bargaining power of workers. Trades Unions can help workers to negotiate with employers. This means they help the firm to increase output; this enables the firm to be able to afford higher wages. Trades unions can be important for implementing new working practices which improve productivity.
- To sensitise their members on their rights through seminars. They protect workers from unfair working conditions, unfair dismissal, and ensure security of job for workers.
- Trade unions carry out advocacy for workers’ interests and negotiate with the government to make some legislation that is in support of workers interests for instance fixing a minimum wage.
b. Disadvantages of trade union.
- Through force, trade unions coerce the workers to support the unions view by joining strikes etc. which affect production on the one hand and loyalty of honest workers to the group on the other hand.
- A powerful union of workers in a particular industry can secure higher wages. This may induce the workers in other industries to put an unreasonable demand for higher wages.
- Trade unions ignore the social interests. They never advocate for the increase in production and productivity and thus take one-sided view.
- Create Unemployment. If labour markets are competitive, higher wages will cause unemployment. Trades unions can cause wages to go above equilibrium through the threat of strikes etc. However when the wage is above the equilibrium it will cause a fall in employment.
- Ignore non-members. Trades unions only consider the needs of its members. They often ignore the plight of those excluded from the labour markets, e.g. the unemployed.
- Lost productivity. If unions go on strike and work unproductively (work to rule) it can reduce output. Therefore their company may go out of business and be unable to employ workers at all.
- Trade unions may cause wage Inflation. At times, powerful unions can bargain for higher wages that are beyond the rate of inflation. This may contribute to general inflation.
- If unions become too powerful and they force wages to be too high, then they may cause unemployment and inflation
12.5.6. Weaknesses of trade unions in developing economies.
ACTIVITY 12.14
i. As a member of the economics club in your school. List down the problems that you think may limit the progress of your club.
ii. With reference to the problems identified above, discuss the factors that can make trade unions in developing economies weak.
Trade unions in most developing economies have failed to achieve their objectives because of both internal and external factors. Such factors include,
- Workers have no keen interest in the trade union. Trade unions represent a small proportion of the total labour force and therefore, they are in a weak bargaining position.
- Leadership problem. Trade unions may have poor leadership as they fail to present their wage claims in the right manner. When they have no correct approach, their wishes have not always been granted.
- Unemployment: There is open unemployment in LDCs. There is a large surplus of labour in the agricultural sector. On top of this, there are so many job seekers migrating from the countryside to the urban sector. In a position like this, where the possible supply of workers is much greater than demand, it will be quite difficult for the trade unions to push wages up.
- Financial difficulties: Trade unions are always in financial difficulties. To begin with, the incomes of union members are generally low, and they are therefore reluctant
- to pay union dues.
- A high proportion of migrants within the work force: The composition of the labour force changes continuously. Organisation of a trade u n i o n becomes particularly very difficult. People are not interested in becoming members of a trade union. This puts a trade union in a weak bargaining position.
- Fear of the effects of high wages on the economy. There may be a fear of the effect of high wages on general price level. This may limit the activities of trade unions and bring down their success.
- At times, trade unions are regarded as strike tools only because trade unions are always busy in organising strikes. Due to this, they have lost public sympathy. Employers take chance of this to ignore their genuine demands.
- Supply for labour especially the unskilled is elastic. Trade unions cannot emphasise their action because employers threaten workers with dismissal. They are assured of cheaper alternatives in case the current workers leave.
- Employers earning profits. This limits their capacity to increase workers remunerations, offer other benefits that may be demanded by trade unions.
APPLICATION ACTIVITY 12.5
a. Make a research on the problems workers in the community around your school face.
b. Write a report and make recommendations. Present it to a community leader near your school.
END UNIT ASSESSMENT
1. (a) State the difference between demand for labour and labour supply.
(b) Analyse the factors that influence the supply and demand for labour in a labour market.
2. (a) What do you understand by the term labour efficiency?
(b) State and explain the factors that influence the efficiency of labour in an economy.
3. (a)Distinguish between time rate and piece rate systems of wage determination.
(b)Analyse the merits that piece rate system has over time rate.
4. (a)What do you understand by the marginal revenue product of labour?
(b)How relevant is the marginal productivity theory of wages in your country.
5. (a)Examine the factors that limit the success of trade unions in developing countries.
REFERENCES
1. Mirembe E. N. (2017); Economics for Rwanda Secondary Schools Learner’s Book Senior Five. Kigali: Fountain Publishers Rwanda Ltd
2. Jim, B, Safari J.B., Patrick W.,Tony G. (2016) ; Economics For Rwandan Schools student book Senior four . Kigali: Longhorn Publishers (Rwanda) Ltd.
3. Alain, A. (2008). Economics, fifth edition. Pearson Education.
4. Asiimwe, H.M. (2009). Fundamental Economics. East Africa Edition.
5. Asiimwe. H.M (2013), Senior Secondary Economics student books 4,5 and
6 MK Publishers Ltd
6. Chrisdom M.A. (2006). Economics for advanced level, Paper one and Professional Studies. Published by The General Publishing House LTD.
7. Chrisdom M. A. (2006). Economics for advanced level, Paper one and Professional Studies. Published by The General Publishing House LTD.
8. Eleazar, C.I., Turner, P.H., and Turner, D. (1993). Economics for Senior Secondary School in East Africa. Published by The Macmillan Press LTD.
9. Grant, S.G., and Stanlake. (2000). Introductory Economics. 7th Edition. Pearson Education Limited.
10. Harvey.J., and Jowsey, E. (2007) Modern Economics. 8th edition 2007. Published by Palgrave Macmillan.
11. Lipsey and Chrystal. (2007). Economics. Eleventh Edition. Oxford
University Press.
12. Lipsey, R.G., and Harbour, C. (1992). First Principles of Economics. Second
Edition. Oxford University Press.
13. Maunder, P., Myers, D., Wall, N., and Miller, R.L. (2000). Economics Explained. HarperCollins Publishers Limited.
14. Tayebwa, B. M.B. (2007). Basic Economics. Published by Genuine Researcher and Publishers (GRP).
15. https://www.researchgate.net/publication/5028931_An_introduction_ ;to_the_search_theory_of_unemployment.
16. https://www.investopedia.com/terms/f/financialinstitution.asp on 21- 10-2019