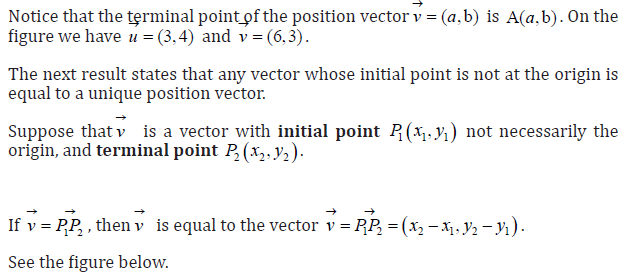
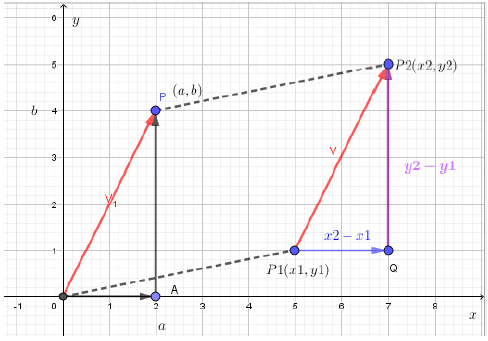
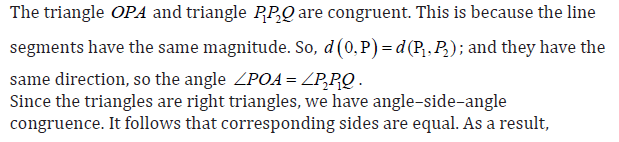
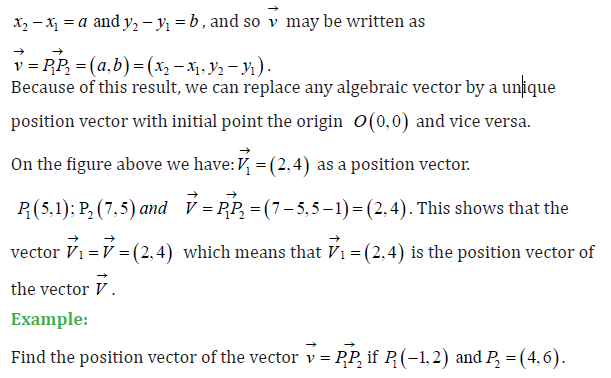
Topic outline
General
- Mathematics TG LE Year 2 File Uploaded 16/11/20, 11:10
- Mathematics SB LE Year 2 File Uploaded 16/11/20, 11:07
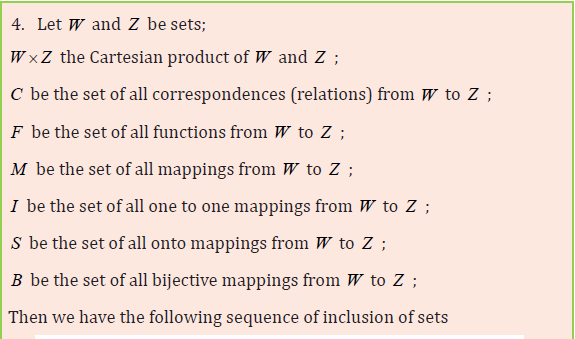
UNIT 1:FUNCTIONS AND GRAPHS
Key unit Competence: Apply graphical representation of function in economics models
1.0 INTRODUCTORY ACTIVITY
1.1. Generalities on numerical functions
ACTIVITY 1.1
Content summary
1.1.1 Function
A function is a rule that assigns to each element in a set A one and only one element in set B. We can even define a function as any relationship which takes one element of one set and assigns to it one and only one element of second set.
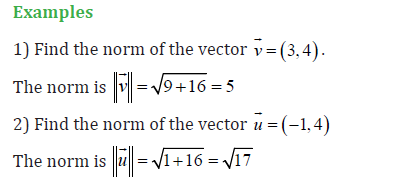
Examples
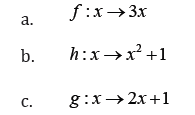
2. Draw arrow diagrams for the functions. Use the domain {1,2,3}
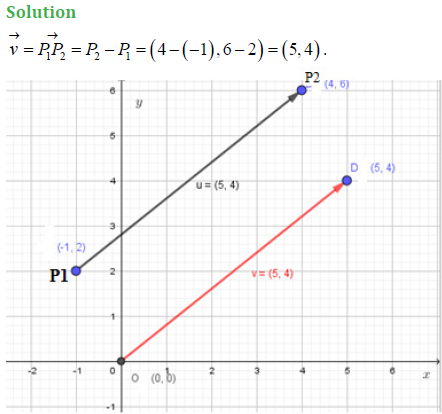
Solution
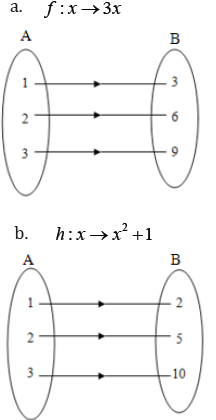
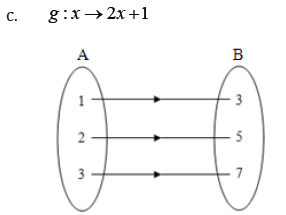
State the range of each of these functions.
Solution
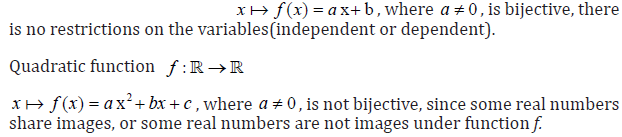
1.1.2 Injective, surjective and bijective functions
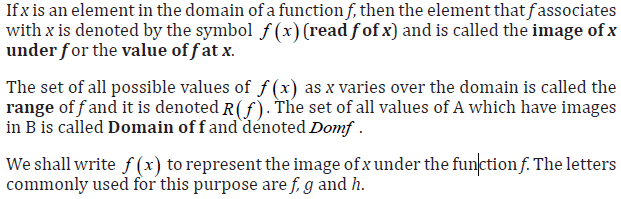
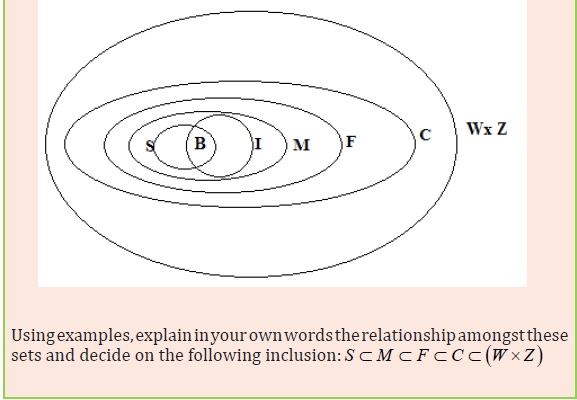
Given sets A and B, a function defined from A to B is a correspondence, or a rule that associates to any element of A either one image in B, or no image in B.
A function such that every elements of A has an image in B is called a mapping, thus, under a mapping any element of A has exactly one image in B (not less than one, and not more than one).
A mapping such that every element of B is image of either one element of A, or of no element of A, is called a one- to- one mapping, or an injective mapping or simply an injection; under a one-to-one mapping no two elements of A share the common image in B.

A mapping such that every element of B is image of at least one element of A (image of one element of A, or image of more than one element of A), is called an onto mapping, or a surjective mapping or simply a surjection

A mapping satisfying properties of both one-to-one and onto is said to be a bijective mapping, or simply a bijection.

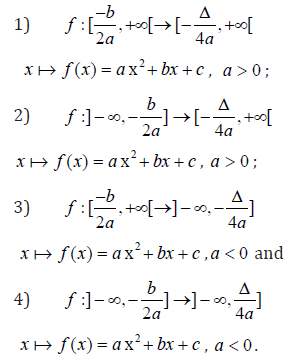
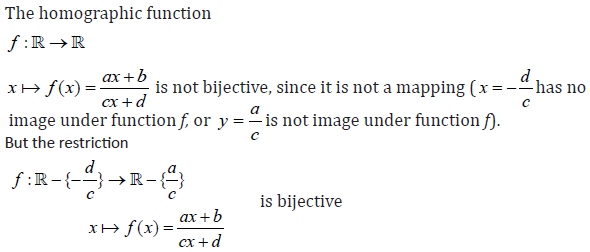
But the following restrictions are bijective:
Examples:
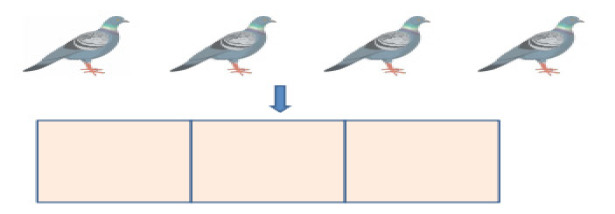
1) Consider the set of pigeons and the set of pigeonholes on the diagram below to answer the questions:
Determine whether it can be established or not between the two sets:
a. A mapping,
b. A one-to-one mapping,
c. An onto mapping,
d. A bijective mapping:
Solution:
Let the pigeons be numbered a, b, c, d and the pigeonholes be numbered 1,2,3.
a. It is possible to establish a mapping between the two sets. For example,
{(a,1);(b, 2);(c,3);(d,3)}.This function is a mapping since each pigeon is accommodated in exactly one pigeonhole, though pigeons c and d are in the same pigeonhole.
b. It is not possible to establish a one-to-one mapping, since sharing images is not allowed. A function from one finite set to a smaller finite set cannot be one-to-one: there must be at least two elements that have the same image
c. The example given in part (a) illustrates a mapping that is onto: no pigeonhole is empty.
d. It is impossible to define a bijection, since it is already impossible to establish a one-to-one mapping
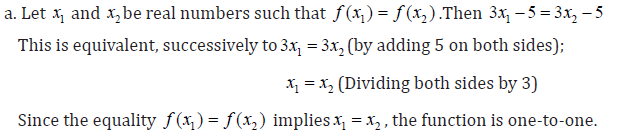
a. One-to-one
b. Onto
c. Bijective.
Solution:
Solution
is bijective
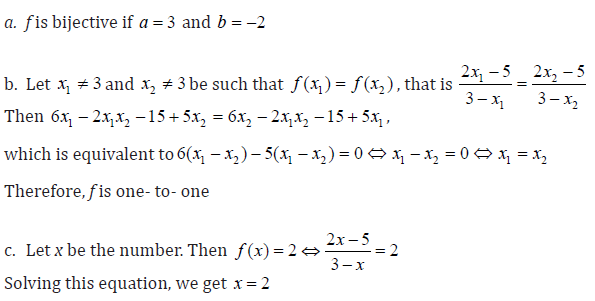
a. Find the values of a and b
b. Show that f is one-to-one
c. Find the real number whose image is 2
Solution:
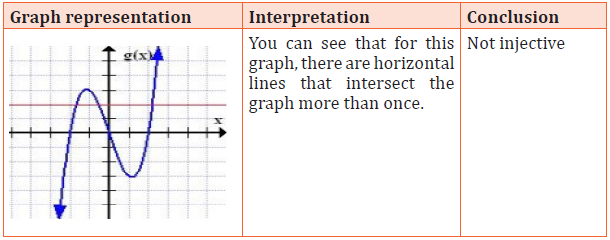
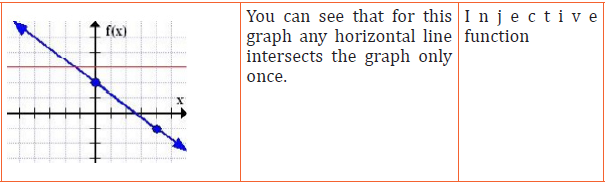
Horizontal Line Test
Horizontal Line Test states that a function is a one to one(injective) function if
there is no horizontal line that intersects the graph of the function at more than one point.
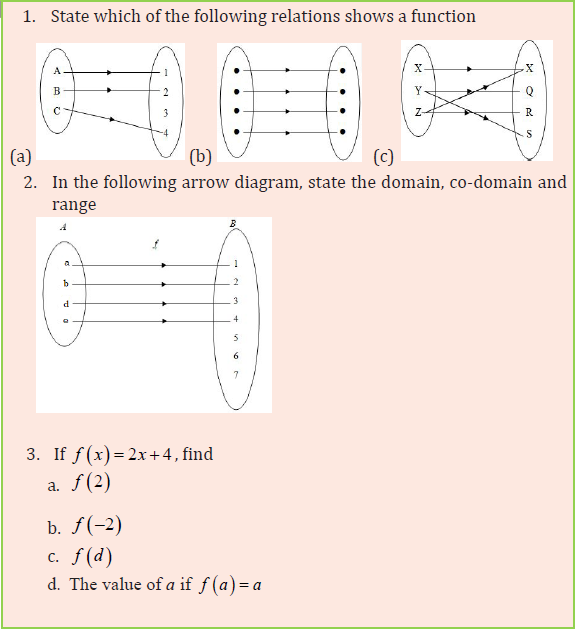
APPLICATION ACTIVITY 1.1
1.2 Types of numerical functions
ACTIVITY 1.2
a) Constant function
A function that assigns the same value to every member of its domain is called a constant function.
This is
 c where c is a given real number.
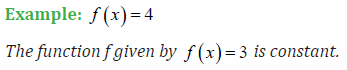
Remark
The constant function that assigns the value c to each real number is sometimes
called the constant function c.
b) Identity: The identity function is of the form

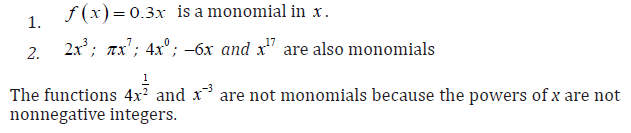
c) Monomial
A function of the form cxn , where c is constant and n a nonnegative integer is called a monomial in x.
Examples
d) Polynomial
A function that is expressible as the sum of finitely many monomials in x is called
Polynomial in x.
Examples:
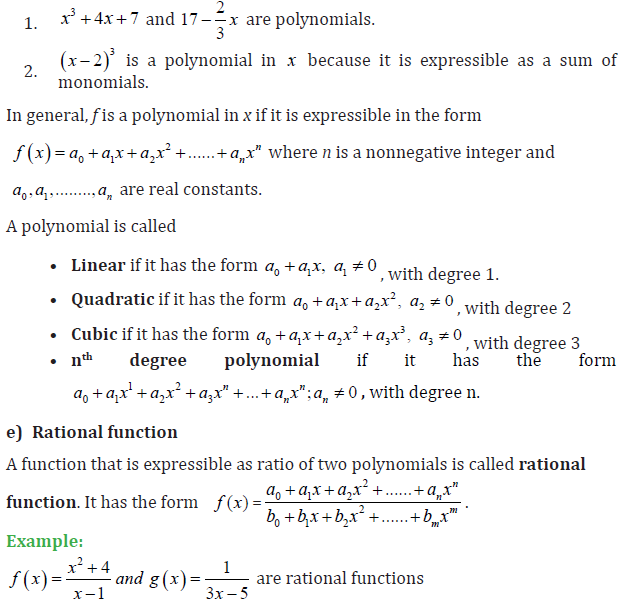
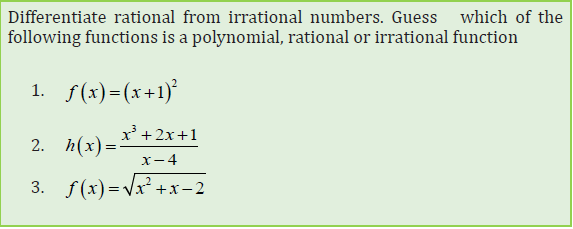
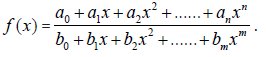
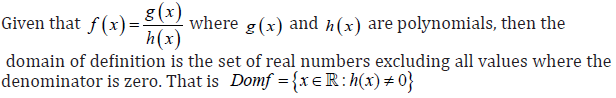
e) Rational function
A function that is expressible as ratio of two polynomials is called rational
function. It has the form
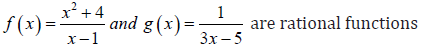
Example:
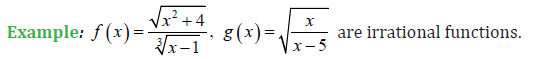
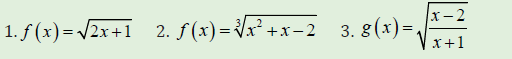
f) Irrational function
A function that is expressed as root extractions is called irrational function.

APPLICATION ACTIVITY 1.2
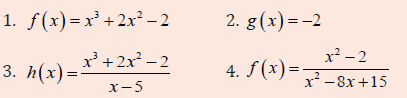
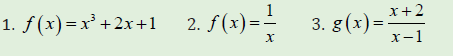
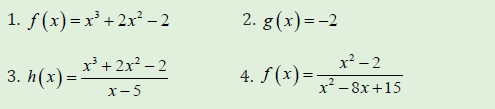
What is the type of the following function?
5. Provide other types of functions and explain your reasons with examples
1.3 Domain of definition for a numerical function
ACTIVITY 1.3.1
For which value(s) the following functions are not defined
ACTIVITY 1.3.2
Find the domain of definition for each of the following functions
ACTIVITY 1.3.3
For each of the following functions, give a range of values of the variable x for which the function is not defined
Content summary
(1) Case of polynomial functions
From the graphs, one can observe that each value of x has its corresponding y value.
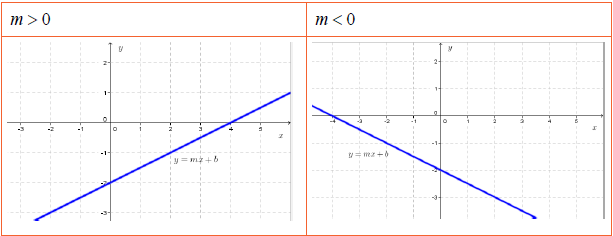
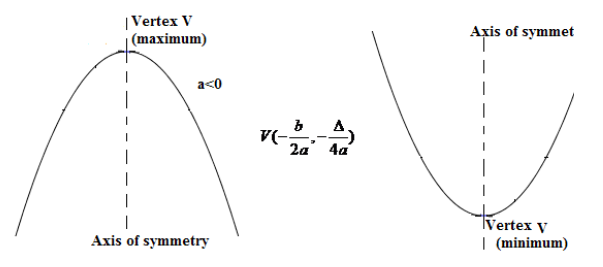
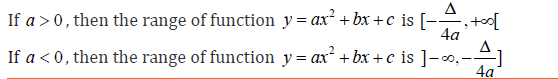
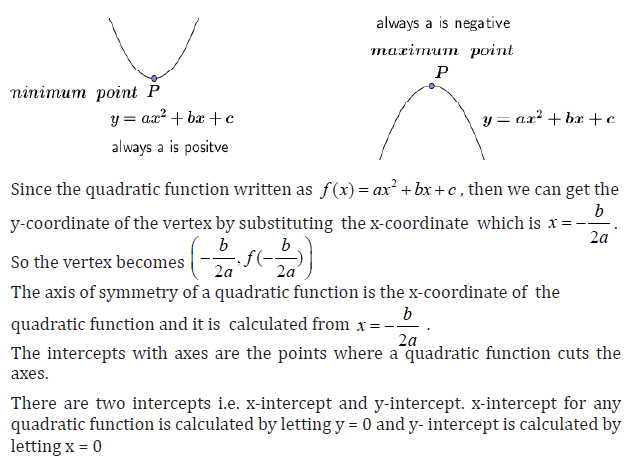
For quadratic functions y = ax2 + bx + c , the main features are summarized on the graph below:
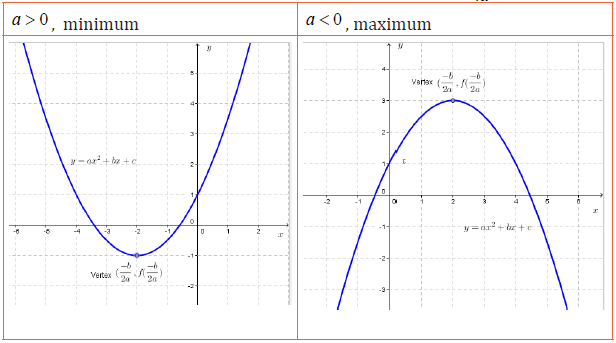
For cubic functions f (x) = ax3 + bx2 + cx + d;a ≠ 0 ,the trends of the graphs are as shown below:
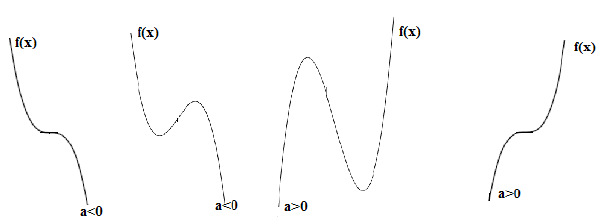
In each case, the domain is ]−∞,+∞[ and the range is ]−∞,+∞[
Even though the range for polynomials of odd degrees is the set of all real numbers, it is not the case for polynomials of even degree greater or equal to 4.
The determination of the range is not easy unless the function is given by its graph; in this case, find by inspection, on the y-axis, the set of all points such that the horizontal lines through those points cut the graph.
Example
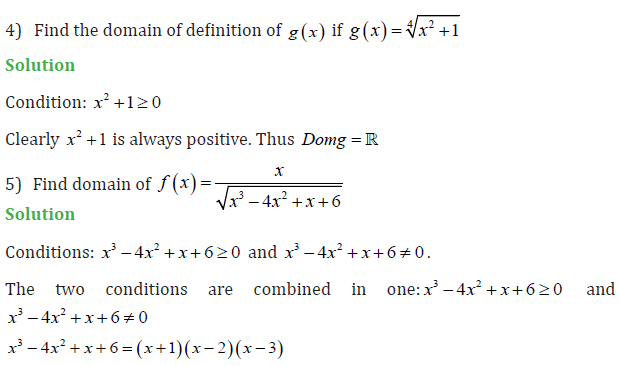
1) Determine the domain and range of
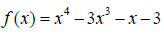 shown on the graph below:
Solution:
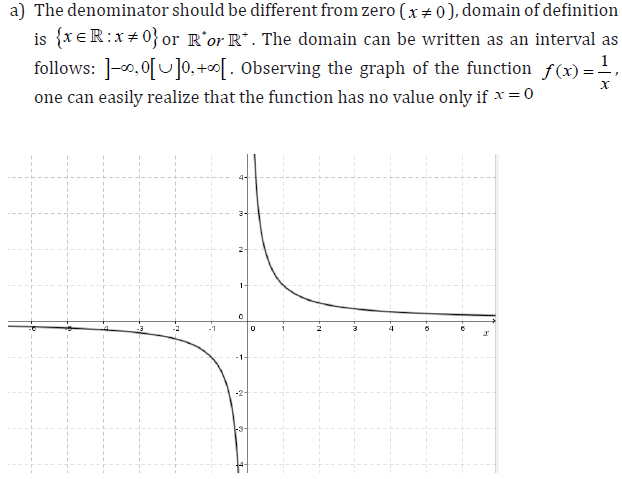
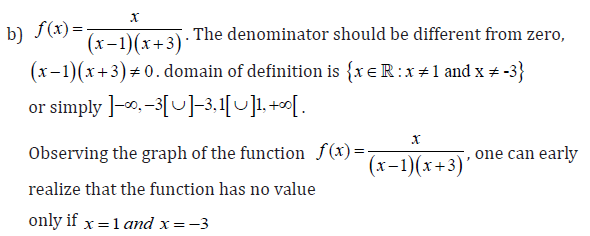
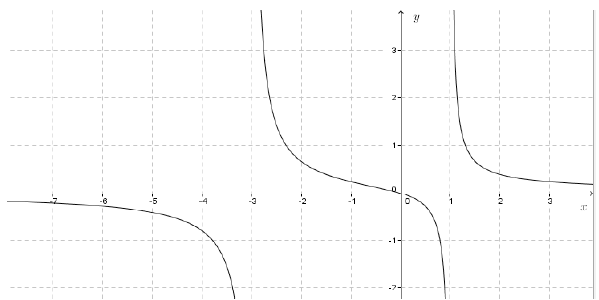
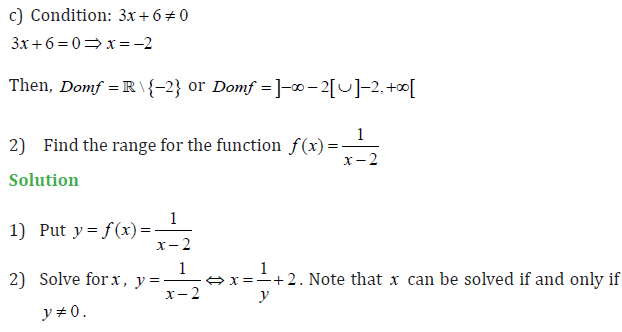
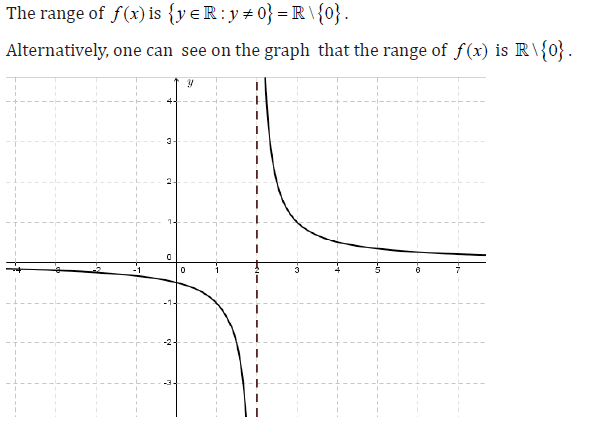
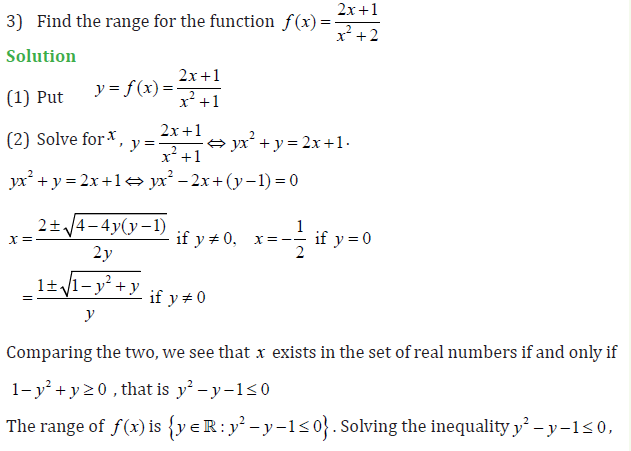
(2) Case for rational functions
Example
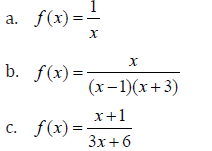
1) Find the domain of each of the functions:
Solution
(3) Case for irrational functions
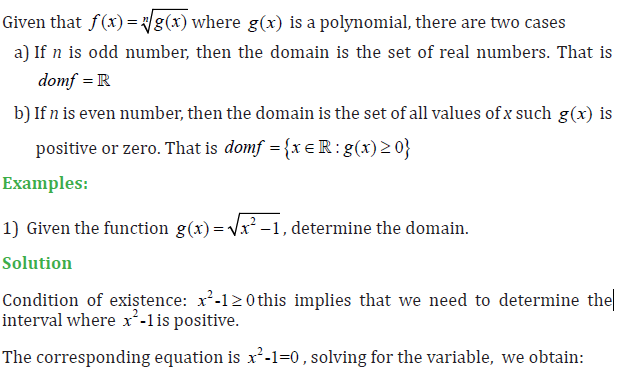
x2 -1=0 Û ( x -1)( x +1) =0
x -1 = 0 Þ x = 1
x + 1 = 0 Þ x = -1

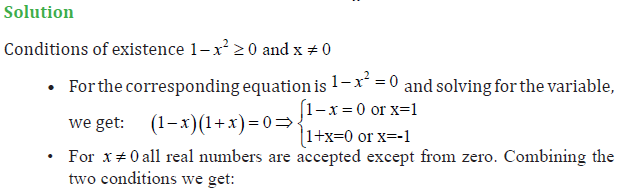
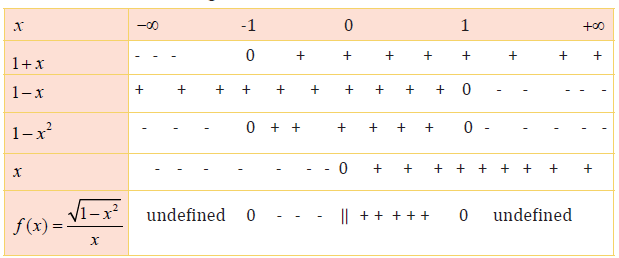
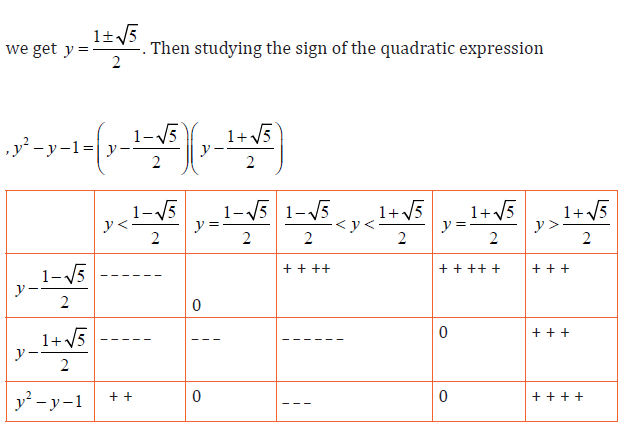
Solution
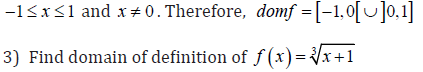
Since the index in radical sign is odd number, then

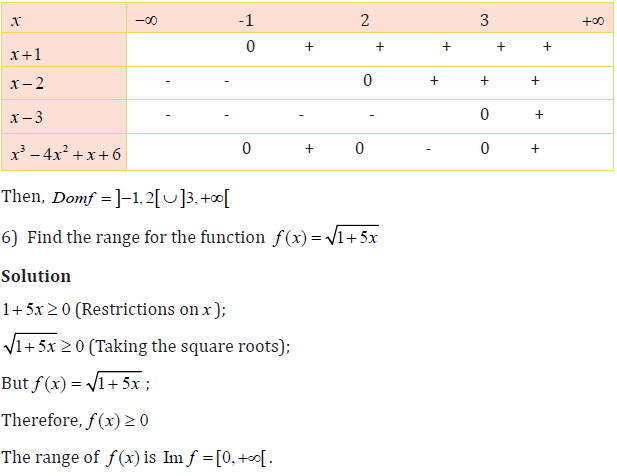
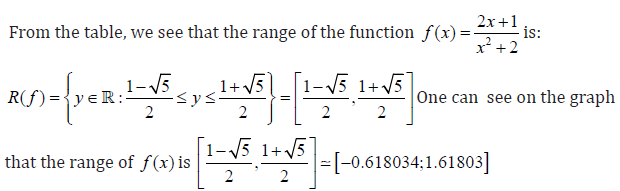
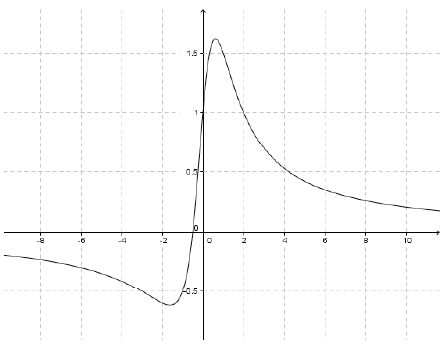
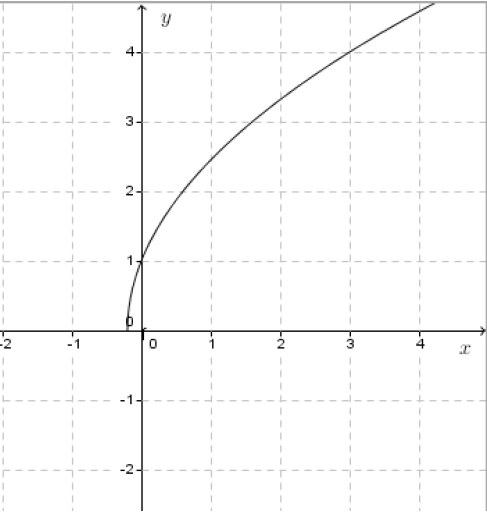
The graph below illustrates the range:
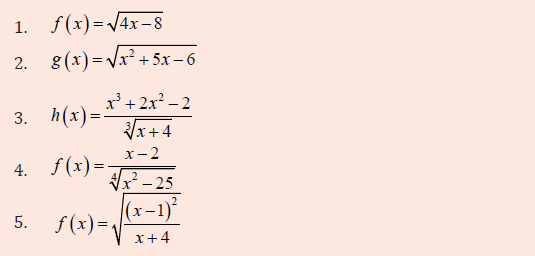
APPLICATION ACTIVITY 1.3
Find the domain of definition for each of the following functions
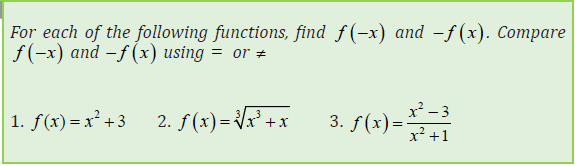
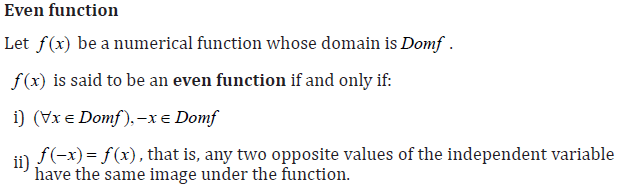
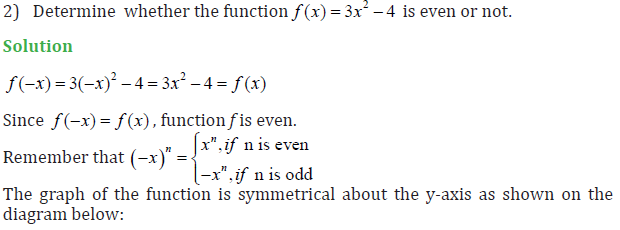
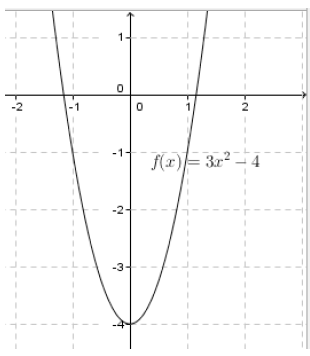
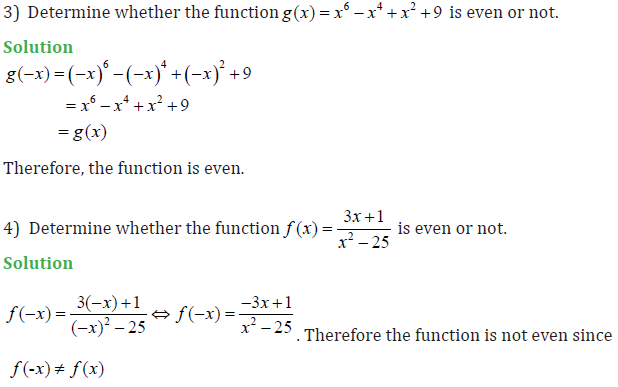
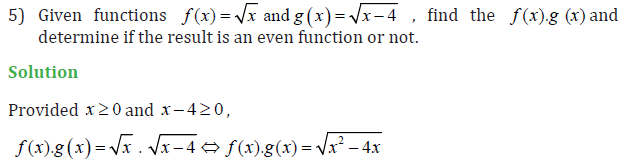
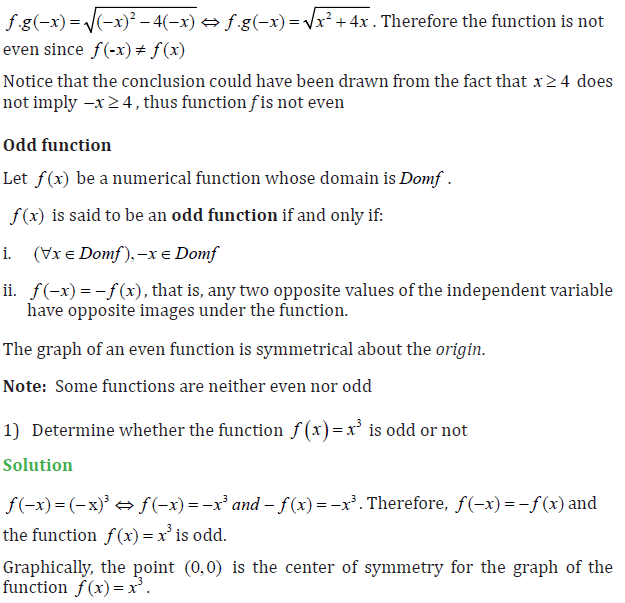
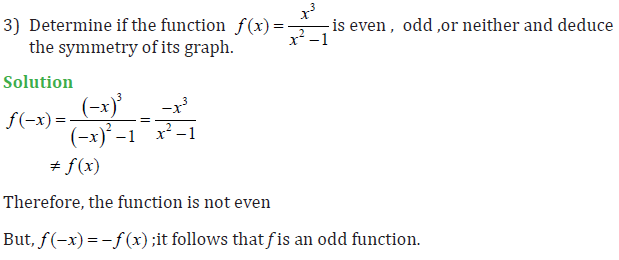
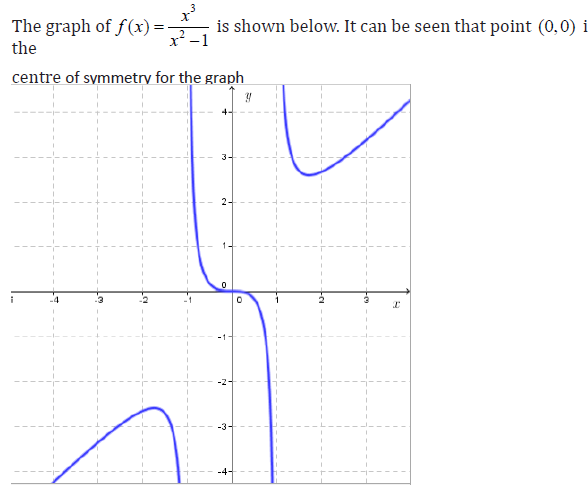
1.4 Parity of a function (odd or even)
ACTIVITY 1.4
The graph of an even function is symmetrical about the y-axis.
Examples

Solution
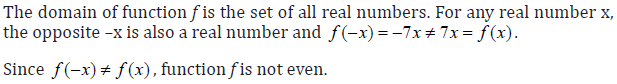
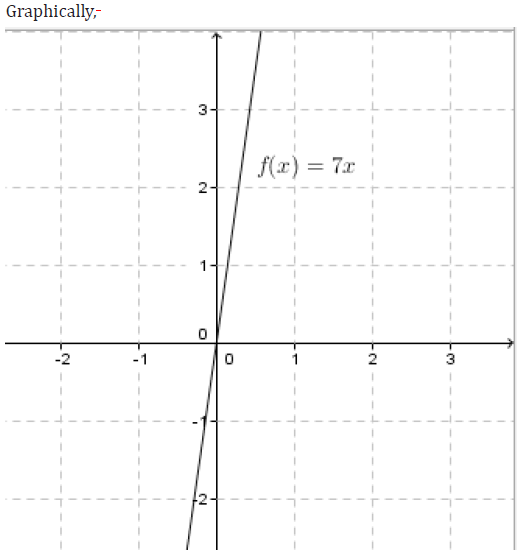
The graph is not symmetrical about the y-axis
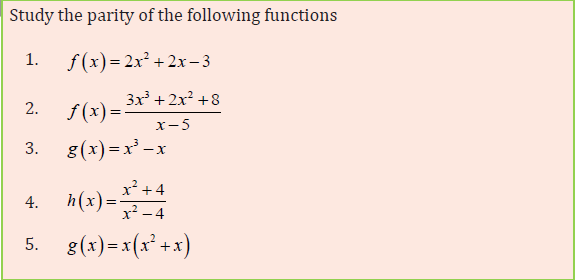
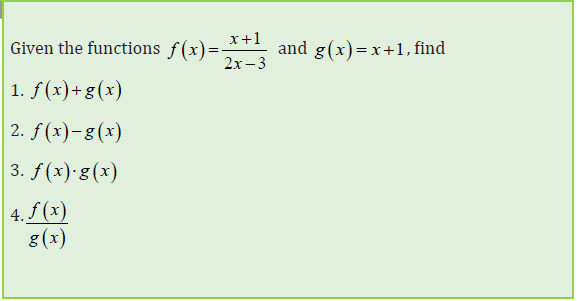
APPLICATION ACTIVITY 1.4
1.5 Operations on functions
1.5.1 Addition, subtraction, multiplication and division
LEARNING ACTIVITY 1.5.1
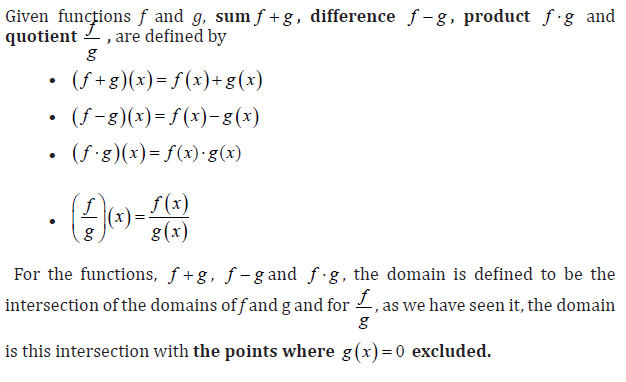
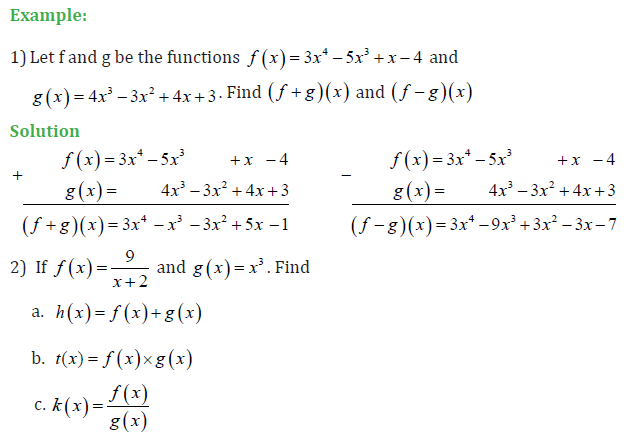
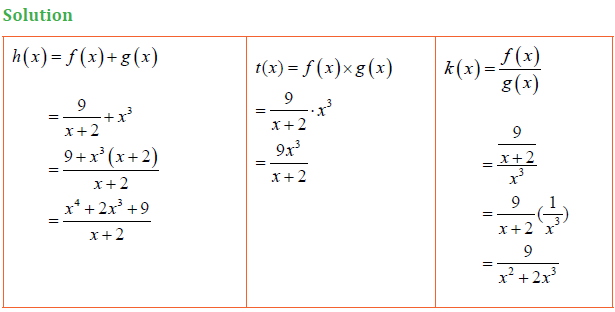
Just as numbers can be added, subtract, multiplied and divided to produce other numbers, there is a useful way of adding, subtracting, multiplying and dividing functions to produce other functions. These operations are defined as follows:
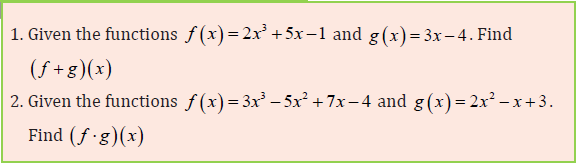
APPLICATION ACTIVITY 1.5.1
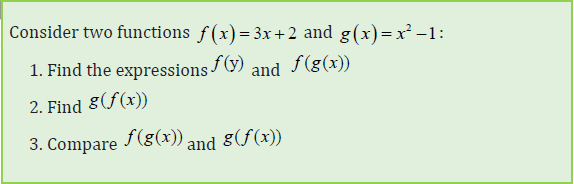
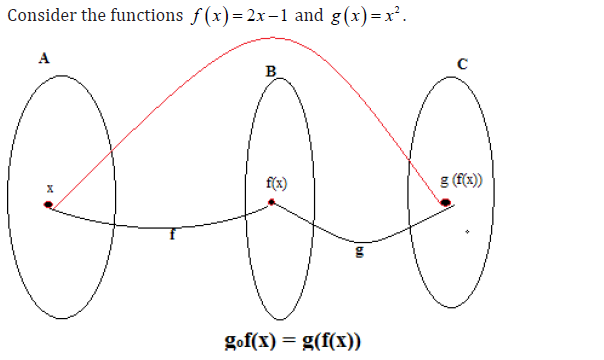
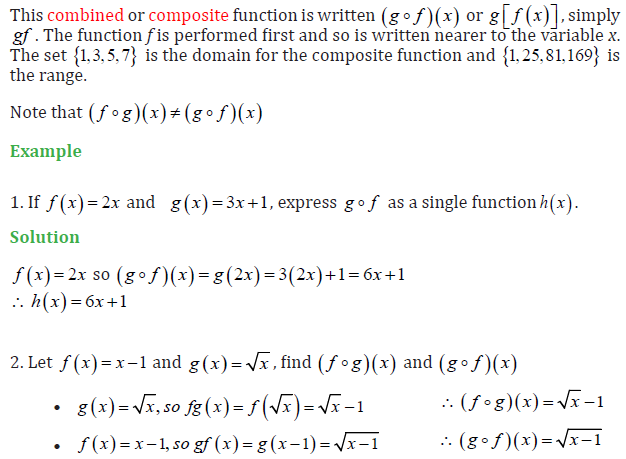
1.5.2 Composite functions
ACTIVITY 1.5.2
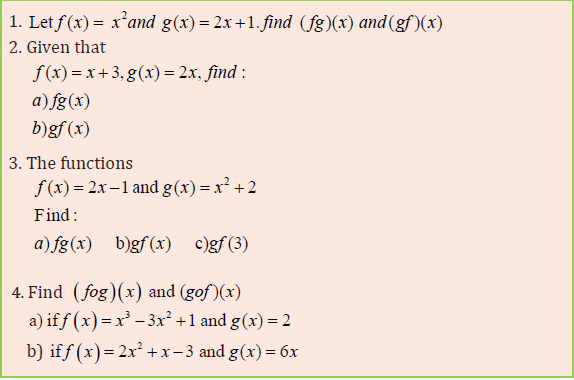
APPLICATION ACTIVITY 1.5.2
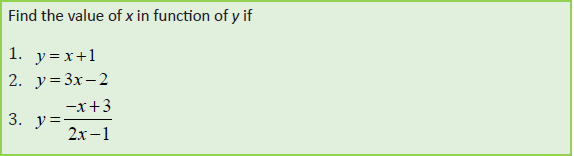
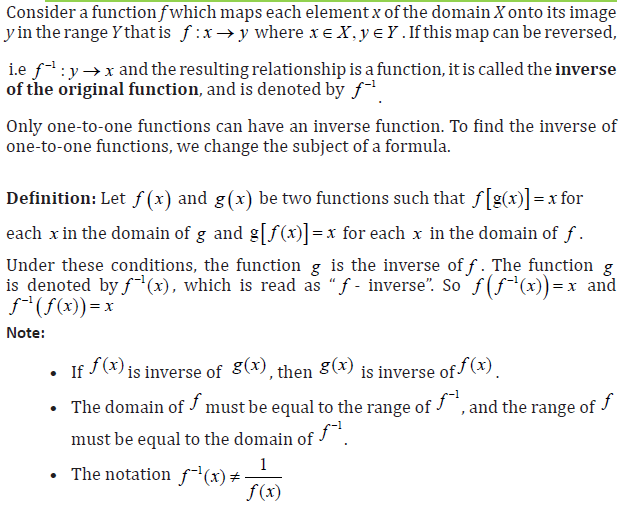
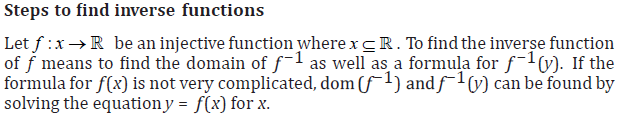
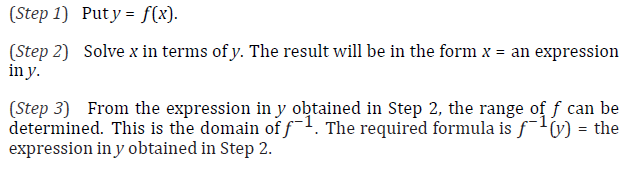
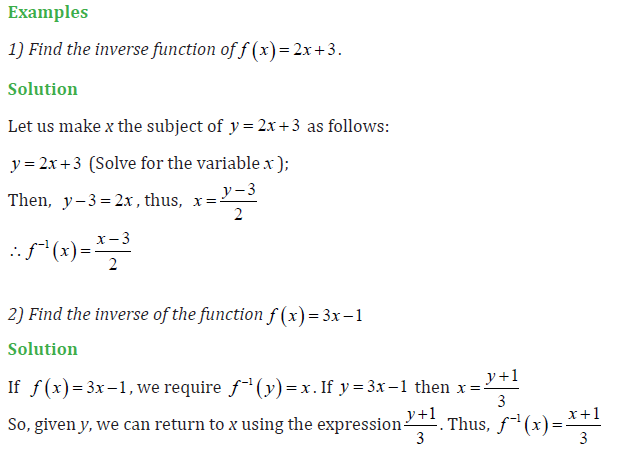
1.5.3 The inverse of a function
ACTIVITY 1.5.3
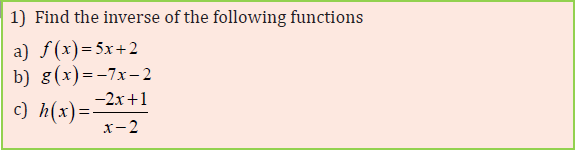
APPLICATION ACTIVITY 1.5.3
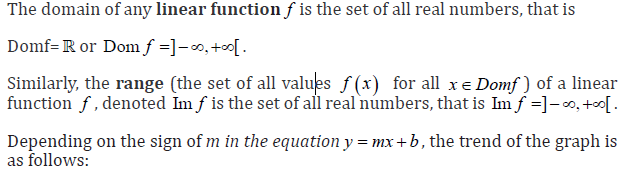
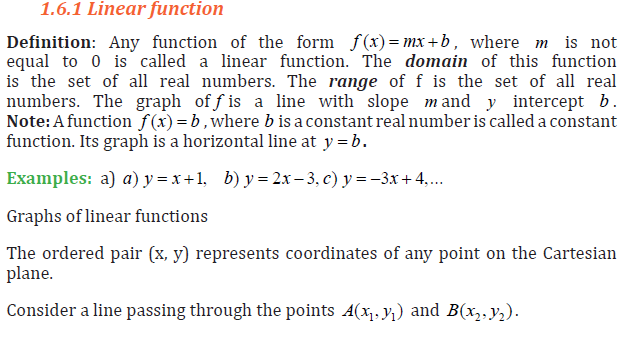
1.6 Graphical representation and interpretation of linear and quadratic functions
ACTIVITY 1.6
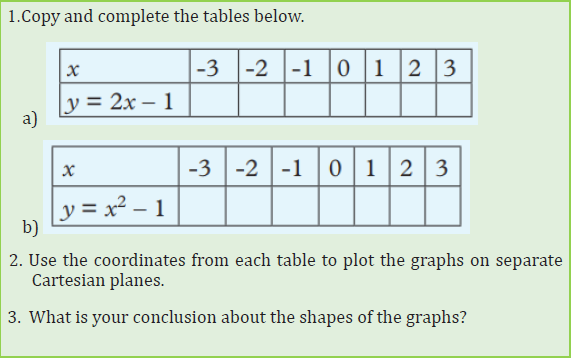
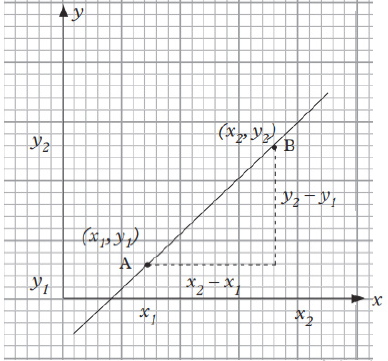
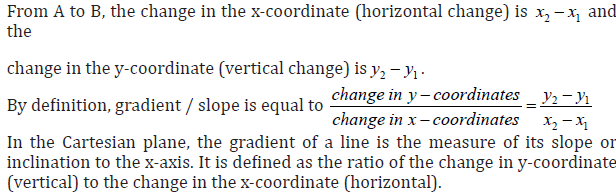
When drawing a graph of a linear function, it is sufficient to plot only two points and these points may be chosen as the x and y intercepts of the graph.
In practice, however, it is wise to plot three points. If the three points lie on the same line, the working is probably correct, if not you have a chance to check whether there could be an error in your calculation.
If we assign x any value, we can easily calculate the corresponding value of y.
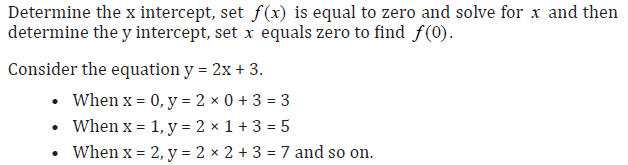
For convenience and ease while reading, the calculations are usually tabulated
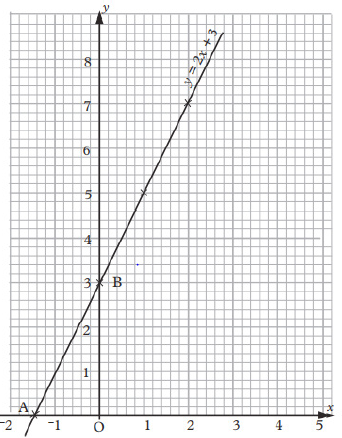
as shown below in the table of values for y = 2x + 3.
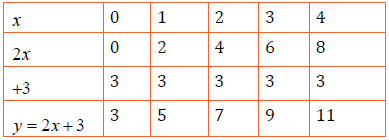
From the table the coordinates (x, y) are (0, 3), (1, 5), (2, 7), (3, 9), (4, 11)....
When drawing the graph, the dependent variable is marked on the vertical axis generally known as the y – axis. The independent variable is marked on the horizontal axis also known as the x – axis.
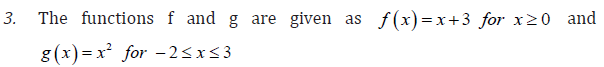
1.6.2 Quadratic function
A polynomial equation in which the highest power of the variable is 2 is called a quadratic function. The expression y = ax2 + bx + c , where a,b and c are constants and a ≠ 0, is called a quadratic function of x or a function of the second degree (highest power of x is two).
Table of values are used to determine the coordinates that are used to draw thegraph of a quadratic function. To get the table of values, we need to have the domain (values of an independent variable) and then the domain is replaced in a given quadratic function to find range (values of dependent variables). The values obtained are useful for plotting the graph of a quadratic function. All quadratic function graphs are parabolic in nature.
Any quadratic function has a graph which is symmetrical about a line which is parallel to the y-axis i.e. a line x = h where h is constant value. This line is called axis of symmetry.

For any quadratic function f (x) = ax2 + bx + c whose axis of symmetry is the line x = h , the vertex is the point (h, f
).
The vertex of a quadratic function is the point where the function crosses its axis of symmetry.
If the coefficient of the x2 term is positive, the vertex will be the lowest point on the graph, the point at the bottom of the U-shape. If the coefficient of the term x2 is negative, the vertex will be the highest point on the graph, the point at the top of the ∩-shape. The shapes are as below.
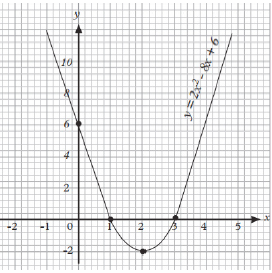
Graph of a quadratic function
The graph of a quadratic function can be sketched without table of values as
long as the following are known.
- The vertex
- The x-intercepts
- The y-intercept
APPLICATION ACTIVITY 1.6
1.Using the table of values, sketch the graph of the following functions:
a) y = – 3x + 2
b) y = x2 – 3x + 2
2. Without tables of values, state the vertex, intercept with axis, axis of symmetry, and sketch the graph of
−3x2 + 6x +1 = y
1.7 Graphical representation and interpretation of functions in economics and finance
ACTIVITY 1.7
Content summary
1. Price as function of quantity supplied
The quantity q of an item that is manufactured and sold depends on its price p
As the price increases, manufacturers are usually willing to supply more of the
product, whereas the quantity demanded by consumers falls.
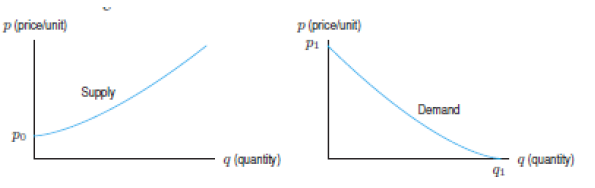
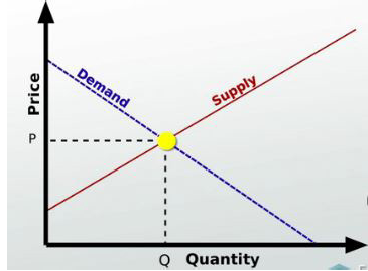
The supply curve, for a given item, relates the quantity q of the item that
manufacturers are willing to make per unit time to the price p for which the item can be sold.
The demand curve relates the quantity q of an item demanded by consumers per unit time to the price p of the item.
Economists often think of the quantities supplied and demanded Q as functions of price P. However, for historical reasons, the economists put price (the independent variable) on the vertical axis and quantity (the dependent variable) on the horizontal axis. (The reason for this state of affairs is that economists originally took price to be the dependent variable and put it on the vertical axis
Theoretically, it does not matter which axis is used to measure which variable.
However, one of the main reasons for using graphs is to make analysis clearer to understand. Therefore, if one always has to keep checking which axis measures which variable this defeats the objective of the exercise. Thus, even though it may upset some mathematical purists, the economists sometimes stick to the convention of measuring quantity on the horizontal axis and price on the vertical axis, even if price is the independent variable in a function.
This means that care has to be taken when performing certain operations on functions. If necessary, one can transform monotonic functions to obtain the inverse function (as already explained) if this helps the analysis.
Examples
This figure shows that when the quantity Q is increasing, the price P reduces progressively.
This can be caused by the fact that every consumer has sufficient quantity of goods and does not want to by any more.
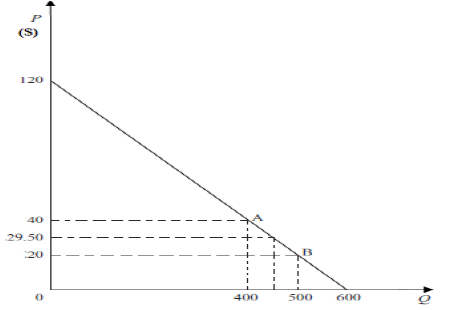
2) Suppose that a firm faces a linear demand schedule and that 400 units of output Q are sold when price is $40 and 500 units are sold when price is $20. Once these two price and quantity combinations have been marked as points A and B, then the rest of the demand schedule can be drawn in. Use this data to determine the function that can help to predict quantities demanded at different prices and draw the corresponding graph.
Solution:
Accurate predictions of quantities demanded at different prices can be made if the information that is initially given is used to determine the algebraic format of the function.
A linear demand function must be in the form P = a − bQ , where a and b are parameters that we wish to determine the value of.
When P = 40 then Q = 400 and so 40 = a − 400b (1)
When P = 20 then Q = 500 and so 20 = a − 500b (2)
Equations (1) and (2) are what is known as simultaneous linear equations.
We can solve these simultaneous linear equations by one of the methods we used above and find
a =120, b = 0.02 .
Our function can now be written as P = 120 − 0.2Q
We can check that this is correct by substituting the original values of Q into the function.
If Q = 400 then P = 120 − 0.2(400) = 120 − 80 = 40
If Q = 500 then P = 120 − 0.2(500) = 120 − 100 = 20
These are the values of P originally specified and so we can be satisfied that the
line that passes through points A and B is the linear function P = 120 − 0.2Q.
The inverse of this function will be Q = 600−5P. Precise values of Q can now
be derived for given values of P. For example, when P = £29.50 then Q = 600 −
5(29.50) = 452.5.
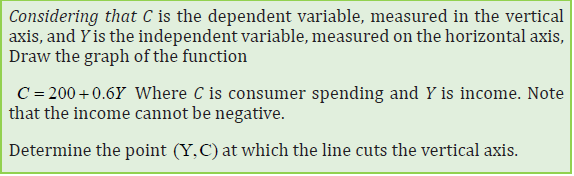
It is assumed that consumption C depends on income Y and that this relationship
takes the form of the linear function C = a + bY .
Example:
When the income is $600, the consumption observed is $660. When the income is $1,000, the consumption observed is $900. Determine the equation “consumption function of income”.
Solution:
To determine the required equation, we can solve this system of equations
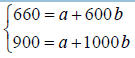
by using different methods to find the value of a and b .
However, let us use another way as follows: We expect b to be positive, i.e. consumption increases with income, and so our function will slope upwards. As this is a linear function then equal changes in Y will cause the same changes in C.
A decrease in Y of $400, from $1,000 to $600, causes C to fall by $240, from $900 to $660.
If Y is decreased by a further $600 (i.e. to zero) then the corresponding fall in
C will be 1.5 times the fall caused by an income decrease of $400, since $600 = 1.5 × $400.
Therefore, the fall in C is 1.5 × $240 = $360. This means that the value of C when
Y is zero is $660 − $360 = $300. Thus a = 300.
A rise in Y of $400 causes C to rise by $240. Therefore, a rise in Y of $1 will cause
C to rise by $240/400 = $0.6. Thus b = 0.6.
The function can therefore be specified as C = 300 + 0.6Y .
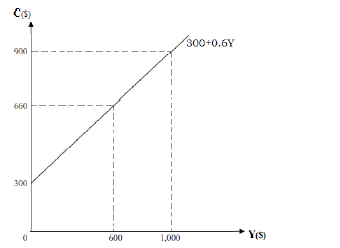
The graph shows that when the income increases, the consumption increases also.
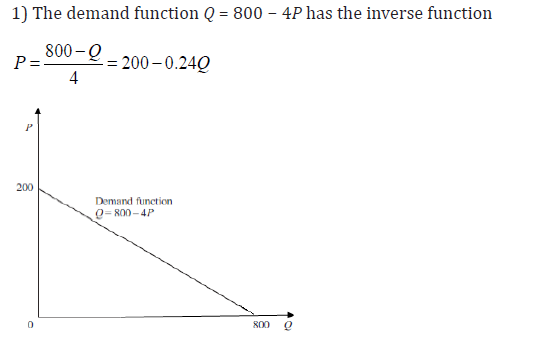
3. Price as function of quantity demanded
The linear demand function is in the form P = a − bQ , where a and b are
parameters, P is the price and Q is the quantity demanded.
Example:
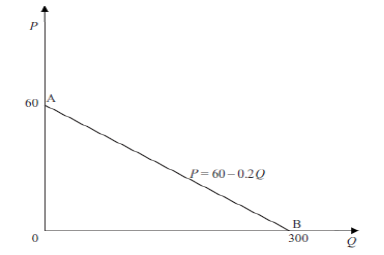
Consider the function P = 60−0.2Q where P is price and Q is quantity demanded.
Assume that P and Q cannot take negative values, determine the slop of this function and sketch its graph.
Solution:
When Q = 0 then P = 60
When P = 0 then 0 = 60 − 0.2Q
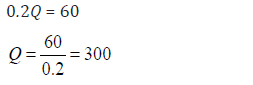
Using these points: (0,60) and (300,0) , we can find the graph as follows:
The slope of a function which slopes down from left to right is found by applying the formula
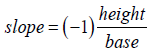
To the relevant right-angled triangle. Thus, using the triangle 0BA, the slope of our function is
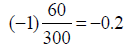
This, of course, is the same as the coefficient of Q in the function P = 60 − 0.2Q.
Remember that in economics the usual convention is to measure P on the vertical axis of a graph. If you are given a function in the format Q = f (P) then you would need to derive the inverse function to read off the slope.
Example:
What is the slope of the demand function Q = 830 − 2.5P when P is measured on the vertical axis of a graph?
Solution:
If Q= 830−2.5P; then 2.5P = 830−Q
P = 332−0.4Q
Therefore, the slope is the coefficient of Q, which is −0.4.
4. Point elasticity of demand
Elasticity can be calculated at a specific point on a linear demand schedule. This
is called ‘point elasticity of demand’ and is defined as
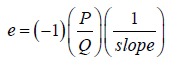
where P and Q are the price and quantity at the point in question. The slope refers to the slope of the demand schedule at this point although, of course, for a linear demand schedule the slope will be the same at all points.
Example:
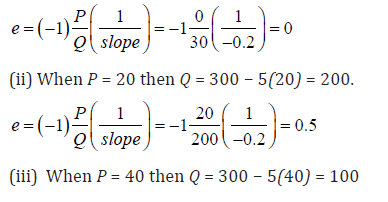
Calculate the point elasticity of demand for the demand schedule P = 60 − 0.2Q where price is
(i) Zero, (ii) $20, (iii) $40, (iv) $60.
Solution
This is the demand schedule referred to earlier and illustrated above. Its slope
must be −0.2 at all points as it is a linear function and this is the coefficient of Q.
To find the values of Q corresponding to the given prices we need to derive the inverse function. Given that
P = 60 − 0.2Q then 0.2Q = 60 − P
Q = 300 − 5P
(i) When P is zero, at point B, then Q = 300 − 5(0) = 300. The point elasticity will therefore be
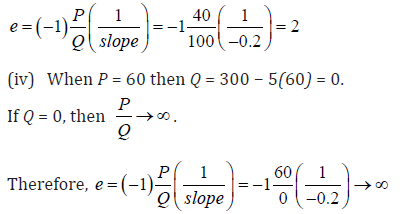
5. The Cost Function
The cost function, C(q), gives the total cost of producing a quantity q of some good. Costs of production can be separated into two parts: the fixed costs, which are incurred even if nothing is produced, and the variable costs, which depend on how many units are produced.
Example:
Let’s consider a company that makes radios. The factory and machinery needed to begin production are fixed costs, which are incurred even if no radios are made. The costs of labor and raw materials are variable costs since these quantities depend on how many radios are made. The fixed costs for this company are $24,000 and the variable costs are $7 per radio.
Then, Total costs for the company = Fixed costs + Variable costs = 24,000 + 7.
(Number of radios),
so, if q is the number of radios produced,
C(q) = 24,000 + 7q.
This is the equation of a line with slope 7 and vertical intercept 24,000.
If C(q) is a linear cost function,
- Fixed costs are represented by the vertical intercept.
- Marginal cost is represented by the slope.
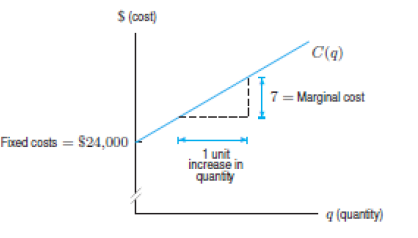
6. The Revenue Function
The revenue function, R(q), gives the total revenue received by a firm from selling a quantity, q, of some good.
If the good sells for a price of p per unit, and the quantity sold is q, then Revenue
= Price · Quantity,
so, R = pq.
If the price does not depend on the quantity sold, so p is a constant, the graph
of revenue as a function of q is a line through the origin, with slope equal to the price p.
Example:
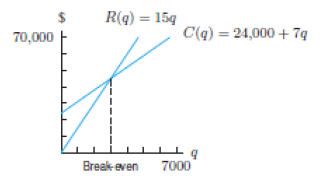
1. If radios sell for $15 each, sketch the manufacturer’s revenue function. Show
the price of a radio on the graph.
Solution:
Since R(q) = pq = 15q, the revenue graph is a line through the origin with a
slope of 15. See the figure. The price is the slope of the line.
2. Graph the cost function C(q) = 24,000 + 7q and the revenue function R(q) =
15q on the same axes. For what values of q does the company make money?
Solution:
The company makes money whenever revenues are greater than costs, so we
find the values of q for which the graph of R(q) lies above the graph of C(q). See Figure 1.45.
We find the point at which the graphs of R(q) and C(q) cross:
Revenue = Cost
15q = 24,000 + 7q
8q = 24,000
q = 3000.
The company makes a profit if it produces and sells more than 3000 radios. The
company loses money if it produces and sells fewer than 3000 radios.
7. The Profit Function
Decisions are often made by considering the profit, usually written as π to
distinguish it from the price, p .
We have: Profit = Revenue – Cost.
So, π = R −C
The break-even point for a company is the point where the profit is zero and revenue equals cost.
Example:
Find a formula for the profit function of the radio manufacturer. Graph it, marking the break-even point
Solution:
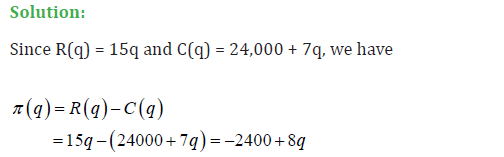
Notice that the negative of the fixed costs is the vertical intercept and the breakeven
point is the horizontal intercept. See the figure;
8. The Marginal Cost, Marginal Revenue, and Marginal Profit
Just as we used the term marginal cost to mean the rate of change, or slope, of a linear cost function, we use the terms marginal revenue and marginal profit to mean the rate of change, or slope, of linear revenue and profit functions, respectively.
The term marginal is used because we are looking at how the cost, revenue, or profit change “at the margin,” that is, by the addition of one more unit.
For example, for the radio manufacturer, the marginal cost is 7 dollars/item (the additional cost of producing one more item is $7), the marginal revenue is 15 dollars/item (the additional revenue from selling one more item is $15), and the marginal profit is 8 dollars/item (the additional profit from selling one more item is $8).
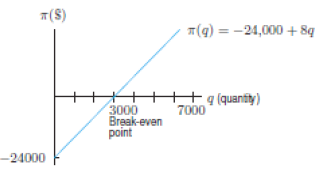
9. Equilibrium Price and Quantity
If we plot the supply and demand curves on the same axes, the graphs cross at the equilibrium point. The values p * and q* at this point are called the equilibrium price and equilibrium quantity, respectively. It is assumed that the market naturally settles to this equilibrium point.
Example:
Find the equilibrium price and quantity if Quantity supplied = 3p − 50 and
Quantity demanded = 100 − 2p.
Solution:
To find the equilibrium price and quantity, we find the point at which
Supply = Demand
3p − 50 = 100 − 2p
5p = 150
p = 30.
The equilibrium price is $30. To find the equilibrium quantity, we use either the demand curve or the supply curve.
At a price of $30, the quantity produced is
100 − 2 (30) = 40 items.
The equilibrium quantity is 40 items.
In the figure, the demand and supply curves intersect at p* = 30 and q* = 40 .
APPLICATION ACTIVITY 1.7
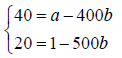
1. Assume that consumption C depends on income Y according to the function
C = a + bY , where a and b are parameters. If C is $60 when Y is $40 and C is $90 when Y is $80,
What are the values of the parameters a and b?
Sketch the graph of C(Y) and interpret it.
2. Suppose that q = f(p) is the demand curve for a product, where p is the
selling price in dollars and q is the quantity sold at that price.
(a) What does the statement f(12) = 60 tell you about demand for this product?
(b) Do you expect this function to be increasing or decreasing? Why?
3. A demand curve is given by 75p + 50q = 300, where p is the price of the product, in dollars, and q is the quantity demanded at that price.
Find p * and q* intercepts and interpret them in terms of consumer demand.
1.8 END UNIT ASSESSMENT
1) The total cost C for units produced by a company is given by
C(q) = 50000 + 8q where q is the number of units produced.
a) What does the number 50000 represent?
b)What does the number 8 represent?
d) Plot the graph of C and indicate the cost when q = 5 .
e) Determine the real domain and the range of C(q) .
f) Is C(q) an odd function?
2) Bosco was working for his boss Kamana and they agreed to start a job where the monthly salary f (t ) was depending on the time t representing the tth month Bosco spends on service. The salary
f (t ) was the sum of a monthly bonus of 50,000Fr and product of 10,000Frw by the inverse of the time t .
a) Give the function f (t ) which models the monthly salary of Bosco;
b) Determine the domain of f (t ) and explain what it means
c) Suppose that Bosco can continue to work indefinitely, determine the Maximum Salary and the Minimum Salary can Bosco get and deduce the Range of f (t ) .
d) Bosco has a monthly bonus, is this bonus motivating? Explain your answer.
e) If you were Bosco, how many months can you work for Kamana?
Explain your answer.
UNIT 2:INTRODUCTION TO LOGIC
Key Unit competence: Use Mathematical logic as a tool of reasoning and decision making in daily life
2.0 INTRODUCTORY ACTIVITY 2
A) Discuss the meaning of propositional statement
B) In the following sentences which of them are propositions and which are not propositions?
1. Don’t eat the daisies!
2. My dog is called Didi.
3. Do you enjoy reading novels?
4. The jokes are great.
5. Mozart composed classical music.
6. The camera is not a Kodak.
7. This statement is false.
8. Use the quadratic formula on that one.
2.1 Simple statement and compound statements
ACTIVITY 2.1
From the following expressions, give your answer by true or false
1. Every integer larger than 1 is positive
2. Kampala is in Rwanda
3. How old are you?
4. Every liquid is water.
5. Write down the names of Rwandan president.
6. 1− x2 = 0 .
7. Rwanda is an African country or Rwanda is a member of Commonwealth.
Content summary
A sentence which is either true or false but not both simultaneously is named statement or proposition. In the context of logic, a proposition or a statement is the sentence in the grammatical sense conveying a situation which is neither imperative, interrogative nor exclamatory.
The expressions 1, 2, 4 and 7 are statements: the 2nd and 4th are false while 1st and 7th are true.
- • The expression “How old are you?” is not a proposition since you cannot reply by true nor false (grammatically this sentence is interrogative).
- The equality “1− x2 = 0 ” is not a proposition because for some values of x the equality is true, whereas for others it is false.
- The expression “Write down the names of Rwandan president” is not a proposition as the answer will be given by neither true nor false. It is a command.
A statement that cannot be broken into two or more sentences is called simple statement. Combining two or more simple statements we form a compound statement.
Example: In activity 7.1.1, the 1st, 2nd and 4th expressions are simple statements while the 7th is a compound statement.
In this unit, statements will be denoted by small letters such as p, q, r, ...
The logical statements are required to have a definite truth-value, or, to be either true or false, but never both, and to always have the same truth value.
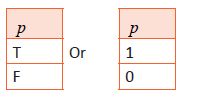
The two truth values of proposition are true and false and are denoted by the symbols T and F respectively.
Occasionally, they are also denoted by the symbols 1 and 0 respectively.
APPLICATION ACTIVITY 2.1
1) Find out which of the following sentences are statements and which are not. Justify your answer.
a) Uganda is a member of East African Community.
b) The sun is shining.
c) Come to class!
d) The sum of two prime numbers is even.
e) It is not true that China is in Europe.
f) May God bless you!
2) Write down the truth value (T or F) of the following statements
a) Paris is in Italy.
b) 13 is a prime number.
c) Kigeri IV Rwabugiri was the king of the Kingdom of Rwanda
d) Lesotho is a state of South Africa.
2.2 Truth values and truth tables
ACTIVITY 2.2
Are these sentences proposition? If yes, give their truth values
a) Uganda is a member of East African Community.
b) The sun shines.
c) Paris is in England.
d) Come to class!
e) The sum of two prime numbers is even.
f) It is not true that Uganda is in Europe.
Content summary
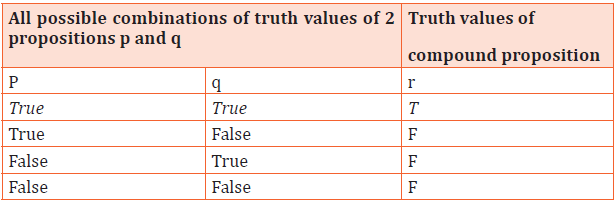
The way we will define compound statements is to list all the possible combinations of the truth-values (abbreviated T and F or 1and 0) of the simple statements (that are being combined into a compound statement) in a table, called a truth table. The name of each statement is at the top of a column of the table.
If the compound statement contains n distinct simple statements, we will consider 2n possible combinations of truth values in order to obtain the truth table.
Examples
1) One proposition p has two truth values ( 21 = 2 possible combinations), the truth table is
2) Suppose we are given two mathematical statements, named P and Q, new mathematical statements that incorporate P and Q are called compound statements. Their truth values will be determined solely by the truth-values of P and of Q.
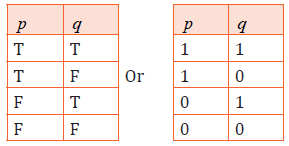
For two propositions p and q, we have 22 = 4 possible combinations of truth values, the truth table is:
Any proposition can be represented by a truth table
- It shows truth values for all combinations of its constituent variables
Example:
Proposition involving 2 variables p and q. Let us take the true statement “p and q” where p: I am at home, and q: It is raining. One combination of r = p ∧ q is I am at home and it is raining. Others are the following: I am at home and it is not raining (F), I am not at home and it is raining (F) and I am not at home and it is not raining (F).
A proposition can involve any number of variables; each row corresponds to a possible combination of variables. With n variables the truth table has:
n+1 column (one for each of the n variables and one for the compound expression);
It has also 2n rows plus a header.
The following lesson will develop how to make a compound statement using different connectives.
APPLICATION ACTIVITY 2.2
Write down the truth table for
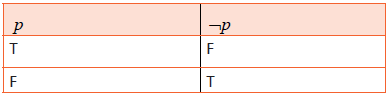
1) Three propositions p, q and r
2) Four propositions p, q, r and s
2.3 Logical connectives
2.3.1 Negation
ACTIVITY 2.3.1
1) Given statements P: I am strong and Q: I can jump, try to make a compound statement formed by P and Q in different ways. What are the different connecting words that can be used?
2) Let p, q, … are the given propositions, put these propositions in negative form
1. Jack is running.
2. Ronald does not smile.
3. She isn’t a foot ball player.
4. -3 is a natural number.
5. Mathematics is needed in languages Education option.
Content summary
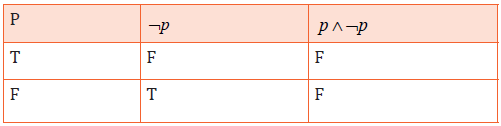
The negation of a statement P is made by introducing the word “not” denoted by prefixing the statement P. It has opposite truth value from the statement. It is denoted by
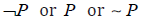
From this definition, it follows that the negation of a true statement is false while the negation of false statement is true; simply If P is true, then ¬P is false and if P is false, then ¬P true.
Example
1) Let P : “Kamana is a student”, then¬P : “Kamana is not a student”.
2)P: The earth is round, ¬P : The earth is not round.
Let P be a proposition. Construct the truth table of ¬P
Solution
APPLICATION ACTIVITY 2.3.1
1. Write the negation of each of the following statements:
a) Today is raining.
b) The sky is blue
c) My native country is Rwanda.
d) Bony is smart and healthy.
2. Complete the following truth table
2.3.2 Conjunction
ACTIVITY 2.3.2
Given two propositions which are true;
p: I am at school, q: it is raining, Discuss the truth value of the compound propositions:
a) “I am at school and it is raining”
b) “I am not at school and it is raining”,
c)“I am not at school and it is not raining”.
Content summary
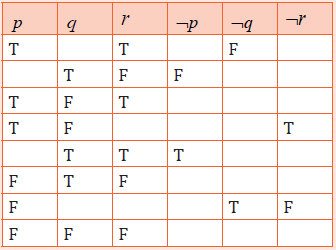
If two simple statements p and q are connected by the word “and”, then the resulting compound statement p and q is called a conjunction of p and q and is written in symbolic form p ∧ q . It has the truth value true whenever both p and q have the truth value true; otherwise it has the truth value false.
Examples
Let p be “It is raining today” and q be “there are fifteen chairs in this class room” assuming that p and q are true statements, construct simple sentences which describe each of the following statements and construct the truth table.
a) p ∧ q
Solution
a) From the given two simple statements, one of the resulting compound statements is
(i) “It is raining today and there are fifteen chairs in this class room” which is True.
(ii) “It is not raining and there are not fifteen chairs in this classroom: Which is False.
You can give the remaining two sentences and the truth table of related compound statements is as follows:
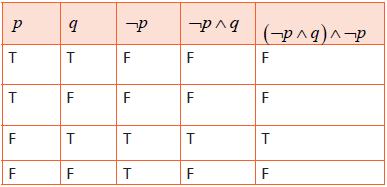
2) Let p and q be propositions. Construct the truth table for
a) ¬p ∧ q
b) (¬p ∧ q) ∧¬p
Solution
APPLICATION ACTIVITY 2.3.2
1) If p stands for the statement “ It is cold” and q stands for the statement
“ It is raining”, then what does ¬q ∧¬q stands for? Construct its truth table
2) Let p and q be two propositions. Construct the truth table of
a) p ∧ q
b) ¬p ∧ q
c) p ∧¬q
d) ¬( p ∧ q)
e) ¬q ∧(¬p ∧ q)
3) Determine the truth value of each of the following statements
1. Paris is in France and it is a Capital city
2. 4 + 4 = 9 and 5 + 8 =11
3. Paris is in England and 3+ 4 = 7
4. Kigali is the Capital city of Burundi and1+1 = 2
5. Alphabets are the basic of any languages and the digits is not the basic in counting
6. m2 is the unit of area and kg being one of the units of weight.
2.3.3 Disjunction
ACTIVITY 2.3.3
1)There were boys and girls in the classroom.
a) If they ask you to choose 2 boys and two girls. How many students will you choose?
b) If they ask you to select two girls or two boys how many students will you select?
2) Given the true proposition p: I am at home, q: it is raining. What is the truth value of
a) “I am at home or it is raining”.
b) “I am not at home or it is not raining”.
c) “I am at home or it is not raining”.
Content summary
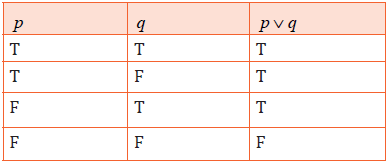
If two simple statements p and q are connected by the word “or”, then the resulting compound statement “p or q” is called a disjunction of p and q and it is written in symbolic form by p ∨ q .
It has the truth value false only when p and q have truth value false, otherwise it has true as a the truth value.
Examples
1) Let p be “Paris is in France” and q be “London is in England”. Construct simple verbal sentences which describe different related compound statements and construct the truth table. of p ∨ q .
Solution
From the given two simple statements, the resulting compound statement is
(i) “Paris is in France or London is in England” (True)
(ii) Paris is in France or London is not in England (Tue)
(iii) Paris is not in France or London is in England (True)
(iii) Paris is not in France or London is not in England (False).
The Truth table of related compound statement is as follows:
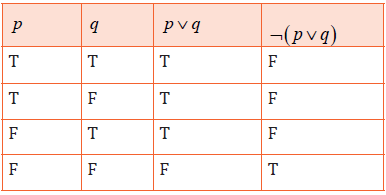
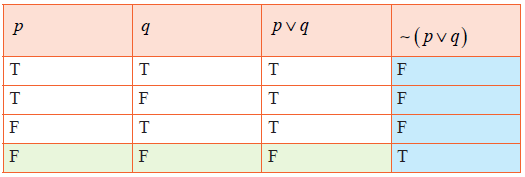
2) Construct the truth tables for any ¬( p ∨ q) and ¬p ∧¬q and compare them.
Solution:
First, we make a table that displays all the possible combinations of truth values for p and q ,
then we add two columns and put p ∨ q and ¬( p ∨ q) into its top cell and then start calculations.
Note: Ambiguity of “or” in English language
In natural language “or” has two meanings:
Inclusive or: where p ∨ q is true if either p or both are true.
Example: Numbers or measurements may be taken as prerequisites for geometry.
Meaning: take either one but you may also take both.
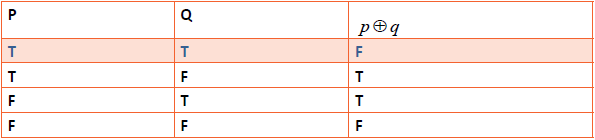
Exclusive or: denoted as ⊕: where p⊕q is true if either p or q but not both are true.
Example: “You will be paid money or a computer”.
Meaning: do not expect to get both. Bellow is the table for p⊕q
APPLICATION ACTIVITY 2.3.3
1.Translate each of the following compound statements into symbolic form
i) Bwenge reads News Paper or Mathematics book.
ii) Rwema is a student-teacher or not a book seller.
2. Suppose that p is a false statement, and q is a true statement.
a) What is the truth-value of the compound statement¬p ∨ q ?
b) What is the truth-value of the compound statement p ∨¬q ?
3. Let p and q be two propositions. Construct the truth table of
p ∨ q ; p ∨¬q ; ¬( p ∨ q) ∧(¬p ∨¬q) and (¬q ∨ p) ∧(¬p ∨ q)
2.3.4 Conditional statement
ACTIVITY 2.3.4
1) Given the following conditional statement: “If Samantha’s health is good, then she will go to the party”.
Discuss and identify the hypothesis (premise) and conclusion (consequent) of the conditional statement.
2) Complete these sentences referring to the conditional statement given in question one.
If Samantha’s health is not good, ...
Samantha will go to the party, ...
Samantha will not go to the party, ...
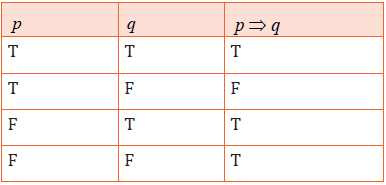
Content summary
A conditional statement is a logic statement used when the statement is in the
form “if ...then ....” It can be written as "If p then q" or p→q ,(or p⇒q ) read as pimplies q .
In this case the proposition p is called antecedent, hypothesis or premise while
the proposition q is the conclusion or the consequent. In language, p can be
called the first clause and q is the second clause.
The conditional p⇒q can also be read:
- If p, then q.
- q follows from p.
- q if p.
- p only if q.
- p is sufficient for q.
- q is necessary for p.
Let us consider the logical conditional as an obligation or contract, for example:
“If you get 100% on the final, then you will earn an A”
p: If you get 100% on the final, q: you will earn an A.
p⇒q
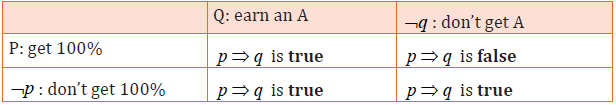
This shows that F ⇒T does not violate the obligation, the only time the obligation is broken is when T ⇒ F .
Therefore, the statement p⇒q has the truth value True in all cases except when p is true while q is false.
The related truth table is as follows:
Examples
1.Rephrase the sentence “If it is Sunday, you go to church”, then construct the related truth values.
Solution
Here are some various ways of rephrasing the sentence:
- “You go to church if it is Sunday.”
- “It is Sunday only if you go to church.”
- “It can’t be Sunday unless you go to church.”
Let denote the given statements as: p: It is Sunday, q: you go to church.
The statement If it is Sunday, you go to church is symbolized as follow: p⇒q .
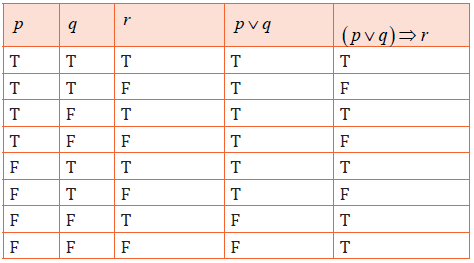
1. Construct the truth value of the following statement:
“If either John takes Calculus or Betty takes Sociology then Peter will take English.”
2. Let denote the statements as:
p: John takes Calculus, q: Betty takes Sociology and r: Peter takes English.
The given statement can be symbolized as follow: ( p ∨ q)⇒r
Use different related sentences and construct the truth table for ( p ∨ q)⇒r .
Solution
Converse, Contrapositive and Inverse of a conditional propositional
a) Converse
The implication obtained by interchanging the antecedent and the consequent
of an implication is called the converse.
Thus, the converse of P ⇒ Q is Q ⇒ P.
Example: If you are a student, then you should study. The converse is “if you study, then you are a student” this is not true.
b) Contra-positive
Given the conditional p⇒q , the implication ¬q⇒¬p is called the contrapositive of p⇒q .
Example:
If it is a PC, then it is a computer, the contrapositive is “if it is not a computer, then it is not a PC”. This is true.
c) Inverse
Given the conditional p⇒q , the implication ¬p⇒¬q is called its inverse. It is
obtained by negating the antecedent and negating the consequence.
Example:
If it is a PC, then it is a computer; the inverse is “If it is not a PC, then it is not a computer”. This is false.
Note:
i. A conditional statement is logically equivalent to its contrapositive. A
conditional statement can be replaced with its contrapositive and keeps its truth value.
ii. Converse: p⇒q does not necessary imply q⇒ p .
iii. Inverse: p⇒q does not imply

APPLICATION ACTIVITY 2.3.4
1) Using the statements p :Mico is fat and p :Mico is happy
Assuming that “not fat” is thin, write the following statements in symbolic form
a) If Mico is fat then she is happy.
b) Mico is unhappy implies that Mico is thin
2) Write the following statements in symbolic form and their truth values
a) If n is prime, then n is odd or n is 2.
b) If x is nonnegative, then x is positive or x is 0.
c) If Tom is Ann’s father, then Jim is her uncle and Sue is her aunt.
3) Consider the conditional proposition: “If a number is a multiple of
10, then the number is a multiple of 5”.
(a) What is the truth value of that proposition?
(b) Deduce the converse of the proposition and the related truth value.
(d) Deduce the contrapositive of the proposition and the related truth value.
(f) Write its inverse and the related truth value.
4) Write the converse, inverse and contrapositive of the false conditional statement below and determine whether each of the
statements found is true or false.
“If x is an even number, then the last digit of x is 2.
2.3.5 Bi-conditional statements
ACTIVITY 2.3.5
1. Let p be the statement: “Anne Maria is intelligent” and q be the statement: “Anne Maria is hard working”
a. Express p⇒q and its truth value.
b. Express q⇒ p and its truth value
c. Give the truth value of ( p⇒q) ∧(q⇒ p) .
2. Let r be the statement: “ 7 = 7 ” and s be the statement: “5 = 3”
a. Give the truth value of r ⇒ s
b. Give the truth value of s⇒r
c. Give the truth value of (r ⇒ s) ∧(s⇒r ).
Content summary
Let us consider the proposition p: Two lines are perpendicular, q: Two lines form a right angle.
We have: p⇒q : If two lines are perpendicular, then the two lines form a right angle.(True)
The converse is q⇒ p means: if two lines form a right angle, then the two lines are perpendicular. (True).
We see that a statement and its converse are both true statements; that is p⇒q and q⇒ p are both true.
Generally p⇒q is not the same as q⇒ p . It may happen, however, that both
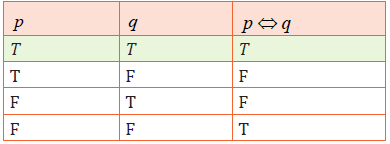
p⇒q and q⇒ p are true. The statement p⇔q is defined to be the statement ( p⇒q) ∧(q⇒ p) .
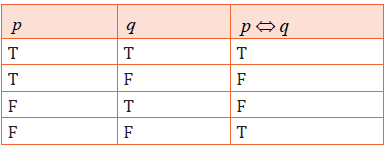
For this reason, the double headed arrow p⇔q is called the bi-conditional.
The bi-conditional p⇔q , which we read “p if and only if q” or “p is equivalent
to q” is true if both p and q have the same truth values and false if p and q have opposite truth values.
Examples
Let denote the statements as:
p : The number is divisible by 3
q : The sum of the digits forming the number is divisible by 3.
The compound statement “The number is divisible by 3 if and only if the sum of
the digits forming the number is divisible by three”;
This means that If the sum of the digits forming the number is divisible by 3,
then the number is divisible by 3 and if the number is divisible by 3, then the
sum of the digits forming the number is divisible by 3.
Symbolically p⇔qmeans ( p⇒q) ∧(q⇒ p) .
3) Given the statements: p: Two lines are perpendicular and q: Two lines form a right angle.
Formulate 4 different compound statements and their truth values and deduce the truth table of p⇔q .
Solution
One of these compound statements is: “If two lines are perpendicular, then the two lines form a right angle”.
Make others and you will see the following table.
Equivalent statements
Let us compare the truth values of ¬( p ∨ q) and ¬p ∧¬q .
a) Considering the truth values of ¬p ∧¬q , we can determine the case in which this statement ¬p ∧¬q is true.
The first two columns of the truth table give all possible combinations of the truth values of p and q , and the second two columns of the truth table are merely negations of the first two columns. The statement ¬p ∧¬q is the conjunction of two statements ¬p and ¬q . Therefore, the only case in which ¬p ∧¬q is true is when both A and b are false.
b) The truth values of ¬( p ∨ q) can be summarized in the truth table:
Like the previous question, the truth table consists of four rows.
The third column of the truth table gives the truth values for the disjunction p ∨ q .
The fourth column gives the truth values for the negation of disjunction. Therefore,
¬( p ∨ q) is true only when both p and q are false.
Comparing the truth values of ¬( p ∨ q) and¬p ∧¬q in the last columns of the
two tables, we find that their truth values are identical.
Whenever two statements have the same truth values, the statements are said to be logically equivalent.
The symbol of equivalent statements is ≡ . Thus we can write ¬( p ∨ q) ≡ ¬p ∧¬q .
In spoken language, the equivalence of two propositions means they are similar,
when you express one you have the same idea with he who expressed the other.
Example:
Use a truth table to show that the conditional p⇒q and its contrapositive ¬q⇒¬p are logically equivalent.
Solution
Let us construct the truth table containing both p⇒q and its contrapositive ¬q⇒¬p .
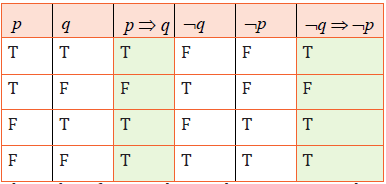
The order of ¬q and ¬p when organizing the columns of the table must be respected.
It is clear that p⇒q and ¬q⇒¬p have the same truth values in the third and the sixth columns.
Note: Two propositions differ if you can find at least one row of the truth table where values differ.
APPLICATION ACTIVITY 2.3.5
1) Suppose that r is a false statement, and s is a true statement.
a) What is the truth-value of the compound statement (¬r )⇔ s ?
b) What is the truth-value of the compound statement r ⇔(¬s) ?
c) What is the truth-value of the compound statement r ⇔ s ?
d) What is the truth-value of the compound statement¬(r ⇔(¬s)) ?
2) Construct the truth table for
a) p↔q and ( p→q) ∧(q→ p) b) p↔q and (¬p ∨ q) ∧(¬q ∨ p)
c) ¬( p↔q) and ( p ∨ q) ∧¬( p ∧ q)
d)¬( p↔q) and ( p ∧¬q)∨ (¬p ∧ q)
3) Show that neither the converse nor the inverse of an implication are equivalent to the implication.
4) Formulate a conditional statement made by two compound statements p and q.
Use that statement to express different forms of ¬p ∨ q and p⇒q and show that ¬p ∨ q and p⇒q are equivalent.
Relate to the daily life situation
2.4 Tautology and contradiction
ACTIVITY 2.4
Let p and q be two propositions. Construct the truth table of
1) p ∨¬p 2) p ∧(¬p)
3) ¬p ∧( p ∧ q) 4)¬( p ∧ q)∨ ( p ∨ q)
Do you find a column in which the truth value is always true or always false?
Content summary
A tautology is a compound statement that is always true regardless of the truth values of the individual statements substituted for its statement variables.
Example
- The statement “The main idea behind data compression is to compress data” is a tautology since it repeats the same and it is always true.
- The statement “I will either get paid or not get paid” is a tautology since it is always true
If you are given a statement and want to determine if it is a tautology, then all you need to do is construct a truth table for the statement and look at the truth values in the final column.
If all of the values are T (for true), then the statement is a tautology.
The statement “I will either get paid or not get paid” is a tautology since it is always true. We can use p to represent the statement “I will get paid” and not p (written ¬p) to represent “I will not get paid.”
p : I will get paid
¬p : I will not get paid
So, p ∨ (¬p) : I will either get paid or not get paid
A truth table for the statement would look like:
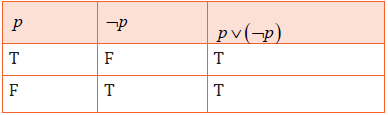
Looking at the final column in the truth table, one can see that all the truth values are T (for true).
Whenever all of the truth values in the final column are true, the statement is a tautology.
So, our statement ‘I will either get paid or not get paid’ is always a true statement, a tautology.
A contradiction is a compound statement that is always false regardless of the
truth values of the individual statements substituted for its statement variables.
Example
1) The statement “I don’t believe in reincarnation, but I did in my past life”, is always false.
2) The statement p ∧(¬p) is always false, because p and ¬p cannot both be true.
APPLICATION ACTIVITY 2.4
1) From the following compound statements, indicate which is tautology, contradiction or neither
a) p ∧¬( p ∧ q) b)¬q ∧(q ∧ r )
c) ( p ∧ q) ∧¬( p ∨ q) d) ( p ∨ r )∨¬r
2) In your own words, formulate 2 propositional statements expressing the tautology and 2 propositional statements expressing the contradiction. and show where these tautology or contradiction can be avoid in every day practice of argumentation.
2.5 Quantifiers
2.5.1 Universal quantifier
ACTIVITY 2.5.1
1) Let A = {1,2,3,4,5}. Determine the truth value of each of the following
statements:
a) For all x∈ A, x + 3 < 9
b) For all x∈ A, x + 3 ≤ 7
2) Determine the truth value of the following statement where U = {1,2,3}is the universal set:
There exist x∈U such that x + 3 ≤ 5
3) What is the truth value of p, q if p: “All men eat banana”, q: All men are mortal.
Content summary
Let p(x) be a propositional function defined on a set A. Consider the expression
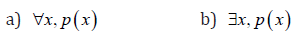
(∀x∈ A) p(x) or ∀x p(x)which is read by “For every x in A , p(x) is a true statement” or, simply, “For all x , p(x) .”
The symbol universal quantifier “For all” symbolized by ∀ is read by “for all” or “for every” is called the universal quantifier.
The statement (∀x∈ A) p(x) means that the truth set of p(x) is the entire set A .
Example:
All men are mortal. This is true if for every man, dying is applicable.
The expression p(x) by itself is an open sentence or condition and therefore has no truth value.
However, (∀x∈ p(x) , that is p(x) proceeded by the quantifier ∀ , does have a truth value which follows from the equivalence.
Specifically:
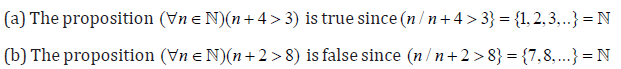
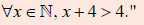
1 Q : if {x / x∈ A, p(x)} = Athen ∀x p(x) is True; otherwise ∀x p(x) is False.
Example
APPLICATION ACTIVITY 2.5.1
1. Given the statement p: “for every real number x , x + y >10."discuss the values of y which make p true.
2. Give the truth value for the following statements:
a) Some rectangles are squares
b) All squares are rectangles
c) Every language student-teacher must take a logic mathematics course.
d)
2.5.2 Existence quantifier
ACTIVITY 2.5.2
1) Let A = {1,2,3,4,5}. Determine the truth value of each of the following
statements:
a)There exist x∈ A, x + 3 =10
b) For some x∈ A, x + 3 < 5
2) Let A = {1, 2,3,...,8,9,10}. Consider each of the following sentences;
determine the set of y for which the following statement is true. Such set is called a truth set.
(a) (∀x∈ A)(∃y∈ A)(x + y <14)
(b) (∃y∈ A)(x + y <14) .
Content summary
Let p(x) be a propositional function defined on a set A . Consider the expression: there exist some x∈ A that satisfy p(x) .
This can be written as (∃x∈ A) p(x) or ∃x, p(x) or “There exists an x in A such that p(x) is a true
statement” or, simply, “For some x , p(x) .” The quantifier “there exist” or “for some” or “for at least one” symbolized by ∃ is an existential quantifier. The statement (∃x) p(x) is read as “there exists an x such that p (x) is true”.
Specifically:
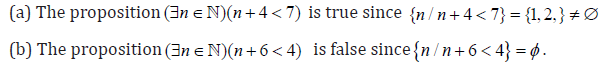
Q : if {x / p(x)} ≠ 0 then ∃x p(x) is True; otherwise ∃x p(x) is False.
Example
c) Some men do not have wives, is true since some men such as Priests remain single.
d) There exist natural number between 3 and 6. This is statement is true because {4,5} exists.
e) Some student teachers teach at university. This is false because the set of such students is empty.
APPLICATION ACTIVITY 2.5.2
1. Translate the following into symbolic form:
a) Somebody cried out for help and called the police.
b) Nobody can ignore her.
2. Consider the predicates: r ( x) : x − 7 = 2 and s ( x) : x > 9 . If the universe of discourse is the real numbers,
give the truth value of propositions: (∃x) s ( x) ∧¬(∀x)r ( x)
3. Formulate different statements with existential quantifiers and give their truth values.
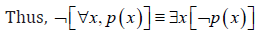
2.5.3 Negation of quantifiers
ACTIVITY 2.5.3
Negate the following statements
1. All grapefruits have red colour.
2. Some celebrities are beautiful.
3. No one weighs more than five hundred Kilograms.
4. Some people are more than 2m tall.
5. All snakes are poisonous.
6. Some mammals can stay under water for two days without surfacing for air.
7. All birds can fly.
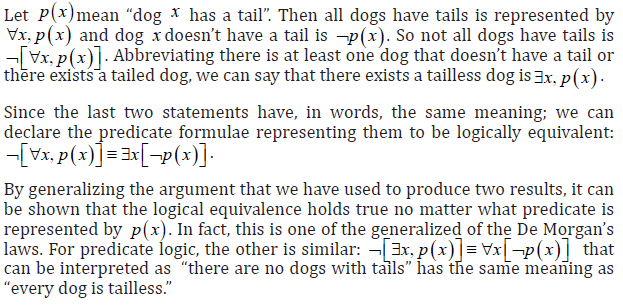
Consider the statement: “All dogs have tails”. Its negation is “Not all dogs have tails” which means that:
“There is at least one dog that does not have a tail.”
Let us express these ideas symbolically:
Examples
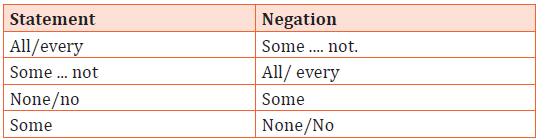
1. In statements that involve the words “all, every, some, none or no”, forming the negation is not as easy.
The following table shows examples
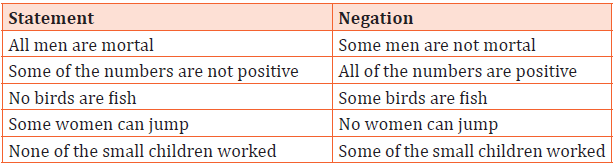
This shows that:
“Negating a universally quantified statement changes it into an existentially quantified statement and vice-versa with the
part of the statement after the quantifier becoming negated.
2. Let p (x)mean “country x has a president.” Interpret the following statements.
Establish the equivalence of their negation.
Solution
a) Since p(x)mean “country x has a president, thus ∀x, p ( x) means “all countries have president”
The negation is ,
 that is interpreted as “it is not true that all counties have presidents.”
This sentence can be express as “there exist a country without a president” and symbolically it is written as

b) ∃x, p ( x) means “there is a country with a president.”
Negating the given statements, we get

This sentence is equivalent to” all countries have not a president” symbolically

These laws can be summarized as follow:
“Negating a universally quantified formula changes it into an existentially
quantified formula and vice-versa with the part of the formula after the quantifier becoming negated.”
The basic forms for negative statements that involve “all, every, some, none or no” can be summarized as follows:
APPLICATION ACTIVITY 2.5.3
Negate each of the following statements and write the answer in symbolic form:
1. Some students are mathematics majors.
2. Every real number is positive, negative or zero.
3. Every good boy does fine.
4. There is a broken desk in our classroom.
5. Lockers must be turned in by the last day of class.
6. Haste makes waste.
2.6 Applications of logic in real life
ACTIVITY 2.6
It is known that you must have the correct form and true premises to
reason deductively toward a true conclusion.
The following are examples of arguments that need true conclusions.
Try to conclude:
a) If you live in Nyarugenge, then you live in Kigali.
If you live in Kigali, then you live in Rwanda.
Therefore, ...
b) If a triangle is isosceles, then it has two equal sides.
If a triangle has two equal sides, then it has two equal angles.
Therefore, ...
c) If you study the whole student book, then you will pass the exam.
You study the whole student book.
Therefore, ...
Content summary
“A syllogism is form of argumentation in the deductive way that consists of two statements or premises, and a logical conclusion drawn from them. These premises are usually articles of faith, laws, rules, definitions, assumptions, or commonly accepted facts.” In the following paragraphs, we discuss three types of syllogisms: hypothetical syllogism, affirming the antecedent, and denying the consequent.
2.6.1 Hypothetical Syllogism
If A, B, and C represent statements, a hypothetical syllogism is constructed from the statements, the first two lines being the premises and the third being the conclusion. The hypothetical syllogism can be written in three different ways:
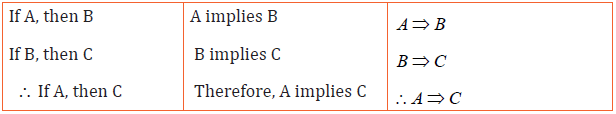
∴ Means therefore
In the hypothetical syllogism, the argument is correct even when one or both of the premises are false.
The truth or falsehood of the premises does not affect the logic of the argument.
Logic deals with the relationship between premises and conclusion, not the truth of the premises.
To say that a deductive argument is correct means that the premises are related to the conclusion in such a way that, if the premises are true, the conclusion must be true. A conclusion cannot be false if the logical form is correct and the premises are true.
Example
a) If you live in Rwamagana, then you live in Eastern province.
If you live in Eastern province, you live in Rwanda.
Therefore, if you live in Rwamagana, then you live in Rwanda.
Solution: It is the hypothetical syllogism.
b) Is the following argument a hypothetical syllogism? Why or why not?
If you have a party, you should invite your friends.
If you are graduating from college, you should invite your friends.
Therefore, if you are having a party, you are graduating from college.
Solution:
The argument is not a hypothetical syllogism. The premises do not link properly. The conclusion
of the first premise should be the hypothesis of the second premise, and no logical
rearrangement can accomplish the proper linking of the statements.
a) Even though the conclusion of this argument is true, explain why the following argument is a poor one.
If you are over 18 years old, then you can read.
If you can read, you can vote.
Therefore, if you are over 18 years old, then you can vote.
Solution
The argument has the form of hypothetical syllogism, so it is a correct argument.
However, it is a poor argument, since neither of the premises is true, the argument does not actually prove its conclusion.
2.6.2 Affirming the Antecedent
If A and B represent statements, an argument that affirms the antecedent has the following form.
Major premise: A⇒ B
Minor premise: A
Conclusion: ∴B
The major premise is a conditional statement A⇒ B . The minor premise states
that the hypothesis of the major premise is true or has occurred.
This is called affirming the antecedent.
Example
If I study for 6 hours, I will pass the exam.
I studied for 6 hours.
Therefore, I will pass the exam.
Solution:
This classical argument is another example of affirming the antecedent.
All men are mortal.
Makuza is a man.
Therefore, Makuza is mortal.
This can be written so that the correct form is apparent.
If one is a man, then one is mortal.
Makuza is a man.
Therefore, Makuza is mortal.
If an argument has the correct form, it is a logical argument.
However, if it is to be a convincing argument with a true conclusion, its premises must also be true.
You can affirm the antecedent to reason deductively if the argument has the correct form and true premises.
Example
Is the following argument a good one? Explain.
If you want to run a marathon, then you should train for the race.
Mukamurenzi wants to run a marathon.
Therefore, Mukamurenzi should train for the race.
Solution:
The argument has the correct form for affirming the antecedent. If we take its first premise as true because of commonly accepted notions about the physical stamina needed to run a marathon, the argument is a good one.
Even though the argument has the correct form of an argument using the technique of affirming the antecedent, the major premise is not true. Thus, it is a correct argument but it does not arrive at a true conclusion.
You need both the correct form and true premises to ensure true conclusions.
2.6.3 Denying the Consequent
If A and B represent statements, an argument that denies the consequent has
the following form:
Major premise: A⇒ B
Minor premise: ~A
Conclusion: ∴~ A
Examples
1. If Edna is at the school, then she has notebooks.
Edna does not have notebooks.
Therefore, Edna is not at the school.
2. If you pay the bill on time, then you are not charged a penalty
You are charged a penalty.
Therefore, you did not pay the bill on time.
The major premise is a conditional statement. The minor premise is a denial (negation) of the consequent (conclusion) of the conditional statement.
For this reason, this argument is called denying the consequent.
This form of argument is based on the contra -positive principle in which the statement A⇒ B is logically equivalent to ~ B⇒~ A . We can see that this form of argument is correct by observing that it is really an application of affirming the antecedent.
Major premise: A⇒ B is equivalent to ~ B⇒~ AMinor premise: ~ B is
equivalent to ~ B
Conclusion: ~A is equivalent to ~ A
Example
Is the following argument a good one? Explain.
If a number is not positive, then the number is negative.
Zero is not negative.
Therefore, zero is positive.
Solution:
The argument has the form of an argument using denying the con-sequent, so it is a correct argument.
However, its first premise is not true, since if a number is not positive, it could be either negative or zero.
Thus, the argument is faulty.
We can also make correct arguments from premises that do not at first glance
seem to be one of our standard logical forms, as in the next example.
Example
Construct a logically correct argument from the following premises:
If P, then ~ Q .
If ~ R , then Q.
If R, then ~ S .
Solution:
To have the correct form of the hypothetical syllogism, the conclusion of one statement must be the hypothesis of the next statement. Since we know that if a statement is true, its contrapositive is true, we can use that principle on the second premise, that is, “If ~R , then Q” implies “If ~ Q , then R.”
If P, then ~ Q .
If ~ R , then Q.
If R, then ~ S .
This can be reformulated in the following way:
If P, then ~ Q .
If ~ Q , then R.
If R, then ~ S
∴ if P then ~ S
Thus, the conclusion of this argument is: if P then ~ S
Even though you may use the contrapositive statement in a logical argument, do not use the inverse or converse.
APPLICATION ACTIVITY 2.6
1. What is wrong with the following argument?
All good chess players wear glasses.
Sylvia is a good chess player.
Therefore, Sylvia wears glasses.
2. Determine whether or not the following arguments are correct. For those are not correct,
(a) Explain what is wrong with the argument;
(b) Change the minor premise and make a correct argument.
i. When it is midnight, I am asleep.
I was asleep.
Therefore, it was midnight.
ii. All Rhode Island Red hens lay brown eggs.
My hen, Motopa, is a Rhode Island Red.
Therefore, Motopa lays brown eggs
iii. If ABCD is a square, it has four sides.
If it has four sides, then it is a quadrilateral.
Therefore, if ABCD is a square, it is a quadrilateral.
iv) If a triangle is equilateral, then it has three equal sides.
ABC does not have three equal sides.
Therefore, ABC is not equilateral.
2.7 END UNIT ASSESSMENT
1. Which of the following sentences are propositions?
a) Pretoria is the capital of South Africa
b) Is this concept important?
c) Wow, what a day!
2. Find the negation of the proposition “Today is Monday”
3. Find the conjunction of the propositions p and q, where p is the
proposition “Today is Sunday” and q is the proposition “The moon is made of cheese”.
4. Find the disjunction of the propositions p and q, where p is the proposition “Today is Sunday” and q:
“The moon is made of cheese”.
5. How many rows, not counting the top one, are needed to construct the truth table for a compound
statement made from n statements?
6. Show that
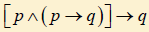 is a tautology.
7. Find the truth value of the bi-conditional “The moon is made of cheese if and only if 1=2”.
8. Construct the truth table for the proposition (¬p→q) ∧ r
9. In the question below are given three statements, followed by conclusions: I, II, III, IV. You have to take the given statements
to be true even if they seem to be at variance from commonly known facts. Read the conclusions and then decide which of the
given conclusions logically follows from the given statements disregarding commonly known facts.
Statements: Some Cats are Rats. All bats are tables. All Rats are Bats.
Conclusion:
I. Some Cats are bats II. All bats are rats
III. All tables are cats IV. All bats are cats
1. Only I & II follow 2. Only II follows
3. Only I & IV follow 4. None of these
UNIT 3: POINTS, LINES AND GEOMETRIC SHAPES IN 2D
Key Unit competence: To be able to determine algebraic representations of lines and calculate the area of
geometric shapes in 2D.
3.0 INTRODUCTORY ACTIVITY 3
RUKUNDO uses a number line to graph the points -4, -2, 3, and 4. Her classmate ISIMBI, notices that -4 is closer to zero than -2 as shown in the figure below. She told him that he is mistaken. Rukundo replied that his is not sure about his diagram because he did not have time to repeat his course yesterday evening.

a) Use what you know about a vertical number line to determine if RUKUNDO made a mistake or not.
Support your explanation with a number line diagram
b) What is number line
c) What is Cartesian plane?
3.1. Cartesian coordinates of a point
ACTIVITY 3.1
Consider the points A(1, 2), B(5, 4)
1. Represents these points in xy plane
2. Draw a line segment from A to B
Content summary
A point is represented by Cartesian coordinates (also called rectangular coordinates).
In two dimensions, Cartesian coordinates are a pair of numbers that specify signed distances from the coordinate axes.
They are specified in terms of the x coordinates and the y coordinates. The origin is the intersection of the two axes.
The position of a point on the Cartesian plane is represented by a pair of numbers.
The pair is called an ordered pair or coordinates (x, y). The first number, x,
called the x-coordinate and the second number, y, is called the y-coordinate.
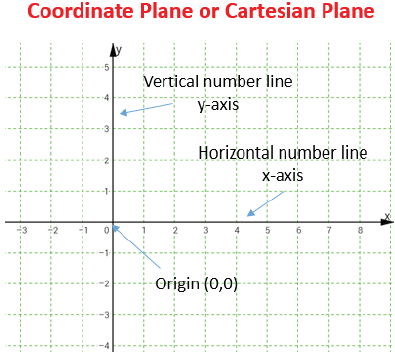
The origin is indicated by the ordered pair or coordinates (0, 0).
To get to the point (x, y) in cartesian plane, we start from the origin. If x is positive then we move x units right from the origin otherwise if x is negative then we move x units left from the origin. Then, if y is positive, we move y units up otherwise if y is negative, we move y units down
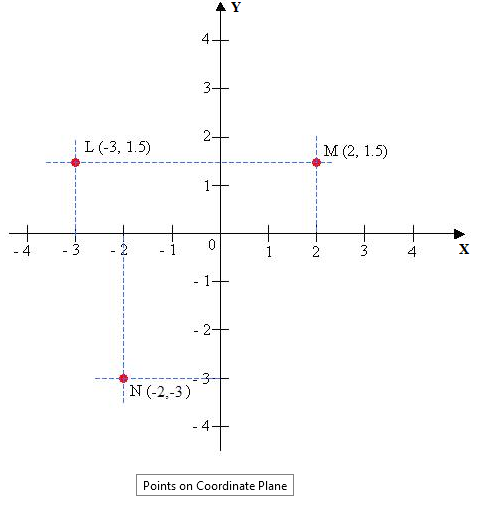
Example:
Represent the points M (2,1.5) , L(−3,1.5) and N (−2,−3) in Cartesian plane.
Solution
- Point M has coordinates M (2,1.5). To get to point M, we move 2 units to the right of x-axis from the origin (positive side) and 1.5 units up on y-axis from the origin (positive side).
- Point L is represented by the coordinates L(−3,1.5) . To get to point L, we move 3 units to the left of x-axis from the origin (negative side ) and 1.5 units up on y-axis from the origin (positive side)
- Point N has coordinates N (−2,−3). To get to point N, we move 2 units to the left of x-axis from the origin of(negative) and 3 units down on y-axis from the origin (negative side).
APPLICATION ACTIVITY 3.1
Represent the points A(−3,2) , B(4, 2) , C(−3,−2) , D(3,−1) in xyplane
3.2. Distances between two points
ACTIVITY 3.2
Kalisa and Mugisha live in the same Sector but at
two different hills. If Kalisa’s house is located at A(1,2) from the Sector and Mugisha’s house is at A(4,6) .
a) If the office of the sector is considered as the origin, present this situation on Cartesian plan.
b) Use the ruler to calculate the distance between Kalisa’s house and Mugisha’s.
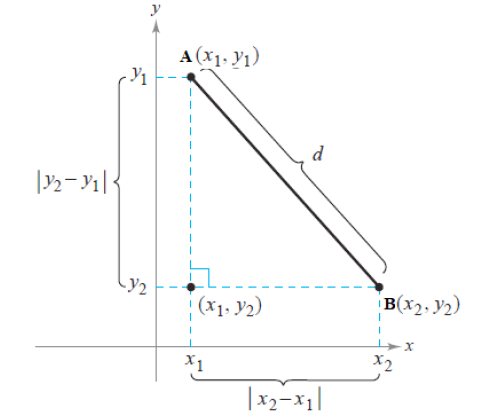
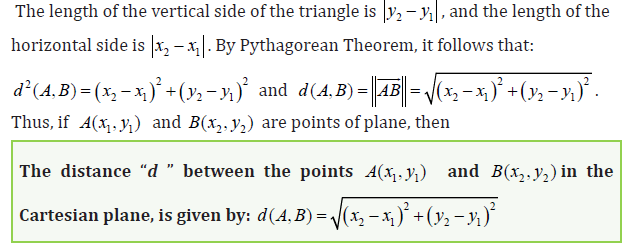
Content summary
Recall from the Pythagorean Theorem that, in a right triangle, the hypotenuse c and sides a and b are related by a2 + b2 = c2 . Conversely, if a2 + b2 = c2 the triangle is a right (see figure below).
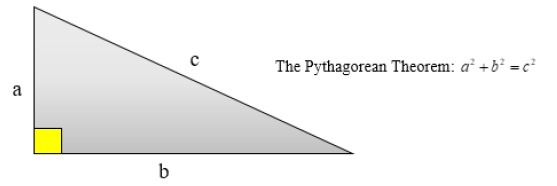
If the two points do not lie on a horizontal or on a vertical line, they can be used
to form a right triangle, as shown in in the figure below.
Examples:
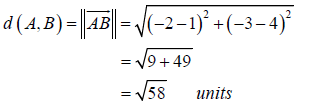
1) Consider the points A(1,4), B(−2,−3) in Cartesian plane. Find the distance between the point A and B.
Solution
The distance is
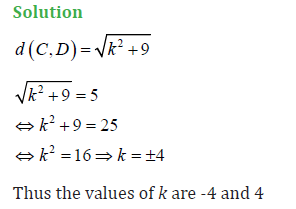
2) Consider the points C(k,−2) and D(0,1) in cartesian plane. Find the distance between the point A and B.
APPLICATION ACTIVITY 3.2
1. Calculate the distance between the points given below:
a) S(−2;−5) and Q(7;−2)
b) A(2;7) and B(−3;5)
c) A(x;y) and B(x+4;y−1)
2. The length of CD = 5. Find the missing coordinate if:
a) C(6;−2) and D(x;2).
b) C(4;y) and D(1;−1).
3.3. Midpoint of a line segment
ACTIVITY 3.3
Three friends: Pascal, Steve, and Benjamin live on the same side of a street from Nyabugogo to Ruyenzi.
Steve’s house is halfway between Pascal’s and Benjamin’s houses. If the locations of Pascal can be given by the coordinates (2,5) , Benjamin’s house at (4,7);
a) Draw a Cartesian plan and locate Pascal’s and Benjamin’s houses
b) Show the line segment joining the locations of Pascal’s and Benjamin’s houses;
c) Given that Steve’s house is in the half way, locate his house, estimate the coordinate of that location
and explain how to find it.
Content summary
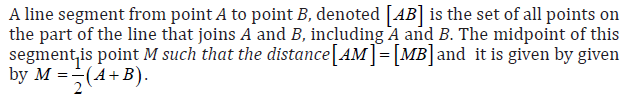
The midpoint of a segment is a point on that line segment which maintains the same distance from both
of the endpoints of that line segment.
For example, consider segment to the left.
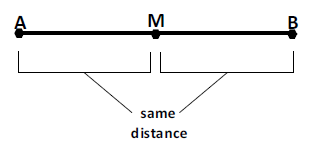
It has endpoints named A and B. The midpoint of the segment is labeled M.
It is at the same distance from each of the endpoints.

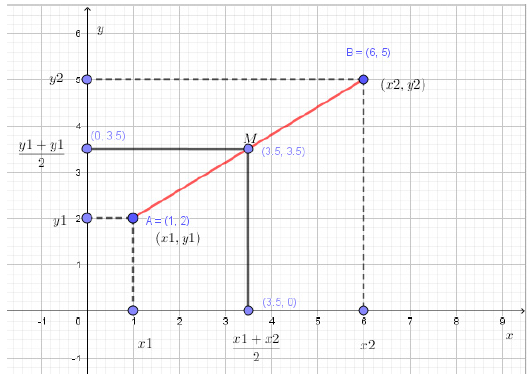
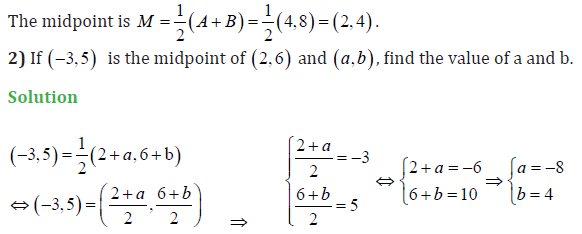
The coordinates of the midpoint, are obtained using the midpoint formula, such that:

Example:
1) Find the midpoint of the segment joining points A(3,0) and B(1,8) .
Solution
APPLICATION ACTIVITY 3.3
Micheal and Sarah live in different cities and one day they decided to meet up for lunch.
Because they both wanted to travel as little as possible they decided to meet at a point halfway between their homes.
If their positions are given by (3100,500) and (5120,125).
Which of the following coordinates represents the place where they
should meet?
a) (4110,312.5)
b) (4110,375)
c) (2020,375)
d) (8220,625)
3.4. Vector in 2D and dot product
3.4.1. Vectors in 2D
ACTIVITY 3.4.1
In xy plane:
1. Represent the points A(1,2) and B(−3,1)
2. Draw arrow from point A to point B

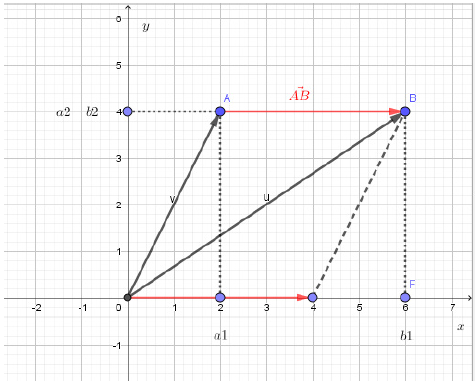
Content summary
Definitions and operations on vectors
A vector is a directed line segment; it is a quantity that has both magnitude and direction.
A vector is represented by an arrow.
The length of the arrow represents the magnitude of the vector, and the arrowhead indicates the direction of the vector.
That is to say, a vector has a given length and a given direction.

Components of a vector
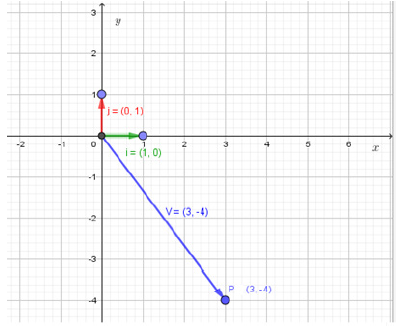
We now present an alternative representation of a vector in the plane that is common in the physical sciences. Let i →
denote the unit vector whose direction is along the positive x-axis;
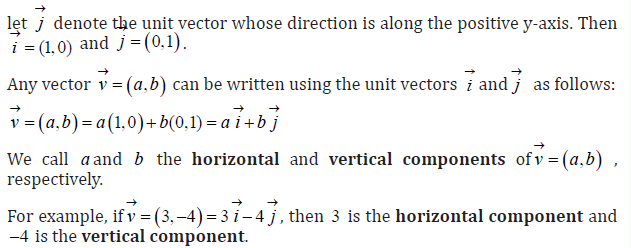
APPLICATION ACTIVITY 3.4.1
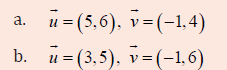
1) In xy plane, present the following vectors:
2) Plot a vector with initial point P(1,1) and terminal point Q(8,5) in the Cartesian plane and illustrate its position vector.
3.4.2 Dot product
ACTIVITY 3.4.2
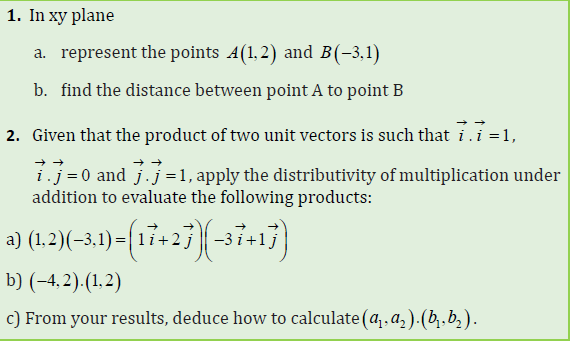
Content summary
Scalar product and properties
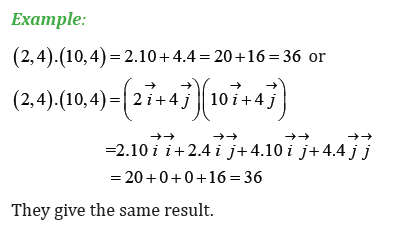
The scalar product or dot product (or sometimes inner product) is an algebraic operation that takes two coordinate vectors and returns a single number.
Algebraically, it is the sum of the products of the corresponding coordinates of the two vectors.

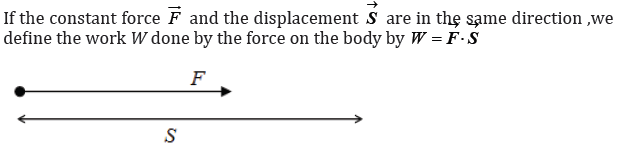
We can illustrate this scalar product in terms of work done by a force on the body:
Suppose that a person is holding a heavy weight at rest. This person may say and feel he is doing hard work but in fact none is being done on the weight in the scientific sense. Work is done when a force moves its point of application along the direction of its line of action. A force F can act on a body and move it to a displacement→S .
Properties of scalar product
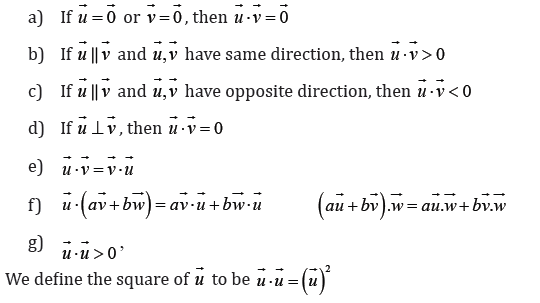
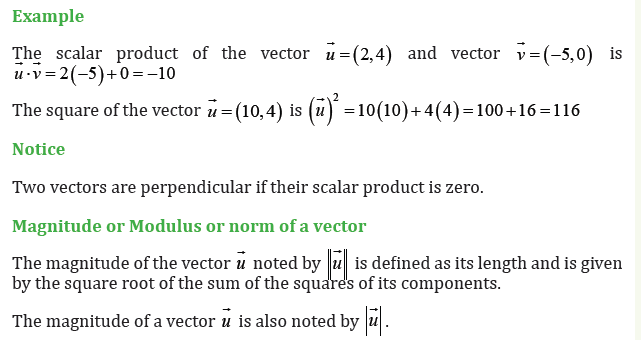
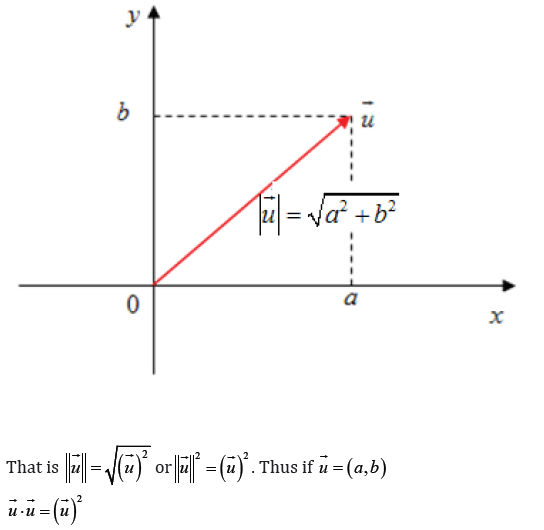
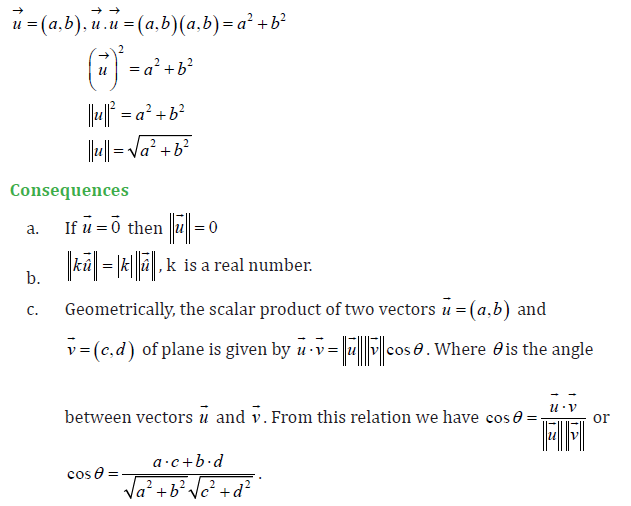
APPLICATION ACTIVITY 3.4.2
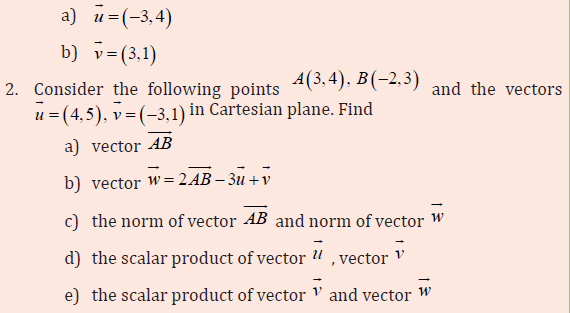
1. Find the norm(magnitude) of the following vectors:
3.5. Equation of a straight line
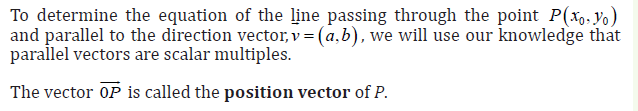
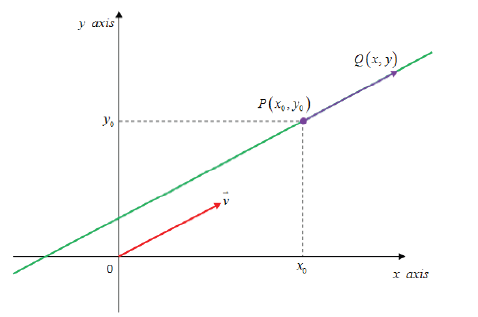
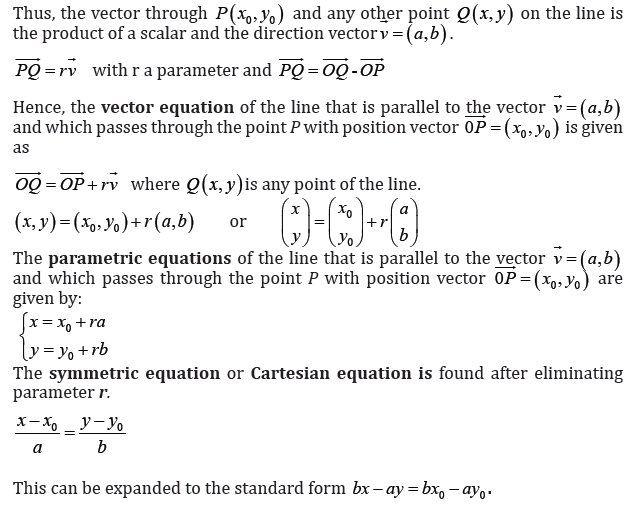
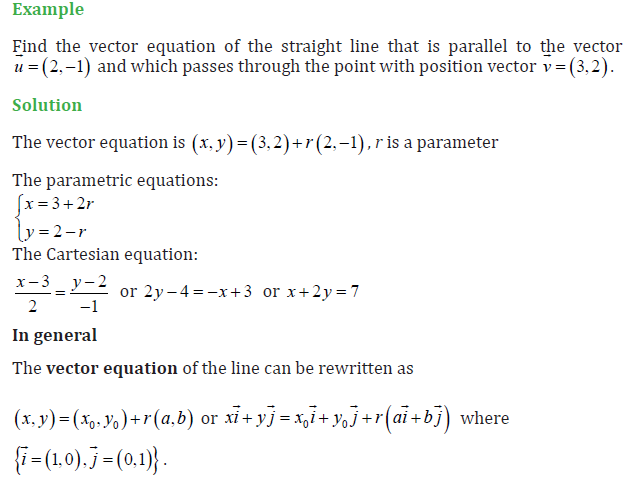
3.5.1. Equation of a straight line passing through a point and parallel to a direction vector
ACTIVITY 3.5.1
APPLICATION ACTIVITY 3.5.1.
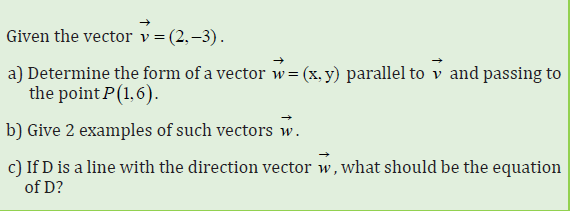
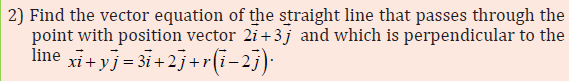
1. Find the vector, parametric and Cartesian equation of the line passing through the point with position vector (2,−3)
and parallel to the line (x, y) = (3,5) + r (1,6)
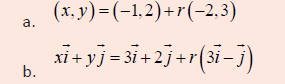
2. Find the Cartesian equations of the lines whose vector equations are given below.
Give your answers in the form y = mx + c
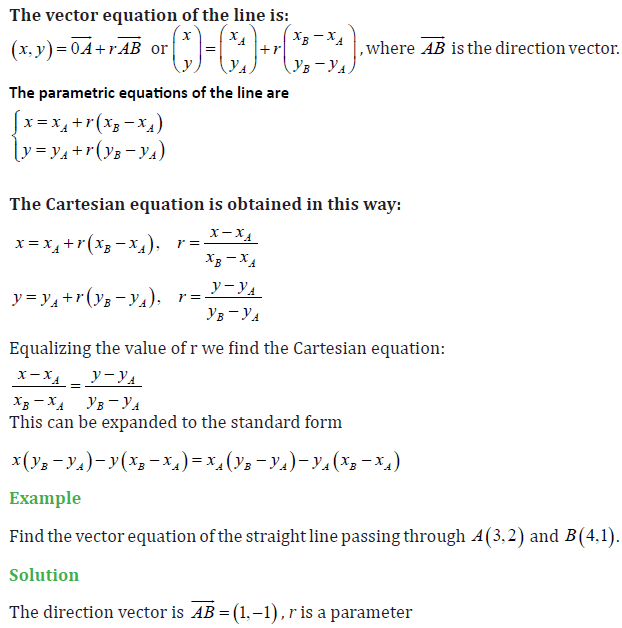
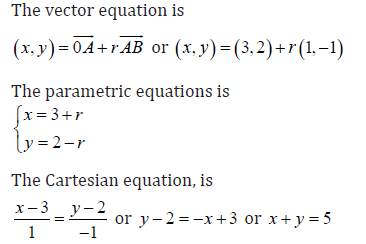
3.5.2 Equation of a straight line given 2 points
ACTIVITY 3.5.2
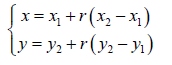
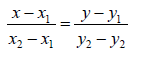
Content summary
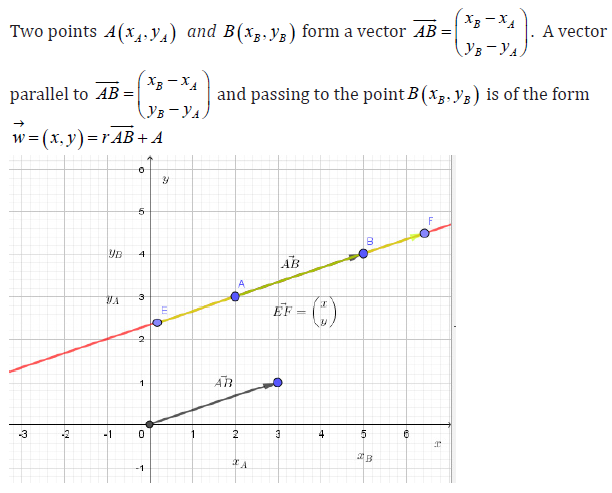
Therefore,
APPLICATION ACTIVITY 3.5.2
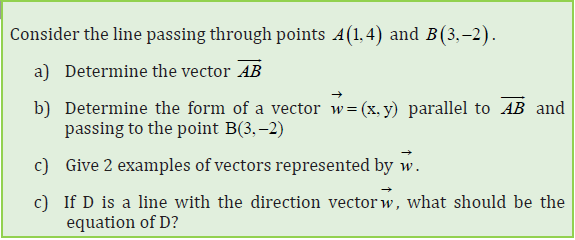
1) Determine the equation of a straight line passing through P(2, 4) and B(3,−2) .
3.5.3 Equation of a straight line given its gradient
LEARNING ACTIVITY 3.5.3
Determine the slope and the -intercept in the equations below. Hence draw the lines in the same graph.
Consider a line having gradient and passing through the point P1 ( X1,Y1) .
Suppose that the point P(x, y) is an other point on the line.
Then the gradient of the line is the rate at which the line rises (or falls) vertically for every unit across to the right.
It is defined by the change in to the change in .
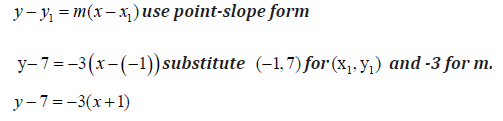
Thus, the equation of the line in point-slope form is defined by
From the equation above, if we take any other point P2 (X2,Y2 ) that lies on this line, then:
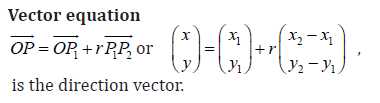
Parametric equations
Cartesian equation
Example :
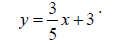
Write the equation of the line that has slope that passes through the
Solution
Note:
The genaral equation of the line is Ax + By +C = 0, where A, B,C are constantes,
And, A ≠ 0, B ≠ 0 .
- If A = 0 the line is horizontal.
- If B = 0 the line is vertical.
- If C = 0 the line passes through the origin.

- • If the two lines are parallel, then their slopes/gradients are equal.
Therefore m1 = m2
Thus, the equations Ax + By +C = 0 and Ax + By + D = 0 are parallel.
- If two lines are peripendicular, then the product of their slopes/ gradients is equal to −1.
- Therefore m 1×m2 = −1.
- Thus, the equations Ax + By +C = 0 and Bx − Ay + D = 0 are peripendicular.
Example :
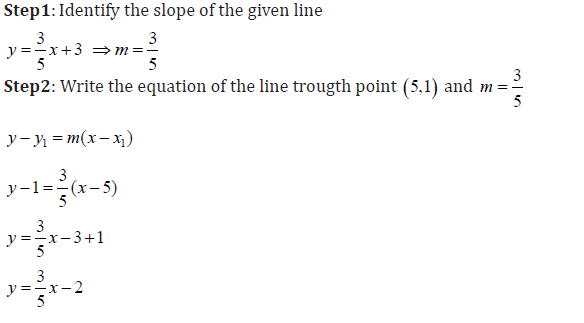
1) Find the equation for the line that contains the point (5,1) and is parallel to
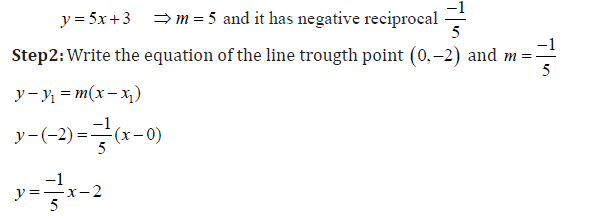
2) Find the equation for the line that contains the point (0, −2) and is perpendicular to y = 5x + 3?
Step1: Identify the slope of the given line and write its negative reciprocal.
APPLICATION ACTIVITY 3.5.3
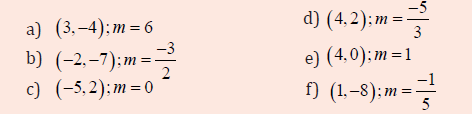
1. Write the equation in point-slope form for the line through the given point that has the given slope
2. Is y − 5 = 2(x −1) an equation of a line passing through(4, 11) ? Explain.
3. Write an equation of the line that contains the point (−3,−5) and the same slope as y + 2 = 7(x + 3)
3.6. Problems on points and straight lines in 2D
3.6.1 Intersection, perpendicularity or parallelism of two lines
ACTIVITY 3.6.1
1. In the same Cartesian plane plot the straight lines containing the following points
What is your opinion about the two lines in the Cartesian plane?
2. In the same Cartesian plane plot the straight lines containing the following points (−3,−1); (0,3) and ( − 2,−4); (1,0)
a) Perpendicularity and intersection of two lines
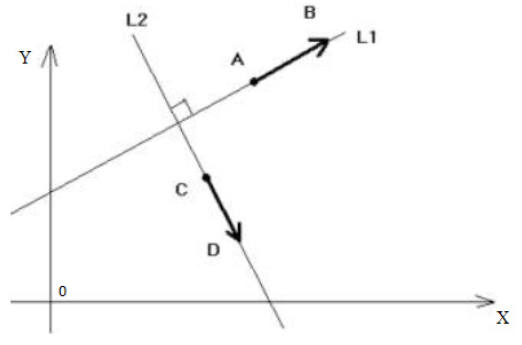
Here L1 and L2 are perpendicular
To write a straight line perpendicular to a given straight line we proceed as follows:
Step I: Interchange the coefficients of x and y in equation ax + by + c = 0.
Step II: Interchange the sign between the terms in x and y of equation i.e., If the coefficient of x and y in the given equation are of the same signs make them of opposite signs and if the coefficient of x and y in the given equation are of the opposite signs make them of the same sign.
Step III: Replace the given constant of equation ax + by + c = 0by an arbitrary constant.
For example, the equation of a line perpendicular to the line 7x + 2y + 5 = 0 is
2x − 7y + c = 0 again, the equation of a line, perpendicular to the line9x − 3y =1 is 3x + 9y + k = 0
Note:
Assigning different values to k in bx − ay + k = 0 , we shall get different parallel straight lines each of which is
perpendicular to the line ax + by + c = 0. Thus we can have a family of straight lines perpendicular to a given straight line.
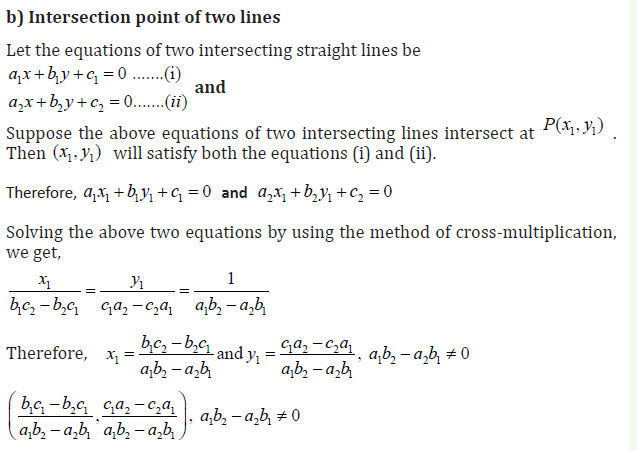
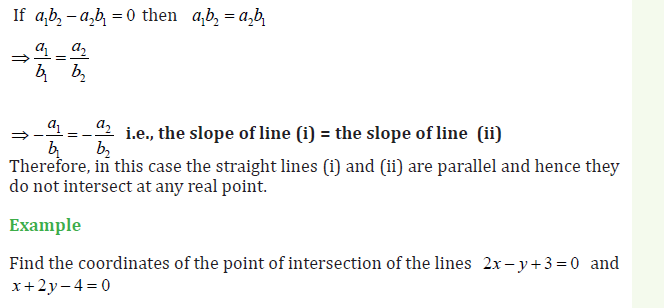
Notes:
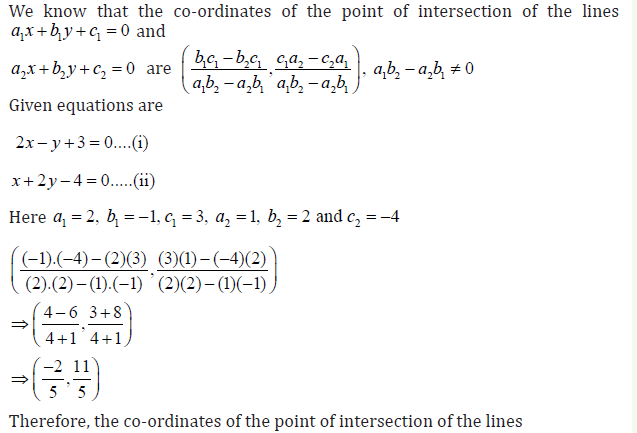
To find the coordinates of the point of intersection of two non-parallel lines, we solve the given equations simultaneously and the values of x and y so obtained determine the coordinates of the point of intersection.
Solution:
Example
Find the equation of the straight line which is parallel to 5x − 7y = 0 and passing through the point (2,−3) .
Solution:
The equation of any straight line parallel to the line 5x − 7y = 0 is 5x − 7y +λ = 0
………… (i) [Where λ is an arbitrary constant].If the line (i) passes through the
point (2,−3) then we shall have:
Therefore, the equation of the required straight line is 5x − 7y + 31 = 0
d) Angles between two lines
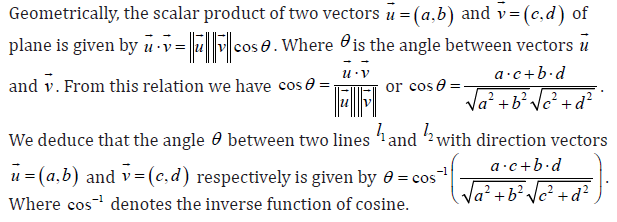
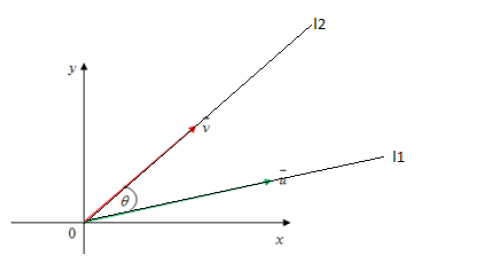
We can illustrate the scalar product in terms of work done by the force on the body:

If the force does not act in the direction in which motion occurs but an angle θ to it , then the work done is defined as the product of the component of the force in the direction of motion and the displacement in that direction.
Notice
- Two lines are perpendicular if the angle between them is a multiple of a right angle
- Two lines are parallel and with the same direction if the angle between them is a multiple of a zero angle
- Two lines are parallel and with the opposite direction if the angle between them is a multiple of a straight angle
Example:
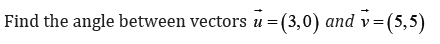
Solution
Let α be the angle between these two vectors
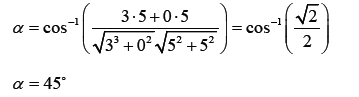
APPLICATION ACTIVITY 3.6.1
1. Find the equation of a straight line that passes through the point
(−2,3) and perpendicular to the straight line 2x + 4y + 7 = 0
2. Find the equation of the straight line which passes through the point
of intersection of the straight lines x + y + 9 = 0 and 3x − 2y + 2 = 0 and is perpendicular to the line
4x + 5y +1 = 0
3. Find the equation of the straight line passing through the point
(5,−6) and parallel to the straight line 3x − 2y +10 = 0 .
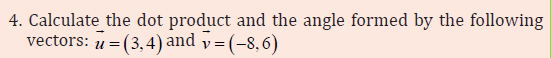
3.6.2. Distance between two lines and the distance between a point and line
ACTIVITY 3.6.2
1. In one Cartesian plane plot the straight lines containing the following points
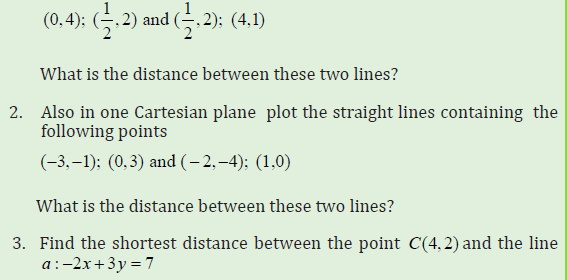
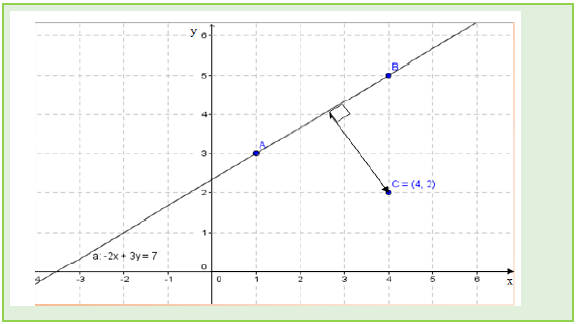
Distance between a point and a line
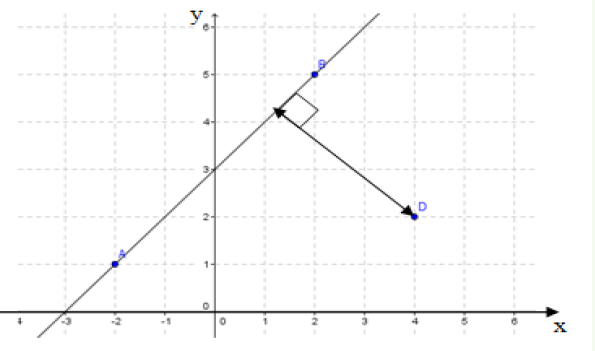
The perpendicular distance from a point D(x1, y1) to the line ax + by + c = 0 is given by
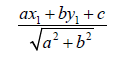
Example
Find the shortest distance from the line 2x + y −1 = 0 to the point (3,2)
Solution :
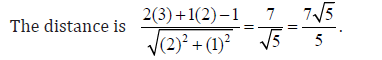
Distance between two parallel lines and two intersecting lines
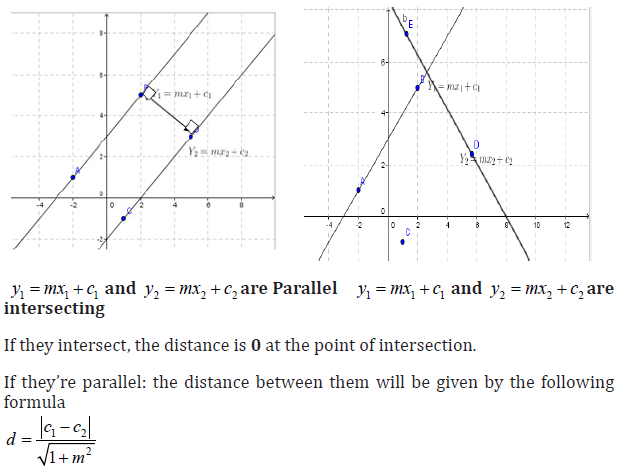
Example
What is the distance between the lines3x + 4y = 9 and 6x + 8y =15 ?
Solution:
First of all we find the slopes of the two lines. We convert the equations into slope intercept form
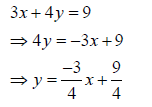
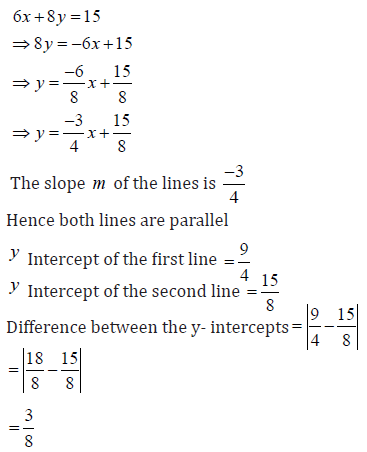
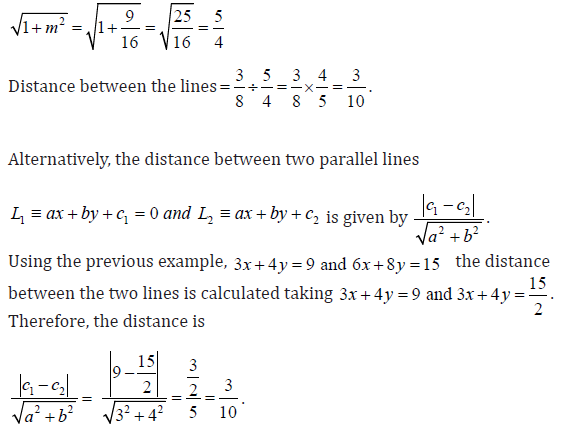
APPLICATION ACTIVITY 3.6.2
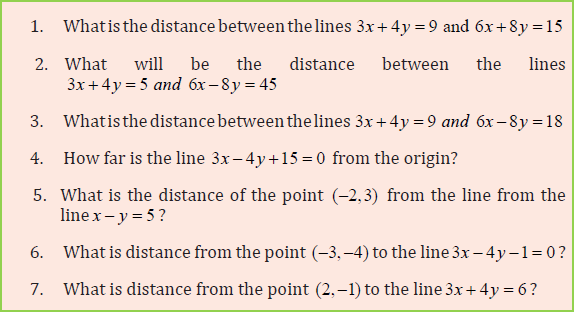
3.7 Geometric shapes in 2D
3.7.1 Identification of the Geometric shapes in two dimensions
LEARNING ACTIVITY 3.7.1
1) i) Discuss the difference between regular polygons and irregular
polygons and give examples.
ii) Name the shapes with three sides and give at least 4 examples of
materials in real life with three sides.
iii) Name the shapes with four sides and give at least 4 examples of
materials in real life with four sides.
2) i) Plot the following points on the 2D coordinate plane, then use a
ruler to connect the points in the order they are listed to form a polygon.
1) i) Discuss the difference between regular polygons and irregular polygons and give examples.
ii) Name the shapes with three sides and give at least 4 examples of materials in real life with three sides.
iii) Name the shapes with four sides and give at least 4 examples of materials in real life with four sides.
2) i) Plot the following points on the 2D coordinate plane, then use a
ruler to connect the points in the order they are listed to form a polygon.
Polygon 1: (8,6);(11,1);(8,6)
Polygon 2: (2,5);(6,5);(6,3);(2,3)
Polygon3: (3,5);(7, 2);(7,−5);(3,−2)
Polygon4: (−2,5);(−2,−2),(3,−2),(5,5)
Polygon5: ( 2, 2);(2, 2);(2, 2);(6, 2),(− − − 6,−6);(−4,−6);(−4,−4);(−2, 4)
ii) What is the name of each geometric figure formed?
iii) Describe the similarities and differences of those figures.
Content summary
In geometry, a two-dimensional shape can be defined as a flat plane figure or
a shape that has two dimensions – length and width. Length on x- axis and width on y-axis or vice versa
Two-dimensional or 2-D shapes do not have any thickness and can be measured
in only two faces. In the two –dimensional coordinate, geometric figures can be plotted:
Example : The following points;
a) (8,6);(11,1);(8,6) b) (2,5);(6,5);(6,3);(2,3)
Can make the following polygons in coordinate’s graphs
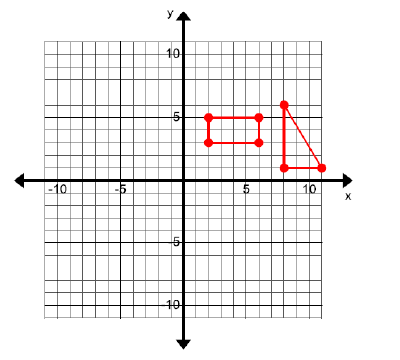
Two dimensional shapes are for example: Triangle, square, rectangle,
parallelogram, trapezium, rhombus, circle, pentagon, hexagon, etc.
It is also important to take note of the hierarchy, e.g. all rectangles are
parallelograms but all parallelograms are not rectangles.
Example:
Explain why square is rectangle but a rectangle is not a square?
Solution:
Depending on their properties, a square is a quadrilateral with four right angles
and equal sides. The two parallel sides are obviously equal, which allows a
square to be a rectangle. Even though the two parallel sides of a rectangle are
equal, the four sides are not equal; which means that a rectangle is not a square
but a square is rectangle.
APPLICATION ACTIVITY 3.7.1
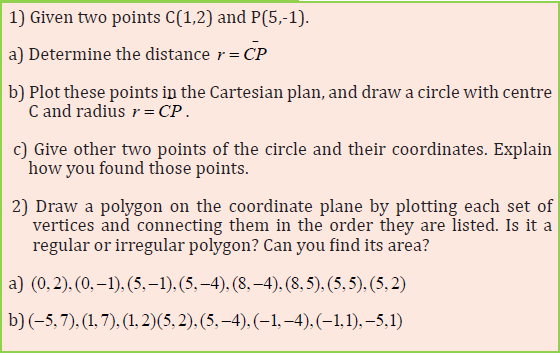
3.7.2 Perimeter and area of geometric shapes in 2D.
LEARNING ACTIVITY 3.7.2
1) The following fields have two dimensional shapes, find the length of
one wire that can be used on one row of the fence in order to protect the plants.
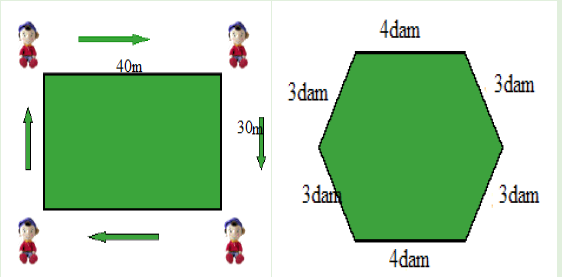
2) On the graph below, one square of the paper represents one square
unit. Calculate the area of given shapes in the graph
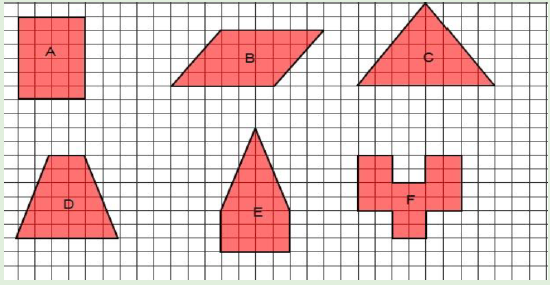
Content summary
As studied in previous levels (Primary and ordinary levels), the perimeter and
area of two dimensional shapes can be summarised in the following table:
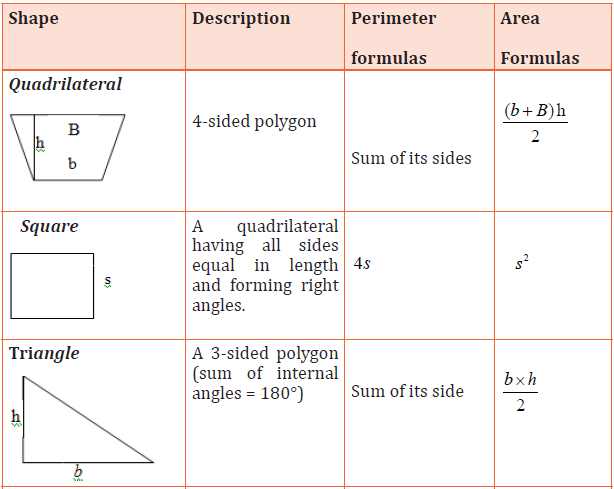
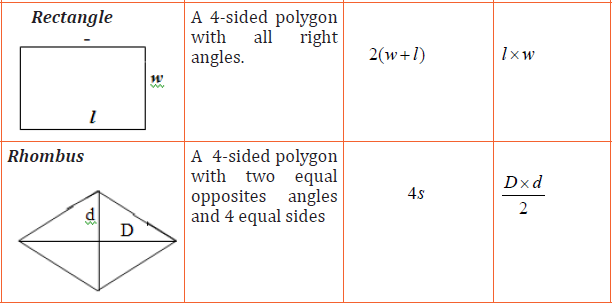
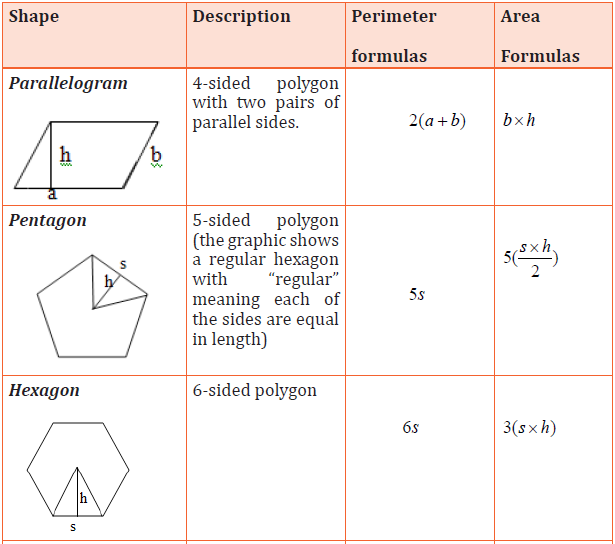
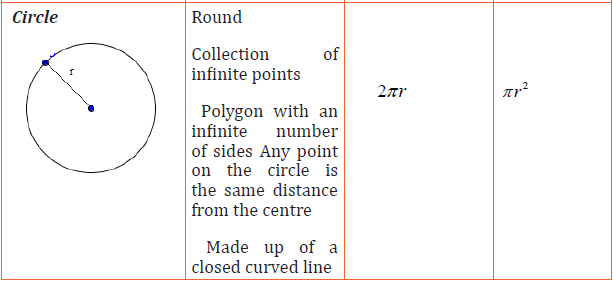
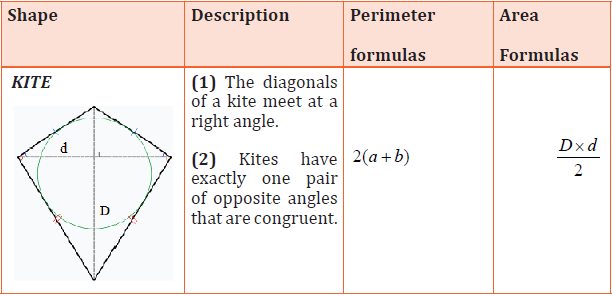
Example
Find the perimeter and the area of the regular octagon below. A regular octagon
has all sides that are equal.
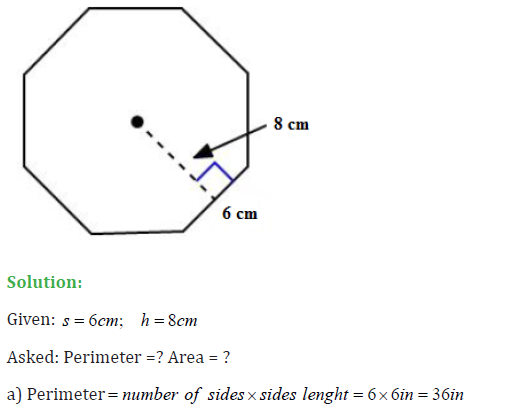
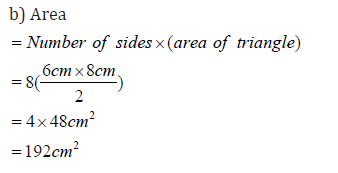
Irregular polygons
If the shape is irregular, it can be divided into regular or other simple figures
to find its area. while the perimeter is found by adding the sum of sides for the original figure.
Examples: Given that one square of the paper represents one square unit, find the area of shaded figures.
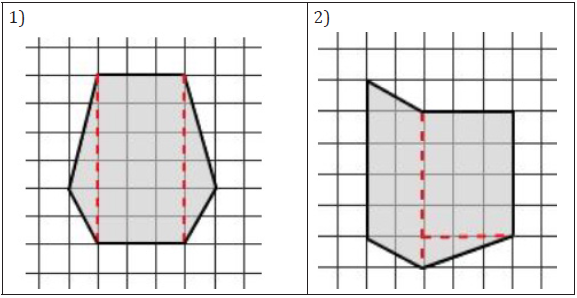
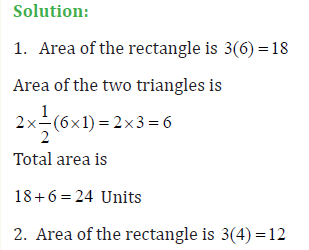
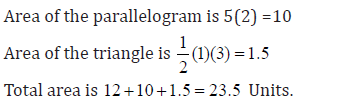
APPLICATION ACTIVITY 3.7.2
Two different copies of a geometric figure were provided as follow:
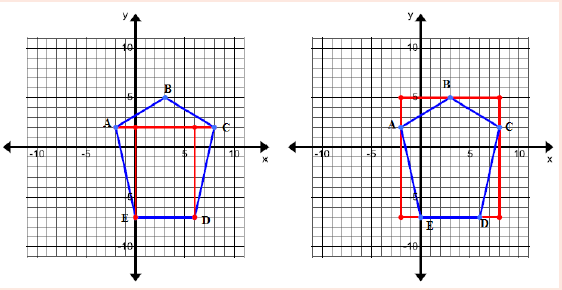

i) Given that one square of the paper represents one square unit on each figure,
find the area of the geometric figure ABCDE in blue.
ii) Show and explain that different methods can be used when finding the area of an irregular polygon.
3.8 END UNIT ASSESSMENT
1) A new park is being designed for your city. The plans for the design
are being drawn on the coordinate plane below. The vertices given
form a polygon that represents the location for 5 different features in the park.
a) Plot each set of points in the order they are given to form a polygon.
Label the feature that the polygon represents on the graph.
Playground:

Splash Pad: (10, 4),(−4,8),(6,8)
Restrooms: (−4,5),(−4,8),(−7,10),(−10,7),(−7,5)
Picnic Pavilion: (8,−1),(6,−3),(4,−3),(2,−1),(2,1),(4,3),(6,3),(8,1) .
If each square on the graph represents 1 square meter, answer the questions that follow.
b) Cement needs to be poured to lay the foundation for the restroom and
the splash pad. How many square meters of cement will the city need
for the foundation of these two features?
c) The playground is going to be covered with wood chips, how many square
meters of wood chips will the city need for the playground?
d) The citizens of the city have asked that the playground have a fence
around its perimeter. How many meters of fencing will they need for the playground?
e) The foundation of the pavilion picnic area is going to be covered with
special pavers. How many square meters of pavers will they need for the pavilion?
2) A coordinate grid represents the map of a city. Each square on the grid represents one city block.
a) Helena’s apartment is at the point . She walks 4 blocks south, then 8 blocks west, then 4 blocks north,
and then finally 8 blocks east back to her apartment. How many blocks did she walk total?
Describe the shape of her path. Mark and label her apartment and highlight her walk.
b) Draw and describe in words at least two different ways you could walk exactly 20 blocks and
end up back where you came from.
c) Carl lives at the point , Find the distance between Helena’s house and Carl’s house, and then mark and label Carl’s house.
d) Establish the equation of the line passing through the points H(5,7) and C(5,-5).
Given that one block has 10 m of length’s side, calculate the distance between them,
and the area of the square centered in C with radius .
REFERENCE
1. J. Sadler, D. W. S. Thorning: Understanding Pure Mathematics, Oxford University Press 1987.
2. Arthur Adam Freddy Goossens: Francis Lousberg. Mathématisons 65. DeBoeck,3e edition 1991.
3. Charles D. Hodgman, M.S., Samuel M. Selby, Robert C.Weast. Standard
Mathematical Table. Chemical Rubber Publishing Company, Cleveland, Ohio 1959.
4. David Rayner, Higher GCSE Mathematics, Oxford University Press 2000
5. Direction des Progammes de l’Enseignement Secondaire. Géometrie de l’Espace 1er Fascule. Kigali, October1988
6. Direction des Progammes de l’Enseignement Secondaire. Géometrie de l’Espace 2ème Fascule. Kigali, October1988
7. Frank Ebos, Dennis Hamaguchi, Barbana Morrison & John Klassen,
Mathematics Principles & Process, Nelson Canada A Division of International Thomson Limited 1990
8. George B. Thomas, Maurice D. Weir & Joel R. Hass, Thomas’ Calculus Twelfth Edition, Pearson Education, Inc. 2010
9. Geoff Mannall & Michael Kenwood, Pure Mathematics 2, Heinemann Educational Publishers 1995
10. H.K. DASS...Engineering Mathematics. New Delhi, S. CHAND&COMPANY LTD, thirteenth revised edition 2007.
11. Hubert Carnec, Genevieve Haye, Monique Nouet, ReneSeroux, Jacqueline
Venard. Mathématiques TS Enseignement obligatoire. Bordas Paris 1994.
12. James T. McClave, P.George Benson. Statistics for Business and Economics.
USA, Dellen Publishing Company, a division of Macmillan, Inc 1988.
13. J CRAWSHAW, J CHAMBERS: A concise course in A-Level statistics with
worked examples, Stanley Thornes (Publishers) LTD, 1984.
14. Jean Paul Beltramonde, VincentBrun, ClaudeFelloneau, LydiaMisset,
Claude Talamoni. Declic 1re S Mathématiques. Hachette-education, Paris 2005.
15. JF Talber & HH Heing, Additional Mathematics 6th Edition Pure & Applied, Pearson Education South Asia Pte Ltd 1995
16. J.K. Backhouse, SPTHouldsworth B.E.D. Copper and P.J.F. Horril. Pure
Mathematics 2. Longman, third edition 1985, fifteenth impression 1998.
17. Mukasonga Solange. Mathématiques 12, AnalyseNumérique. KIE, Kigali 2006.
18. N. PISKOUNOV, Calcul Différential et Integral tom II 9ème édition.
Editions MIR. Moscou, 1980.
19. Paule Faure- Benjamin Bouchon, Mathématiques Terminales F. Editions Nathan, Paris 1992.
20. Peter Smythe: Mathematics HL & SL with HL options, Revised Edition,
Mathematics Publishing Pty. Limited, 2005.
21. Robert A. Adms & Christopher Essex, Calculus A complete course Seventh
Edition, Pearson Canada Inc., Toronto, Ontario 2010
22. Seymour Lipschutz. Schaum’s outline of Theory and Problems of Finite
Mathematics. New York, Schaum Publisher, 1966
23. Seymour Lipschutz. Schaum’s outline of Theory and Problems of linear
algebra. McGraw-Hill 1968.
24. Shampiyona Aimable : Mathématiques 6. Kigali, Juin 2005.
25. Yves Noirot, Jean–Paul Parisot, Nathalie Brouillet. Cours de Physique
Mathématiques pour la Physique. Paris, DUNOD, 1997.
26. Swokowski, E.W. (1994). Pre-calculus: Functions and graphs, Seventh
edition. PWS Publishing Company, USA.
27. Allan G. B. (2007). Elementary statistics: a step by step approach, seventh
edition, Von Hoffmann Press, New York.
28. David R. (2000). Higher GCSE Mathematics, revision and Practice. Oxford University Press, UK.
29. Ngezahayo E.(2016). Subsidiary Mathematics for Rwanda secondary
Schools, Learners’ book 4, Fountain publishers, Kigali.
30. REB. (2015). Subsidiary Mathematics Syllabus, MINEDUC, Kigali, Rwanda.
31. REB. (2019). Mathematics Syllabus for TTC-Option of LE, MINEDUC, Kigali Rwanda.
32. Peter S. (2005). Mathematics HL&SL with HL options, Revised edition.
Mathematics Publishing PTY. Limited.
33. Elliot M. (1998). Schaum’s outline series of Calculus. MCGraw-Hill Companies, Inc. USA.
34. Frank E. et All. (1990). Mathematics. Nelson Canada, Scarborough, Ontario (Canada)
35. Gilbert J.C. et all. (2006). Glencoe Advanced mathematical concepts,
MCGraw-Hill Companies, Inc. USA.
36. Robert A. A. (2006). Calculus, a complete course, sixth edition. Pearson
Education Canada, Toronto, Ontario (Canada).
37. Sadler A. J & Thorning D.W. (1997). Understanding Pure mathematics, Oxford university press, UK.
38. J. CRAWSHAW and J. CHAMBERS 2001. A concise course in Advanced
Level Statistics with worked examples 4th Edition. Nelson Thornes Ltd, UK.
39. Ron Larson and David C (2009). Falvo. Brief Calculus, An applied approach. Houghton Mifflin Company.
40. Michael Sullivan, 2012. Algebra and Trigonometry 9th Edition. Pearson Education, Inc
41. Swokowski & Cole. (1992). Preaclaculus, Functions and Graphs. Seventh edition.
42. Glencoe. (2006). Advanced mathematical concepts, Precalculus with Applications.
43. Seymour Lipschutz, PhD. & Marc Lipson, PhD. (2007). Discrete mathematics. 3rd edition.
44. K.A. Stroud. (2001). Engineering mathematics. 5th Edition. Industrial Press, Inc, New York
45. John bird. (2005). Basic engineering mathematics. 4th Edition. Linacre House, Jordan Hill, Oxford OX2 8DP