General
- Mathematics S3 SB File Uploaded 25/01/22, 13:19
- S3: Maths TG File Uploaded 3/08/22, 14:47
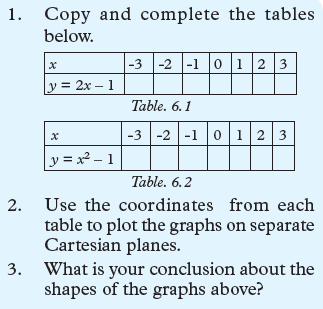
Unit 6: LINEAR AND QUADRATIC FUNCTIONS
this unit, learners should be able to solve problems involving linear and quadratic
functions and interpret the graphs of quadratic functions.Unit outline
• Linear functions
- Definition of linear functions.
- Slope/gradient of a linear function
- Cartesian equation of line
- Parallel and Perpendicular lines
• Quadratic functions
- Table of Values
- Vertex of a parabola and axis of symmetry.
- Intercepts
- Graph in Cartesian plane
Introduction
Unit Focus Activity
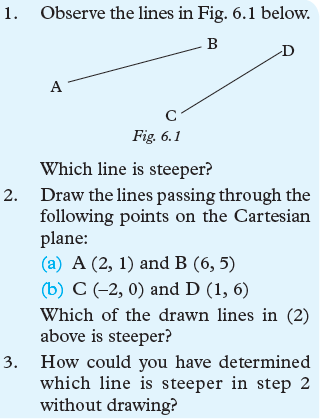
1. Consider line L1 that passes through points A(3, 10) and
B(6, 7) and L2 that passes through point C(1, 2) and D(3, 8).
Determine without drawing the line that is steeper.2. The straight line y = 3
2 x + 9 meets the y-axis at A and the x-axis at B.(a) State the coordinates of A and B.
(b) Find the equation of a line through A perpendicular to
y = 3/2 x + 9.(c) Find the equation of a line through B that is parallel to
y = 3/2 x + 9.3. (a) Draw the graph of the quadratic function
y = 2x2 + 5x – 9 for the values of x from –4 to 2.
Hence, solve the equation
2x2 + 5x – 9 = 0.(b) State the equation of the line of symmetry for the curve.
(c) Use your graph to solve the equations 2x2 + 3x – 4 = 0
6.1 Linear functions
6.1.1 Definition of linear functions
Activity 6.1
Any function of the form y = mx + c where constants m and c given is a straight line
graph when drawn in a Cartesian plane. Such functions are known as linear
functions. The constants can be zero or other integers.The highest degree of a linear function
is one.
Examples of linear functions are y = 2x,
y = 5x+ 4, 3x + y = 4, and so many others.6.1.2 Slope/Gradient of a linear function
Activity 6.2
Activity 6.3
From the graph on the Cartesian plane below, answer the questions that follow.
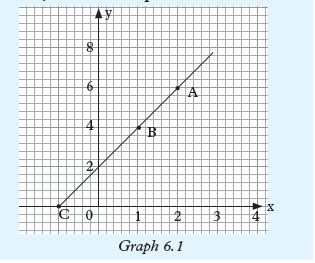
1. Read and record the coordinates of points A, B and C
2. Find gradient of AB and BC
3. What do you notice in part (2) above?
Every straight line has a slope with respect to the horizontal axis. The measure of the
slope is called the gradient.In the Cartesian plane, the gradient of a line is the measure of its slope or
inclination to the x-axis. It is defined as the ratio of the change in y-coordinate
(vertical) to the change in the x-coordinate (horizontal).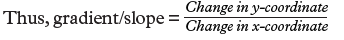
Consider a line passing through the points A (x1, y1) and B(x2, y2).
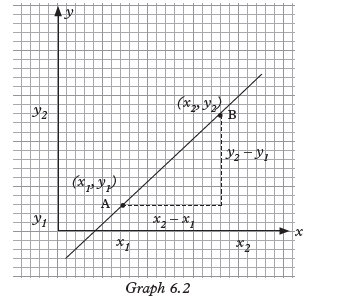
From A to B, the change in the x-coordinate (horizontal change) is x2 – x1 and the
change in the y-coordinate (vertical change) is y2 – y1. By definition, gradient/slope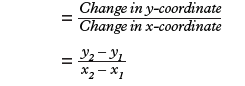
Or =y1 – y2/x1 – x2

I f , for an increase in the
x-co-ordinate, there is no changein the y-co-ordinate, i.e. the line is
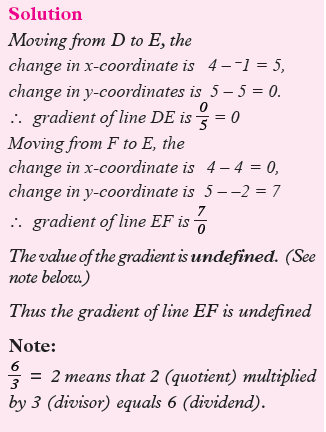
horizontal, the gradient is zero.2. If there is no change in the x-co-ordinate while there is an
increase in the y-co-ordinate, i.e. the line is vertical, the gradient is
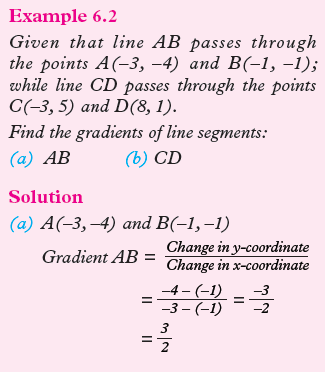
undefined.Note that any two points on a straight line gives the same value of the gradient/slope
of that line. Hence any two points on a line can be used
to find its gradient.Exercise 6.1
1. For each of the following pairs of points, find the change in the x-coordinate
and the corresponding change in the y-coordinate. Hence find the gradients
of the lines passing through them.(a) (0 , 2) and (3 , 4)
(b) (0 , 2) and (5 , 0)
(c) (–2 , –2) and (2 , 0)
(d) (–1 , –2) and (1 , 8)
(e) (–1 , 2) and (3 , –2)
(f) (0 , –2) and (0 , 3)
(g) (2 , –8) and (–2 , 8)
(–2 , 0) and (3 , 0)
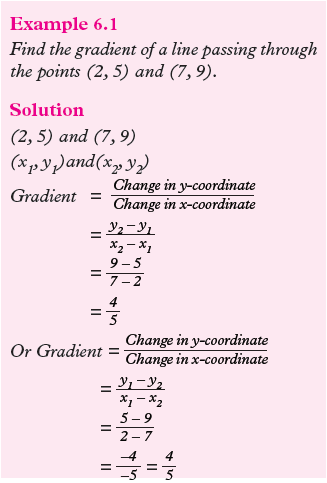
2. Find the gradient of the line which passes through each of the following
pairs of points.
(a) (3 , 5) and (9 , 8)(b) (2 , 5) and (4 , 10)
(c) (7 , 3) and (0 , 0)
(d) (1 , 5) and (7 , 2)
(e) (0 , 4) and (4 , 0)
(f) (–2 , 3) and (5 , 5)
(g) (–7 , 3) and (8 , –2)
(i) (–1, 4) and (–3, –1)
(j) (3 , –1) and (3, 1)
3. In each of the following cases, the coordinates of a point and the gradient
of a line through the point are given respectively. State the coordinates of
two other points on the line.(a) (3 , 1), 3 (b) (4 , 5), 2
(c) (–2 , 3), –1 (d) (5 , 5), – 1
(e) (–4 , 3), undefined
(f) (–4, 3), 0
4. Find the gradients of the lines l1 to l5 in graph 6.4.

DID YOU KNOW? Gradients are applied in Economics, Physics and
Entrepreneurship. In Economics, we have demand and supply where the gradient of
a demand curve is a negative indicating the relationship between demand and
price, supply curve has positive gradient. In Physics, gradients are applied in linear
motion.6.1.3 Cartesian Equation of a line
6.1.3.1 General form of Cartesian equation of a straight line
Activity 6.4
1. Write down the gradients and y-intercepts of the lines whose
equations are:
(a) y = 3x + 4 (b) y = –2x + 5(c) y = 6 – 5x (d) y = 7x
2. Re-write the equations x – 2y = –6,
2x + 3y = 6, y = –1
4x + 2y = 5, 2y = x – 4, and
4x – y = 6 in form of y = mx + c.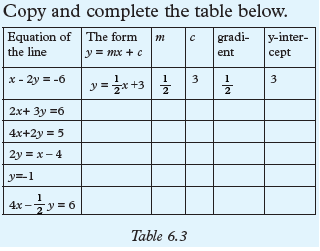
At the beginning of this unit, we learnt that a linear function has a general form
y = mx + c. In this case, m is the gradient of the line and c is the y – intercept.The graph below shows the line y = 2x + 1.
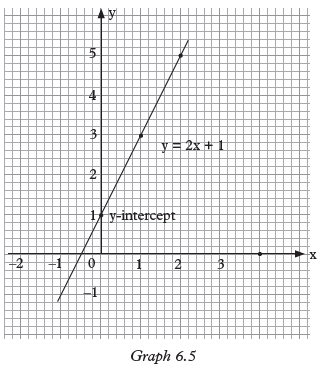
The line has gradient of 2 and y-intercept of 1.
Example 6.4
Find the gradient of the line 3x – y = 2 and draw the line on squared paper.
Solution
To find the gradient of the line, we need to first find any two points on the line.
We write the equation 3x – y = 2 as y = 3x – 2, choose any two convenient
values of x and find corresponding values of y.
For example, when
x = 0, y = 3 × 0 – 2 = –2,∴ point (0, –2) lies on the line.
When x = 2, y = 3 × 2 – 2 = 4,∴ point (2,4) lies on the line.
Thus gradient of the line is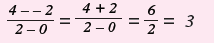
Fig. 6.6 shows the line 3x – y = 2.
Example 6.5
Find the gradient and y-intercept of the line whose equation is 4x – 3y – 9 = 0. Sketch
the line.
Note that for an increase of 3 units in the x-coordinate, the increase in the
y-coordinate is 4 units. Hence, point (3, 1) is on the line.Exercise 6.2
1. In each of the following cases, determine the gradient and
y-intercept by writing the equation in the form y = mx + c. Sketch the
line.(a) 5x = 2y
(b) y = 2x + 1
(c) 2x + y = 3
(d) 4x – 2y + 3 = 0
(e) 2x + 3y = 3
(f) 5 = 5x – 2y
(g) 2x + 3y = 6
2. Find the y-intercepts of the lines with the given gradients and passing
through the given points.
(a) 3, (2 , 6)(b) 5/3, (–2 , 3)
(c) –2, (7 , 4)
(d) –1/4, (2 , 4)
(e) 0, (–3 , –2)
(f) Undefined, (1, 3)
3. Write down, in the gradient-intercept form, the equations of lines (a), (b),
(c) and (d) in Graph 6.8.
6.2.3.2 Finding the equation of a straight line given gradient and a point on the line
Activity 6.5
You are given the straight line that
passes through the point (3, -1) and its
gradient is 2.1. Taking (x) as any other general point through the line, form an
expression for the gradient using the two points (2, –1) and (x, y).2. Find the equation of the line by equating an expression you
obtained in step 1 to the gradient of 2. Simplify the equation in form
y = mx + cExample 6.6
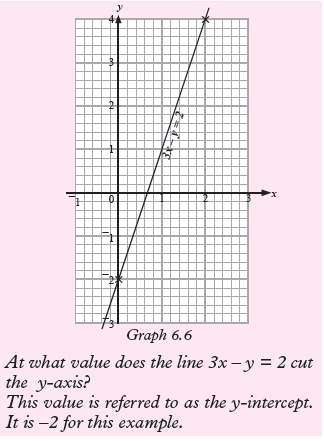
A straight line with gradient 3 passes through the point A(3,–4). Find the
equation of the line.Solution
Fig. 6.9 is a sketch of the line.
Since gradient = 3,
Then, y + 4
x – 3 = 3
⇔ 3(x – 3) = y + 4
⇔ 3x – 9 = y + 4
⇔ 3x – y = 13 (This is the equation of the line).In general, the equation of a straight line, of gradient m, which passes through
a point (a, b) is given by y – b/x – a = m.Exercise 6.3
1. In each of the following cases, the gradient of a line and a point on the
line are given. Find the equation of the line.
(a) 3; (3, 1) (b) 1/2; (4, 5)(c) –1; (–2, 3) (d) –1/5; (5, 5)
(e) 0; (–4, 3)
(f) Undefined; (–4, 3)
(g) 2/3; (–3 , 0)
2. In each of the following, find the equation of a line whose gradient and
a point through which it passes are:
(a) –3; (0, 0) (b) 2/3; (1/2, 1/3)(c) –5/2; (4, 0) (d) 0; (4, 3)
3. Find the equations of lines described below.
(a) A line whose gradient is –2 and x-intercept is 1
(b) A line whose gradient is –1/5 and y-intercept is 4
4. The gradients of two lines l1 and l2are –1/2 and 3 respectively. Find their
equations if they meet at the point(2, 3).5. Line L1 has a gradient of -1 and passes through the point (3, 0). Line
L2 has a gradient of 23 and passes
through the point (4, 4). Draw the two lines on the same pair of axes and
state their point of intersection.6.1.2.3 Equation of a straight line given two points
Activity 6.6
You are provided with the pointsA(–1, 1) and B(3, 2) along the straight
line.
1. Find the gradient of the line joining the two points A and B.2. Taking the point C (x, y) as the general point on the line and the
point A(–1, 1), find an expression for the gradient of line AC.3. Equate gradient obtained in step 1 to the gradient obtained in step 3
Simplify the result.4. Repeat step (2) and (3) using (3,2) and (x,y)
5. Compare the results. What do you notice?
Example 6.7
Find the equation of the straight line which passes through points A(3 , 7) and B(6 , 1).
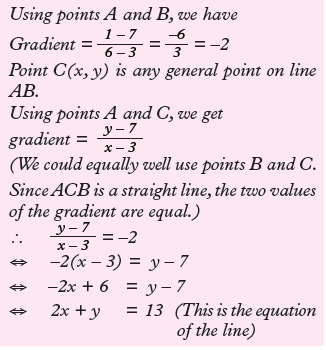
In general,
The equation of a straight line which passes through points (a, b) and (c, d) is
given by,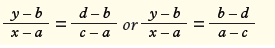


Equating the two gradients, we get
3/4 = y – 3/x – 0
So, 3x = 4y – 12 we get y = 3/4 x + 3Exercise 6.4
1. Find the equation of the line that passes through the points
(a) (–1, 1), (3, 2)(b) (7, 2) (4, 3)
(c) (2, 5), (0, 5)
(d) (5, –2), (6, 2)
(e) (6, 3), (–6 , 2)
(f) (2, –5), (2, 3)
(g) ( 1/4 , 1/3 ), ( 1/3 , 1/4 )
2. (a) Find the equation of the straight line which passes through the
points (0, 7) and (7, 0).(b) Show that the equation of the straight line which passes through
(0, a) and (a, 0) is x + y = a.3. A triangle has vertices A (–2, 0), B(–1,3) and C(2,3). Find the
equations of the sides of the triangle.4. Two lines, l1 and l2, both pass through the point (4, k).
(a) If l1 passes through the point (5 , –3), and has a gradient –11/3 ,
find the value of k(b) If l2 passes through (–14 , 0), find its equation
5. Find the equations of lines described below
(a) A line whose x-intercept is 0 and passing through the point (–3,1)
(b) A line whose y-intercept is –5 and passing through point (–4, –1)
(c) A line whose x and y- intercepts are 4 and –5
6. Line L1 passes through the point
(–1, 3) and has a gradient of 3. Line L2 passes through the point (2, 3)
and meets line L1 at the point (0, 6).(a) Find the equations of the two lines.
(b) Draw the lines L1 and L2 on the same pair of axes.
7. Determine the gradients and the y-intercepts of the straight lines:
a) y = 8x + 1
(b) y = x
(c) y = 3 – 2x
(d) y + x = 0
(e) 3y + x = 9
(f) 2x + 5y + 10 = 0
(g) 1/2 y + 1/3 x = 2
8. Show that the point (–1, –4) lies on the line y = 3x – 1.
9. Show that the equation of the straight line passing through (0, k) and (k, 0)
is y + x = k.10. Given that the line y = 3x + a passes through (1, 4), find the value of a.
6.1.4 Parallel and Perpendicular lines
6.1.4.1 Parallel lines
Activity 6.7
Consider Graph 6.11 below

Lines are parallel if they have the same gradient.
Consider two lines y = m1x + c1 and
y = m2x + c2. These lines are parallel only and only if m1 = m2Example 6.10
Find the equation of a line which passes through the point (3, 5) and is parallel to
2y = 2 – 6x.Solution
The equation of the required line is in the form of y = mx + c. The gradient of the
line 2y = –6x + 2 ⇒ y = –3x + 1 is –3.
Since the two lines are parallel m = –3. Thus, y = –3x + c.
The fact that the required line passes through (3,5),5 = –3 × 3 + c
5 = –9 + c
c = 14
The required equation is y = –3x + 146.1.4.2 Perpendicular lines
Activity 6.8
Consider graph 6.12 below.
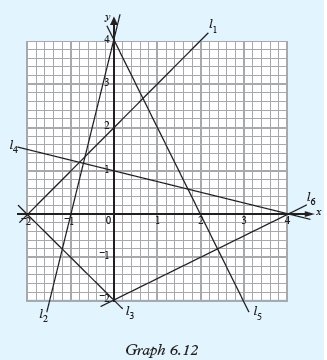
1. Observe and state which pairs of lines are perpendicular?
2. (i) Calculate the gradients of all the lines, use the results to
complete the table below.
(ii) What do you notice about m1× m2?
Lines are said to be perpendicular if the product of their gradients gives –1.
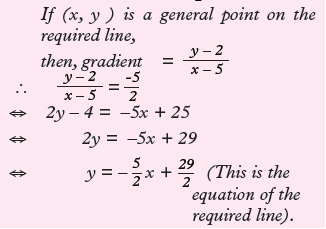
i.e. m1× m2 = –1Example 6.11
Find the equation of the line through (5, 2)
which is (a) parallel, (b) perpendicular to the line 5y – 2x = 10.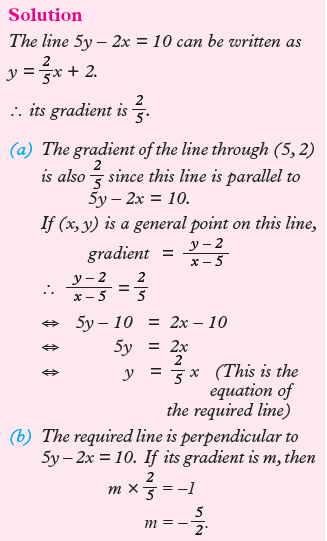
Exercise 6.5
1. Determine the gradients of the following pairs of equations and
state whether their lines are parallel without drawing.
(a) y = 2x – 7 (b) y = 4
3y = 6x + 2 y = –3(c) y = 2x + 3
y = 4x + 6
(d) 5y + 3x + 1 = 0
10y + 6x – 1 = 0(e) 2y + x = 2 (f) 2x + y = 3
3y + 2x = 0 3x + y = 1(g) x + 2y = 4
x + 3y = 6 2y = 4x – 7(i) 3y = 5x + 7 (j) 5y = x + 2
6y = 10x – 3 4y = x + 32. Without drawing, determine which of the following pairs of lines are
perpendicular.(a) y = 2x + 5 and 2y + x = 3
(b) 2x – y = 7 and x + y = 5
(c) 3y= 2x + 1 and 2y + 3x – 5 = 0
(d) 7x – 2y = –2 and 14y – 4x = –1
(e) y = 3/4 x – 2 and the line through
(8, 10) and (2, 2).(f) A line through (2, 2) and (10, 8) and another through (5, 6) and(8, 2).
3. A line through the points (–2,4) and (3, 5) is parallel to the line passing
through the points (a, 6) and (–4,1).
Find a.4. Line L is parallel to a line whose equation is y = 4x – 7 and passes
through the point (1, –2). Find the equation of line L.5. Find the equation of the line that is parallel to another line whose
equation is 4y + 5x = 6 and passes through the point (8, 5).6. Find the equation of the line that is parallel to another line whose
equation is y = 2/5 x + 2 and passes through the point (–2, –3).7. Write down the equation of the line perpendicular to:
(a) 3x + 4y – 1 = 0 and passes through (1, 2),
(b) y = 3/4 x + 3/4 and passes through the origin,
(c) 3x – 2y + 7 = 0 and passes through (–1, 0),
(d) 5y + x + 4 = 0 and passes through (3, 5).
8. Find the equation of the line that is parallel to another line whose
equation is y = 2
5 x + 2 and passes
through the point (–2, –3).6.2 Quadratic functions
Activity 6.9
Study the following functions and decide which of them are quadratic
functions. Give reasons to support your answer.(a) y = 3x + 4
(b) y = 3x2 – 9x – 3
(c) y = x3 – 4x2 + 10
(d) y = x2
(e) y = 2x/x2 – 4 – 8
The expression y = ax2 + bx + c, where a, b and c are constants and a ≠ 0, is called a
quadratic function of x or a function of the second degree (highest power of x is two).Examples of quadratic functions are
(a) f(x) = x2 – 9 (b) f(x) = 2 – 3x + x2
(c) f(x) = 2x2 – 3x – 4 (d) y = x2 + 8
6.2.1 Table of values
Activity 6.10
Given the quadratic function
y = x2 – x – 6. (Hint: Refer to Unit 5)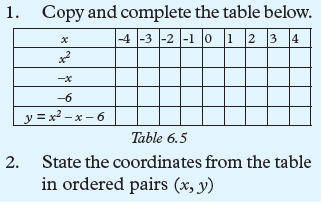
Table of values are used to determine
the coordinates that are used to draw the graph of a quadratic function.
To get the table of values, we need to have the domain (values of an independent
variable) and then the domain is replaced in a given quadratic function to find range
(values of dependent variables). The values obtained are useful for plotting the
graph of a quadratic function. All quadratic function graphs are parabolic
in nature.Example 6.12
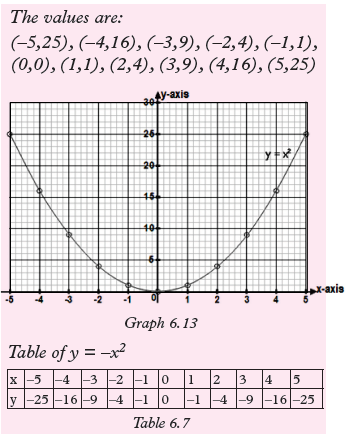
Draw the table of values of y = x2 and
y = –x2 for values of x between –5 and +5.
Plot the graphs.Solution
Table of y = x2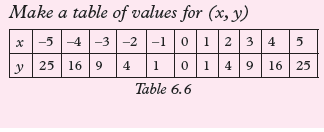

Example 6.13
Draw the table of y= x2 – 3x + 2, for values of x between -1 and +4.
Solution
Make a table of values of x and y

Exercise 6.6
1. (a) Draw the table of y = 1 + x – 2x2, taking values of x in the domain
–3 < x < 3. State the coordinates obtained.(b) Use the same domain to draw the table of y = 2x – 5. State the
coordinates obtained.2. Draw the graph of y = 2x2 + x -2 from x = -3 to x = 2. Hence, find the
appropriate values of the roots of the equation 2x2 + x – 2 = 0.3. Copy and complete the following table of values for y = 6 + 3x – 2x2.
Plot the graph of the function.
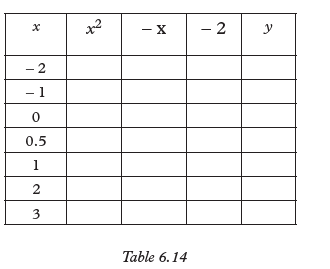
4. Given that y = x2 – x – 2 complete the following table for values of x and y.
State the coordinates in ordered pairs (x, y) . Plot the graph.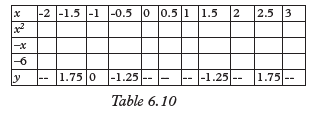
5. Given that y = (3x + 1)(2x – 5), copy and complete the following
table for values of x and y. State the coordinates in ordered pairs and plot
the graph.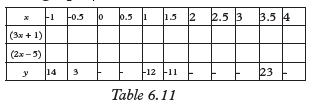
6.2.2 Determining the Vertex of aquadratic function and axis of symmetry from the graph.
Activity 6.11
Use internet or dictionary to explain the following terms.
(a) Line of symmetry
(b) Maximum point
(c) Minimum point
Any quadratic function has a graph which is symmetrical about a line which is
parallel to the y-axis i.e. a line x = h where h = constant value. This line is called axis
of symmetry as shown in graph 6.16 below.
For any quadratic function
f(x) = ax2 + bx + c whose axis of
symmetry is the line x = h, the vertex is the point (h, fExample 6.14
1. Given that of y = x2 + 2x – 2 is a quadratic function.
(a) Prepare the table of values for the function y = x2 + 2x – 2
for –4 ≤ × ≥ 2.(b) Draw the graph.
(c) From the graph, identify;
(i) the value of y when x = 1.5
(ii) the value of x when y = –1,
(iii) the least value of y.
(d) Determine the line of symetry of the function.
Solution
(a) Table below is the required table of values. Values of y are obtained by
adding the values of x2, 2x and –2. Note that breaking down the expression into
such components makes the working much easier.
(b) Choose a suitable scale and plot the values of y against the corresponding
values of x. Join the various points with a continuous smooth curve to obtain a
graph like that of graph 6.16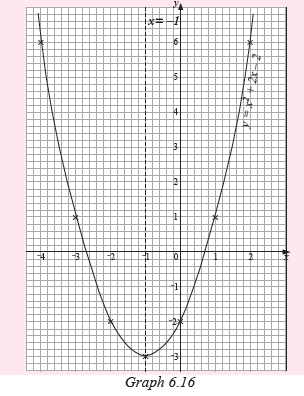
(c) From graph 6.16,
(i) when x = 1.5, y = 3,
(ii) when y = –1, x = –2.4 or 0.4,
(iii) the least value of y is –3.
(c) For the graph y = x2 + 2x – 2, the symmetry is line
x = –1.
Reason: It is the x-value of the lowest point on the graph.Example 6.15
Draw the graph of y = 2 + 2x – x2 for values of x from –2 to 4. From the graph,
find:(a) the maximum value of 2 + 2x – x2
(b) the value of x for which y is greatest
(c) the range of values of x for which y ispositive
(d) the axis of symmetry.
Solution
The table 6.13 is the required table of values.
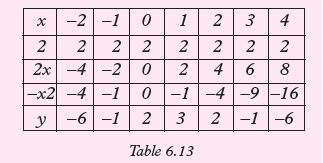
Fig. 6.17 shows the graph of y = 2 + 2x – x2.
From the graph
(a) the maximum value of 2 + 2x – x2 is3,(b) the value of x for which y is greatest is1,
(c) y is positive for all parts of the curve above the x-axis, i.e. when x > –0.8
and x < 2.8. In short, y is positive over the range –0.8 < x < 2.7.(d) the axis of symmetry for the graph of y = 2 + 2x – x2 is x = 1.
Notice that the graph 6.17 is upside down as compared to graph 6.15.
This is always the case when the coefficient of x2 is negative.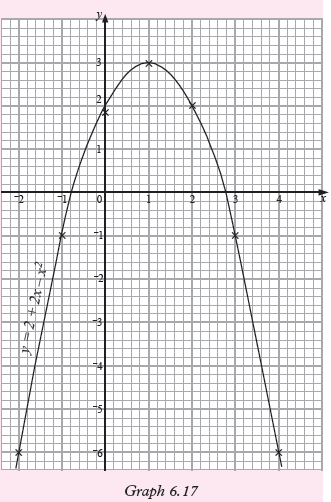
Exercise 6.7
1. Plot the graph of y = x2 – 4x + 5 for
–1< x <5. Use the graph to answer the questions below.(a) Where does the graph cut x-axis?
(b) State the axis of symmetry of the graph.
(c) Find the vertex of the graph.
(d) Find the value of y when x=3.
2. Given that y = x2 – x – 2 complete the following table for values of x and y.
(a) State the co-ordinates in orderedpairs
(b) Plot the graph of the function
(c) Find the axis of symmetry from the graph plotted in (b).
(d) Find the vertex of the function from the graph plotted in (b).
3. The table below shows the values of y = x2 – 3x + 2
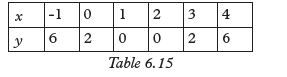
(a) Using a suitable scale, draw a graph of y = x2 – 3x + 2.
(b) What is the axis of symmetry of y = x2 – 3x + 2?
(c) What is the vertex of the function y = x2 – 3x + 2.
(d) Use the graph drawn to solve y = x2 – 3x + 2.
4. (a) Plot the graphs of y = 3x – x2 and y = x2 – 3x in for –1 ≤ x ≤ 4 on
the same axes.(b) What is the relationship between
the two graphs plotted in 4(a)above?6.2.3 Determining the intercepts, vertices and sketching
quadratic functionsActivity 6.12
Consider the graph in Graph 6.18 below,
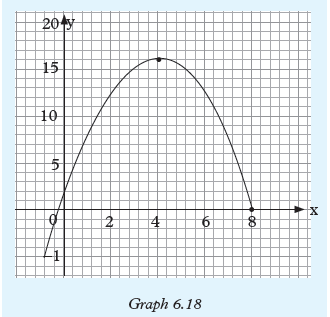
1. Read and record the vertex of the graph.
2. What is the axis of symmetry from the graph?
3. Read and record the points where the graph cuts and axes.
The vertex of a quadratic function is the point where the function crosses its axis
of symmetry.If the coefficient of the x2 term is positive, the vertex will be the lowest point on the
graph, the point at the bottom of the U-shape. If the coefficient of the term x2
is negative, the vertex will be the highest point on the graph, the point at the top of
the ∩-shape. The shapes are as below.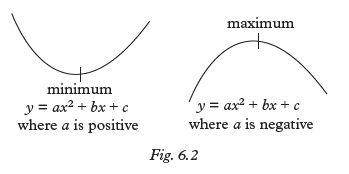
The standard equation of a quadratic
function is y = ax2 + bx + c.
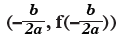
Since the quadratic expression written as f(x) = ax2 + bx + c, then we can get the
y-coordinate of the vertex by substituting the x-coordinate = –b/2a .So the vertex becomes
The axis of symmetry is the x-coordinate of
the quadratic function. Axis of symmetry
is therefore calculated from x = –b/2a .
The intercepts with axes are the points where a quadratic function cuts the axes.
There are two intercepts i.e. x-intercept and y-intercept. x-intercept for any
quadratic expression is calculated by letting y = 0 and y intercept is calculated
by letting x = 0
The graph of a quadratic expression can be sketched without table of values as long
as the following are known.(a) The vertex
(b) The x-intercepts
(c) The y-intercept
Example 6.16
Find the vertex of y = 3x2 + 12x – 12. State
the axis of symmetry.Solution
The coefficients are a = 3,b = 12 and c = –12
The x-coordinate h = –b/2a , = –12
2(3) = –2.Substituting the x-coordinate to get y coordinate, we have
y= 3(–2)2 + 12(–2) – 12 = –24.
The vertex is at (–2, –24)
The axis of symmetry is the line x = –2.Example 6.17
Find the vertex and axis of symmetry of the parabolic curve y = 2x2 – 8x + 6Solution
The coefficients are a = 2, b = –8 and c = 6
The x-coordinate of the vertex is
h = –b./2a = (–8)
2(2)
– = 8
4 = 2.
The y-coordinate of the vertex is obtained
by substituting the x-coordinate of the
vertex to the quadratic expression. We get
y = 2(2)2 – 8(2) + 6 = –2.
The vertex is(2, –2) and the axis of
symmetry is x = 2.Example 6.18
Find the intercepts of the graph of the
function y = 2x2 – 8x + 6
Solution
When x = 0, y = 2(0)2 –8(0) + 6 = 6
The y-intercept is (0, 6)
When y = 0, 0 = 2x2 – 8x + 6
We therefore solve the quadratic equation
for the values of x
2x2 – 8x + 6 = 0.
2x2 – 6x – 2x + 6 = 0.
2x(x – 3) – 2(x – 3) = 0.
(2x – 2)(x – 3) = 0.
Either 2x – 2 = 0 or x – 3 = 0.
x = 1 or x = 3.
The x-intercepts are (1,0) or (3,0)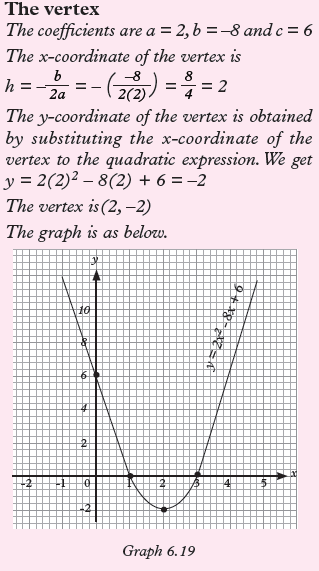
Example 6.19
Sketch the graph of y = x2 – 3x + 2
Solution
The intercepts.
When x = 0, y = 2. The y-intercept is (0, 2)
When y = 0, then x2 – 3x + 2 = 0
Solving the quadratic expression,
x2 – 3x + 2 = 0.
x2 – 2x – x + 2 = 0.
x(x – 2) –1(x – 2) = 0.
(x – 1)(x – 2) = 0.
x = 1 or x = 2.
(1,0) and (2,0) are x-intercepts.

3. Without tables of values, state the vertices, intercepts with axes, axes of
symmetry, and sketch the graphs.
(a) y = 2x2 + 5x - 1(b) y = 3x2 + 8x - 6
(c) 2x2 - 7x – 15 = 0
(d) y = 3 + 4x – 2x2
Unit Summary
• Linear function is of the form y = mx + c where m = gradient and
c = y-intercept.
Examples of linear functions are: y = 2x – 1, y = 8, y = 7 – 7x• Gradient of a straight line: For line joining two points as shown in the
figure.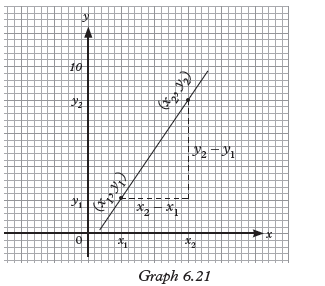
Gradient of the line is m =y2 – y1/x2 – x1.
• Parallel condition: When lines are parallel, they have the same gradient
i.e. Consider two lines y = m1x + c1 and y = m2x + c2. These lines are
parallel only and only if m1 = m2• Perpendicular condition: When lines are perpendicular, the product of
their gradients is –1 i.e. Two lines y = m1x + c1 and y = m2x + c2 are said to be perpendicular if the
product of their gradients gives –1.
i.e. m1 × m2 = –1.• Equation of a straight line: The equation of a line y = mx + c can be
obtained when it passes through one point and gradient is given or when it
passes through two given points.• Quadratic function: The expression y = ax2 + bx + c, where a, b and c
are constants and a ≠ 0, is called a quadratic function of x or a function
of the second degree (highest power of x is two).• Axis of symmetry: A quadratic function has axis of symmetry x = h. The axis of
symmetry is parallel to the y - axis.• Vertex of a quadratic function: Every quadratic function has vertex. The
graph turns at its vertex. The vertex is the coordinate ([h, f(h)) where
x = h is the axis of symmetry. For the expression y = ax2 + bx + c, if
the coefficient of the x2 term is positive, the vertex will be the lowest point on
the graph, the point at the bottom of the "∪"-shape. If the coefficient of the
term x2 is negative, the vertex will be the highest point on the graph, the
point at the top of the "∩"-shape.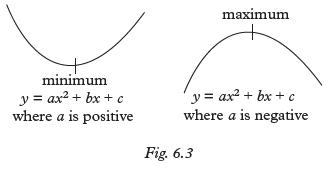
• Intercepts of a quadratic function:
The intercepts with axes are the points where a quadratic function
cuts the axes. There are two intercepts i.e. x-intercept
and y-intercept. x-Intercept for any quadratic expression is calculated
by letting y = 0 and y-intercept is calculated by letting x = 0Unit 6 Test
1. Show that the equation of the straight line passing through (0, p) and (p, 0)
is y + x = p.2. Given the function f(x)=–2x2 + 4x – 6.
(a) Identify the function and explain why.(b) Find the vertex of the function.
(c) Find the intercepts of the function with axes.
(d) Sketch the graph of the function on a Cartesian plane.
3. Consider the function
f(x) = 2(x – 3)(x + 1).
(a) Is the curve open up or open down? Explain.(b) Find the vertex and intercepts of the curve.
(c) What is the axis of symmetry of the curve?
(d) Sketch the curve on a Cartesian plane.
4. Sketch the graph of y = –(x + 4)(x – 9)
5. Find the equation of the line that is parallel to another line whose
equation is 4y + 5x = 6 and passes through the point (8, 5).6. (a) Show that the point (–1, –4) lies on the line y = 3x – 1.
(b) Find the equation of the line that is parallel to another line whose
equation is x + 2y + 8 = 0 and passes through the point (–2, –3).7. (a) Given that the line y = 3x + a passes through (1, 4), find the
value of a.(b) Sketch the graph of y = –2x2 – 6x – 9.