UNIT 10: INTERPRETATION OF FINANCIAL STATEMENTS
Key unit competence: To be able to interpret financial statements using
ratios for an entity
Introductory activity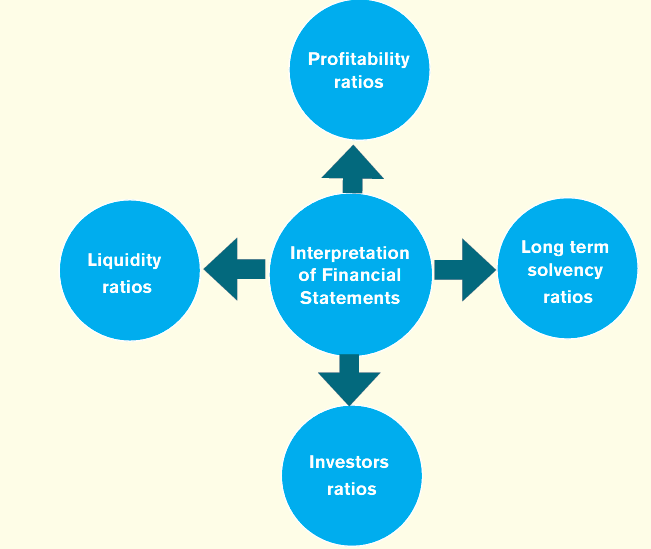
Observe the above picture and answer to the following questions:
1. What do you think is the interpretation of financial statements?
2. What is a financial ratio?
3. What is the purpose of financial ratios?4. What are the broad categories of accounting ratios?
10.1. Introduction to financial statements interpretations
Learning Activity 10.1
Lois ltd company is a Company operating its business in Kigali city from
2019. At the end of the financial period ended 31st December 2021,
the owners hired the new accountant to present the business’s financial
statements. After preparing the financial statements, the owners asked the
accountant to explain the meaning of his results and he was not able to give
the real answer. The owners of Lois ltd company want you to help them tounderstand well the meaning of their financial statements results.
a) Which tool are you going to use to understand the Financial10.1.1 Meaning of interpretation of financial statements
Statements results?
b) What is the purpose of financial statement interpretation?c) What is the Importance of ratio method?
Financial statements should be clear and understandable to enable users make
sound decision and judgments. They should also show corresponding figures
for the preceding period to afford comparison and analysis.
Depending on the need and the accounting knowledge of the users, the
financial statements may not fully serve the required needs, however simple
they may appear to the accountant. It is therefore the duty of the accountant to
analyze and interpret the special language to non-accounting users so that they
may make the best use of financial statements to suit their special needs. The
accountant translates the information contained in the financial statements into
a form which is more helpful and can easily be understood by users.
In order to translate financial statements to users, some yardsticks or bases or
identifiable economic relationships are used. The commonly used yardsticks in
analyzing and interpreting financial statements are as follows:
• Annual or inter-period
The analysis of financial statements is based on the results achieved by the
business enterprise during a previous accounting period. This is only possible iffinancial statements show corresponding figures for the preceding period.
Inter-firm comparison
The results of the firm and results of other closely related firms operating
within the same industry for the current period, also help in analyzing the firm’s
performance.
• Standards and budgets
The management establishes standards and budgets upon which the
performance of the business is measured. The financial statements are therefore
analyzed based on these standards.
Tools of financial analysis
There are several tools used in analyzing financial statements. These include:
i. Ratio analysis: Liquidity, profitability, Solvency, operating or activity
ii. Comparative financial statements (variations in %)
iii. Common size statement
iv. Trend ratios or trend analysis (changes in % from base year)
v. Statement of changes in working capital
vi. Funds flow and cash flow analysis
vii. Graphicsviii. Charts
10.1.2 Meaning and purpose of accounting ratios
Definition of ratio
Ratio can be defined as a proportional relationship between two significant
values (or significant magnitudes). It is an arithmetical relationship between
given items normally expressed as a fraction or a percentage or the numerical or
arithmetical relationship between two figures. It is expressed where one figureis divided by another.
Ratio analysis
Ratio analysis is one of the powerful tools of financial analysis which deals
with calculation and interpretation of ratios. It can be defined as the process of
ascertaining the financial ratios that are used for indicating the ongoing financialperformance of a company using a few types of ratios.
Ratio analysis helps the analysts to make quantitative judgment with regard to
concern’s financial position and performance.
Ratio can be expressed:
• As a pure ratio e.g 1:2
• As a decimal value, such as 0.10
• As an equivalent percent, such as 10%
• As a decimal number, especially when they are more than 1.
Objectives/purpose of financial ratios/ financial statements
interpretation
Use of ratios enable items appearing in financial statements to be translated and
interpreted using any suitable basis such as the past record of the business.
Comparison of the firm with other competitive business of the same nature, is
also possible by use of ratio analysis.
In analyzing the financial statements of a business, ratio analysis has the following
objectives:
• Measure the profitability and adequacy of the profits of the business
enterprise. In this regard, users of financial statements would be able
to determine:
a) Whether the profits earned by the business are rising or declining
over time and whether such profits are adequate to cover the cost
of sales and operating expenses, yet still leave a balance for the
proprietors.
b) Whether the firm’s profits are stable over time
c) The position of the firm’s profits as compared to the average annual
profits earned by competitors and similar firms operating in the same
industry.
• Measure the worth of a business to its owners or equity holders. In this
regard, users would be able to determine:
a) The return on equity or shareholders’ funds tied up in the business
b) If the satisfaction that the current earnings are per share is realistic
c) How realistic the current market price is for the firm’s shares.
• Measure the liquidity, financial strength and the survival ability of the
business. In this regard, the users of financial statements would be able
to determine:
a) The ability of the business to pay its short term debts as they fall
due, without having to sell the whole undertaking
b) The financial stability of the business
c) The ability of the enterprise to withstand a fall in the value of its
assets before the creditors’ position is prejudiced
d) The ability of the business to generate enough revenue to cover
financial charges and leave a sufficient balance over for dividends,
expansion and provision to finance a loan capital repayment.
• Measure the productivity of the assets and how efficient management
utilizes the economic resources placed at its disposal. In this regard,
the users would like to know:
a) The extent of asset utilization and extent to which management uses
all available resources to generate sales.
b) The collection period of accounts from credit customers
c) How fast the business turns over its stock and the ability of
management to control the investment in stock.
d) The average period of time taken to pay debts of the business
especially to settle accounts of creditors.
• Measure the solvency, defensive and survival position of the business.
Users would be able to determine:
a) The extended to which the firm’s assets are financed through
borrowing and its extent of trading on equity, i.e. using shareholders’
funds.
b) The level of the cushion of security of creditors
c) The gearing or leverage into the capital structure of the business, in
other words, the relationship between capital and capital investedby the ordinary shareholders.
Importance of ratio method
Ratio method permits:
• To follow the evolution and progress of the financial situation of an
enterprise
• To set or to establish regularly the relationship between two values or
two subjects
• To analyze and interpret the information extracted from the financial
statements
• To compare an enterprise (financial position) with another (or industry)
in the same sector.
• To know the actual financial situation of an enterprise.
• It provides a basis for making future business policies.
• It is used in evaluating the business and shares by investing on stockexchange.
The users of financial ratios
Users of financial statements include owners -who are managers, owners –who
are shareholders, managers, government, creditors, potential buyers, suppliers,
customers, employees and general public.
Each of these users has their own requirement of information. Financial
statements may meet some. Financial statements provide information that is
historical, summarized and highly selective.
• Internal Managers: To evaluate the performance of the business as
compared to the previous years or other firms in the same trade.
• Existing and prospective shareholders: to make the investments
decisions on the basis of return on their investments.
• Bank Managers and creditors: To make the decisions for providing
loans and credit facilities.
• Security analysts: use financial ratios to compare the strengths and
weaknesses in various companies. If shares in a company are traded
in a financial market, the market price of the shares is used in certainfinancial ratios. Etc
Source of data for financial ratios
Values used in calculating financial ratios are taken from the balance sheet,
income statement, statement of cash flows or (sometimes) the statement of
retained earnings. These comprise the firm’s accounting statements or financialstatements.
Notes: The comparison of a firm’s ratios with other similar firms’ ratios, or
with industry figures, is known as A cross sectional analysis.
Whereas the comparison of the firm’s own results in time is called Time seriesanalysis.
Application activity 10.1
1. You are hired as an accountant of any local company, appreciate the
need of financial ratios method in your work.
2. An accountant of your local company is not understanding why different
users’ need its financial ratios and he/she is persisting offering them.
You are asked to help him/her knowing some users of accountinginformation and why each of them needs that information.
10.2 Broad categories of ratios, their calculation and their
interpretation.Learning Activity 10.2
From the above figure,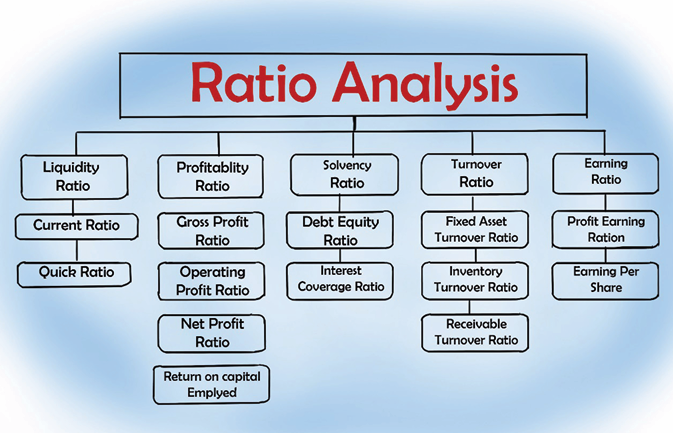
a) What are the broad categories of ratio analysis?
b) Give examples to each category of ratio analysis.
Financial ratios are categorized according to the financial aspect of the business
which the ratio measure. There are broadly classified into five categories:
• Liquidity/working capital ratios measure the availability of cash to
pay debt
• Activity ratios measure how quickly a firm converts non-cash assets
to cash assets.
• Debt ratios measure the firm’s ability to repay long-term debt.
• Profitability ratios measure the firm’s use of its assets and control of
its expenses to generate an acceptable rate of return.
• Market ratios measure investor response to owning a company’sstock and also the cost of issuing stock.
10.2.1 Liquidity ratios
Liquidity: It is the ability of a business to pay its debts as they fall due and to
meet unexpected expenses within a reasonable settlement period. It is also an
indicator of a firm’s ability to generate enough cash to remain in existence.
Liquidity Ratios, also called working capital ratios. Those are the ratios that
attempt to indicate the ability of a business to meet its debts as they become due.
A business that has satisfactory liquidity will have sufficient funds, normally
referred to as working capital to pay creditors at the required time. This is vital
to ensure that good business relationships are maintained
The liquidity ratios include:
c) Current ratio (or working capital ratio): It measures currentassets against current liabilities.
This ratio shows whether the business is able to pay back its current liabilities
using only its current assets. The analysis of this ratio can be completed by theanalysis of facility of current assets to be turned into cash.
Interpretation: It is best for this ratio to be about 2 (or 2:1) i.e the current
asset must at least be twice as high as current liabilities. The rule says that the
current ratio should meet current liabilities at least twice. If the actual current
ratio is less than the standard ratio (current) of two to one (2:1), the conclusion
is that the concern does not enjoy sufficient liquidity and will not be able to meetits short-term obligations and vice-versa.
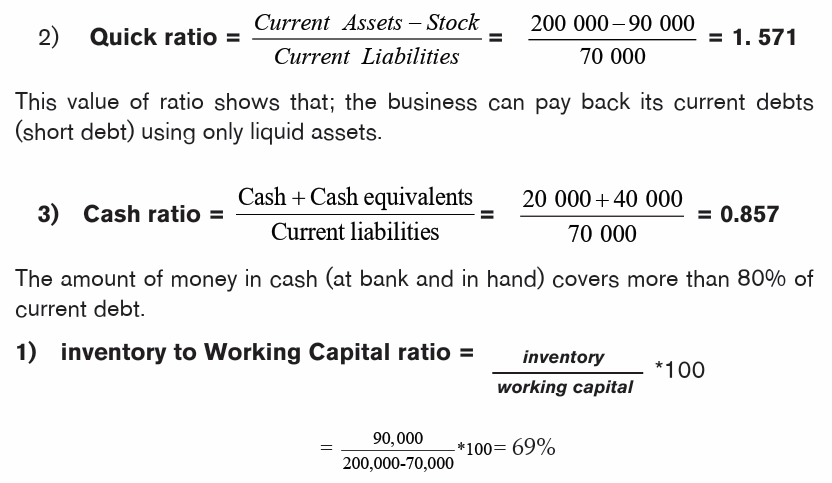
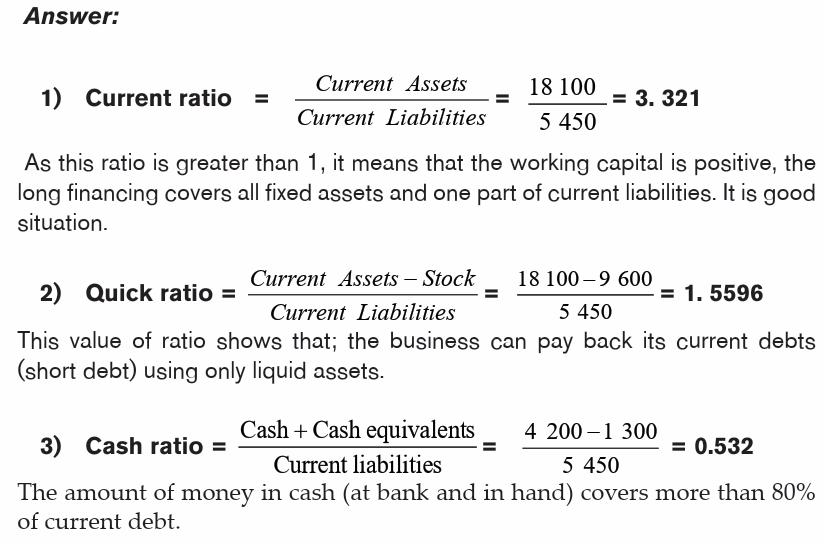
d) Quick ratio (or Acid test ratio): The Acid test or quick ratio takes
into account only those current assets that are cash or can be changedvery quickly into cash.
This ratio shows whether there are enough liquid assets to be able to pay
current liabilities quickly. It is dangerous if this ratio is allowed to fall to a very
low figure. The analysis of this ratio should be completed by the comparison
analysis between collection period and payment period. Collection period
should precede repayment period. It is an acid test of solvency and measureson how quickly current assets can be converted into cash.
Is a more refined current ratio which exclude amount of stock of the firm. Stocks
are excluded for two basic reasons:
i) They are valued on historical cost basis
ii) They may not be converted into cash very quickly
Interpretation: On average, a liquidity ratio 1:1 is considered adequate.
However, the most appropriate acid test ratio will definitely depend on thenature of the business.
c) Cash ratio/absolute ratio/ super quick ratio: Indicates the cash
available to pay the liabilities. This is a refinement of acid test ratio
indicating the ability of the firm to meet its current liabilities from its
most liquid resources. It is more refined since it assumes that debtors
may not pay their accounts on time and stock will take time to convertinto cash.
Absolute assets mean cash in hand, cash at bank and readily marketable
securities.
Interpretation: Actual absolute liquid ratio is compared to the standard of 1:2,
(the standard absolute liquid ratio is fixed at 1:2, because for the payments of
quick liabilities, besides 100% cash available from the absolute liquid assets,
a good amount of cash may also come from other current assets like bills
receivable
d) Inventory to working capital ratio
Inventory/ stock: Refers to the closing stock of raw materials, work in progress
(semi-finished goods) and finished goods.
Working capital: The difference between current assets and current liabilitiesor excess of current assets and current liabilities.
The use of this ratio is to indicate that there is overstocking or understocking.
Interpretation: As per the standard, inventory to working capital ratio, the
inventories should not absorb more than 75% of working capital. As such,
a low inventory to working capital ratio (a ratio of less than 75%) indicates
understocking and so, a high liquid position. While a high inventory indicates
overstocking, and so a low liquid position.
Illustration 1.
Let’s assume that the balance sheet of Diane on 31/12/2011 shows thefollowing:
As this ratio is greater than 1, it means that the working capital is positive, the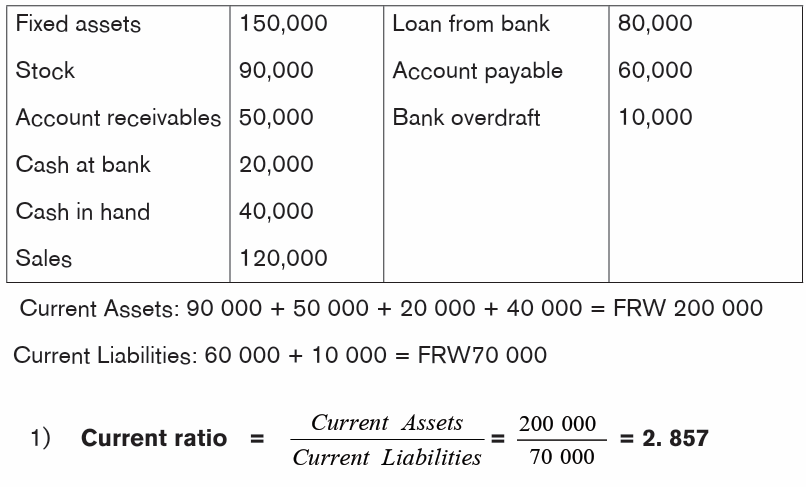
long financing covers all fixed assets and one part of current liabilities. It is goodsituation.
Determine the liquidity ratios studied knowing the sales values for period was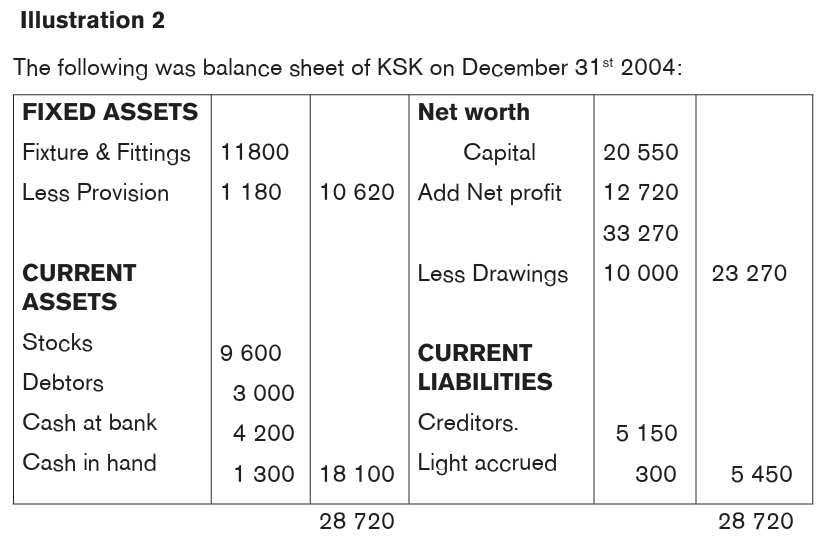
FRW 20,000
10.2.2 Activity / efficiency ratios/performance ratios/turn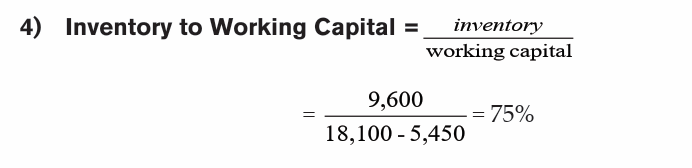
over ratios
Activity or efficiency ratios measure the effectiveness of the firms use of
resources (assets) to generate sales/turnover and so profit.
These ratios compare revenue figures with capital figures and may be used
in addition to the return on capital percentage to measure the management’s
efficiency in using available assetsa) Stock turnover ratio/Inventory turnover ratio
Every business should operate both to keep its stock to as low a figure as
possible without losing profitability, and to sell its goods as quickly as possible.
The stock turnover ratio measures how well the firm is managing to do these
things and indicates the velocity with which goods move out of the business. In
other words, it indicates the number of time the average stock of finished goods
is turned over or sold during a year.
Interpretation: a stock turnover of 8 times a year is considered ideal. As such,
a stock turnover of 8 times or more than 8 times indicates that more sales are
affected. i.e. the business is expanding, thus there is effective management of
inventory. On the other hand, a stock turnover of less than 8 times means that theconcern has accumulated useable goods. i.e. the business is not prosperous.
Illustration1
Gross profit for product A: FRW 5 with Stock Turnover of 8
The total gross profit: 5 x 8 = FRW 40
If the stock turnover ratio goes up to 10. The gross profit will be 5 x 10 = FRW 50
Note: Average of stock is found by adding opening stock and closing stock anddividing the sum by two.
Illustration 2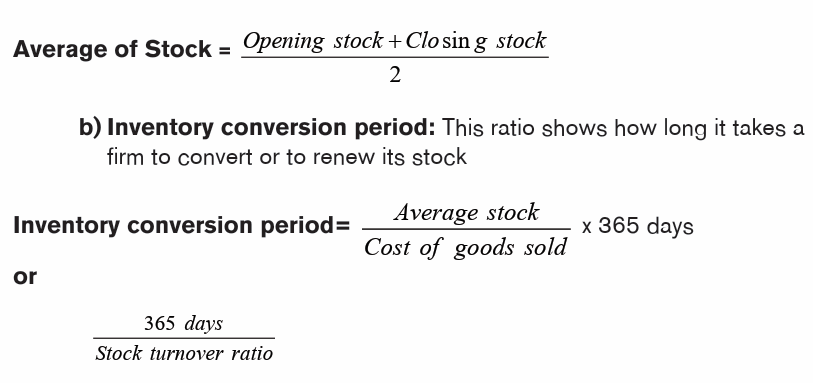
Given that: Opening stock: 300 units at FRW 200 per unit
Purchase account: 2 000 units for FRW 450 000Closing stock: 100 units for FRW 24 000
Determine the:
i. Stock turnover ratio
ii. Inventory conversion periodValue of opening stock: 200 x 300 = FRW60 000
The stock is renewed more of 11 times during the year, after 32 days.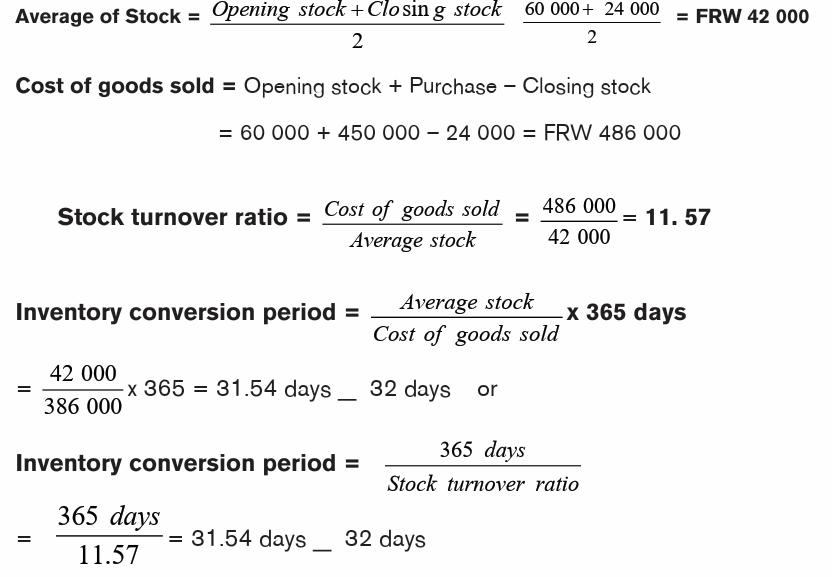
c) Debtors to sales ratio or Debtors’ collection period or Debtors
ratio:
Also called Average collection period (Number of days receivable), thisratio assesses how long it takes for debtors (On average) to pay what they owe.

This ratio is better to judge the quality of the debtors. In short, it indicates the
average period of credit allowed to debtors. It gives the number of days that
debtors (on average) take to pay up; it is debt period.
Interpretation: if the actual period of credit is more than normal period of
credit or ideal period of credit is 30 days, the indication is that credit is not
efficient. On the other hand, if the actual period of credit allowed is less than the
normal period of credit or ideal period of credit, the indication is that the credit
collection is efficient.
Note: Here, the closing balance of debtor’s figure is always used because the
operating balance figure relates to the previous year’s sales. By multiplying by
12 or 52 we may arrive at the credit period in months or weeks.
Two main reasons for the firm to make certain that the debtors pay their accounts
on time:
– The longer a debt is owed, the more likely it will become a bad debt.
– Any payment can be used in the firm as soon as it is received, and so
this increases profitability; it can help reduce expenses. E.g. it wouldreduce a bank overdraft.
d) Creditors to purchases ratio or Creditors’ payment period orCreditor ratio:
e) Cash turnover ratio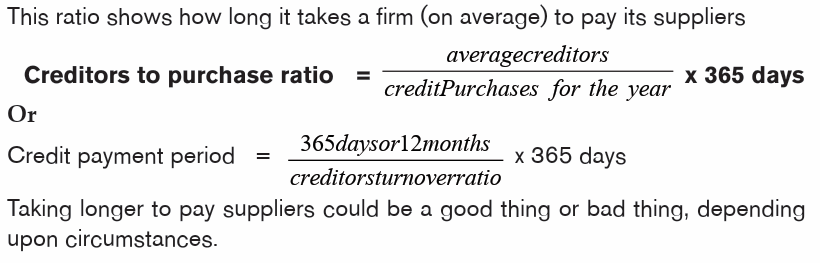
Cash, for this purpose, means cash in hand, cash at bank and readily realizable
investment. Turnover refers to total annual sales (i.e., cash sales plus creditsales.
Use: this ratio indicates the extent to which cash resources are efficiently utilized
by the firm. It is also helpful in determining the liquidity of the concern.
Interpretation: the standard or ideal cash turnover ratio of 10:1. As such, a
cash turnover ratio of 10:1 or more indicates the effective utilization of the cash
resources of the enterprise. On the other hand, a cash turnover ratio of less than
10:1 suggests that cash resources of the enterprise are not effectively utilized.
f) Assets turnover ratio: (This ratio is also called Asset efficiency
ratios) and indicates the efficiency or inefficiency in the use of total
resources or assets of the concern. In other words, it is a measure ofthe overall performance of the business.
Interpretation: A total assets turnover ratio of 2 times or more indicates that
the assets of the concern have been utilized effectively. On the other hand, a
total assets turnover ratio of less than 2 times indicates that the assets of theconcern have been under-utilized.
g) Working capital turnover ratio or sales to working capital ratio
Working capital is the excess of current assets over current liabilities.Turnover means net sales. i.e. total sales less sales returns.
Use: this ratio indicates the efficient or inefficient utilization of the working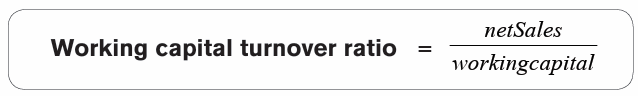
capital of an enterprise.
Interpretation: there is no standard or ideal working capital turnover ratio.
Though there is no standard working capital ratio, one can say that a high
working capital turnover ratio indicates the efficiency and a lower working capital
turnover ratio indicates the inefficiency of the management in the utilization ofworking capital.
h) Sales to net worth ratio or owned Turnover ratio
Use: This ratio is a good index of the utilization of the owner’s funds. It also
indicates over trading (i.e. too much of sales in relation to owners’ capital) or
under- trading (i.e. low sales in relation to owners’ capital). In short, it is a guide
in the proper administration of capital.
Interpretation: if the volume of sales in relation to net worth is reasonable, the
indication is that the owners ‘funds have been effectively utilized.
i) Noncurrent assets turnover ratio (Sales/Fixed Assets ratio): This
ratio indicates as to what extent the fixed assets of a concern have
contributed to sales. In other words, it indicates as to what extent thefixed assets have been utilized.
Interpretation: The standard or ideal fixed assets turnover ratio is 5 times.
So, a fixed assets ratio of 5 times or more indicates better utilization of fixed
assets turnover ratio of less than 5 times is an indicator of underutilization
of fixed assets.j) Current assets turnover ratio
Use: This ratio indicates the contribution of current assets to sales.
Interpretation: There is no standard or ideal current assets turnover ratio. Yet
the inference is that high current assets turnover ratio is an indication of the
better utilization of current assets. On the other hand, the low current assets
turnover ratio suggests that the current assets have not been utilized effectively.
k) Account Receivables/debtors turnover ratio/ debtors velocity
Debtor turnover ratio is the ratio which indicates the relationship between
debtors and sales. It is also the ratio which indicates the number of times thedebts are collected in a year.
Debtors or accounts receivables, for this purpose, is sundry debtors plus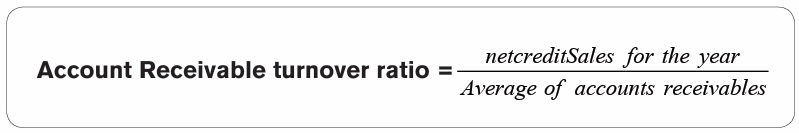
bills receivable. Further, debtors, here mean gross debtors (i.e. debtors before
deducting bad debts and reserve for doubtful debts). Sales here, mean net
credit sales (credit sales-sales returns)
Use: this ratio indicates the extent to which debts have been collected in time.
It also indicates the liquidity of the concern
l) Account payable/creditors turnover ratioThis ratio indicates the rate at which the debt is paid to creditors.
Illustration 3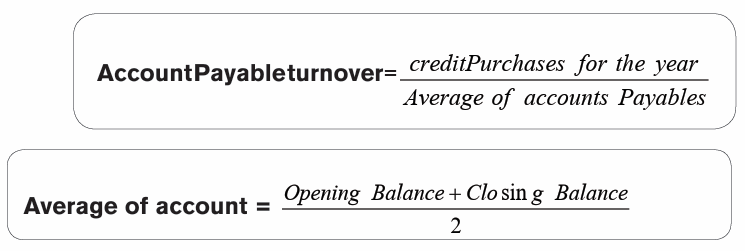
The following information was extracted from IDI’s books for the year ended X:
Sales accounts: FRW 700 000 Purchases account: FRW 550 000
Opening stock: FRW 100 000 Closing stock: FRW 80 000
Debtors account: FRW300 000 Creditors account: FRW 250 000Total Assets: FRW 900 000 Total of noncurrent assets: 60% of Assets


10.2.3 Gearing / leverage/ capital structure ratios / long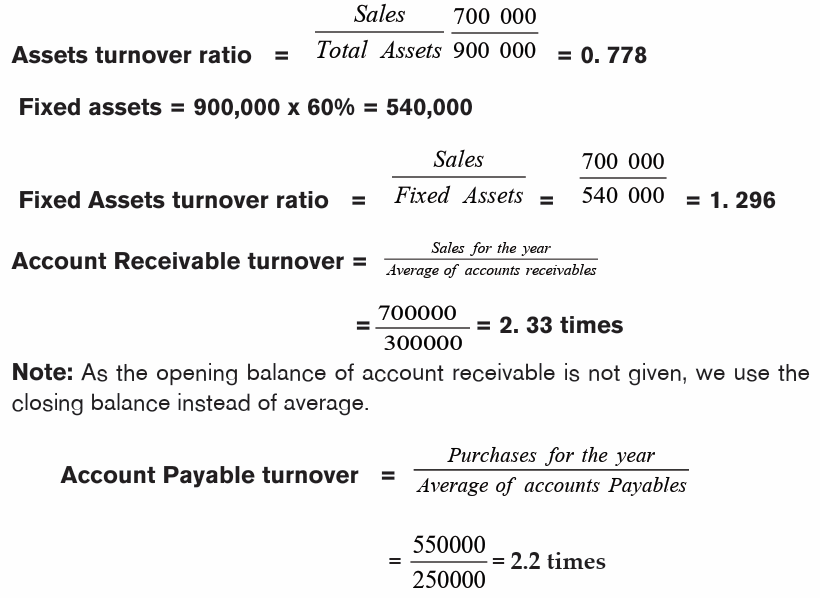
term solvency ratios
These ratios measure the extent to which the firm is financed by liabilities. They
are used to measure long term structure of the company position and its financial
risk. Financial risk is the probability that the firm may not be able to pay its debtsas and when they fall due.
Solvency ratio measure the ability of a company to pay its long term debt and
the interest on that debt.
Solvency versus Liquidity
Liquidity is a measure of the firm’s ability to pay short-term debt whereas
Solvency measure of the firm’s ability to pay all debt, particularly long-term debtand is a measure of the firm’s long-term survival.
It expresses the relationship between the proportions of fixed interest capital
to share capital. A high proportion means a highly geared business (company).
This will mean that shareholders can get more income if the additional loan
capital brings more profit than the interest. This on the other hand means that
the dividends of ordinary shareholders will be fluctuating a lot. It also means that
the company highly depends on non-owners to supply capital.b) Debt ratio (or Debt to Assets ratio)
Measures the proportion of the total assets financed by liabilities. In other words,
this ratio indicates to what extent the liabilities of a firm can be covered by its
economic resources. The higher the ratio, the higher the financial risk
c) Solvency ratioSolvency ratio is a ratio between total assets and total liabilities of a concern.
Uses: The solvency ratio is a measure of the solvency of a concern means the
ability of a concern to meet its total liabilities out of its total assets.
Interpretation: Though no standard ratio, solvency ratio has been established,
one can say that the higher the ratio, the stronger the financial position of theconcern and the lower the ratio the weaker is its financial position.
d) Debt to equity ratio or Leverage ratio
Interpretation: the standard ratio: 2:1. If the debt is less than two times the
equity, the logical conclusion is that the financial structure of the concern is
sound and so the risk of the long term is relatively less and vice-versa.e) Capital structure ratio
A higher CNCAR indicates that it is easier to meet the business debt and credit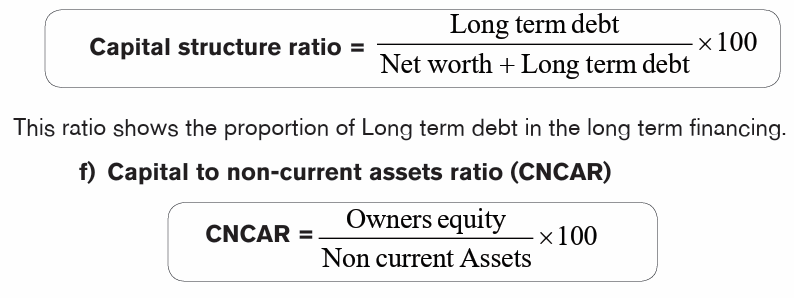
commitment
g) Proprietary/equity/Net worth ratio
Net worth means the excess of total assets over total liabilities. It means
owners’ funds. Total assets include all realizable assets that are all tangible
assets and intangible assets if they can be realized. But goodwill cannot be
included since it cannot be realized before the liquidation of the concern. It iscalculated as follows:
Uses of Net Worth ratio: it indicates the proportion between owned capital
and loaned capital. It is also an index of the amount proprietor invested on total
assets.
Interpretation: The higher the proprietary ratio, the stronger is the financial
position of the concern and vice versa. Generally, a ratio of 5:1 is considered
ideal.
h) Fixed assets to Net Worth ratio
Fixed assets refer to assets which are used in the enterprise permanently.
However, they do not include investments on security. Again, fixed assets mean
Net fixed assets i.e. fixed assets at cost less depreciation.Net worth means owner’s fund
Use: It indicates to what extent the owners have invested funds in the fixed
assets, which constitute the main structure of the business.
Interpretation: the ideal fixed assets to Net Worth ratio for an industrial
undertaking is 67%. That is to mean the fixed assets should not constitute
more than 67% or 2/3 of the owner’s funds. If the fixed assets are more that,
the owner’s funds are mostly sunk in the fixed assets and current assets arefinanced out of loaned funds.
i) Current assets to Net worth ratio
This ratio indicates the proportion of current assets financed by the owners.
Interpretation: The higher ratio indicates the proportion of current assets
financed by the owners.
j) Fixed assets Ratio
It is the ratio between fixed assets and capital employed. Capital employedmeans owner’s funds plus long term loans plus deposits and debentures.
Use: this ratio indicates how the fixed assets of concern have been financed.
Interpretation: the fixed assets ratio should not be more than 1. The standard
ratio is 0.67.
k) Fixed charges cover ratio
It is the ratio between net profit and fixed charges and income tax. Fixed profit for
this purpose means net profit before deducting fixed charges and income tax.Fixed charges mean interests on long term loans and deposits and debentures.
This ratio indicates as to how many times the net profit of the concern covers its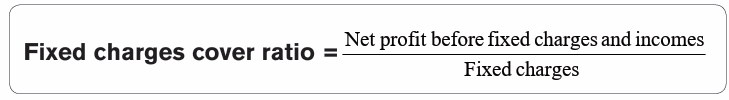
fixed charges. It indicates whether the business would earn sufficient profits topay the interest charges periodically.
l) Dividend coverage ratio
This is the ratio between disposable profit and dividend. Disposable profit
means net profit after deducting interest on long-term borrowings and incometax. In short, it means final net profit available for dividend.
Use: this ratio indicates the ability of the concern to maintain the dividend on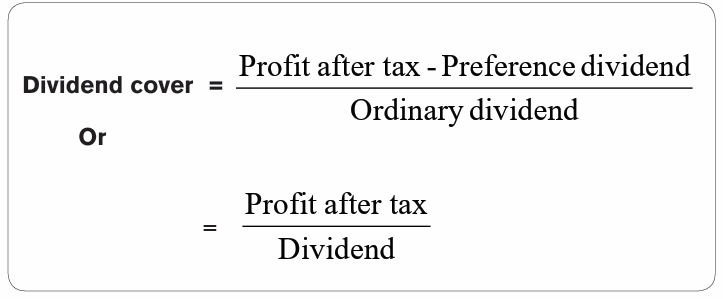
shares in the future.
Interpretation: if the dividend declared is adequately covered by the disposable
profit, the indication is that there is sufficient amount of retained profit and so,
slight variations in profits in the future will not disturb the amount of dividend in
the future and vice –versa. i.e. The higher the number of times the better for theenterprise.
Illustration 1
The list of accounts balance of MMM is given in the following table
1. Calculate the Gearing/ leverage / capital structure ratios
(Sales 5,000,000 FRW; Purchases: 1,000,000 FRW, Closing stock600,000 FRW)
Illustration 2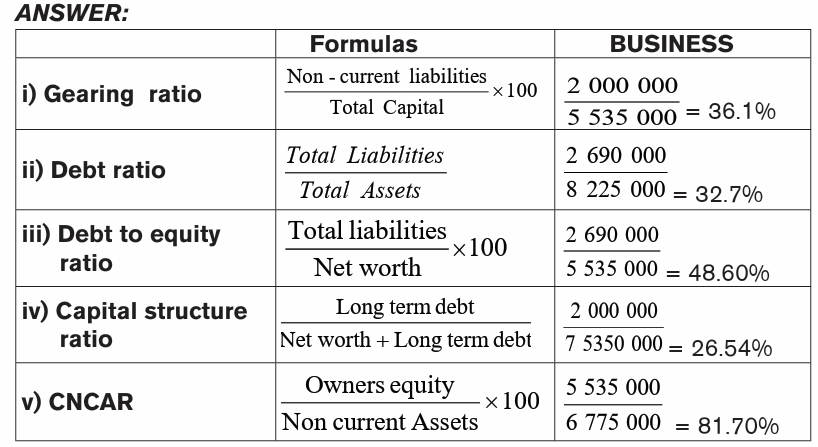
The following is the Balance sheets (In FRW) of Maria
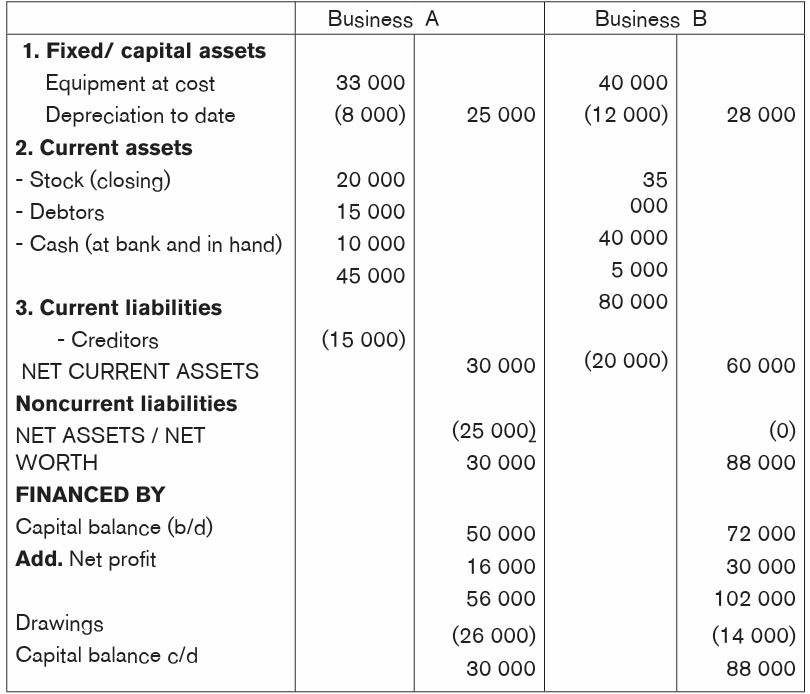
Required: Calculate the Gearing/ leverage / capital structure ratio
10.2.4 Profitability ratios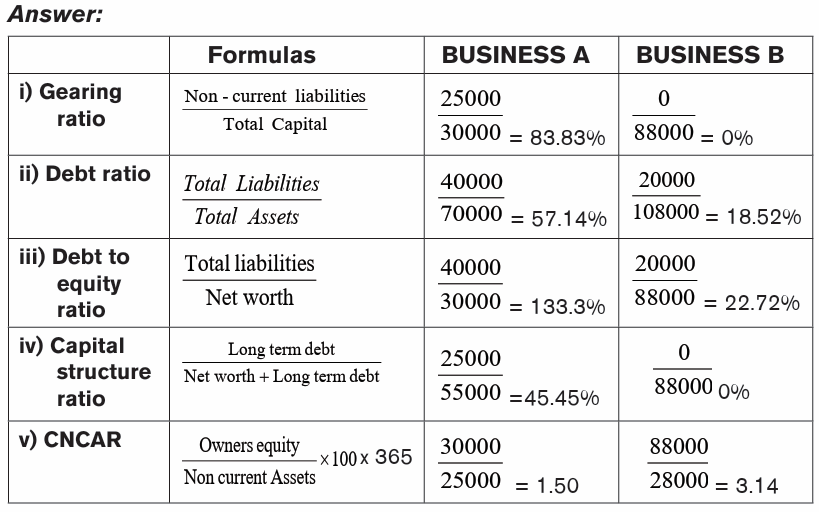
These are ratios which measure the profitability of a concern. In other words,
there are ratios which reveal the effect of the business transactions on the
profit position of an enterprise and indicate how far the enterprise has beensuccessful in its aim.
i) Gross profit margin
This is the ratio of profits to sales. It assesses the business level and adequateof profits earned and their stability. The gross profit margin is expressed as:
Gross profit is the profit that a concern earns on its trading. In other words, it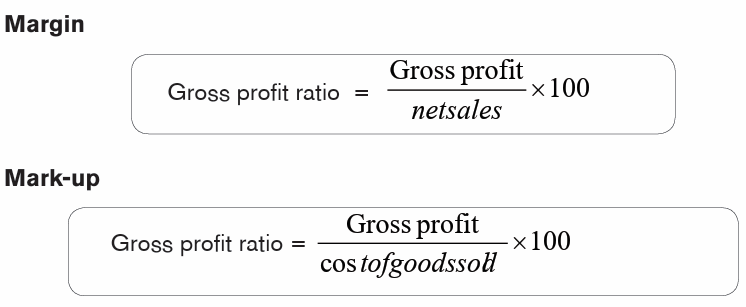
is the excess of the net sales over the cost of goods sold.
Sales refer to total sales, i.e. cash sales plus credit sales, but they represent net
sales, i.e. total sales minus sales returns.
Use: this ratio discloses the gross result of trading or the overall margin within
which a business undertaking must limit its operating expenses to earn sufficient
profit.
Interpretation: the actual gross profit ratio is compared with gross profit ratio
of the previous years and those of other concerns carrying on similar business,
when it is high, it is indication of good results and vice-versa.ii) Net profit ratio
Net profit means final balance of operating and non-operating incomes after
meeting all expenses. Sales means total sales, but net sales i.e. total sales
minus sales returns
Use: this ratio indicates the quantum of profit earned by a concern.
Interpretation: A high net profit ratio indicates that the profitability of the
concern is good. On the other hand, a low net ratio indicates that profitability is
poor.iii) Operating ratio or operating cost ratio
Operating cost refers to all expenses incurred for operating or running a
business. It comprises cost of goods sold plus operating expenses and selling
and distribution expenses. Sales refer to net sales. i.e. total sales minus sales
returns.
Use: the operating ratio indicates the efficiency of the management in the
conduct of the business.
Interpretation: a low operating ratio is an indication of an operating efficiency
of the business.
iv) Expenses ratio
Expenses ratios are ratios which supplement the information given by the
operating cost ratio. They are the ratios between expenses and sales. Some ofthe important expenses ratios are:
Interpretation: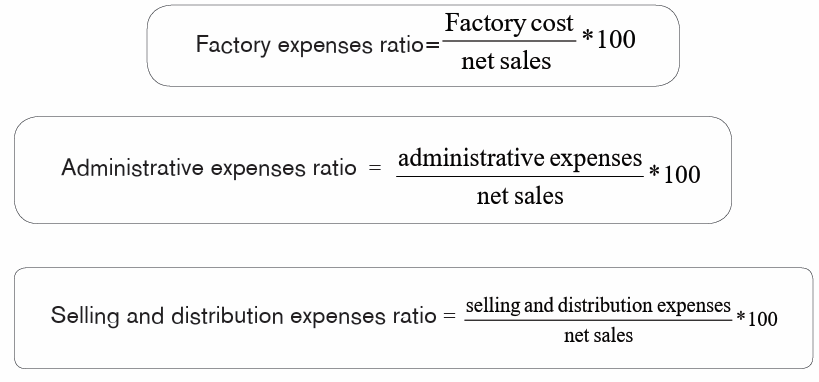
a) A low factory ratio is an indication of the economy and the efficiency
in the manufacturing operations of the firm. On the other hand, a
high factory expenses ratio is an indication of the inefficiency in the
manufacturing process of the enterprise.
b) A low administrative expense ratio is an indication of the economy and
the efficiency in the general administration of the concern and viceversa.
c) A low selling and distribution expenses and vice versa.
v) Operating profit ratio
Operating profit ratio is the excess of net sales over the operating cost.
Alternatively, it is the net profit plus non-operating expenses minus operatingincomes.
Interpretation: The standard o ideal operating profit ratio of 10% or more is an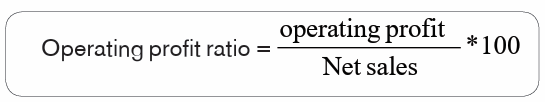
indication of the operating efficiency of the business, and vice-versa.
vi) Return on total Resources ratio
Return, here, means net profit after taxes, i.e. final profit.
Total resources or total assets mean all realizable assets, including intangible,if they are realizable.
Use: This ratio measures the productivity of the total resources or assets of a
concern. In other words, it indicates the profitability of the business.
Interpretation: a return of 10% is normally considered as an ideal ratio. As such,
if the actual ratio is 10% or more, it is an indication of the higher productivity of
the resources on the other hand, a return of less than 10% is an indication of
lower productivity of the resources.
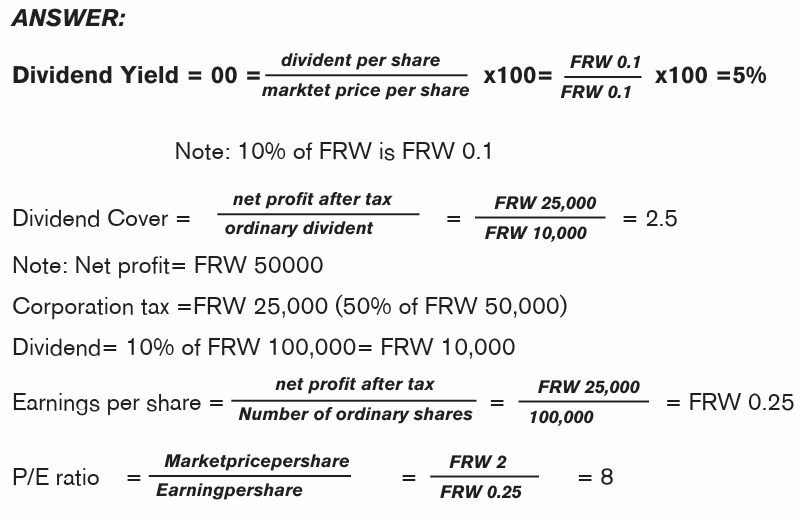
vii) Returns on capital employed (ROCE) or Return on Investment
Ratio (ROI)
ROCE or ROI is the ratio between return on capital employed and capitalemployed
Return on capital employed means operating profit or net profit before
deducting interests and taxes
Capital employed refers to total long-term funds employed in the business.
This ratio indicates the overall profitability of the business. Since it reveals the
productivity of the capital employed in the business. Capital employed here
means investments made outside the business-fictious assets.
Interpretation: the standard or ideal return on capital employed ratio is about
16%. So if the actual ratio is equal to or more than 16% it is an indication of
higher productivity of the capital employed.
Use: this ratio is the measure of the productivity.viii) Return On Equity Ratio (ROE)
Net worth here means all types of share capital + accumulated resources and
profits-all losses and fictious assets.
Use: This ratio is a measure of the productivity of shareholders’ funds. It also
gives the shareholders an idea of the return on their funds. It is also useful for
inter-firm and inter-industry comparisons.
Interpretation: the standard or ideal net profit to net worth ratio is about 13%or
more. It is an indication of good return on shareholders’ funds it influences the
market price of the equity shares.ix) Return on Equity Capital ratio or Net profit to Equity Capital
Net profit: Net profit after deducting taxes and preference dividends or net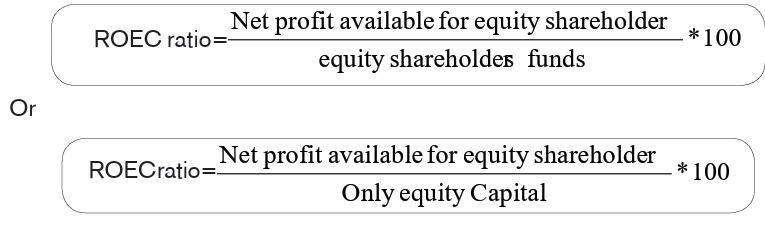
profit available for equity shareholders.
Equity capital is interpreted in two ways. Some authors take equity capital to
mean only equity share capital. Other take equity shareholders’ funds (i.e. equity
share capital plus all accumulated reserves and profits minus all losses andfictious assets.
Use: this ratio is a measure of the productivity of equity capital. It is a satisfactory
measure of the profitability of the eEnterprise from the point of view of equityshareholders.
Interpretation: there is no standard or ideal net profit to equity capital ratio.
So, the actual net profit to equity capital ratio is compared with those othersimilar concern and the productivity of equity capital is determined.
x) Debt-service coverage ratio (DSCR)
1. In corporate finance, it is the amount of cash flow available to meet annual
interest and principal payments on debt, including sinking fund payments.
2. In government finance, it is the amount of export earnings needed to meet
annual interest and principal payments on a country’s external debts.
3. In personal finance, it is a ratio used by bank loan officers in determining
income property loans.
This ratio should ideally be over 1. That would mean the property is generatingenough income to pay its debt obligations. In general, it is calculated by:
A DSCR of less than 1 would mean a negative cash flow. A DSCR of less
than 1, say .95, would mean that there is only enough net operating income to
cover 95% of annual debt payments.
For example, in the context of personal finance, this would mean that the
borrower would have to delve into his or her personal funds every month to keep
the project afloat. Generally, lenders frown on a negative cash flow, but some
allow it if the borrower has strong outside income.
Debt-service refers to the cash that is required for a particular time period to
cover the repayment of interest and principal on a debt.
Sinking funds: a means of repaying funds that were borrowed through a bondissue.
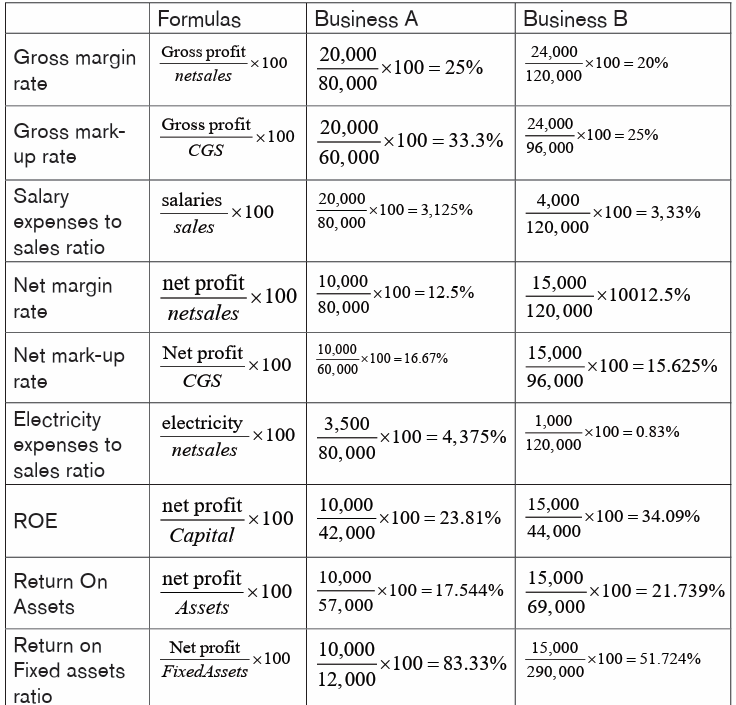
IllustrationThe following are the Final accounts for two similar types of business:
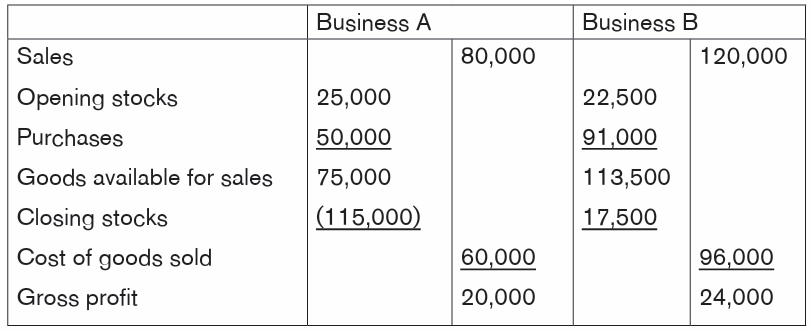
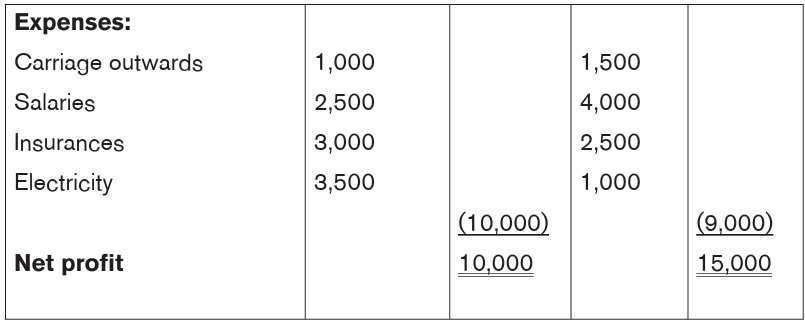
Balance Sheets (in FRW)
You are required to calculate:
a) Gross margin rate
b) Gross mark-up ratio
c) Salaries expenses to sale ratio
d) Net margin ratio
e) Net mark-up ratio
f) Electricity expense to sales ratio
g) Return on Equity ratio
h) Return on Assets
i) Return on Fixed assets
j) Return on Capital Employed ratio (ROCE)Solution
10.2.5 Shareholders ratios/growth and valuation ratios/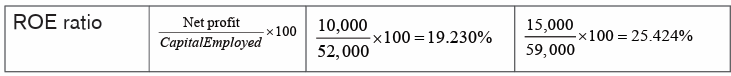
defensive and survival ratiosi) Earnings per share (EPS)
Use: the EPS ratio assesses the relationship of operating profit after tax, interest
on loan capital and preference dividend, to the number of shares issued as fully
paid up. It shows the amount of earnings applicable to a share of ordinary equity.
Interpretation: the more the earning per share, the better is the performance
and the future prospects of the company. Higher earnings per share suggest
the possibility of more cash dividend or bonus shares and a rise in the market
price of share.ii) Dividend per share (DPS)
The higher the ratio, the more profitable the enterprise.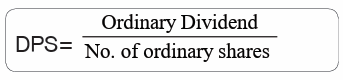
iii) Dividend yield
Use: this is the ratio of dividend paid by the business enterprise per share to the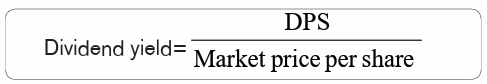
market price per each share of the business.
Interpretation: the actual dividend yield ratio of the company in question
should be compared with the dividend yield ratios of other similar companies.
If the dividend yield ratio of the company in question is more than that of other
similar companies, it is an indication to the investor that it is worth investing on
the shares of the company in the question.iv) Price earnings ratio (P/E ratio)
This ratio assesses the ongoing financial performance of company from year to
year. It shows the profit earning capacity of a business. It indicates the number
of times the earning per share is covered by its market price. It is very useful toan investor for predicting the market price of shares at some future date.
Interpretation: the higher the price earnings ratio, the better are the chances
of appreciation in the market price of share.v) Dividend payout ratio/ payout ratio
Use: it throws light on the chance of appreciation, in the price of the shares.
Interpretation: a low payout ratio indicates that only a small portion of the
earning of the company has been used for dividend and the major portion of
the earnings is retained for ploughing back and vice versa. A low payment ratio
suggests that there are good chances of appreciation in the prices of shares.
vi) Preference Dividend cover
Use: the EDC indicates the number of times the equity dividend paid is covered
by the profits available for equity shareholders. It indicates the degree of certainty
of declaration of equity dividend in future years also.
Interpretation: the standard equity dividend cover is two times. As such, if the
equity dividend cover is more, the indication is that there is a greater degree of
certainty that equity dividend will be declared in the future years also; and vice versa.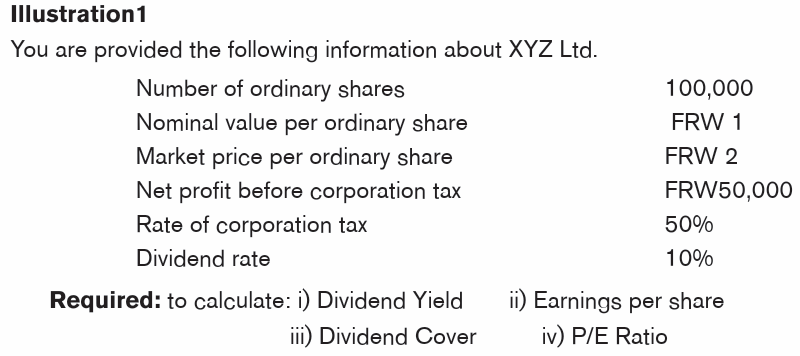
Limitations of ratio analysis
Ratio analysis is not foolproof. There are many problems in trying to identify
trends and make comparisons. Below are just a few.
• Information problems
– The base information is often out of date, so timeliness of information
leads to problems of interpretation.
– Historical cost information cost information may not be the most
appropriate information for the decision for which the analysis is being
undertaken.
– Information in published accounts is generally summarized information
and detailed information may be needed.
– Analysis of accounting information only identifies symptoms, not causes,
and is therefore of limited use.
• Comparison problems: trend analysis
– Effects of price changes make comparisons difficult unless adjustments
are made.
– Impacts of changes in technology on the price of assets, the likely
return and the future markets.
– Impacts of a changing environment on the results reflected in the
accounting information.
– Potential effects of changes in accounting policies on the reported
results
– Problems associated with establishing a normal base year with which
to compare other years.
• Comparison problems: across companies
– Selection of industry norms and the usefulness of norms based on
averages
– Different firms having different financial and business risk profiles and
the impact on analysis.
– Different firms using different accounting policies
– Impacts of the size of the business and its comparators on risk, structure
and returns.
– Impacts of different environments on results, eg different countries orhome-based versus multinational firms.
Application activity 10.2
1) The ratio has increased in 2018 compared to 2017 because we
have increased the length of time allowed for customers to pay their
invoices. The statement above could explain a decrease in which of
the following ratios?
i. The receivables collection period
ii. The gearing ratio
iii. Interest cover
iv. The payables payment period2) The following information for Christian Ltd is available
Christian Ltd purchased new non-current assets during the year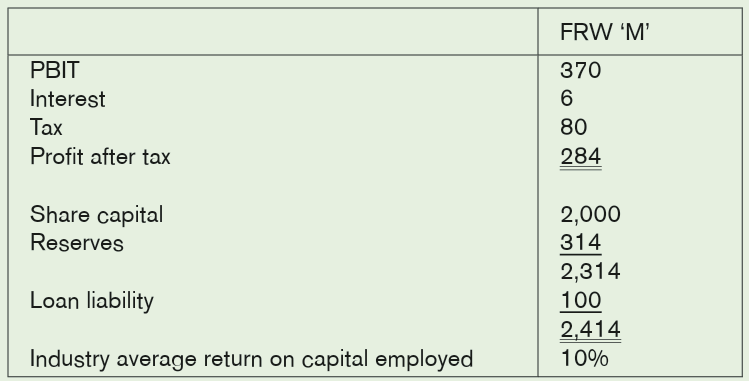
Required: calculate and comment on ROCE for Christian Ltd
Skills Lab
Carry out a visit in any company, ask for their financial statements and
interpret them based on different categories of financial ratios.
End unit assessment
Given below is a range of financial ratios for two companies that bothoperates nearby your school:
Required: Comment upon what the ratios indicate about each business
One of the businesses is a supermarket and the other is jeweler who
supplies some goods on credit to long standing customers. Identify whichbusiness.
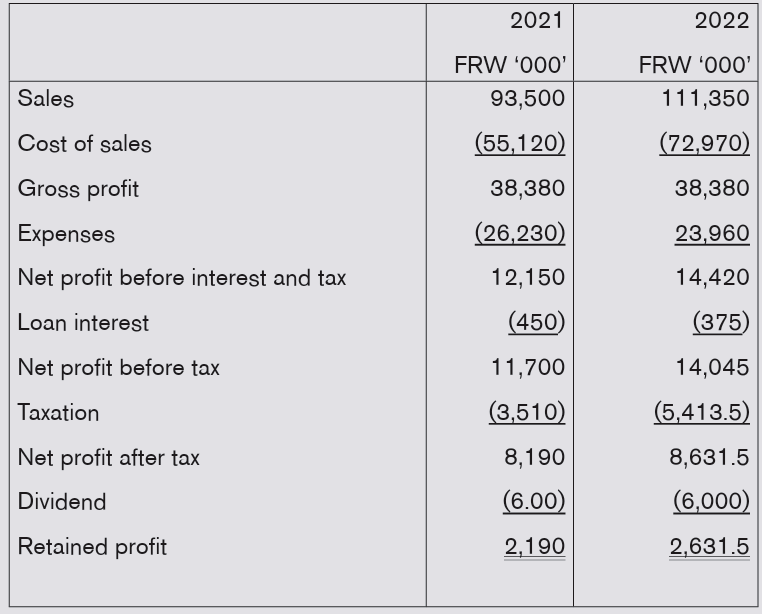
2. The following are summarized financial statements of DAMIAN
Limited:
DAMIAN LimitedStatement of Profit or Loss for the year ended 31 October
Balance sheet as at 31 October
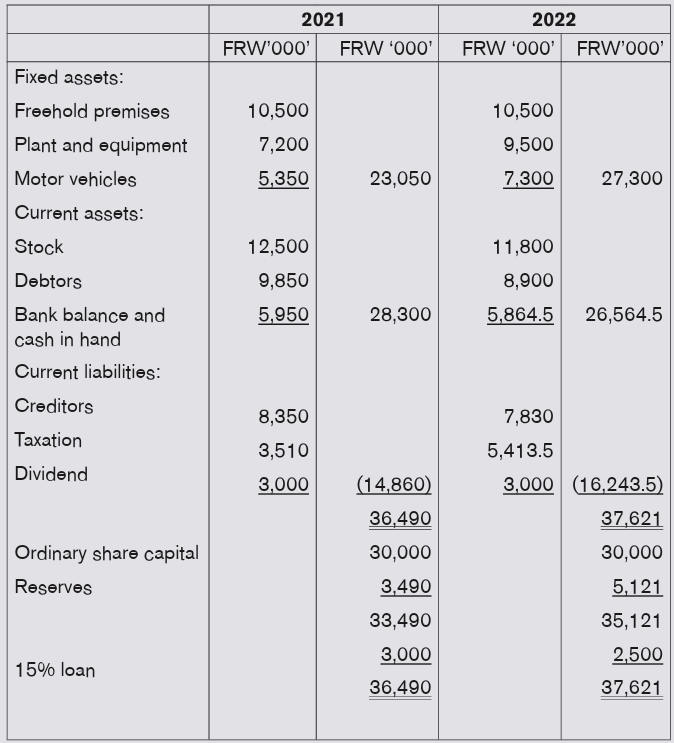
Note:
1. 80% of the sales are no credit2. The stock as at 31 October 2001 was valued at FRW 13,000,000
REQUIRED:
Calculate two ratios for each classification identified below for the financial
years ended 31 October 2021 and 2022:
i) Profitability
ii) Liquidity ratios
iii) Gearing ratiosiv) Activity ratios
REFERENCE
Jin, Z. (2010). Accounting for nonprofit organizations: a case study of British
Red Cross (Master’s thesis).
Belverd E.D. (2011). Principles of Financial Accounting (11th edition). USA:
Cengage learning.
Donna, R.H., Charles. T., Sundem, G.L., Gary L. & Elliott, J. A. (2006).
Introduction to Financial Accounting (9th edition). Prentice-Hall.
Asiimwe, H. M. (2009). Mk Fundamental Economics. Kampala: MK Publishers
Ltd.
ICPAR (2018). Certified Accounting Technician (CAT) Stage 1, Recording
Financial Transactions (First edition). London: BPP Learning Media Ltd.
ICPAR (2018). Certified Accounting Technician (CAT) Stage 2, Preparation
of basic accounts (First edition). London: BPP Learning Media Ltd.
ICPAR (2018). Certified Accounting Technician (CAT) Stage 3, Financial
Accounting (First edition). London: BPP Learning Media Ltd.
Kimuda, D. W (2008). Foundations of accounting. kampala: East African
Education Publishers Ltd.
Marriot, P., Edwards, J.R., & Mellet, H.J (2002). Introduction to accounting (3rd
edition). London: Sage publications.
Mukasa, H. (2008). New Comprehensive Accounting for Schools and
Colleges (first edition). Kampala.
Needles, B. E. (2011). Principles of Financial Accounting. Northwestern:
Cengage Learning.
Omonuk, J.B. (1999). Fundamental Accounting for Business: Practical
Emphasis. Makerere Universty of University of Business School,
Kampala: Joseph Ben Omonuk.
Roman, L.W., Katherine, S. & Jennifer, F. (2010). Financial Accounting: An
introduction to concepts, methods, and uses (14th edition). USA:
Cengage Learning.
Saleemi, N.A. (1991). Financial Accounting Simplified. KENYA.
Sangster, F. W. (2005). Business Accounting. London: Prentice Hall.
Uwaramutse, C. (2019). Financial Accounting I. University of Lay Adventist of
Kigali (UNILAK). Kigali.
Weygandt, J.J, Kimmel, P.D. & Kieso, D.E. (2009) Accounting Principles (9th
Edition). USA: John Wiley & Sons.
Wood, F. & Sangster, A. (2005). Business Accounting 1 (10th edition). UK:
Prentice-Hall.
Wood, F. & Sangster, A. (2005). Business Accounting 2 (10th edition). UK:
Prentice-Hall.
IFRS Online navigator-
https:https://www.ifrs.org/issued-standards/list-of-standards/?language=en&;
year=2022&issue-type=%2Fcontent%2Fcq%3Atags%2Fifrs%2Fproduction%2Fissue-type%2Fissued