General
- Mathematics Y1 SB ECLPE File Uploaded 1/11/21, 16:05
- Mathematics Y1 TG ECLPE File Uploaded 1/11/21, 16:07
UNIT 2: SET THEORY
Key Unit competence: Solve problems that involve Sets operations, using Venn diagram.
2.0. Introductory Activity 2
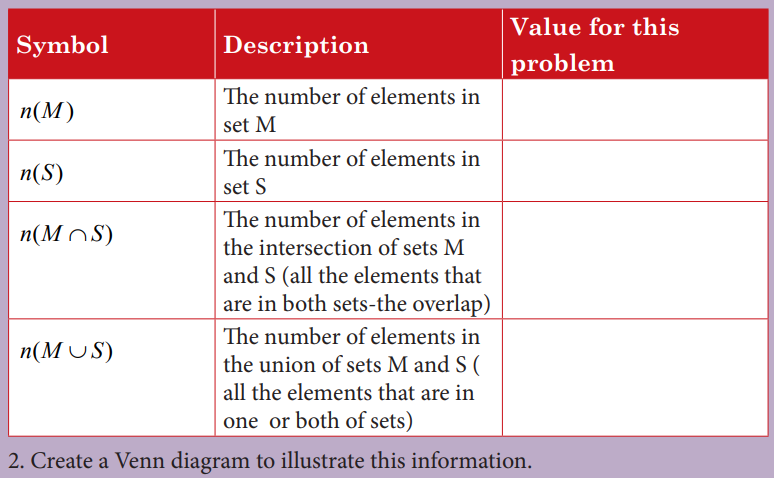
At a TTC school of 500 students-teachers, there are 125 students enrolled in Mathematics club, 257 students who play sports and 52 students that are enrolled in Mathematics club and play sports.
If M stands for the set of students in Mathematics club, S stands for the set of students in Sports and U stands for all students at the school or universal set,
1. Complete the following table
2.1 Sets and Venn diagrams
Activity 2.1
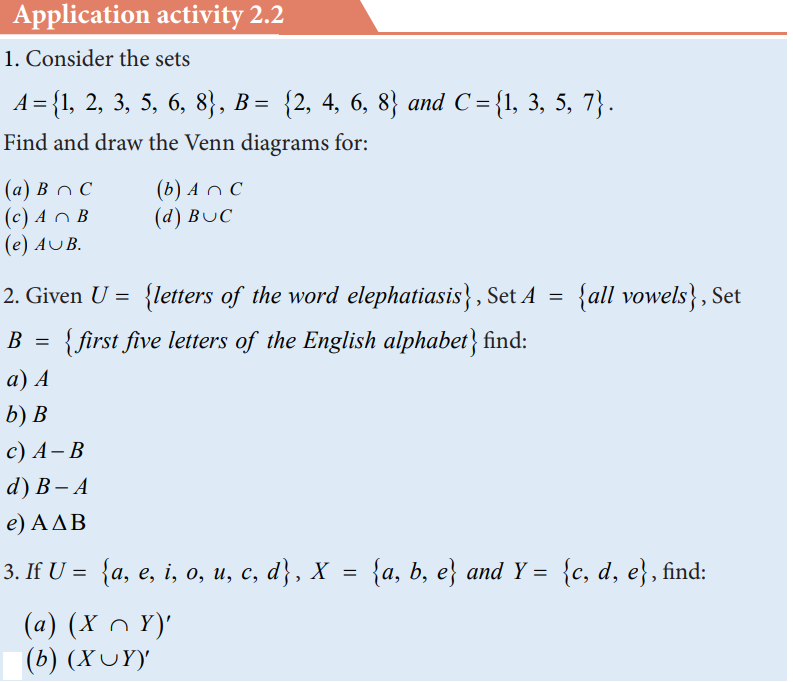
Given set A = { 1, 3, 5, 7, 9 } and B = { 1, 2, 3, 4, 5 },
• Identify common elements for both sets.
• Determine elements of set A which are not in set B
• Determine elements of set B which are not in set A
• Determine all elements in set A and set B
• Represent elements of set A in a Venn diagram
• Represent elements of set B in a Venn diagram
• Represent elements of sets A and B using one Venn diagram
CONTENT SUMMARY
A well-defined collection of objects is called a set. Each member of a set is called an element. All elements of a set follow a certain rule and share a common property amongst them.
A set that contains all the elements and sets in a given scenario is called a Universal Set (U).
Venn Diagrams consist of closed shapes, generally circles, which represent sets. The capital letter outside the circle denotes the name of the set while the small letters inside the circle denote the elements of the set.
The various operations of sets are represented by partial or complete overlap of these closed figures. Regions of overlap represent elements that are shared by sets.
In practice, sets are generally represented by circles. The universal set is represented by a rectangle that encloses all other sets.
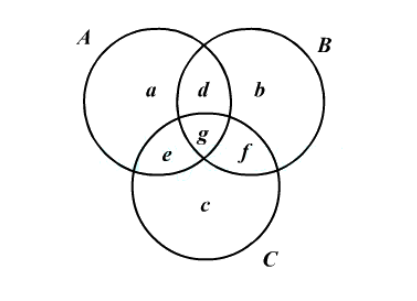
The given figure is a representation of a Venn diagram. Here each of the
circles A, B and C represents a set of elements.
• Set A has the elements a, d, e and g.
• Set B has the elements b, d, g and f.
• Set C has the elements e, g, f and c.
• Both A and B have the elements d and g.
• Both B and C have the elements g and f.
• Both C and A have the elements e and g.
• A, B and C all have the element g.
The circular pattern used to represent a set and its elements is called a Venn diagram.Venn diagrams are an efficient way of representing and analysing sets and performing set operations. As such, the usage of Venn diagrams is just the elaboration of a solving technique. Problems that are solved using Venn diagrams are essentially problems based on sets and set operations.
Example
1. Given set A= {2, 4, 5, 7, 8}, represent set A on a Venn diagram.
Solution
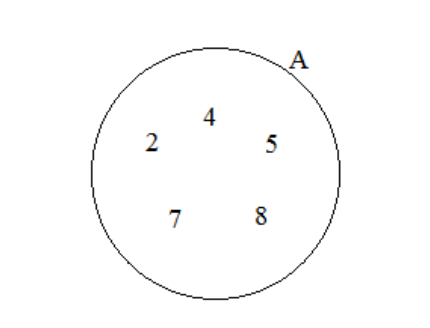
First, express the data in terms of set notation and then fill the data in the Venn diagram for easy solution.
When drawing Venn diagrams, some important facts like “intersection”, “union” and “complement” should be well considered and represented.
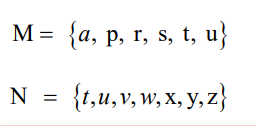
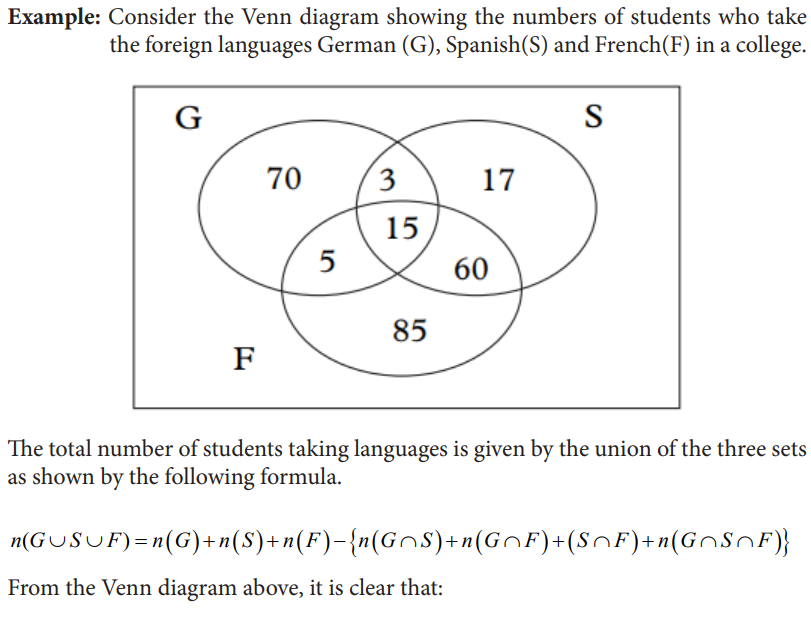
Example: Consider the Venn diagram below.
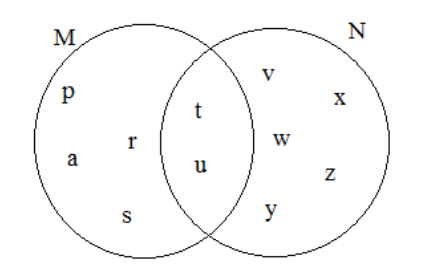
List the elements of set M and N.
Solution
Application activity 2.1
Consider these two sets A = {2,4,6,8,10 ] and B = { 2,3,5,7} . Represent them in a Venn diagram
2.2 Operations of Sets
Activity 2.2
Consider a class of students that form the universal set. Set A is the set of all students who were present in the English class, while Set B is the set of all the students who were present in the History class. It is obvious that there were students who were present in both classes as well as those who were not present in either of the two classes. The shaded part shows the elements which are considered in the diagram.
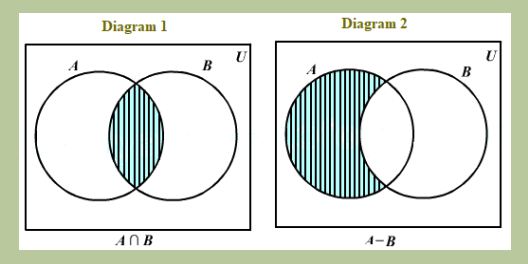
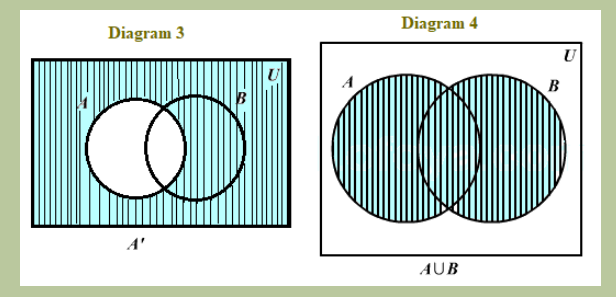
Observe the diagrams and identify which one to represent the following:
• All students who were absent in the English class
• All students who were present in at least one of the two classes.
• All the students who were present for both English as well as History classes.
• All the students who have attended only the English class and not the History class
• All the students who have attended just the History class and not the English class.
CONTENT SUMMARY
From the activity, we realize that two or more sets can be represented using one Venn diagram and from the representations, different sets can be determined. To determine those sets, one may perform different operations on sets such as:
• Intersection of sets
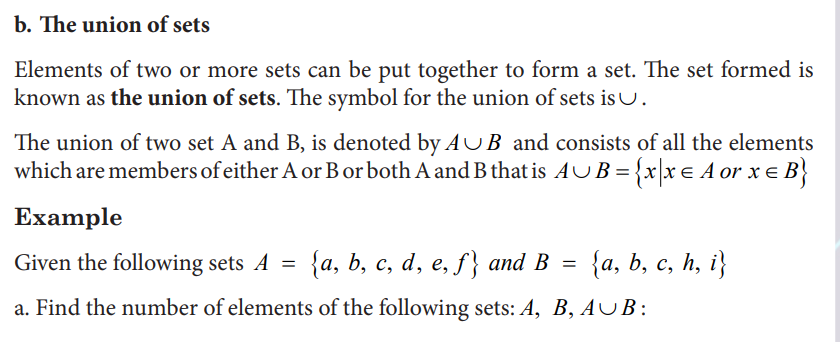
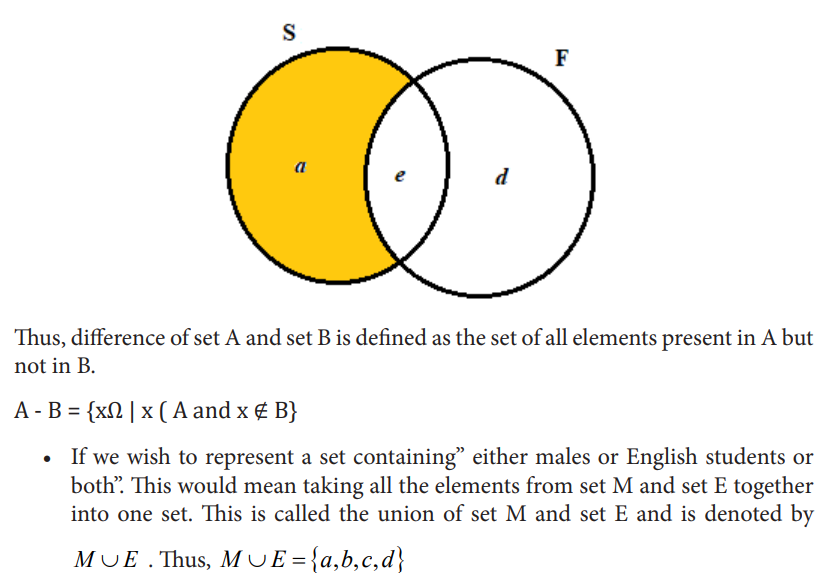
• Union of sets
• Universal sets
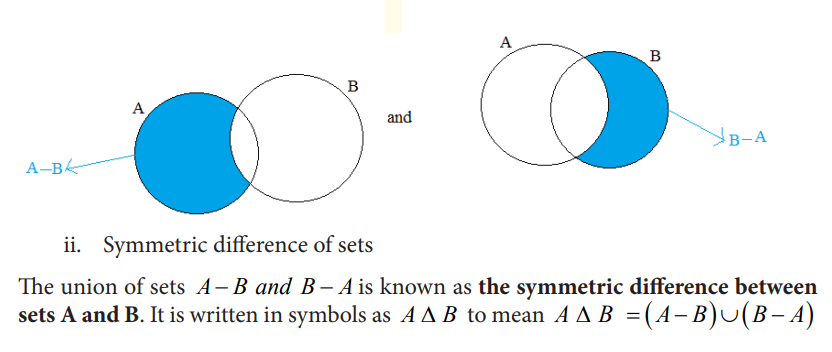
• Simple difference of sets
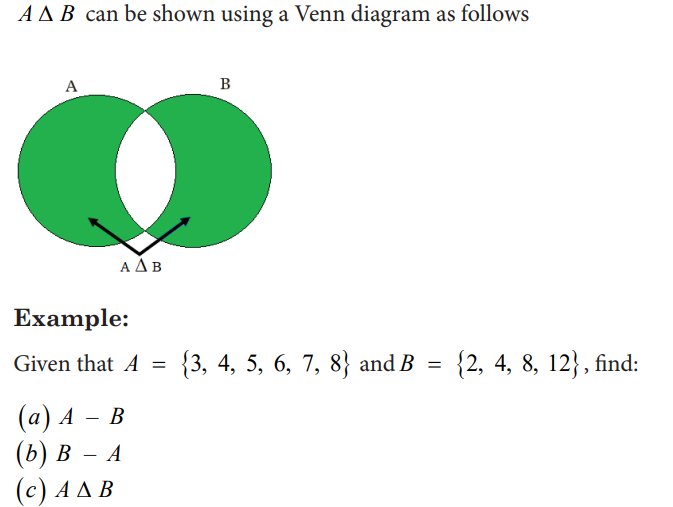
• Symmetric difference of sets
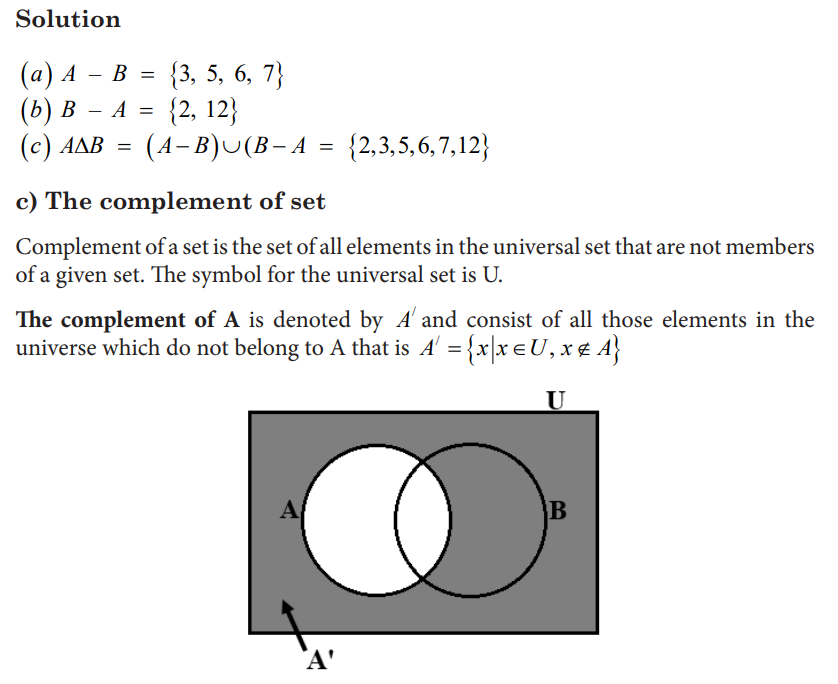
• Complement of sets
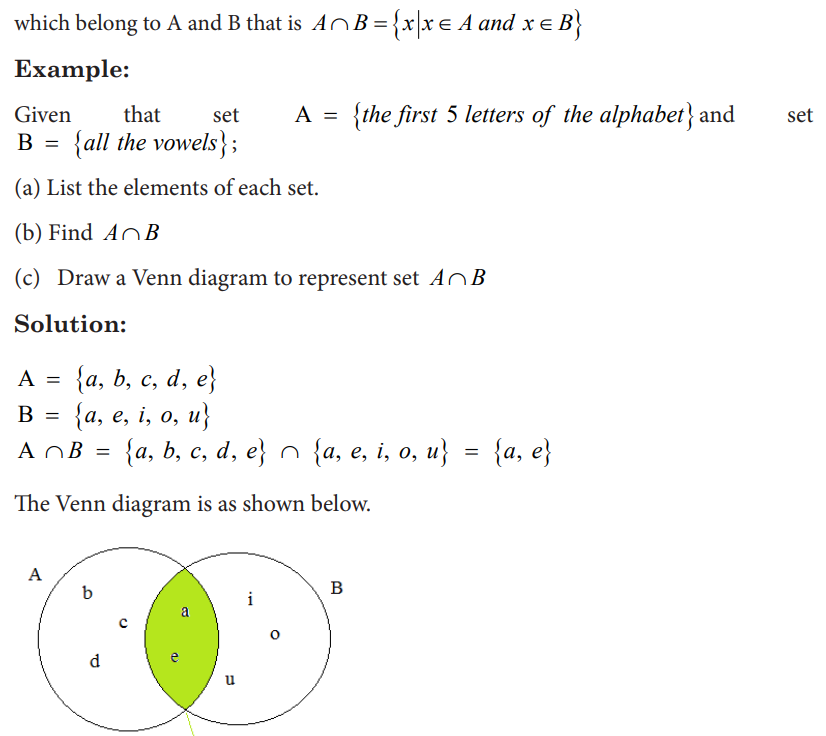
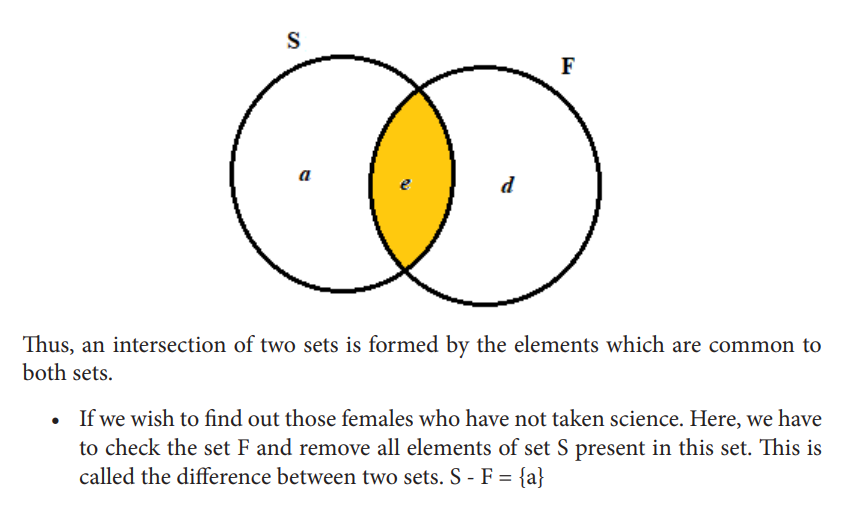
a. The intersection of sets
The common elements which appear in two or more sets form the intersection of sets. The symbol used to denote the intersection of sets is∩ . The intersection of sets A and B is denoted by A ∩ B and consist of those elements
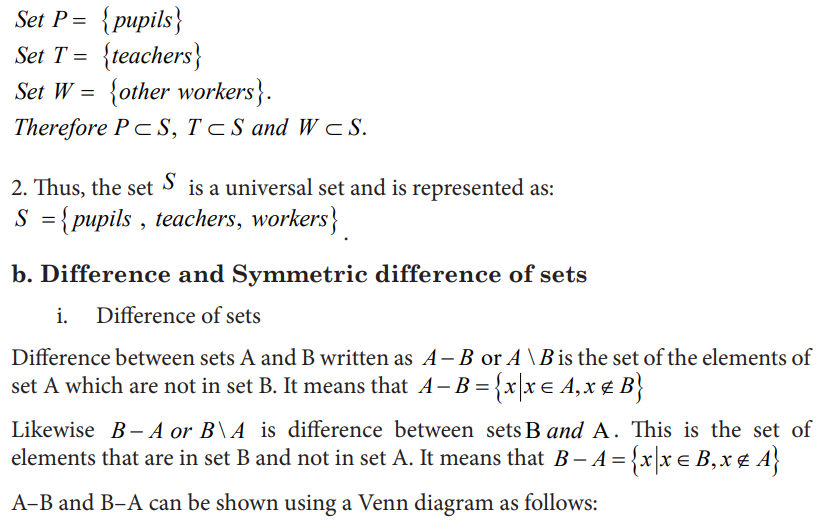
a) Universal set
A set that contains all the subsets under consideration is known as a universal set. A Universal set is denoted by the symbolU .
Example
Consider a school in which one can find various categories of people such as pupils, teachers and other workers or staff.
1. Use S to represent the set of people in a school.
2. Write all the subsets of S.
Solution
1. We can present the set of all people in the school with sets as follows:
Set S pupils teachers workers = { ,, . }
Thus, set S contains all the subsets of the various categories of people in the school.
Let us use sets P, T and W to represent the subsets of set S.
2.3 Analysis, interpretation and presentation of a problem using Venn diagram
Activity 2.3
1. A survey was carried out in a shop to find the number of customers who bought bread or milk or both or neither. Out of a total of 79 customers for the day, 52 bought milk, 32 bought bread and 15 bought neither.
a. Without using a Venn diagram, find the number of customers who:
i. bought bread and milk
ii. bought bread only
iii. bought milk only
b. With the aid of a Venn diagram, work out questions (i), (ii) and (iii) in (a) above.
c. Which of the methods in (a) and (b) above is easier to work with? Give reasons for your answer.
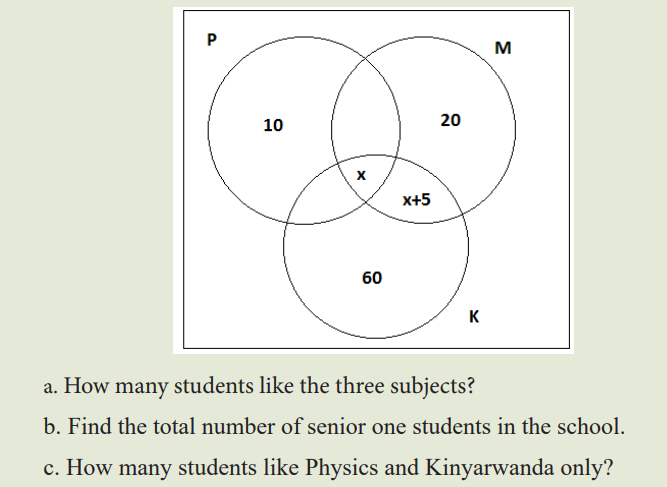
2. The Venn diagram below shows the number of senior one students in a school who like Mathematics (M), Physics (P) and Kinyarwanda (K). Some like more than one subject in total 55 students like Mathematics.
CONTENT SUMMARY
1. Venn diagrams are great for comparing things in a visual manner and to quickly identify overlaps. They are diagrams containing circles that show the logical relations between a collection of sets or groups
Venn diagrams are used in many areas of life where people need to categorize or group items, as well as compare and contrast different items. Although Venn diagrams are primarily a thinking tool, they can also be used for assessment. However, students must already be familiar with them.
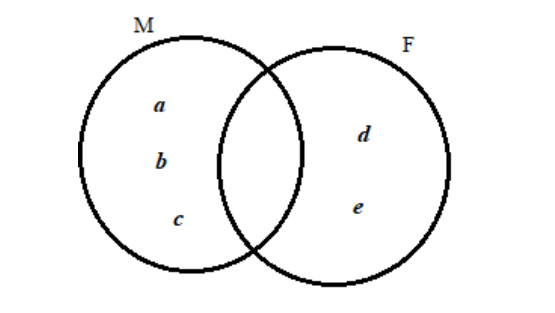
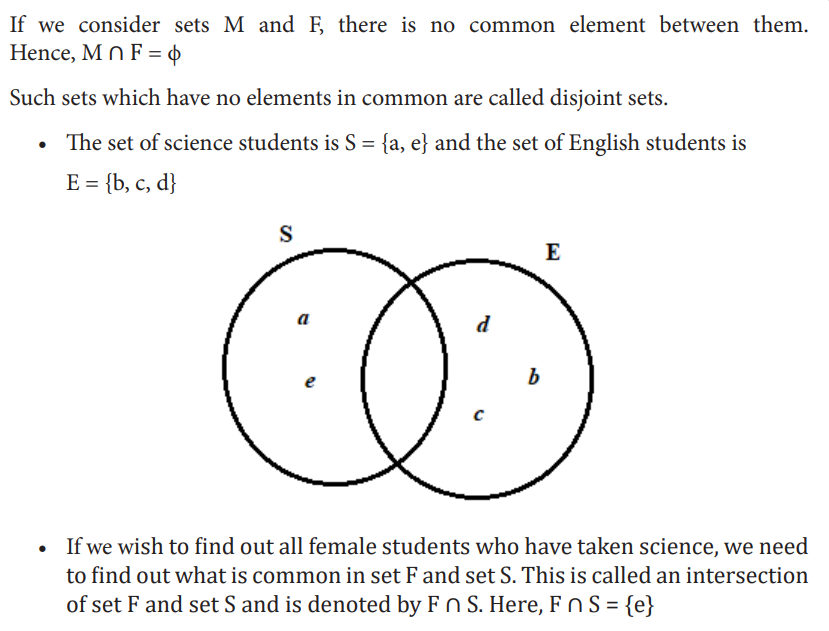
Example: In a room, there are 5 people a, b, c, d, e. Out of them, a, b and c are Males while d and e are Females. Also, a and e study science while b, c and d study English. The set of males is M = {a, b, c} and the set of females is F = {d, e}

2.4. Modelling and solving problems involve Set operations using Venn diagram
Activity 2.4
A survey was carried out in Kigali. 50 people were asked about their preferred hotel for taking lunch among Hilltop, Serena and Lemigo hotels. It was found out that 15 people ate at Hilltop, 30 people ate at Serena, 19 people ate at Lemigo, 8 people ate at Hilltop and Serena, 12 people ate at Hilltop and Lemigo, 7 people ate at Serena and Lemigo. 5 people ate at Hilltop, Serena, and Lemigo.
a. Model the problem using variables and represent the information on a Venn diagram.
b. How many people ate at Hilltop?
c. How many ate at Hilltop and Serena but not at Lemigo?
d. How many people did not eat from any of these three hotels?
CONTENT SUMMARY
Pictorial representations of sets represented by closed figures are called set diagrams or Venn diagrams and they are used to illustrate various operations like union and intersection. A Mathematician John Venn introduced the concept of representing the sets
pictorially by means of closed geometrical figures called Venn diagrams. In Venn diagrams, the Universal Set U is represented by a rectangle and all other sets under consideration by circles within the rectangle. Venn diagrams are useful in solving simple logical problems.
A Venn Diagram is an illustration that shows logical relationships between two or more sets (grouping items). Venn diagram uses circles (both overlapping and non-overlapping) or other shapes. Commonly, Venn diagrams show how given items are similar and different.
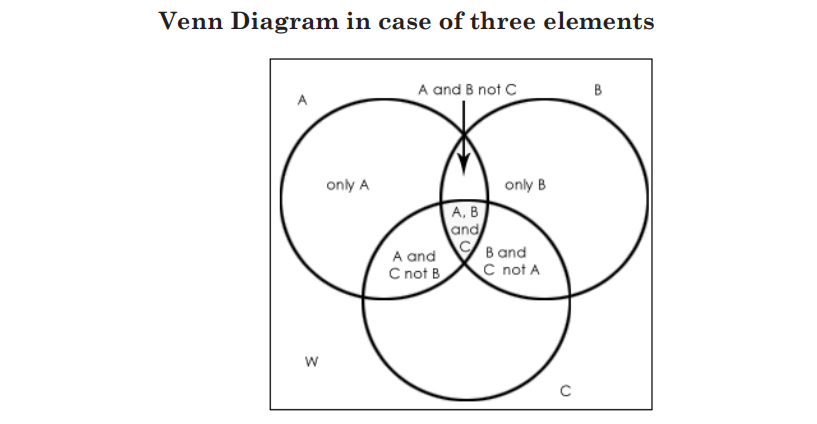
Despite Venn diagram with 2 or 3 circles are the most common type, there are also many diagrams with a larger number of circles (5,6,7,8,10…)theoretically, they can have unlimited circles.
Venn Diagram in case of two elements
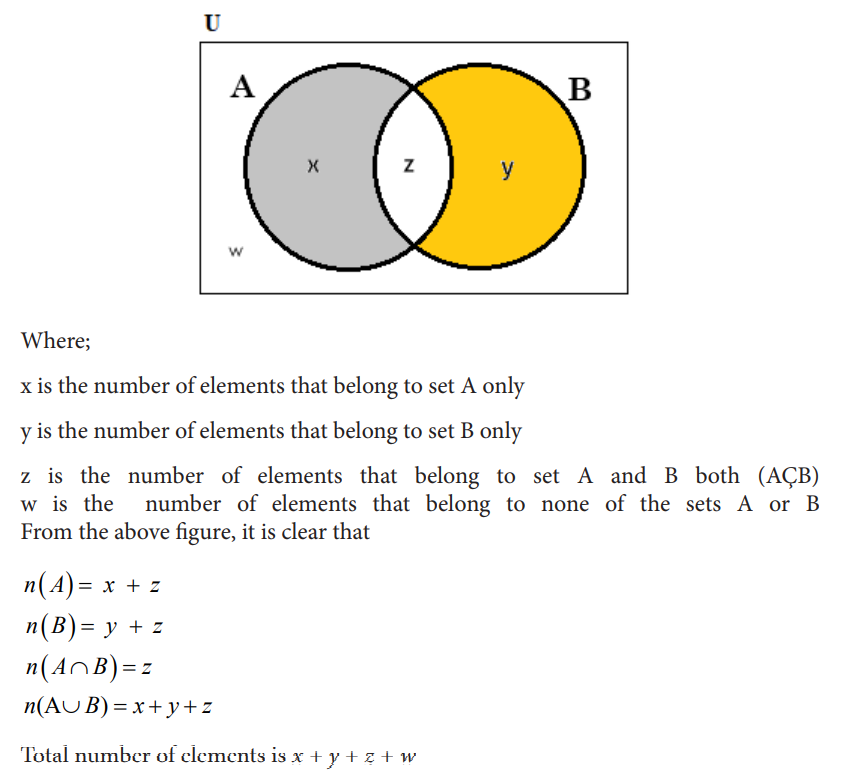
Where w is the number of elements that belong to none of the sets A, B or C
Tip: Always start filling values in the Venn diagram from the innermost value or intersection part
Example:
150 TTC student-teachers were interviewed. 85 were were registered for a Math class, 70 were were registered for an English class while 50 were registered for both Math and English.
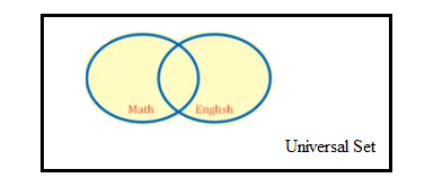
Model this problem using variables and Venn diagram and find out the following:
• How many student-teachers signed up only for Math class?
• How many student-teachers signed up only for English class?
• How many student-teachers signed up for Math or English?
• How many student-teachers signed up for neither Math or English?
Solution
• Let x be the number of student- teachers who signed up for both Math and English.
• The number of student- teachers who signed up only for Math class is 85 – x. Knowing that x = 50, student- teachers who signed up only for Math is 35.
• The number of student- teachers who signed up only for English class is 70 – x. Knowing that x = 50, student- teachers who signed up only for English is 20.
• The number of student- teachers who signed up for Math or English is given by the total number of all student teachers in both sets. This is 35 +50 + 20 = 105
• The number of student- teachers who signed up for neither Math or English is given by the total number of all TTC student- teachers who were interviewed minus the total number of all student teachers in both sets.
This is 150 - 105 = 45
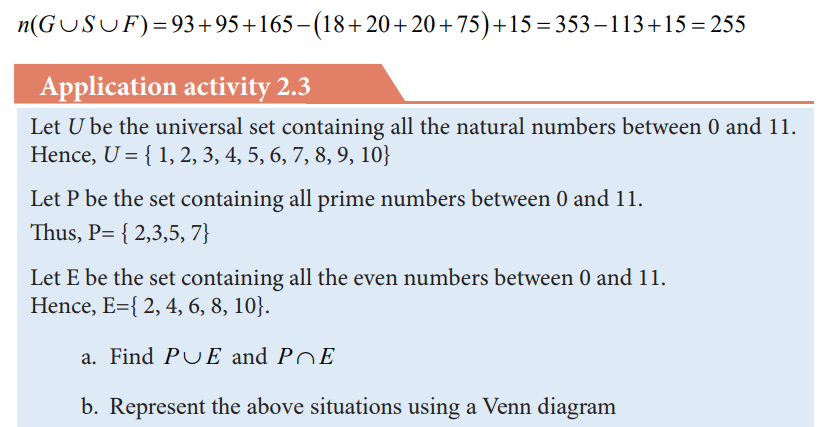
Application activity 2.4
The Venn diagram below shows the number of year two student-teachers in SME who like Mathematics (M), Physics (P) and Kinyarwanda (K). Some like more than one subject in total 55 students like Mathematics.
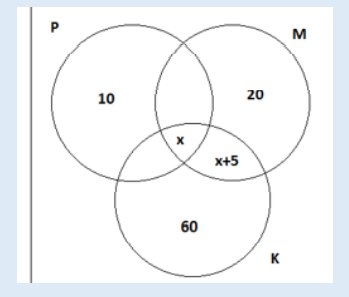
a. How many student- teachers who like the three subjects?
b. Find the total number of year two student- teachers in SME.
c. How many student-teachers who like Physics and Kinyarwanda only?
2.5. END UNIT ASSESSMENT 2
1. In a class, 15 students play Volleyball, 11play Basketball, 6 play both games and everyone plays at least one of the games. Find the total number of students in the class.
2. Out of 17 teachers in a school, 10 teach Economics and 9 teach Mathematics. The number of teachers who teach both subjects is twice that of those who teach none of the subjects. With the aid of a Venn diagram, find the number that teach:
(a) Both subjects
(b) None of the subject
(c) Only one subject
3. In a class the students are required to take part in at least two sports chosen from football, gymnastics and tennis. 9 students play football and gymnastics; 19 play football and tennis; 6 play all the three sports. If there were 30 students in the class, draw a Venn diagram to show this information. With the help of a Venn diagram, find out how many students did not participate in any of the sports.
4. At a certain school, 100 students were interviewed about the subject they like. 28 students took Physical Education (PE), 31 took Biology (BIO), 42 took English (ENG), 9 took PE and BIO, 10 took PE and ENG, 6 took BIO and ENG, while 4 students took all three subjects.
• Represent the situation in the following Venn diagram.
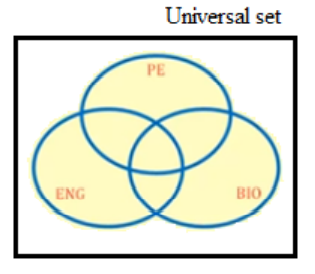
• Model the problem using variables and find out the following:
a. How many students took none of the three subjects?
b. How many students took PE, but not BIO or ENG?
c. How many students took BIO and PE but not ENG?