Geography and Environment
- S1: Geography TG File Uploaded 16/08/22, 09:52
- S1: Geography SB File Uploaded 16/08/22, 09:56
UNIT 12:Population and settlement

By the end of this unit, you must be able to explain general population concepts and settlement patterns (rural and urban).
Unit objectives
By the end of this unit, you must be able to:
(a) define population and associated concepts
(b) identify types of settlement
(c) define concept of migration.
Work in groups of four.
1. Count the number of people in your classroom.
2. Include all the students, your facilitator and any other person present at the time of counting.
3. Give the number of males and females, separately.
4. Use the data collected to draw a chart or a picture of your classroom. Use symbols to show the statistics of your class.
5. Display your chart or picture on the class notice board.
6. Describe the composition of the people in your class.7. Why is it important for your facilitator and school management to know the number of students in a class?

Work in pairs. Your teacher will guide you to fill in the table below with the required
details.Table 12.1 The population of our school.
Category of people (persons) Number Females
(a) Learners
(b) Teachers
(c) Workers such as cleaners, cooks and
security personnel.
(d) Administrators
(e) Visitors such as the inspectors.Males
(a) Learners
(b) Teachers
(c) Workers such as cleaners, cooks and security personnel.
(d) Administrators
(e) Visitors such as the inspectors.(a) Analysis
(b) The number of females
(c) The number of males
(d) The total number of the populationGeneral description or
comment on the composition of the school’s populationstructure.(Compare the male and female numbers)
Population
Work in pairs.
1. Define the term population.
2. Explain the meaning of population census.
3. Why do you think it is important for countries to carry out population census?
4. Give the term given to the study of population.Population is a term used to refer to the number of people living in an area at a given time. Using the findings of Activity 12.1, you are able to know the population of your class. At the same time, Activity 12.2, assists you to know the population of your school. Suppose your class was a country, you would be able to know the number of people living in the country. The official counting exercise
is known as population census.
Population census is the act of counting people living in a given area over a specific time. Population census is usually done by countries at intervals of ten years. Rwanda also carries out its population census after every 10 years. The last population census in Rwanda was in 2012.It is therefore expected that there will be a population census in 2022.
The study of populations is referred to as demography. This field deals with studying the population distribution, population structure and composition, factors that influence population distribution and the effects of population levels on the available resources and socio-economic state of the
society.The population structure and composition

Do this in pairs.
1. Use the data findings in Activities 12.1 and 12.2 to do this activity.
2. Determine the age of the population of your school.
3. Fill in the table below.Table 12.2 The age group of the population of our school.
Category of people (persons) Age group Number of people Females 0 – 4
5 – 9
10 – 14
15 – 19
20 – 24
25 – 29
30 – 34
35 – 39
40 – 44
45 – 49Females 50 – 54
55 – 59
60 – 64
65+Males 0 – 4
5 – 9
10 – 14
15 – 19
20 – 24
25 – 29
30 – 34
35 – 39
40 – 44
45 – 49
50 – 54
55 – 59
60 – 64
65+Analysis
The number of females.
The number of males.
The total number of the population.General description or comment on the composition of the school’s population structure.
(Compare the male and female numbers in terms of age.)
1. State the number of females and males found in your school.
2. Why do you think it is very important to know the above numbers?
3. Identify the largest age group in your school and explain why it is so.
4. Using the answers obtained in 1, 2 and
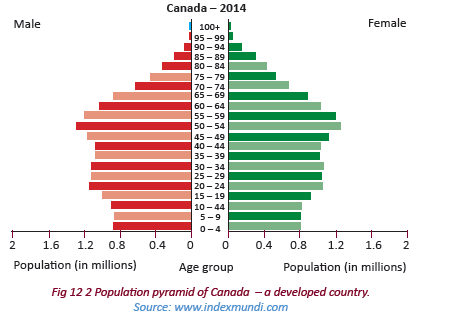
3 above, explain what a population structure is.Population structure refers to the composition of a given population. It is broken down into categories such as age and gender. The population structure of a given country is represented diagrammatically by use of population pyramids. The pyramids are commonly known as the Age and Sex graphs.
The importance of a population structure
(a) It helps governments to project the future growth and economic prosperity of countries.
(b) It provides the data that is used by policy makers and economic planners. The data is used when planning and budgeting for the nation. For example it helps to determine the number of
schools, hospitals and distribution of clean water. Electricity supply, roads and recreational facilities in a given area can also be determined.
The information collected is then statistically represented. This representation gives a visual interpretation of the analysis of the population composition.
The nature of a population pyramid
-When the population structure has the greatest population lying between 0–14 years, it is a young population.
- Most developing countries have a population pyramid that is broad at the base. This means that there are more young people and few aged ones.
- On the other hand, the population structure of a developed country is narrow at the base and wider at the apex when compared to that of a developing country.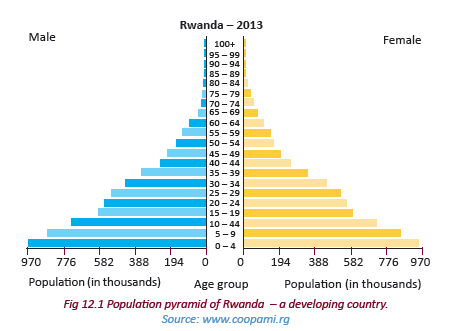
The middle part of this population structure is wide. This is reflected by bulging bars as illustrated below.
Population distribution and density

Do this in groups of three.
1. Use the five classes; Senior 1, Senior 2, Senior 3, Senior 4, and Senior 5 as representatives of the provinces of Rwanda.
2. Count the number of learners in each class.
3. Describe the way population is spread out in your school.Population distribution is the spread of people across the area where people live.
An analysis of population distribution shows areas with many people or few people and areas that are moderately populated.
This implies that population can hardly be evenly distributed. Some areas have dense, low and sparse populations. Population distribution is represented using population
maps. On such maps, dots are used to represent settlements. The maps are known as dot maps. There are other population maps that use shades of different colours. They are called choropleth maps.
Areas with many dots imply dense populations. Areas with scattered dots indicate sparse populations.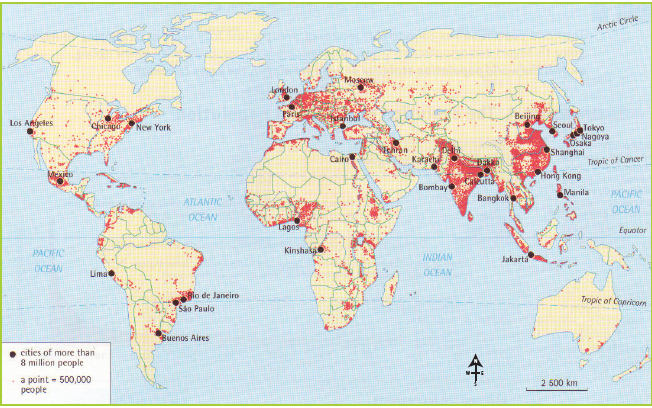
Fig 12.3 United States Hispanic population dot map.
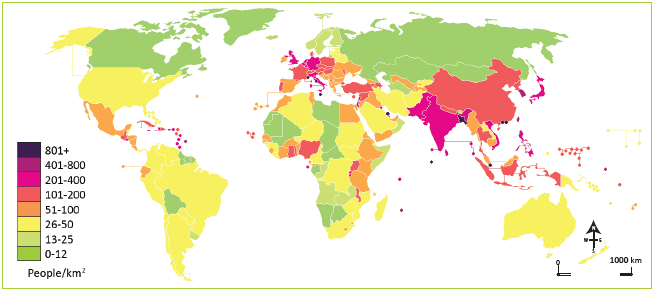
Fig 12.4 A choropleth map showing global population distribution.
Task 12.1
1. Define the term population distribution.
2. Describe a population structure.
3. Explain the composition of a population structure of a:
a) developing country
b) developed country.
4. Describe how population distribution is represented in geography.Population density
Population density refers to the number of people living per unit area. The unit area is usually in square kilometres. To determine the population density of an area, the total population of an area is divided by the total size of the area. The population density is expressed as persons per square kilometer.Suppose country Y has a total population of 29,500,500 people and a total land area of 156,578 km2. Its population density will be as follows:
Therefore, the population density of area Y
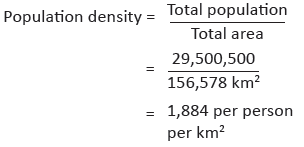
Therefore, the population density of area Y is 1,884 persons per square kilometer.

Use the data indicated in the Table 12.3 to determine the population density of each
country.Table 12.3 Population densities of different countries.
Country Total population Total area in km2 Population density X 11,565,810 26,671 ------------------------- Y 2,050,678 276,106 -------------------------- Z 50,000,658 25,000 -------------------------- E 38,689,654 102,000 --------------------------
1. Identify the country with the highest population density.
2. Identify the country with the lowest population density.
3. Explain the problems a country with a high population density is likely to face.
4. Examine the challenges a country with a low population density is likely to experience.
5. Present your findings in class.
Project work.
Work in groups of five.
1. Analyse the effects of a high population density on the environment where you live.
2. Suggest how the problems arising can be solved in order to use the environment sustainably.
3. Present your findings in class.enables the country to allocate resources appropriately. This is in proportion to the number of people.
Task 12.2
1. Define the term population density.
2. Explain how the population of a given country is obtained.
3. Why is it necessary to determine the population densities of various parts of Ma country?
4. Calculate the population density of country X, whose total population is 2,506,761 people and total area is 2,565 square kilometres.Population growth

Do this individually.
There is a large inflow of refugees from Burundi entering into Rwanda. The refugees are fleeing from insecurity and famine.
Unfortunately, this is happening when the infant mortality rate in Rwanda has declined
tremendously. The life expectancy level in Rwanda has also risen.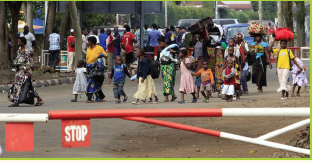
Fig 12.5
1. Explain the effects that this refugee problem will have on the population of Rwanda.
2. Identify the main factors that have forced refugees from Burundi to enter Rwanda.
3. Why did the refugees decide to take refuge in Rwanda?Population growth refers to the increase in the number of people living in a given area or country. The population of the world has been steadily increasing over time.
The population of Africa is also rapidly increasing. To determine whether there has been population growth, the following formula is used; (birth rate + immigration) – (death rate + emigration).(a) Birth rate

Do this individually.
1. Study the population of your home area.
2. Compare it with how it was last year.
3. Do you notice any difference?
4. Explain the difference noted.
5. Present your findings in class.Birth rate refers to the number of live babies born in a year for every 1000 people in the total population. It is calculated using the following formula.

Suppose in a certain year, new born babies were 200,000 in a total population of 10,000,000 people. The birth rate is as follows;

The birth rate is approximately 20 per every 1,000. This means that every year there are
20 newborn babies.
The birth rate of an area is closely affected by fertility.
(b) Fertility rate
Work individually.
1. Identify the following families in your neighbourhood:
(a) families with many children
(b) families with few children
(c) childless families.
2. Explain the varying sizes of families.Fertility rate refers to the number of children that would be born to a woman in her lifetime. It is calculated per every 1000 women in a population. Fertility rates vary in different areas. Other reasons that account for differences in fertility rates include economic constraints, cultural and
traditional beliefs, poor nutrition by the mothers and diseases.Task 12.3
1. Explain the difference between fertility rate and birth rate.
2. Explain the factors that influence the fertility rate in any given region.
3. What would happen to population sizes if the fertility rate:
(a) increases
(b) decreases?(c) Death rate

Do this in pairs.
In a certain year in a village in Gasabo district, there were many grandparents taking care
of their grandchildren. After 10 years, the grandchildren were found alone taking care of themselves. Their grandparents could not be seen anymore.
(a) What do you think happened to that village?
(b) Why were the grandchildren left alone?Death rate refers to the number of people dying per 1000 people in the total population. It is calculated using the following formula:
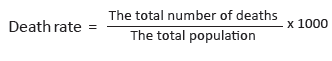
Let us see a scenario;
In 2014, country X registered 60,000 deaths in a total population of 12,000,000 people.
Calculate the death rate of country X.
This means that for every 1000 people of the general population, 5 persons died in that year.
(d) Growth rate
Growth rate refers to the natural change in the number of people living in a given area or country. This change is by an increase or decrease expressed as a percentage. Growth rate is also defined as the ratio of birth rate and death rate per 1000 people.
This is determined by the formula: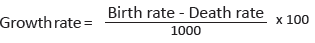
There are different types of growth rates.
Rapid growth rate - refers to a situation where birth rates are high and death rates are
low. This leads to a fast growing population.
Slow growth rate - refers to a nearly stagnant population growth where both the birth and death rate are low. It is experienced in countries such as Britain and Sweden.
Zero growth rate - is also known as constant growth rate. It is a stable population growth
rate where birth rates are equal to death rates and the rate of population increase is
therefore zero.
Negative growth rate- is a type of growth rate where birth rates are lower than death
rates. This results in a declining population.
(e) Natural increase
This is the difference between the number of births and number of deaths. It occurs when the birth rate exceeds the death rate.
This may be caused by high birth rates, low death rates and influx of people like
refugees into a country.
(f) Natural decrease
This is a condition that occurs when the death rate exceeds the birth rate. It results in a low population growth rate. A natural decrease could also be caused by epidemics such as HIV and AIDS, natural hazards such as floods, severe drought, pests and diseases and civil wars.
Do this in pairs.
Use the following data to calculate the birth and death rates of various countries.Table 12.4

1. Define the term death rate.
2. Differentiate between birth and death rates.
3. Comment on country X and Y and suggest factors that led to their differences in birth and death rates.
4. Calculate the growth rate for each of the countries.
5. Identify some factors that may influence the population growth rate.
Do this in groups of three.
Use the Internet, geography textbooks and other geographical documents.
1. Find out other concepts and terms related to population studies.
2. Describe the characteristics of the concepts.
3. Write down your findings.
4. Discuss them in a class presentation.Settlement

Do this in pairs. Discuss and answer the following questions.
1. Where did the early man live?
2. Where do people live?
3. Describe where you live.
4. Why is it necessary to have homes?
5. Identify the factors that influence the establishment of a home.
6. Draw a village where people live and display your picture in the class.A settlement refers to a place where people live and establish their homes. It refers to forms of human habitation from a single dwelling to the largest city.
People choose to build their homes in given areas due to factors that may be favourable.
They include the following.
(a) Where there is a reliable source of water.
(b) In places with fertile soils that can support plant growth.
(c) In locations with enough supply of food such as near the market or an agriculturally rich region.(d) In places with security such as near the king’s palace, state house or army barracks.
(e) In areas with favourable relief that is generally flat or gently sloping areas. This is for easy accessibility and infrastructural development.
(f) In places that are disease and pest free.
(g) Strategic positions or sites such as at a place where many roads meet.The presence of natural resources, where people able to get jobs easily.
Types of settlements

Observe the settlements around your home area and school. Answer the following questions in a class discussion.
1. Describe the settlements.
2. Name the types of settlements you have observed.
3. Which type of settlement is associated with roads, rails and towns?
4. Which type of settlement is associated with rivers and farms?Rural settlements are villages occupied by people involved in primary production such as subsistence agriculture.
Urban settlements are areas occupied by people who are involved in trade, commerce and
industrial activities. They comprise of towns or urban centres and cities.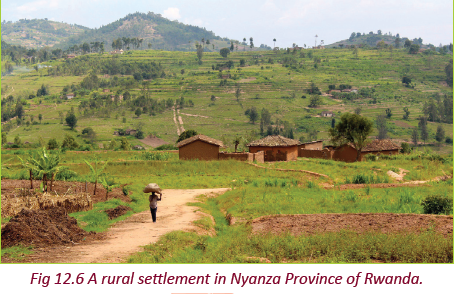
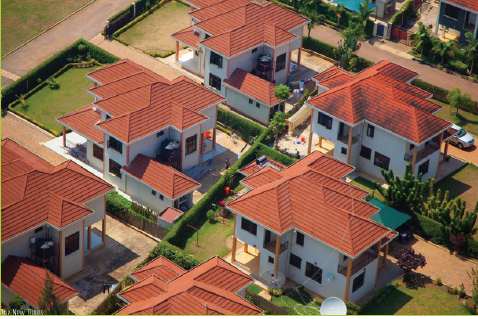
Fig 12.7 An Aerial view of housing units of urban settlements in Kibagabaga, Gasabo District.
Both rural and urban settlements take any of the following settlement patterns.
(a) Nucleated settlement pattern.
(b) Linear settlement pattern.
(c) Sparse settlement pattern.(a) Nucleated settlements
This is a settlement pattern where people cluster together to form compact
settlements. The clusters may be around a market, a source of water or a farm that has
been divided into strips.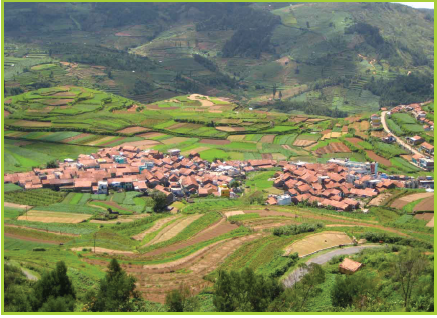
Fig 12.8 A nucleated settlement pattern in Poomparai village in India.
(b) Linear settlements
This is a common kind of settlement pattern. Homesteads and houses are arranged in lines.The houses are located on either side of certain features like roads, railways, rivers or along a coast. Most linear settlements develop because of the convenience of nearness
to a transport route.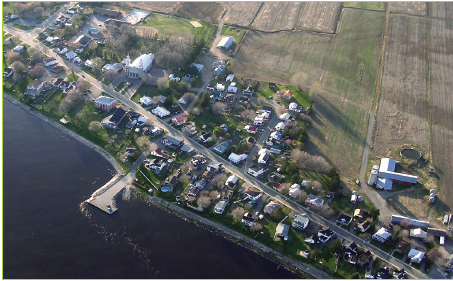
Fig 12. 9 A linear settlement pattern along Saint Lawrence River in Quebec Canada.
(c) Sparse or scattered settlements
This is a type of settlement consists of isolated dwellings which are scattered over a large area. This type of settlement is common in areas where rainfall is very low and unreliable in nature. Practices such as hunting, shifting cultivation and food gathering and nomadic pastoralism are a
main economic activity.
Fig 12.10 A dispersed settlement pattern in Darrenfelen and Cwm Dyar-fach in Britain.

Do this in pairs.
1. Observe the settlements in the area around your school.
2. Identify the different types of settlement patterns.
3. Give their characteristics and reasons why they exist.
4. Record your findings for a class discussion.Task 12.4
1. Define the term settlement.
2. Explain the meaning of the following.
(a) Rural settlement.
(b) Urban settlement.
3. Differentiate between:
(a) nucleated settlement and sparse settlement
(b) linear and isolated settlementMigration
Do this in pairs.
Study the photograph shown below and answer the questions that follow.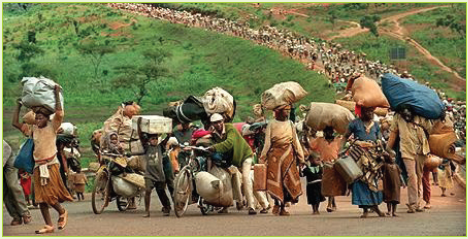
Fig 12.11 Refugees from Rwanda.
1. Explain what is happening in the photograph.
2. Identify the causes of such a mass movement of people like those in the photograph.
3. What are the challenges that such people face during and after such undesirable movement?
4. Suggest what can be done to stop such movements from happening in our country.Migration is a term used to refer to the movement of people from one place to another for specific purposes. The purposes could be to search for jobs, search for pasture, search for better living conditions or as a result of civil war.
Types of migration
There are different types of migration.
The types are classified based on the original location of a person and their final destination. They include the following.(a) Internal migration
This is the movement of people from one place to another within the same country.
It does not include crossing of borders of a country.(b) External migration
This refers to the movement of people from one country to another. It involves crossing the borders of a country. This means that they emigrate from one country to another.
When someone migrates from one country to another, the person is known as an emigrant. The same person in the receiving country is known as an immigrant. The processes of movement are known as emigration and immigration respectively.
Study the table below and fill in the missing information.
Table 12.5

Other types of migration
(a) Voluntary migration
This is where an individual moves from one place to another without being forced. A person moves out of his or her own free will. The movement could be between continents, countries or certain parts of the same country. This is sometimes referred to as “analysed migration”. The parties involved study the advantages and disadvantages of moving and decide to leave willingly.(b) Involuntary migration
This is forced migration where an individual shifts from a place to another due to unfavourable factors. A person moves against his or her will. For example, the government may decide to resettle a given population due to a need. The need could be such as infrastructural development. Other factors that can force people to move include war, genocide or civil unrest in a country.(c) Permanent migration or long-term migration
This is the movement of people from the source area to another place with no intention of returning back to their origin.(d) Temporary migration or short-term migration
This is the movement of people from the source area to another part with an intention of returning to their homes. It is also referred to as a “return migration” or short-term migration. This form of migration is practised by businessmen, tourists and students.
There are other types of migration that are found on villages and towns. They are presented in Table 12.6.Table 12.6 Types of migration.
(a) Rural – urban migration This is the movement of people from villages
to cities and towns.(b) Rural – rural migration This is the movement of people from one
village to another village.(c) Urban – urban migration This is the movement of people from one
city to another(d) Urban – rural migration This is the movement of people from cities
or towns to villages.
Use Geography textbooks, the Internet, maps and other documents.
1. Find out the types of migration that exist in Rwanda. Give examples.
2. Note them down and discuss your findings in a class presentation.Did you know?
• About 50% of the world population is under 25 years old.
• The average life expectancy is 80 years old for people in industrialized nations, and 53 years old for Sub-Saharan Africa.
• The continent with highest population is Asia that accounts for 60% of world’s population.
• Early human migrations are thought to have begun when Homo Erectus first migrated out of Africa to Eurasia.
• The largest migration corridor in the world is the Mexico – USA.
1. Define population.
2. Explain the meaning of the following terms:
(a) population structure
(b) population distribution and density.
3. Why is it important for governments to carry out census in their countries?
4. Differentiate between:
(a) birth, death and growth rates.
(b) natural increase and decrease.
5. (a) Define settlement.
(b) List and briefly describe three types of settlements.
6. (a) Define migration.
(b) Mention and briefly explain the two main types of migration.
(c) Give four reasons why people migrate.