General
- Geography S5 SB File Uploaded 28/01/22, 13:38
- S5 : Geography TG File Uploaded 19/08/22, 10:37
UNIT 2: BEARINGS, DIRECTIONS, DISTANCES AND AREAS ON A MAP
Key unit competency: By the end of this unit, I should be able to measure the bearings and the directions, calculate distances and areas on a map.

2.1. Location of places using the grid reference
Activity 2.1
a) A map has several lines printed on it. Identify the names given to the vertical and
horizontal lines printed on the map.
b) What does grid reference mean?
A grid is a series of straight lines drawn vertically and horizontally on topographical maps. Where the lines cross each other to form squares of equal sizes. The lines running from north to south (vertical lines) are called Eastings. This is because their numbers increase towards the east from the south western corner. This corner is known as the grid origin and it is from it that all readings start. There are those drawn horizontally, and their numbers increase towards the north. These are called the Northings.
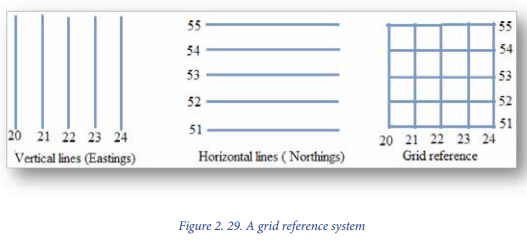
The lines shown on the illustration above, intersect forming grid squares. These are formed by both vertical lines (Eastings) and Horizontal lines (Northings). These are called grid references or geographical coordinates. They are the ones that are used to locate places and features indicated on the map. This is illustrated hereunder:
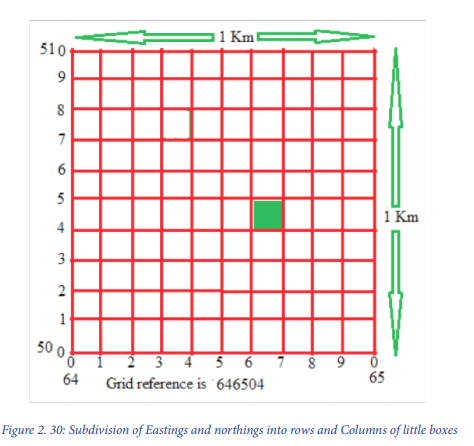
The value of the easting (vertical gridline) is read first, followed by the value of the northing (horizontal Gridline). The values of the Eastings and northings are known as coordinates. The coordinates are expressed as a single continuous figure without decimal points or commas, for example, 646 504 and not 64, 65, 04. They are plain numbers, without units of measurement.
The coordinates are given in two ways:
- Four figure grid reference
- Six figure grid reference
2.1.1 The four-figure grid reference
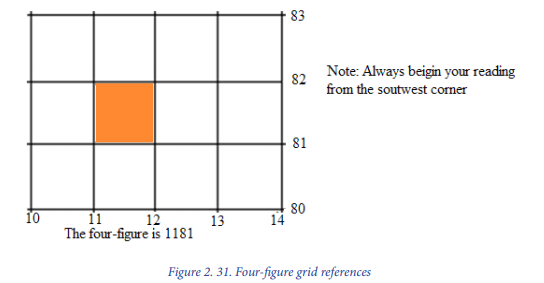
The four-figure grid reference has four digits. It gives the grid square in which a position is found. The four-figure grid reference of Yellow Square in figure 2.31 below is found as follows:
– Read the easting first and record its value. In this case it is 11.
– Next, read the northings and record its value. In this case it is 81.
– Put the two values together.
– The four-figure grid reference for the yellow square is 1181.
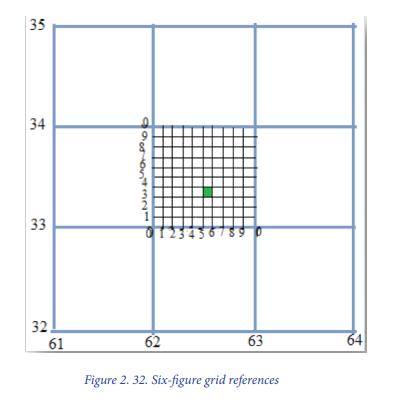
2.1.2 The six-figure grid reference
This reference has six digits. It is more exact than the four-figure grid reference. To get the six-figure grid reference for red square in figure 2.32 below, the following is done:
Read the easting first and record its value. In this case it is 62.
– Subdivide the area between easting 62 and 63 into 10 equal parts.
– Record the value of red square out of 10 from easting 62. In this case, it is 5. This
forms the third digit of the easting.
– The value of the easting for red square is therefore 625.
– Read and record the northing. In this case, it is 33.
– Subdivide the area between northing 33 and 34 into 10 equal parts.
– Record the value of red square out of 10 from northing 33. In this case, it is 3.
This forms the third digit of the northing.
– The value of the northing for the red square is therefore 333.
– The six-figure grid reference for red square is therefore 625 333.

2.2: Stating directions and bearings on topographic map
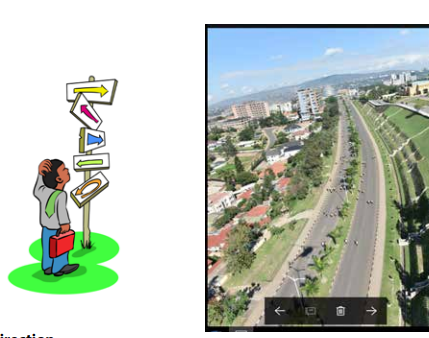
2.2.1. Direction
Direction or orientation is important for finding the way and its relative position
or direction of something. All directions are based on the cardinal points of the
compass shown below:
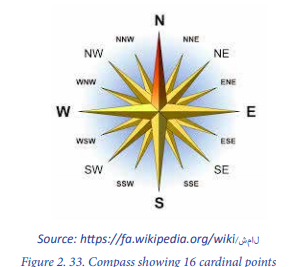
Direction is the relative position of a place from another using the points of the compass. The main cardinal points of a compass are north, east, south and west. The first letters of these directions (in capital) are used in place of the full names. These are N—North, E—East, S—South and W—West.
2.2.2. Bearing
Bearing is an accurate way of giving the direction of one place in relation to another. It is more accurate than direction because it has 360 points compared to the 16 points of a compass. Instead of saying, for example, that place A is north east of place B, we use degrees. So, we would say that place B is situated at 045° from place A. The bearing of a point is the number of degrees in the angle measured in a clockwise direction, from the North line to the line joining the centre of the compass with the point. This is illustrated below :
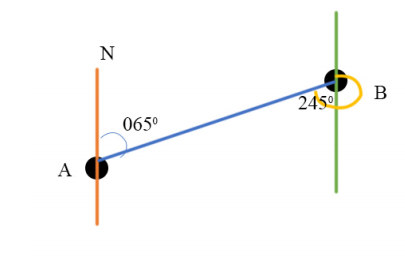
A bearing is used to represent the direction of one-point relative to another point. For example, the bearing of A Form B is 245˚. The bearing of B from A is 065˚. Bearing is also the direction to something measured as an angle relative to the north. It increases towards the East, with North=0 degrees, East=90 degrees, South=180 degrees, and West=270degrees.
2.2.3. Measuring true bearing
True bearing (TB) is a bearing where the true-north line is taken as 0˚. It is the
measurement of the angle between the true-north line and the line joining the two
places in question.
A true bearing is measured using a protractor from True North, as shown below:
– Draw a north-south line through the starting point.
– Use a straight line to join the two places given.
– Draw an arrow from the True North line to the line joining the two places in a
clockwise direction. Then measure the angle with a protractor.
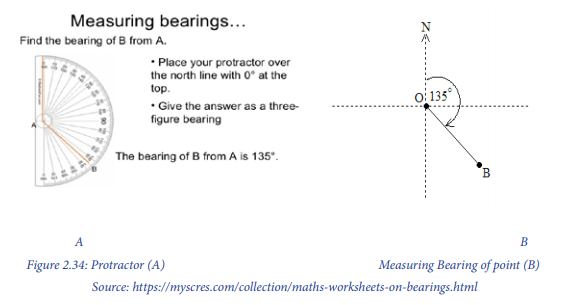
In this case, the bearing of B from A is 135 degrees. It is therefore, very important to
understand how to use the protractor.
i) Centre the protractor over the starting point and orient 0˚with true north.
ii) Draw a line on the map from the starting point towards the destination.
iii) Read the bearing where the line intersects the protractor. Remember that
line is the direction of travel to your destination.
2.3: Measure the distance on the maps: straight line and curved line
Learning activity 2.3
Read this conversation between Paul and Sarah students in S1 A and answer
the questions:
Paul: Let us visit my uncle at Kayonza district.
Sarah: Can we walk from GS St Aloys Rwamagana to Kayonza?
Paul: I don’t know, let us look at our map. It has a ratio scale of 1:50 000. On the map, it is
about 30 cm from our school to Kayonza district.
Using your map reading skills that you have acquired in your previous studies:
a) Calculate the actual distance on the ground
b Can Sarah and Paul walk within two hours from GS St Aloys Rwamagana to
Kayonza? Support your answer.
A map is a representation of the actual ground on a piece of paper. It is usually drawn to scale. Distance on the map is measured between two points, e.g. between a school and the museum or any other feature. Then, the distance measured on the map is converted into the actual distance on the ground. The distances can either be straight or curved. To measure the distance requires:
- To identify the two places and then calculate the length between them in
either centimetres or millimetres;
- To convert the length into the units required such as Kilometres or miles of
the actual area (ground) referring to the map scale.
A map scale refers to the relationship (or ratio) between distance on a map and the corresponding distance on the actual ground. The map scale tells you about the comparative size of features and distances displayed on the map.
2.3.1. Straight line distance
The shortest distance between two points is sometimes known as “the crow flies’.
- Use a ruler and measure the distance between two points in centimeters.
- Convert the centimeter reading to kilometers by multiplying by 0.5 km if the
map scale is (1:50 000) to obtain the kilometers on the ground.
- For example, the distance as the crow flies from A to B is 9.5 cm on a map;
therefore 9.5 cm x 0,5 km = 4.75 km on the ground.
2.3.2 Curved Distances
In map reading, there are times when curved or straight areas are used while
determining the distance. Below are the explanations of how curved distances can
be determined or calculated:
- Place the straight edge of paper along the feature to be measured e.g. road;
- Make a mark where the paper intersects the road;
- Hold the paper steadily with the point of a pair of dividers.
- Rotate or swivel paper following the line/road being measured.
- Mark where paper insects with the line/road.
- Write down the reading after measuring the line/ road.
- Check the scale of the map.
- Now multiply the distance between the two points by the scale on the map.
- The answer above needs to be converted to the unit for the actual ground
distances (km).
NB – An alternative method is where a piece of string is used to measure the curved
/ winding line. Make sure that the string is not elastic.
Formula: Actual Distance on the ground = Map distance/Scale.
Source: http://www.juddtrump.com/index-contour
2.4. Calculate the areas on topographic maps: regular and irregular shape

An area is calculated to determine the actual (size on the ground) of a feature / region / demarcated area. The area of a feature can be regular or irregular in shape.)
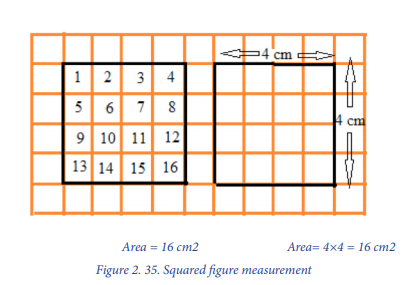
2.4.1. Calculate areas of regular shapes
Getting the area of a regular body on maps is simple. This is because the body may
be a square, rectangle, triangle or a circle. Once the distances are obtained, the
formulae used in mathematics are used.
– Square and rectangle: multiply the length by the width.
– Triangle: half base multiplied by height.
– Circle: Pi multiplied by square of radius.
2.4.2. Calculate areas of irregular shapes
The following methods are used to calculate the irregular shapes:
a. The use of grid squares
On topographical maps of the scale 1:50,000, there are grid squares measuring 2 cm by 2 cm. On the ground, these measure 1 km by 1 km. This means that they have an area of 1 km2. To calculate the area of irregular shapes,
the following steps are done:
– Count all the full squares inside the irregular body.
– Count all the half squares inside the irregular body
– and divide them by two.
– Add the total of the full squares and the half squares.
For example,
Formula:

Full squares= 20
Half Squares=26
Get 26 halves divide by 2 =13 full squares
20 +13=33 full squares X the area of one square
33 x1 square km
=33 km Squared.
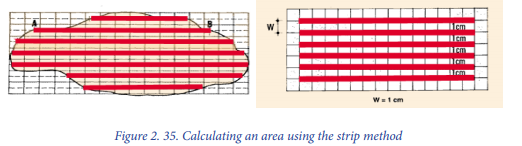
b. The use of strip method
Here, strips of equal width are drawn on the irregular body. The length of the strips
differs from strip to strip. Follow the method used to find the area of regular shapes.
Calculate the area of each strip. Add the areas of the various strips. This gives you the
area of the irregular shape.
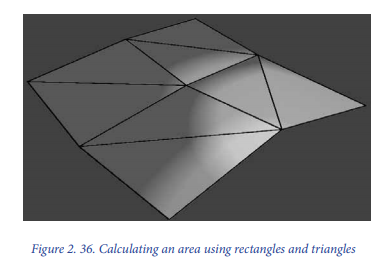
c. Use of rectangles and triangles
The irregular body is divided into a rectangle and triangles as shown below. Their
measurements are taken. The formula for finding the area are used (known). Then
get the totals of these areas.
Application activity 2.4
Using your knowledge, identify how you can calculate the area of a farm if the
measurement got are 45 m length, and 34 m width.
2.5: Representation of relief on the map
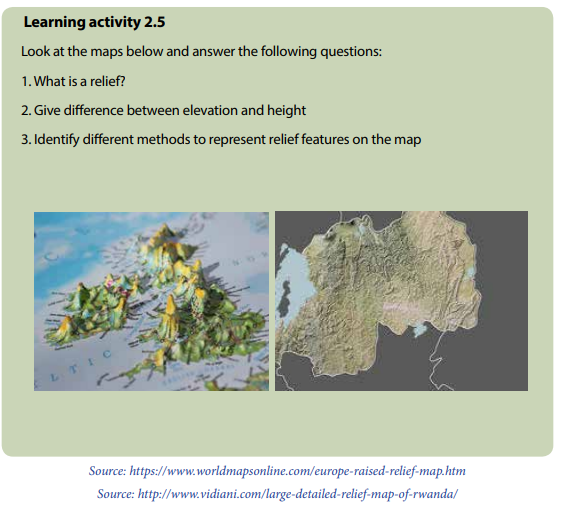
The surface of the earth is not flat. It has such features as mountains, valleys, gullies, hills, plateaus and plains. In Geography, this form of landscape is called relief. In other words, relief is the general appearance of the land’s surface. It does not include the aspects covered in human geography. The following are the most common techniques used to represent relief features:
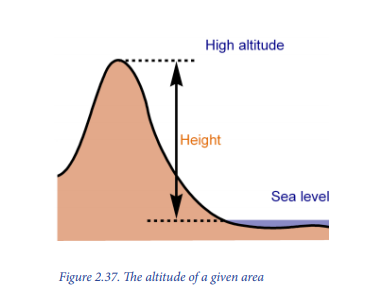
2.5.1. Altitude
Altitude is the height above sea level. It is the height of a point in relation to the seal level. Elevation is the vertical distance above the sea level while Height is the vertical distance from the base to the top. The figure below shows how relief is determined.
2.5.2. Contours
a. Contour lines
Contours are lines that join places of the same height above the sea level. A contour is represented in brown lines on the topographical maps. The height of the contour is indicated on each contour line. The difference between one contour line and the next is called contour interval. If only certain contours are numbered, one must find how many contours lie between the numbered contours and work out the contour interval. A contour interval is given on the legend on the topographical maps. From the below illustration, the contour interval is 20 m.

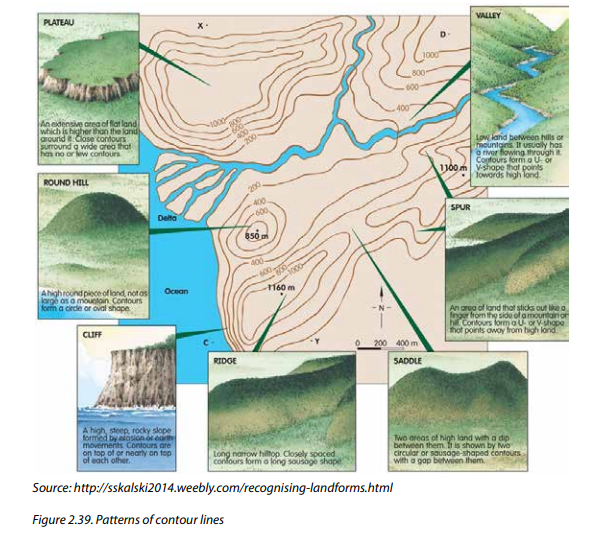
b. Uses of contours and identifying the shape created by the patterns of
contours
i. Contours help to recognize land features
By recognizing land features, we understand our natural environment. This is
useful and helpful for a wide range of activities including:
– Planning housing estates, freeway routes and reservoirs;
– Organizing outdoor recreational pursuits;
– Managing hazards such as flooding, landsides, etc.
ii. Contours help to recognize the shape of the land
By reading the contour lines an understanding of the shape of the land is obtained.
Land features are identified from the contour lines as follow:
– spacing (density) of the contours indicates the slope (gradient) of the land;
– contour lines that are close together denote steep slopes;
– contour lines that are far apart denote gentle slopes;
– when there are no contour lines, it means the land is almost flat;
– when the contour lines spaced further apart as the height of the slope
increases, the
– Slope is convex; when the contour lines spaced closer together as the height
of the slope increases, the slope is concave (broad spacing to narrow spacing).
iii. Recognizing land features on a map involves identifying the shape created
by the patterns of contours
2.5.3. Hill shading
Hill shading is the method of adding light and dark area or shading to a map to highlight the location of hills or mountains. When light is shone from a given direction, areas with steep slopes are hidden. Such parts can be clearly shown by shading. The thickness of the shade depends on how steep the slope is. Steep relief has darker shading compared to gentle slopes. This method does not show the exact height of the relief feature. Refer to the figure below.

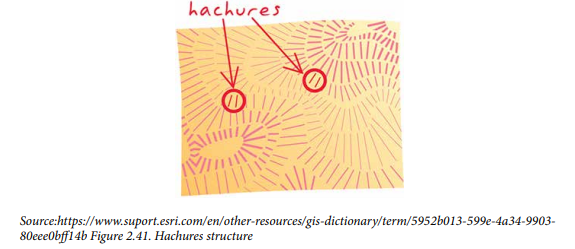
2.5.4. Hachures
Hachures are short lines on a map that indicate the direction and steepness of a slope. Hachures that represent steep slopes are short and close together while hachures that represent gentle slopes are longer, lighter, and farther apart.
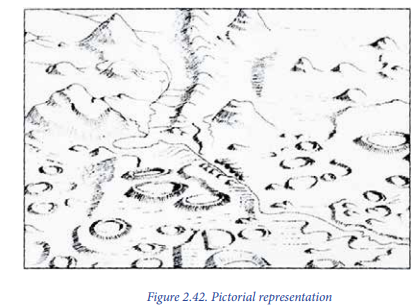
2.5.5. Pictorial representation
In this method, certain symbols are used to show relief on maps. It does not give the heights above sea level. Only a small variety of landforms can be shown using it. The pictures may further hide important details. See the figure below.
2.5.6. Colouring/ Layer Tinting
Colouring or layer tinting is a method of showing relief by colour. A different colour is used for each band of elevation. Each shade of colour or band, represents a definite elevation range. A legend is printed on the map margin to indicate the elevation range represented by each colour. However, this method does not allow the map user to determine the exact elevation of a specific point; only the range is identified.

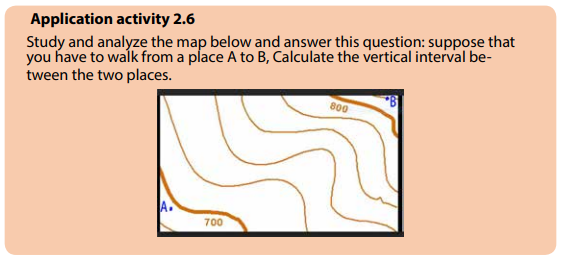
Application activity 2.5
Make your own research and find an extract of the topographic map of
Rwanda, and describe its relief basing on different representation signs used.
2.6. Calculation of the vertical interval and the amplitude of relief /spot heights

2.6.1. Vertical interval and amplitude of relief
The dark lines with reading are index contour lines while thin lines represent intermediate contours. The difference in height or altitude between two places is known as the vertical rise or the vertical interval (V.I.).
How to calculate the vertical interval?
There are several steps that are followed when the vertical interval is being
determined. These include the following:
1. Locate 2 index contour lines that are labeled with a specific elevation.
2. Now calculate the difference between the two-selected index contour line
selected from a map. To take the difference, subtract the higher elevated
line with the lower elevated line reading.
3. Now count the number of non-index lines contour lines between the 2
index contour lines selected for the contour interval calculating in the 1st
step.
4. The number of lines obtained in the above step is taken and added with 1.
For example: if the number of lines between 2 index lines are 4. Then add
1 to 4 that becomes 5.
5. The final step is the measure of the difference between 2 index lines (step
2) and the number of lines in between two index lines plus 1 (step 4).
6. The final answer we get after dividing is the contour interval of the specific
topographical map.
2.6.2. Spot heights and trigonometrical stations
A spot height is shown as a dot and the actual height in metres. Spot heights are mainly used where drawing of complete contours is difficult. This happens on such features as mountain peaks and hilltops. Trigonometrical stations are also known as triangulation points. Surveyors mark those using triangles or circles with a dot at the centre.
End unit assessment
Mugisha and Mucyo are traders in Kigali and they export goods made in Rwanda and import some missing commodities not locally produced. Sometimes goods delay as they are being transported from Mombasa port. Suppose you want to travel with these traders, explain how you would use a map to find out the distance from Kigali to Mombasa
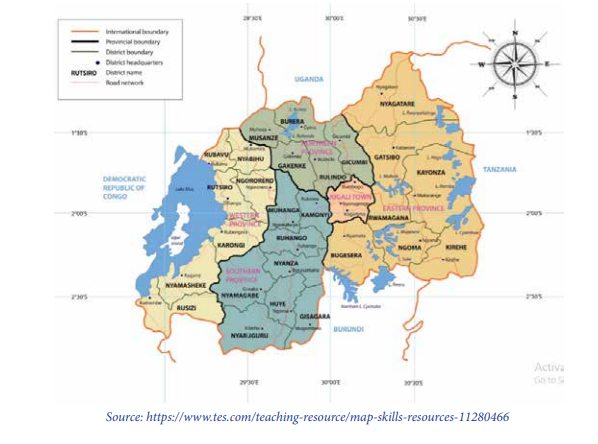
Imagine someone comes from Europe to visit Rwanda, specifically in Muhoza sector, Musanze district (see the map below). At Kigali airport someone gives him a map with a scale of 1:50 000. He/ she needs to know the bearing of Muhoza from Kigali.
1. Show how you would find the bearing of Muhoza if this visitor asked for
guidance.
2. What is the relative position of Muhoza from Kigali?
3. Basing on your general knowledge describe physical features that
make Musanze to be known and hence attracting many people all over
the world. In addition, explain the environmental hazards that use to
happen in its area of northern part of Rwanda.