General
- Chemistry S6 SB File Uploaded 28/01/22, 15:18
UNIT 10: INDICATORS AND TITRATION CURVES
Key unit competence
To be able to relate curves to the type of acid orbase titrated, properly choose and use indicators in acid and base titration
Learning objectives
At the end of this unit , students will be able to:
• Explain how the indicator works;
• Explain what is meant by the pH range of indicator;
• State the criteria for the selection of acid-base indicator for the use in titrations;
• Describe the changes in pH durind acid/base titrations;
• Perform experiments to show that the effectivenees of different indicators is related to the pH changes which occur during titration;
• Draw and interpret titration curves for various acid/base titrations;
• Match the titration curve to the type of acid and base titrated;
• Interpret pH curves of different titration reactions.
Introductory Activity
1. Explain the difference between acid and base.
2. Discuss the relationship between end point and equivalence point during titration
10.1. Definition of acid-base indicator
Activity 10.1Different types of indicators used in the Laboratory are given below.
a. Phenolphthalein indicator.
b. Methyl orange.
c. Litmus papers.
d. Methyl red.
e. Reagents of acid and base e.g. NaOH (aq) and HCl (aq)
f. Carry out different tests on acid and base above using different indicators and write down your observations.
An indicator is a substance which changes colour according to the nature of solution. An acid have indicator changes the colour according to wheather the medium is acidic or basic. Therefore it can be used to know if a solution is acidic or basic. It can also be used to determine the end point in a titration.
The substances that change colour when the acidity of the solution changes are known as acid-base indicators. A very common indicator used is litmus, which is obtained from lichen. Litmus paper is prepared by soaking absorbent paper with litmus solution and then drying it.
Acid-base indicators are used to find out the equivalence point of a titration.They change their colour within a certain pH range.
The titration is a process commonly used to determine the concentration of an acid or a base. During the titration, there are two main key points:
a. The amount of acid or a base mixed together must be controlled and measured
b. There must be some way of determining when enough acid or a base has been added to neutralize the solution.
The equivalence point informs us when enough acid or base has been added to neutralize the solution. The pH changes considerably near the equivalence point. A titration curve can be plotted to show the changes in pH.
In the previous units, it has been seen that acids are substances which donate a proton and become electron acceptors. Bases are proton acceptors and electron donors. During the titration process the concentration of unknown (acid or a base) is determined. Indicators are weak acids whose conjugate base is of different color.Indicators are weak organic acids or bases which changes color whenever there is a change in pH.
Indicators are used in titration solutions to indicate the completion of the acid-base reaction. Universal indicator is a mixture of indicators which give a gradual change in color over a wide pH range. The pH of a solution can be approximately identified when a few drops of universal indicator are mixed with the solution.
Checking up 10.1
Explain why each of the following procedures is used during acid –base titration in the laboratory.
1. After cleaning the burette some of the solution to be put inside it is added to the burette and rolled around inside them and then discarded.
2. You constantly swirl the reaction vessel as you perform the titration.
3. You should always keep your eye in line with the meniscus of the burette when reading the burette volume.
10.2. The pH range of indicators
Activity 10.2
1.Discuss your understanding of ionization of both weak acids and weak bases.
2. Discuss ionization of both strong acids and strong bases.
3. Explain the term conjugate base.
Weak acids or weak bases are classifies as weak electrolytes which ionize partially in solution while strong acids or strong bases as strong electrolytes ionize completely in solution.


At this point the equilibrium shifts to the right.
Under low pH (acidic) the concentration of H+ ions is high and the equilibrium
shifts to the left as predicted by Lechatelier’s principle.

At a low value of pH, a weak acid indicator is almost completely in the HIn form, the color of which predominates. As the pH increases, the intensity of the color of HIn decreases and the equilibrium is pushed to the right. Therefore, the intensity of the color of In- increases. An indicator is most effective if the color change is distinct and over a small pH range.


A good indicator for a specific acid-base titration has an endpoint with a pH at or near the pH of the equivalence point.
10.2.3. Choice of indicators
It is important to choose the correct indicator to be used. An indicator is appropriate for a given titration if the rapid change of pH at equivalence overlaps the pH range of the indicator. The table 10.2 summarizes some types of titrations and the choice of appropriate indicators for them

The pH at the equivalence-point must be known for the proper selection of an indicator
Note: Choose an indicator whose range lies on vertical section of the pH curve.
Checking up 10.2
1. Write the equation to show ionization of the weak acid HClO2 and the expression for its equilibrium constant.
2. How do you know that the Ka for any weak acid is a small number?
10.3. Acid-base titration curves
Activity 10.3
Explain how Acid—Base indicators are used to determine the equivalence point of a titration.
A titration curve is normally a plot of pH versus volume of titrant. It shows how the pH of an acid or base change as it is neutralized. For example as a base is added to acid, a gradual increase in pH will occur until the solution gets close to the equivalence point. Near the equivalence point, a rapid change in pH occurs. At the equivalence point, equivalent amounts of acid and base have been added and the pH will reflect which species are present. Beyond the equivalence point, when excess base is added an abrupt increase of PH is observed as a steep increase of the titration curve.
Titrations can result in acidic, basic, or neutral solutions at the equivalence point.
We can distinguish the following titration curves:
a. Strong acids – strong base titration curve where strong acids and bases are completely converted to H3O+ and OH- in water solution. This titration results in a neutral solution at the equivalence point.
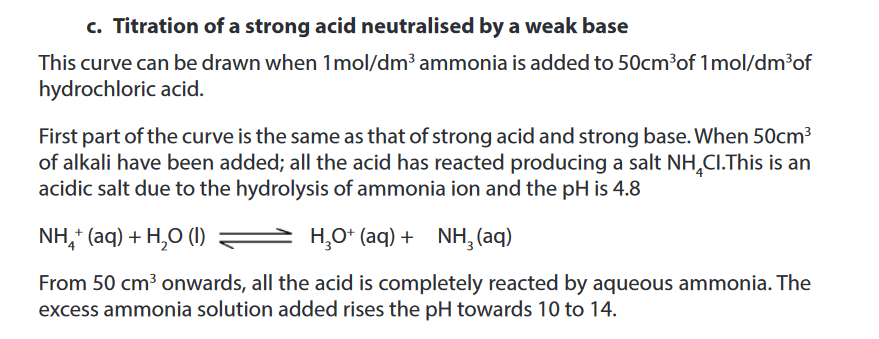
b. Strong acids titrated with weak bases result in acidic solutions at the equivalence point.
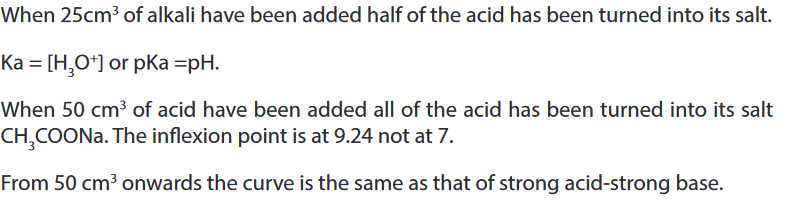
c. Weak acids titrated with strong bases result in a basic solution at the equivalence point.
d. Weak base and weak acid
Note: The following points are considered to plot pH titration curves:
• use graph paper
• orientation of axis
• naming of axis
- graduation of axis