General
- Geography S4 SB File Uploaded 25/01/22, 10:39
- S4 : Geography TG File Uploaded 11/08/22, 22:37
UNIT 2: Maps and cartographic projections
Topic area: Practical Geography
Sub-topic area: Map work interpretation
Key unit: competence By the end of this unit, you should be able to differentiate types of cartographic projections and categories of maps.
Unit objectives By the end of this unit, you should be able to:
• Recall the elements of a good map.
• Identify different types of maps.
• Outline the categories of maps.
• State different cartographic projections.
• Recall the grid reference systems (coordinates) on a map.
Activity 2.1
Do this in pairs.
1. Define a map.
2. Discuss your answers in class.
Maps
In Senior One, you defined a map as a representation of the features of an area of the Earth on a flat surface. The area could be on land or sea. Maps are usually drawn to scale on flat surfaces. Drawing to scale enables representations of large surface areas of land on the actual ground to be shown on small surfaces
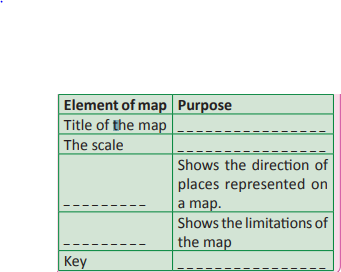
You also learnt about the key elements of a good map. These are the features of a maps that provide important information about particular maps. Study the map shown on page 35.
Activity 2.2
Work in groups.
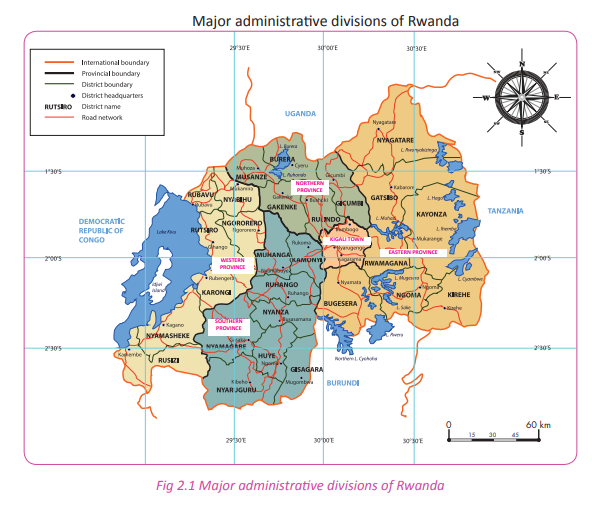
1. Identify and explain the importance of the five elements of a good map from Figure 2.1 on page 35.
2. Present the findings of your discussion in class.
3. Draw a sketch map of your school. In it, include the elements of a good map.
4. Display your work in class for your classmates and teacher to appraise
Activity 2. 3
In reference to the findings of each group it shows that a good map should have the following elements.
Types of maps
Activity 2.4 Work in pairs.
1. Name the types of maps that you have studied in your earlier classes.
2. Discuss their characteristics in class.
Maps are used for different purposes. They are therefore classified according to their uses. They are broadly classified into two types. They are general reference maps and thematic maps.
General reference maps show landforms, political boundaries, water and the locations of cities. They are mostly topographic in nature. These are the mostly used maps
Thematic maps show different but very specific topics. Such topics could be the average rainfall distribution of an area or the distribution of a certain disease throughout a country or population distribution. The different types of maps include:
• Topographic maps
• World map
• Globe maps
• Sheet maps
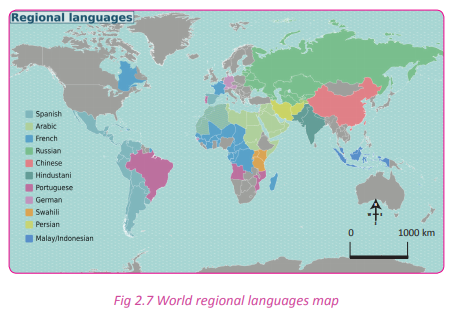
• Regional maps
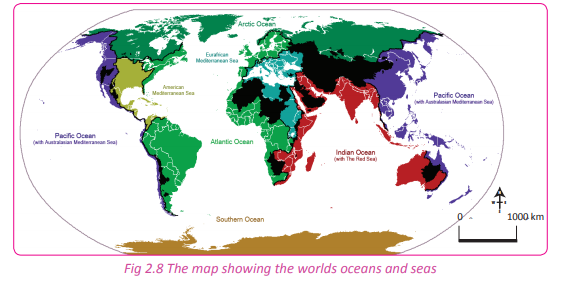
• Marine maps.
Topographic maps
Activity 2.5
In pairs, research using geographical sources on;
1. The meaning of topographical map.
2. Use the findings in class.
These are maps whose purpose is to show or represent both physical and human features found in an area.
Topographic maps have the following characteristics:
(a) They are large scale maps with scales such as 1:50,000.
(b) They are drawn basing on accurate surveys.
(c) They are drawn on sheets which have reference numbers.
(d) They show detailed data compared to other types of maps.
(e) They have all elements of a good map such as the title, scale, key, frame and compass.
Information on topographic maps The features shown on topographic maps are grouped into two. They are:
(a) Natural physical features
(b) Human made features
Natural physical features These are natural geographical features. They include the following:
• Lakes
• Rivers
• Vegetation
• Escarpments
• Hills
• Mountains
• Lowland areas
• Oceans
• Ponds
• Marshy areas or swamps
• Hills
• Swamps
• Plateaus
Human made features
These include the following:
• Boundaries
• Power lines
• Settlements such as towns, villages and huts.
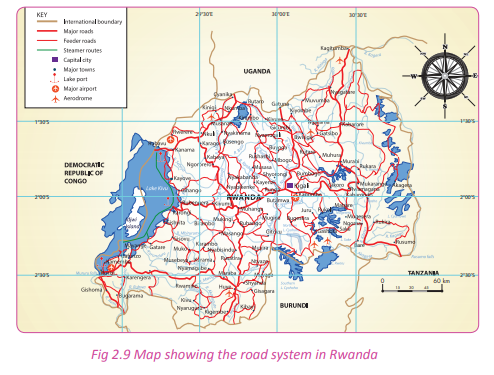
• Transport systems such as roads, airports, railways, seaports (harbours)
• Industrial infrastructure
• Recreational centres such as stadiums
• Mining areas
• Quarrying areas
• Agricultural projects and plantations.
Activity 2. 6
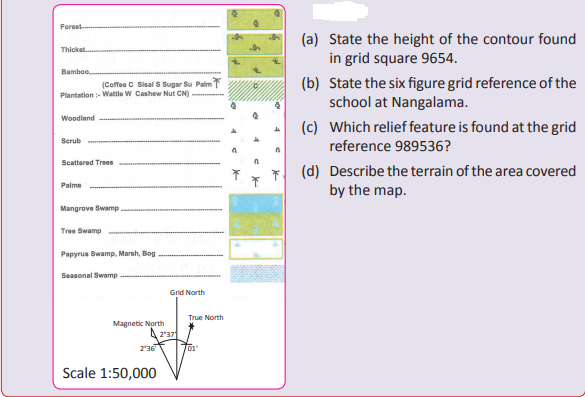
Work in groups of three. Study the map extract provided and answer the question that follow:
1. Name the type of map displayed above.
2. State the title of this map shown above.
3. Identify both physical and human features found in the area.
4. Examine the challenges people living in the area are likely to face.
5. Why is it necessary to conserve the physical features indicated on the map extract?
6. Write your answers and share your findings with the other class members.
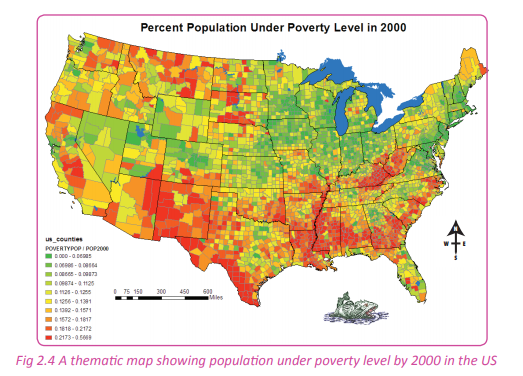
Thematic maps
Activity 2. 7
Work in pairs. Study the map shown below.
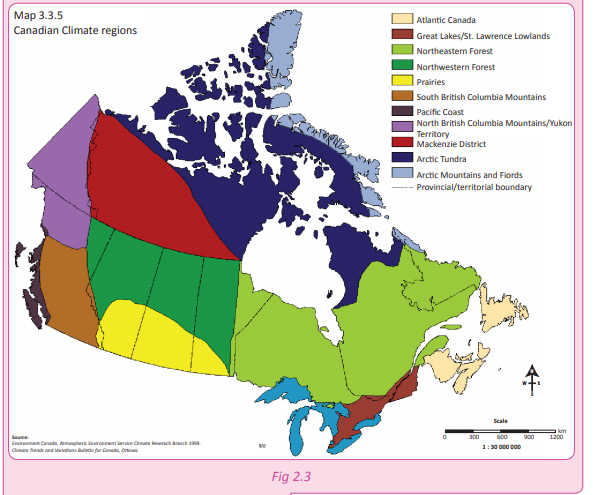
1. Find out what kind of map this is.
2. Explain what the map shows.
3. Share your findings in class.
These maps are specially designed to show particular theme connected with a specific geographic areas. They can portray physical, social, political, cultural, economic, agricultural, or any other aspects of a city, state, region, nation, or continent. They show aspects like elements of weather, population distribution, political,cultural or agricultural features of an area. Contour maps, dot maps and choropleth maps are examples of thematic maps. Thematic maps serve three primary purposes.
(a) They provide specific information about particular locations.
(b) They provide general information about spatial patterns.
(c) They can be used to compare patterns on two or more maps.
ther examples of maps are discussed below.
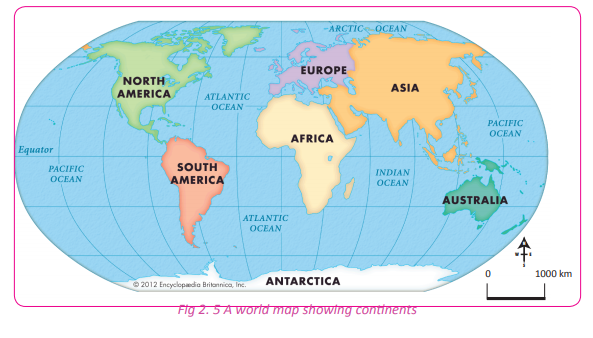
(a)World map
This is a map that represents the whole surface of the world. A world map may be thematic or general reference map depending on the intentions of the cartographer.
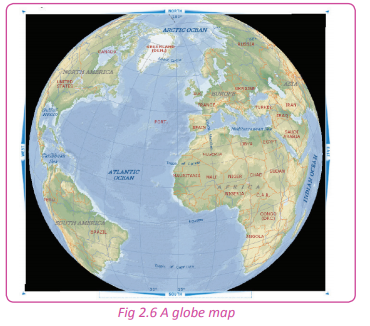
(b) Globe map
This is a map drawn to represent the world. It reflects the shape of planet Earth that is spherical shape.
(c) Sheet maps
Activity 2.8
Work in pairs. Use the Internet, atlas, Geography textbooks and journals.
1. Find out what a sheet map is.
2. Find out examples of sheet maps in Rwanda.
3. Record your findings for a presentation in a class discussion.
A map series is a group of topographic or thematic maps, charts or sheets that have the same scale and cartographic specifications. Each sheet is appropriately identified by its publisher as belonging to the same series. Map series occurs when an area is to be covered by a map that, due to its scale,must be spread over several sheets. The individual sheets of a map series can also be used quite independently since they have full map details and keys surrounding them. If a publisher produces several map series at different scales, then these series are called scale series.
(d) Regional maps
Regional maps may include several states, counties, zip codes or addresses. They could also include areas that are defined by sales territories, natural landforms, demographics or any other natural, statistical or subjective criteria. Often a region may cross a state, provincial or country borders. Regional maps may be any scale, content or style.
(e) Marine maps
These are maps drawn to represent the hydrological part of the Earth especially oceans and major seas.
Other examples of maps include;
(i) Socio-economic maps
These show information on:
• Crops
• Livestock
• Mining
• Transport
• Urbanisation
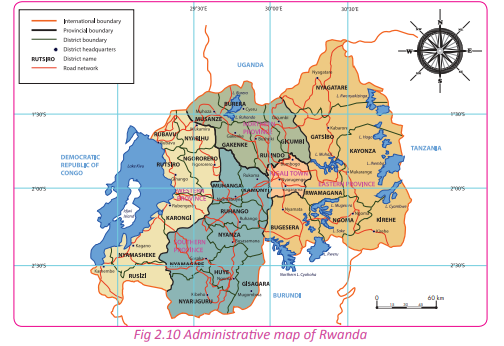
(ii) Political maps
These represent geo-political units of a given area such as:
• Political or local, regional or administrative boundaries.
• Population
• Settlements and international boundaries.
(iii) Vegetation maps
These show data on the distribution of different types of natural plant cover (vegetation)

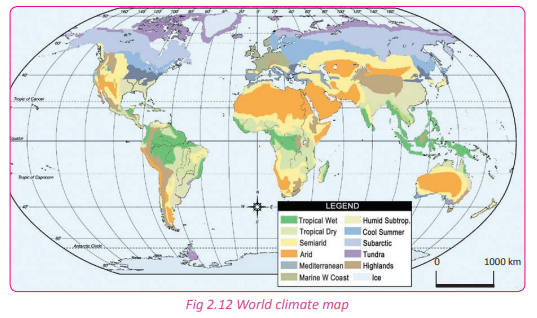
(iv) Climate maps
These show the general distribution of:
• Rainfall
• Temperature
• Pressure belts or barometric pressure
• Solar radiation etc.
• Movement of winds
Activity 2.9
Work in pairs.
1. Using a topographic map of Rwanda, provided by your teacher; describe the relief features across the country.
2. Describe the relief features of the district in which your school is located from a relief map of Rwanda.
3. Present your findings in a class presentation.
Task 2.1
1. Explain the meaning of the following.
(a) General reference maps
(b) Thematic maps
2. Why is it important to have the thematic maps in geography?
3. State and explain the key features a good map should have.
4. Analyse the information identified on a topographical map.
Categories of maps
Activity 2. 10
Do this in pairs.
1. Open your atlas and look at the maps inside the atlas.
2. Are all maps of the same size?
3. Give reasons why the maps are of different sizes.
4. Write down your answers for a class discussion.
There are mainly three categories of maps. The categories are based on the scales used. They include the following.
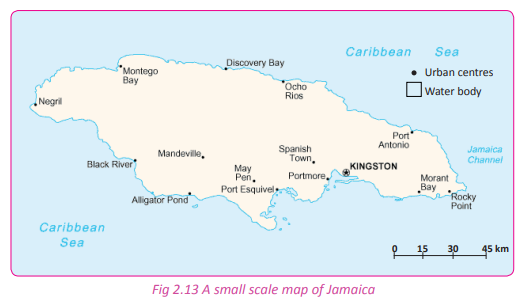
(a) Small scale maps
Small scale refers to maps of large regions such as continents or large nations that show large areas of land on a small space. They are called small scale because the scales used are relatively small. A small scale map shows large territories but with less details. An example of a small scale used on a map would be 1:5 000 000.
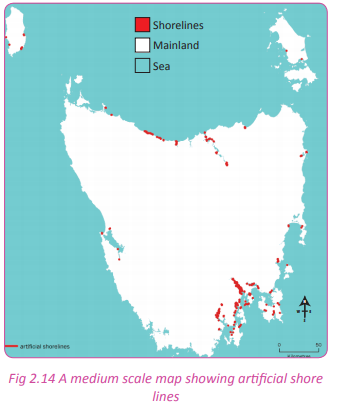
(b) Medium scale map
A map having a scale larger than 1:600,000 and smaller than 1:75,000 is referred to as a medium scale map.
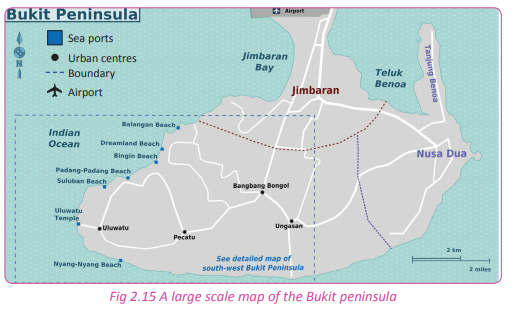
(c) Large scale maps
These maps represent small areas and at the same time indicate more details. These maps are commonly used in secondary schools. Topographical maps also fall under this category. An example of a large scale used on a map would be 1:20 000.
(d) A plan
Activity 2. 11
Do this in groups of three. 1. Draw the setting plan of your classroom.
2. Display your plans on the classroom noticeboard.
3. Your teacher and other students should give their comments on the plan.
This is a large-scale map of a small area that includes details. The common examples include plans of cities such as Kigali and other urban areas. Plans can be created on a scale of 1:50,000.

Activity 2.12
Do this in pairs.
1. Study different maps in your atlas.
2. Classify the maps as small, medium or large scale.
3. Identify plans from the atlas.
4. Share your findings with your classmates in a class discussion.
Cartographic projections
Activity 2.13
Using the Internet, Geography textbooks, magazines and journals.
1. Find out what a cartographic projection is.
2. Discuss how important it is in Geography.
3. Share your findings in a class presentation.
A cartographic projection is a mathematical technique used by the cartographers while representing the curved globe surfaces onto a plane of a flat map. In other words, cartographic projections are ways used to transform the curved surfaces of the earth onto flat map surfaces. It is important to note that cartographic projections do not always represent the true nature of the actual area as on the globe. Distortions in the representations are expected.
These distortions have effects on the different angles, shape, distance, areas and lengths of areas on the Earth’s surface. This implies that maps do not provide a perfect representation in relation to the actual areas being represented. Cartographic projections are also known as map projections.
Types of cartographic projections
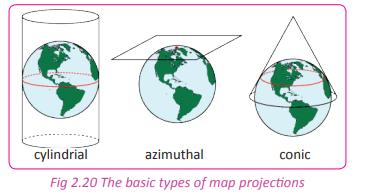
There are various types of cartographic projections in map work. These protections are used to reduce the distortions while drawing maps. They include the following.
(a) Azimuthal projection
Activity 2.14
Use the Internet, Geography textbooks and journals.
1. Find out the meaning of an azimuthal cartographic projection.
2. Discuss when it is suitable for it to be used on maps.
3. Present your findings in class
This is a map projection in which a globe, such as the Earth, is assumed to rest on a flat surface onto which its features are projected.
An azimuthal projection produces a circular map with a chosen point— the point on the globe that is tangent to the flat surface— at its centre. When the central point is either of Earth’s poles, latitudes appear as concentric circles on the map. Longitudes appear as straight lines radiating from the centre. Directions from the central point to any other points on the map are accurate.
However, distances and shapes in some azimuthal projections are distorted away from the centre.
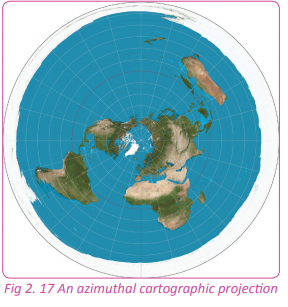
Characteristics of an azimuthal projection
• Lines of latitude and longitude are intersecting at 90°.
• Longitudes are straight lines.
• Latitudes are concentric circles.
• The scale near the centre is true.
• The pole is represented as a point.
• It can have the properties of equidistance, conformality or equal area.
Due to its characteristics, azimuthal projections are favoured on maps that represent polar zones.
(b) Conical cartographic projection
Activity 2.15
Using the Internet, Geography textbooks and journals;
1. Find out the meaning of a conical cartographic projection.
2. Discuss when it is suitable for it to be used on maps.
3. Present your findings in class.
This is a method of projecting maps of parts of the Earth’s spherical surface on a surrounding cone. The cone is flattened to a plane surface having concentric circles as latitudes and radiating lines from the apex as longitudes. Conical projections are not widely used in small scale mapping because of their relatively small zone of reasonable accuracy.
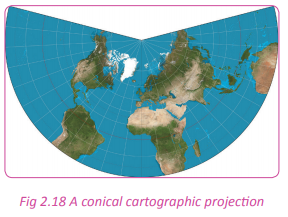
Characteristics of conical projections
• Lines of latitude and longitude intersect at 90°.
• Longitudes are straight lines.
• Latitudes are concentric circular arcs.
• The scale along the standard latitude(s) is true.
• It can have the properties of equidistance, conformality or equal area Owing to a simple construction and inherent distortion pattern, conical projections have been widely employed in national or largescale regional maps of temperate zones.
(c) Cylindrical cartographic projection
Activity 2.16
Use the Internet, Geography textbooks and journals.
1. Find out the meaning of a cylindrical cartographic projection.
2. Discuss when it is suitable for it to be used on maps.
3. Present your findings in class.
This is a map projection in which the surface features of a globe are depicted as if projected onto a cylinder. It is positioned with the globe centred horizontally inside the cylinder. Distortion of shape and scale in a cylindrical projection of the Earth is minimal in equatorial regions and maximal at the poles.
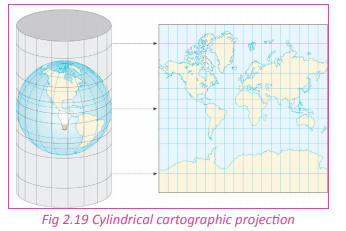
Characteristics of a cylindrical projection
• Lines of latitude and longitude are parallel and intersect at 90°.
• Longitudes are equidistant.
• It forms a rectangular map.
• The scale along the equator or standard latitudes is true.
• It can have properties of equidistance, conformality or equal area.
• The poles are represented as lines.
• This projection is favoured on maps that represent the tropical region or zones.
Classification of distortion properties of a map
While dealing with cartographic projections, distortions are identified. Some of them are unavoidable when the actual map is drawn. These distortions in relation to the actual area being represented are classified into three properties. They are
• Equidistant
• Conformal
• Equal-area
Equidistant property
The equidistant projection shows all points on the map are at proportionately correct distances from the centre. All points on the map are at the correct direction from the centre point. Distances and directions to all places are true only from the centre point of projection. Distances are correct between points along straight lines through the centre. All other distances are incorrect. Distortion of areas and shapes increases with distance from the centre point.
Conformal property
In the conformal property, correct shapes of small areas are preserved. Graticule lines intersect at 90- degree angles, and at any point on the map the scale is the same in all directions. A conformal projection maintains all angles at each point, including those between the intersections of arcs. Therefore, the size of areas enclosed by many arcs may be greatly distorted. No map projection can preserve the shapes of larger regions.
Equal area property
In the equal area property, the projection is undistorted along the equator which is the standard latitude. However, distortion increases rapidly towards the poles. Latitudes are stretched increasingly away from the equator. The poles mount up to endless distortion, becoming lines instead of points.
Activity 2.17
Do this in pairs.
Use the Internet and the atlas and other geographical documents.
1. Identify maps showing the following zones;
(i) Equatorial zone
(ii) Polar zone
(iii) Temperate zone
2. Identify and match the cartographic projection that defines the maps for each of the zones identified.
3. In a discussion, describe and write down the characteristics of each of the cartographic projections identified.
4. Present your findings in a class discussion for a question and answer session.
Activity 2. 18
Do this in groups of three.
1. Describe the cartographic projection that best represents Rwanda.
2. Write a report with the characteristics that justify the cartographic projection chosen.
3. Share your findings in class.
Location of areas on topographic maps using grid reference systems
Activity 2.19
Do this in pairs.
1. Define latitudes and longitudes.
2. Discuss the importance of latitudes and longitudes to a geographer.
3. Discuss your findings in class.
In Senior One, you learnt how to locate phenomena on maps using latitudes and longitudes. In Senior Four, you are going to learn how to locate places and phenomena on maps using the grid reference system. The location of an area or geographical aspect or feature on both land and maps can be determined in several ways. The common way is the use of latitudes and longitudes.
Use of grid reference or geographical coordinates
Grid references define locations on maps using Cartesian coordinates. Grid lines on maps define the coordinate system. They are numbered to provide a unique reference to features. The grid reference is also referred to as the geographical coordinates. A series of faint blue lines on every map makes up a numbered grid that is used to create the Grid reference. The use of the grid reference system is a simple way of finding points and places on a map.
Grid systems vary, but the most common is a square grid with grid lines intersecting each other at right angles. They are also numbered sequentially from the origin at the bottom left of the map. The grid numbers on the west-east (vertical) axis are called Eastings. The numbering of the Eastings increases towards the East.

The grid numbers on the south-north (horizontal) axis are called Northings. The Northings have their names because of the northward numbering order. Their numbering increases northwards.
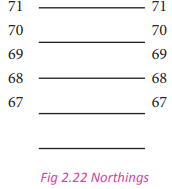
Fig 2.22 Northings Grids may be arbitrary, or can be based on specific distances. For example some maps use a one-kilometre square grid spacing. A grid reference locates a unique square region on the map. The precision of location varies. For example a simple town plan may use a simple grid system with single numbers for Eastings and single numbers for Northings.
Statement of grid reference
The grid reference can be expressed in two ways. They are: (i) A four-figure grid reference (ii) A six-figure grid reference
A four-figure grid reference
This is where the grid reference numbers used to locate a given feature or an area on a map is made up of four digits such as 4767, 9845, 2848 etc. When using grid reference numbers, the Eastings are written first followed by the Northings.
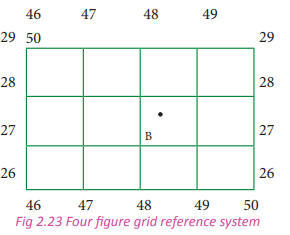
From Figure 2.23 above, the location of location B using a four figure grid reference is Easting 48 and Northing 27. Therefore, the grid reference of location B is 4827 in a four figure grid reference system.
A six-figure grid reference
This is the most commonly used system for locating features or locations on a map. It is made up of six digits. The Eastings are first identified followed by the Northings. The square in which the area or a feature is found is partitioned into imaginary tenths or 10 equal units between two successive Easting and Northing lines. The purpose of this division of squares is to get the exact point of location for the area or feature identified.
Numerical grid references consist of an even number of digits. Eastings are written before Northings. Thus in a 6 digit grid reference 123456, the Easting component is 123 and the Northing component is 456.
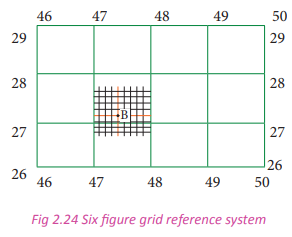
From Figure 2.24 above, the square in which feature B is located is divided into ten equal units. This means that each square has 0.1 share of the complete square. After partitioning, begin numbering using the Eastings. In this case, the Easting for location R is 32 followed by Northing 27. Then add there the equivalent of the specific line that partitions as the Easting; this is the 4th position. This is where the red line of the Eastings passes. Then write the Eastings as 324. In the same manner, count the lines that partition the square as the Northings. Location R is on Northing 4. This is where the red line passes. Write down the Northings as 274. Combine the two sets of numbers to get the grid reference location for location R as 324274 in the six figure grid reference.
Note:
• Always begin numbering the grids with the Eastings.
• The numbering of the Northings comes after the Eastings.
Activity 2.20

1. Give the six figure grid reference of the dispensary in Naam Okora area.
2. Using contour lines, describe the landscape of an area shown on the map.
3. Which economic activities are the people who live in the area likely to engage in?
4. Give the four figure grid reference of the borehole in the area.
Did you know?
• All map projections have a degree of distortion. No projection gives a perfect representation.
• There are four basic characteristics of a map that are distorted to some degree. They include distance, direction, shape, and area.
• Topographic and general reference maps summarise the landscape.
• Thematic maps describe the landscape.
• A map which depicts a small area is referred to as a large scale map while a map depicting a large area is referred to as a small scale map.
End of unit revision task
1. (a) Define a map.
(b) List and explain the elements of a good map.
2. (a) Identify and describe the different types of maps.
(b) Giving specific examples, outline four categories of maps.
3. (a) Define the term cartographic projection.
(b) With clear illustrations, describe the characteristics of the three major classifications of map projections. (c) Describe the distortion properties of maps.
(d) Why should cartographers use cartographic projections when drawing maps?
4. (a) Name and explain the map projection that is suitable for the following regions where the following countries are found;
(i) Rwanda
(ii) Alaska in the USA
(iii) Great Britain
(b) Identify the aspects that are likely to be transformed or distorted in the process of transferring information from the earth to a map.
5. (a) Explain the grid reference system
(b) Name two ways in which a geographer can use to locate places and features on a map.
(c) Differentiate between Eastings and Northings.
(d) Differentiate between a fourfigure and six-figure grid references.