General
- P5: Mathematics File Uploaded 31/07/22, 11:26
- P5: Mathematics TG File Uploaded 1/08/22, 18:29
- P5 MATH TG ( Adapted ) File Uploaded 2/11/22, 08:28
- END UNIT 1 ASSIGNMENTOpened: Saturday, 27 May 2023, 12:00 PMDue: Monday, 29 May 2023, 12:00 AM
UNIT 14:Statistics
14.1 Continuous and Discrete Quantitative data
Activity 14.1
1. Question: What type of data are your heights?
Materials: Tape measure or ruler.Steps:
(i) In groups, measure your heights. Record your results in the table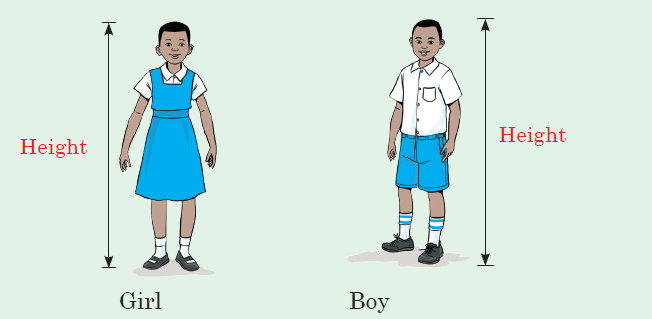
below.(ii) Observe the values you record.
(a) Name the type of data you collect. Discuss your answer.
(b) Does your data have various values that include decimals?
2. Now, form a question to collect data for
• distance to school compound.
• time taken to get to school.Follow the same process you used in (1).
Activity 14.2
1. Question: How many brothers and sisters do you have?
Steps:
(i) In groups, make a chart below. State and record your number ofsisters and brothers.
(ii) Observe the values you record. Do they take various values? Do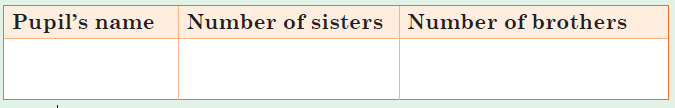
your values include decimals? Explain your answers.
2. Now, follow the same steps and form questions to collect data on:
– Shoe sizes worn by adults.– Shoe sizes worn by children.
Task
Discuss the differences in the type of data from Activity 14.1 and 14.2.
Show a summary of the type of data you collected.
Tip:
• Data with numerical values is called quantitative data.
• The values for numerical data can be whole numbers only. Such data
is discrete.
• The values for numerical data can take any number including decimals.Such data is continuous.
Example 14.1
From Activity 14.1 and 14.2, state the type of quantitative data you
collected.
Solution
(a) Discrete quantitative data include: number of brothers or sisters
you have and shoe size worn by different people.
(b) Continuous quantitative data include: distance from home to school,
time taken to get to school and heights of pupils in class.(c) Discuss and name other discrete and continuous quantitative data.
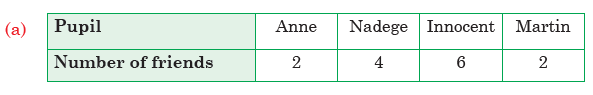
Practice Activity 14.11. The following data was collected by a group of pupils.
(i) What type of data was collected?
(ii) Is the data discrete or continuous? Explain your answer.
2. A class collected numerical data on the following.
(a) Shoe sizes worn by pupils in school.
(b) Time taken to run twice round the field.
(c) Distance from home to school for group members.
(d) Number of parents for different pupils in a class.Draw a table and group the data accordingly. Discuss your answers.

3. Shyaka and Filonne collected the following data
In each case, identify the type of quantitative data?Explain your answer.
14.2 Representing data using bar charts
Activity 14.3
Represent the data you collect in Activity 14.1 and 14.2 using a bar chart.
Explain your bar chart.Tell cases where you can represent data using bar graphs.
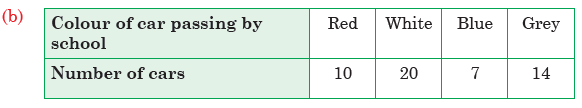
Example 14.2The table below contains data about the number of cars in a car park.
Represent the data in a bar chart.
Solution
Steps:
• Draw horizontal and vertical axes. Label them as shown.
• Choose a good scale to allow you to plot the data easily.
• Mark the length of bars as per the number of cars for each colour.Draw them.
Practice Activity 14.2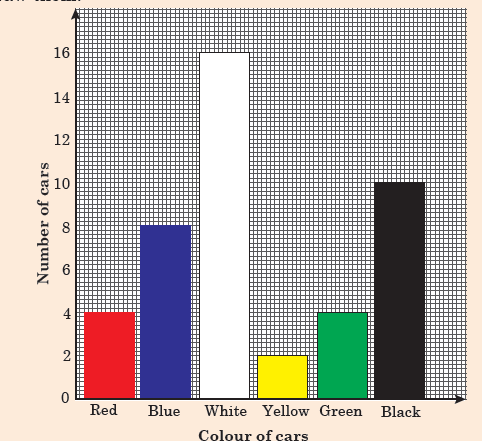
1. The table below contains data for heights of family members.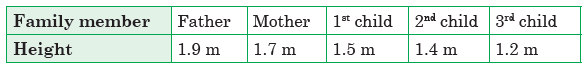
Represent the data using a bar chart.2. The table below contains data for shoe sizes for different people.
Represent the data using a bar chart.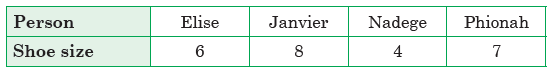
3. The table below contains data about the number of books each pupilhas.
Represent the data using bar chart.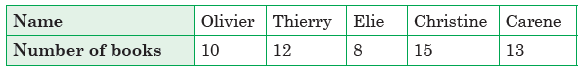
4. What type of data are those in questions 2 and 3?
14.3 Interpreting bar charts
Activity 14.4Study the bar chart below.

(a) What is the bar chart about? Explain.
(b) Read the height of:
(i) Dad (ii) Mum (iii) Boy (iv) Girl
Tip: In interpreting bar charts
(i) Read the lengths of bars and the information they represent. Check
the vertical axis.
(ii) State the information represented by each bar. Check the horizontal axis.
Example 14.3
From Activity 14.4, answer the following.
(a) What information is shown by the bar chart?
(b) Who is the tallest?
(c) Who is 150 cm tall?
(d) How is bar chart important to you?
Solution
(a) On the vertical axis, we have height (in cm).
On the horizontal axis, we have family members.
The information shown is the heights of family members.
(b) Dad is the tallest. His height is 180 cm.
(c) Starting from vertical axis, at 150 cm put a ruler. Draw a dotted line
to see which bar is at 150 cm.
The bar representing the Girl is at 150 cm. The girl is 150 cm tall.
Practice Activity 14.31. Look at the bar graph below.
(a) How many pupils measured their heights?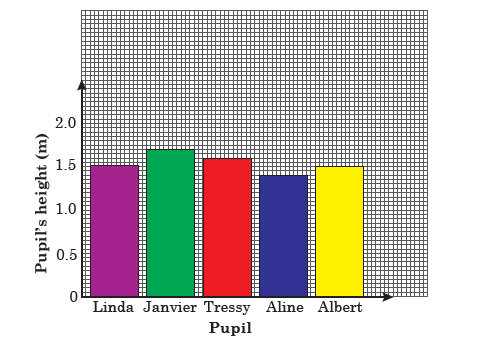
(b) What information is shown on the graph?
(c) Who is the shortest?
(d) How many metres tall is the tallest pupil?
(e) Which pupils were the same height?2. Study the bar chart below.
(a) What is the bar chart about?
(b) How many pupils did the mathematics activity?
(c) What is the highest score?
(d) Who scored the lowest mark?
(e) Which pupils scored the same mark?
(f) Who scored the highest mark?
(g) How many more marks did Ruth score than Rosy?What score did Seth get?
14.4 Representing data using line graphs
Activity 14.5
Materials: Metre rule or tape measure.
• Measure the length of your shadow at the following times. Record
your findings in the following table.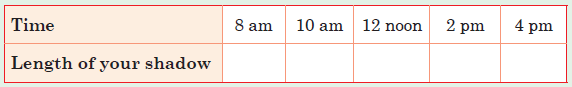
• Represent your data using a line graph. Discuss your steps.Where can you use line graphs to represent data in daily life?
Tip: To draw a line graph;
(i) Choose a suitable scale for all values.
(ii) Draw axes and label them.
(iii) Plot points on the graph.(iv) Join the points using straight line.
Example 14.4Below is data for the distance covered by a cyclist at different times.
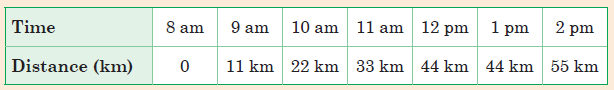
Represent the data using a line graph.
Practice Activity 14.4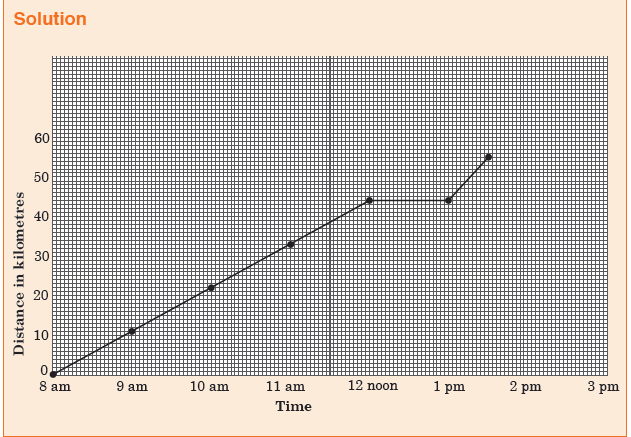
1. Study the data in the table below. It shows the distance travelled by a
motoris
Represent the data using a line graph.
2. The data below is the amount of water used by a family after every two
hours.
(a) Represent the data using a line graph.
(b) Why was the amount of water the same from 11 a.m to 1 p.m?
Explain your answer.
3. A pupil did a number of competence exams. She got the following
marks at different times.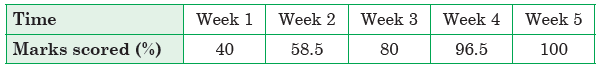
Represent the data using a line graph.
Was the pupil improving in performance or not? Explain your answer.
4. A farmer planted a crop. She measured its height after every two
months. She recorded the data below.
Represent the data using a line graph. Discuss your steps to draw anaccurate line.
14.5 Interpreting line graphs
Activity 14.6
Look at the line graph below. It represents data for distance covered byan athlete.
(i) What is the line graph about?
(ii) How many seconds does the athlete take to cover 100 m? Explain
the steps you used to find the answer.
Example 14.5
Study the graph in Activity 14.6. Answer these questions:
(a) What distance does the athlete cover in 4 seconds?
(b) How long does it take the athlete to cover 75 m?
(c) Find the distance the athlete covered in 8 seconds.
(d) How is line graph important to you?
Solution
(a) Put the ruler vertically at 4 seconds. It cuts the line at 25 m.
(b) Put the ruler horizontally at 75 m. It cuts the line at 12 seconds.(c) In 8 seconds, the athlete covered 50 m.
Practice Activity 14.51. Look at the graph below.
(a) What is the graph about?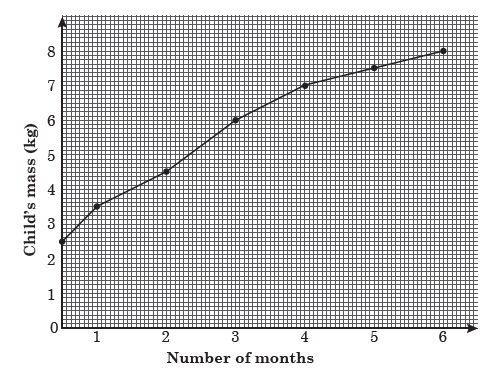
(b) What is the mass of the child at birth?
(c) Read the mass of the child at 3rd month.
(d) At what month is the mass of the child 7 kg?
(e) What is the change in the child’s mass from the 3rd to the 4th month?
2. A motorist started a journey from town A to B. The data is representedin the graph below.
(i) How far is town A from B?
(ii) What time did the motorist start the journey?
(iii) What time did the motorist start to rest?
(iv) What distance did the motorist cover from 11.00 a.m to
11.30 a.m?(v) Find the time taken to reach town B after resting.
Revision Activity 141. In a school the following data was recorded.
(a) Name the type of quantitative data above. Explain.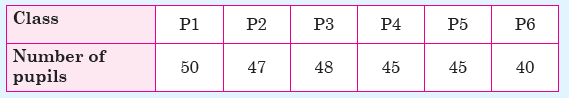
(b) Represent the data using a bar chart. What do you notice?
(c) From your bar graph;
(i) Which class had the highest number of pupils?
(ii) Which two classes had the same number of pupils?
2. In a cross-country race, a top athlete was involved. The time anddistance covered are represented below.
(a) What was the distance ran by the athlete?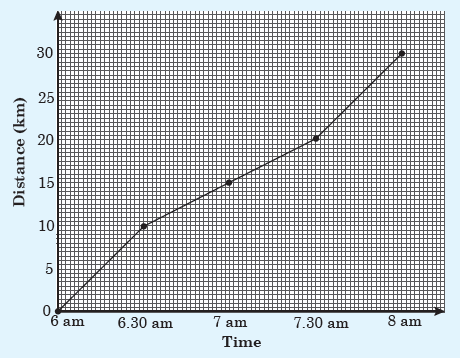
(b) At what time did the athlete complete the race?
(c) At what time did the race begin? Explain your answer.
(d) How much distance had the athlete completed at 7.00 a.m?
(e) At what time had the athlete run 10 km? Discuss the steps
to your answer. What are the importance of interpreting line
graphs?
3. The amount of rainfall was recorded for a certain town.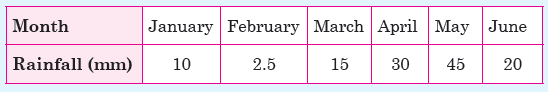
(a) What type of quantitative data was collected?
(b) Represent the data using a line graph.(c) From your graph, which month had the highest rainfall? Explain.
Word list
Quantitative data Continuous quantitative data
Discrete quantitative data Record Collect data
Represent data Interpret data Bar graph
Line graph
Task
Do the following.
(i) Read each word aloud to your friend.
(ii) Write the meaning of each of the words above. Discuss with your friend.(iii) Write sentences using each of the words above. Read with your friend.