UNIT 2: LINEAR INEQUALITIES AND THEIR APPLICATION IN LINEAR PROGRAMMING PROBLEMS
Key unit competencies: Solve linear programming problems
Introductory activity
1. Formulate 3 examples of linear inequalities, then perform the following:
(a) Form a system of linear inequalities. (b) Represent them on Cartesian
plane. (c) Show their meet region. (d) Establish the linkage betweenthem.
2. The two production companies produce two different drinking products
that, after being prepared, are graded into three classes: high, medium,
and low-quality. The companies agreed to provide 1200 dozens of high-
quality, 800 dozens of medium-quality, and 2400 dozens of low-quality
drinks per day. Both companies had different operating procedures andtook weekends off. Their specifics are provided below.
Apply the linear inequality concepts to present the above information and
determine the hour per day each company be operated to fulfill the signedcontract.
2.1 Recall of linear inequalities
Learning activity 2.1


Note that:
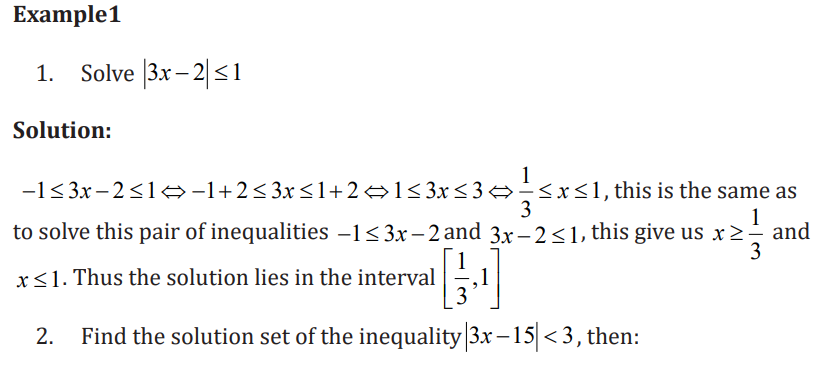
– When the same real number is added or subtracted from each side ofinequality the direction of inequality is not changed.
The direction of the inequality is not changed if both sides are multiplied
or divided by the same positive real number and is reversed if both sidesare multiplied or divided by the same negative real number.



Problems involves linear inequalities
Inequalities can be used to model a number of real life situations. When
converting such word problems into inequalities, begin by identifying how the
quantities are relating to each other, and then pick the inequality symbol that is
appropriate for that situation. When solving these problems, the solution will
be a range of possibilities. Absolute value inequalities can be used to modelsituations where margin of error is a concern.


Application activity 2.1

2.2 Basic concepts of linear programming problem (LPP)
2.2.1 Definition and keys concepts
Learning activity 2.2.1
The following graph illustrate two lines and their equations, for each point
A, B, C, and D, replace its coordinate in the two inequalities to verify whichone satisfies the following system:
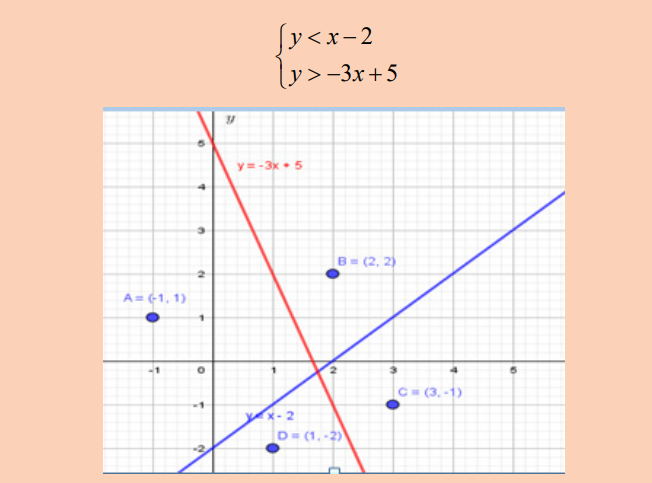
1. What are your observations on the graph as a future accountant?
2. Show the solution of these linear inequalities.
3. What is the common solution?
4. Where do we need this solution in Economics?
– A system of inequalities consits of a set of two or more inequalities with
the same variables. The inequalities define the conditions that are to beconsidered simultaneously.
– Each inequality in the set contains infinitely many ordered pair solutions
defined by a region in rectangular coordinate plane. When considering two
of these inequalities together, the intersection of these sets will define theset of simultaneous ordered pair solutions.
– A system of linear inequalities is similar to a system of linear equations,
except that it is made up of inequalities rather than equations. To modelscenarios with multiple constraints, systems of linear inequalities are used.
In finding solution, first, graphs the “equals” line, then shade in the correct
area. The following steps will be considered to find the solution of simultaneous
linear inequalities with two unknowns graphically, but for more than two isimpossible:
Linear inequalities with more than two unknowns are solved to find a range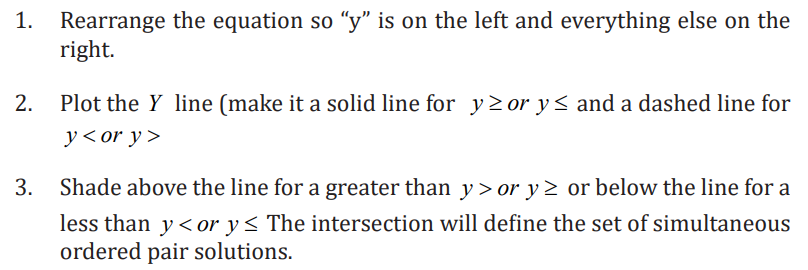
of values of three or more unknowns which make the inequalities true at the
same time. The solution is not represented graphically but we can apply one of
the following methods we expended in senior five Accounting, include Gaussian
elimination, comparison, substitution, or matrix inversion methods, and youare advised to review for recall on yourself.
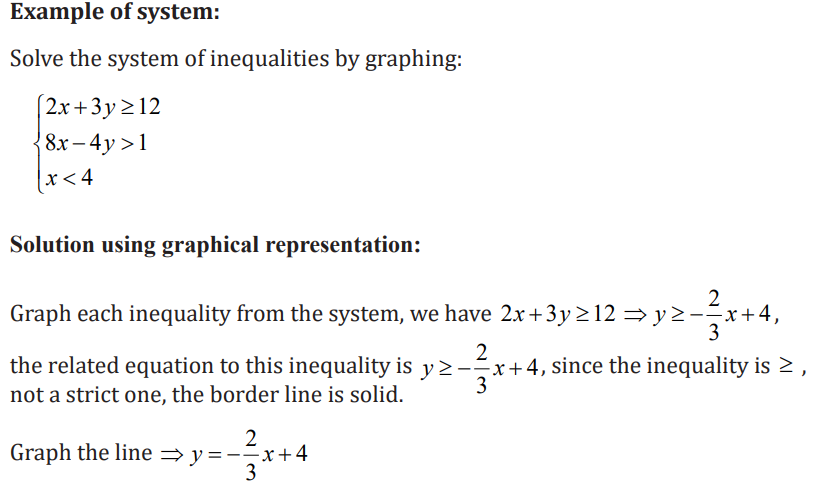

The solution of the whole system of inequalities is provided by the intersection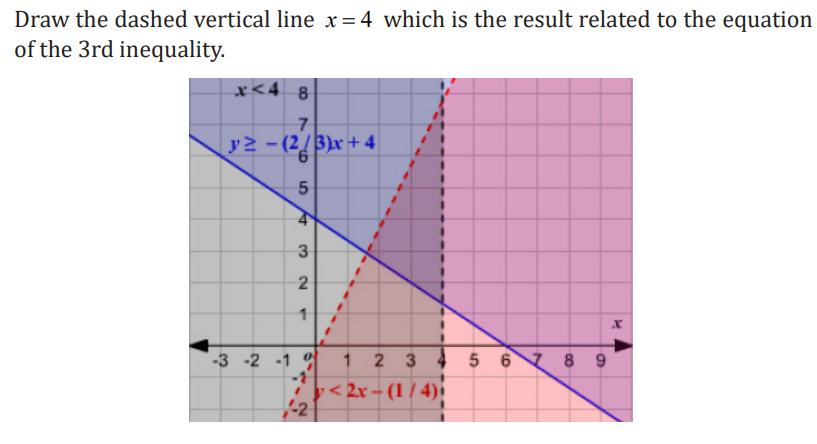
region of the solutions of all the three inequalities as it is shown in the figurebelow.
Linear programming is a subset of Operations Research (OR), an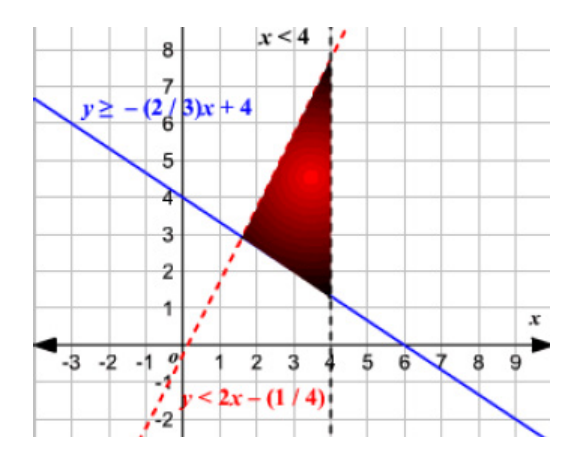
interdisciplinary branch of formal science that employs methods such as
mathematical modeling and algorithms to find optimal or near-optimal solutions
to complex problems. It has the goal of optimizing the solution (minimize costor maximize profit).
Therefore, Linear programming deals with the optimization (maximization or
minimization) of a function of variables known as objective function, subject
to a set of linear equalities and/or inequalities known as constraints. The
objective function may be profit, cost, production capacity or any other measureof effectiveness, which is to be obtained in the best possible or optimal manner.
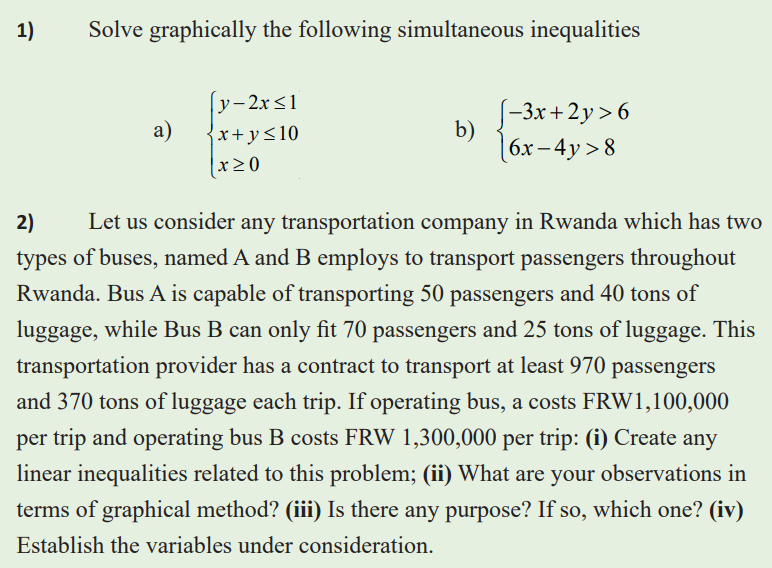
Application activity 2.2.1
2.2.2 Mathematical models formulation and optimal solution
Learning activity 2.2.2
Refer to the application activity 2.2.1 where the transportation company
has signed a contract to transport at least 970 passengers and 370 tons of
luggage each trip and transport passengers in Rwanda with Bus A which is
capable of transporting 50 passengers and 40 tons of luggage, while Bus B
can only fit 70 passengers and 25 tons of luggage. If operating bus A costs
FRW1, 100,000 per trip and operating bus B costs FRW 1, 300,000 per trip.Then perform the following:
i. Without computation, which bus option will result in the lowestoverall cost per travel? Why?
ii. How can you reduce expenses?
A model in mathematics is simplified representation of an operation or a
process in which only the basic aspects or the most important features of a
typical problem under investigation are considered.
The objective of a model is to provide a means for analyzing the behaviour of
the system for the purpose of improving its performance. There are several
models in each area of business, or industrial activity. For instance, an account
model is a typical budget in which business accounts are referred to with the
intention of providing measurements such as rate of expenses, quantity sold,
etc.; A mathematical equation may be considered to be a mathematical modelin which a relationship between constants and variables is represented.
A model which has the possibility of measuring observations is called a
quantitative model; a product, a device or any tangible thing used forexperimentation may represent a physical model.
In this course Mathematical Model is used to model an object or situation from
the real world using mathematical ideas. It helps us understand the real world
and is used to improve many aspects of our lives. Mathematical models are an
essential part of the working world, from safety to planning and construction.
More broadly, a model is a representation of an object or idea that is used togain a better understanding of the real thing.
The procedures of translating any real world to mathematical problems are in
the table below.

Objective Function
The objective function is a mathematical equation that describes the production output
target that corresponds to the maximization of profits with respect to production. It
attempts to maximize profits or minimize losses based on a set of constraints andthe relationship between one or more decision variables. It is given by Z ax +by

Constraints
The objective function is subject to certain constraints, expressed by linear
inequalities. These constraints are actually the limitations on the primarydecision variables.
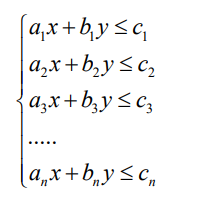
Each inequality constraint system determines a half-plane.
Feasible Solution
The feasibility region of the linear programming problem shows set of all
feasible solutions. A feasible solution of the linear programming problemsatisfies every constraint of the problem.
Corner points
Are the set of all points near feasible solution, and in these points we have to
choice the point which help us to maximize or minimize the objective functionas an optimal point.
Optimal Solution
It is also included in the feasible region; however, it represents the maximum
objective value of the function for the problem which requires maximization and
smallest objective value of the function that requires minimization. There are
many methods to solve linear programming problems. These methods include
a graphing method, Lagrange multipliers method, simplex method, northwest
corner method, and least cost method, etc. At this level, students will see only
how to solve problems using the graphical method only. Other methods will bestudied at the university level.
Example 1:
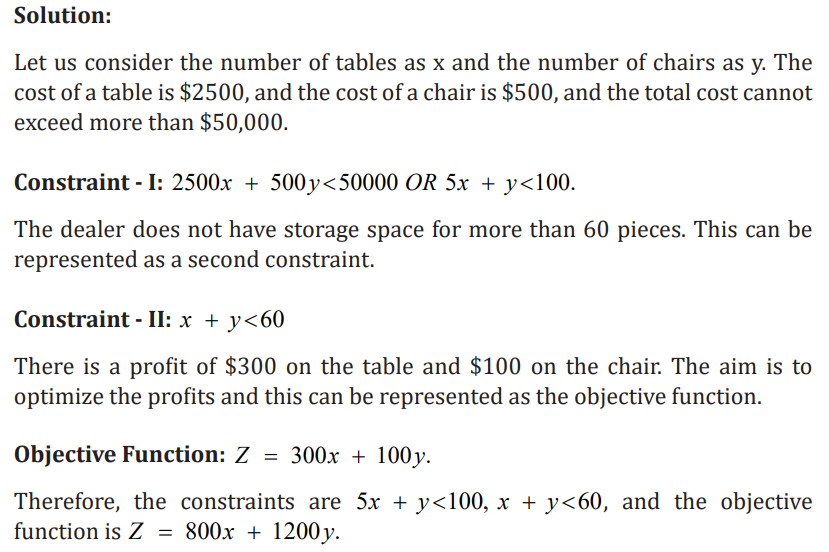
A furniture dealer has to buy chairs and tables and he has total available money
of $50,000 for investment. The cost of a table is $2500, and the cost of a chair is
$500. He has storage space for only 60 pieces, and he can make a profit of $300
on a table and $100 on a chair. Express this as an objective function and alsofind the constraints.
Example 2:
A furniture company produces office chairs and tables. The company projects
the demand of at least 100 chairs and 50 tables daily. The company can produce
no more than 120 chairs and 70 tables daily. The company must ship at most
150 units of chairs and tables daily to fulfill the shipping contract. Each soldtable results in the profit of 50 and each chair produces15 profit
a) How many units of chairs and tables should be made daily to maximizethe profit?
b) Compute the maximum profit the company can earn in a day?
Solution
a) Let x stands for the number of chairs sold daily, y stands for the numberof tables sold daily.
The objective function is given by P= 15x +50y ,

We graph the constraints inequalities on a Cartesian plane, and we obtain the following:
At point (100, 50) is there only one feasible solution which is also the optimal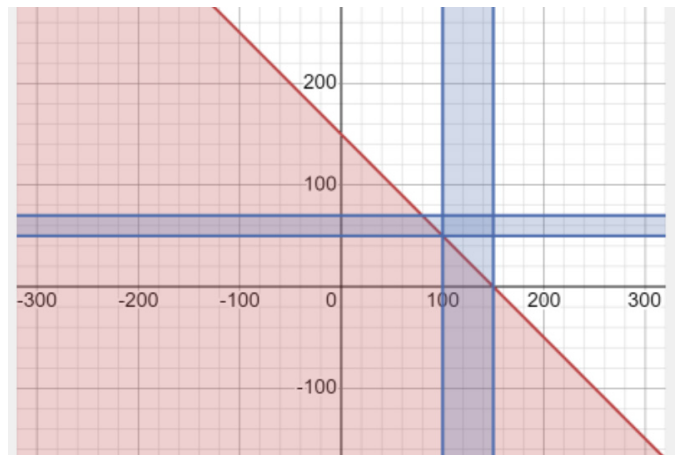
solution of the problem because all the three lines of the graph are intersecting
each other. Therefore, the point (100, 50) satisfies all the constraints of the
problem. Hence, a furniture company must produces 100 chairs and 50 tablesdaily to optimize the profits.

Application activity 2.2.2
A manufacturing company makes two kinds of instruments. The first
instrument requires 9 hours of fabrication time and one hour of labor
time for finishing. The second model requires 12 hours for fabricating
and 2 hours of labor time for finishing. The total time available for
fabricating and finishing is 180 hours and 30 hours respectively.
The company makes a profit of 800,000 Frw on the first instrument
and 1200, 000Frw on the second instrument. Express this linear
programming problem as an objective function and also find theconstraint involved.
2.3 Methods of solving linear programming problems (LPP)
2.3.1. Solving LPP using graphical methods
Learning activity 2.3.1
Learning activity 2.3.1
Consider the following problem
c) Which steps can you list to find solution? Graphically solve the givensystem of linear equation.
d) Do you think Profit can be shown from this graph?
To solve LPP we use graphical method under different steps. These are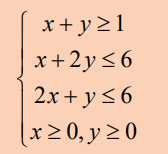
summarized below:
Step 1. Identify the problem-the decision variables, the objective and therestrictions.
Step 2. Set up the mathematical formulation of the problem
Step 3. Plot a graph representing all the constraints of the problem and identify
the feasible region (solution space). The feasible region is the intersection of
all the regions bounded (represented) by the constraints of the problem and isrestricted to the first quadrant only.
Step 4. The feasible region obtained in step 3 may be bounded or unbounded.Compute the coordinates of all the corner points of the feasible region.
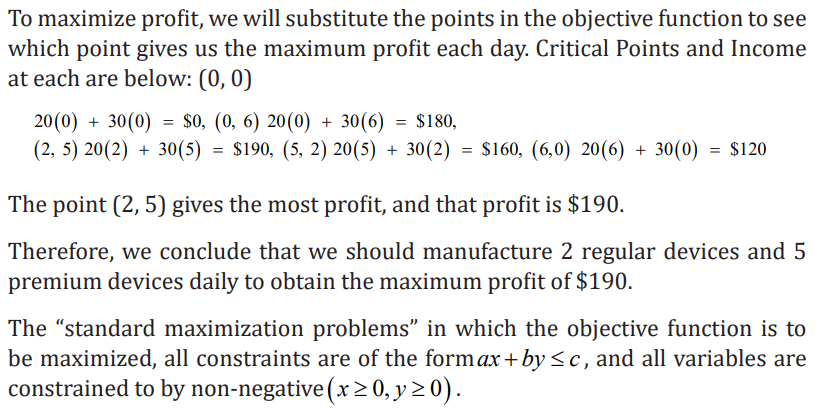
Step 5. Find out the value of the objective function at each corner (solution)point determined in step 4
Step 6. Select the corner point that optimizes (maximizes or minimizes) thevalue of the objective function. It gives the optimum feasible solution.
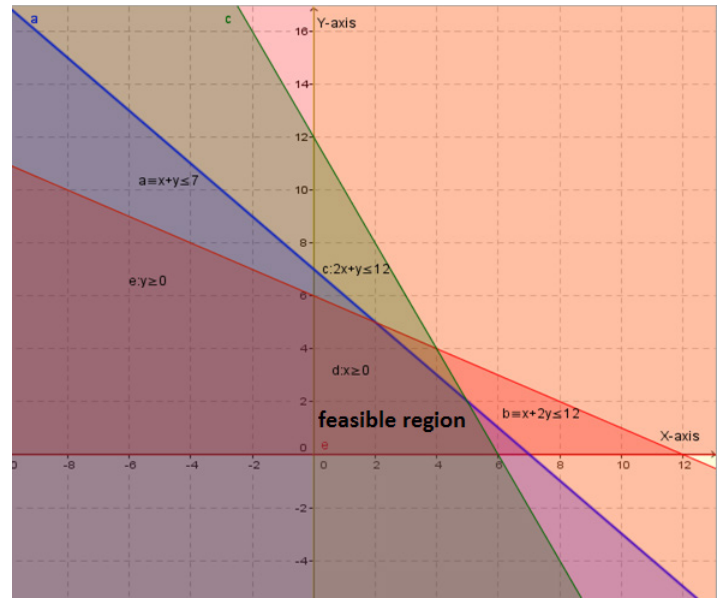
Example
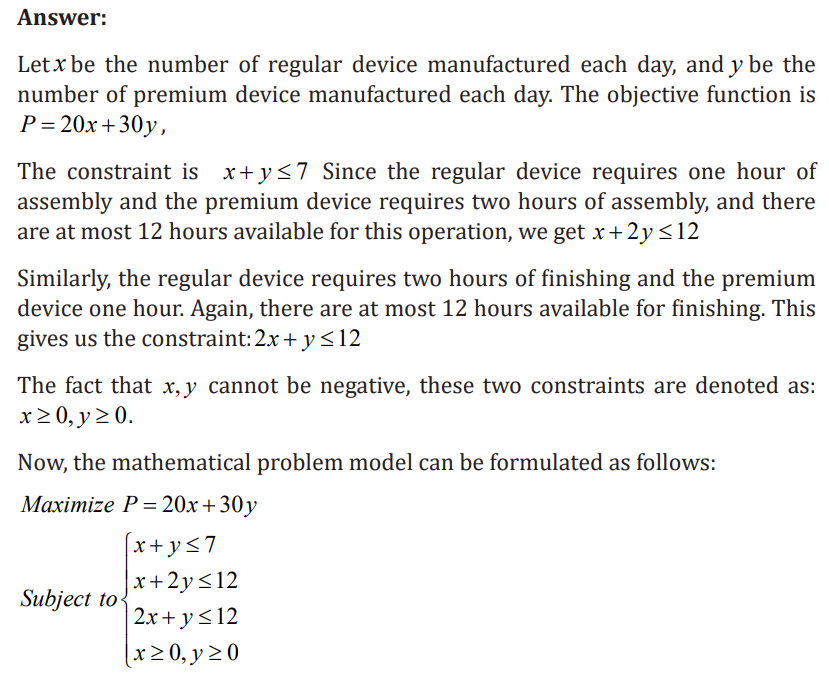
A factory produces two types of devices including regular and premium. Each
device necessitates two operations, assembly and finishing, and each operation
has a maximum time limit of 12 hours. A standard device requires 1 hour of
assembly and 2 hours of finishing, whereas a premium device requires 2 hours
of assembly and 1 hour of finishing. Due to other constraints, the company can
only produce 7 devices per day. How many of each should be manufactured to
maximize profit if a profit of $20 is realized for each regular device and a profitof $30 for each premium device?

Application activity 2.3.1
Aline holds two part-time jobs, storekeeper, and Accountant. She never wants
to work more than a total of 12 hours a week. She has determined that for every
hour she works at storekeeper, she needs 2 hours of preparation time, and for
every hour she works at accountant, she needs one hour of preparation time,
and she cannot spend more than 16 hours for preparation. If Aline makes $40
an hour at Storekeeper, and $30 an hour at Accountant, how many hours shouldshe work per week at each job to maximize her income?
2.4 End unit assessment
1. An airline must sell at least 25 business class and 90 economy
class tickets to earn profit. It makes a profit of320 by selling each
business class ticket and a profit of 400 by selling an economy classticket. No more than 180 passengers can board the plane at a time.
i. How many of economy and business class tickets should be sold bythe airline to maximize the profit?
ii. How much maximum profit the airline can earn?
2. A bakery manufacturers two kinds of cookies, chocolate chip, and
caramel. The bakery forecasts the demand for at least 80 caramel
and 120 chocolate chip cookies daily. Due to the limited ingredients
and employees, the bakery can manufacture at most 120 caramel
cookies and 140 chocolate chip cookies daily. To be profitable the
bakery must sell at least 240 cookies daily. Each chocolate chip
cookie sold results in a profit of $0.75 and each caramel cookieproduces $0.88 profit.
i. How many chocolate chip and caramel cookies should be made dailyto maximize the profit?
ii. Compute the maximum revenue that can be generated in a day?
3. A farm is engaged in breeding pigs. The pigs are fed on various
products grown on the farm. In view of the need to ensure certain
nutrient constituents (call them A,B and C), it is necessary to buy
two additional products, say, X and Y. One unit of product X contains
36 units of A, 3 units of B and 20 units of C. One unit of product Y
contains 6 units of A, 12 units of B and 10 units of C. The minimum
requirement of A, B and C is 108 units, 36 units and 100 units
respectively. Product X costs 20FRW per unit and product Y costs
40 FRW per unit. Formulate the above as a linear Programming
problem to minimize the total cost, and solve the problem by using
graphic method.
