UNIT 7:Bivariate Statistics
Introductory activity
In Kabeza village, after her 9 observations about farming,
UMULISA saw that in every house observed, where there are
a number x of cows there are also y domestic ducks, and then
she got the following results of (x,y) pairs: (1,4), (2,8), (3,2),
(4,12), (5,10), (6,14), (7,16), (8,6), (9,18)
a) Represent this information graphically in a
( x y coordinates , ) − .
b) Chose two points, find the equation of a line joining
them and draw it in the same graph. How are the positions
of remaining points vis-a -vis this line?
c) According to your observation from (a), explain in
your own words if there is any relationship between the
variation of the number x of cows and the number y ofdomestic ducks.
Until now, we know how to determine the measures of central
tendency in one variable. In this unit, we will use those measures
in two quantitative variables known as double series. In statistics,
double series includes technique of analyzing data in two variables,
when we focus on the relationship between a dependent variable-y
and an independent variable-x. The linear regression method will
be used in this unit. The estimation target is a function of the
independent variable called the regression function which will bea function of a straight line.
Objectives
By the end of this unit, a student will be able to:
ᇢ find measures of variability in two quantitative
variables.
ᇢ draw the scatter diagram of given statistical
series in two quantitative variables.
ᇢ determine the linear regression line of a given
series,
ᇢ calculate a linear coefficient of correlation of agiven double series and interpret it
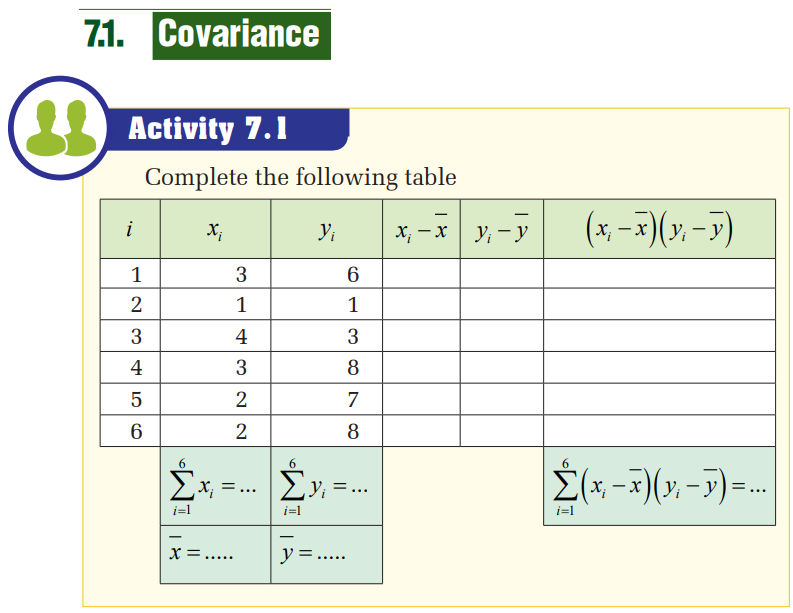
In case of two variables, say x and y, there is another important
result called covariance of x and y, denoted cov , ( x y), which is a
measure of how these two variables change together.
The covariance of variables x and y is a measure of how these
two variables change together. If the greater values of one variable
mainly correspond with the greater values of the other variable,
and the same holds for the smaller values, i.e. the variables tend to
show similar behavior, the covariance is positive. In the opposite
case, when the greater values of one variable mainly correspond
to the smaller values of the other, i.e. the variables tend to show
opposite behavior, the covariance is negative. If covariance is zero
the variables are said to be uncorrelated, meaning that there is no
linear relationship between them.
Therefore, the sign of covariance shows the tendency in the linear
relationship between the variables. The magnitude of covariance
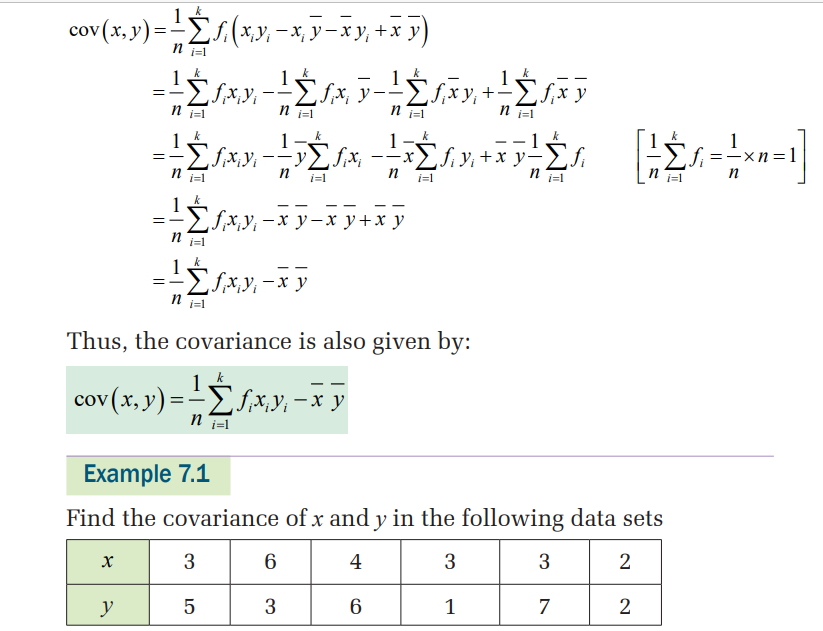
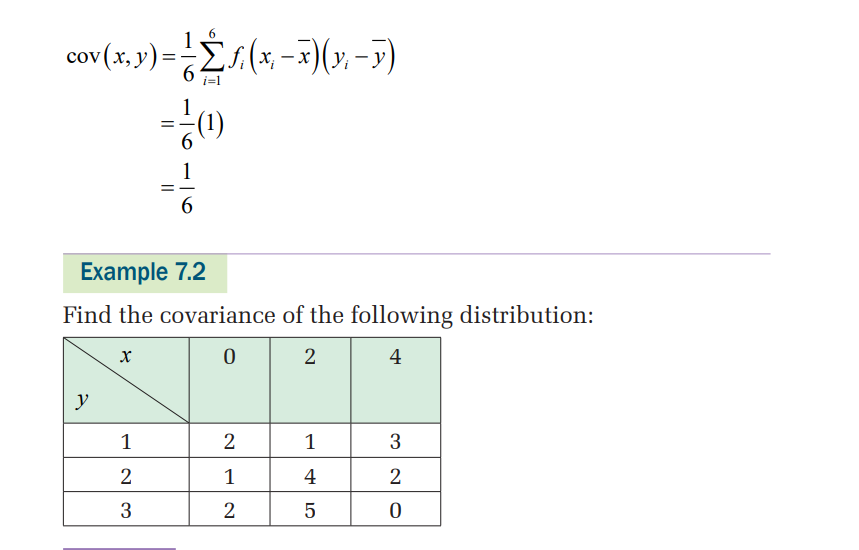
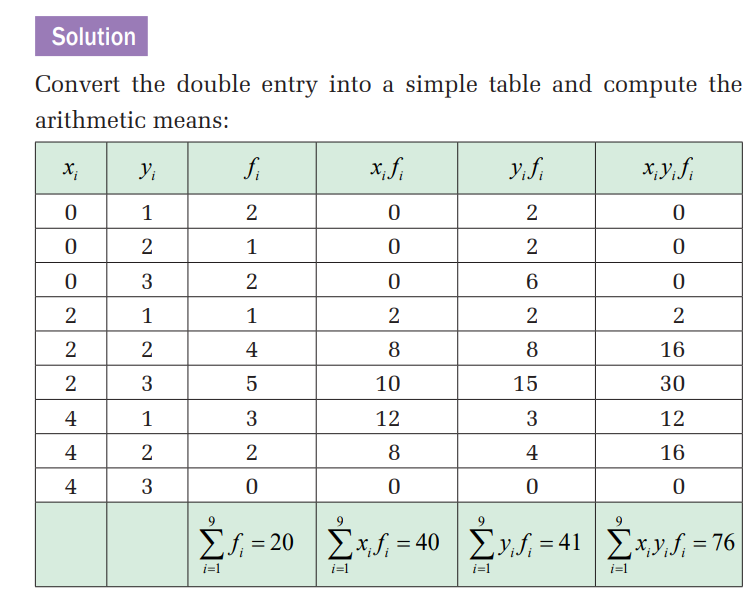
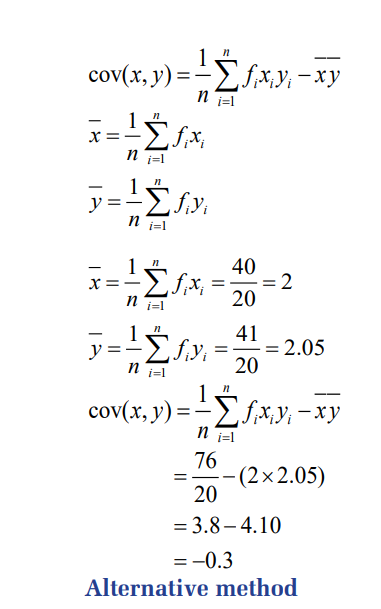
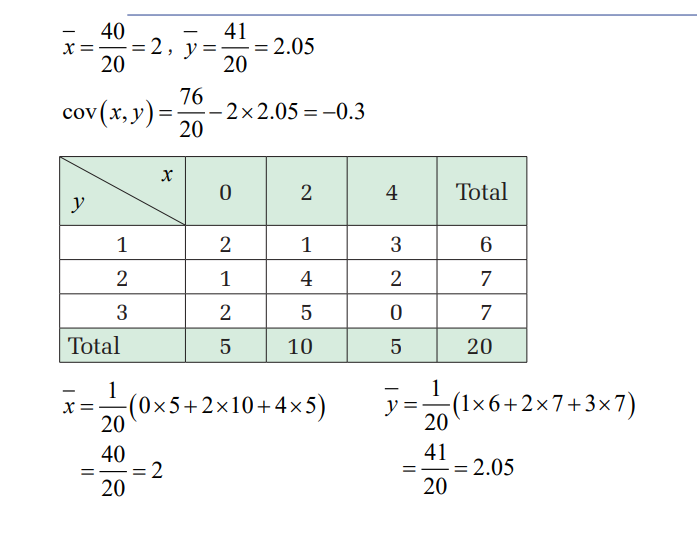
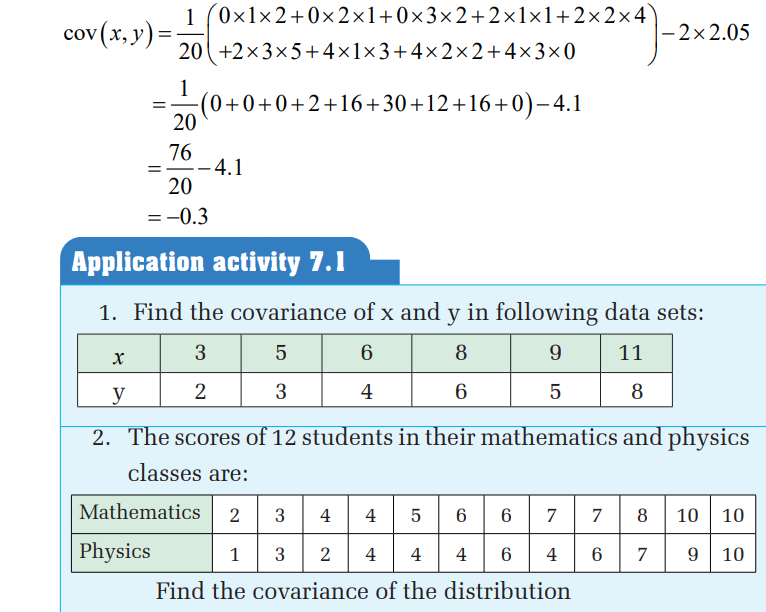
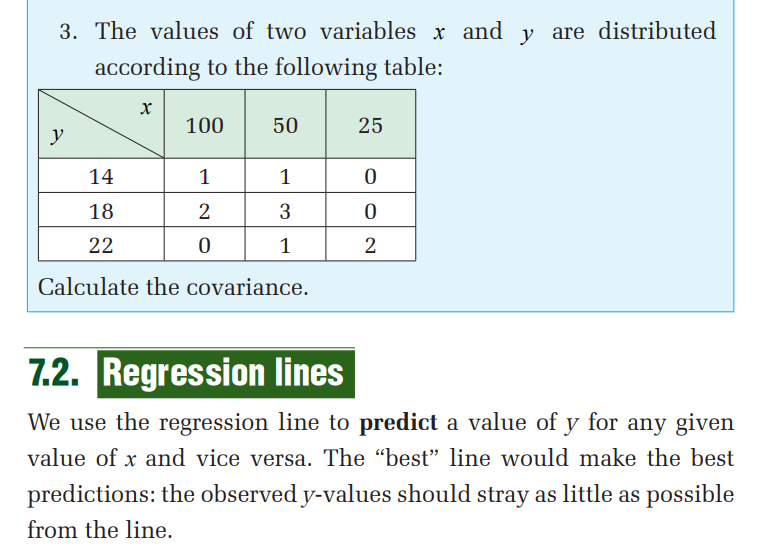
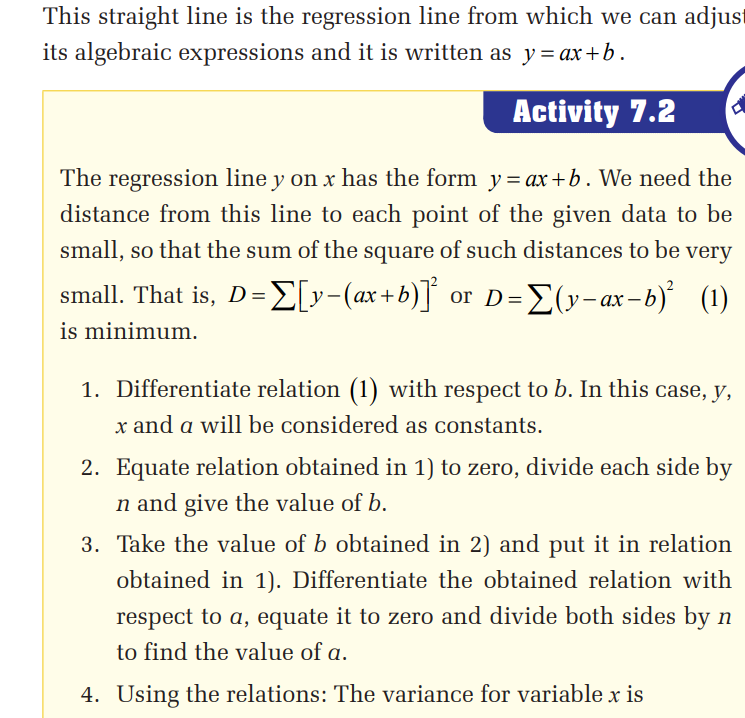
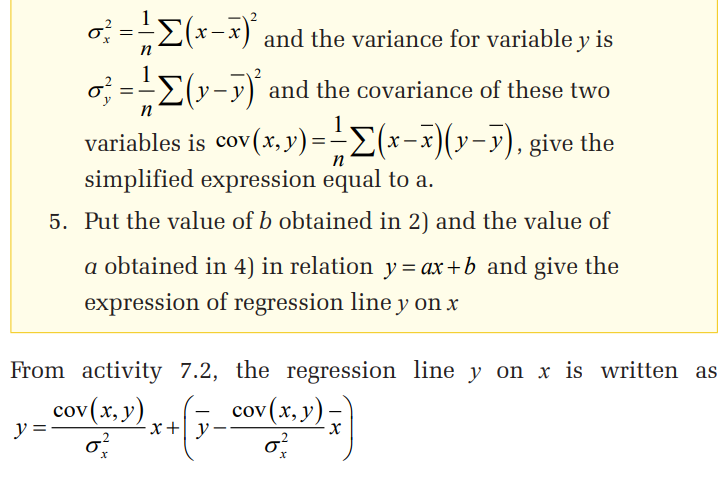
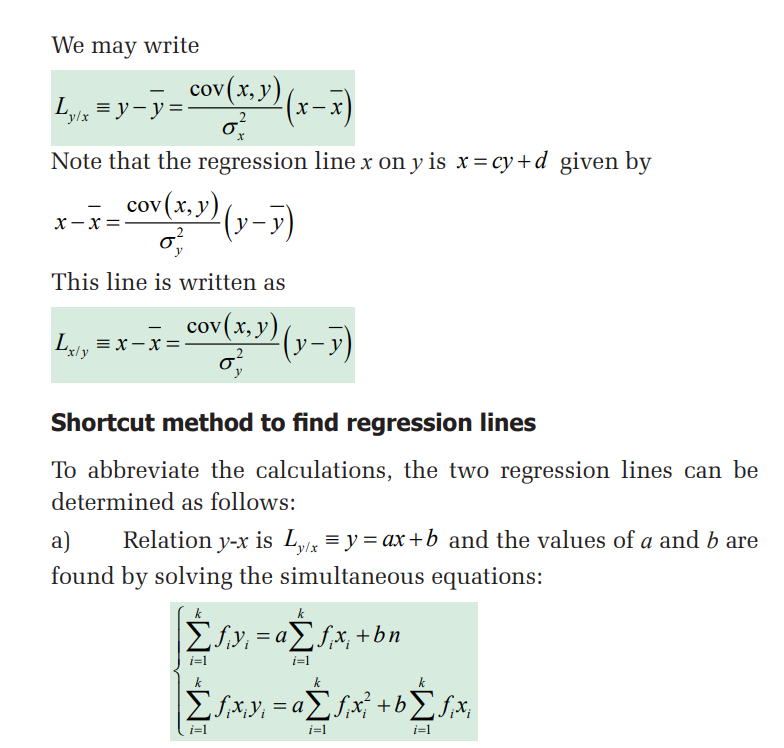
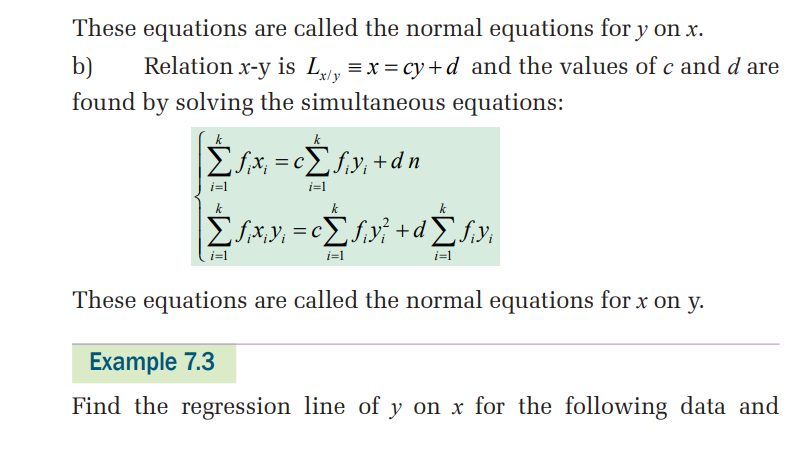
is not easy to interpret.Covariance of variables x and y, where the summation of frequencies

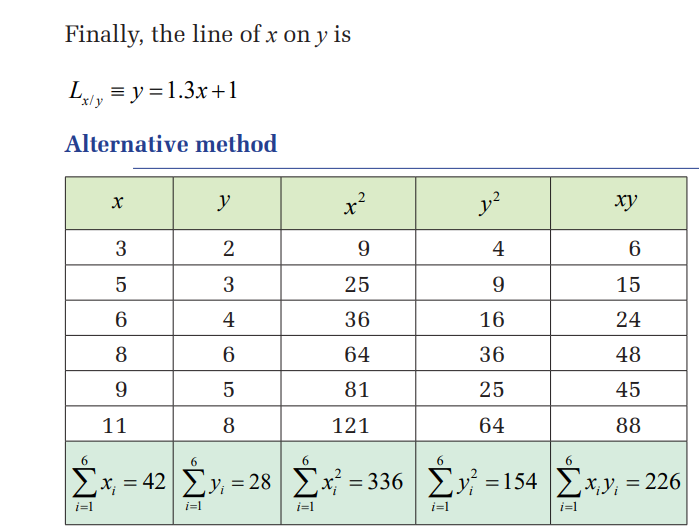
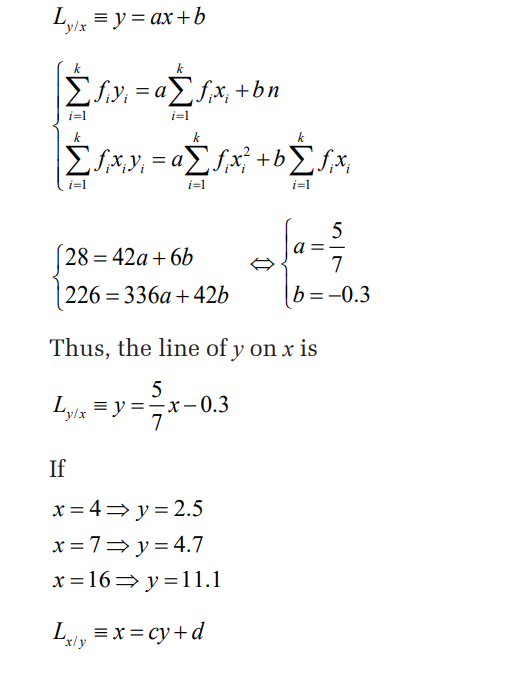
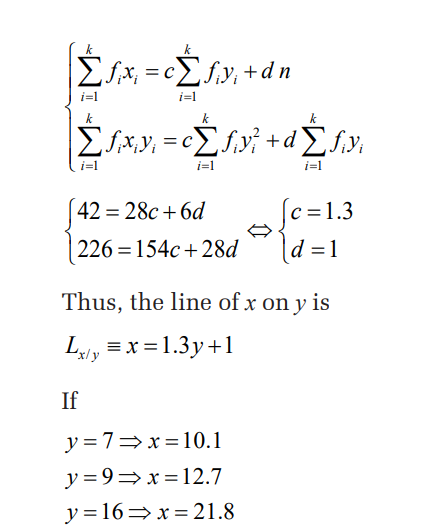
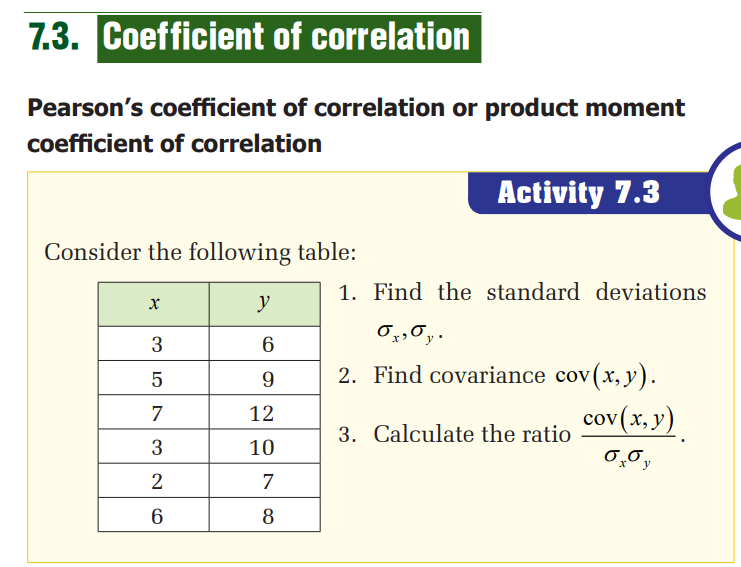
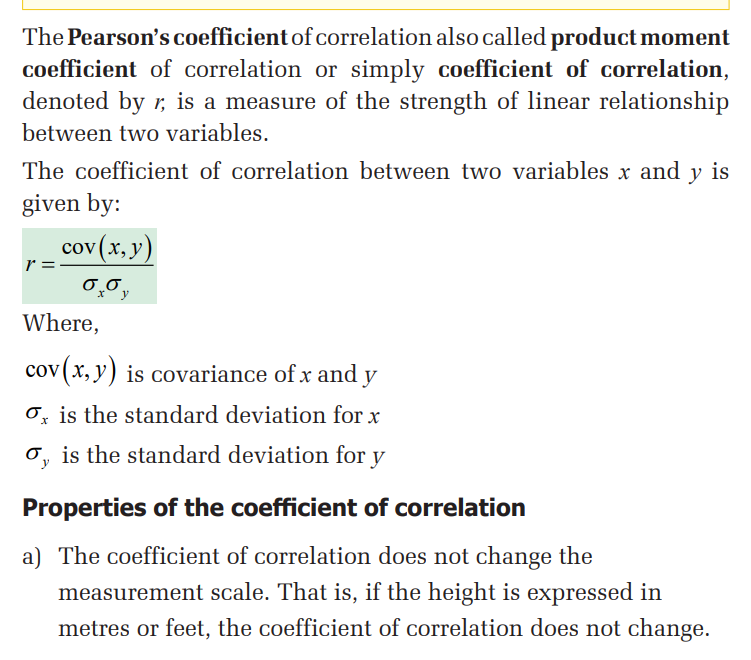
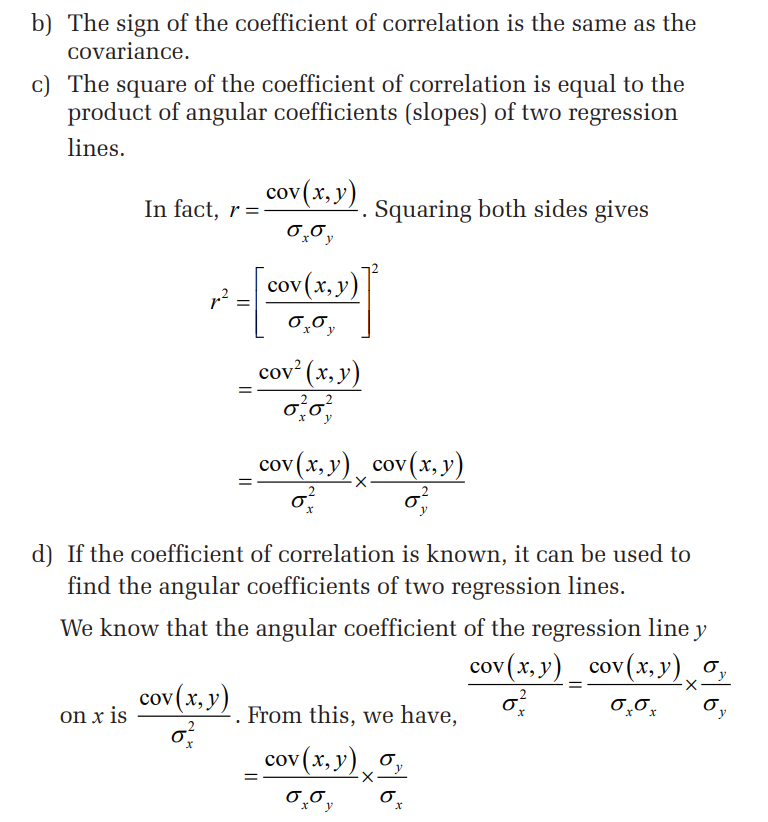
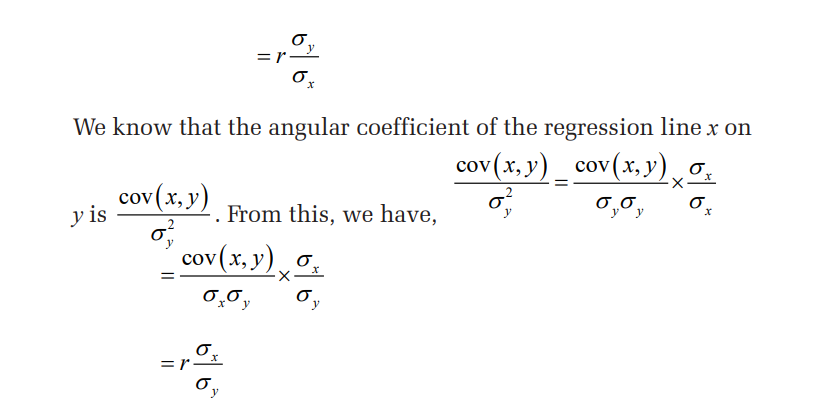
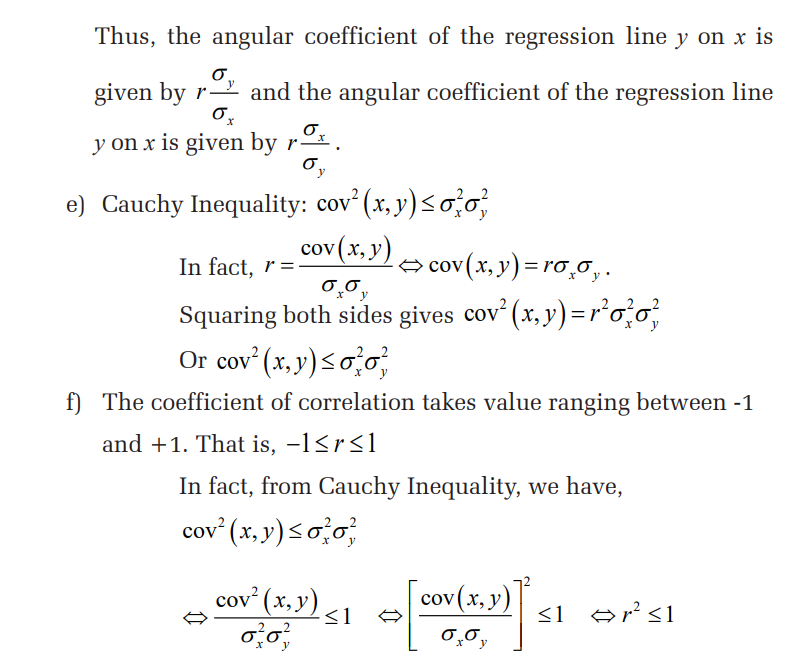
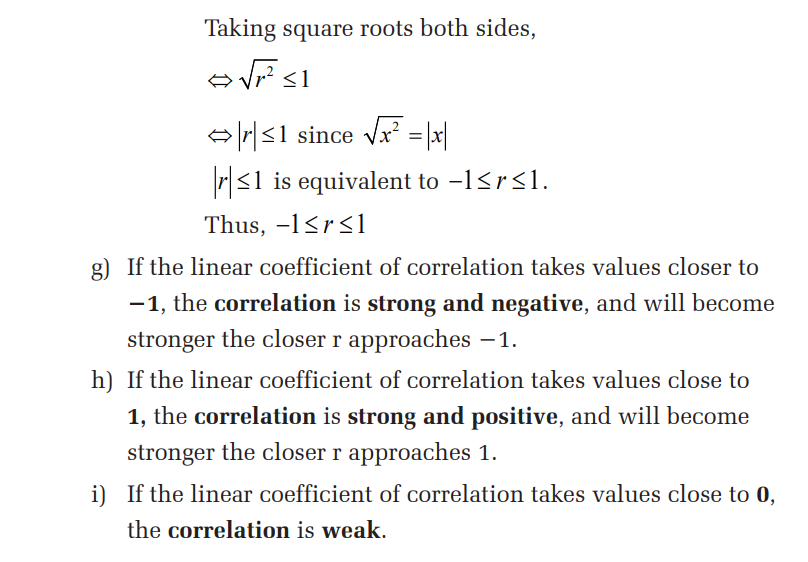
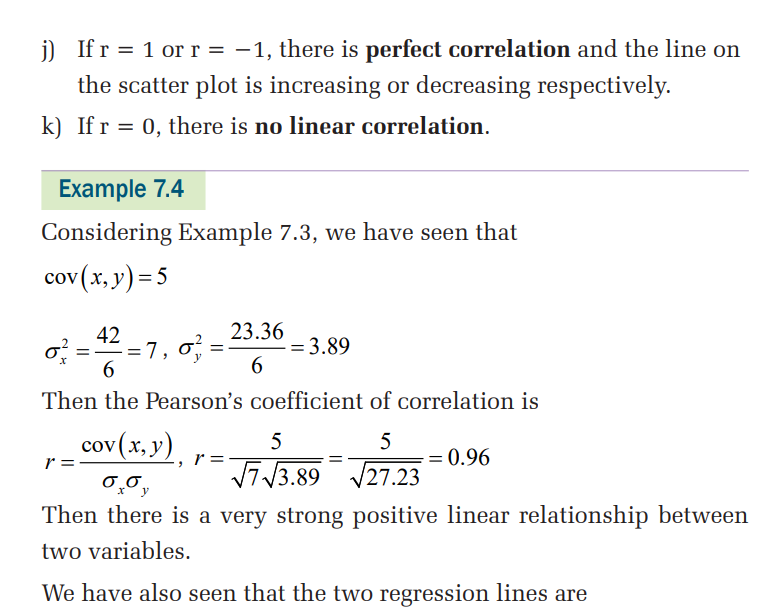
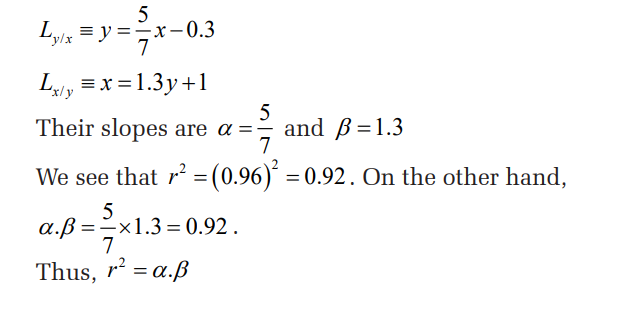
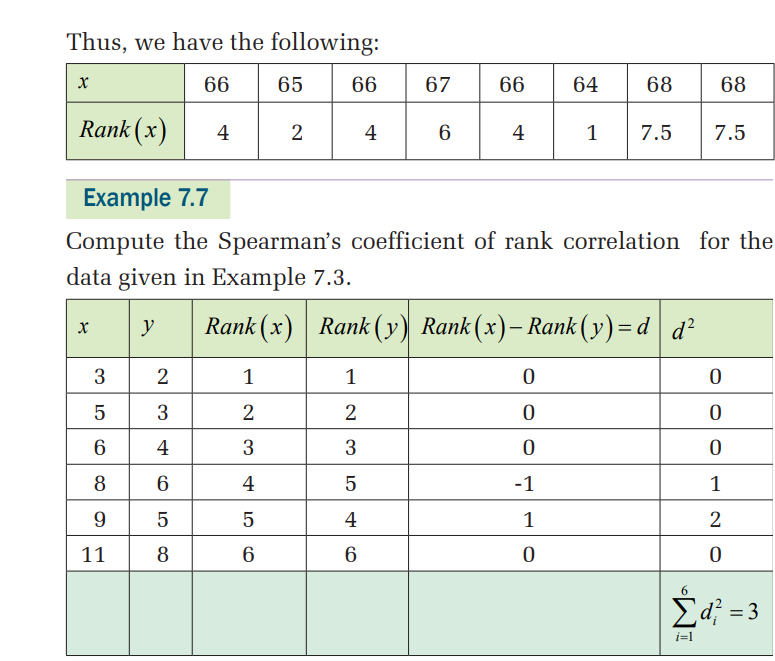
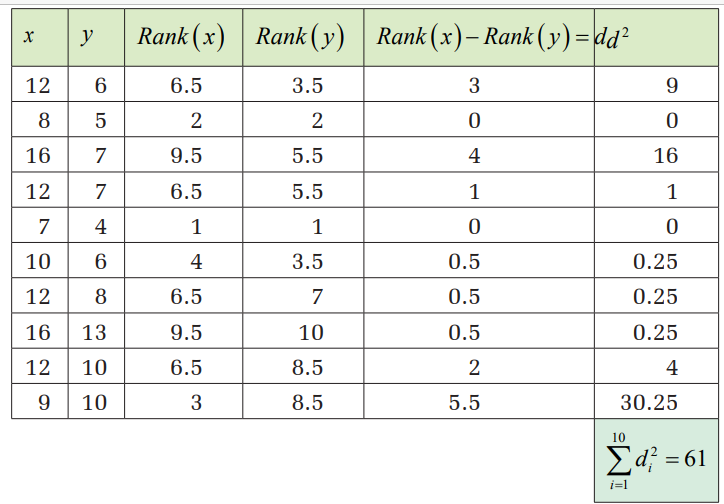
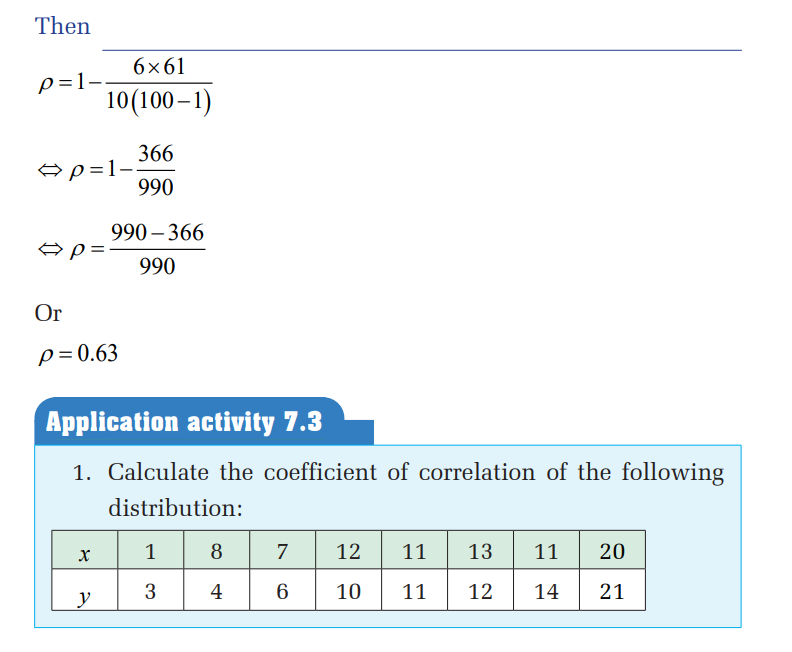
Method of ranking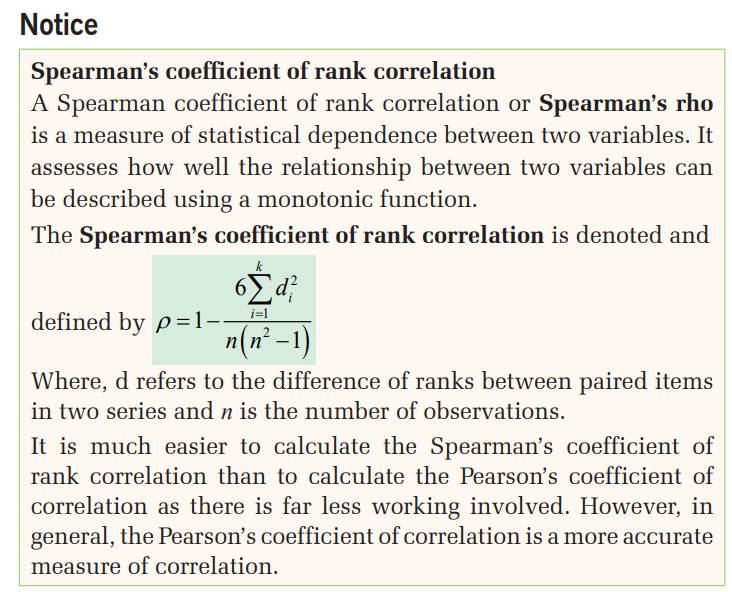
Ranking can be done in ascending or descending order.
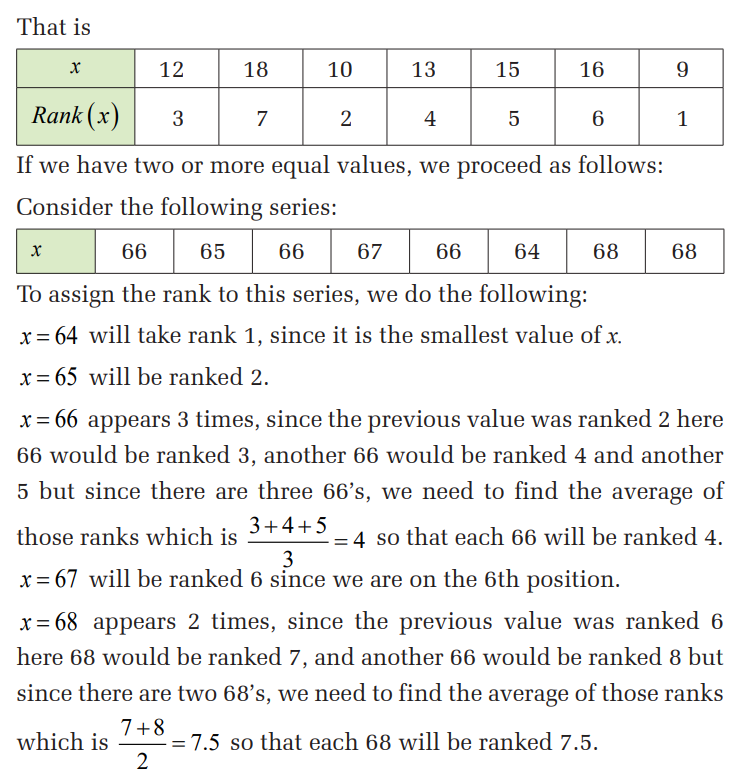
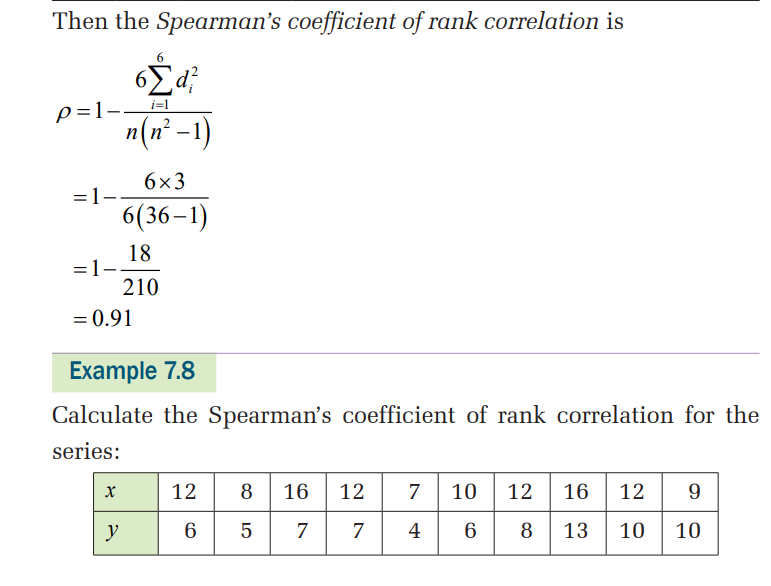
Example 7.6
Suppose that we have the marks, x, of seven students in this order:
12, 18, 10, 13, 15, 16, 9
We assign the rank 1, 2, 3, 4, 5, 7 such that the smallest value of xwill be ranked 1.
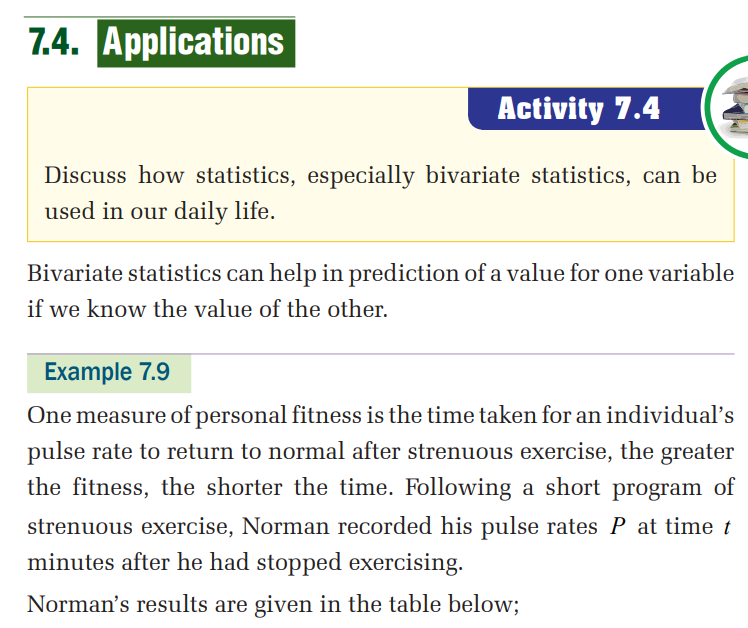


a) It is required to estimate the value of X for Nepal, where the
value of Y is 450.
i) Find the equation for a suitable line of regression.
Simplify your answer as far as possible, giving the
constants correct to three significant figures
ii) Use your equation to obtain the required estimate
b) Use your equation to estimate the value of x for North Korea,
where the value of Y was 858. Comment on your answer.
Solution
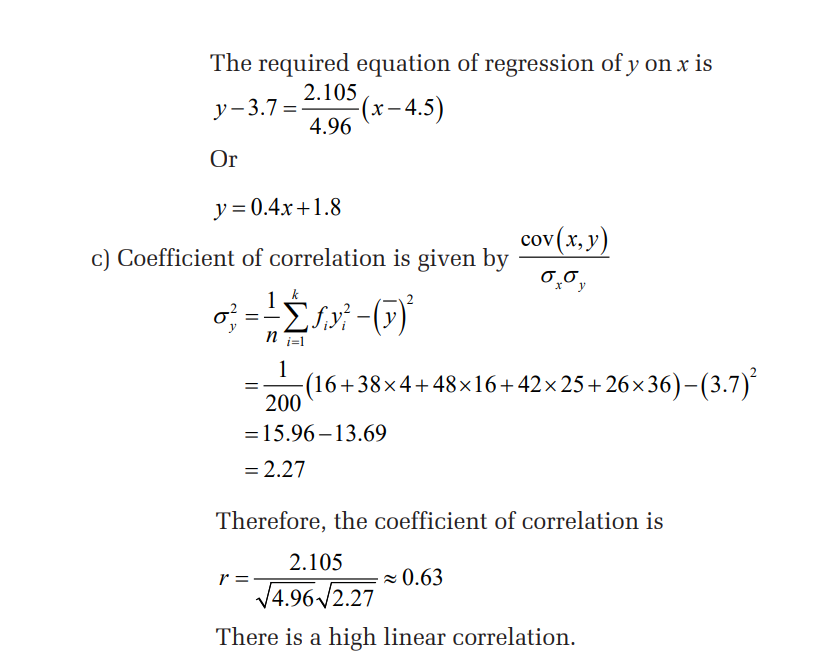
a) i) Neither variable has been controlled in the given data and
since you are required to estimate the life expectancy, X
years, when the GDP per head, Y dollars is 160 dollars, it is
sensible to use the regression line of X on YThe regression line of X on Y has equation


Unit Summary
 r = 0.95
End of Unit Assessment
1. For each set of data, find:
a) equation of the regression line of y on x.
b) equation of the regression line of x on y

Find both equations of the regression lines. Also estimate the value ofy for x = 30 .
5. The following results were obtained from records of age (x) and
systolic blood pressure
of a group of 10 men:


a) Calculate the Spearman’s coefficient of rank correlation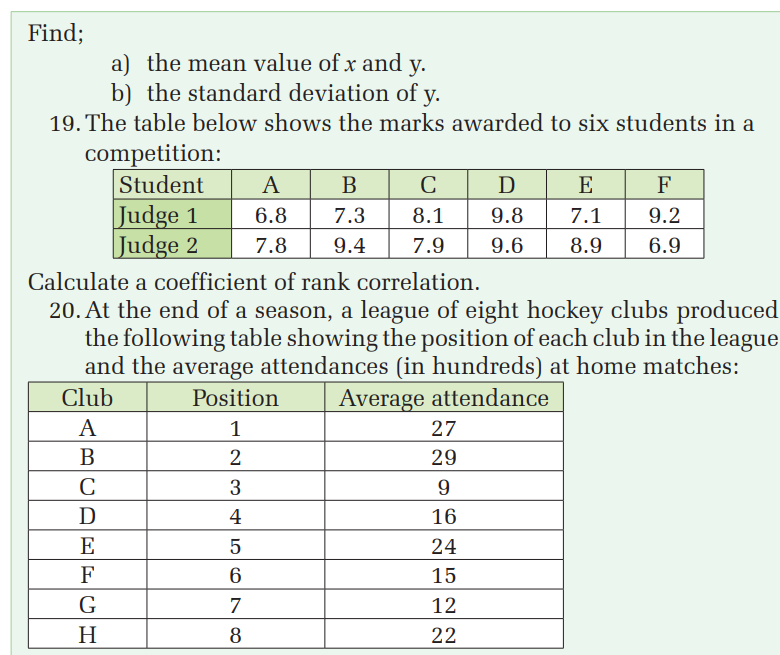
between position in the league and average attendance.
b) Comment on your results
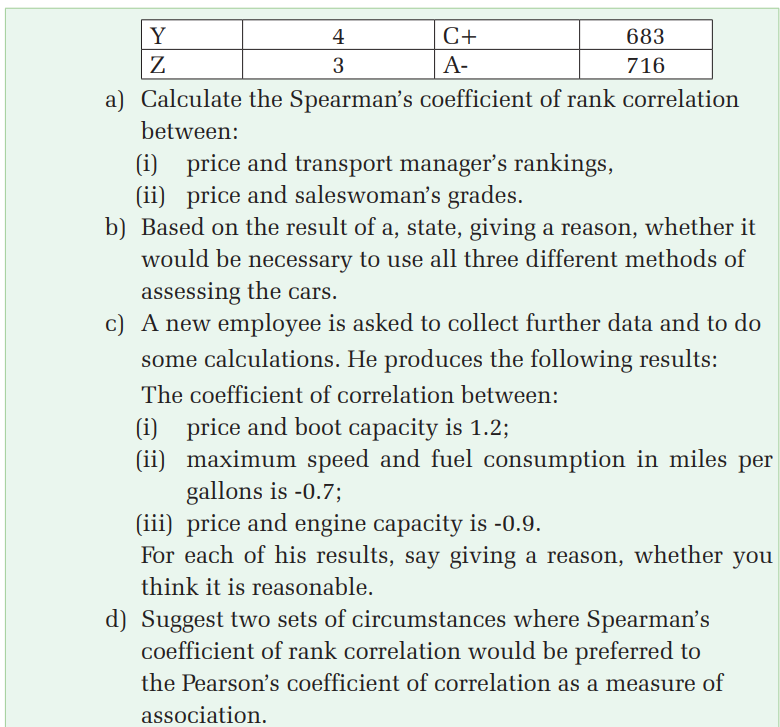
21.A company is to replace its fleet of cars. Eight possible models
are considered and the transport manager is asked to rank them,
from 1 to 8, in order of preference. A saleswoman is asked to use
each type of car for a week and grade them according to their
suitability for the job (A-very suitable to E-unsuitable).The price is also recorded:

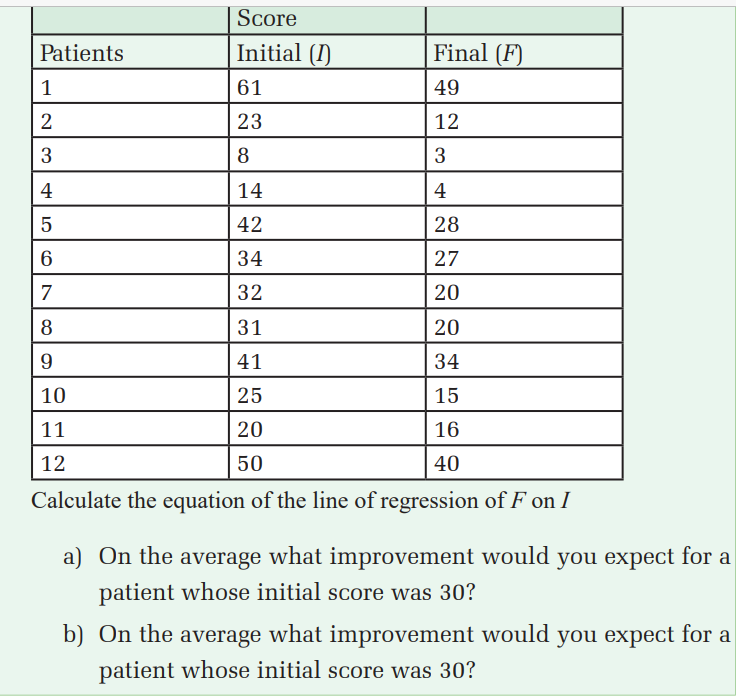
23.To test the effect of a new drug twelve patients were examined
before the drug was administered and given an initial score (I)
depending on the severity of various symptoms. After taking the
drug they were examined again and given a final score (F). A
decrease in score represented an improvement. The scores for
the twelve patients are given in the table below: