UNIT 10. PHASE DIAGRAMS
Key unit competency:
To be able to interpret the phase diagrams for different compounds.
• Define a phase
• Explain the term phase equilibrium
• Explain the effect of change of state on changing pressure and temperature
• Define heterogeneous and homogeneous equilibria
• Define triple point, critical point, normal boiling and melting points of
substances
• Relate the physical properties of compounds to their phase diagrams.
• Locate triple point, critical point, normal boiling and melting points on the
phase
• diagrams
• Compare the phase diagrams for water with that carbon dioxide
• Develop analysis skills, team work, and attentiveness in interpreting thephase diagrams and in practical activities
Introductory Activity
In our daily life, we use varied materials which have distinct properties and they
can exist in different physical states of the matter. In this regard, we sometimes
need to keep a given substance in a certain state because we know that it will
serve better. Explain two important conditions that should be dealt with to
maintain stable some physical states of the matter as we need them.Explain why ice flots on water.
10.1. Phase equilibrium
Activity 10.1
1. Observe the diagrams that represent different systems and assess thenumber of phases and components involved in each system.

2. Differentiate a phase and a physical state of matter. Explain your answer.
10.1.1. Definition of key terms
A phase is a homogeneous portion of a system which has uniform physical
characteristics. It can be separated from other parts of the system by a clear boundary
(limit). A phase can be a solid, liquid, vapor (gas) or aqueous solution which is uniformin both chemical composition and physical state.
Examples
i. A mixture of gases (air) consists of one phase only
ii. A mixture of oil and water consists of two different liquid phasesiii. A mixture of solids, each solid is regarded as having one phase
A component: it is a chemical species which may be used to specify the
composition of a system. For example;
• A three-phase system of water (i.e. water, ice, and vapor) is a one component
system. The constituent substance of the three phases is water only.
• A mixture of water and ethanol is a one phase, two components system
because there are two different chemical compositions.
• An equilibrium: it is the state of a reaction or physical change in which the
rates of the forward and reverse processes are the same and there is no net
change on the amount of the equilibrium components
• A phase equilibrium: it is a balance between phases, that is, the coexistence
of two or more phases in a state of dynamic equilibrium. The forward process
is taking place at the same rate as the backward process and therefore the
relative quantity of each phase remains unchanged unless the externalcondition is altered.

Checking up 10.1
1. Which of the following is not an example of phase equilibrium?

b) Carbon dioxide in a stoppered fizzy drink:
c) Vapours above the surface of liquid water in a closed container, at a given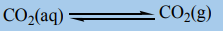
temperature.
2. At 0.001°C and 0.00603 atm water, ice and vapor can coexist in a closed
container.
a) Explain the number of phases that this equilibrium has.b) How many components does this system have? Explain.
10.2. Homogeneous and heterogeneous equilibria
Activity 10.2
Differentiate homogeneous mixture from heterogeneous mixture. mixture
of solids, each solid is regarded as having one phase
1. Homogeneous equilibrium
A system with one phase only is described as a homogeneous system and when
this system is at equilibrium, it is said to be a homogenous equilibrium.
In general, a homogeneous equilibrium is one in which all components are present
in a single phase. In a case of a chemical reaction, both reactants and products exist
in one phase (gaseous phase, liquid phase or aqueous solution and solid phase).
For example, in the esterification of acetic acid and ethanol the equilibrium is
homogeneous because all involved substances are in the same liquid phase.
All the reactants and products are liquids
2. Heterogeneous equilibrium
A system consisting of more than one distinct phases is described as heterogeneous
system. A heterogeneous equilibrium is a system in which the constituents are
found in two or more phases. The phases may be any combination of solid, liquid,
gas, or solutions.
For example, in the manufacture of quick lime from lime
stone the following equilibrium is involved:
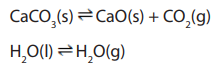
It is a heterogeneous equilibrium because some of the components are solids (limestone and quick lime) and another is a gas (carbon dioxide).
Checking up 10.2
Classify the following reactions as homogeneous equilibrium and heterogeneousequilibrium

10.3. Phase diagrams
Activity 10.3
1. When ice cream trucks drive through towns on hot season days, they
keep their products from melting by using dry ice (solid carbon dioxide)as shown in the image below. Why is dry ice used instead of ice?

2. Why most of the time very high mountains are covered by ice?
3. Explain the conditions that are required to be changed so that the pure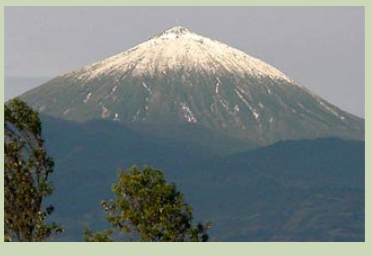
substance change from one state of matter to another.
Aphase diagram is a graph illustrating the conditions of temperature and pressure
under which equilibrium exists between the distinct phases (states of matter) of a
substance. Phase diagrams are divided into three single phase regions that cover
the pressure-temperature space over which the matter being evaluated exists:
liquid, gaseous, and solid states. The lines that separate these single-phase regions
are known as phase boundaries. Along the phase boundaries, the matter being
evaluated exists simultaneously in equilibrium between the two states that borderthe phase boundary.
The general form of a phase diagram for a substance that exhibits three phasesis shown below in the Figure 10.1.

Under appropriate conditions of temperature and pressure of a solid can be in
equilibrium with its liquid state or even with its gaseous state. The phase diagram
allows to predict the phase of substance that is stable at any given temperature and
pressure. It contains three important curves, each of which represents the conditionsof temperature and pressure at which the various phases can coexist at equilibrium.
i. Boiling point
The line TC is the vapor pressure curve of the liquid. It represents the equilibrium
between the liquid and the gas phases. The temperature on this curve where the
vapor pressure is equal to 1atm and it is the normal boiling point of the substance.
The vapor pressure curve ends at the critical point (C) which is the critical
temperature corresponding to the critical pressure of the substance which is thepressure required to bring about liquefaction at critical temperature.
ii. Critical point
Critical point consists of the temperature and pressure beyond which the liquid and
gas phases cannot be distinguished. Every substance has a critical temperatureabove which the gas cannot be liquefied, regardless the applied pressure.
iii. Sublimation point
The line AT is the sublimation curve which represent the variation in the vapor
pressure of the solid as it sublimes into gas at different temperatures. The reverse
process is deposition of the gas as a solid. Sublimation point is the temperature atwhich the solid turns to gas at a constant pressure.
iv. Melting point
The line TB is the melting point curve which represent the change in melting point
of the solid with increasing pressure.The line usually slopes slightly to the right as
pressure increases. For most substances, the solid is denser than the liquid, therefore,
an increase in pressure favors the more compact solid. Thus, higher temperatures
are required to melt the solid at higher pressures. The temperature at which thesolid melts at a pressure of 1atm is the “normal melting point”.
v. Triple point
The triple point T is a point where the three curves intersect. All the three phases
exist at equilibrium at this temperature and pressure. The triple point is unique foreach substance.
vi. Supercritical fluid
Supercritical fluid of a substance is the temperature and pressure above its own
thermodynamic critical point that can diffuse through solids like a gas and dissolvedmaterials like a liquid.
Any point on the diagram that does not fall on a line corresponds to conditions
under which one phase is present. Any other point on the three curves represents
equilibrium between two phases.
The gas phase is stable phase at low pressures and elevated temperatures. The
conditions under which the solid phase is stable extend to low temperatures and
high pressures. The stability range for liquids lie between the other two regions. Thatis between solid and liquid regions.
10.3. 1. Phase diagram of water
Water is a unique substance in many ways due to its properties. One of these special
properties is the fact that solid water (ice) is less dense than liquid water just abovethe freezing point. The phase diagram for water is shown in the Figure 10.2.
Water can turn into vapor at any temperature that falls on the vapor pressure curve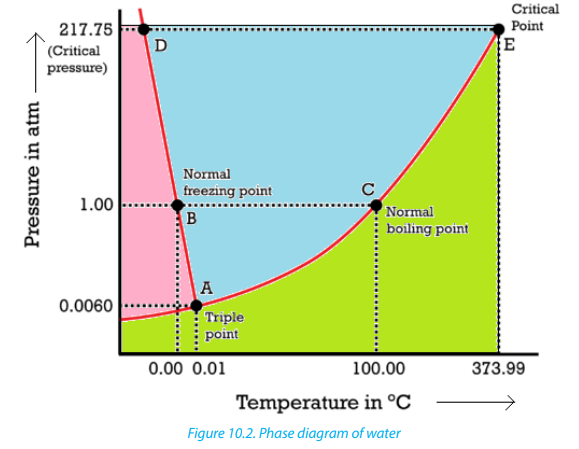
depending on the conditions of pressure, but the temperature at which water liquid
turns into vapor at normal pressure (1atm) is called the normal boiling point ofwater, 100 °C (Figure 10.2)
Point E in the Figure 10.2 is the critical point of water where the pressure is equal
to 218 atm and the temperature is about 374 °C. At 374°C, particles of water in the
gas phase are moving rapidly.At any other temperature above the critical point of
water, the physical nature of water liquid and steam cannot be distinguished; the
gas phase cannot be made to liquefy, no matter how much pressure is applied tothe gas.
The phase diagram of water is not a typical example of a one component system
because the line AD (melting point curve) slopes upward from right to left. It has a
negative slope and its melting point decreases as the pressure increases. This occurs
only for substances that expand on freezing. Therefore, liquid water is denser thansolid water (ice), the reason why ice floats on water.
10.3.2. Phase diagram of carbon dioxide
Compared to the phase diagram of water, in the phase diagram of carbon dioxide
the solid-liquid curve exhibits a positive slope, indicating that the melting point for increases with pressure as it does for most substances. The increase of pressure
causes the equilibrium between dry ice and carbon dioxide liquid to shift in the
direction of formation of dry ice that is freezing. Carbon dioxide contracts on freezing
and this implies that dry ice has higher density than that of liquid carbon dioxide.The Figure 10.3 shows the phase diagram of carbon dioxide.

The triple point is observed at the pressure above 1atm, indicating that carbon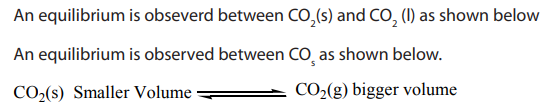
dioxide cannot exist as a liquid under normal conditions of pressure. Instead,
cooling gaseous carbon dioxide at 1atm results in its deposition into the solid state.
Likewise, solid carbon dioxide does not melt at 1atm pressure but instead sublimesto yield gaseous

Checking up 10.3
1. If a piece of dry ice is left on the lab counter, you will see it get smaller
until it disappears, with no liquid left around it. Explain why.
2. Describe what conditions of pressure and temperature will carbon
dioxide exist as a liquid?
3. What is the meaning of the term “critical temperature”, and what is the
value of the critical temperature of ?
?
4. Why does make an excellent fire extinguisher?
5. Explain the following observations:
a) When a closed glass container full of water is put in fridge, it directly
breaks when the water freezes.
b) The water of oceans at the poles of the Earth are normally covered byice and ice does not submerge in water.
10.4. Comparison of phase diagrams of substances that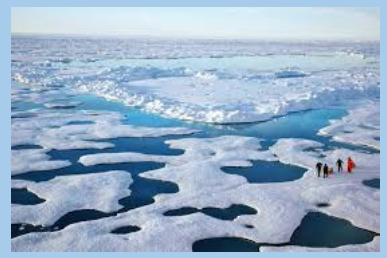
expand and those that contract on freezing
Activity 10.4
1. Analyze the phase diagrams of water and carbon dioxide previously
discussed to assess their similarities and differences.
2. The glacier easily slides on ice as shown in the photo below. Explain howthe property of water facilitates this movement.

For the phase diagrams, some materials contract on freezing while others expand
on freezing. The main differences between substances that expand and those
that contract on freezing can be highlighted by comparing the phase diagrams
of carbon dioxide and that of water. In the phase diagram of carbon dioxide, thesubstance contracts on freezing and that of water expands on freezing.
Both phase diagrams for water and carbon dioxide have the same general Y-shape,
just shifted relative to one another. This shift occurs because the liquid phase in
the dry ice can only occur at higher temperatures and pressures, whereas, in ice
the liquid phase occurs at lower temperatures and pressures. There are two more
significant differences between the phase diagram of carbon dioxide and that ofwater:
10.4.1. Melting point curve
The melting point curve of carbon dioxide slopes upwards to right (Figure 10.3)
whereas that of water slopes upward to left (Figure 10.2). This means that for carbon
dioxide the melting point increases as the pressure increases, a characteristic
behavior of substances that contract on freezing. Further, water expands on freezing
(Figure 1.4) and this unusual behavior is caused by the open structure of the regular
packing of water molecules in ice due to the network of hydrogen bonding in icewhich is more extensive than in liquid.
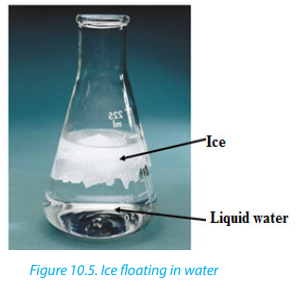
Ice floats on liquid water (Figure 10.5), this unusual behavior is caused by the open
structure of the regular packing of water molecules in ice due to the network of
hydrogen bonding in ice which is more extensive than in liquid. The ice is less densethan water reason why it floats in water.
10.4.2. Triple point
The triple point of carbon dioxide is above atmospheric pressure. This means that
the state of liquid carbon dioxide does not exist at ordinary atmospheric pressure.
Dry ice remains as a solid below -78ºC and changes to fog (gas) above -78ºC. It
sublimes without forming liquid at normal atmospheric pressure (Figure 10.6). The
sublimation of carbon dioxide results in a low temperature which causes watervapors in the air to form moist.
Ice is stable below 0 ºC and water is stable between 0ºC and 100 ºC while water
vapor is stable above 100 ºC. At normal atmospheric pressure, ice can first melts andultimately boils as the temperature increases.
Checking up 10. 4
1. Explain three ways that dry ice is different to the normal ice.
2. Explain why the liquid phase is not observed in the dry ice as it sublimes,
whereas all three phases are observed in the ice?
3. At temperature and pressure of 5ºC and 1atm (refer to both phase
diagram of and
and  are normal ice and dry ice at the same phase?
Explain your reasoning.
4. Draw and label a phase diagram for water and carbon dioxide and
explain why they are different?5. Explain the reason why a glass container breaks when water freezes.
10.5. Applied aspect of phase diagrams
Activity 10.5
Engineers use diverse materials in construction of houses, bridges, etc. and in
making different other products such as cars, airplanes, computers, etc. Explain
if the knowledge of the phase diagrams of those materials the engineers use isimportant to them.
The applications of phase diagrams are useful for engineer’s materials and material
applications. The scientists and engineers understand the behavior of a system
which may contain more than one component. Multicomponent phase’s diagramsshow the conditions for the formation of solutions and new compounds.
The phase diagrams are applied in solidification and casting problems. Many materials
and alloy system exist in more than one phase depending on the conditions of
temperature, pressure and compositions. In the area of alloy development, phase
diagrams have proved invaluable for tailoring existing alloys to avoid over design
in current applications, each phase has different microstructure which is related
to mechanical properties. The development of microstructure is related to the
characteristics of phase diagrams. Proper knowledge and understanding of phase
diagrams lead to the design and control of heating procedures for developing therequired microstructure and properties.
Phase diagrams are consulted when materials are attacked by corrosion. They
predict the temperature at which freezing or melting begins or ends. Phase
diagrams differentiate the critical point, triple point, normal boiling point, etc ofsome substances.
Examples
• Zn-Fe based high-order phase diagrams have found a wide range of
applications in continuous galvanizing.
• The Zn-rich corner of the Zn-Fe-Al phase diagram is being used daily forscientific interpretation of bath assays.
In general the industrial applications of phase diagrams include alloy design,processing, and performance.
Checking up 10.5Do research and explain different applications of phase diagrams.
10.6. End unit assessment
1. At pressures lower than triple point, water cannot exist as liquid,
regardless of the temperature.
a. True b) False
2. The melting point of water decreases as the pressure is augmented
because water contracts on freezing.
a. True b) False
3. The melting point of carbon dioxide increases as the pressure is raised
because carbon dioxide expands on freezing.
a). True b). False
4. Use the following phase diagram of water to answer the questions
related:
a. At a pressure of 1atmosphere, what is the normal freezing point of
water?
b. What is the normal boiling point of water, at 1atmosphere of water?
c. In Karisimbi, we live approximately 5,500 feet above sea level, which
means the normal atmospheric pressure is less than 1atm. In Karisimbi,
will water freeze at a lower temperature or a higher temperature than
at 1atmosphere?
d. Will water boil at a higher or lower temperature, than at 1atmosphere?
5. If we shake a carbon dioxide fire extinguisher on a cool day , we
can hear liquid sloshing around inside the cylinder. However, the
cylinder appears to contain no liquid on a sweltering day,
Explain these observations.6. Observe the diagram below and answer the related question.
a. Explain what is labeled in the parts X, Y, Z, C and T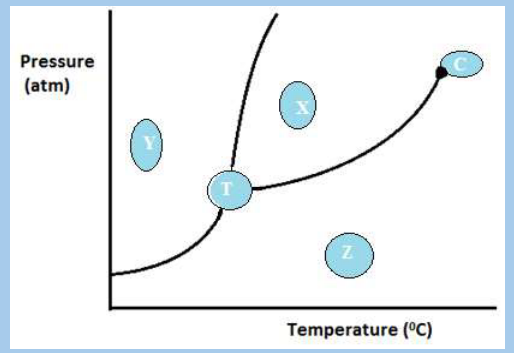
b. Would the substance represented on this graph contract or expand when
it was frozen? Explain your answer.
c. Describe what will happen to Y if the temperature is increased at constant
pressure.
d. Explain what will happen to X if the pressure is much lowered at constant
temperature.
7. The diagram below shows the variation of vapor pressure with temperaturefor pure substance.
a. What sections represent liquid, gas, solid phases?
b. What letter represents the triple point? Give the definition of the triple
point.
c. What is the substance‘s normal boiling and melting point?
d. Above which temperature it is not possible to liquefy the gas of the
substance, no matter how much pressure is applied?
e. At a constant temperature, what would you do to cause this substanceto change from the liquid phase to the solid phase?