Topic outline
Geography and Environment
- S1: Geography TG File Uploaded 16/08/22, 09:52
- S1: Geography SB File Uploaded 16/08/22, 09:56
Unit 1: Introduction to Geography
Label: 1URL: 1Unit 2: Elements of a map

By the end of this unit, you must be able to interpret the essential elements of a map and draw sketch maps
Unit objectives
By the end of this unit, you must be able to:
(a) define a map
(b) identify the various elements of a good map
(c) identify and interpret symbols and signs on a map
(d) draw sketch maps
(e) state indicators of relief on a physical map
(f) define a map and an aerial photograph
(g) define an atlas index.What is a map?
A map is a representation of the features of an area of the earth on a flat surface. The area could be on land or sea. A map usually shows physical features such as cities and roads. This representation is usually done on a flat surface or piece of paper.
There are several types of maps. In this topic, we will use topographic maps for our study.
Topographic maps are also called relief maps. These are maps that show both natural and artificial features of a given area. The maps are drawn to scale. This means that they are reduced so that large areas are represented on small sheets of paper.
Read this passage and answer the questions that follow.
Gahigi wanted to go to a place far away from his home. He had been invited by his friend Uwase to go on an expedition. Early one morning, he set out on his journey. His friend had told him that they would meet under a certain tree. She gave him a list of physical features to look out for on his way.
He was to cross a river and then turn right. After going down a valley, he was supposed to turn left and wait for his friend under a big tree with many leaves.
(a) If you were Gahigi, what would you have done?
(b) Do you think Gahigi got to his destination?
(c) Name the tool that Gahigi needed for him to get to his destination quickly.
Study the map of Rwanda below, and answer the questions that follow. Write your answers in your notebooks.
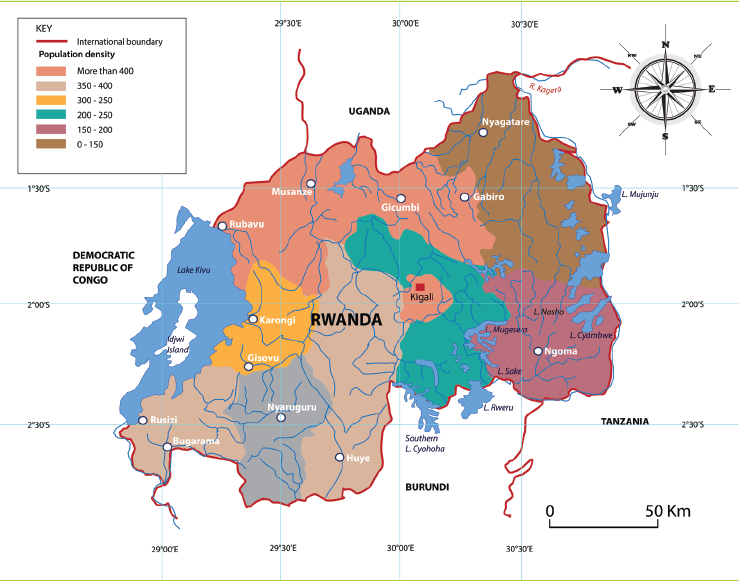
Fig 2.1
1. (a) What is the title of the map?
(b) What is the main information represented by the map?
(c) Why do you think it is important for such a map to have a title?
2. (a) Name other elements of maps that have been shown on the map.
( b) Give the importance of the elements you have identified on the map.(c) Which element helps a map reader to understand the meaning of various symbols and signs used on a map?
3. Suppose Miss Tumusiime wishes to use the above map, which tool would help her to locate Kigali City? .
Elements of a good map
In groups, study the map of Africa below and answer the questions that follow.
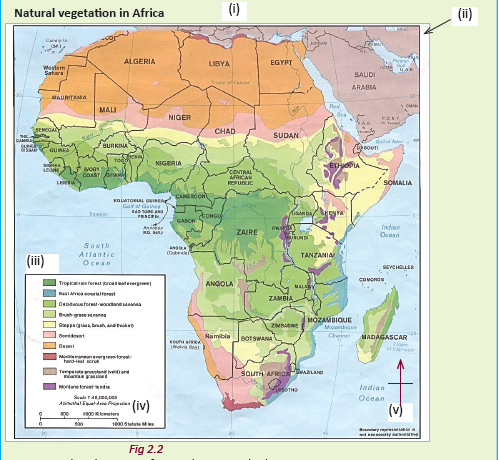
1. Name the elements of a good map marked:
(a) (i), (ii), (iii), (iv) and (v).(b) Explain the purpose of each element mentioned in (a) above.
2. Give the direction of tropical rain forests from Lesotho.
A good map has specific features. These features are commonly referred to as the elements of a map.The elements of a map are not part of the information that is represented in a map. They are therefore usually placed at the margins.
The following are the major elements of a good map.
Table 2.1 Elements of a good map.
Element Description Title This shows the information that is contained in a map. Frame This is a line that surrounds a map showing its limitation. A key This is a tool that is used in maps. It helps a map reader to
understand the symbols, colours and signs used. A key is important
since it helps one to understand the contents of a map in detail.A compass This shows the direction of various features that are shown on
map. The directions are usually in relation to the cardinal points
of a compass. They are North, South, West and East.Scale This is the ratio of the size of a map to the ground area
represented on it. A scale helps cartographers to draw a large
area of the earth’s surface on a small sheet of a paper.
In groups, use the elevation map shown below to answer the questions that follow.Physical features of Rwanda
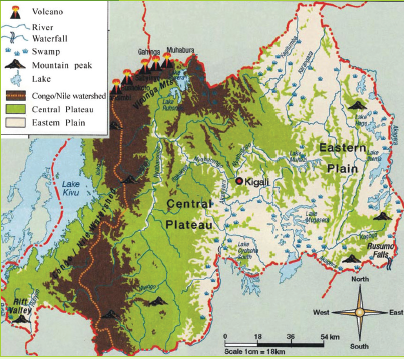
Fig 2.3
1. Which physical feature is found to the north-western part of the map?
2. Name the lake that is found to the western side of the map.
3. Give the direction of Birunga Mountains from the Eastern plains.
4. Your teacher has organised a trip for you to the Rusumo falls. Identify its direction from Kigali city.Symbols and signs used on maps
A symbol is something that is used for or regarded as representing something else.In map work, a key usually shows different symbols.It also gives their meanings. The symbols are usually in the form of shorthand characters, pictorial presentations or colours. In most cases, they show the activities, towns and other physical features. This is done purposely to avoid overcrowding
a map with a lot of information that would make it look untidy.
In groups, use the map extract provided below.
1. Identify the symbols used to represent various features on the map.
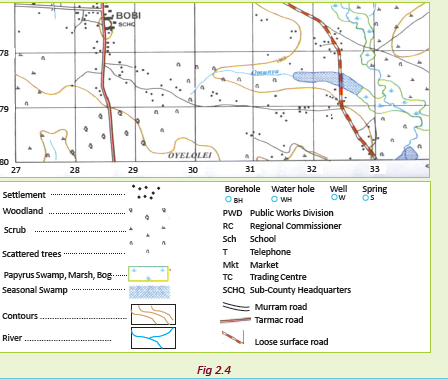
2. Use the map key to identify the symbols used.
3. Give the meaning of each of the symbols and signs used on the map.Some of the features represented on a key are given in Table 2.2:
Table 2.2 Symbols used in maps
Feature Symbol used Road 
Railway line 
Airstrip (airport 
Religious centre
Village 
Town 
Mineral works/mining 
Power transmission line 
Mosque 
Hut 
Bridge 
River 
Lake 
School 
Hospital 
Antiquity 
Swamps 
Telephone lines 
Trigonometrical
station (Primary
Trigonometrical
station (Secondary)
Foot path 
Brown lines (contours) 
The features shown in Table 2.2 are only a few of the features that are represented
on maps. It is important that you go to the library and find out other symbols used to represent the features that are shown in maps. The symbols used on maps are usually given in the key of a map. It is important to study the key of a map.
Drawing sketch maps
Do the following under the guidance of your teacher.
1. Collect drawing materials: pencils,paper, a ruler and an eraser.
2. Go outside your classroom and carefully observe your school surroundings.
3. Draw a map showing your school surroundings. Your teacher will show you how to come up with and use different scales, for example 1:100,000
4. On the map, use symbols to represent features such as buildings, vegetation and roads.
5. Include all the elements of a good map on the map that you draw. This include; a title, a frame, a key, a scale and a compass.
A sketch map is an outline map that is drawn from observation.It does not use exact measurements. It only shows the main features of an area.
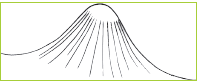
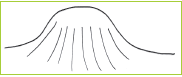
Below is an example of a sketch map of Mt. St. Helens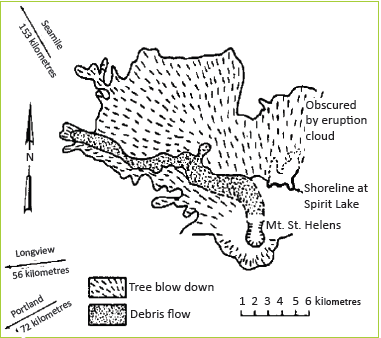
Fig 2.5 Sketch map.
.Characteristics of sketch maps
Sketch maps have the following features that distinguish them from other maps.
• They are drawn roughly.
• They are not drawn to the scale.
• They represent few features for the interests of the user.
• They are less detailed as compared to topographical maps.
• They are simple and hence easy to understand.
• They have the elements of a good map such as the title, key, frame and compass.
Steps involved in drawing a sketch map
There are five steps in the designing and drawing of a sketch map.
1. Identify and point out the features to be represented. For instance,landforms such as hills, mountains,lakes and rivers. Remember to also include land use such as construction,mining and farming. Transport facilities such as roads, railway lines and airports should also be included.
2. Place the identified elements in order according to the divisions of the landscape.
These include the background, middle ground and the fore ground. This is important because it ensures that each feature is rightly shown where it is supposed to be.
3. Draw the actual sketch map,representing it in a simple way.
4. Select a suitable title that accurately shows the purpose of the sketch map,for instance, what the map is about.
Sketch map of a school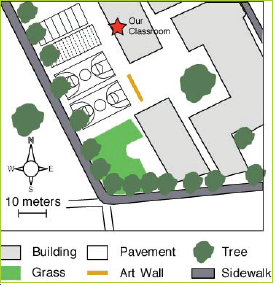
Fig 2.6 (a) Sketch map of a school.
Sketch map of a school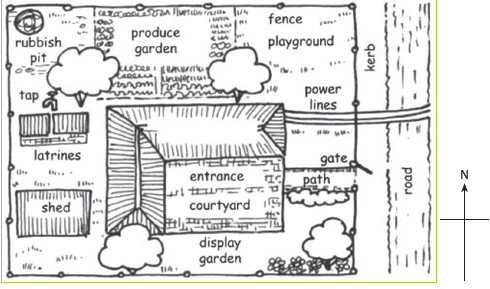
Fig 2.6 (b) Sketch map of a school.
1. Draw a sketch map of your homestead with all the features that are in it.
2. In your sketch map apply the elements of a good map.
3. Use a scale of 1:24000.
4. Present your work for assessment by your teacher.
Task 2.1
1. Explain the meaning of a map.
2. Which of the following combination comprises of elements of a good map?
A. Title, roads, key
B. Title, key, relief
C. Title, key, compass direction
3. Give other elements of a good map that are not listed in the combination in Question 2.
4. State the difference between a topographical map and a sketch map.
5. Explain the main steps involved in drawing a sketch map.
6. Describe the characteristics of a sketch map.
Indicators of relief on maps
In groups, use the map extract provided below to answer the questions that follow: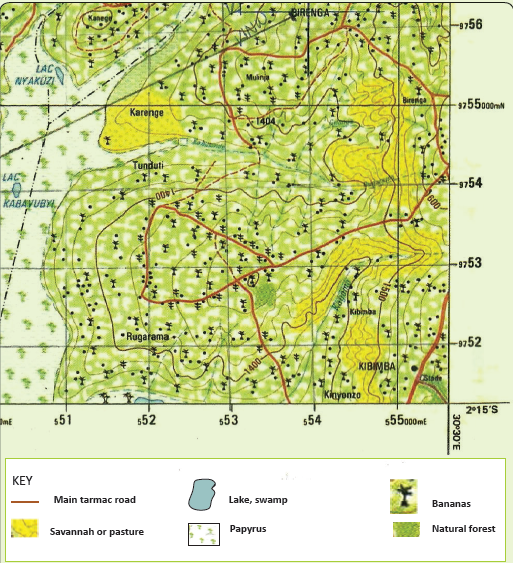
Fig 2.7
(a) Identify the vegetation type of the area represented.
(b) Identify two natural features on the map.
(c) Describe the economic activity of the people in the area.The term relief in geography refers to the nature and outlook of a landscape. Relief usually refers to the highest and lowest elevation points in an area.
Mountains and ridges are the highest elevation points, while valleys are the lowest. Relief describes the horizontal and vertical dimensions of a land surface.This is also known as terrain.
Relief features are visible on physical maps.This is because these maps emphasize the height of the land. This is usually shown with differences in colour and shading. This is done for different heights.The earth’s surface is made up of various relief features. These features have varying altitudes, characteristics and origins that shape their appearance. The relief features represented on maps include the following:
• mountains
• hills
• rivers
• lakes
• plains (low land areas)
• escarpments/rift valley
• fault lines
• swamps.
It is important to study relief in geography because of the following reasons.
• The terrain of an area is one of the main determinants of its suitability for human settlement. Rocky and steep areas are not favourable for human settlement. Flat plains that have alluvial soils are suitable for settlement.
• Understanding an area’s relief helps town planners to understand the drainage of an area.Relief maps help planners to locate watersheds and to determine where water moves. It also helps to predict how human activity is likely to affect water quality over time.
• Knowing the relief of the land also helps with planning for soil conservation. Soil conservation is important in agriculture.This helps to inform the farmers about practices like contour ploughing.• Knowing the terrain of an area makes the difference between a smooth landing and a difficult one, for aircrafts.

Do this in groups with the guidance of your teacher.
1. Go for a field study in the area around your school.
2. Study the relief of the area. Observe both the artificial and natural features.
3. Study the relationship between the artificial and natural features.
4. Write down your observations in a notebook.
5. Explain how human activities have affected the environment.
6. Explain the ways humans can use their surrounding in a sustainable way.
Methods of presenting relief on mapsPhysical maps show the location of landforms like deserts, mountains and plains. Topographical maps are detailed, accurate graphic representations of features that appear on the Earth’s surface. These features include:
• roads, buildings, urban development, railways and airports.
• geographical features, administrative boundaries, state and international borders and reserves
• lakes, rivers, streams, swamps and coastal flats
• mountains, valleys, slopes, depressions and plains
• forested and cleared areas.
A map key lists the features shown on the map, and their symbols. There are many ways of representing relief on topographical maps. They include:(a) use of colour
(b) trigonometric stations
(c) spot heights
(d) contours
(e) pictorials
(f) hachures
(g) shading
Layer tintingThis is the use of colour to show different relief features in relation to various heights.The colour or shade used varies from dark to light shades.
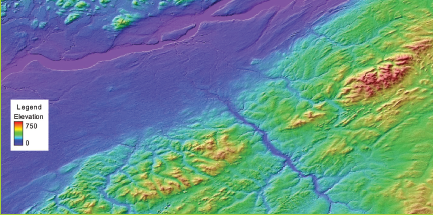
Fig 2.8 Coloured representation of relief.
The dark shades of colour are used for areas of higher altitudes. Areas with lower altitudes
are shaded using lighter shades of colour. For example, areas with ice or snow are shown
in white. Dark brown represents mountains, light green shows low lying areas and light brown colour represents hilly areas. Depths of oceans and seas are shown in shades of blue from light to dark. This means that as the height increases, the shade deepens and becomes darker.
Do this in groups.
1. Study the map of Figure 2.9.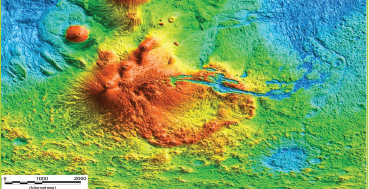
Fig 2.9
2 Identify the relief features shown.
3. Describe the height of the features presented on the map.
4 Present your findings to the rest of the class.Trigonometric stations
These are fixed surveying stations that are used for land surveys. A trigonometric station is also known as a trig point. Many trigonometric stations are located on the top of hills. This is done so that they can top of hills. This is done so that they can easily be spotted from many directions Trigonometric stations are shown on maps using a triangle. In some instances, the
actual heights of specific spots where the triangles are placed are given beside the triangle. The stations are important in the construction of modern infrastructure such as land boundaries, roads, railways and bridges. Table 2.3 shows the types of symbols for trigonometric stations.
Table 2.3 Symbols showing trigonometric stations.

Do this in groups.
Study the map of Figure 2.10.
Fig 2.10
1. Using the map extract provided, state the highest points in metres.
2. Describe the terrain of the area represented on the map.
3. Draw a sketch map of the landscape around your school. Use colour to show the
important features.Spot heights
These are dots used to represent specific areas on a topographical map. They show the
actual heights of given areas. For example, • 2015 • 2001 • 560 • 675.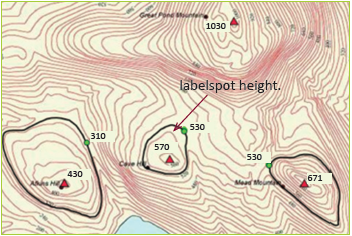
Fig 2.11 Spot heights on an extract of a topographical map.

Do this in groups of three.
1. Identify the spot heights indicated on the map of Figure 2.12.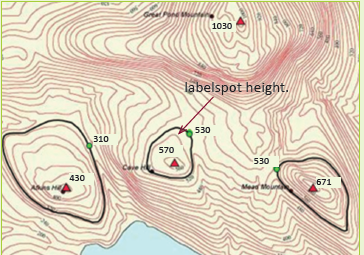
Fig 2.12
2. Describe what they represent.
Contours
Contours are lines drawn on maps joining areas with the same height above sea level.
They show both the height and steepness of a place. Height is usually represented in metres or feet. The contour lines are usually drawn at intervals called contour intervals. The contour lines never cross each other. The lines are usually brown in colour. In steep areas, the lines are very close to each other. In areas with gentle gradients, the lines are far apart. Contours are mostly used in representing relief on topographical maps.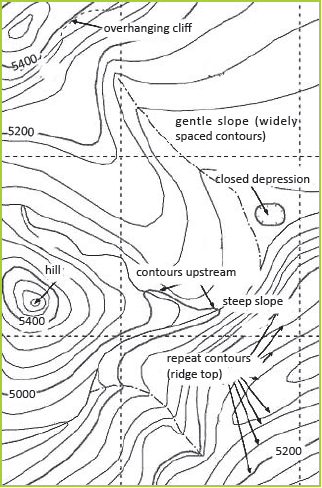
Fig 2.13 Contour lines used on a map.Characteristics of contour lines used on maps
• They have the height number written on them.
• They are drawn based on a specific and uniform interval.
In pairs, do the following with the guidance of your teacher.
1. Study the picture below.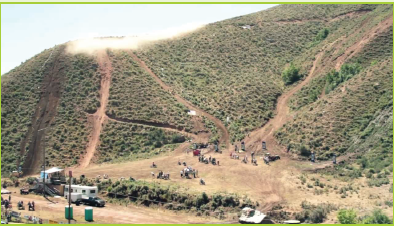
Fig 2.14
2. Which side of the hill is shown in Figure 2.14?
3. Sketch contour lines representing this side of the hill.
4. Give reasons for your choice of sketch.Interpretation of contours on a topographical map
various landforms. Some of the landforms
include:
• conical hills
• flat-topped hills
• ridges
• hills with depressions
• craters
• slopes
• plateaus• spurs
• low lands
• river valleys.Conical hills
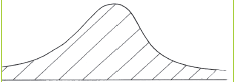
Fig 2.15 A conical hill .
tops with slopes that are similar in gradient and appearance. The contours representing conical hills are of the same size. They also have uniform spacing between them. This means that the lines are evenly spread.They usually have a circular arrangement as shown in Figure 2.16.
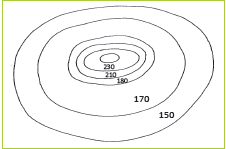
Fig 2.16 Contour lines representing a conical hill.
The top part of the hill is represented by contour lines which are close together. As you move away from the top, the space between the lines are widely spaced on the slopes of the hill. This is due to the gentle gradient of the slopes. If a hill has the same gradient in all its slopes, it is represented by the contour lines shown in Figure 2.17.
Fig 2.17 Contour lines representing a conical hill with an even gradient
Flat-topped hillsThese differ from the conical hills as their tops are generally flat. The contour lines representing flat-topped hills are wide apart at the top, but start getting close together towards the lower parts of the hills.

Fig 2.18 Flat topped hill.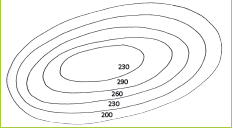
Fig 2.19 Contours representing a flat topped hill.
Hills with depressionsThese are hills which have depressions at their tops. They are represented by contours that are ring shaped. The depression is represented by pictorial symbols.
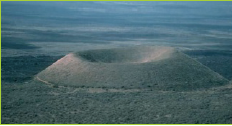
Fig 2.20 A hill with a depression on its top.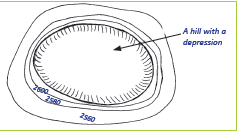
Fig 2.21 Contours representing a hill with a depression.Depression craters

Work in groups of three. Use geographical documents and other resources.
1. Find out information about
(a) depression craters
(b) ridges
(c) escarpments.
2. Write short notes about each feature.
3. Present your findings in a class discussion.
Depression craters are hills or mountains that have deep depressions usually containing water. An example is Mt. Bisoke in Rwanda. Such hills or mountains are represented on a topographical map with ring-shaped contour lines.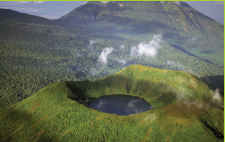
Fig 2.22 The crater lake on Mt. Bisoke
Fig 2.23 Contours representing a depression crater
RidgesA ridge is an elongated or stretched out hill,or a range of hills that are close together. The contour lines representing ridges are elongated or sometimes oval shaped. In some instances, the hills that make up a ridge are separated from each other by gaps called saddles which are broad gaps or cols which are narrow gaps.
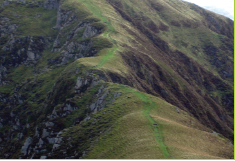
Fig 2. 24 A ridge.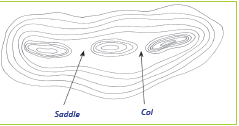
Fig 2.25 Contours showing a ridge with cols and saddles.
EscarpmentsThese are physical features that have two distinctively different slopes. One side is steeper than the other. The steep side is called a scarp slope while the gentle side is known as the dip slope. The contour lines representing the dip slope are far apart from each other while those representing the scarp slope tend to be close together.
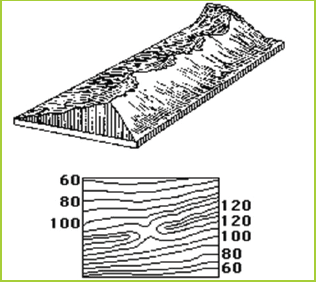
Fig 2.26 An escarpment and contour lines representing it.
Your teacher will take you to a hill near your school. Do this in groups.
1. Observe and describe the nature of the hill.
2. Identify the scarp slope and the dip slope.
SlopesA slope refers to the surface of the earth whereby one end is at a higher level than the other.
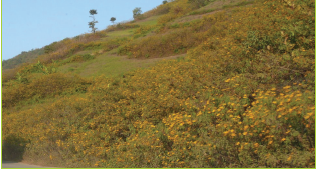
Fig 2.27 A slope.
.Types of slopes and how they are represented on topographical maps

1. Your teacher will take you for a field visit to an area near your school.
2. Carefully study the hilly areas and the slopes and draw them in your exercise book.
3. Describe the difference in the gradients of the slopes you have drawn.
Concave slope
The contours that represent this slope are close together towards the top. They are
wide apart towards the base of the slope.This is because the land is steep at the top
and gently slopes towards the base.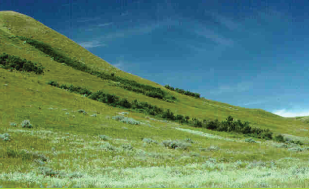
Fig 2.28 (a) A concave slope.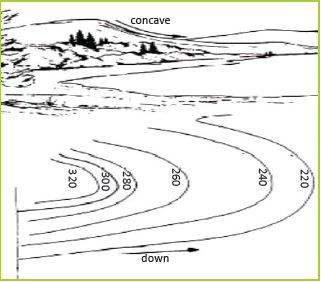
Fig 2.28 (b) Contours representing a concave slopeConvex slopes
This is a slope that is gentle towards the top and steep towards the base. The contours are widely spaced at the top. Towards the base where the land is steep, they are closely spaced.

Fig 2.29 (a) A convex slope.
Fig 2.29 (b) Contours representing a convex slope.
Steep slopes
Do this is in groups of three. Use Figure 2.30 below to answer the questions that follow.
. Fig 2.30
1. Describe the nature of the landscape shown.
2. Explain the gradient or nature of the slope.
3. Suppose you lived in such an area, how would you use the land sustainably?
A steep slope is represented on a topographical map by contours that are very close together. This is due to the uniform steepness of the slopes or land.
.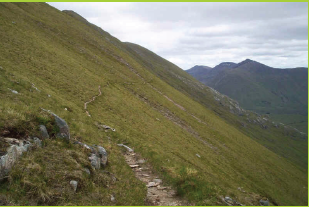
Fig 2.31 (a) A steep slope
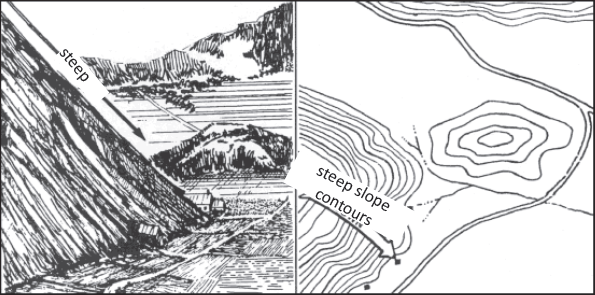
Fig 2.31 (b) Contours representing a steep slope.
Gentle slopes
A gentle slope is represented on a topographical map by contours that are uniformly spaced. This is because the slope is uniformly gentle.

Fig 2.32 (a) A gentle slope.
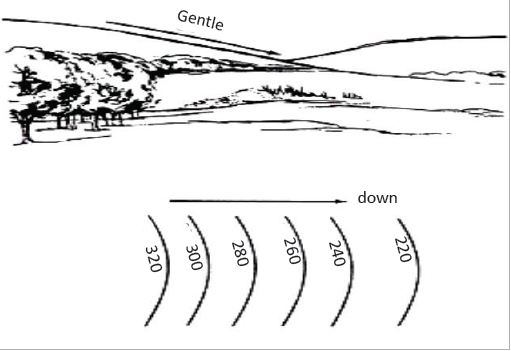
Fig 2.32 (b) Contours representing a gentle slope.
Flat land or plainsThis is represented on a topographical map by contours that are uniformly widely spaced. Such areas are associated with other features such as swamps.

Fig 2.33 (a) A flat land
Fig 2.33 (b) Contour lines on a relatively flat land.
Even slopeThis is a slope where the land has an almost similar gradient. When being represented on a topographical map, contour lines with same distance between the lines are drawn. Thecontour lines are equally spaced.

Fig 2.34 (a) An even slope.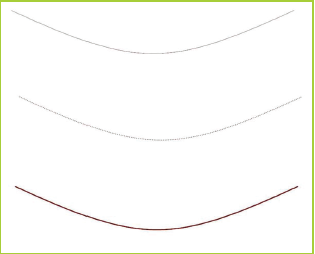
Fig 2.34 (b) Contours showing an even slope.
Work in groups.
Do the following.
1. Describe the nature of the land shown by the contour lines.
2. Identify some of the landforms on the map represented by the contour lines.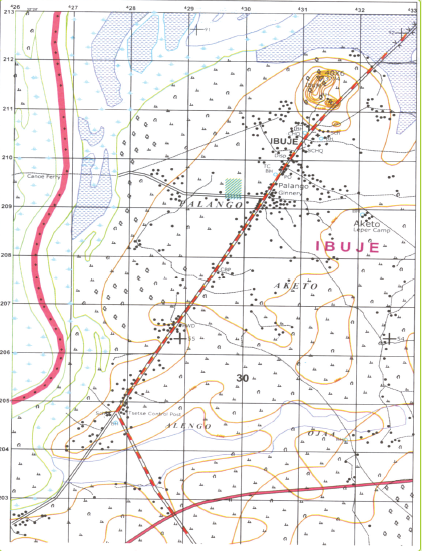

There are other indicators of relief used on maps. They include the following.
Hachures
Hachuring is one of the commonly used methods of representing relief on topographical maps. This method is used to show the altitude of a given area. It is used
more in places with steep gradients. They are represented using short parallel lines.The steepness or gentleness of a slope is shown using lines with varying lengths and thicknesses. It is very important to note that hachures do not reveal the actual heights of areas represented as is the case with contour lines.
Fig 2.36 Hachures.
Table 2.4: Interpretation of hachure lines.
Nature of the lines interpretation Lines drawn very close to one another in a compacted way.
Represent a very steep slope or gradient
such as a cone volcano.
Lines drawn widely apart and less compacted or not congested (thin in nature).
Represent a very gentle gradient or a
gently sloping area.
Pictorial method
This method uses symbols based on the appearance of the features. It shows how features appear from above. For example, mountains are raised while valleys are sunken. When showing height, very short thick lines which have thick heads and tails are used. The sharp point of the symbol points towards the lowland part of a feature while the thick head points to the
high altitude.
Hill shading
This method of representing relief is about careful use of light and shadow. It is imagined that light over a given area brings variations in shading. The intensity of light keeps on reducing depending on the nature and angle of the slope and the gradient. The darker expressions are used to represent the steep slopes. Bright expressions are used to represent hill tops, areas with gentle gradients such as valley bottoms and plain or flat lands.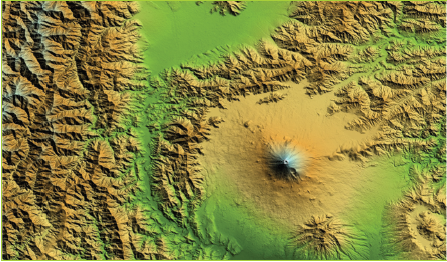
Fig 2.37 Hill shading.
Do this in groups. Study the map extract provided below, and answer the questions that follow.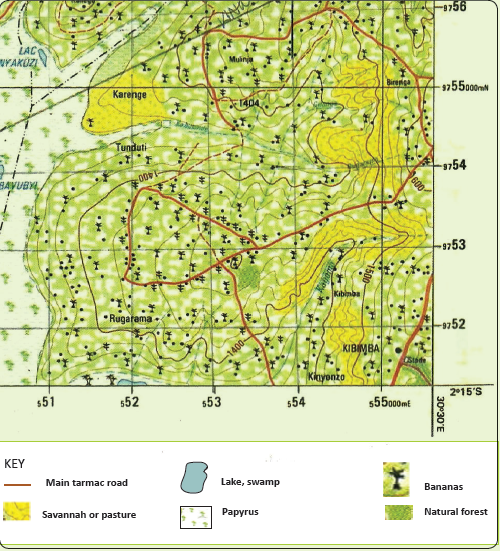
Fig 2.38
1. Give the grid reference of Lac Nyakuzi.
2. Mention the relief indicators that have been used to represent relief features on the map.
Do the following in groups, with the help of your teacher.
1. Draw a sketch map showing the landscape of the area around your school.
2. Using different colours, shade the map illustrating variations in light. Ensure that you bring out the gradient expressions.
3. Present your drawings to the rest of the class for discussion.
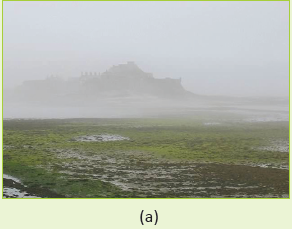
Maps and aerial photographs
1. Study Figures 2.39 and 2.40. Give a name to each one of them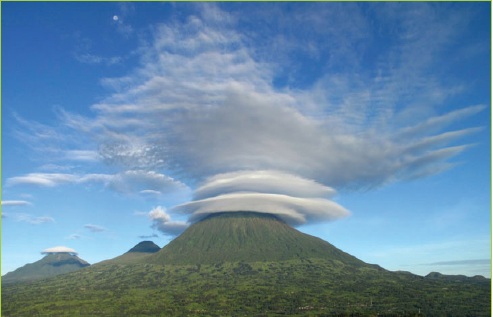
Fig 2.39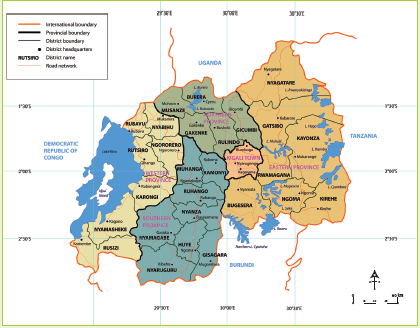
Fig 2.40
2. Describe the features of each one of them.
As earlier explained, a map is a representation on a flat surface of a whole or part of an area. Maps represent parts of the earth’s surface drawn to scale. Figure 2.41 shows a map of Rwanda
Fig 2.41 A map showing the districts of Rwanda
A photograph is a picture created using a camera and stored digitally. Photographs are usually in the form of a print or a slide. A photograph could be a picture of a person,a scene or a physical feature on earth or space.The sizes of photographs vary. There is
no relationship between the size of a photograph and the size of the object represented.
An aerial photograph is a picture of the earth’s surface taken from above. The picture is usually taken from an aircraft. Aerial photographs are often used as data for geographers. They are also used for locating geographic features as well as for interpreting environmental conditions.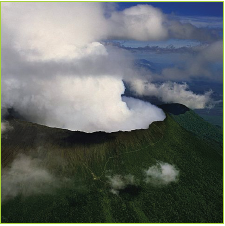
Fig 2.40 An aerial photograph of Mt. Bisoke in Rwanda
Your teacher will provide you with copies of maps and a variety of aerial photographs.
1. Study the documents carefully
2. Identify maps and photographs. Do this by separating them accordingly.
3. Give reasons why you have classified them the way you have.
4 Present your work to the rest of the class members.
Differences between maps and aerial photographs
Aerial photographs and maps are used by geographers. Cartographers sometimes
use aerial photographs when designing and preparing maps.
Under the guidance of your teacher, do the following.
1. Draw a sketch map of your school. Include all the elements of a good map in your drawing.
2. Your teacher will help you take ground photographs of your school using a camera.
3. Compare the photographs you have taken with the aerial photographs that you had studied before.
4. Note the differences that you can observe between the two types of photographs. Write them in your exercise books.
5. Note down the differences between the aerial photographs and the map that you have drawn.
6. Present your findings in class.
The table below shows the difference between maps and aerial photographs.
Table 2.4 Differences between maps and aerial photographs.
Maps Aerial photographs A map is a representation of a part of the earth’s surface. An aerial photograph is a picture taken from a raised platform representing a small part of the earth’s surface They are drawn to scale. Not taken to scale. A map can represent a relatively large area. An aerial photograph only covers a small area or object. The features used on a map are
interpreted by use of symbols.The features are clearly seen without the use of symbols. They appear as they are in their natural form. A map is sometimes difficult to
interpret.An aerial photograph is easy to interpret. A map only shows specific information that is needed. It is thus prepared
selectively.An aerial photograph shows all features that are near a place, whether they are useful or not. A map is difficult to come up with. It
requires a wide range of skills such as
cartographic techniques.It is relatively easier to take a photograph. It only requires one to have a camera and to know how to use it. A map has a key that helps readers to
interpret and understand it.An aerial photograph has no key. To understand it, one only has to keenly look at it. A map has no skyline. It does not show the horizon which can be used to determine the relief of an area. It instead uses contours to represent relief. An aerial photograph has a skyline especially the high oblique aerial photographs. This makes it easy to determine the relief and climate of the
area represented.A map has a compass that shows the direction of various parts on it. This is done in relation to the actual areas being represented. An aerial photograph does not have a compass
to aid in determining the direction of the features in it.
Atlas index
Work in groups. Your teacher will give you atlases.
1. Read the contents on the last page of the atlas.
2. Write down your observations in your exercise book.
3. Using the Internet and your textbook, find out the meaning of an atlas index.
4. Identify its main characteristics.
5. Write down the findings in your exercise books for class presentation.An atlas is a collection of maps of the Earth or regions of the Earth. However, there are atlases of other planets too. An atlas is usually a bound book with a collection of maps. However, there are atlases in multimedia formats
Fig 2.43 An atlas book
Atlases usually present geographical features, political boundaries, geopolitical, social, religious and economic statistics. They also have information about maps and places in them.
An atlas index is a detailed alphabetical listing of names, places and topics. In some cases, an atlas index follows numerical listing. The list is accompanied by the numbers of the pages on which they are mentioned or discussed. The atlas index is usually found at the end of the atlas.
1. Your teacher will provide you with an atlas. Find the index page and comment on the following.
• Content of the index.
• The position of the index.
• The arrangement of content of the index.
2. Present your findings in class.
Fig 2.44 Sample of an open atlas index.
Elements of an atlas index
The atlas index shows various topicsband names of places.
The index is at the last pages of the atlas.
The index lists a summary of the specific contents of the atlas.
The index acts as a pointer. It directs the reader to specific pages where given topics can be found inside the atlas.
The index follows a systematic alphabetical or numerical order.The following are the elements of an atlas index.Did you know?
• No one knows the exact date when the first map was created.
• People who create maps are known as cartographers.
• Some of the first detailed maps were made by armies.
• It is impossible to create a map with a perfect scale.
• The first aerial photographs were taken by French map makers in 1858.
1. (a) Define the term relief.
(b) Name six the features that are represented on a topographical map.2. (a) Name the seven different ways that can be used to represent relief on topographical maps.
(b) Muhire wants to indicate the height of a specific spot of an area on a map. Suggest to him two methods that he can use.
3. (a) Distinguish between an trigonometric station and a spot height.
(b) Name two types of trigonometric stations.
(c) Show the symbols used for each.
4. (a) Explain the difference between hachures and hill shading methods of representing relief.
(b) Give the appropriate illustration for each.
5. (a) Define contours.
(b) Explain the main characteristics of contours in map work.
(c) Describe types of slopes and explain how they are represented on topographical maps.
6. Using illustrations, explain how the layer tinting method can help geographers to represent relief on a map.
7. Explain five differences between a map and an aerial photograph.
8. (a) Give the meaning of an atlas index.
(b) Describe the characteristics of an atlas index.Unit 3: The Earth in relation to the universe

By the end of this unit, you must be able to analyse the impact of the earth’s position and movements in the solar system.
Unit objectives
By the end of this unit, you must be able to:
(a) identify different components of the universe
(b) describe the earth and the solar system
(c) state the earth’s movements and their consequences
(d) show the relationship between longitude and time
(e) define latitude and longitude.Components of the universe

Do this in groups of four under the guidance of your teacher.
1. Go outside your classroom for five minutes.
2. Observe the sky.
3. Write down what you have observed.4. Let each group member say what is seen in the sky at night.
5. Write down your points.
6. Compile your points and share them with other members in a class presentation.
Do this individually and share the findings with other members of your class.
Study the pictures shown below.
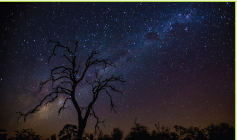
Fig 3.1
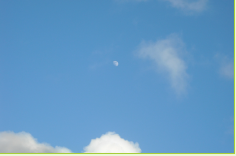
Fig 3.2
1. Compare the two pictures showing the sky at different times.
2. Write down the differences that you can observe.
3. Explain why you think there is a difference in the sky at night and at day time.
4. Share your findings with the rest of the class.Definition of the universe
The term universe refers all of space including everything that exists in it. This includes the stars, the galaxies, the planets, matter and energy . It also has empty space with particles and interstellar gas. The universe is also known as the cosmos. During day time, it is common to see the sun. This is one of the heavenly bodies that exist in space. However this depends on one’s geographical location. The universe has no specific shape. It is endless space. Scientists have not fully explored the universe due to its vast and seemingly unending nature. They are still making discoveries in order to understand the universe better.

Do this in groups of five.
1. Use the Internet, geography textbooks and photographs to find out the elements that constitute the universe.
2. Write down notes on your findings.
3. Choose a group leader who will share the findings of your group with other class members in a class presentation.Components of the universe

Do this in groups of three.
1. Using the Internet and geography textbooks, find out other heavenly bodies found in the universe.
2. Write them down in your notebooks.
3.The universe is made up of planetary bodies that move or revolve around the sun. They
include the following. Present your findings in class.• Stars
• The sun
• Clusters
• Galaxies
• Planets
• Earth
• Moons
• Asteroids
• Meteors
• Comets(a) Stars
Stars are luminous heavenly bodies that give out light. In most cases, stars have very
high temperatures. There are many stars in the universe. Each star is associated with planets and moons.
Fig 3.3 Stars in the sky at night
(b) The sun
The sun is one of the stars that are found in the universe. It is the only star that gives out its own light. Other stars in our universe reflect light from it. It is located in the middle of the solar system. The sun is near the earth’s atmosphere. All the known planets and other heavenly bodies revolve
around it. The planets and heavenly bodies revolve around the sun following specific paths
known as orbits. This revolution occurs because the sun pulls them towards it. They also use their own gravitational force to pull towards their centres and end up being in a circular motion.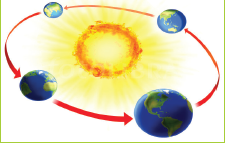
Fig 3.4 The earth orbits the sun
(c) Clusters
Star clusters are a group of stars that share a common origin. They are held together by
the force of gravity.
Fig 3.5 A cluster of stars.
(d) Galaxy
A galaxy is a large collection of gas, dust and billions of stars held together by gravity. One galaxy can have hundreds of billions of stars and be as large as 200,000 light years across. These stars are still held together by the force of gravity. For example, our planet, Earth is found in the Milky Way galaxy. It derived its name from its milky, appearance of a dim glowing band arching across the night sky. There are also other galaxies in the universe.
Fig 3.6 The Milky Way galaxy.
(e) Planets
These are heavenly bodies that revolve around a star following specific orbits.
Fig 3.7 Planets in the solar system
The solar system consists of eight planets and the sun. The eight planets are: Mercury, Venus, Earth, Mars, Jupiter, Saturn, Uranus and Neptune. The Earth is the only planet that has been known to support life.

Work in pairs.
1. Go outside the classroom. Describe what you can see on planet earth that makes it able to support life.
2. Write down your findings in your notebooks.3. Present your work in a class discussion.
(f) Moons
The moon is another heavenly body that is found in the universe. It is a natural satellite of the earth. There is only one moon that attends to our planet Earth. Other planets also have satellites that attend to them. It is estimated that there are about 179 satellites that attend to all the planets and planetoids. These satellites form part of the universe.
Fig 3.8 The moon as observed from the earth
(g) Asteroids
Asteroids are small, airless rocky bodies revolving around the sun between Mars and Jupiter. They are too small to be called planets. This is because they never fully developed into planets. They are sometimes referred to as planetoids or dwarf planets. They range in size from tiny particles to large bodies hundreds of kilometres in diameter. It is not easy to see the smallest asteroids. Since they have little gravity, they are irregular in shape. Asteroids are minor members of the solar system. They form part of the universe.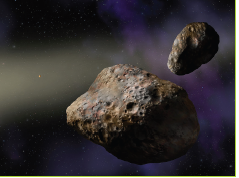
Fig 3.9 Asteroids in space
Meteors
Meteors are fragments of rock and metal that fall to Earth from space. They are known to fall as they break away from other bodies such as asteroids. They are of different sizes. Some are as small as a fraction of a millimetre. Others are as big as a football pitch or bigger. The Earth’s gravitational force causes the meteorites to accelerate to over 11.2 kilometres per second. As they enter Earth’s thick atmosphere, they rapidly slow down due to the friction. They then glow, flashing across the sky like fireworks, before finally crashing to the ground.Meteors are popularly known as shooting stars. When they enter the Earth’s atmosphere, they appear as short-lived long thin lines of light. This light suddenly disappears into vapour or ash.
This happens before the meteors reach the Earth’s surface. The bright light is formed out of friction between the meteor and the atmospheric air. Meteors are minor members of the solar system. They form part of the universe.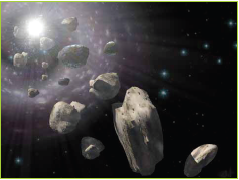
Fig 3.10 Meteors in outer space
Meteors that fail to vapourise or burn up reach the Earth’s surface as rocks. They are referred to as meteorites. Some hit the Earth’s surface with a great impact forming craters. When meteorites reach the Earth’s surface, they cause great damage. However, in most
case the meteors fail to enter the Earth’s atmosphere. This is because of the following
reasons.- Most of them burn up before they reach on the Earth’s surface. This is due to the high speeds and powerful friction.
- The moon safeguards the Earth from meteoroids. Therefore, most of them land onto the moon’s surface. This is why there are many craters on the moon’s surface.

Do this in groups of three.
1. Using space photographs, the Internet and textbooks, find out what would happen to our environment if meteors hit the Earth’s surface.
2. Come up with appropriate measures that humans could take to ensure that we protect our environment should that happen.(i) Comets
Comets are small heavenly bodies that revolve round the sun along very elongated orbits. They are made up of frozen gases, ice and lumps of rocks. Comets cross the orbits of other planets as they move towards the sun.
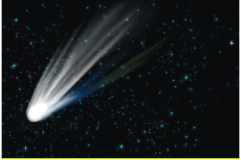
Fig 3.11 Comets in space.
When they get closer to the sun, the heat vapourises the frozen gases. This produces a glowing head called coma and a tail.The tail extends for millions of kilometres. This tail points away from the sun. As thencomets move away from the sun, the gases condense and the tail disappears.
Task 1.
(a) Define the term universe.
(b) Outline the components of the universe.
2. (a) Describe the phases of the moon.
(b) Explain the meaning of a satellite.
3. (a) What is an orbit?
(b) Why should planetary bodies revolve around the sun?
5. Describe the difference between the sun and other stars.
6. (a) With specific examples, define the term planet.
(b) Explain the characteristics of the moon that is attendant to planet Earth.
7. Describe the following terms as used in geography.
(a) Asteroids (b) Planetoids
(c) Meteors (d) Meteorites
(e) Comets (f) Shooting starsConstellations and galaxies

Work in pairs. Your teacher will provide with two photographs.
1. Using the Internet and geography textbooks, find out the meanings of the following:
(a) constellations
(b) galaxies.2. Look at the photographs that yourbteacher provided you with and state the differences between the two.
3. Write down the differences in your notebook.
4. Present your findings in class.Constellations
A constellation is a group of stars that forms a pattern in the sky. This is as seen when viewed from the earth.
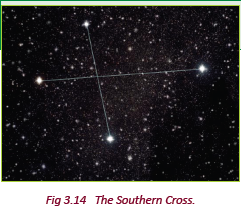
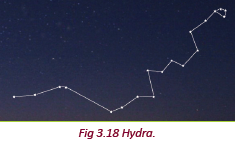
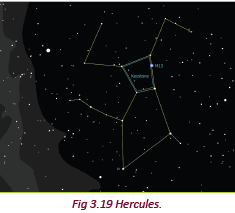
There are 88 constellations in our solar system. The Southern Cross commonly referred to as a Crux is the brightest while Hydra is the biggest. The following pictures show different constellations and their appearances in the sky.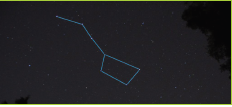
Fig 3.12 The big dipper
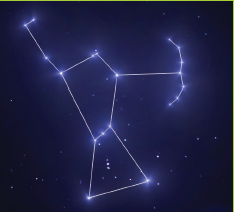
Fig 3.13 Orion.


Do this in groups of four.
1. Go outside the classroom.
2. Using threads and short sticks, demonstrate the patterns of the following constellations:(a) The big dipper
(b) The Southern Cross (Crux)
(c) Orion
(d) Pegasus.Galaxies

Do this in groups of three. Use the Internet, geography textbooks and journals to do the
following.
1. Define the term galaxy.
2. Name and describe different galaxies.
3. Find out whether the Milky Way galaxy is spiral, elliptical or irredula.
4. Write down your findings in your notebook.
5. Share your findings in a class discussion.As you learnt earlier, galaxies form part of the universe. A galaxy is a big collection of gas, dust and billions of stars held together by gravity. One galaxy can have hundreds of billions of stars. It can also be as large as 200,000 light years across.
(a) The Milky Way galaxy – This galaxy has a bright central core with a high density of stars and a flattened disk surrounding it. Its name “milky” is derived from its appearance as a dim glowing band
arching across the night sky. This galaxy contains our solar system.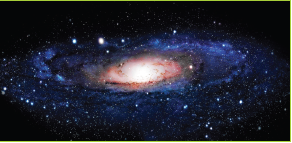
Fig 3.20 The Milky Way galaxy.
(b) The Andromeda galaxy – This galaxy gets its name from the area of the sky in which it appears, the constellation of Andromeda. It is the closest big galaxy to the Milky Way.
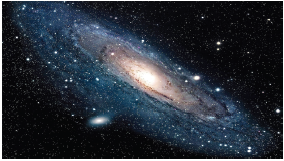
Fig 3.21 The Andromeda galaxy.
(c) Black Eye galaxy – It has a spectacular dark band of absorbing dust in front of the galaxy’s bright nucleus, giving rise to its nicknames of the “Black Eye” or “Evil Eye” galaxy.
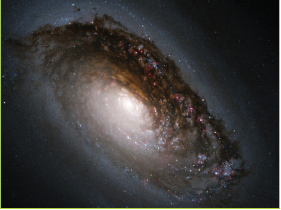
Fig 3.22 The Black Eye galaxy.
(d) Bode’s galaxy – This is named for Johann Elert Bode who discovered this galaxy in 1774.

Fig 3.23 The Bode’s galaxy.
(e) Cartwheel galaxy – Its visual appearance is similar to that of a spoked cartwheel.
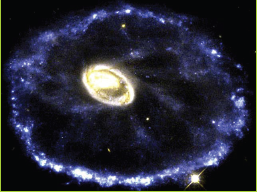
Fig 3.24 The Cartwheel galaxy.
(f) Cigar galaxy – This galaxy appears similar in shape to a cigar.
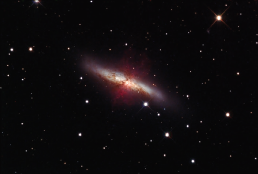
Fig 3.25 The Cigar galaxy
(g) Comet galaxy – This galaxy is named after its unusual appearance, looking like a comet.

Fig 3.26 The Comet galaxy.
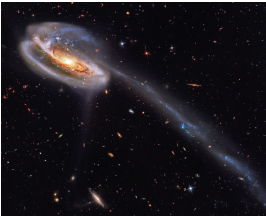
Fig 3.27 The Tadpole galaxy .
(i) Whirlpool galaxy – From the whirlpool appearance this gravitationally disturbed galaxy
exhibits.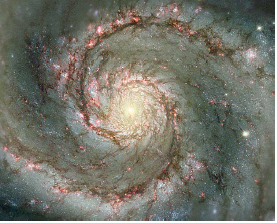
Fig 3.28 The Whirlpool galaxy
Task 3.2
1. What is a constellation?
2. Give the names of the following.
(a) The brightest constellation.
(b) The biggest constellation in our solar system.
3. Give the names of specific examples of constellations.
4. Define a galaxy.
5. Name any three examples of galaxies.The earth and the solar system

Do this in pairs.
1. Go outside your classroom and observe the sky.
2. Record what you see in your notebook.
3. Explain the importance of the sun to human beings and to the environment.
4 Share your findings in a class discussion.When you go outside, you can see a bright heavenly body that gives us light. The heavenly body is known as the sun. We have already learnt that we have stars in the universe. The most important star is the sun. Plants, animals and human beings all depend on the energy provided by the sun. The sun is a star that is at the centre of the solar system. It is the only star that gives out its own light.

Do this in groups of three.
1. Discuss the importance of the sunshine.
2. Explain what would happen to our environment if:
(a) the sun did not produce light
(b) the sun gave too much heat.The solar system

Work in pairs.
1. What is the meaning of the solar system?
2. Name the components of solar system.
3. Name the heavenly body that holds planets in the solar system.The word solar is derived from a Latin word sol that means the sun.

Fig 3.29 The composition of the solar system.
The solar system is a composition of the sun, the eight planets and other heavenly bodies. In the solar system, the planets and the heavenly bodies revolve around the sun. The eight planets are Mercury, Venus, Earth, Mars, Jupiter, Saturn, Uranus and Neptune. They occur in that order from the sun. Jupiter is the largest planet while Mercury is the smallest. Other heavenly bodies are
smaller than the planets. They include; satellites, meteors, asteroids, satellites, comets and meteorites, gas and dust. The solar system exists in the universe. It is one of the components of the universe.The sun
The sun is a star. A star has a bright sphere of hot gas. There are millions of stars in the space. The sun was formed about 4 to 6 billion years ago. It forms the central part of the solar system. All the bodies of the solar system revolve around the sun. The gravitational field of the sun holds elements of the solar system in orbit. The sun rotates in an anticlockwise direction on its axis. It takes about 25 days to complete a rotation at the equator. It also takes about 34 to 35 days to rotate at the poles. The sun is mainly made up of hydrogen and helium which are burning gases.
The planets.The planets

Work in groups.
1. Go outside your classroom to the playground.
2. Draw eight different circles on the ground using chalk. The circles should be inside each other with spaces of about 2 metres apart.3. Choose some students to run as they go round the circles in an anticlockwise direction. They should begin at a slow speed and increase the speed gradually.
4. Observe what happens. Explain why the above learners did not collide as they ran around.
5. What is the geographical name given to the paths that the learners followed?
6. What do you think would happen if the learners did not have specific paths to follow?A planet is a heavenly body which:
(a) is made up of rocky solids
(b) is oval in shape
(c) is suspended in space
(d) rotates on its own axis
(e) revolves around the sun.
The planets are grouped into two:(a) The inner planets: These are also referred to as the terrestrial planets. They are made up of silicate rock mantles. Their cores are composed of iron. They are the planets that are nearer the sun.They are:
. Mercury .Venus
. Earth . Mars(b) The outer planets: They are also called Jovian planets. They are:
Jupiter Uranus
Saturn Neptune
Jupiter and Saturn are composed of gas while Uranus and Neptune are composed
of ice. The planets revolve around the sun in an anticlockwise direction along paths known as orbits. The orbits are oval or elliptical in shape. Different planets take different lengths of time to make complete revolutions round the sun. This is because of their various distances from the sun. The period taken by a planet to make a complete revolution round the sun is known as a year. The earth takes 365 ¼ days to make a complete revolution round the sun. This period is one year on the Earth. Mercury takes 88 days to make a complete revolution round the sun. This is because it is near the sun. This is the shortest time taken by a planet to go round the sun. While revolving around the sun, the planets also rotate on their own axes. The planets and heavenly bodies are held in place by the gravity of the sun.
(a) Name the planets in the solar system.
(b) Which planet supports life?
(c) Suggest ways that humans can make planet Earth fit for human habitation.Table 3.1 The known planets of the solar system.
Planet Key features Mercury • It is the smallest planet.
• It is the nearest planet to the sun.
• It completes its revolution in 88 days.
• It is moonless.
• It is about 70 million kilometres from the sun when it is at its farthest.
When it is closest to the sun , it is at 47 million kilometres away.Venus • It is slightly smaller than planet earth.
• It is one of the brightest planets in the universe.
• It is almost similar to the earth.
• It is moonless.
• It is 108.9 million kilometres from the sun.
• It takes 225 days or 0.165 Earth years to complete its revolution
around the sun.Earth • It is the third planet from the sun.
• It is the only planet known to support life .
• It is 146 million kilometres from the sun.
• It has one moon.
• It takes 365 days to complete a revolution around the sun.Mars • It is slightly cooler than other planets.
• It is 228 million kilometres from the sun.
• It has 2 moons.
• It takes 686.971 Earth days to complete a revolution around the sun.Jupiter • It is the largest planet.
• It has 63 moons.
• It takes 12 Earth years to complete one revolution round the sun.
• It is 779 million kilometres from the sun.Saturn • It has a ring around it making it unique.
• It has 62 moons.
• It is 1.4 billion kilometres from the sun.
• It takes 29.4 Earth years to complete a revolution around the sun.Uranus • It is the 7th planet in the universe .
• It is the 8th 2.5 billion kilometres from the sun.
• It has 27 moons.
• It takes 84.3 years to complete a revolution around the sun.Neptune • It is the 8th planet from the sun.
• It is 4.5 billion kilometres from the sun.
• It has 13 moons.
• It takes 164.79 Earth years to complete a revolution around the sun.
(c) Satellites
Your teacher will provide you with photographs of satellites.
(a) Classify the satellites as natural or artificial.
(b) Write down the differences between the two in your notebook.
(c) Share your findings with your classmates in a class presentation.
- A satellite is an object that moves around a larger object. The moon is a satellite because it moves around Earth. Some planets are moonless meaning they have no satellites while others have many moons. In total, the solar system has 179 satellites. There are two types of satellites in our universe.
- (a) natural satellites
- (b) artificial satellites.
- Natural satellites
- These are heavenly bodies that float around planets passing through specific paths called orbits. They occur naturally in the outer space. A good example is the moon. It is a natural satellite.

- Fig 3.30 The moon is a natural satellite.
- Artificial satellites
- These are smaller objects in the outer space made by humans. They move around planets or moons. They are mostly used for scientific research, communication, weather monitoring and military purposes.
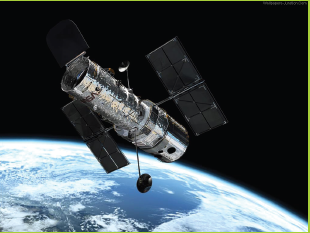
- Fig 3.31 An artificial satellite in space.

- Use the Internet and geography textbooks:
- 1. Find the relationship between the solar system and the universe.
- 2. State the importance of the solar system in the universe. Write down your findings in your notebook.
- 3. Share your findings with the rest of the class.
- Task 3.3
- 1. Explain what a planet is.
- 2. Distinguish between the inner planets and outer planets.
- 3. List examples of terrestrial planets and explain why they are called so.
- 4. With the aid of a diagram, list the planets of the solar system in order of occurrence.
- The moon
The moon is a natural satellite of the earth.Moonlight is the illumination of the sun’s light. The moon does not produce any light of its own. - The moon’s diameter is approximately 3,476 kilometres. It is egg-shaped with the smaller end pointing towards the earth. It rotates on its axis. It also revolves round the earth in 27 days, 7 hours and 43 minutes. It takes 29 days, 12 hours and 44 minutes to get to a new moon. The moon therefore, completes its rotation and revolution at about the same time
- Phases of the moon
- Do this in pairs.
- 1. From your own observation, how would you describe the changing appearance of the moon at different times ? Write these down in your notebook.
- 2. Share with your classmates in a class discussion.
- The moon has different phases. These phases refer to the different shapes of the illuminated part of the moon. These phases are as seen from Earth. The moon changes its phase in relation to the reflected sunlight depending on its position.
- The following are the main phases of the moon.
- 1. Primary phases.
- • New moon
- • First quarter
- • Full moon
- • Last quarter
- 2. Intermediate phases.
- • Waxing crescent
- • Waxing gibbous
- • Waning gibbous
- • Waning crescent
- New moon
The new moon is completely dark on the first day. This happens when the side of the moon that receives sunlight faces away from the earth. The new moon appears when the moon is aligned with the sun and the Earth. During this period, the sun and the moon rise and set about the same time. The new moon is usually dark. 
- Fig 3.32 The new moon.
- Waxing crescent moon
- Between the 1st and the 6th day after the new moon, the moon changes. The part that faces the earth begins showing a silver bright crescent shape. This happens to the moon as it moves around the earth.This shape continues to increase in size as days go by.
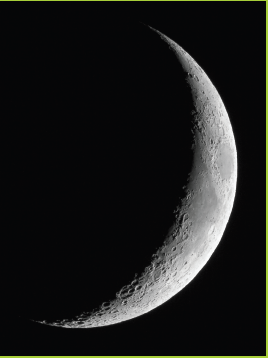
- Fig 3.33 Waxing crescent moon.
- The first quarter moon
- Seven days after the new moon, the moon completes a quarter of its journey around the earth. This is when we are able to see the half of it that receives sunlight. This happens when the moon is at a 90° angle to the earth and sun. This is the part that is illuminated. The other half is in theshadow.
-
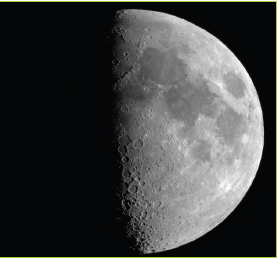
- Fig 3.34 The first quarter moon.
- Waxing gibbous moon
- This is the moon that appears between day 8 and 13. This phase appears when the part of the moon that receives sunlight grows bigger.
Fig 3.35 The waxing gibbous moon.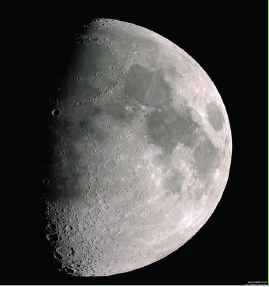 At this point, we view a bigger bright part of the moon as illustrated in Figure 3.35.Full moonFourteen days after the new moon, the moon completes half of its revolution around the earth. During this phase, we see a complete circle of the moon exposed to sunlight
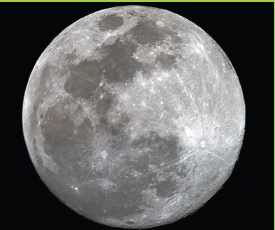 Fig 3.36 The full moon.Waning gibbous moonThis phase appears between 15 to 21 days after the first phase of the new moon. From the earth, we see the lit disk of the moon decreasing or waning. This continues to decrease as days go by.
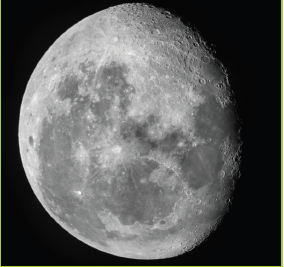 Fig 3.37 Waning gibbous moon.Last quarterThis phase appears three weeks after the new moon. From the earth, we see half of the moon that is lit and half that is completely dark.
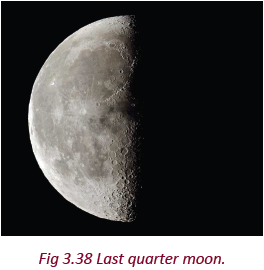 Waning crescentThis phase occurs 23 to 28 days after the new moon. In this phase, the dark part of the moon is bigger than the lit side. From the earth, a bright crescent is seen. It keeps on decreasing until the whole disk of the moon is dark. This leads to day 0 when another new moon occurs.
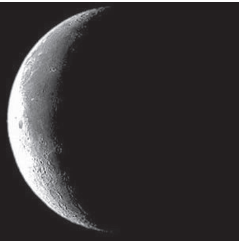 Fig 3.39 Waning crescent moon.
 Fig 3.40 A summary of the phases of the moon.
 Do this in pairs.1. Collect a used DVD disk and a torch.2. Hold the disk as you face your classmate.3. Ask your classmate to hold a brightly lit torch pointing towards the disk.4. Continue changing the position of the disk as you observe the light.5. Note down your observations.6. Discuss your observations with your classmate.7. Compare this to the different phases of the moon.Characteristics of the moon
 Do research in pairs. Use the Internet and other geographical documents.1. Find out the unique characteristics of the moon as a component of the universe.2. Write down your findings in notebooks.3. Share your findings in a class presentation.The moon has the following characteristics.(a) It has a cold surface. Although it gives out light, the temperatures on its surface are so low. It does not produce its own light. It reflects light from the sun that is projected onto planet Earth.(b) It is a dry globe. It has neither rain nor water bodies. This means it has no moisture in its environment.(c) Its surface is dominated with craters.Craters are depressions or holes. They are caused by other heavenly objects that fall on it with great force.(d) Its landscape is made up of rocks and dust. When other heavenly objects fall onto the moon, they break the rocks on the surface. As they break,they are crushed into dust.(e) It has no or low gravitation force. On most parts of the moon, there is very little gravity. On other parts, there is no gravity at all. The gravitational force of the moon causes periodic rising and falling of sea and oceanwaters. This causes tides.(f) Its atmosphere is very limited.This means that there is little air surrounding it.
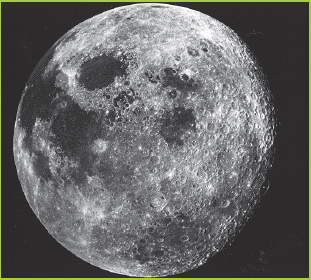 Fig 3.41 The surface of the moon is full ofcraters.Eclipse
 Do this in groups of three.(a) Collect a torch and a football. The ball represents a heavenly body while the torch represents the sun.(b) One of you should hold the ball and the other one the lit torch.(c) Hold the lit torch and the ball aligned in a straight line.(d) Note down your findings.(e) One group member should stand in front of the source of the lit torch.(f) Observe what happens to the ball.(g) Write down your observation in your notebook.(i) What happened to the ball when the torch was lit?(ii) What happened when an obstacle came in between the source of light and the ball?The answers to the questions in Activity 3.20 explain what happens between the sun, moon and the earth. This happens when the moon moves around the earth. The word eclipse comes from the Greek word ekleipsis which means abandonment.An eclipse is the blocking off of the light of a heavenly body. This light is blocked by another heavenly body that passes in front of it.An eclipse occurs when the sun or moon is hidden from an observer on earth. The sun is larger than the earth and the moon.This results in the formation of zones of shadows. The inner total shadow is called the umbra. The outer partial shadow is called thepenumbra.Types of eclipseThere are two types of eclipses.
- The eclipse of the moon (lunar eclipse).
- The eclipse of the sun (solar eclipse).
Eclipse of the moon (lunar eclipse)This occurs when the earth comes between the moon and the sun. The earth blocks the sun’s light from reaching the surface of the moon. The earth casts its shadow on the moon, making it
completely dark.
During the eclipse, the moon may be visible but without its bright illumination. The moon remains in darkness for about two hours. This is because the earth is larger than the moon. It therefore takes a longer period to move the path of the sunlight. Lunar eclipses take place at night and only duringthe full moon.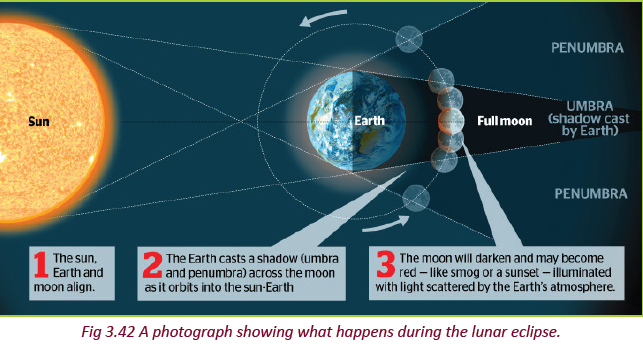
Eclipse of the sun (solar eclipse)This eclipse occurs when the moon comes between the earth and the sun. The moon casts its shadow on the Earth’s surface. It obscures or hides the Earth from the sunlight. Only a small section of the Earth experiences a total solar eclipse. It lasts for about seven and half minutes. The solar eclipse occurs at daytime.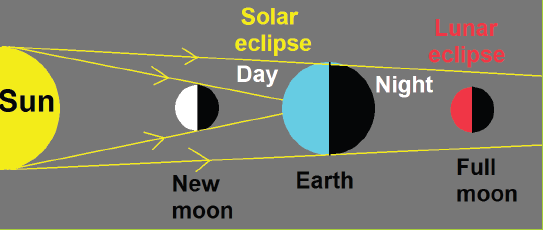 Fig 3.43 (a) A drawing showing the lunar eclipse.
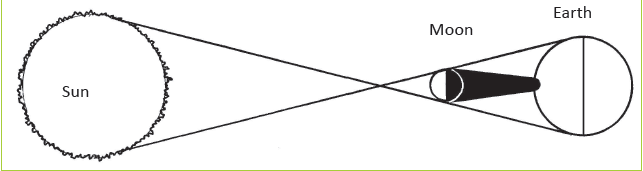 Fig 3.44 (b) An illustration of the solar eclipse.
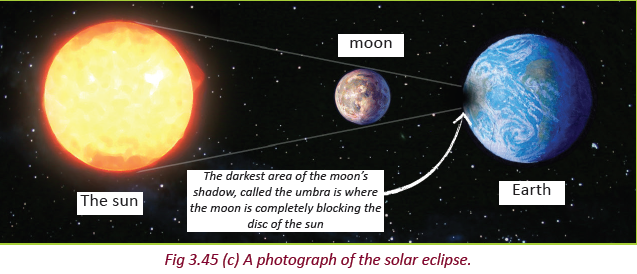
 Do this in pairs. Use the encyclopedia, the Internet and geography textbooks.
1. Carry out further research on the occurrence of the solar and lunar eclipses.
2. Compile a report of your findings.
3. Share your findings in a class presentation.The characteristics of the Earth
The Earth is one of the eight planets in the solar system. It is the third planet after Mercury and Venus. It is believed that the earth was formed about 4,600 million years ago. It was formed when
hot gaseous material broke away from the sun. When this happened, the denser materials consolidated first. They collected at the centre to form a core. The less dense materials collected around the core to form the mantle and the crust. The crust cooled at a faster rate than both the mantle and the core. It therefore hardened. The interior of the earth still maintains very high
temperatures.
The earth is surrounded by a thin layer of gases that is called the atmosphere. The atmosphere is held into place by gravity.About 71% of the total surface of the Earth is occupied by water. Only 29% is occupied by land.Elements of the earth Do this in pairs.
1. Use the Internet and geography textbooks to critically study the components of the earth.
2. Compare them with those of other planets in the solar system.
3. Find out the components that make the earth unique.The earth is made up of the following.
• The core
• The mantle
• The crust
• The atmosphere
• The hydrosphere
The core
The core of the earth is made of dense material. This material collected during the formation of the earth. The core consists of an outer and an inner core.The mantle
This part lies between the crust and the core. It consists of hot, dense, semi-solid rock. It is about 2,900 kilometres thick.The crust
It is the outermost layer of the earth. It is made of a variety of igneous, sedimentary
and metamorphic rocks.
The atmosphere
This is the thin layer of gases that surrounds the earth. It is held onto the earth by the force of gravity. It consists of a mixture of gases like nitrogen, oxygen, water vapour and carbon (IV) oxide.
The hydrosphere
This is composed of all the water on the earth’s surface. The oceans and seas cover 71% of the earth’s surface. This accounts for about 97% of the total waters on earth.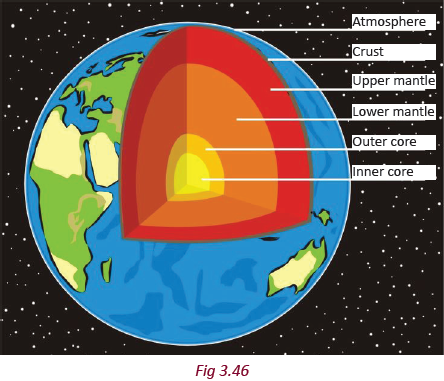 Uniqueness of the earth
The earth is the only planet that is known to support life. This is because it has liquid water
on its surface. The water is in amounts that are conducive to life evolving. The earth has plates that move over an underlying mantle.
It also has an atmosphere. The atmosphere shelters it from the sun’s rays. These attributes make it unique among the other planets. Do this in groups of three.
1. Go outside the classroom.
2. Identify evidences of the factors that support the Earth’s uniqueness.
3. Suggest ways in which humans can conserve the environment to make the Earth remain habitable.
4 Use the findings of your discussion to make a class presentation.The shape of the earth Do this in groups of five.
Your teacher will provide you with whole pumpkins. Follow the instructions given below. After the activity, write down the findings in your note book for class discussion.
1. Cut off the top and bottom parts of the pumpkin. Name the top part North Pole and the bottom part South Pole.
2. Use a thread and ruler to measure the circumference of the pumpkin. Record your findings.3. Measure the latitudinal distances around the pumpkin, 5 cm from each pole.
4. Determine the middle part of the pumpkin and draw a line using a marker. This represents the equator. Measure its distance from the poles and note down your findings.
5. From your findings, state the similarities and the differences between the two parts of the
pumpkin.
6. Use your findings to describe the shape of the earth.In the past, the shape of the earth was thought to be flat. Later on, scientific studies showed that it is almost spherical in shape.
However, the shape of the earth does not make a perfect sphere. It is oblate spheroid or a geoid. It is flattened along the polar regions and bulges along the equator. It is therefore not an actual sphere.
The dimensions of the Earth along the equator, the poles and the meridians give a hint about the shape of the Earth.
Evidence to show that the shape of the Earth is not a perfect sphere
(a) The polar diameter (12,722 km) is shorter than the equatorial diameter which stands at 12,762 kilometres.
(b) The circumference of the polar and equatorial areas differ. The circumference at the equator is bigger than that at the polar regions.
(c) There is great gravitational pull at the poles than at the equator. This is because areas along the equator are far from the centre of the Earth.
(d) Modern satellites show that the Southern Hemisphere is slightly larger than the northern hemisphere.Evidence to show that the earth is not flat Do this in pairs.
1. Describe the shape of each of the following:
(a) Eggs
(b) Oranges
(c) Watermelon
(d) Football
(e) A square wooden board2. Write down your points for a class discussion.
3. Which one of the above items perfectly represent the shape of the earth?The above activity should help you prove that the shape of the Earth is spherical. The evidence listed below show that the Earth is not flat.
(a) Aerial photographs taken using satellites from high altitudes show the earth is round.
(b) The shadow cast onto the moon during the lunar eclipse shows the earth is round.
(c) Several voyages taken around the earth have all proven that the earth is round. Movement on the earth along a straight path in one direction brings you to your starting point from the opposite direction.(d) Places on the Earth’s surface do not receive sunshine at the same time.
(e) The sun keeps changing its altitude at different times of the day. In the morning and evening, the sun seems to be at a low altitude. At noon, the sun’s altitude is at a high altitude. This is illustrated below: Fig 3.47 The sun at various altitudes.(f) The Earth’s horizon is curved. This is evidenced by approaching ships. The smoke, funnels and mast appear on the horizon, before the rest of the ship is seen from the coast.(g) The polar star looks bigger at the poles and smaller away from the poles.The size of the earthEarth is the fifth largest planet in the solar system. It has a surface area of 510 million square kilometres. It is a member of the terrestrial planets and is the largest in the group. It is also the densest planetary body in the solar system. Table 3.2 shows the dimensions of the earth.Table 3.2 Dimensions of the earth.
Measurement Kilometres Equatorial diameter 12,762 km Equatorial circumference 40,075.16 km Polar diameter 12,722 km Meridional circumference 40,009 km Surface area 510,000,000 km2
Position of the earth in the solar system
As you earlier learnt, the Earth is the third planet in the solar system. It is about 150,000,000 million kilometres from the sun. It lies between Venus and Mars. It is the largest of the four terrestrial planets. Do this in pairs.
1. Using the Internet, encyclopaedias and other geography textbooks, describe other characteristics of the earth.
2. Write down your findings in your notebook.
3. Present your findings in a class discussionThe Earth’s movements and their consequences
There are mainly two types of the Earth movements.
(a) Rotation of the Earth.
(b) Revolution of the Earth.Rotation of the Earth on its axis
Do this in pairs. You will require an orange and a sharp stick. You can also use a globe if it is available.
1. Hold the orange in your hand.
2. Pierce the sharp stick through it. Ensure that the stick goes through both ends of the orange.
3. Hold the stick with the orange on hand. Rotate it in a west to east direction.
4. Compare this with the rotation of the earth on its axis.
5. If you use a globe, rotate it to a west to east direction. Observe what happens.Definition of rotationRotation is the act or process of turning around a centre or an axis. The earth is not static. It is always moving round its axis. The earth rotates in an anticlockwise direction from west to east. It rotates at a speed of 1680 kilometres per hour or 28 kilometres per minute.
The earth’s axis is an imaginary line believed to cut across the centre of the earth. It cuts from the North Pole to the South Pole. The earth’s axis is inclined at 23° perpendicular to its orbital plane. The axis has two ends, namely:
(a) North Pole
(b) South Pole. Fig 3.48 Rotation of the earth.The earth’s rotation takes 24 hours in which it is able to complete 360°. This means that
for every 1° , the earth takes 4 minutes. This is calculated practically as shown below.
360°=24 hours Therefore, the Earth completes one degree in 4 minutes.
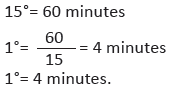
The consequences of the earth’s rotation
The rotation of the earth has the following effects.
(a) Day and night.
(b) The rising and falling of ocean tides.
(c) Differences in time between longitudes(d) The deflection of winds and ocean currents.
(e) Variations in atmospheric pressure over the earth’s surface.
(f) It influences the revolution of the moon round the earth.
Day and night You will require a torch and a ball or globe.
1. One of you should hold the ball or globe and the other one the torch.
2. The student with the lit torch should focus the light to one spot . You can focus it to the centre of the ball or globe.
3. The student with the ball or globe should rotate the ball in a slow motion.
4. Observe what happens and write it down.
5. Present your findings in a class discussion.You will observe that the side of the ball facing the light is bright. The other parts facing away from the light are dark. This is exactly what happens as the earth rotates.
The side of the earth that faces the sun receives sunlight and thus experiences daytime. The opposite side of the Earth experiences darkness in the form of night.The rising and falling ocean tides
A tide is defined as a rhythmic rise and fall of the sea level. This is caused by gravitational
forces between the moon, the sun and the earth.When the earth is rotating, areas facing the sun are pulled by the sun’s gravitational force. However, the solid parts of the earth do not positively respond to this force. The mobile elements of the earth respond in particular the hydrosphere or water bodies. It influences the water levels causing sea levels to rise. When these specific areas move away from the sun, the sea levels go
back to normal. These are referred to as solar tides.Parts of the earth that face the moon at night are subjected to the moon’s gravitational force. This causes lunar tides.
At times, the moon and sun are aligned at the same position in a linear order. At such times, strong tides called spring tides are formed.
The occurrence of tides can be observed at a shore. At high tide, the ocean water rises and covers most of the shore. At the low tide, the water flows back into the ocean.Time differences between longitudes Longitudes are imaginary lines drawn on a map from the North Pole to the South Pole. They are geographic coordinates that specify the east–west position of a point on the earth’s surface. Longitudes are sometimes referred to as meridians. They
are measured in degrees east or west of the Prime or Greenwich Meridian. This is a line that is marked 0° up to 180° both to the west and east.Longitudes are expressed in degrees. They cover 3600 of the globe. The difference
between longitudes is 150 which is equivalent to 1 hour.
The major longitudes are:
(a) Prime or Greenwich Meridian
(b) International Date Line.
How to determine local time using longitudes
The Prime Meridian is important in determining the local time. This is in reference to the usage of other longitudes. Calculation of time is in reference to Greenwich. Therefore, when calculating
time away from the Greenwich Meridian, it is important to know the time at Greenwich.Example
Calculate the time at Alexandria located
at 30° east when the time at Greenwich is noon.
Solution
Step 1:
Determine the difference in degrees between the two longitudes.
The Prime Meridian and 30°.
0° + 30°= 30° east.Step 2:
Find the time based on the difference in degrees between the two longitudes. In this case, if the earth takes 360° to make a complete rotation in 24 hours, then:360°= 24 hours
15° = 1 hour
15°= 60 minutes
1° = 4 timesTherefore, 30° = 30° X 4 minutes
=120 minutes
Convert the 120 minutes into hours.
1 hour = 60 minutes Step 3:
Alexandria is located east of Greenwich. This implies that the time there is ahead of that
at Greenwich. Therefore;2 hours + time at Greenwich2 hours +12:000 GMT =14:00 hrs (24 hour clock) or 2:00 p.m (12 hour clock)The time at Alexandra is 14:00 hrs (24-hour clock) or 2:00 p.m (12-hour clock) when it
is noon at Greenwich. Do this individually.
Determine the time of various places using the longitudes given.
(a) It is 2:00 pm at Greenwich, what is the time at Kinshasa which is located at 15° east?(b) It is 4:00 am at Greenwich; calculate the time at Mogadishu which is located at 45° east?The standard time and time zonesThe standard timeThis is the time recorded by all the countries found in the same geographical region. It is
a time that is agreed by all the countries in a given region. For example, Uganda, Tanzania and Kenya have the same time. Standard time is important for the following reasons:
(a) It helps in making schedules of transport systems.
(b) It helps in creating schedules of meetings.
(c) It gives a country a standard time that it is known for internationallyTime zones
A time zone is a region that observes a uniform standard time. This is important for legal, commercial, and social purposes. Time zones follow the boundaries of countries and their subdivisions. This is because it is convenient for areas close to each other to keep the same time.
Each time zone is 15 degrees of longitude wide (with local variations). The local time is one hour earlier than the zone immediately to the east on the map. There are 24 time zones in the world.The International Date LineAs earlier discussed, the longitudes are measured from 0° (Greenwich) to 180° east or 1800 west. International Date Line refers to an imaginary line of longitude on the earth’s surface. It is located at about 180 degrees east (or west) of the Greenwich Meridian. It marks the change from one calendar day to the next. At any moment, there are two days on earth with the same time. A new day begins at midnight on the International Date Line. If one travels across the International Date Line, the date would change either forward or backward.
At 12:00 a.m at Greenwich on Monday, it will be 12.00 a.m on Tuesday across the 180° east longitude. On the other hand, the time at 180° west would be 12:00 a.m on Sunday. In other words, time does not change; what changes is the date. When going to the east, one adjusts the clock by
adding 24 hours to the time. When going west, one adjusts the time by subtracting 24 hours to the time.The deflection of winds and ocean currents
The earth’s rotation from west to east results in winds and ocean currents changing direction. This change of direction is referred to as deflection.Ocean currents are streams of water flowing in a horizontal direction. They are usually associated with seas and oceans.Maximum deflection at pole Fig 3.50 Deflection of winds and ocean currents in the North and South Hemispheres.Winds and ocean currents change direction to the left in the Southern Hemisphere. They deflect to the right in the Northern Hemisphere.Variations in atmospheric pressure over the earth’s surface
When the earth rotates, it causes the air at the poles to move towards the equator. As this air crosses latitudes that are becoming wider, it spreads out over a larger area. It creates low pressure at latitudes 60° north and south.
Air moving from the equator towards the poles spreads over latitudes which are becoming shorter. As the surface area reduces, the air molecules contract hence having contact with each other. This builds high pressure at latitudes 30° north and south of the Equator. The earth rotates in an anticlockwise direction. It moves from west to east through 360° in 24 hours. In 1 hour, the earth covers 15°. To go through 1° it takes 4 minutes.The revolution of the moon round the earth
Do this in groups of three in the library. Use the Internet, encyclopedias and geography textbooks:
1. Find out why the position of the sun keeps changing as the day progresses.
2. Relate this to the rotation of the Earth on its axis.
3. Write down your findings.
4. Share your findings in a class discussion.The rotation of the Earth round the sun leads to the revolution of the moon round the earth. As the Earth rotates on its axis, it produces a centrifugal force which causes its satellite to move in a circular motion.
This leads to revolution of the moon around the Earth.The revolution of the earth around the sun 1. Take a globe and rotate it to fully cover 360° in a west to east direction.
2. Observe what happens.
3. Compare this to the revolution of the earth round the sun.Definition of revolutionRevolution refers to the motion of the earth on its orbit around the sun. The earth revolves round the sun from west to east.
The earth takes one year or 365 ¼ days to complete its revolution round the sun. This happens in a normal year. A leap year occurs once after four years where the earth takes 366 days to complete one revolution. The earth is inclined at an angle of 66½°.The consequences of the earth’s revolution
The earth’s revolution results in the following.
(a) The occurrence of the four seasons.
(b) Varying lengths of day and night.
(c) Changes in the position of the overhead sun. Fig 3.51 Earth’s revolution round the sun.The four seasons
 Do this in groups of four.
(a) Analyse and discuss the climate of Rwanda.
(b) Note down the rainy and dry periods.
(c) How many climatic seasons does Rwanda experience?
(d) If you lived in Europe, write down the seasons you are likely to experienceSeasons are climatic changes that occur in different zones of the earth. They occur due to temperature changes that result from the earth’s position as it revolves around the sun. The earth’s axis is tilted at an angle of 66½°.
This tilt brings about variations in the sunlight received at different latitude areas on earth. The revolution of the earth also brings variations in the sunlight received at different latitude areas. The seasons are mostly experienced in high and mid-latitude
regions of the world. They are:(a) Summer (c) Winter
(b) Autumn (d) Spring
On 21st March, the sun is overhead at the equator. This time is the start of the spring season in the Northern Hemisphere. During the same period, it is autumn season in the Southern Hemisphere.
On 21st June the sun is overhead at the tropic of cancer. This time is the start of summer in the Northern Hemisphere. During the same period, there is winter in the Southern Hemisphere.
On 22nd December, the sun is at the overhead position at the tropic of Capricorn.
This is summer time in the Southern Hemisphere and winter in the Northern Hemisphere.
On 21st March and 23rd September the sun is overhead at the equator. During this period,
days and nights are equal. This is called the equinox.The summer season is characterised by warm to hot temperatures because of the long durations of sunlight.
The winter season is characterised by cool to cold temperatures because nights are longer.
Spring and autumn are short seasons that mark the changes between winter and summer.
The order of seasons is such that autumn comes before winter and spring before summer.
The seasons determine the type of activities that take place at a given time. In winter for example, snow falls covering the ground making it frozen. People engage in indoor activities. Plants also remain dormant throughout winter. However, sports such as skiing and ice skating take place.Spring time comes immediately after winter. This is when temperatures begin to warm up springing everything back to life. Leaves sprout on trees, grass and flowers begin to grow and hibernating animals become active.
The summer season which follows spring is full of activities. Plants and animals become active. Fruits and grains mature and ripen for harvest before autumn sets in.
In autumn, plants begin to shed their leaves and animals begin to hibernate in preparation for winter.
These four seasons occur in the temperate zones. These are the regions between the
tropics and the Arctic and Antarctic circles.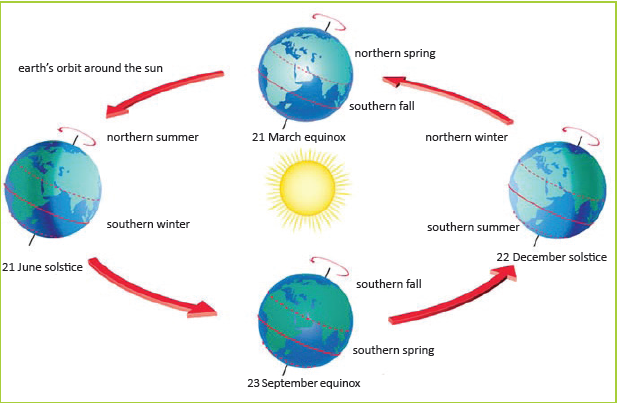 Fig 3.52 The four climatic seasons in the Northern and Southern Hemispheres.Table 3.2: Description of seasons
Season Description Winter • Very low temperatures
• Severe cold
• Land mostly covered by snow in some areasSpring • Occurs after winter
• Temperatures begin to increase leading to summer
conditionsSummer • A lot of sunshine
• High temperaturesAutumn or Fall • Occurs when summer is ending
• Temperatures start falling and decreasing towards very cold
conditions
Task 3.41. What is the meaning of the term season?
2. Name the seasons experienced in Europe.
3. On which date(s) is the sun overhead the equator?
4. Mention the date(s) when the sun is overhead at the Tropic of Cancer and Tropic of Capricorn.
5. Explain the meaning of equinox.The varying lengths of days and nightsThe earth’s revolution leads to differences in the lengths of days and nights. During summer, longer hours of sunshine are experienced. Longer hours of darkness are experienced during winter . This means that in summer there are more days of sunshine than darkness. It also means that in winter,
there are more days of darkness than days of sunshine.
For example, in December, hours of darkness increase in the Northern Hemisphere. At the same time in the Southern Hemisphere, hours of sunshine increase. As one goes beyond the Arctic circle 66° north, there are days of total darkness.Changes in the position of the overhead sun
The sun’s altitude is the height of the sun above its nearest horizon. The sun changes its altitude in relation to the earth’s revolution as seen in Figure 3.52.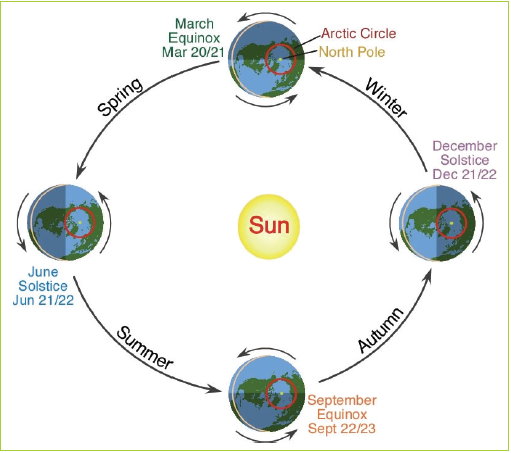 Fig 3.53 Changes in the position of the overhead sun.Task 3.51. List and explain the effects of the earth’s revolution round the sun.
2. Define the following terms:
(a) axis (b) tides.
3. What is the difference between standard time and time zone?
4. Give the meaning of International Date Line.
5. What are ocean currents?
6. Differentiate between the earth’s revolution and earth’s rotation.
7. State and examine the effects of the earth’s revolutionLatitudes and longitudes Do this in pairs.
You will require a globe or a ball, thread of different colours and a ruler.
1. Tie a red thread round the globe or ball. The thread should run vertically from the top to the bottom.
2. Make 24 other vertical runs of thread of different colours round the globe or ball. Ensure that the space between one thread and the next is equal. Use a ruler to obtain exact measurement. You can use sellotape or glue to ensure that the threads stick in place.3. Get a strand of the red thread that you had used before. Determine the centre of the ball or globe using the ruler. Tie the thread horizontally across the ball or globe.
4. Use threads of a different colours and pass them horizontally round the globe. Ensure that the spacing between one thread to the other is equal. Use the ruler to ensure this. You can use sellotape or glue to ensure that the threads stick in place.
5. Differentiate between the vertical and the horizontal threads.LatitudeA latitudes is the angular distance of a place north or south of the earth’s equator Latitudes range from 0° at the equator to 90° north or south at the poles. They are measured in degrees, minutes and seconds north or south of the equator. On a map, latitudes are drawn horizontally from west
to east. Lines of latitudes are referred to as parallels.Distance between lines
The distance on the earth’s surface for each degree of latitude or longitude is about 111 kilometres. This is achieved if you divide the circumference of the earth by 360°.
It is important to note that this distance reduces as you move towards the poles.This is the direction towards north or south of the equator.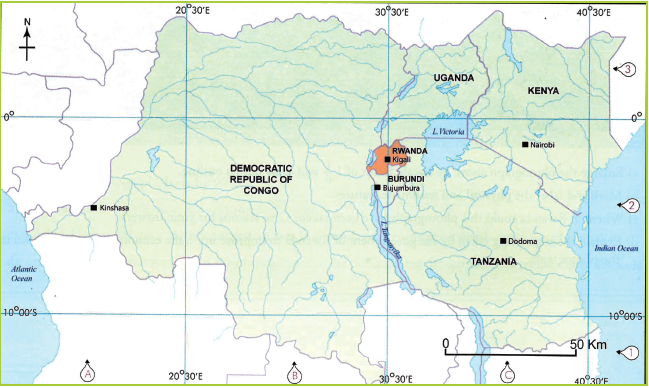 Fig 3.54 A map of the Great Lakes countries showing latitudes and longitudes.LongitudeA longitudes is the angular distance of a place east or west of the Greenwich Meridian. Longitudes are measured in degrees, minutes and seconds east or west of the Greenwich Meridian. They
are imaginary lines drawn on a map, from north to south. Lines of longitudes are also referred to as meridians. They help us to determine the time of a given place and locations of different places.
Latitudes and longitudes are used together on a map. They help in finding the exact locations of places and features easily. In Activity 3.33 on page 88, the vertical threads that you tied on the globe represent the longitudes. The red middle thread represents the Greenwich Meridian which
is a very important longitude.
The horizontal threads that you tied represent the latitudes. The red thread that you tied across the globe or ball represents the equator. The equator is a very important latitude. When reading the coordinates on a map, remember the following tips.
• Latitude is always given before longitude (49° N 100° E).
• Latitudes are parallel, but longitudes are not.
• Degrees west and south are sometimes referred to as negative degrees (–12° –23° is the same as 12°S 23°W).
• The latitude of a place affects its climate, but its longitude does not.• Key longitude lines are the Prime Meridian (0°) and the International Date Line (180°).
• Key latitude lines include the Equator (0°), Tropic of Cancer (23° 26’ N), Tropic of Capricorn (23° 26’ S), the Arctic Circle (66° 33’ N) and the Antarctic Circle (66° 33’ S). Use an atlas to do the following.
1. Distinguish between latitudes and longitudes.
2. Find the location of Kigali City on a map of Rwanda using latitudes and longitudes.
3. Determine the coordinates of the location where you were born on a map of Rwanda.
4. Find the location of Kigali City on a world map using latitudes and longitudes.
5. Present your work to your teacher.Earlier in this unit, you learnt that the rotation of the earth causes differences in time between longitudes. You learnt how to determine time using given longitudes. This is in relation to the Greenwich Meridian.
In this sub-topic, you will learn how to determine the longitudes of different places. This is done using time in relation to the Greenwich Meridian.
How to determine the longitude of a place using time
It is also possible to determine the longitude of a given place using time. Do this individually. Make reference to a globe, a map or an atlas.
1. Determine the longitude of Taipei in Taiwan whose local time is 8:00 p.m when the local time in London is 12 noon.
2. What is the longitude of Nairobi whose local time is 8:00 a.m, when it is 5:56 a.m in Accra?
3. Mr. Kamari took a flight from London at 12 noon to Honiara Island that is located at 159°E. What time did he arrive at Honiara?
4. It is noon at Manaus in Brazil which is situated at 60°W. What would be the
time in Dhaka located at 90°E?This is done in reference to the time at Greenwich and the specific area. Study the
example shown below.Example
Calculate the longitude of place X whose local time is 10:00 p.m when the local time
at Greenwich is 1:00 p.m.
Step 1:
Find the difference in time between two longitudes.
Time at Greenwich is 1:00 p.m.
Time at location X is 10:00 p.m
1:00 p. m - 10:00 p. m = 9 hours
Step 2:
For every hour, the earth rotates through 15°. Therefore, in 9 hours the earth will have
rotated through 15 × 9 =135°Step 3:
The time at Greenwich is behind that of location X. This means that location X is east
of Greenwich by 135°. Therefore location X is 135° east of Greenwich.Did you know?• A huge part of the universe is made up of things we cannot see.
• The solar system was formed approximately 4.6 billion years ago.
• The formation of the solar system was by the collapse of a giant cloud.
• 99.86% of the solar system’s mass is found in the sun.
• A person would weigh much less on the moon than on earth. 1. (a) What is the universe?
(b) List the components of the universe.
2. Using examples, distinguish between a constellation and a galaxy.
3. Describe the composition of the solar system.
4. List four characteristics of the moon.
5. (a) Name two earth movements.
(b) Discuss the consequences of the rotation of the earth.
(c) Discuss the consequences of the revolution of the Earth.
6. Distinguish between a latitude and a longitude.
7. With the use of well-labelled diagrams, describe the main types of eclipse.Planet Key features Mercury • It is the smallest planet.
• It is the nearest planet to the sun.
• It completes its revolution in 88 days.
• It is moonless.
• It is about 70 million kilometres from the sun when it is at its farthest.
When it is closest to the sun , it is at 47 million kilometres away.Venus • It is slightly smaller than planet earth.
• It is one of the brightest planets in the universe.
• It is almost similar to the earth.
• It is moonless.
• It is 108.9 million kilometres from the sun.
• It takes 225 days or 0.165 Earth years to complete its revolution
around the sun.Earth • It is the third planet from the sun.
• It is the only planet known to support life .
• It is 146 million kilometres from the sun.
• It has one moon.
• It takes 365 days to complete a revolution around the sun.Mars • It is slightly cooler than other planets.
• It is 228 million kilometres from the sun.
• It has 2 moons.
• It takes 686.971 Earth days to complete a revolution around the sun.Jupiter • It is the largest planet.
• It has 63 moons.
• It takes 12 Earth years to complete one revolution round the sun.
• It is 779 million kilometres from the sun.Saturn • It has a ring around it making it unique.
• It has 62 moons.
• It is 1.4 billion kilometres from the sun.
• It takes 29.4 Earth years to complete a revolution around the sun.Uranus • It is the 7th planet in the universe .
• It is the 8th 2.5 billion kilometres from the sun.
• It has 27 moons.
• It takes 84.3 years to complete a revolution around the sun.Neptune • It is the 8th planet from the sun.
• It is 4.5 billion kilometres from the sun.
• It has 13 moons.
• It takes 164.79 Earth years to complete a revolution around the sun.Unit 4: The structure of the earth

By the end of this unit, you must be able to describe the geographical structure of the earth.
Unit objectives
By the end of this unit, you must be able to:
(a) explain the external components of the earth
(b) describe the internal structure of the earth.The components of the earth

Do this in pairs. Study the picture below and answer the questions that follow
1. Mention the natural features that you can see in the picture.
2. Discuss the importance of the things that you have listed.3. What will happen to this neighborhood if the trees, grass and vegetation were all removed?
4. Suggest ways in which the people who live in this neighborhood can protect and conserve the environment.Figure 4.1 shows us that the earth is composed of solid materials. They include soil, rocks, vegetation and the air that surrounds us.
It is important to note that both living and non-living things constitute the
environment. They form part of what makes up the external structure of the earth. They are the things that we can see and touch.
The structure of the earth is made up of two components, namely the external and internal structures.The external structure is made up of:
• the atmosphere
• the hydrosphere
• the lithosphere
• the biosphere.
The internal structure is made of:
• the crust
• the mantle
• the core.External structure of the earth
(a) The atmosphere
The atmosphere is a thin layer of gases that surrounds the earth. It is held onto it by the force of gravity. It is a mixture of gases like nitrogen, oxygen, water vapour and carbon (IV) oxide. The earth’s atmosphere extends out to 10,000 kilometres. The atmosphere is important since it determines the climate.
The atmosphere has to be protected since it influences human activities and wellbeing(b) Hydrosphere
The hydrosphere is made up of water. It is all the water on the surface of the earth. 71% of the earth’s surface is covered by water. The oceans hold 96.5% of the earth’s water. The rest of the hydrosphere includes the fresh water found in the streams, rivers, lakes, glaciers, ice sheets, underground water and water vapour. Water moves from the oceans and seas to the atmosphere, then to the land and into the sea in a continuous process called the hydrological cycle. Water
bodies on earth play a role in maintaining our environment. Human activities such as agriculture and fishing depend on water found on the earth’s surface..
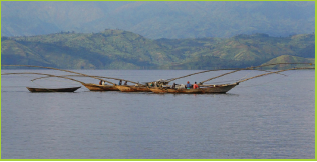
Fig 4.2 Fishing on Lake Kivu in Rwanda
(c) Biosphere
This is the biological component of earth’s systems. It includes all living organisms on earth, together with the dead organic matter that they produce. Living things are divided into plants and animals. The plants are referred to as flora and the animals as fauna.(d) Lithosphere
This is the solid, rocky crust that covers the entire planet. This crust is composed of minerals. It is inorganic. It is this part that supports plant life. It includes land or soils and rocks.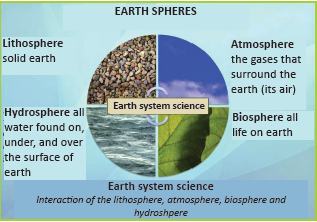
Fig 4.3 A summary of the external structure of the Earth

Do this in groups of three. Your teacher will take you to two different locations in the neighborhood of your school. One location has fertile soil, trees and vegetation. The second location has rocks and bare soil.
1. Observe the external components of the earth that can be observed in both locations.2. Record your observations of the two locations separately.
3. Present your findings on the description of the two locations to the class and discuss.
4. In a question and answer session, answer the following.
• State the factors that make the two locations different in their appearance.
• Explain what can be done to conserve the environment in the second location.
• Explain the importance of conserving the environment.
• Explain how plants and animals benefit from the first location.Task 4.1
1. Explain why it is important to conserve our environment.
2. Describe the composition of the external structure of the earth.
3. Explain how the earth’s external structure is important to humans.
Do this in pairs.
1. Discuss the importance of each of the components of the earth’s external structure.
2. Explain the importance of each component as observed in your home area.
3. Suggest ways in which each of the external components of the earth can be protected4. Show how plants and animals benefit from the hydrosphere, atmosphere and lithosphere.
5. Present your findings in class for discussion.Internal structure of the earth

Do this in groups of three. You will need an avocado fruit and a knife.
1. Cut the avocado into two using a knife.
2. Carefully study the parts of the cut avocado.
3. (a) How many layers can you see?
(b) Name them
4. Write down your findings.
5. Discuss them in a class presentation.Earth’s interior is made up of three parts:
the crust
the mantle
the core
Fig 4.4 The internal structure of the earth.
(a) The crust
This is the outermost layer of the earth’s structure. It measures about 30 kilometres at the continents and 5 kilometres under the oceans. 1% of the earth’s mass is made up of its crust. The crust rests on the mantle. It is divided into two sections, the sial and sima. These are the continental and oceanic crusts.The sial (continental crust)
This zone makes the outermost layer of the crust. It forms the continents and is composed of granitic rocks. It is dry and has a thickness of between 35 and 40 kilometres. This layer has huge
quantities of silica and aluminium minerals hence the name sial. The density of this layer averages about 2700 – 2800 kg/m3. The rocks found here are bright in colour. The sial is solid and firm.
It holds the biosphere.The sima (oceanic crust) This is the inner layer of the crust which forms the oceanic beds. It has an average thickness of between 7 to 10 kilometres. Sima derives its name from the component minerals silica and magnesium. Sima occurs beneath the sial. It is more dense than the sial with a density of about 2800 to 3300 kg/m3. The rocks are dark in colour.
The upper part of the sima consists of sediments deposited by rivers and sea waves. It also has volcanic lava derived from the eruption of volcanoes on the ocean beds. The lower layer is made up of basalt rocks. The rocks result from the spreading of lava on ocean beds. This layer is thicker
than the upper layer. The crust is separated from the mantle by a transitional zone called the Mohorovicic discontinuity. It is also referred to as the Moho discontinuity.This is a zone of sharpchange in rock density between the crust and the mantle. It is between 5 and 10 kilometres with an average of 8 kilometres beneath the ocean floor. It is about 20 to 90 kilometres with an average of 32 kilometres beneath the continents.(b) The mantle
This is the layer that is found below the crust. It is the largest part of the earth’s interior. It makes up about 84% of the earth’s volume.
The mantle is a silicate rocky shell with an average thickness of 2,886 kilometres. It extends inwards to a depth of about 2,900 kilometres. In the mantle, temperatures range between 500 and 900 °C at the upper boundary with the crust to over 4,000°C at its boundary with the core.
It is divided into two parts, namely the upper mantle and the lower mantle. The mantle is separated from the core by a zone of discontinuity. This zone is referred to as the Gutenberg discontinuity. It occurs at a depth of 2900 kilometres beneath the surface.(c) The core
This the innermost part of the earth’s interior. It is composed of iron and nickel. It extends from below the mantle to the earth’s centre, a depth of about 6,400 kilometres.
It is about 7,000 kilometres in diameter and 3,500 kilometres in radius. Temperatures in the core are about 6,000°C. The core is divided into two parts. They are the inner and the outer core.
Fig 4.5 An illustration of the earth’s structure

Do this in groups of three. Using images from the Internet:
1. Identify the parts that make up the internal structure of the earth.
2. Describe their characteristics.
3. Draw well-labelled diagrams to aid your explanation.Did you know?
• The average density of the earth as whole is about 5.51gms/cc.
• The total mass of the earth is about 5.9736 x 1024 kgs.
• The earth is mostly iron, oxygen and silicon.
• The earth’s molten iron core creates a magnetic field.
• The outer crust of the earth is broken up into regions known as tectonic plates.
1. (a) Name the components of the external structure of the earth.
(b) Describe the components of the external structure of the earth.
2. With the aid of a well-labelled diagram, name different parts of the earth’s structure.
3. Explain why the inner core of the earth is in a solid state.
4. Name the main minerals that form the following.
(a) Sial
(b) Sima.
5. Distinguish between the Mohorovicic and the Gutenberg discontinuities.UNIT5:Forms of relief

By the end of this unit, you must be able to determine the relationship between relief
and human activities.Unit objectives
By the end of this unit, you must be able to:
(a) identify different forms of relief features
(b) state the relationship between relief and human activities.Relief
Relief refers to the character of the land surface of the earth. It comprises a wide variety of landforms. These landforms are located between the lowest and the highest elevation points on the land surface. Relief is also known as terrain.
A relief map shows the topography of an area. Topography is the lay of the land, the relief of a region taken as a whole.
Do this in groups of three.
1. Go outside your classroom and observe the landscape of the area.
2. Describe the appearance of the landscape.3. Name the physical features that you have seen on the landscape.
4. Write them down in your notebook.
5. Present your findings in a class discussion.Slope, altitude and contours

Do this in groups of three. Your teacher will take you to an area around your school.
1. Keenly observe the relief of the area.
2. Describe the nature of the relief of the area.
3. Name the types of slopes accordingly.
4. Write down your findings.
5. Present your findings in a class presentation.Slope
Slope is the rise or fall of a relief feature. It is a measure of the degree of inclination of a feature in relation to the horizontal plane.
The angle of elevation determines the type of slope.
The following are four main types of slopes.
• Convex slope
• Concave slope• Steep slope
• Gentle slope
(a) Convex slope
This is a slope, or slope element, that gets progressively steeper downhill. It may be determined by structure. Convex slopes may result from weathering and transportation of debris.
Fig 5.1 A convex slope.
(b) Concave slope
This is a terrain feature that is rounded inward like the inside of a bowl. It goes from more steep to less steep. It declines in steepness with movement downslope. It is also known as a waning slope.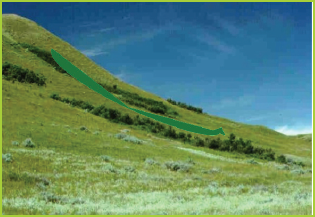
Fig 5.2 A concave slope.
(c) Steep slope
This is a relief feature that has an almost vertical slope or a relatively high gradient.
Fig 5.3 A steep slope.
(d) Gentle slope
This is a relief feature that is almost flat. Its elevation is flat when compared to the convex, concave and steep slopes.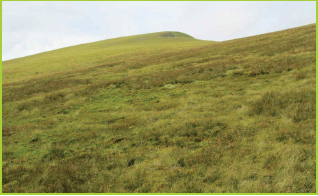
Fig 5.4 A gentle slope.
Altitude
This is the height or elevation of a point above a given reference point. In geography the reference level is the sea level. Sometimes, the ground level is used as the reference point. Altitude is expressed in feet or metres. Altitude is thus defined as the height above the sea level. Relief features are found at different altitudes.Contours
A contour is a line connecting points of the same altitude on a topographic map. Contours show the type of relief on the earth’s surface.
A landscape that is nearly flat is shown by contours that are far apart. On the other hand, contours that are close together indicate a steep slope.


Fig 5.6 A topographic map with physical features marked by contours.

Study the topographic map extract below.
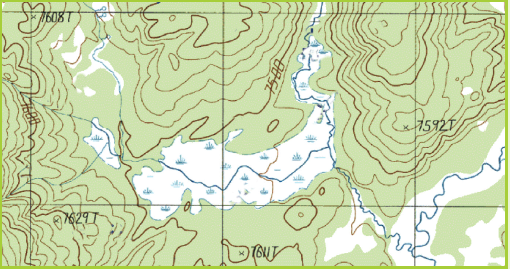
Fig 5.7
1. Describe the nature of the slopes in the landscape shown by the map.
2. Which side of the landscape has the highest altitude?
3. Write down your findings and present them in a class discussion.Forms of relief
Relief forms are classified into two main categories. These are continental and marine relief features.
Continental relief features
These are landforms that are found on the earth’s surface. The relief features of continents are varied. Some of the relief features are caused by the internal forces of the earth. These forces include tectonic plate movements, earthquakes and vulcanicity. Other features are caused
by external agents including wind, rain, temperatures, rivers, groundwater, ice and human activities.
The internal forces are responsible for the elevation of topography. The external agents cause erosion and modification of the earth’s relief.The main forms of continental relief include the following.
(a) Mountain A mountain is a large landform that rises above the area surrounding it. It usually
has a peak. Mountains are formed through tectonic forces or volcanism. Mountains may appear as a single landmass or in a chain called a range. Mountains erode slowly through the action of rivers, weather conditions and glaciers.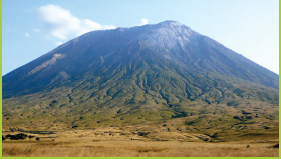
Fig 5.8 Mt Kilimanjaro.
An elevation is referred to as a mountain when it is 600 metres and beyond above sea level.
(b) Hill
A hill is a landform that extends above the surrounding terrain. It is however smaller than a mountain.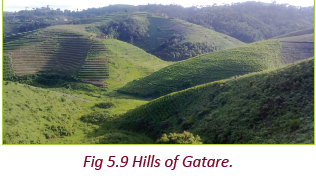
(c) Plain
A plain is an extensive tract of flat land or a gently undulating terrain. There are no prominent hills or depressions.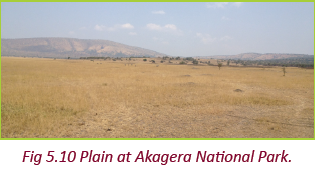
(d) Plateau
A plateau is an elevated tract of relatively flat land with a steep slope falling abruptly to a lower land on one or either sides. A plateau is higher than a plain.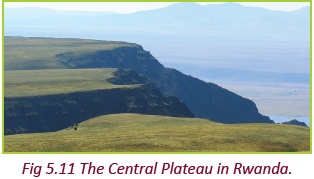
(e) Valley
A valley is a sunken land or depression surrounded by mountains or ridges. Rivers may flow along the valleys.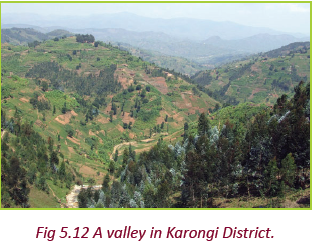
(f) Ridge
A ridge is a linear, steep-sided upland. It is a relief feature that consists of a chain of mountains or hills. These mountains or hills form a continuous elevated crest for some distance. Ridges are usually referred to as hills or mountains depending on their size.
Work in groups of three.
1. Go outside your classroom.
2. Observe the landscape in the surrounding area.
3. Name and list the landforms that you can see.
4. Identify the characteristics of the landforms you have identified.
5. Discuss the importance of the relief features you have identified to the area.
6. Discuss your findings in a class presentationMarine relief features
These are landforms that are found on the oceanic crust. The oceanic crust is bordered by a coast. A coast is a broad area of land that borders the sea. It has a variety of landforms. They include beaches, gulfs, cliffs and capes.
The main relief features of the ocean bed include the following.(a) Continental shelf
The continental shelf is an underwater landmass. It extends from a continent and results in an area of relatively shallow water.
This area is known as a shelf sea. Most of the shelves were exposed during glacial periods. The width of the continental shelf varies. It is wide in Japan, Canada and U.S.A but narrow in Africa.
The continental shelf allows sunlight to penetrate to the sea bed. This encourages the growth of planktons. Continental shelves are rich fishing grounds. This is due to the availability of planktons which are food for fish.
Fig 5.13 Continental shelf.
(b) Continental slope
This is a steep slope that extends from the edge of the continental shelf to the deep sea plain. A continental slope is typically about 20 kilometres wide. It consists of mud and silt, and is often cross cut by submarine canyons.
Fig 5.14 Continental slope.
(c) Oceanic ridge
This is a continuous submarine mountain chain extending approximately 80,000 kilometres through all the world’s oceans. It is formed from magma that rises from the mantle to occupy spaces formed as the sima rocks drift away from each other.
An example of an oceanic ridge is the Mid-Atlantic Ridge in the Atlantic ocean.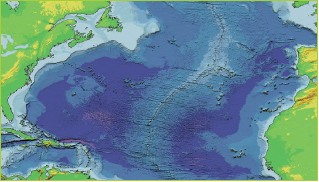
Fig 5.15 Satelite image of the Mid-Atlantic Ridge.
(d) Oceanic trench
This is a long narrow steep-sided depression in the Earth’s oceanic crust. It is the deepest part of the ocean floor. Examples of oceanic trenches are the Mariana and Atacama trenches. They are located to the West and East of the Pacific Ocean respectively. The Mariana Trench is about 10,994 metres deep. It is the deepest part of the world’s oceans. The Atacama Trench is about 8,065 metres deep.
Fig 5.18 An oceanic island in the South Pacific
Task 5.1
1. (a) Define continental relief features.
(b) Name two ways by which continental relief features are formed.
(c) Name three continental relief features found in Rwanda.
2. (a) What are oceanic relief features?
(b) Name three examples of oceanic relief features.Relationship between relief and human activities

Your teacher will take you on a field visit.
1. Observe the relief features present in the area.
2. Find out from a resource person or the people how the features influence their day to day activities. Ask for both the positive and negative influences.
3. Recommend activities that are friendly to the forms of relief found in the area.4. Note down the points in your notebook.
5. Discuss your findings in a class presentationsThe relief features in an area determine the human activities carried out in a place. The main activities that are influenced by relief features include transport, agriculture and settlement.
(a) Effects of relief on transport
(i) Type of relief in an area influences the establishment of transport and communication networks. Roads, railway lines and airports are mainly constructed on relatively level ground. This is because level ground is convenient and easy to break during construction of transport networks.(ii) Landscapes that are highly dissected have transport routes constructed along the valleys. This is because valleys are relatively gentle and easy to construct transport infrastructure on.
(iii) Roads constructed on steep slopes will ascend in a zigzag manner. This is done to reduce the gradient.
(iv) Wide river channels on relatively level land are suitable for navigation.
(v) Plains allow for the expansion of infrastructure. This is because they have even surfaces. Such a surface favours the building of roads and airports and laying of railway lines.
(b) Effects of relief on settlements
The type of relief in an area influences the distribution of settlements.(i) Gently sloping areas are suitable for agriculture. This is due to the deep soils hence attracting settlements. The landscape is also suitable for construction of houses.
(ii) Steep slopes have few settlements because it is difficult to construct houses on them. The soils on such slopes are thin and discourage farming.
(iii) Very flat areas that are covered with marshes and swamps have no settlements. This is because they are unsuitable for construction of houses.
They are prone to flooding and disease-causing insects such as mosquitoes.(iv) As much as 80% of the world’s population lives on plains.
(c) Effects of relief on agriculture

Do this in groups of three. Your teacher will provide you with a topographic map of Rwanda.
1. Identify the relief features on the map.
2. Find out the human activities that take place in the areas with the relief features.
3. Relate the features to the human activities that take place in the various areas.
4. Suggest human activities that you think are friendly to the forms of relief identified.5. Write your findings in your notebooks.
6. Discuss the findings in a class presentation.
7. Engage other group members in a question and answer session on their findings.(i) Gently sloping or undulating landscape encourage farming activities. This is due to the presence of deep, well-drained soils.
(ii) Very steep slopes discourage farming because of the thin soils.
(iii) Very high altitude discourages farming and settlement because of extremely low temperatures. The moisture in the soil is frozen and therefore unavailable for plant growth.
(iv) Highlands that experience lower temperatures and high rainfall have adequate pasture. Dairy farming is common in such areas.
(v) The suitable climate and fertile soils of the plateaus are helpful for animal - rearing and agriculture.
(vi)Perennial rivers arising mountains are important sources of water. They help in promoting the irrigation and provide water for many other uses.
(vii) The rivers from the high mountains carry silt along with water to the lower valleys. This helps in the formation of fertile plains for agriculture.
(viii) Plateaus have large grassland areas that are suitable for rearing sheep, goat and cattle. They provide a variety of products such as wool, milk, meat and hides and skin.
(ix) The lava plateaus are preferred for agriculture since their soils are very fertile.
(x) Plains generally have deep and fertile soils. Since the plains are flat it is easy to practise irrigation. These factors have made the plains agriculturally important. They are often called ‘food
baskets of the world’.(xi) The rich agricultural resources of alluvial plains have helped in the growth of agro- based industries. This has given employment to millions of people. It has also registered a marked
increase in the national production and per capita income. Since the plains are heavily populated, plenty of labour is available for the intensive cultivation. The population also supplies the work force needed for industries.(d) Effect of relief on other human activities
(i) Mountainous areas are usually forested areas. The presence of forests in such areas encourages lumbering which is an important economic activity.
(ii) Plateaus are useful because of the presence and easier way of extracting minerals. They also favour generation of hydropower.
(iii) Large resources of minerals are usually found in mountains. This encourages mining activities.
(v) Hydroelectricity is generated from the waters of perennial rivers in the mountain regions.
(vi) The pleasant climate and the beautiful scenery of the mountains have led to their development as centres of tourist attraction. The tourist and hotel industries get an additional encouragement in such regions.
An example is found at the Virunga Mountains of Rwanda.(vii) Most of the minerals in the world are found in the plateaus. For example tin and wolfram are found in the central plateau of Rwanda.
(viii) Rivers falling down the edges of plateaus form waterfalls. These waterfalls provide ideal sites for generating hydroelectric power. They are also good tourist attraction sites.
(ix) The easy means of transport on plains favour the growth of agriculture and industries. This has results in the expansion of cities and towns.
The most developed trade-centres and ports of the world are found in the plains. They include Rome, Tokyo, Calcutta, Yangoon (Rangoon), Varanasi, Paris and other famous cities are situated in the plains.(x) The plains have been the centres of many modern and ancient civilisations.
The major river valley civilisations of the world have flourished in them.Hence, they are referred to as the cradles of civilisation.
Do this in groups of three.
1. Use an atlas to identify the relief features in various parts of the world.
2. Find out the dominant human activities in the areas with the relief features.3. Relate the features to the human activities.
4. Write down four findings in your notebooks.
5. Discuss them with other members of your class.Did you know?
• Some of the highest mountains are at the bottom of the sea.
• The largest range of mountains is in the Atlantic Ocean.
• The deepest parts of the sea are found close to the margins of continents.
• The abyssal plain is among the flattest portions of the earth’s crust.
• Plateaus also form in the ocean.
1. (a) Define relief.
(b) Identify forms of relief.
2. Name the relief features found in Rwanda.
3. Differentiate between slope, altitude and contours.
4. Discuss the importance of the relief features of Rwanda to the country.
5. Explain how the relief features of Rwanda influence human activities in the country.
6. Suggest four ways through which Rwandans can preserve the relief features in the country.UNIT6: Rocks

By the end of this unit, you must be able to differentiate among types of rocks and their
economic uses.The unit objectives
By the end of this unit, you must be able to:
(a) define rocks
(b) state the types and characteristics of rocks
(c) outline the importance of rocks.Definition of rocks

Do this in groups of four.
1. Go outside your classroom and collect different types of stones.
2. Observe the stones you have collected.
3. Describe their shape, colour and texture.
4. Write your findings in your notebooks.
5. Share your findings with other class members in a class discussion.A rock is a naturally occurring solid made up of one or more minerals. Rocks form the solid part of the earth’s crust. A mineral is a natural inorganic substance possessing a definite chemical composition. Minerals are found below the earth’s surface. The scientific study of rocks is called petrology.
Types and characteristics of rocks

Individually, study the photograph below and answer the questions that follow.
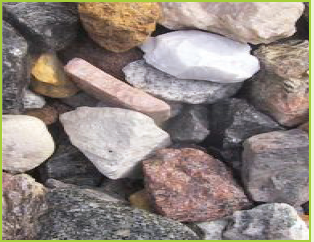
Fig 6.1
1. Are the rocks shown on the photograph similar?
2. If your answer is no, identify the differences seen in the rocks.
3. Why do you think the rocks are different?There are different types of rocks. Rocks are classified based on three main characteristics.
(a) chemical composition - mineral composition
(b) physical properties such as permeability, texture and the size of the mineral particles
(c) mode of formation.
Based on the above characteristics, there are three main types of rocks. They are igneous, sedimentary and metamorphic rocks.Igneous rocks

Do this in pairs.
Study the photograph below and use it to answer the questions that follow.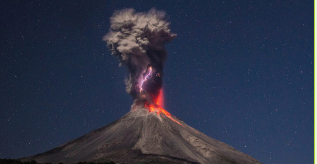
Fig 6.2
1. Tell your friend what you can see in the photograph.
2. Suppose you were staying in this area, which type of rock would you see?
3. What happens when the hot magma cools down?
4. Name the type of rocks found when the magma cools from within the earth’s crust.
5. Discuss your answers in class.Igneous rocks are formed from the cooling and solidification of magma or lava. Rocks in the interior of the Earth are in a molten form. This is due to very high temperatures and pressure. Magma is forced out of the interior of the earth through cracks in the earth’s crust. The cracks through which
magma passes are also referred to as fissures or vents. The magma then cools and solidifies into hard rock. These rocks are called igneous rocks.When magma that is on the earth’s crust cools, it forms rock crystals. Magma that cools slowly forms large crystals while magma that cools quickly forms small crystals.
The chemical composition of igneous rocks varies. This variation depends on the proportion of silica and basic oxides. There are four classes of igneous rocks based on their chemical composition. They are acidic, basic, intermediate and ultrabasic igneous rocks. Table 6.1 below shows the chemical composition of the different classes of igneous rocks.Table 6.1 Chemical composition of igneous rocks
Type of rock % silica % basic oxides Acidic >65 35 Intermediate 55 – 65 35 - 45 Basic 455 – 55 45 - 65 Ultrabasic <45 >55
There are two types of igneous rocks. They are intrusive and extrusive igneous rocks.Intrusive igneous rocks
The word igneous comes from a Latin word that means fire. This is related to the melting process that forms these rocks. These are also known as plutonic rocks. They form from magma that cools and solidifies inside the earth’s crust. The magma cools and solidifies slowly leading to the formation of large crystals. Landforms of intrusive igneous rocks are sometimes seen on the
surface of the earth. This happens when the overlying rocks of the earth’s crust are removed by erosion.Examples of intrusive igneous rocks includes diorite, granite, gabbro, syenite and peridotite.
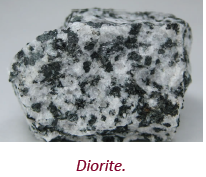
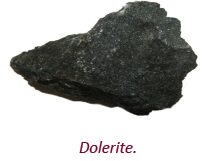


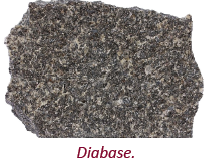
Fig 6.3 Igneous rocks.
Rocks that cool and solidify near the surface of the earth are known as hypabyssal rocks. Since they form at shallow depth, the rate of cooling is moderate. As a result, medium sized crystals are formed. Examples of hypabyssal rocks are porphyry, dolerite, porphyrite, diabase, lamprophyre and
granophyre.Extrusive igneous rocks
These rocks are also known as volcanic rocks. They form from lava that cools and solidifies on the earth’s surface. The lava cools and solidifies rapidly leading to the formation of small crystals.
There are two types of extrusive igneous rocks formed by lava flows and volcanic ejecta.(a) Extrusive igneous rocks formed by lava flows
During volcanic eruptions, lava is ejected onto the earth’s surface. The lava flows for a long distance on the earth’s surface.
This happens before it cools and solidifies to form extrusive igneous rocks. Examples of extrusive igneous rocks include basalt and obsidian.(b) Extrusive igneous rocks formed by volcanic ejecta
During volcanic eruptions, solid ash and semi-liquid materials are ejected out of the earth’s crust. This happens with great force.
The materials are pushed high up into the atmosphere. They then cool and solidify as they fall back onto the earth’s surface.
They form extrusive igneous rocks of various sizes and shapes. Volcanic ash and dust settle on the earth’s surface. They are compressed and hardened over a long period of time to form a rock called tuff.Figure 6.4 shows examples of extrusive rocks.
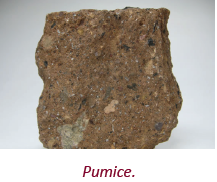
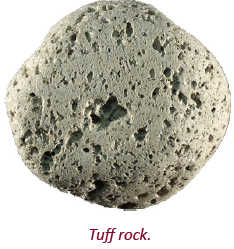
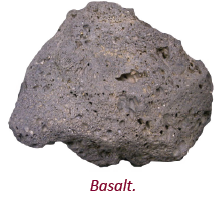
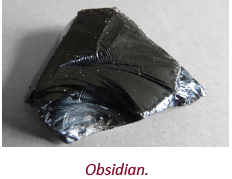
Fig 6.4 Extrusive igneous rocks.
Sedimentary rocks

Do this in pairs.
Use the Internet and geographical documents.
1. Define sedimentary rocks.
2. Research on the formation of sedimentary rocks.
3. Identify three examples of sedimentary rocks.
4. Name some of the places where sedimentary rocks are found.
5. Discuss your finding in class.Sedimentary rocks are formed by the deposition of materials on the earth’s surface and on the beds of water bodies.
They are formed through the process of sedimentation. Sedimentation is the process that causes mineral and other organic particles to settle and accumulate.
It also causes minerals to precipitate from a solution.The sediments that form sedimentary rocks are derived from the pre-existing rocks through weathering and erosion. The sediments are transported and deposited in layers by wind, water or moving ice.
After a long period of time, the sediments are compacted to become hard rocks.
This is due to pressure from the overlying sediments and other materials.Sedimentary rocks are classified according to their mode of formation and appearance.
The classifications are:
(a) mechanically formed sedimentary rocks.(b) organically formed sedimentary rocks
(c) chemically formed sedimentary rocks.
(a) Mechanically formed sedimentary rocks
These rocks are formed when eroded rock materials are transported by agents of erosion. They are then deposited in layers either on land or in the sea. The rock materials are derived from pre existing rocks such as igneous or metamorphic rocks.
The rock particles are consolidated and hardened into hard rocks by pressure from overlying layers. Examples of mechanically formed sedimentary rocks include the following.
(i) Sandstone and gritstone – composed of rock particles, mainly sand.
(ii) Conglomerate, breccia and boulder clay – composed of rock particles larger than 2mm in diameter.
(iii) Claystone, siltstone, shale, loess, mudstone – composed of very small rock particles.

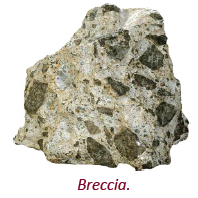
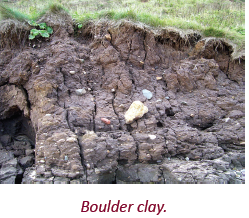


Fig 6.5 Mechanically formed sedimentary rocks.
(b) Organically formed sedimentary rocks
These rocks are formed from the remains of organic materials. They are formed when the remains of plants and animals accumulate over time. They accumulate in layers on land or in the sea. Other materials accumulate over these organic remains. The weight of overlying materials exerts pressure on the organic materials. Eventually, they are consolidated and hardened to form rocks.
Organically formed sedimentary rocks are classified based on their composition and mode of formation. Table 6.2 below summarises their classification.
Table 6.2 Classification of organically formed sedimentary rocks.
Classification Examples of rocks Composition Calcareous Limestone, chalk, coral reef Skeletons of tiny marine creatures e.g. coral polyps. Ferruginous Iron stone Hydrated iron oxide. Siliceous Diatomite Remains of diatoms rich in silica. Carbonaceous Coral (lignite coal, bituminous coal, brown coal, anthracite coal Remains of plants. 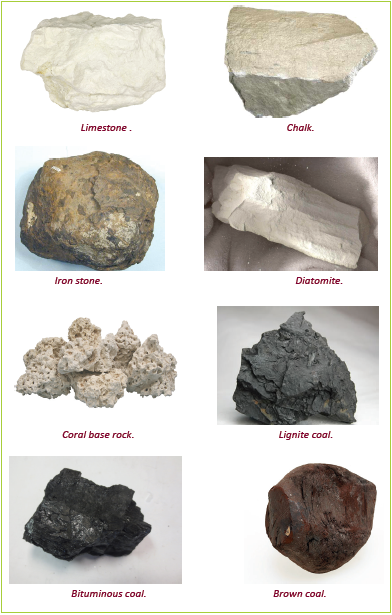

Fig 6.6 Organically formed sedimentary rocks.
Chemically formed sedimentary rocks
These rocks are formed when minerals are precipitated. They are also formed when solutions of salt evaporate and particles accumulate in layers. Soluble minerals such as salts, lime and other chemicals result from complicated chemical processes. They are then deposited on the lakes or ocean beds. High evaporation in areas with low rainfall also results in accumulation of salts.
The salts accumulate on the lake beds.The mineral salts accumulate in layers over long periods of time. The overlaying layers exert pressure on the lower layers. The mineral particles are eventually consolidated and hardened into rocks.
Chemically formed sedimentary rocks are classified based on their mineral compositionTable 6.3 Classification of chemically formed sedimentary rocks.
Classification Examples of rocks Composition Carbonates Travertine, trona, dolomite Calcium carbonate compounds Sulphates Gypsum Calcium sulphate Chlorides Rock salt Sodium chloride Silicates Flint Silica Iron stones Limonite, hematite Iron oxides 
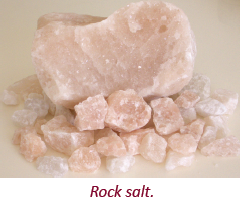
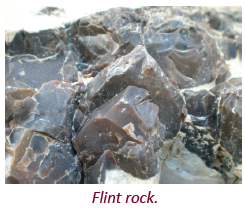
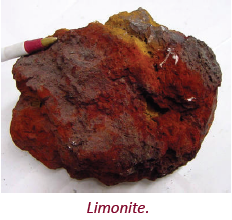
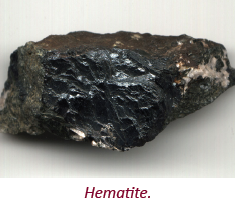
Fig 6.7 Chemically formed sedimentary rocks.
(c) Metamorphic rocks

Do this in pairs.
Make use of the Internet and geographical documents.
1. Define metamorphic rocks.
2. Research on their formation.
3. Get some clay and mix it with some water. Mould a small ball out of it. Put the clay ball in fire and observe what happens.
4. Discuss your finding and observations in classThese rocks are formed when pre-existing rocks are subjected to great heat or pressure.
Sometimes the rocks are subjected to both heat and pressure.
The pre-existing rocks are either igneous or sedimentary. The process of metamorphism leads to physical or chemical changes in the original rocks.Table 6.4 Types of metamorphic rocks.

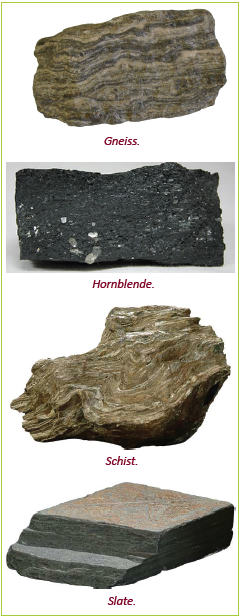


Work in groups of three. Use the Internet, geography textbooks and journals for your research.
1. Find out the characteristics of each of the types of rocks that you have studied in class.
2. Note down your findings in a notebook.3. Discuss your findings within your groups.
4. Choose a leader to present your findings in a class discussion
5. Compare your findings with those of other groups
6. Write notes on the characteristics of the different rock types.

Work in groups of three.
1. Your teacher will take you to a field near your school.2. Collect rock samples that fit the characteristics that you found out.
3. Take them to class.
4. Touch and feel them with your hands.
5. Classify the rocks according to their types by observing their characteristics.
6. Make a class presentation on your findings.
7. Ask your classmates questions on the characteristics of rocks they have collected.
Characteristics of rocks
(a) Rock colour
The colour of rocks gives a hint about its mineral composition. For example, gold is yellow and copper is reddish brown. The individual minerals that form these rocks have the same colour as the rocks.(b) Rock texture and grain size This refers to the size of the individual grains that form the rocks. Rocks with very small grains have a very fine texture. Others are either medium or coarse grained.
(c) Rock structure
This refers to the arrangement of the minerals that form the rocks. Minerals have different shapes which determine the nature of rock formation. For example, quartzite crystals are hexagonal in shape and fluorite crystals are cube shaped.
Non-crystalline rocks like sedimentary rocks have a compact appearance. This is because they are made up of dense and solid minerals.
Granular rocks are made up of grain-like minerals as seen in sandstone.(d) Mineral composition of rocks
This refers to the chemical composition of the minerals that form a rock. It determines the origin of the rock. The original materials of volcanic rocks are identified as basic or acidic. Those with high silica content are acidic while those that contain little silica are basic. Sedimentary rocks have a
chemical composition similar to the rocks from which they are derived. The chemical composition of a rock can be determined through laboratory tests.(e) Rock hardness
This is the level of resistance of a rock to being broken or scratched. Rock hardness gives a clue to how a rock may have been formed. Generally, metamorphic rocks are more resistant than sedimentary rocks.
The hardness or resistance of a rock may be tested through different ways. They include scratching the rock with a fingernail, another rock, a knife or hitting using a hammer.(f) Rock density
This refers to the weight of rocks. This can be determined by weighing the rock, tossing it or placing it in water. A heavy rock will sink in water and settle at the bottom of a container. A light rock of the same mass may float on water. For example, pumice rock will float on water while a granite rock will sink.
Rocks which form oceanic beds are heavier than those that form the continental crust.(g) Mineral luster
Lustre refers to the brightness of rocks. The brightness is determined by the way light is reflected from the rock surface. There are two types of luster, metallic and nonmetallic.
Minerals with a metallic luster shine like metal. Examples of such minerals include gold, silver and lead.
This refers to the way a rock mineral breaks. Some rocks have a uniform cleavage. These ones break in one direction forming thin sheets. An example of this is mica. Other rocks break into irregular shapes as is the case with granites.(i) Taste and odour
Rocks can either be porous or impervious. Porous rocks have pore spaces which allow water to pass through them. Hence such rocks are permeable.
Impermeable rocks do not allow water to pass through them. This is because they have very tiny pore spaces. Clay is impermeable despite the fact that it is porous. Its pore spaces allow water to
collect and remain within.(i) Rock solubility
Some rocks such as limestone, chalk and trona easily dissolve in water.Task 6.1
Discuss the distinguishing characteristics of the following.
(a) Igneous rocks.(b) Sedimentary rocks.
(c) Metamorphic rocks.
The importance of rocks

Do this individually.
Read the passage below and answer the questions that follow.Hirwa and his younger sister Muteteli were excited that they were closing school. They were to begin their long vacation. On their way home from school, they saw a road under construction. Beside the road was a quarry where stones were being dug out.
The stones were rectangular in shape. They were being loaded onto trucks that were on standby. Some rocks were being put into a large machine to crush them into smaller pieces.
When they reached home, their father was waiting to take them to town for shopping.
On their way, they saw a group of tourists taking photographs. They were standing around a rock that had a round top and narrow base.After they passed the river, they saw some goats and cows licking some rocks. Their father told them that the rock contained salt.
As they neared town, they saw some buildings that were under construction.
Hirwa and his sister saw a blue lorry that they had seen at the quarry. The lorry was parked next to one of the buildings that was under construction. Some young men were offloading the rectangular blocks from the lorry. There was another lorry that was full of bags of cement. Muteteli asked his father where the cement was from. Their father told them that the cement was from a factory. He also told them that it was made by crushing limestone into powder. They then continued with their journey to the city of Kigali.
(a) From the above story, give some of the uses of the rocks that Hirwa and Muteteli saw.
(b) Apart from the uses identified in the story above, state other uses of rocks.Rocks are of great significance to any country.
(a) Some rocks provide raw materials for industries leading to industrialisation. Coral limestone is used in the manufacture of cement. Cement is also exported and this earns the country foreign exchange. Rock chalk is used to produce chalk which is used on chalkboards. Diatomite is a
filtering agent in food industries.(b) Some rocks such as trachyte and limestone are extracted to provide building and construction materials. Phonolite, sandstone and flint are also used for building. Gabbro and granite can be crashed to provide road chippings. Marble and gneiss are used to decorate buildings. Slate can be split into thin sheets for roofing. Loess can be cut into blocks used for building. Clay provides the
raw materials for brick making and pottery. Kaolin which is a type of clay is used in the manufacturing of ceramics and porcelain.(c) Some rocks contain valuable minerals.
They are mined and exported to earn foreign exchange. Minerals include gold, diamonds, copper, silver and tin. Other rocks are sources of gemstones which are used to produce ornaments.(d) Some rocks are extracted and used in art in the making of carvings. These carvings are sold to earn income. An example of such rocks is soap stones.
(e) Some rocks such as coal are a source of energy.
(f) Some rocks such as rock salt is used as a healthy substitute of common salt. This is because it is rich in minerals.
(g) Some rocks when weathered produce fertile soils which are suitable for agriculture. Limestone when ground produces lime which can be added to soils to improve them. Phosphates are used as fertilisers.
(i) Some rocks store underground water. The water can be extracted and used for domestic, industrial or agricultural purposes.

Do this in groups of three.
Your teacher will take you for a field visit to a quarry.
1. Observe how the rocks are extracted.
2. Find out how they are used.
3. Find out their importance to the people who use them and to the people who extract them.
4 Observe and point out how some of the rocks have been used within your school compound.
5. Write your observations and findings in your notebooks.
6. Once you are back to school, present your findings in a class discussion.Did you know?
• The earth’s crust is made up of rock.
• Ninety-five percent of the earth’s crust is made up of igneous rocks.
• Sedimentary rocks are extremely important resources that give us clues about the earth’s past.
• Metamorphic rocks are so called because they always begin as another type of rock.
• Rocks have been used by humans for millions of years.
1. Define a rock.
2. (a) Give the characteristics of igneous rocks.
(b) Give three examples of intrusive igneous rocks.
(c) Describe how extrusive igneous rocks are formed.
3. Explain how sedimentary rocks are formed.
4. (a) Classify sedimentary rocks based on their mode of formation and composition. Give examples of rocks in each class.
(b) Give the characteristics of sedimentary rocks.
5. (a) What are metamorphic rocks?
(b) Describe three ways in which metamorphic rocks are formed.
(c) Give four original rocks to match the metamorphic rocks that result after metamorphism.
6. Using specific examples, describe the importance of rocks to the economy of Rwanda.
UNIT 7:Soils

By the end of this unit, you must be able to determine the relationship between different types of soils and human activities.
Unit objectives
By the end of this unit, you must be able to:
(a) define soils
(b) state factors responsible for soil formation
(c) identify soil properties and constituents
(d) identify types of soils
(e) state the importance of soils
(f) outline the effects of soils on human activities.Definition of soil

Work in groups of four.
1. Go outside your classroom.
2. Collect soils from different parts of the school compound.
3. Observe and describe the soil samples collected.
4. In your own words attempt to give a definition of soil.Soil refers to the top layer of the earth’s surface on which plants grow. Soil consists of rock and mineral particles mixed with decaying organic matter, water and air.
Soil can also be described as a naturally occurring thin layer of loose materials. The loose materials overlie crustal rocks. Soils are important for the existence of many forms of life on earth.Soil formation processes
(a) Weathering of rocks
Work in pairs.
Study the photographs in Figure 7.1 and answer the questions that follow.

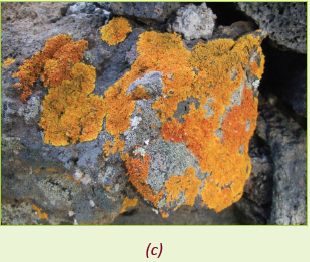
Fig 7.1
1. Describe what you can see in each picture.
2. Identify the weather conditions that lead to the condition observed in pictures (a) and (c).
3. Give the importance of the process that is taking place in picture (a).
4. Why do you think there are different colours on picture (c)?Weathering is the process through which the rocks of the earth’s crust are broken down. They are broken into smaller particles through mechanical or chemical processes hence forming soils.
(b) Leaching
This is the process by which water removes minerals and other soluble constituents from the soil.
The minerals are usually removed from the upper to the lower horizons of soil. This happens when the water percolates into the soil.(c) Eluviation
This is the process that involves the washing through of solid materials from the upper soil horizons as a result of leaching. This process encourages the formation of different soil horizons.
(d) Illuviation
This process follows eluviation. It involves the accumulation of materials into the lower
layers of the soil.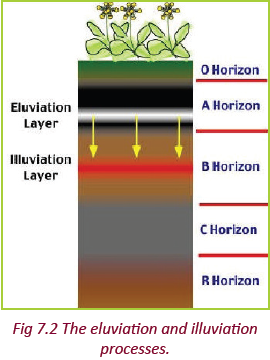
(e) Salinisation
It is a process by which water soluble salts accumulate in the soil. This accumulation is caused by high rates of evaporation on the earth’s surface.
The salts in the lower horizons are carried upwards towards the surface by capillary action.
This process occurs in areas with high temperatures and low rainfall such as the deserts.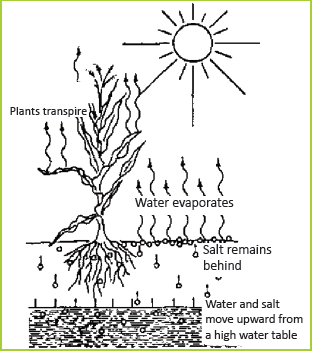
Fig 7.3 Salinisation process.
(f) Podzolisation
This process involves the decomposition of vegetative matter that results in the formation of humic acids. Minerals like calcium, iron, magnesium, aluminium, salts and bases and carbonates are dissolved from one horizon to another. This leads to the formation of acidic soils. This process
occurs in the cool temperatures.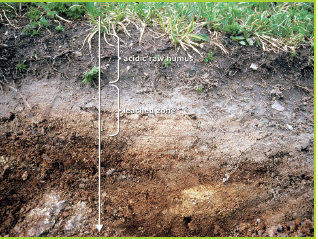
Fig 7.4 Soil that has undergone podzolisation.
(g) Calcification
The dissolved calcium carbonate is then carried downwards to horizon B where it is deposited.
This process occurs in dry climates. Calcium carbonate is dissolved in horizon A during the periods of rainfall or snowmelt.
Fig 7.5 Soil that has undergone calcification.
This process occurs in warm humid climates. During the wet season, mineral salts in horizon A dissolve in rain water. The minerals that dissolve are mainly silica and the bases. The dissolved minerals percolate downwards to the lower layer. Insoluble minerals such as iron and aluminium
accumulate in the top layer. They form a crust of laterite. The top layer is reddish in colour.(i) Humification
When plants and animals die, their remains decompose in the soil. This decomposition is aided by the micro-organisms that are found within the soils. The decomposed organic matter form humus. The humus mixes with the soils to form fertile layers of soil as shown in Figure 7.5.
Fig 7.6 Transformation of organic matter into humus.Task 7.1
1. Define leaching.
2. Give the conditions that make it possible for leaching to occur.
3. Using specific examples, explain the effects of leaching in the soil.
Do this in groups of three.
Use the Internet, geography textbooks and journals.
1. Find out other soil formation processes.
2. Discuss the processes with the help of well labelled diagrams.3. Make notes on your findings.
4. Present your findings in a class presentation for input from other class members.Factors influencing soil formation
Soils are formed through the interaction of five major factors. These are parent rock, climate, topography (also referred to as relief) time and living organisms.
(a) Parent rock
This refers to the original material that forms the rock that weathers into soils.
The parent rock determines the chemical and physical characteristics of the soil. The nature of the parent rock influences the rate of weathering. Soft rocks are weathered faster thus enhancing the soil formation process. Hard rocks on the other hand are weathered slowly. This slows down the soil formation process.The parent rock also determines the soil texture. Large grained rocks are weathered to produce coarse grained soils. Fine grained rocks produce fine grained soils. The type of minerals and colour of the parent rock are also transferred to soil during formation.
(b) Climate
The climate of an area determines the way in which weathering of the rocks takes place.
The main elements of weather that influence soil formation are temperature and rainfall.
Rainfall provides water. This water makes it possible for decay and disintegration of rocks that form soil.(c) Topography or relief
The topography of an area influences the process of soil formation in many ways. The most important being the slope of land. Steep slopes encourage erosion. The areas of low relief or gentle slope experience deposition and have deep, well drained soils. The degree of slope also largely determines the fertility of soil.(d) Time
Different types of soils require different durations of soil formation processes to reach maturity. A soil formation process that takes a long period of time forms mature soils. A process that takes a shorter period of time forms immature soils.(e) Living organisms
When plants and animals die, they decay to form humus. Micro-organisms in the soil aid in plant and animal decomposition to form humus. These organisms include bacteria, fungi, vegetation and animals. Their major influence is the effect on the chemical and physical environment of the soils.
Roots of plants penetrate into the rocks facilitating weathering of the parent rocks.
This process forms soils. Human activities like ploughing and harrowing break up the rocks into small particles to form soil.(f) Nature of vegetation
Natural vegetation reflects the combined effects of relief and climate. The formation and development of soil is very much influenced by the growth of vegetation.
The decayed leaf material adds much needed humus to soil thereby increasing its fertility. The densely forested areas contain some of the best soils. There is a close relationship between the vegetation types and soil types.Figure 7.7 below shows a summary of the factors responsible for soil formation.

Fig 7.7 Factors that influence soil formation.

Do this in groups of three.
Use the Internet, geography textbooks and journals.
1. Find out other factors that influence soil formation.
2. Analyse the factors by way of group discussion.
3. Make notes on your findings.
4. Present your findings in a class presentation for input from other class members.Task 7.2
1. Define the following terms.
(a) Parent rock
(b) Climate
(c) Topography
(d) Living organisms
2. Describe how each one of the factors in Question 1 influences soil formation.Soil properties and constituents
Constituents of soil

Work in groups of five.
Under the guidance of your teacher, collect the following apparatus.
• A shovel
• A clear bottle or jar
• Water
• Soil
• FunnelCarry out the experiment below.
Follow the steps below
1. Dig up soil from different parts of your school compound.
2. Carry the soil samples in paper bags and take them to the class.
3. Pour the water into the bottle until it is half full.
4. Add the soil into the bottle.
5. Stir the mixture and leave it to settle for 30 minutes.
6. Observe the mixture and record your findings.Answer the questions below.
(a) Draw a diagram showing the appearance of the mixture in the bottle.
(b) As you stirred the soil in water, did you observe any bubbles? Explain why you think the bubbles formed.(c) Explain the distribution of materials as the soil settled in the water.
(d) Give the reason why the water in the bottle changed its colour.Soil is made up of the following components
(a) Inorganic particles
(b) Organic matter
(c) Water (moisture)
(d) Air (gases)(a) Inorganic components
These are particles that are obtained from the parent rock through weathering. These particles vary in shape and size.
They include the following.
(i) Rock particles such as sand, gravel, silt and clay.
(ii) Metallic and non metallic minerals such as calcium, iron and potassium. Inorganic matter provides important plant nutrients, determine soil aeration, soil texture and drainage. It also gives support to the plants. Inorganic matter makes up 45% of the soil.(b) Organic matter
Organic matter in soil consists of small animals, bacteria, fungi, plants, animal waste and plants. Organic matter makes up 45% of the soil.
The breakdown of organic matter leads to the formation of humus. Humus is black or dark-brown in colour. It provides the soil with important benefits. They include the following.(i) It enhances the soil’s ability to hold and store water.
(ii) It provides essential minerals to the soil.
(iii) It improves the soil structure.
(iv) It reduces eluviation of soluble minerals from the top soil.
(v) It helps in soil aeration.(c) Soil water
Soil water (or moisture) makes up 25% of the soil. The water occupies the pore spaces in the soil.
Significance of soil water.
(i) It dissolves various substances for example salts that are derived from plant or animal remains forming solutions.
(ii) It helps plants to absorb minerals from the soil.
(iii) It washes away highly soluble minerals from the upper to the lower layers (leaching).
(iv) It brings soluble minerals from the lower to the upper horizons of soil through capillarity.(d) Soil air
Air or gases make up 25% of the soil. The air occupies the pores in the soil. Importance of air in the soil.
(i) It facilitates plant growth by supplying oxygen to the root hairs.
(ii) Air supports micro-organisms which are found in the soil.
(iii) Air helps in the oxidation process. This process is responsible for breaking down rocks to form soils.Task 7.3
1. Name the components of soil.
2. Give three ways through which humus is important to soil.
3. Explain the significance of moisture in the soil.
Do this in groups of three.
Use the Internet, geography textbooks and journals.
1. Find out more information on the components of soil.
2. Analyse the importance of each of the components by way of discussion.
3. Make notes on your findings.
4. Present your findings in a class presentation for input from other class members.Properties of soil

Work in groups of three.
Use the Internet, geography textbooks and journals.
1. Find out the properties of soil.
2. List and discuss each property in your group.
3. Present your findings in class.Properties of soil refer to the physical and chemical characteristics of soil. Different types of soils have different properties.
The physical properties of soil include texture, structure, colour, depth, density, porosity, permeability and consistence.(a) Soil texture
Soil texture refers to the proportions of the various soil aggregates that make up the soil. These soil aggregates include gravel, sand, silt and clay. The proportion of each of the aggregates is used to determine the type of soil. The soil texture is often defined as the roughness or the smoothness of the soil particles.There are three classes of soil particles. These are sand, silt and clay. The proportions of the aggregates of sand, silt and clay in a soil add up to 100%. Soil texture is important due to the following reasons.
(i) It determines the amount of soil water available within the soil. Silt and clay soils have a high water holding capacity. Sandy soils have a low water holding capacity.
(ii) It determines the ease with which plant roots penetrate the soil.(iii) It determines the soil’s ability to retain humus from being washed away.
(iv) It determines the aeration of the soil.
Work in pairs.
1. Collect samples of soil from the school garden or around the school.
2. Make the soils wet and rub each of the soils between your fingers.
3. Tell your partner what you feel when you rub each soil type between your fingers.
4. Record your findings in your notebooks.
5. Present your findings in class.(b) Soil structure
The term soil structure refers to the physical arrangement of the soil aggregates.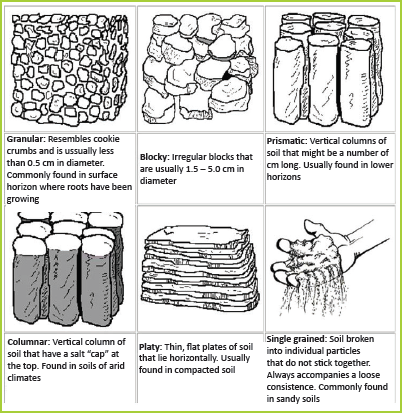
Fig 7.8 Summary of soil structures.
It is the arrangement of primary soil particles into compound structures referred to as aggregates. The soil aggregates cluster together into structural units called peds.
Between the peds are spaces which are occupied by water and air. Therefore, different aggregates are found in different soil horizons. They are also in different shapes. In most cases, soil structure is
commonly defined in terms of the shapes of the soil aggregates.Types of soil structures
(i) Granular - composed of rounded particles.
(ii) Platy - composed of thin sheets of particles arranged in a horizontal manner.
(iii) Prismatic - composed of vertical prism-like particles.
(iv) Columnar - similar to prismatic but the particles are rounded at the top.
(v) Blocky - irregular angular particles that are arranged to form a block.
Work in pairs.
1. Under the guidance of your teacher, visit your school garden.
2. Dig holes using a hoe in different sections of the school garden.
3. Observe the soil layers in the different sections that you have dug.
4. Record your findings in your notebook.
5. Present your findings in class.(c) Soil colour
This property of soil is easily identified through seeing. Soils have different colours.Soil colour is influenced by the parent rock, organic matter , moisture content and minerals. Soils have a variety of colours.
They include red, yellow, black, grey, white and brown. A soil that is black or dark brown has high organic matter content. Soils that are reddish brown are well drained whereas grey soils are infertile.For example, in well aerated soils, the presence of oxidised iron is responsible for the colours seen in the soils. The colours are brown, yellow, and red. When the iron is removed, the soil becomes
grey.
Work in pairs.
1. Under the guidance of your teacher, visit your school garden.
2. Observe the soil colour in different parts of the garden.
3. Record your findings in your notebook.
4. Present the findings in class.(d) Depth

Work in pairs.
1. Under the guidance of your teacher, visit your school garden.
2. Using a hoe, dig holes in various areas of the school garden.
3. Observe the depth of each soil by looking at the depth of the dark soil rich in organic matter.
4. Use a tape measure to measure each soil depth.5. Record the measurements in your notebooks.
6. Discuss your findings in class.Soil depth indicates how thick the soil cover is. Soils are either shallow or deep. Shallow soils have the parent rock material lying close to the surface level. The parent rock material is found much
deeper in deep soils.(e) Soil density
The density of soil is the mass per unit volume of soil particles. It is expressed in grams per cubic centimetres (g/cc). Most soils have a particle density of about 2.6 g/cc. The presence of organic matter decreases the density of soil. The presence of iron compounds increases the density of soil.(f) Soil porosity

Work in groups of five.
1. Under the guidance of your teacher, collect samples of soil from different sections of your school garden.
2. Put the small amounts of about 150 ml of the soil samples in a clear container.
3. Using a marked cylinder, measure 100 ml of water and pour in each soil sample.
4. Do this slowly until the water is slightly above each soil sample.
5. Record the amount of water that has been poured into each soil sample.6. Calculate the porosity of each soil sample using the formula provided below and report your findings in class.
Soil porosity refers to the number of pore spaces in the soil. The pore spaces relate to the portion of the soil space occupied by air and water. This is determined by the arrangement of the soil particles. Soils vary in porosity. Soils with large pores, for example sand are porous while clay is
non-porous. Soil porosity is expressed as a percentage. This percentage is of the total volume of a sample of soil.
(g) Soil permeability

Work in pairs.
1. Under the guidance of your teacher, go to your school garden.
2. Dig some holes in different parts of the garden.
3. Pour water to fill the holes.
4. Observe the reaction.
5. Write down your observations for class discussionSoil permeability refers to the ease with which water or gases pass through soil.
Permeability is influenced by the size and texture of particles. Sandy soils are more permeable than clay soil.
Work in groups of five to test for stickiness of wet soil.
1. Collect samples of different types of soil from different parts of your school garden.
2. Make the soil wet. Soil can also be collected after heavy rains.
3. Press a small amount of each soil sample between the thumb and forefinger.
4. Open the fingers slowly and tell your group members whether the soil is sticky, slightly sticky or non-sticky.
5. Record your findings and present them in class.Soil consistency refers to the ease with which individual particles of soil can be crushed. This is done by the fingers or a cultivation tool. Soil consistency depends on the soil moisture content. The degree of soil consistency can be determined using moist, wet or dry soil.
The consistency of wet soils is determined by its stickiness and plasticity. Plasticity is the extent to which the soil can be moulded.(i) Moist soils

Work in groups of five.
1. Collect samples of different types of soil from different parts of your school compound.
2. Make the soil moist. Ensure that it does not get wet.3. Press a small amount of each soil sample between your forefinger and the thumb. You can squeeze the soil in your palm as shown in Figure 7.9.

Fig. 7.9 How to press soil using fingers or the palm
4. Rate each soil sample as being loose, friable or firm.
5. Record your findings in your notebook.
6. Present your findings in class.Moist soil consistency can be measured as loose, friable or firm. Loose soils do not hold together in a mass when moist. Friable soils are crushed easily under gentle pressure between the thumb and forefinger when moist. Firm soils can be crushed under moderate pressure between the thumb
and forefinger. However, the resistance is noticeable.(ii) Wet soils

Testing for plasticity of wet soil
1. Take a sample of each wet soil that you have collected.
2. Roll it between the palms of your hands to form a ribbon.
3. Rate the soil as being non-plastic, slightly plastic, plastic or very plastic.
4. Record your findings and present them in class.The soil is non-sticky if there is no soil that sticks to your fingers. It is slightly sticky when the soil sticks to your fingers slightly then comes off. It is sticky when the soil sticks to your forefinger and thumb.
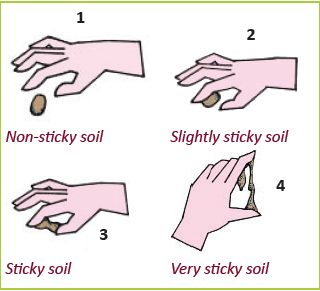
Fig. 7.10 Images illustrating stickiness of soil.Soil is non-plastic when no ribbon is formed when it is rolled. The soil is slightly plastic when a ribbon is formed. It can also be broken easily and the soil returned to its original state. The soil is plastic when a ribbon is formed. It can also be broken down and then rolled back to its original form.
(iii) Dry soils
The consistency of dry soils is loose when the soil can be broken with little pressure. It is hard when the soil is broken with a lot of force.
Work in groups of five.
1. Collect different soil samples and airdry the soil.
2. Try to break each soil sample by pressing it between the thumb and forefinger. You can also break it in your palm.
3. Rate the soil as loose, soft or hard.
4. Record your findings and present them in class.The chemical properties of soil include:
• Soil pH
• Salinity
• Nutrient status(i) Soil pH
Soil pH is an indicator of the acidity or alkalinity of a soil. It is also known as soil reaction.
Soil pH refers to the concentration of hydrogen ions in the soil. Soil pH affects the availability of nutrients in the soil. Soil acidity is increased when the carbon dioxide reacts with water to form carbonic acid.
Alkalinity of the soil increases when too much lime is applied to the soil. The pH scale is used to determine the level of alkalinity or acidity of soil. The soil pH scale ranges from 0 to 14.Table 7.1 Soil pH colour chart.
Less than pH 5 pH 5-6 pH7 pH8-10 Over pH9 Soil is very acidic(red) Slightly acidic(pink) Neutral(green) Slightly alkaline(blue) Alkaline (purple
Acidity of the soil increases as you move from pH 7 to 0. Alkalinity of the soil increases from pH 7 to 14. Most crops grow well at a pH of 6.5.
Work in groups of five.
Do the experiment given below.Materials
• Different soil samples
• Distilled or rain water
• Container with a lid
• Litmus paper
Procedure
1. Collect different soil samples from different locations in your school compound.
2. Mix two parts of a given sample of soil with one part of rain water.
3. Put them in a container with a lid.
4. Allow the mixture to settle.
5. Dip a litmus paper into the mixture and observe the colour change.
6. Repeat this procedure using soil samples from different areas of your school compound.
7. Record your observations and compare the colour produced with those on the soil pH colour chart.
8 Present your findings in class.(j) Salinity

Work in groups of five. Do the experiment given below.
Materials
• Different soil samples
• Distilled or rain water
• Pestle and mortar
• Evaporating basins/tins
• Source of heat
• Weighing equipmentProcedure
1. Collect soil samples from different parts of your school compound.
2. Put the soil sample out to dry. Ensure that they are completely dry.
3. Crush the soil using the pestle and mortar. You can also use a stone to crush the soil until there are no soil aggregates left.
4. Add water to the soil and shake the container thoroughly for about 2 minutes.
5. Let the mixture settle for a minute. The ratio of soil to water should be 1:5.
6. Filter the water and pour it out into the evaporating tin. Heat the mixture until all the water evaporates.
7. Weigh the residue that is left in the tin. This is to determine the amount of salt available in the soil sample.
8. Repeat this procedure using different soil samples.
9. Present your findings in class.Soil salinity refers to amount of salt present in soil. Salts occurs naturally within soils and water. Salination can be caused by natural processes such as mineral weathering or by gradual withdrawal of an ocean. It can also come about through artificial processes such as irrigation.
Salts in the soil also come from fertilisers, compost and manure. Introduction of water into the soil can reduce the amount of salt in the soil through leaching.
Nutrient status

Mr. Muhire, a farmer in Gashora village planted beans in one of his fields during the last planting seasons. However, the yield was very poor. He was advised by the agricultural office in his sector to use artificial and organic manure in the next season. When the planting season came, hedid that and his harvest greatly improved.
1. Explain what was missing in the soil that led to poor yield.
2. Why was he advised to use artificial and organic manure on the soil?
3. Why do you think the yield was good in his second harvest?
4. Use the advice he was given to help farmers in your home area to improve their yields.The nutrient status of soil determines the level of fertility of the soil. Soils that have high levels of nutrients are very fertile whereas soils with low levels of nutrients are infertile. The nutrients that are found in the soil are referred to as minerals. These nutrients are divided into macro and micro
nutrients.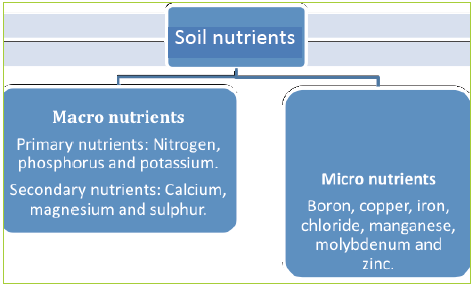
Fig 7.11 Nutrients found in the soil.

Do this in groups of five.
Use the Internet, geography textbooks and journals.
1. Find out other physical and chemical properties of soil.
2. Note down your findings in your notebooks3. Observe the soils in your school compound. Find out if they possess the properties that you are
researching about.
4. Present your findings in class by way of discussion.Soil structure

Do this in pairs.
Use the Internet, geography textbooks and journals.
1. Find out the meaning of soil structure.
2. What is the importance of soil structure?
3. Discuss and present your findings in class.Soil structure describes the arrangement of the solid parts of a soil. It also describes the pore spaces located between them. The structure of a soil is determined by how individual soil granules bind together. Soil structure depends on what the soil developed from. The quality of soil structure
declines under most forms of cultivation and irrigation.Different types of soil structure

Do this under the guidance of your teacher.
1. Go outside your classroom.
2. Dig holes in different parts of your school compound.
3. Observe the structure of the soils that you have dug up.
4. Record and discuss your findings in a class discussion.Soil structure is classified by type (shape), class (size) of peds (soil aggregates) and grade (strength of cohesion) of the aggregates.
Shape, size and strength of aggregates determine pore structure and how easily air,water and roots move through soil.(a) Granular structure
This is the most common structure in surface soil layers. It is present in soils with adequate organic matter. Granular structures offer the most pore spaces.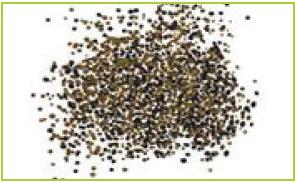
Fig 7.12 Granular (high permeability).
(b) Columnar structure
Columnar structure is often found in soils with excessive sodium. This is because of the dispersing effects of sodium, which destroys the soil structure. Sodium seals the soil to air and water movement. It has moderate permeability.
Fig 7.13 Columnar structure.
(c) Platy structure
Platy structure has the least amount of pore spaces. It is common in compacted soils. It
has low permeability.
Fig 7.14 Platy structure
Soil profile and soil catena

Do this in pairs.
Use the Internet, geography textbooks and journals.
1. Find out the meaning of soil profile.
2. Name the horizons into which soil profile is categorised.
3. Record your findings and present them in class by way of discussion.Major horizons

Work in groups of three.
Under the guidance of your teacher, visit a site near your school where the ground has been excavated to at least about 3 metres in depth.
1. Observe and note down the main characteristics of each layer and soil.
2. Name the horizon or layer that is important for plant growth.
3. Give reason(s) why the layer is important
4. Discuss your finding in class.A soil horizon refers to the layer of soil which lies parallel to the land surface. Each horizon differs from the others in terms of colour, structure and mineral composition.
The horizons are identified by capital letters O, A, B, C and D.1. Horizon O – This layer is also known as the superficial layer. It is the thin layer of dry, decaying and partially decomposed organic matter. It mainly consists of decomposing leaves and roots of plants.
2. Horizon A – This horizon is also known as the topsoil. This layer of soil is found beneath the superficial layer. It is a dark coloured horizon that is rich in humus. The layer has good aeration
and contains active living organisms.3. Horizon B – This horizon is also referred to as the subsoil. It lies immediately below Horizon A. The soil particles are closely packed together. The soil in this layer is poorly aerated. It also has
fewer living organisms and is rich in clay deposits.4. Horizon C – This is the zone of deposition. It forms the parent rock. It is also referred to as sub-stratum. It is the deepest and the thickest of all the layers.
5. Horizon D – This horizon resembles the C-horizon. It is made of the hard rock which is resistant to weathering.
Note
Not all of the five horizons may be present in every soil. This depends on the conditions under which the soil was formed.Soil profile
This is the vertical arrangement of the soil in layers from the surface to the bedrock. The layers of soil are called horizons. Mature soil has four horizons. They are horizons A, B, C and D. Horizon A is composed of the top soil and horizon B the sub-soil.Horizon C is composed of partially weathered rock and Horizon D the parent rock. The horizons have distinct structures, colours, textures, porosity and minerals.


Do this in groups of three.
1. Go to your school garden.
3. Dig small holes and observe the soil layers.
3. Record the different characteristics of the soil layers that you are able to see. Describe aspects such as texture, colour and particle sizes of the soil layers.
4. Discuss your observations in class under the guidance of your teacher.Soil catena

Do this in pairs.
Use the Internet, geography textbooks and journals.
1. Find out the meaning of soil catena.
2. Name the factors responsible for soil catena.
3. Record your findings and present them in class for discussion.
Your teacher will take you to a sloppy area in the neighbourhood of your school.
1. Study the soils on the different heights of the slopes.
2. Name some of the factors that you think are responsible for the differences in soils.3. Record your findings in your notebook.
4. Present your findings in class for discussion.Soil catena refers to the sequence of different soil profiles that occur down a slope.
The soil down a hill slope is rarely uniform. Soil eroded from the top of the slope tends to accumulate near the bottom. Runoff water tends to infiltrate more in the flatter areas at the foot of the slope. This water encourages more plant growth there than on the steep part of the slope. Consequently, the factors forming the soil differ from top to bottom. Different soils thus develop. The steep slopes have thin soils while the valley bottoms have deep soils. Soil catena is therefore influenced by relief, drainage, leaching and transportation of soils during erosion.
Fig 7.16 Soil catena.
Task 7.3
Use well-labelled diagrams to illustrate and explain:
(a) soil profile
(b) soil catena.Types of soils

Do this in pairs.
1. Go outside your school and collect soils from different parts of the compound.
2. Observe the soil samples focusing on their appearance and characteristics.
3. Classify the soils into different types based on the knowledge that you have.
4. Present your findings in class.There are four types of soils. Three are basic while the fourth one is a combination of the
three. They are:• Sand • Clay
• Silt • Loam soils
Sand is composed of small particles of weathered rock. Sand is fairly coarse and loose so water is able to drain through it easily. While this is good for drainage, it is not good for growing plants. This is because sandy soil will not hold water or nutrients. Silt can be described as fine sand. It however
holds water better than sand.
Clay is very fine-grained soil. Its particles are even smaller than those of silt. This means that there is little space between the grains for air or water to circulate. Therefore, clay does not drain well.Loam soil is a combination of sand, silt and clay. Loam will vary depending on how much of each component is present. It holds moisture and also allows for good drainage.

Do this in pairs.
Using the soil samples that you had collected;
1. Classify the soils according to their characteristics.
2. Present your findings in class by way of discussionEffects of soils on human activities
Soils are important for the existence of plants, animals and humans. Most human activities are supported by soils. Some of the human activities that depend on soils include:
• Agriculture and food production
• Pottery
• Building and construction
• Mining
• CultureImportance of soils

Work in pairs.
1. Observe the environment around your home or school.
2. Note the different uses of soil.
3. Discuss the uses of each type of soil that you identified in the activity above.4. Record your findings in your notebook.
5. Present your findings for a class discussion.Below are some of the ways in which soils are important:
1. Soil has vital nutrients which support the growth of plants.
2. Soil supports animal biodiversity, above and below ground.
3. Soil is important in providing an adequate water supply and maintaining quality vegetation.
4. The water absorption property of soil helps in reducing pollution from chemicals in pesticides.
5. Soil holds the key to the earth’s history. It contains and preserves artifacts of the planet’s past. For example dinosaur fossils were discovered in the earth.
6. Clay soils are commonly used in pottery, ceramics, bricks and other clay works.
7. Ordinary soil when mixed with water forms earth blocks that are used in building houses.
8. Murram soils are used in the construction of roads.9. Some soils contain valuable minerals which are mined and sold to earn income.
10. Some soils contain minerals that are used by animals as salt lick.
11. Some soils are used to make medicine and beauty products. For example,
soils rich in clay can be used to make facial masks. Some other soils are used to make skin ointments.
Work in groups of four.
1. Observe your surroundings at home and in school.
2. Identify some of the human activities that take place around the area.
3. Identify the specific soil types that are used for the different activities.
4. Present your findings in class.Relationship between soil types and human activities

Work in groups of three. Use the internet, geography textbooks and photographs;
1. Relate specific soil types to different human activities.
2. Discuss and present your findings in class.The type of soil found in a region determines the human activities in that area. For example.
where there is a lot of sandy soils, there is extraction of the soil for building and construction.• Clay soil supports.
– crop production of specific crops
– pottery and ceramics
– building and construction activities
– medicinal uses.
• Loam soil supports agricultural activities.
• Alluvial soil supports agricultural activities. It is also used in the manufacture of fertilisers.
Work in pairs.
Using the Internet, geography textbooks, journals and personal experience, answer the following questions.
1. How is soil related to agriculture and mining as human activities?
2. Which soil types support the activities?
3. Discuss and record your findings.
4. Present your findings in class.
Work in groups.
After finding out how soil relates to various human activities:
1. Suggest ways in which soil can be conserved.
2. Give reasons why you think it is important to conserve soil.
3. Why is agriculture an important activity?
4. Present your findings in a class discussion.Did you know?
• Soil is a living system
• Soil hosts a quarter of the total planet’s biodiversity.
• There are more micro-organisms in a handful of soil than there are people on earth.
• Soil is a non-renewable resource.
• Soils help to combat and adapt to climate change.
Define soil.
1. Identify three soil formation processes.
2. Discuss the factors that influence soil formation.
3. (a) List the components of soil.
(b) Briefly describe any three properties of soil.
4. (a) Define soil profile.
(b) Draw a well-labelled diagram showing detailed sub-divisions of the horizons in a soil profile.
(c) Briefly describe the characteristics of each horizon.
5. (a) What is soil catena?
(b) State the conditions which influence soil catena.
(c) State the type and characteristics of soils on the following parts of a slope.
(i) upslope (ii) steep slope
(iii) lower slope.
6. Explain how the soils shown in the table below are used for different human activities.
UNIT 8:Weather and climate

By the end of this unit, you must be able to recognise the importance of the atmosphere, differentiate weather from climate and classify major climatic types.
Unit objectives
By the end of this unit, you must be able to:
(a) state the difference between weather and climate
(b) identify layers of the atmosphere and state its importance
(c) outline the elements of weather and climate
(d) identify weather instruments at a weather station
(e) state the factors influencing temperature variation
(f) identify how to measure temperature
(g) state the major processes of the water cycle
(i) state different types/forms of rainfall
(j) explain the factors influencing atmospheric pressure variation
(k) identify the factors influencing humidity and how to measure humidity
(l) identify different types of winds
(m) state different types of clouds
define sunshine
(o) outline factors influencing climate
(p) outline the relationship between climate and human activities.
Definition of atmosphere, weather and climate

Work in pairs.
1. Use the Internet and geography textbooks to find out the composition of the atmosphere.
2. Record your findings and discuss them in a class presentation
In Unit 3, you learnt that the atmosphere is one of the elements of the earth. You defined the atmosphere as the thin layer of gases that surrounds the earth. It is a mixture of gases like nitrogen, oxygen, water vapour, carbon (IV) oxide and others. It is held onto the earth by the force of gravity.
In simple terms, the term atmosphere refers to the envelope of air surrounding the earth.
Work in groups of three.
1. Go outside the classroom and observe the nature of the day.
2. Study the wind, sunshine, temperature and clouds.
3. Write down the observations in your notebooks.
4. Compare your observations with those of other members of the class in a discussion.
Weather refers to the day to day conditions of the atmosphere. It is described in terms of temperature, wind, rain, moisture, atmospheric pressure, humidity, sunshine and clouds.
The weather of the day can be described as: windy, rainy, sunny or cloudy. This depends on the elements of weather. The element that dominates the day describes the weather.
Use the following photographs to describe the weather conditions shown. Do this individually.
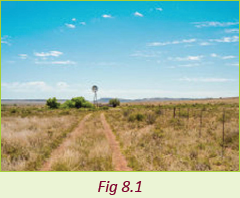
Climate refers to the weather conditions prevailing in an area over a long period of time.

Your teacher will take you to a field visit to a weather station.
1. Observe the weather records kept in the station for the last one year.2. Describe the weather conditions observed.
3. Describe the climate of the area.
4. Identify the dominant activity carried out by the people who live in the area.
5. Find out how the climate of the area influences the activity.
6. Discuss and record you findings.
7. Present your findings in a class discussion.
Atmosphere
You learnt about the atmosphere earlier in this unit. You defined the atmosphere and the gases that make the atmosphere.
The structure of the atmosphere
The atmosphere is divided into four major distinct zones or layers. These distinctions are based on changes in temperature with increase in altitude. The zones are separated by transitional boundaries.
(a) Troposphere (c) Mesosphere
(b) Stratosphere (d) Thermosphere
Troposphere
• This is the lowest layer of the atmosphere.
• It is also the site of all weather on earth. It is thus the most important layer to meteorologists.
• It contains about 75% of the atmosphere’s mass and 99% of its water vapour.
• It has an average depth of about 17 kilometres in the mid latitudes. It is deeper in the tropics about 20 kilometres and shallower towards the poles about 7 kilometres.
• This is the zone where temperatures reduce with increase in altitude. The higher one goes the cooler it becomes.
Towards the end of this zone temperature reduce to almost – 67°F (–20°C).
• Atmospheric pressure also falls with increase in height.
• The speed of wind increases with increase in height.
• It is the only life supporting layer.
• The transitional zone between the troposphere and the stratosphere is known as the tropopause.
Stratosphere
• This is the second layer of the atmosphere.
• The bottom of the stratosphere is around 10 kilometres above the about at middle latitudes. The top of the stratosphere occurs at an altitude of 50 kilometres. The height of the bottom of the stratosphere varies with latitude and with the seasons. The lower boundary of the stratosphere can be as high as 20 kilometres near the equator. It can also be as low as 7 kilometres at the poles in winter.
• In this zone, temperature increase with increase in altitude, and this is called temperature inversion.
• It is in this zone where the ozone layer is found. The ozone layer is the oxygen isotope whose concentration is 25 – 30 kilometres above the sea level.
The ozone layer
The ozone layer is important due to the following reasons.
(a) The sun’s insolation has dangerous rays called ultra-violet rays. These rays are dangerous to humans. The ozone layer filters the sun’s insolation by removing these rays.
(b) The ozone layer regulates temperatures in the lower atmosphere. This prevents the melting of ice and effects of global warming.
Ozone layer depletion
Ozone layer depletion refers to the damaging of the ozone layer by air pollutants.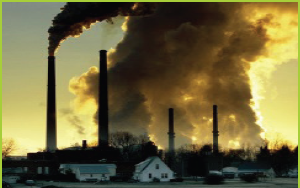
Fig 8.2 Smoke from industries containing gases that destroy the ozone layer.
This happens due to the impact of some gases like chlorofluorocarbons (CFCs) and methane gas. These gases eat up some parts of the ozone layer creating holes in it. The holes are called atmospheric windows.
The destruction of the ozone layer has led to serious effects which include the following.
(a) Increase in temperatures resulting in many of the glaciers melting.
(b) Rise in the sea level due to the incoming melt water .
(c) Diseases like skin cancer.
(d) Extinction of some plant and animal species due to the harsh climatic conditions.
(e) Prolonged droughts and global warming in general that results to environmental degradation.
The lower boundary of the stratosphere is called the tropopause. The upper boundary is called the stratopause.

Work in pairs.
Study the photograph below and answer the questions that follow.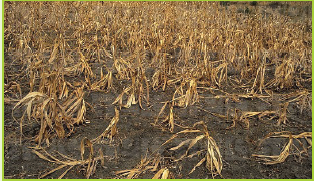
Fig 8.3
1. What could have caused these crops to look like this?
2. Analyse the effects of drought on the environment.
3. Suggest ways in which drought can be prevented.
4. Record your findings.
5. Present your findings in a class presentation.
Mesosphere
• This is a part of the atmosphere that is above the stratosphere.
• It is separated from the stratosphere by a line of transition called the tropopause.
• It is the third layer in the zonation within the atmosphere.
• Its extends from about 50 – 85 kilometres above the earth.
• This the coldest layer in the atmosphere. Temperatures fall to between – 90°C to -101°C at the mesopause. This is the upper limit of the mesosphere.
• The area has the strongest winds nearly 3000km/hour which hardly allow temperatures to increase.
• The transitional zone between the mesosphere and the thermosphere is known as the mesopause.Thermosphere
• This layer starts from the mesopause – a line of transition that separates the thermosphere from mesosphere. It then continuously reaches up to the upper limit of the atmosphere.
• It extends from about 90 kilometres to between 500 and 1,000 kilometres above our planet.
• Here temperatures increase with altitude because of the absorption of solar energy.
• Temperatures in this zone rise tonearly 15000C and above.
• Gases in the thermosphere separate into different layers as follows;
(a) Oxygen zone – lower layer
(b) Helium zone – middle zone
(c) Atomic hydrogen – uppermostlayer
This mesosphere and thermosphere form one layer called ionosphere.
This region is named so for its relatively large concentrations of ions.
The transitional zone between the thermosphere and the exosphere is known as the thermopause.
Exosphere
This is the uppermost region of earth’s atmosphere as it gradually fades into the vacuum of space.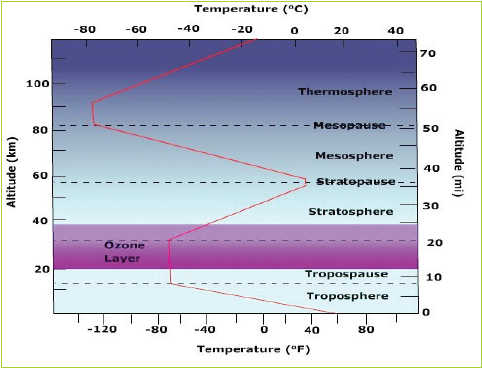
Fig 8.4 Layers of the atmosphere.
Air in the exosphere is extremely thin.In many ways it is almost the same as the airless void of outer space.
It extends to a distance of about 1000 kilometres above the earth’s surface. It extends into interplanetary space.
• It is distinctively dark.
• It is a zone of low density. Atoms fly into space because they are freed from the earth’s gravity.
• The atmosphere shields the earth from ultra-violet rays which are harmful to all life forms on earth.
• The atmosphere facilitates wireless communication. This is due to the ionosphere where there are electromagnetic waves. These waves are reflected back to the earth’s surface.
• The atmosphere regulates the temperatures experienced along the earth’s surface where life exists (flora and fauna).
• The atmosphere and its associated winds are utilised to increase generation of electricity-wind energy.

Work in pairs.
Using the Internet and other geographical documents.
1. Describe each layer of the atmosphere and its characteristics.
2. Record your findings.
3. Discuss your findings in a class discussion.
Composition of the atmosphere
The atmosphere consists of gases such as nitrogen, oxygen, water, carbon (IV) oxide, water vapour and ozone. Nitrogen and oxygen gases occur in larger volumes than other gases.The importance of atmosphere
The atmosphere facilitates the formation of rainfall hence raising the operation of the water cycle.
The atmosphere provides air which is necessary for plant, animal and human life.
The atmosphere provides case studies for research, especially the meteorologists.
The atmosphere shields the earth from ultra-violet rays which are harmful to all life forms on earth.
The atmosphere facilitates wireless communication. This is due to the ionosphere where there are electromagnetic waves. These waves are reflected back to the earth’s surface.
The atmosphere regulates the temperatures experienced along the earth’s surface where life exists (flora and fauna).
The atmosphere and its associated winds are utilised to increase generation of electricity-wind energy.

Work in pairs.
Using the Internet and other geographical documents.
1. Describe each layer of the atmosphere and its characteristics.
2. Record your findings.
3. Discuss your findings in a class discussion.
Composition of the atmosphere
The atmosphere consists of gases such as nitrogen, oxygen, water, carbon (IV) oxide, water vapour and ozone. Nitrogen and oxygen gases occur in larger volumes than other gases.The importance of atmosphere
• The atmosphere facilitates the formation of rainfall hence raising the operation of the water cycle.
• The atmosphere provides air which is necessary for plant, animal and human life.
• The atmosphere provides case studies for research, especially the meteorologists.
• The atmosphere shields the earth from ultra-violet rays which are harmful to all life forms on earth.
• The atmosphere facilitates wireless communication. This is due to the ionosphere where there are electromagnetic waves. These waves are reflected back to the earth’s surface.
• The atmosphere regulates the temperatures experienced along the earth’s surface where life exists (flora and fauna).
• The atmosphere and its associated winds are utilised to increase generation of electricity-wind energy.

Work in groups of three.
Use the Internet and Geography textbooks.
1. Find out other importance of the atmosphere.
2. Discuss how Rwanda benefits from the atmosphere.
3. Record your findings.
4. Present your findings in a class discussion.
Elements of weather and climate

Work in pairs.
1. Describe the weather condition this morning on your way to school.
2. Look outside your classroom and describe the weather outside.
3. Write down your findings and present them in a class discussion.

Work in groups of three.
Use the environment in your school or home, the Internet and geography textbooks.
1. Describe other elements of weather and climate.
2. Record your findings.
3. Present them in a class discussion.
The weather conditions experienced at different times of the day are referred to as elements of weather. These are aspects that describe the atmospheric conditions. Humans depend on these elements to interpret the weather and climate of a given place.The following are the elements of weather and climate
- . Sunshine
- Temperature
- Atmospheric pressure
- Wind
- Humidity
- Cloud cover
- Precipitation
- Visibility
- The weather and climatic conditions of any given place can be influenced by one or more of these elements. The elements can be observed, measured and recorded daily in a weather station.
(a) Sunshine
This is the light or amount of solar radiation received on the surface of the earth from the sun. The amount of sunshine received in a place depends on cloud cover, aspect and latitude. Thick cloud cover reduces the amount of sunshine and its duration. Sunshine is more intense when the sky is clear. The amount of sunshine of a place is recorded as a mean of sunshine hours per day.
(b) Temperature
This describes the hotness or coldness of a place. High temperatures are experienced on sunny cloudless days. Low temperatures are experienced on cloudy days and at night. Thus the temperature of a place is a result of the amount of heat energy received from the sun.
(c) Atmospheric pressure
This is the weight exerted by a vertical column of air onto the earth’s surface. This weight is exerted by the force of gravity. Atmospheric pressure is greater on the ground surface and greatest at sea level. It decreases with increase in altitude.
(d) WindThis is moving air caused by pressure difference. It moves from a zone of high pressure to a zone of low pressure. It moves in a horizontal manner.
(e) Humidity
This is the amount of water vapour in the atmosphere. Water vapour is obtained from water bodies and the ground surface. It is obtained through evaporation and from plants through transpiration. The amount of water in the air depends on:
• Temperature
• Size of water bodies present in a place
• Prevailing winds.
Thus, places with large water bodies and high temperatures have higher amounts of water vapour than those without. Onshore and calm wind facilitate build-up of water vapour on land. Offshore and very strong winds blow away the water vapour from the land.
(f) Cloud cover
Clouds are tiny droplets of water or ice suspended in the air. They are formed when water vapour condenses into water droplets or ice crystals. These crystals condense around things such as dust, salt or smoke particles moving in the atmosphere.
(g) Precipitation
This is the deposition of moisture in liquid or solid form falling from onto the earth from the clouds. It is in the form of rain, hail, frost, sleet, snow or frost.
Visibility
This is the measure of distance at which an object or terrain can be clearly seen. Visibility is reported in metres. It is reported as a prevailing value of the visibility at all directions.

1. Observe the weather around your school and home for about a week.
2. Describe the weather changes through the week.
3. Find out the reason why the weather keeps changing.
4. Record your findings and discuss them in your group.
5. Make a class presentation on your findings.
Task 8.1 1.
(a) Define the term weather.
(b) Differentiate between weather and climate.
2. State the elements of weather.
3. (a) Define the term atmosphere.
(b) With the help of a diagram, describe the major layers or zones that form the atmosphere.
4. (a) Define the term ozone layer.
(b) Explain the importance of the ozone layer to humans and wildlife at large.
5. (a) Explain the meaning of depletion of the depletion of the ozone layer depletion.
(b) Analyse the causes of the ozone layer.
6. (a) What are atmospheric windows?
(b) State and explain the effects of atmospheric windows on the environment.
7. Discuss the importance of atmosphere to humans and to the environment.
The weather station and its instruments

Work in groups of three.
1. Show how the following elements of weather are measured using local resources.
(a) Temperature (c) Wind speed
(b) Rainfall (d) Sunshine
2. Write down your finding and discuss them in class
A weather station is a place where observation, measurement and recording of elements of weather is done. These activities are carried out on a daily basis. The information obtained is used to describe the weather of a place.
At a weather station, different instruments are found. Each instrument is used for collecting specific data on given elements of weather.
Table 8.2 shows elements of weather and the instruments used to measure them.
Table 8.2 Weather instruments.
Element Instrument Lines drawn on a map showing each element Temperature Thermometer Isotherms Rainfall Rain gauge Isohyet Wind speed Anemometer Isotachs Wind direction Wind vane Isogons Atmospheric pressure Barometer/aneroid barometer Isobars Humidity Hygrometer Isohumes Sunshine Sunshine recorder Isohels Cloud cover Ceilometer/ceiling light (height of cloud), cloud cover radiometer (CCR) Isonephs
Thermometer
A thermometer measures the air temperature. Most thermometers are closed glass tubes containing liquids such as alcohol or mercury. When air around the tube heats the liquid, it expands and moves up the tube. A scale then shows what the actual temperature is.
Fig 8.5 Weather thermometer.
Barometer
A barometer measures air pressure. It tells one whether or not the pressure is rising or falling. A rising barometer means sunny and dry conditions. A falling barometer means stormy and wet conditions.
Rain gauge
A rain gauge measures the amount of rain that has fallen over a specific time period.
Fig 8.7 A rain gauge.Wind vane
A wind vane is an instrument that determines the direction from which the wind is blowing.

Fig 8.8 Wind vane.
Windsock
It also shows the direction and relative speed of wind. It determines the direction that the wind is blowing towards. It consists of a bag like cloth closed at one end and open on the other
Fig 8.9 A windsock.
Anemometer
An anemometer measures wind speed. The cups catch the wind, turning a dial attached to the instrument. The dial shows the wind speed.

Fig 8.10 An anemometer.
Hygrometer
A hygrometer measures the water vapour content of air or the humidity.
Fig 8.11 A hygrometer.
Sunshine recorder
- A sunshine recorder is a device that records the amount of sunshine at a location. The results provide information about the weather and climate of a geographical area.
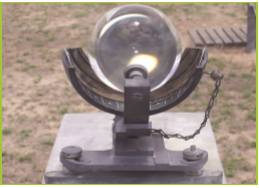
Fig 8.12 A sunshine recorder.
Ceilometer
This is a device that is used for measuring and recording the height of clouds.

Fig 8.13 A ceilometer.
A Stevenson screen
This is a special box in which the main delicate weather instruments are kept. It houses thermometers and the hygrometer. This is to protect the instruments from dew and rainfall. Rain and dew interfere with and damage the thermometers.
The thermometers that are found inside a Stevenson screen include the following.
• Maximum thermometer
• Minimum thermometer
• Wet-bulb thermometer
• Six’s thermometer

Fig 8.14 A Stevenson screen.Important points to note about a Stevenson screen
(a) It is made of wood. This is preferred to prevent the external heat. Wood is a bad conductor of heat.
(b) All the sides of the Stevenson screen have louvres to allow proper aeration. This is to allow free circulation of air. It is also to safeguard the thermometer from direct sun’s rays.
(c) The Stevenson screen is painted white. This is purposely to reflect heat. This implies that the sun’s insolation is reflected back. This prevents it influencing the temperatures inside the box.
(d) Stevenson screen is placed on a grass-covered ground. This is done to prevent the radiated heat from influencing the temperatures inside the Steven screen.
(e) The Stevenson screen is placed on a stand, about 121 cm above the ground. This enables the air temperatures to be easily determined.
(f) It is located far away from obstacles such as buildings, trees or concrete fences. This is to avoid disturbing the free movement of air. It also allows air to enter the Stevenson screen through the four louvred sides.
(g) The Stevenson screen has a double boarded roof. This prevents direct rays from the sun from influencing the temperatures inside the box.

Fig 8.15 A weather station with weather instruments.
In Rwanda, there are several weather stations. An example is the Nyamirambo weather station in Nyarugenge District, Kigali Province.

Do this individually.
Study Figure 8.15.
1. Identify some of the instruments in the photograph.
2. Why do you think it is necessary for such stations to be built in various parts of the country?
3. Does your school have a weather station?
4. If it does, how important is it?

Work in groups of three. Your teacher will take you for a field visit to a weather station.
1. With the help of a resource person, go round the station and identify the instruments available.
2. Record them in your notebooks.
3. The resource person at the station will show you how to:
(a) measure temperature using a thermometer
(b) check for the wind direction using a wind vane
(c) measure air pressure using a barometer.
4. Ask him or her to show you how to use any other weather instrument available at the station.
5. Record the measurements of the different elements of weather at the station.
6. Write a report on the weather and climate of the area around the station.
7. Make a class presentation on your findings.
Importance of a school weather station
(a) A school weather station enables the school administration and learners to save time and money. These resources would otherwise be spent on the distant field studies on weather stations.
(b) It provides a platform for practical studies to the learners. Learners are able to use the instruments to measure various elements of weather.
(c) The school weather station can enable learners know the weather of their school environment.
(d) The school weather station acts as a laboratory for geography lessons. In practical lessons, learners are involved in collecting data on various elements of weather. This make them understand what is studied in classrooms.
(e) The practical studies facilitated by such stations enable learners to acquire various skills. The skills include measuring, recording and analytical skills.
(f) The school weather station provides evidence on what certain specialists or professionals do. This helps in creating an inner passion in the learners to pursue careers like meteorology and climatology.
Task 8.2
1. (a) Describe a Stevenson screen.
(b) Explain the main features of a Stevenson screen.
2. Analyse the importance of a school weather station.
3. (a) Explain the main features of a good Stevenson screen.
(b) With the help of a diagram, name and describe the conditions that should be considered while installing a Stevenson screen.
(c) State the importance of the following on a Steveson Screen.
(i) wood
(ii) louvred sides
(iii) double roof
(iv) height of 121 cm above the ground.
4. Name the instruments kept inside the Stevenson screen.
5. Study the table below and fill in the necessary missing information

Temperature

1. Go outside the classroom. Describe the temperature of the air.
2. Compare day temperatures to night temperatures.
Temperature is defined as the degree of hotness and coldness of a given place. Temperature is one of the elements of weather. It is measured by an instrument called a thermometer. There are essentially three types of thermometers.
(a) Maximum thermometer
(b) Minimum thermometer
(c) Six’s thermometer
The maximum thermometer
The maximum thermometer is used to determine the highest temperature reached in a day. This thermometer has a small constriction in the tube just above the bulb. When the temperature increases, the mercury in the bulb expands upwards beyond the constriction. When there is a fall in temperature, the fluid threads break. The end of the mercury column is positioned at the maximum temperature.
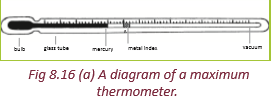

Fig 8.16 (b) A maximum thermometer
The minimum thermometer
This thermometer is responsible for showing the lowest temperature reached in a day. It does not use mercury but instead uses alcohol. When temperatures decreases, it causes the alcohol in the tube to contract. It then pulls along the index to the actual lowest point. To determine the lowest temperature, we use readings at end of the index near the surface of the alcohol.

Fig 8.17 (a) A diagram of a minimum thermometer.

Fig 8.17 (b) A minimum thermometer
The Six’s thermometer
This type of thermometer is used to measure maximum and minimum temperatures in a day. One of its sides has a maximum thermometer and the other minimum thermometer.

Fig 8.18 (a) Diagram of Six’s thermometer.

Fig 8.18 (b) Six’s thermometer
How it works
1. It has two scales namely the minimum and the maximum scale.
2. The maximum scale is progressive while the minimum scale is retrogressive .
3. When temperature increases, alcohol and mercury expand towards the maximum side.
4. Some of the alcohol in the maximum thermometer vapourises and occupies the empty space on top.
5. This flow pushes the index upwards up to the highest temperature.
6. When temperature reduces, there will be a reverse flow.
7. The maximum index will stay still at the maximum temperature. This time, the vapour that was in the vacuum turns back to liquid.
8. The mercury and liquid contract and the constriction forces the metal index in the minimum thermometer upwards.
9. As it continues upwards, it reads lower and lower temperature on the scale. It then stops on the lowest temperatures of the day.

1. Your teacher will give you samples of the maximum, minimum and Six’s thermometers.
2. Measure the maximum and minimum temperature inside your classroom and record your findings.
3. Measure the maximum and minimum temperature outside your classroom and record your findings.
4. Compare your findings with the rest of your class members.
Factors influencing variation of temperature
(a) Nature of the atmosphere
Solar radiation passes through the atmosphere. As it passes, it collects various gases and aerosols which are impurities. These impurities interfere with radiation by scattering, reflecting and absorbing part of the insolation. Eventually, the temperatures rise.
(b) The solar altitude
The noon sun is much more intense than the rising or setting sun. Therefore, at noon time, temperatures become higher than those experienced in morning and evening hours.
(c) The distance away from the sun
The longer the distance covered by solar radiation, the lower the temperature will be. The shorter the distance, the more the radiation and the higher the temperatures.
(d) Latitudinal location
This refers to the position of a place on the earth in relation to the equator. The areas near the equator have higher temperatures than areas far from the equator. The polar regions have lower temperatures.
(e) Altitudinal location
This is the location of an area measured from the sea level. Areas whose altitudes are high tend to have lower temperatures. Areas of low altitudes tend to have high temperatures.
(f) Nature of prevailing winds Winds
carry temperature and moisture from one place to another. Onshore winds cause lower temperatures on land. Winds which come from dry areas e.g. Hammatan winds cause high temperatures in the places they blow towards.
(g) The revolution of the earth round the sun
As the earth revolves around the sun, the solar altitude and the length of the day change. Hence, the intensity of the solar radiation (temperature) on the earth changes seasonally.
There is always a very powerful interaction between land and sea. This interaction involves movement of air and transfer of temperature. This happens through land and sea breezes.
(i) Ocean currents
Ocean currents are streams of water moving from specific areas, in particular regions with definite temperatures. Ocean currents are majorly of two types, warm and cold currents. Warm currents carry warm temperatures from the equator to areas they bathe. Cold currents originate from the polar regions and transfer cold temperatures.
(j) AspectAspect in this case refers to the degree to which an area is exposed to the sun. Some slopes are more exposed to the sun while others are shielded from the sun. Areas that are exposed to the sun will have higher temperature than those which are shielded.
(k) Cloud cover
The presence of clouds reduces both incoming and outgoing radiation. Thick clouds prevent solar radiation from striking the earth’s surface. This lowers temperatures of the land surface during the day.
(l) VegetationForested areas usually have cool temperatures. This is because the canopies of the trees act as an umbrella. They prevent solar radiation from striking the floor of the forest.
(m) Human activitiesHuman activities may influence temperature patterns which may cause global warming or cooling. Temperatures are higher in built-up areas like urban centres.
• Industries and motor vehicles also release a lot of carbon dioxide in the atmosphere. The carbon dioxide absorbs a lot of terrestrial radiation raising the air temperature.
• Burning large forests releases a lot of carbon dioxide. The carbon dioxide absorbs heat thus raising atmospheric temperatures.
• Clearing of forests also increases the amount of carbon dioxide in the atmosphere.

Work in pairs.
Work in pairs.
Use the Internet and other geographical documents.
1. Find out and explain other factors that cause variations in temperatures of different places.
2. Record your findings.
3. Present your findings in classroom
Calculations involved in determining the temperatures of a given area
Temperature is calculated in different ways. We can calculate:
• diurnal range temperatures
• mean daily temperature
• mean monthly temperature
• mean annual temperature
• mean annual range
(a) Diurnal range temperature
Diurnal range temperature = daily maximum temperature – daily minimum temperature.
For example: - If the maximum temperature of a day = 24°C and the minimum temperature of a day =14°C, then the diurnal range temperature will be: = 24–14=10°C
(b) Mean daily temperature
Mean daily temperature

Using the example in (a),
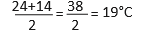
(c) Mean monthly temperature
The mean monthly temperature is the sum of mean daily temperatures divided by the number of days in a month. Suppose the total sum of the mean daily temperature of the month of June is 246.
The mean monthly temperature

(d) Mean annual temperature
The mean annual temperature equals the sum of mean monthly temperatures for a year divided by the number of months in a year.
Table 8.3 Mean monthly temperatures.
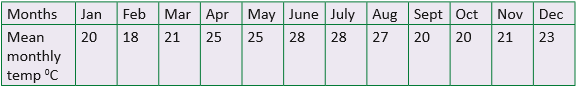
From Table 8.3, the mean annual temperature is
(e) Mean annual range
The mean annual range = the highest mean monthly temperature – the lowest mean monthly temperature. Using Table 8.3:
The highest mean monthly temperature = 28°C
The lowest mean monthly temperature = 20°C
Therefore the mean annual range = 28–20 = 8°C.

Do this individually.
1. Calculate the diurnal range temperature when the highest temperature is 30°C and the lowest temperature is 10°C.
2. Calculate the mean daily temperature of a place whose maximum temperature is 30°C and minimum temperature is 10°C.
3. Calculate the mean annual temperature of the year 2014 from the Table 8.4.
Table 8.4

(e) Calculate the mean annual range of temperature from Table 8.4.Precipitation

Study the photography below and use it to answer the questions that follow.

Fig 8.191. Describe the weather condition of the day shown in Figure 8.19.
2. Why is rain important to humans?
Precipitation is the deposition of moisture in liquid or solid form. The moisture falls from the clouds in the atmosphere onto the earth’s surface. Moisture falls in the form of rainfall, dew, mist, fog, sleet, snow, haze, and frost.
Forms of precipitation

Do this individually.
1. Observe the weather conditions in your home area in the morning on your way to school for a month.
2. Identify the forms of precipitation that your area experiences. You can also state if it is a sunny month.
3. Share your findings in class.
(a) Rainfall
This form of precipitation is made up of liquid water droplets. The droplets fall from the sky after condensation. Condensation refers to the process by which water changes its state from vapour to liquid. The moisture rises into the atmosphere, cools down and forms water droplets. These droplets form clouds. They then get heavy and yield water droplets. The water droplets are pulled towards the earth’s surface by gravity and falls as rain.
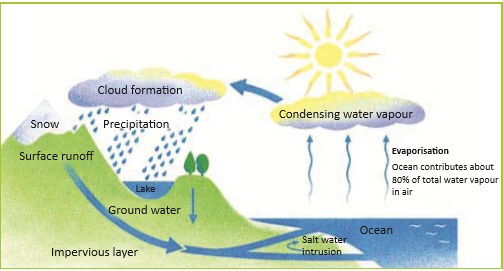
Fig 8.20 Formation of rainfall.
(b) Dew
During the night temperatures near the earth’s surface drop drastically. This makes moisture condense near the surface of the earth. The water droplets are formed on cold surfaces such as objects and vegetation. These droplets are called dew.
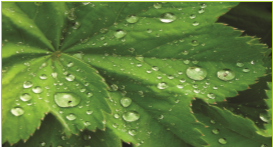
Fig 8.21 Dew
(c) Frost
When the temperatures are too low, the dew freezes. Frozen dew is called frost.

Fig 8.22 Frost
(d) Hoar-frost
In situations whereby the dew-point is below the freezing point, water moisture condenses directly. It then forms tiny ice particles on the cold surfaces. The ice particles are formed without passing through the liquid state. The process is known as sublimation.
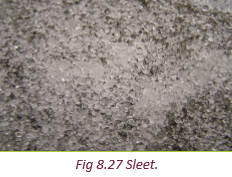
(e) Rime
This refers to super cooled droplets frozen on the surface of telephone poles, wires, and trees. Rime has a white opaque form because of the air confined in ice particles.

(f) Fog
This refers to the cloud of visible aggregates of minute water droplets. They are usually suspended in the atmosphere near the surface of the earth.
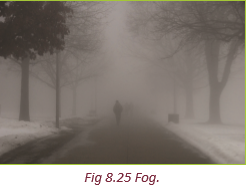
(g) SnowThis is frozen water particles from the higher atmosphere. It is a form of solid precipitation that is formed by sublimation of water vapour. When air temperatures fall below 0°C, the moisture in the air condenses. It then forms small ice crystals known as snowflakes. The crystals are then deposited on the ground as snowfall.

This is made up of a mixture of rain and snow or partially melted snow. The mixture then falls on to the surface of the Earth. Usually, this is formed when the surface of the earth is at or just above freezing point.
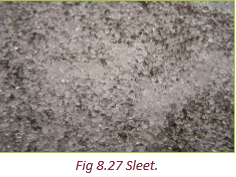
(i) Hail
This is frozen raindrops that build into spherical ice particles. It usually forms in the high clouds due to the uplift by convectional currents. As the raindrops are lifted higher by the rising air currents, they attract ice. They then begin to fall downwards due to the increased weight.

(j) Thunderstorm
This is a form of precipitation that is accompanied by thunder and lightning. Thunder is the explosion or bomb-like sound which occurs in the sky where there are thick clouds.
(k) Mist, fog, and haze
These terms have a direct relationship in terms of mode of formation. The difference is in the variations of how they affect the visibility of a given area.
Fog is used when the visibility is less than one kilometre.
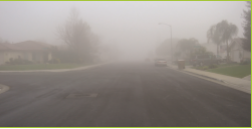
Fig 8.29 Fog.Mist is used when visibility extends to one kilometre.

Haze is the term used when the visibility is limited to between 1km and 2km as a result of dust or smoke.
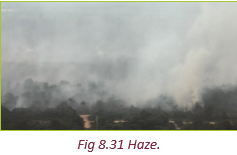
Smog refers to a mixture of fog and smoke. It is very common in industrialised countries like Germany and the Unites States of America.
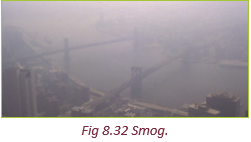
Task 8.31. Define the term precipitation.
2. List and describe various forms of precipitation.
The water cycle

Work in groups of three.
1. Collect sauce pans, water and a charcoal stove or any other source of heat.
2. Put water in a sauce pan to boil.
3. When it starts boiling, get a cold lid and hold it above the sauce pan.
4. Note down your observations for a class presentation.
The water cycle is a continuous cycle where water evaporates into the air, forms clouds and falls down as precipitation. It then evaporates again and repeats the same cycle. It is a never ending cycle. Water keeps moving and changing its state from solid to liquid to gas over and over again. This process is also referred to as the hydrological cycle.
The water cycle process
Stage 1: Evaporation
The sun heats the surface of the earth. This heat makes water from the earth’s surface and plants to rise into the atmosphere. Water rises in the form of moisture or vapour through evaporation and transpiration.
Stage 2: Condensation and sublimation
The rising moisture reaches the upper parts of the atmosphere where temperatures are low. It then condenses forming tiny water droplets that result in the formation of clouds. Under the influence of gravitational pull, the water droplets fall down onto the earth’s surface. It falls in the form of precipitation. When the dew-point is below freezing point the water vapour turns directly into ice crystals. The crystals fall in the form of snow. The snow is formed by sublimation.
This is the process through which moisture freezes without changing into liquid.
Stage 3: Infiltration, percolation and over-land flow/run off

Work in groups of three.
1. Go outside your classroom. Pour some water on the ground and observe what happens after 10 minutes.
2. Move to a rocky area or an area that has concrete. Pour water on the ground and observe what happens.
3. Relate your observation to different types of soils that you learnt about.
4. Discuss your findings in class on the rate of filtration and penetration of water on different surfaces.
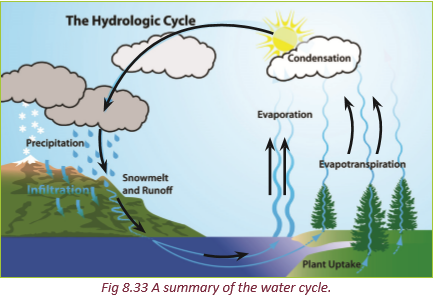
When the water droplets reach the earth’s surface, part of it infiltrates and percolates into the ground. This forms underground water.
The water finds itself back to the water bodies in springs and wells. When the soils are highly saturated, the water starts flowing onto the earth’s surface in form of run-off.
The water ends up into water bodies such as swamps, rivers, lakes, and oceans. Part of the infiltrated water is taken in by vegetation. When the sun releases its insolation it energises the processes of evaporation and transpiration. Moisture then rises back into the atmosphere. This whole process repeats itself. It is continuous.

Do this in pairs.
Study Figure 8.34 and answer the questions that follow.
Fig 8.34
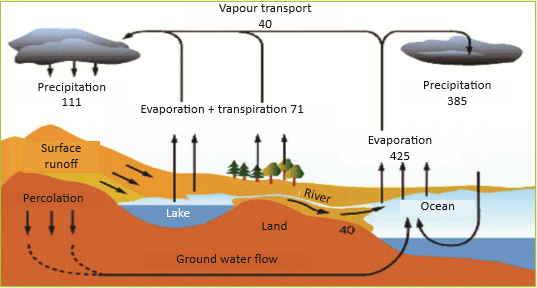
Fig 8.34
1. Describe what happens at every stage.
2. Explain what you think would happen if one process is omitted.
3. Suggest ways in which humans can maintain the water cycle in its normal state.
4. Record your findings and discuss them in a class presentation.
Types of rainfall

Read the passage below and aswer the questions that follow.
Manzi, Kasime and Shema are very good friends. The three friends come from different areas but study together in a boarding school in the Eastern Province of Rwanda. Manzi comes from Musanze District where there are many mountains. Kasime comes from Rubavu District near Lake Kivu. Shema’s home is near Nyungwe Forest.
1. In pairs, identfy the types of rainfall experienced in each of the areas where the students come from.
2. Explain the formation of the types of rainfall identified in (1) above.
3. Mention and describe the formation of type of rainfall that is expirienced in any of the areas mentioned above.
4. Advice the communities living in the areas mentioned on how to conserve the environment in order for them to continues receiving rainfall.
5. Discuss your finding in a class.
As you studied earlier, rainfall is one of the forms of the precipitation.
There are 3 types of rainfall.
- Relief (orographic) rainfall
- Convectional rainfall
- Cyclonic (frontal) rainfall The relief (orographic) rainfall
Formation of relief rainfall
1. The prevailing winds pick up moisture from water bodies as they travel across, making the air moist.
2. The moist air is forced to rise over mountains and hills.
3. This forces the air to cool and condense, forming clouds.
4. The air continues to be forced over the mountains and so it drops its moisture as relief rain.
5. On the top of the mountain, the air drops down the other side. It warms as it drops.
This means it has a greater ability to carry moisture. There is therefore little rain on the far side of the mountain. This area is called the rain shadow.
Note
(i) The side of a mountain that receives rainfall is called the windward side. The side that does not receive rainfall is known as the leeward side. It is sometimes known as the rain shadow side.
(ii) The leeward side remains dry because it is bathed by a dry downslope wind. The moisture in the downslope wind is trapped and dropped on the windward side.
Areas in Eastern Africa where such rainfall is received include:
- The highlands of Rwanda – Northern and Western provinces
- Western side of Mt. Ruwenzori in Uganda
- Mt. Elgon
- Kenyan highlands.
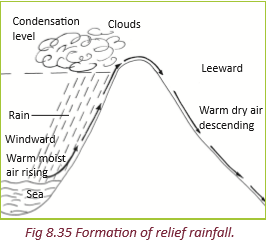 Convectional rainfall
This type of rainfall is very common in areas where the ground is heated by the hot sun. It mostly occurs in the tropics. This is why these areas experience heavy rainfalls most afternoons.
Formation of convectional rainfall
1. The surface of the earth is heated by the sun.
2. The warm surface heats the air above it. Hot air always rises so this newly heated air rises.
3. As it rises, the air cools and begins to condensate.
4. Further rising and cooling causes a large amount of condensation to occur and rain is formed.
5. Convection produces towering clouds, which produce heavy rain and possible thunder and lightning.
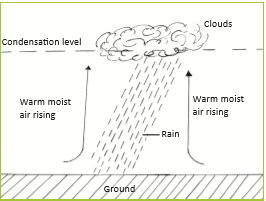
Fig 8.37 Formation of frontal rainfall

1. Describe the type of rainfall that occurs in your home and school neighborhood.
2. Using a well-labelled diagram, describe how it is formed.
3. Suggest ways in which the environment should be cared for to ensure reliable rainfall.
4 Discuss your findings in class.
Measuring rainfall

Work in groups of five with the guidance of your teacher.
1. Find out how to make a rain gauge.2. Make one for use in your school .3. Place it in an appropriate location within your school compound.4. Measure the amount of rainfall that is collected daily for two months.5. Calculate the daily rainfall totals and the mean monthly rainfall.Rainfall is measured using a rain gauge. A rain gauge has an outer cylinder within which there is a funnel that drains into a collecting bottle. A part of it is buried in the ground while the top part remains above the ground.
The following important conditions should be observed when placing a rain gauge in a place.- It should be situated in an open space where there are no trees, houses or buildings. The place should also be free of surface run off. This is to ensure thatbthe rain to be measured is as actual as possible. If it is placed under trees orbin front of houses, it will give wrong readings. This is because more water will collect in it.
- Part of the rain gauge (about 30 cm) should be left above the ground. This is to prevent the run-off and splash water from entering the measuring jar.
- The bottom part of the rain gauge should be partially buried. This is to reduce or stop any evaporation from the jar. If this is not done, part of this water collected in the jar can evaporate. This will happen when the temperatures are high.

Fig 8.38 The structure of a rain gauge
Measuring rainfall
Rainfall can be measured as:• Daily rainfall• Total monthly rainfall• Mean monthly rainfall• Total annual rainfall• Mean annual rainfallDaily rainfall
This is the amount of rainfall collected in a rain gauge at a weather station in a day.Total monthly rainfallThis is obtained by adding the figures of the daily rainfall for a period of one month.Table 8.5: Daily rainfall totals in April for Nyamirambo.

TR = traces
From Table 8.5 the rainfall total for the month of April in Nyamirambo is 266.1 mm.
Mean monthly rainfallMean monthly rainfall is calculated by adding all monthly rainfall totals for the year and dividing by 12.Table 8.6 Total annual rainfall.
Month J F M A M J J A S O N D Total Mean monthly rainfall in mm 26 10 61 202 322 107 88 65 56 84 94 60 1,181 Mean annual rainfallThis is the average rainfall of a place. It is calculated after a period of years such as 15 years. The annual rainfall totals are collected for a period of 15 years. They are then added and the sum divided by 15.Task 8.4
1. With help of appropriate illustrations, describe the major types of rainfall.2. Study the table below, showing areas which receive rainfall. Fill in the appropriate types of rainfall experienced.
3. (a) Explain how rainfall is measured.
(b) State reasons to why it is necessary to measure rainfall.4. Explain the factors responsible for the formation of rainfall.Atmospheric pressure

Work in pairs.
1. Define atmospheric pressure.2. State and explain the factors that influence atmospheric pressure.3. Discuss your finding in a class.Atmospheric pressure refers to the weight exerted by the atmosphere over the Earth’s
surface. Atmospheric pressure is greater on the ground surface and greatest at the sea level. It decreases with an increase in altitude. Atmospheric pressure varies from place to place.Factors that influence atmospheric pressure
Atmospheric pressure is influenced by three factors.- Altitude
- Temperature
- Rotation of the earth.
(a) Altitude
This refers to the height of a given place in relation to the sea level. Areas closer to the sea level support a high column of air above them. This air exerts much pressure.Hence, atmospheric pressure is higher in areas near the sea level and lower on the mountains.
Fig 8.39 Differences in atmospheric pressure.
(b) Temperature
High temperatures cause low pressure while low temperature cause high pressure. In hotwarm regions, heated air becomes lighter and rises. This causes low pressure.In areas with low temperature, air is cold and dense. The air sinks and exerts pressure on the surface. This causes high pressure.(c) The earth’s rotationDuring the rotation of the earth, air is thrown from the equator towards the poles. As the air moves towards the poles, it crosses over latitudes which are reducing in size. This leads to high pressure.On the other hand, air blowing from the polar region crosses over widening latitudes. This leads to low pressure.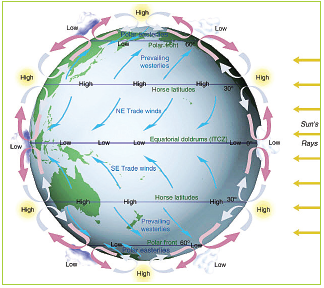
Fig 8. 40 Global pressure belts.

Locate zones of high and low pressure on the earth’s surface on the map shown below.

Fig 8.41
Measurement of atmospheric pressure
Study the diagram representing a mercury barometer and answer the questions that follow:
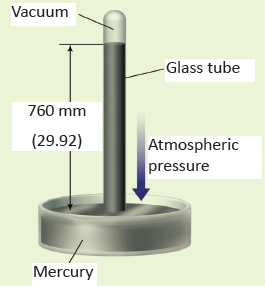
Fig 8.42
1. Explain why the arrow shown on the diagram points down wards.
2. What is the atmospheric pressure experienced in the area where the above mercury barometer was used?3. State the units used in measuring the atmospheric pressure.4. Explain how the above instrument operates.5. Discuss you findings in a class presentation.Atmospheric pressure is measured using an instrument called a barometer. It is measured in millibars.
There are two kinds of barometers. These are:(a) the mercury barometer
(b) the aneroid barometer.The mercury barometer
A glass tube graduated in centimetres or inches and closed at one end is filled with mercury. The tube is then inverted and the open end immersed into a dish of mercury.The mercury flows out of the tube into the bowl. It does so until the weight of its column is balanced by the pressure of the atmospheric pressure exerted on it. This means the mercury adjusts itself until its weight in the column is equal to the weight of the air pressure.When the pressure of the atmosphere increases, it exerts weight on the mercury in the dish. The mercury in the tube rises. The atmospheric pressure is obtained by reading the level of the mercury on the graduated tube. When the pressure decreases, the height of the mercury in the tube drops. The length of the column of mercury indicates the air pressure.
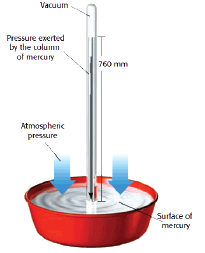
Fig 8.43 Mercury barometer
The aneroid barometer
This is a smaller and more portable barometer. It consists of a vacuum metal box or capsule with a spring inside. This spring prevents it from collapsing. One end of the spring is firmly fixed to the frame of the barometer. The other end is free to move with changes in atmospheric pressure. Alever is fixed to the movable end of the spring. The lever moves a pointer over a dial graduated in millimetres.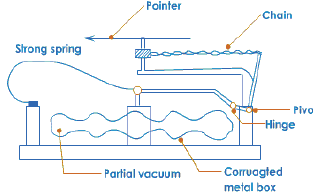
Fig 8.44 An aneroid barometer.
The metal bar or capsule is sensitive to pressure changes. It compresses when pressure increases and expands when pressure decreases. The spring in the box or capsule correspondingly moves. It allows the pointer to indicate the pressure of the atmosphere on the dial. The atmospheric pressure is obtained by reading the figure indicated by the pointer.
On some aneroid barometers, pressure is automatically and continuously printed on a revolving drum. This drum is inside the barometer. The pressure is printed on a graph known as a barograph.
Task 8.5
Use the diagram below to answer the questions that follow.
1. .(a) Name the pressure belts marked X, Y and Z.
(b) Explain the reason for the occurrence of the atmospheric pressure at location Y.(c) Why are polar regions associated with high pressure cells?2. State and explain any three factors that influence the atmospheric pressure of a given area.3. Explain the effects of atmospheric pressure on temperature and winds.4. Study the diagram below and answer the questions that follow
(a) Name the instrument.
(b) State the element of weather measured using the above instrument.(c) Explain how the above instrument works.Humidity

Read the short story below and answer the questions that follow.
Miss Batamuliza is a day scholar in one of the secondary schools in Musanze district. She walks for five kilometres every day to school. She passes through the rocky slopes that decorate the beautiful landscape of the region. She struggles to see what is ahead of her as she walks because of a cloudy substance that blurs her vision. This condition is a common occurrence in her area.One day she woke up earlier than usual. She wanted to go to school to do her assignment.
After walking for two kilometres, she was covered by the tiny water droplets that stuck to her hair.Despite the cold and the dampness, she still went on with her journey. In a few minutes, several droplets of water began rolling down her face. She thought it was drizzling. Her bag and sweater became damp.She soon reached school. She observed that some of her classmates who arrived after her were cold and damp. Later that day when she went home, she requested her parents to take her to a boarding school. She wanted to become a medical doctor like her brother.
(a) What were the tiny water droplets?
(b) As a geography student, explain what was taking place when water droplets started rolling down from Miss Batamuliza’s forehead.(c) Which element of weather caused Miss Batamuliza’s agony on her journey to school?(d) What was limiting Miss Batamuliza’s visibility?Humidity refers to the amount of water moisture in the air that surrounds the earth.
Humidity displays the degree of wetness of the atmosphere. It is one of the major influences of the atmospheric weather.The water vapour is obtained from water bodies and the ground surface through evaporation. It is also obtained from plants through transpiration. The amount of water vapour in the air largely depends on temperature, the size of water bodies present and prevailing winds. Places with large water bodies and high temperatures have high amounts of water vapour .Areas with no water bodies have little amounts of water vapour. Areas with low temperatures also have limited amounts of water vapour. Onshore and calm winds facilitate build up of water vapour on land. Offshore and very strong winds blow away water vapour from the land.
At any one time, at a given temperature, there is a limit to the amount of moisture that the air can hold. When this limit is reached, the air is said to be saturated.Warm air can hold higher amounts of water vapour than cold air. As a result, the amount of rainfall received from warm air is more than that received from cold air.Humidity is expressed either as absolute humidity or relative humidity.
(a) Absolute humidity

Your teacher will take you for a field visit to a weather station near your school.
1. Ask the resource person at the station to show you how to measure humidity using the instrument at the station.2. Measure the humidity in the atmosphere at the station.3. Record your findings.Absolute humidity refers to the actual amount of water vapour present in a certain volume of air at a given temperature. The absolute humidity is expressed in grams per cubic metre (g/m3). Absolute humidity is high when temperature is high. This is during the day and in summer. Areas that experience high temperatures throughout
the year have high absolute humidity. Such areas include the equatorial zones. This happens in areas with large water bodies and heavy rainfall.(b) Relative humidity
This is the ratio between the actual amount of water vapour present in a given mass of air to the maximum amount of water vapour that the same air can hold at the same temperature. It is expressed as a percentage.
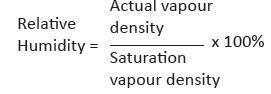
Suppose the actual vapour density is 47 and the saturation vapour density is 98. Calculate the
relative humidity.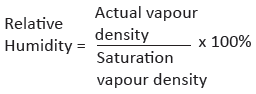
Then, the relative humidity will be calculated as follows:
The relative humidity in this case is 47.96%.
This implies that the same mass of air at the same temperature still requires 47.96% to reach saturation.Factors that influence the amount of humidity
The amount of humidity varies from time to time. It also varies from place to place. Thisvariation occurs due to the following factors.Precipitation
This plays a great role determining the quantity of humidity in the atmosphere.Areas that receive heavy rainfall regularly have more water moisture hence creating humid conditions. On the other hand, areas with arid conditions will have little or no water vapour.Air temperature
This determines the rate of evaporation and transpiration. When the temperatures increase, evaporation and transpiration increase too. These processes steadily supply the atmosphere with water vapour. The opposite happens when the temperatures decline.
The prevailing winds
Winds which are warm and moist carry a lot of water vapour to the areas they blow to.Cold and dry winds limit the level of humid conditions.Plant cover
Forested areas with dense vegetation cover have high humidity. This is due to intense transpiration and other related geographical aspects that increase water moisture. Areas with little vegetation cover have less humidity.The presence and size of water bodies Water bodies of reasonable sizes enable areas where they are located to have humid conditions. This is due to evaporation that continuously supplies water vapour to the atmosphere. Regions that have few or lack water bodies have less humidity dueto limited supply water moisture.Latitude
The amount of water vapour in the atmosphere is higher at the equator and the tropics. It is lower at the temperate and polar regions.Atmospheric pressure
The higher the atmospheric pressure, the lower the amount of water vapour in the air. The lower the atmospheric pressure, the higher the amount of water vapour.
Do this in pairs.
Use the Internet and geographical documents.1. Explain other factors that influence humidity.2. Record your findings and present them in a class discussion.Measurement of humidity
Humidity is measured by an instrument known as a hygrometer. Though there are a variety of hygrometers, the commonly used is the psychrometer. It is often known as the wet-bulb and dry-bulb hygrometer. There is a modern instrument also used to measure humidity. It has a self-recording system and it is called hygrograph.Wet-bulb and dry-bulb hygrometer
This has a muslin bag (wet-bulb hygrometer) that is kept wet all the time. When the moisture reduces through evaporation, latent heat also lowers. It cools the wet- bulb and as a result mercury contracts showing the readings. The dry-bulb hygrometer has no muslin bag. It is entirely affected by the moisture in the surrounding air.
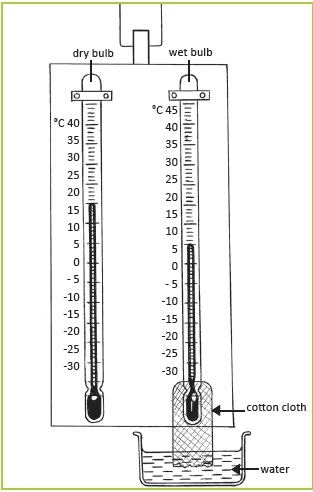
Fig 8.47 A simple hygrometer
Humidity levels are therefore derived from the difference existing between the two readings. This is when the air has not reached saturation levels.
Table 8.7 Interpretation of the readings of the psychrometer.
Nature of the readings Description of humidity levels A very big difference between the readings of the wet bulb and dry bulbhygrometers.Very low humidity A very small difference Humidity is high. The same readings The air is saturated. Winds

Go outside your classroom.
1. Observe trees and hanged clothes.2. Cut small pieces of leaves and put them down.3. Observe what happens to them.4. Throw chalk dust into the air.5. Record your observations for a class discussion.
Use the photographs provided below to answer the questions that follow
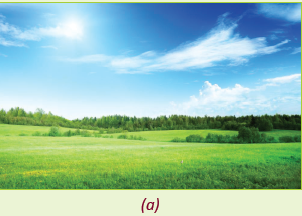
Fig 8.48
1. Describe the photographs (a), (b) and
(c) while relating them to weather conditions.2. In which photograph is air calm?3. Why do you think there are calm conditions in photograph (a)?4. Examine the effects of the element of weather identified in photographs (b) and (c).Wind is defined as moving air. Winds range from a gentle breeze to the fastest and most damaging winds. Wind plays a great role in influencing weather as well as climate. If there were no winds, it would be hard for water vapour to reach the upper layers of the atmosphere. Therefore, condensation would not take place and no clouds and rainfall could be formed. Wind moves from
a zone of low pressure to a zone of high pressure. It moves in a horizontal manner.Types of winds
There are essentially two types of winds.
- Local winds
- Global winds.
Local winds
Local winds are associated with specific areas. They are also directly influenced by the local environment. Such winds cover a small area. They include the following.
- Land breeze
- Sea breeze
- Katabatic and anabatic winds
- The Chinook/Fohn winds.
- The monsoon winds.
(a) Land and sea breezes
These are air circulations which occur locally along the shores of water bodies suchlakes and oceans. They are influenced by variations in temperatures between land and sea respectively.
Sea breeze
During the day, the land warms up faster than the neighbouring water body. The air over the land gets heated. It expands, becomes light and rises. Low pressure develops over the land surface. The water surface which takes a longer time to warm, remains cooler than the land surface. The
low temperature over the water surface leads to the development of a high pressure.
Wind therefore blows from the water body to the land.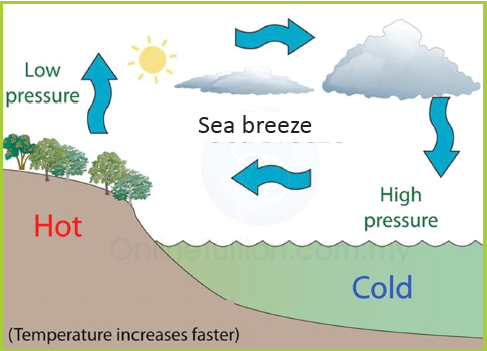

Fig 8. 49 Development of a sea breeze.
Characteristics of a sea breeze
• The wind is fairly strong.
• It blows in the afternoon from a water body towards the land.
This is because by this time both the land and the water body have been heated. This creates a distinct pressure difference.• The wind is relatively cool.
Land breeze
At night, the land cools faster then the sea. This leads to low temperature over the land. The air molecules over the land becomes heavy leading to development of high pressure. The warmer and lighter air over the water rises. This results into low pressure over the water body. Wind therefore blows from the land to the sea forming a land breeze.
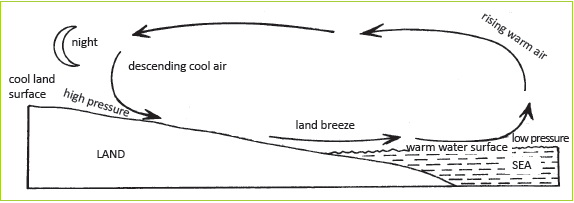
Fig 8.50 Development of a land breeze.
Characteristics of the land breeze
• It is a light wind.
• It blows at night.
• It is weak compared to a sea breeze. This is because the pressure difference between the water and the land surface is small.
Areas that experience these breezes include the areas near Lake Kivu, Lake Victoria and Lake Tanganyika.Weather conditions associated with land and sea breezes
(a) Sea breezes have cooling effects on the adjacent coasts on hot afternoons in the tropical regions.
(b) Sea breezes also lead to formation of convetional rainfall on the land in late afternoons. This is common in areas around Lake Victoria and the coastal regions.
(c) Land breezes lead to the development of heavy rainfall accompanied by thunderstorms and strong winds. This occurs on water at night.Katabatic winds
At night, the upper parts of mountains lose heat faster than the lowland areas such as valley bottoms. This creates a high pressure zone on the upper slopes and a low pressure cell within the valley.
The cold air from the upper slopes descends towards the valley. This air descends under the influence of gravity. The descending cold wind is called the katabatic wind. It is also sometimes known as the mountain breeze.

Fig 8.51 Development of a mountain breeze(katabatic winds).
Characteristics of mountain breeze
• It is cold and dense.
• It blows at night down a mountain slope.• It is gentle.
Weather associated with mountain breeze
(a) It creates a temperature inversion in the valley. The air above the valley bottom is warmer than the surface.
(b) It leads to formation of fog or mist in valleys in the early morning hours. These weather conditions are common in highland areas and escarpments bordering highlands.
(c) It causes frost and chilly conditions in the valleys.
(d) It is associated with dry conditions.Anabatic winds
During the day, the sun’s rays reach the mountain slopes more than valleys. This results into a low pressure zone along upper slopes. The air continues heating up and expands eventually rising into atmosphere.
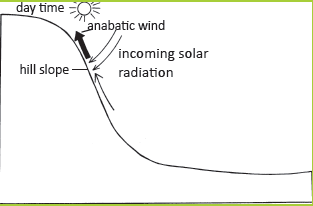
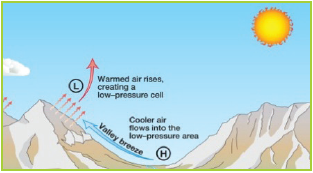
Fig 8.52 Development of a valley breeze (anabatic winds).
Within the valley, the sun’s rays are not intense. The cool conditions lead to the formation of a high pressure zone. The warm air is therefore forced to rise by the adjacent cooler denser air in the valley.
This allows cooler air from the valley to start rising against the slopes. The air rises to replace the warm air that expanded and rose. This is sometimes known as the valley breeze.Characteristics associated with the anabatic wind
• It is a warm light wind.
• It blows upslope during the day.Weather conditions associated with anabatic winds
(a) They lead to the formation of cumulo-nimbus clouds. These clouds yield heavy rainfall accompanied by thunderstorms on the mountains.
(b) The valley remains without mist or fog.The Chinook or Fohn winds
These winds are formed when the warm moist winds blow against the mountain. As they blow, they drop the moisture in form of precipitation on the windward side. After moisture is dropped, winds descend on the leeward side. They begin to warm up due to adiabatic compression.
These winds are dry and warm leading to dry conditions along the leeward side of the mountain. The chinook is an American word which means “snow eater”. This is because the wind is associated with rising temperatures that result into snow melt. When these winds are still on the windward side they are not yet chinook. These winds are common on the eastern slopes of the Rocky Mountains in the USA and in the Alps Mountains in southern Europe. They are called the Fohn winds in the Alps and Chinook in the Rocky Mountains.
Fig 8. 53 Fohn wind descends the mountain as a warm dry wind.
The monsoon winds
A monsoon is a seasonal shift in the prevailing wind direction. It usually brings with it a different kind of weather. Monsoons cause wet and dry seasons throughout much of the tropics. They are
often associated with the Indian Ocean.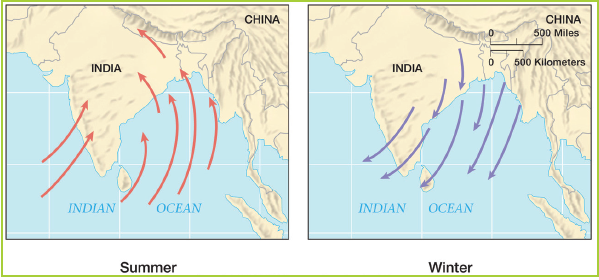
Fig 8.54 The direction of the monsoon winds in summer and in winter.
Monsoons always blow from cold to warm regions. The summer monsoon and the winter monsoon determine the climate for most of India and Southeast Asia. It blows from the southwest in summer and from the northeast in winter. In India and nearby lands, the season during which the southwest monsoon blows has heavy rains.
The harmattan wind
This wind originates from the Sahara desert. It is associated with a lot of dust. It usually results into a decrease in temperatures due to the dusty haze created. When it occurs, visibility is reduced to a kilometre or even less.
Fig 8.55 The harmattan wind.
Sirrocco winds
These are hot winds carrying large quantities of dust in North Africa. They usually blow between February and June. They share similarities with the harmattan winds.
Do this in pairs.
1. Use the Internet and geography textbooks to find out other examples of local winds.
2. Describe their characteristics and effects on land where they occur.
3. Record your findings and present them during a class discussion.The global winds

1. Describe the different types of global winds.
2. Locate the global winds by filling in the names of the winds in the map of Figure 8.56.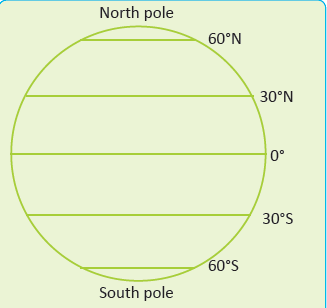
These winds operate between latitudes and cover a huge area or region. They include
the following.
The trade winds
The westerlies
The polar easterlies
As earlier mentioned, global winds cover a larger region and interplay between latitudes.Trade winds
The trade winds are the easterly surface winds found in the tropics. They are found within the lower portion of the earth’s atmosphere near the earth’s equator. The trade winds blow predominantly from the northeast in the Northern Hemisphere. They form the North-east trade winds.
They also blow from the south-east in the Southern Hemisphere. Here they form the south-east trade winds. They strengthen during the winter and when the Arctic region is in its warm phase.They blow from the subtropical high towards the equatorial trough. They migrate with the pressure belts north and south of the equator.

Fig 8.57 Trade winds.
The westerlies
These are prevailing winds that blow from the west toward the east in the middle latitudes. They blow between latitudes 30 and 60 degrees. They originate from the high-pressure areas in the subtropical latitudes and blow towards the poles.
The westerlies are strongest in the Western Hemisphere and at times of low pressure over the poles. They are weakest in the Southern Hemisphere and when pressures
are higher over the poles. The westerlies are particularly strong in areas where land is absent. This is because land intensifies the flow pattern, making the current to flow in a north – south direction. This action slows down the winds. The strongest westerly winds in the middle latitudes occur between the 40 and 50 degrees latitudes.
The westerlies carry the warm, equatorial waters and winds to the western coasts of continents. This happens more in the Southern Hemisphere because of its vast oceans.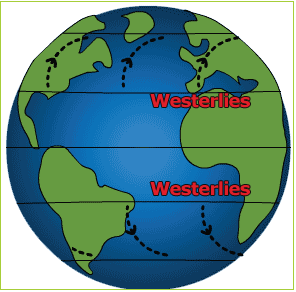
Fig 8.58 Westerlies.
The polar easterlies
The polar easterlies are the dry, cold prevailing winds that blow from the highpressure areas of the north and south poles towards low-pressure areas. Cold air subsides at the poles creating the high
pressure. This pressure causes air to flow outward towards the equator. The outflow is then deflected westward by the Coriolis effect. This results in the easterlies.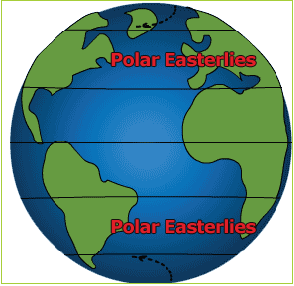
Fig 8.59 Polar easterlies.
Table 8.8 below shows a summary of the global winds.
Table 8.8 Global winds
Wind system Description The polar easterlies • Their origin is in the polar regions.
• They blow towards the temperate areas 60° north or south of the equatorThe westerlies • They originate from the sub-tropical high pressure zone.
• They move towards the temperate low pressure belts.
• They begin as south westerlies but deflect hence generally named westerliesThe northeast trade winds • They begin from the sub-tropical high pressure zone.
• They move towards the equatorial low pressure areas.
• They are only found in the Northern Hemisphere.
• They are situated within 30°N.The southeast trade winds • They originate from the sub-tropical high pressure zone.
• They blow towards the equatorial low pressure areas.
• Their latitudinal location is within 300S.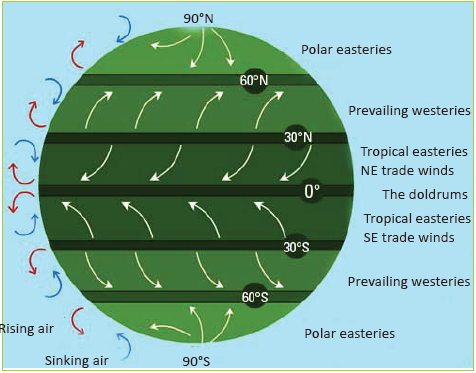
Fig 8.60 Global winds.
Measurement of wind
Wind is measured in terms of direction and speed. The instruments used in these measurements are:
- wind vane for wind direction
- cup anemometer for wind speed
- wind sock for the wind strength and direction.
Wind vane

Work in groups of five.
1. Use local materials from your environment to make a wind vane.
2. Place it in a place where wind direction can be determined.
3. Read the direction of the wind and share your findings in class.This is an instrument used to show wind direction. It has a pointer that looks like an arrow with a broad base. The head always points to the direction of the wind.
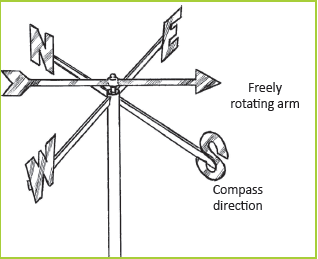
Fig 8.61 A wind vane.
The direction of wind is always determined as the direction from which the wind blows.
For example, wind blowing from west to east is always defined as west wind.
Modern wind vanes are electronically connected to a calibrated dial. The dial has degrees and compass directions, as shown below:
East wind is specified as 90°
South wind is specified as 180°
West wind is specified as 270°
North wind is specified as 360°Cup anemometer
This is the most accurate instrument used in measuring the speed of wind. It is accurate especially in measuring the horizontal wind speed. The cup anemometer has cups which when blown by the wind, generate a weak electric current. The current drives the pointer that is connected to standardized readings on a dial. The readings are in metres per second, kilometres per second or miles per second.
The more the wind speed, the more the rotations and generation of electric current.
Hence, the pointer will point on high metre readings.
Fig 8.62 Cup anemometer.

With the guidance of your teacher, visit a
weather station near your school.
1. Identify a cup anemometer at the station.
2. Ask the resource person to show you how to read the speed of wind.
3. Read the wind speed at the weather station.
4. Record your findings.The windsock
The windsock measures the strength and direction of wind. When the wind’s strength is weak, the sock points downwards. When it is great, it blows out almost at right angle.
Windsocks are mostly used in airports.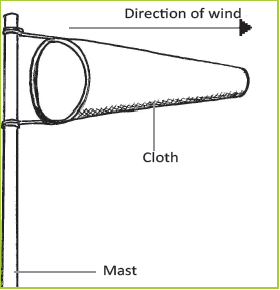
Fig 8.63 Windsock.

Work in groups of three.
1. Tie a paper bag onto a long pole or stick.
2. Place it firmly in a good place where the winds can reach.3. Determine the wind direction using a compass.
4. Observe its behaviour and record down your observations.
5. Use the findings in class discussions.Task 8.6
1. Define wind.
2. (a) Explain how winds influence the climate of a given area.
(b) With the help of diagrams, describe how the following are measured.
(i) Wind direction
(ii) Wind speed
(iii) Wind strength
3. Distinguish between the following.
(a) Land breeze and sea breeze.
(b) Hamattan and Sirocco winds.
(c) Katabatic and anabatic winds.
4. (a) With the help of a diagram, describe how the chinook winds are formed.
(b) Examine the effects of Chinook winds in areas where they occur.Clouds

Do this in pairs. Go outside the classroom and look up into the sky. What do you see?
1. Note down the colour and characteristics of the sky above you.
2. Write down the findings.
3. Draw and colour the sky that you have observed.
4. Have a class for a discussion on your observations.Clouds are tiny water droplets or ice particles suspended in the air. They form when water vapour condenses into water droplets or ice crystals. They condense around particles such as smoke, dust or salts that are found moving in the atmosphere.
Types of clouds
Clouds are classified according to their height, appearance, shape and altitude.
They are generally classified into four.- High clouds – 6,000 to 12000 metres
- Middle clouds – 2,100 to 6,000 metres
- Low clouds – below 2,100 metres
- Clouds of great vertical extent – 1,500 to 9,000 metres
High clouds
Clouds Characteristics Cirrus • They are made of crystals that give them an appearance of white colour.
• They are the highest clouds in the atmosphere.
• They are thin and detached.
• They are feathery with tail filaments.
• They yield no precipitation.Cirrocumulus • They are made of ice crystals.
• They are white in colour.
• They look like soap foam.
• They are made of thin layers and rows of rounded masses with a ripple appearance.
• They yield no precipitation.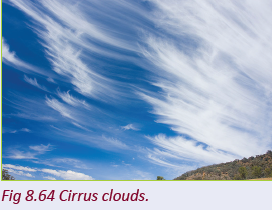

Cirrostratus • They are made of ice crystals which give the clouds a milky appearance.
• They are thin veil-like sheets or layers that cover much or all the sky.• When the sun or moon shines through them they form a ring of light around (halo).

Middle clouds Altocumulus • They consist of water droplets and some ice crystals.
• They are whitish-grey in colour.
• They form waves of lumps separated by patches of blue sky.
• They look like piled up cotton wool.
• They have flattened bottoms.• They yield small amounts of precipitation.
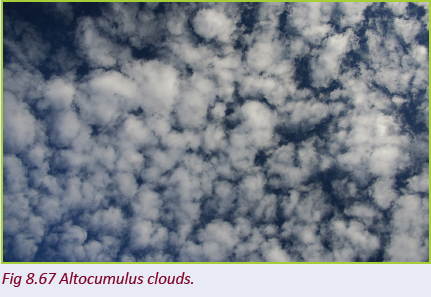
Altostratus • They consist of water droplets and some ice crystals.
• They are grayish in colour.
• They form uniform sheets of watery-looking clouds. These sheets
partly or totally cover the sky, reducing the brightness of the sunor the moon.

Low clouds Stratocumulus • They mainly consist of water droplets.
• They are dark grey or smoky in colour.
• They are large globular and bumpy looking with an appearance
of long rolling rows.• They occasionally yield showers.
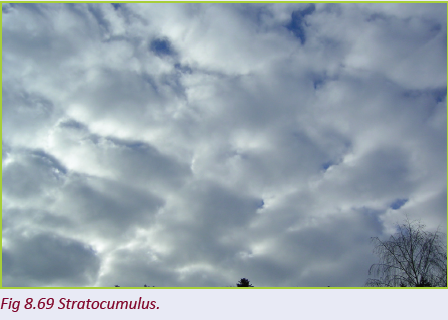
Stratus • They consist of water droplets.
• They form a low uniform layer resembling fog.
• They are greyish white in colour.• They are associated with dull weather and drizzle.
Nimbostratus • They consist of water droplets.
• They are thick and dark grayish-black in colour.
• They are shapeless and may have darker patches beneath them.• They yield continuous rain.
Clouds of great vertical extent Cumulus • They consist of water droplets.
• They are thick white clouds.
• They have a flat base and sharp outlines.
• They occur as isolated heaps. They look like cauliflower or heaped cotton wool.
• They develop into a thick vertical extent because they are convectional in type.• They are associated with intermittent sunshine and occasionally short-lived showers.

Cumulonimbu • They are made of water droplets at the lower levels and ice crystals at the highest levels.
• They have a great vertical extent rising from a height of about 2100 metres to 9000 metres above the ground.
• They are big, heavy and black in colour with a flat base.
• The top of the cloud spreads out assuming the shape of an anvil.
• Cumulonimbus clouds are associated with convectional currents which create rapid movement and mixing of air particles, leading to very heavy rainfall accompanied by thunder and lightning.• They are associated with rain showers and hail. The showers are heavy and violent.


Fig 8. 74 Clouds at different altitudes.
Work in groups of three.
1. Go outside your classroom.
2. Look up into the sky.
3. Identify the different types of clouds that are up in sky.
4. Give the correct characteristics of the clouds that you identify.
5. Draw and colour the clouds identified.
6. Present your findings in a class discussion.
Sunshine
Your teacher will take you for a visit to a weather station.
1. Identify a Campbell-Stokes sunshine recorder.
2. Ask the resource person at the station to show you how to measure sunshine.
3. Measure the sunshine at the station at that particular time.
4. Explain how you can measure sunshine in your school using a Campbell-Stokes sunshine recorder.
5. Record your findings.
6. Discuss them during a class presentation.
This is the light or solar radiation that is received on the earth’s surface from the sun. The amount and duration of sunshine received on the earth’s surface is determined by:
• cloud cover
• aspect
• latitude.
Thick cloud cover reduces the amount of sunshine and consequently its duration. The sunshine is more intense when the sky is clear.
In the Northern Hemisphere, the south facing slopes receive more sunlight than the north-facing slopes. Places near the equator get more sunlight than polar regions. The amount of sunshine in a place is recorded as a mean of sunshine hours per day.Sunshine is measured using an instrument
called the Campbell-Stokes recorder.
Campbell-Stokes sunshine recorder
This is a glass which has a sensitized calibrated paper on a metal frame.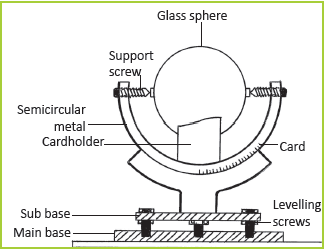
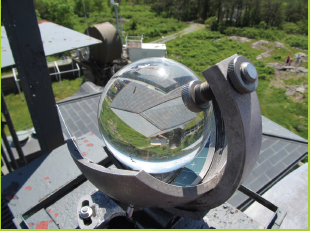
Fig 8.75 A Campbell Stokes sunshine recorder
The glass is put in a position where it is possible for the sun’s rays to focus on the sensitised paper. When the sun shines, the paper is burnt and produces a burnt line.
In case the sunshine is continuous, a line will be completely burnt. If there are some variations, some gaps will be shown. All parts of the burnt line are then added up to determine the number of hours of sunshine.
Factors that influence climate
Use the geographical knowledge that you have so far gained about climate.
1. Find out and give factors for the variation of the following elements of weather and climate in the area near your school.
• Rainfall
• Pressure
• Temperature
• Humidity
• Rainfall
• Sunshine
• Wind
2. Write a detailed report on the factors given.
3. Present your findings in a class discussion.
Some of the factors that influence climate include the following:
(a) Latitudinal location
The latitude of an area determines the amount of the sun’s insolation received in the area. The movement of the sun is specific. When it is overhead in a given area the temperatures increase. It is for this reason that the equatorial regions are warmer than the temperate and polar areas.
(b) Altitude
This has a direct influence on temperature, precipitation and atmospheric pressure.
Areas that are mountainous and hilly have a cool climate. The atmospheric pressure at high altitudes is also low.
(c) Presence and absence of water bodies
These two factors modify the climatic conditions of areas. Areas that are near water bodies are humid. On the other hand, areas which lack water bodies are less humid thus have unreliable rainfall. This is with the exception of mountainous areas.
(d) Vegetation
Areas with dense vegetation such as the Amazon and Congo Basins, experience heavy rainfall and humid conditions. This is due to the steady supply of water vapour due to transpiration. On the other hand areas with no vegetation experience arid conditions. It is for this reason that it is
important for us to conserve our forests .
(e) Distance from the sea
Regions neighbouring the sea experience maritime climate. When the sea water is warm, the coastal areas also experience warm conditions. These conditions increase the rate of evaporation and rainfall is formed. Areas far away from the sea may experience less rainfall.
(f) Human activities
Human activities greatly influence the climates of different regions. Activities such as mining, deforestation and lumbering have negative effects on climate.
(g) Ocean currents
Warm ocean currents carry warm conditions to the neighbouring areas. The currents are associated with warm, wet winds that lead to wet conditions. On the other hand, cold ocean currents cause cold temperatures.
They are usually are associated with cold, dry winds that increase the arid conditions of the areas.
The nature of the land has a direct influence on climate. For example, hilly and mountainous areas are associated with orographic rainfall. However, it is only on the windward side that constant rainfall is experienced. The leeward sides experience dry conditions. These conditions are due to
the warm, dry descending winds.
Do this in pairs.
1. Observe the area around your home and school.
2. Identify the human activities going on in the areas around your home and school
3. Explain how the human activities influence the climate of the areas.
4. Explain how the climate influences the human activities that are carried out in the two areas.
5. Use geography textbooks, journals and the Internet to find out other factors that influence weather and climate.
6. Compile a report of your findings and present them in class.
Project work.
Do this as a class.
1. Design a project that will assist the communities around your school to conserve and protect the environment.
2. Present your reports and recommendations to the community heads through your teacher.
Task 8.7
1. Outline the factors that influence humidity in a given area.
2. Explain the following types of precipitation:
(a) rainfall
(b) sleet
(c) snow
(d) frost
3. Describe the characteristics of the following types of clouds:
(a) cirrus
(b) stratus
(c) cumulus nimbus.
4. Differentiate between mist, fog and hail stones.
5. Explain the type of rainfall received at:
(a) the equator
(b) Mt. Karisimbi.
(c) Write down the observations for a class discussion.
Climate zones are areas with distinct climates. They occur in the east-west direction around the Earth. These areas are classified using different climatic characteristics. Climate zones are belt shaped and circular around the poles.
In some areas, climate zones can be interrupted by mountains or oceans. The
world has different climatic characteristics in different regions. These variations in climatic patterns makes it possible to divide the world into different climatic zones. The classified zones are not perfect but they work. Basing on the climatic differences, there are four major climate zones of the
world.
• Tropical zone
• Temperate zone
• Polar zone
• Mountain zone
Tropical zone
This is the zone between latitudes 0° and 23.5°. This is between the tropics.
The region between the equator and the tropics is known as the equatorial region.
In this region, solar radiation reaches the ground vertically at specific times daily throughout the year. It is therefore very warm in these regions. Due to the high temperatures, more water evaporates and the air is often moist. The resulting frequent and dense cloud cover reduces the effect of the solar radiation on ground temperature.
Characteristics of the tropical climatic zone
• It is in the area around the equator, from 23.5° farther north to 23.5° in the southern latitude.
• The sun is at its zenith (90°) at least once per year. It is never lower than 43°.
• The average temperatures are between 20°C and 30°C.
• The minimum temperature is 0°. There is no frost.
• The maximum temperature is more than 40°.
• The radiation is positive.
• The day length is between 10 and 13.5 hours.
• The rains are defined by the trade winds. Its a seasonal shift.
• The climate is humid and warm.There is often precipitation.
• There are ever green forests and savannahs.
• More than 40% of the earth’s population lives in the tropics. This population keeps increasing.
The subtropics zone
This is the zone between latitudes 23.5° and 40°. The subtropics receive the highest radiation in summer. This is because the sun’s angle at noon is almost vertical to the earth. The cloud cover is also relatively thin.
These regions receive less moisture. This condition increases the effect of radiation.
Therefore, most of the deserts in the world are situated in this zone. In winter, the radiation in these regions decreases significantly. It can temporarily be very cool and moist.
Characteristics of the subtropics climatic zone
• It lies in the area between the tropical and the temperate zones (25° to 40°
North and South latitudes).
• The sun’s angle is at 9° to 27° above the horizon, according to place and season.
• The average temperatures range between 20°C and 35°C.
• Its minimum temperature is – 5°C.
• Its maximum temperature reaches +66°C in areas like Libya, Iran and the Death Valley.
• Its radiation is neutral.
• The day length ranges between 9 and 15 hours.
• It is generally dry with some humidity during winter.
• It has a tropic summer and non-tropic winter climate.
• It has semi-deciduous or evergreen forests, hardwood forests with winter rain, savannah, pasture land. It also has semi-deserts, warm temperate moist forests, nemoral deciduous forests.
• It has extreme heat, strong precipitation and drought in some areas.
Temperate zone
This is the zone between latitudes 40°and 60°. Here, the solar radiation arrives with a smaller angle. The average temperatures here are much cooler than in the subtropics.
The seasons and day length differ significantly in the course of a year. The climate is characterised by less frequent extremes.
There is a more regular distribution of the precipitation over the year. There is also a longer vegetation period.
Characteristics of the temperate climatic zone
• It is in the area between the cold zone and the subtropical zone (40° to 60°).
• The maximum angle of the sun is at 73° and minimum 0° (at the Arctic Circle).
• The average temperatures is between 0°C and 20°C.
• The minimum temperature is at –40°C.
• The maximum temperature is at + 40°C.
• The radiation balance is negative.
• The day length is between 4 to 16 hours and 8 to 12 hours at 50°.
• The precipitation is from 300 mm to 2000 mm with an average of 800 mm.
• The climate is warm and cold temperate.
• The vegetation is deciduous forests, warm temperate forests and savannah.
• Extreme temperatures and precipitation are rare.
Polar zone
This is the zone between latitudes 60° and 90°. The polar areas between 60° latitude and the poles receive less heat through solar radiation. This is because the sun has a very flat angle toward the ground. Because of the changes of the earth’s axis angle to the sun, the day length varies most in this zone. In the summer, polar days occur. Vegetation is only possible during a few months per year and even then is often sparse. The conditions for life in these regions are very hard.
Characteristics of the polar climatic zone
• It is in the area between 60° to 90° North and South latitudes.
• The maximum angle of the sun is at 53° above the horizon (polar day) to under the horizon (polar night).
• The average temperatures are between – 47°C and 0°C.
• The minimum temperature is at – 89°C (Antarctica).
• The maximum temperature is at +25°C (Tundra).
• The radiation is negative.
• The day length is between 0 and 24 hours for polar night and day respectively.
• Precipitation is variable and is mostly in the form of snow.
• There is ice climate with the average temperature of the warmest month below 0°C and tundra climate with the average temperature of the warmest month between 0 under 10°C.
• The vegetation in the area is scarce. There is moss, lichens, grass, boreal forest with conifer woods.
• The area is hostile to life.
Mountain zone
This climatic zone is also referred to as the alpine or highland climatic zone. In this
zone, no month has a mean temperature that is higher than 10°C. The climate becomes colder at high elevations than the surrounding lowlands.
Although this climate classification only covers a small portion of the earth’s surface, mountain climates are widely distributed.
The altitude where alpine climate occurs varies with latitude. For example, at 68°N in Sweden, mountain climate occurs as low as 650 metres, while on Mount Kilimanjaro in Tanzania, it occurs at 3,950 metres. In mountainous areas with an alpine climate, the dominant vegetation is the
alpine tundra. This consists of vegetation that does not contain trees because it grows
in very high altitudes. This type of climate is experienced in areas like:
• The Ethiopian Highlands
• The Alps of Europe
• The Himalayas of Asia
• The Andes in South America
• The Rockies in North America
• The Kenyan highlands
• Mount Kilimanjaro
Characteristics of mountain climatic zone
• It is distributed all over the world.
• This type of climate is greatly influenced by relief and altitude.
• Due to variations in temperature, it has a wide range of micro-climates.
• Temperatures decrease with altitude. The higher one goes, the cooler it becomes.
Fig 8.76 Climatic zones of the world.
• During the day, temperatures rise while in the night, they fall. This is due to excessive radiation.
• There is minor annual temperature range. Temperatures tend to be constant for most part of the year.
• The heavy precipitation is received on the windward side of the mountain. The leeward side has no rainfall and temperatures tend to be high.
• Atmospheric pressure decreases as one ascends.
• Temperature inversion is a common in these areas.
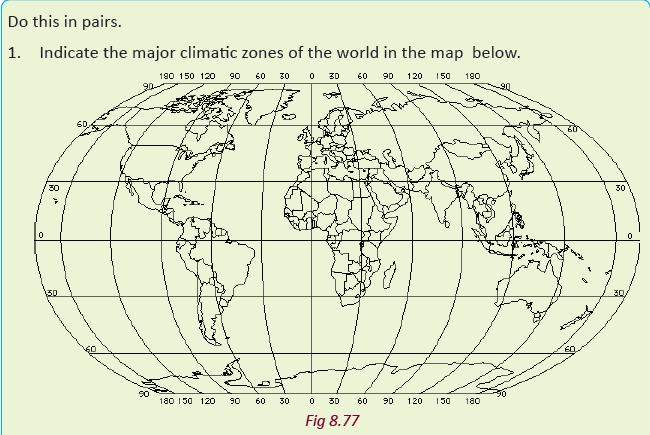
2. Justify your locations by describing the characteristics of the zones that you have indicated on the map.
3. Present your work in a class discussion.
Impact of weather and climate on human activities
Study the photographs provided below.
Fig 8.78 Crops growing in a farm in Musanze district.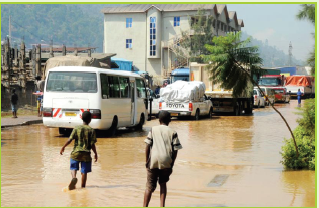
Fig 8.79 Children wading through a flooded street in Nyabugogo area in Kigali.
1. List the differences in the pictures.
2. What are some of the causes of the floods in Nyabugogo area?
3. Discuss your findings in class.
The weather and climate play a huge role in determining the human activities that can take place. For example agricultural activities are directly influenced by the climate. The following points show how weather and climate impact human activities.
(a) High and reliable rainfall in moderate levels supports the growth of crops.This ensures food security.
(b) Moderate and abundant rainfall supports growth of grass hence favouring livestock farming. It also supports herbivorous wildlife hence developing the tourism sector.
(c) Heavy and reliable rainfall supports the growth of trees of high value. This leads to the development of forestry and lumbering.
(d) The warm tropical climate attracts many tourists who come to enjoy the warmer conditions when they have winter conditions back home. This supports the tourism sector.
(e) In areas where with arid climates, humans are forced to find ways of irrigating the crops.
(f) Heavy and reliable rainfall sustains water bodies like rivers, swamps, lakes and wetlands. All these support aquatic life, tourism sports and provide water that is used for domestic purposes.
Work in pairs.
Use your local environment, the Internet and other geographical material.
1. Find out other influences of weather and climate on human activities.
2. Discuss and note your findings down.
3. Share them with your classmates in a class presentation.
Did you know?
• The South Pole is the least sunny place on earth.
• Antarctica is the least rainy place and not deserts.
• The shape and colour of clouds can help you predict rain
• Ice plays an important role in regulating climate, because it is highly reflective.
• Without the sun, there would be no weather.
1. (a) Distinguish between weather and climate.
(b) List the elements of weather and climate.
2. (a) Define atmosphere
(b) Briefly describe the layers of the atmosphere.
3. (a) Explain the water cycle processes.
(b) Identify different forms of precipitation.
4. Explain the factors influencing atmospheric pressure variation.
5. Identify the different types of winds.
6. State the different types of clouds.
7. Outline the factors that influence climate.
8. (a) Name the major climatic zones in the world.
(b) State the characteristics of alpine climate.
9. Explain how climate has influenced human activities in the world.UNIT 9:Vegetation

By the end of this unit, you must be able to determine the relationship between vegetation and human activities.
Unit objectives
By the end of this unit, you must be able to:
(a) identify different vegetation types on maps
(b) outline factors that influence the distribution of vegetation
(c) outline the importance of vegetation
(d) state the relationship between vegetation and human activities.Vegetation

Do this in groups of four.
Take a walk in the area around your school.
Observe the vegetation growing around the school. Record the following in your exercise books.
• Type of vegetation
• Height of the vegetation
• Size of the leaves
(a) Discuss your observations in groups.
(b) Present your findings in class.Vegetation refers to all the plant cover growing in a particular area. It also refers to the ground cover provided by plants.
Human beings, animals and insects all depend on vegetation. They purify the air that we breathe.Classification of vegetation
Vegetation is classified into three main groups, namely:
(a) Natural vegetation
(b) Artificial vegetation
(c) Secondary vegetationNatural vegetation
This is the vegetation that grows naturally in an area without any human aid. It grows under natural physical conditions and has not been interfered with by people or animals.
Types of natural vegetation include forests, grasslands, desert vegetation and swamp vegetation.Forests
A forest is a large area of land covered by trees and other woody vegetation. The natural forests found in Rwanda are the natural forests of Nyungwe National Park, Volcanoes National Park and Gishwati and Mukura forest reserves. Most of the remaining natural forests in Rwanda are
protected as national parks or forest reserves.
Fig. 9.1 Nyungwe Forest National Park.
Grasslands
Grasslands are areas where the main vegetation is grass. They grow naturally.
Examples of grasslands in Rwanda are the savannahs of Akagera National Park, Bugesera, Gisaka and Umutara.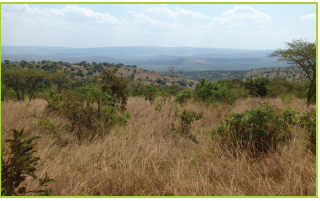
Fig. 9.2 Savannah at Akagera National Park.
Desert vegetation
A desert is an area of land with little or no vegetation. There is very little rainfall in these areas thus the conditions are unsuitable for plant and animal life. There are some plants adapted to growing in the desert. These are desert and semi-desert vegetation such as scrub and cactus.
However, there are no deserts in Rwanda.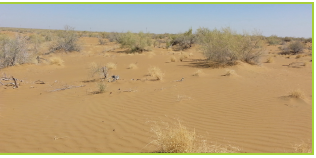
Fig. 9.3 Desert vegetation.
Swamp vegetation
A swamp is a wetland with woody vegetation.
Swamp vegetation can be found in salty or fresh water. The swamps in Rwanda are Mugesera, Rweru, Kagera, Nyabarongo, Mushaka and Kamiranzovu.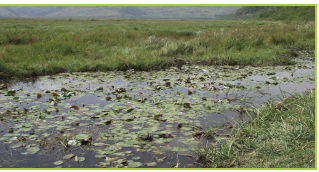
Fig. 9.4 Rweru swamp.
Artificial vegetation
This is composed of the vegetation that has been planted by human beings.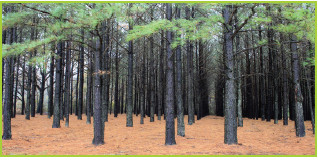
Fig. 9.5 Artificial forest in Rwanda
It is also known as planted vegetation.
Forests made up of exotic trees are examples of planted vegetation. Exotic trees that are planted include pine, cypress and eucalyptus.
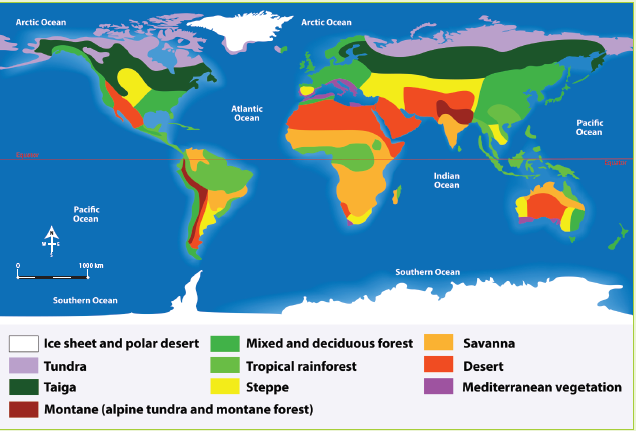
Fig 9.6
1. Study the map shown above.
2. Using the key, identify the different types of world vegetation on the map.
3. Give examples of the vegetation types that are found in Rwanda. Locate the areas in which the vegetation are found on a map of Rwanda.
4. Present your findings in class.Secondary vegetation
This is the vegetation that grows naturally in an area after being interfered with by people or animals. It is also known as derived vegetation. The vegetation is still in the process of development and will eventually acquire the characteristics of natural vegetation.A good example of secondary vegetation is the one that grows in an area after the previous vegetation cover is cleared or destroyed by an outbreak of fire. Do you know of any such vegetation in your country?
Factors that influence the distribution of vegetation


Fig 9.7
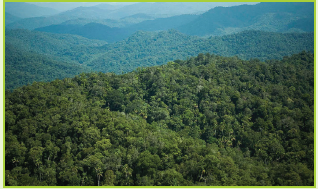

Fig 9.9
1. Identify the type of vegetation in all the pictures.
2. Suggest the factors that are suitable for the growth of the vegetation shown in each of the pictures.3. Identify areas in Rwanda where each of the vegetation shown on the pictures are found.
4. How important are the vegetation to Rwanda as a country and to the people who live near them?There are four main factors that influence the distribution of vegetation over the earth’s surface.
• Climatic factors
• Edaphic factors
• Topographic factors
• Biotic factorsClimatic factors

1. Look at the vegetation surrounding your school
2. Identify some of the factors that have influenced their growth and presence in the area.
3. Classify them according to the factors identified in (2) above.
4. Note down your findings.
5. Discuss them in a class presentation.Climate is the weather condition in an area over a long period of time. The main elements of climate that influence vegetation include precipitation, temperature, sunlight and wind.
(a) Precipitation
Precipitation is the deposit of water in liquid or solid form on the earth’s surface from the atmosphere.
The type and amount of precipitation influences the type and distribution of vegetation. Different plants have different moisture requirements.Areas that receive heavy and well distributed rainfall throughout the year have forests composed of many tree species.
Areas with moderate and seasonal rainfall are dominated by grasslands.
Areas with low rainfall are dominated by desert and semi-desert vegetation.
Fig. 9.10 Natural rainforest.
(b) Temperature
Temperature plays an important role in the growth of vegetation. It determines plant processes such as germination, rate of plant growth, flowering, ripening of fruits and shedding of leaves.
Warm conditions encourage rapid growth of plants. Cold conditions slow down the rate of plant growth.(c) Sunlight
Sunlight is important to plants for photosynthesis. Long hours of sunlight encourage the growth of many varieties of plants. Areas with fewer hours of sunlight have fewer plants.(d) Wind
The moisture content and strength of the winds influences plant growth. Warm moist winds contain sufficient moisture. This helps in the formation of rainfall necessary for plant growth.Hot dry winds cause wilting of plants since it accelerates water loss from the plants. Strong winds cause the trees to bend.
Edaphic factors
This refers to soil particularly with respect to its influence on organisms. Deep well drained soils support a variety of large trees.
Soils that are shallow in depth support the growth of shallow rooted plants such as grass.
The pH of the soil also determines the type of plants found in a region. Soils with nutrients and humus support the growth of plants. Soils with few nutrients support very little plant growth.Topographic factors
Topography defines the physical features in a place. The topographic factors include relief, slope and aspect. These factors affect vegetation through soil formation processes, climate, soil moisture and soil nutrients.(i) Relief
Relief refers to the difference in elevation between any two points on the earth’s surface. The height of the land determines temperature and rainfall. There is an increase in vegetation with an increase in altitude. This is distinct on mountains. The vegetation ranges from grass to forests,
bamboo, heath and moorland.(ii) Slope
Steep slopes experience high rates of soil erosion leading to the development of thin and shallow soils. This results in poor plant growth. Gentle slopes have deep and welldrained soils resulting in the growth of thick vegetation and a wide variety of plants. Flat areas are easily waterlogged resulting in the growth of swamp vegetation.(iii) Aspect
Aspect is the direction of the slope with regards to sunshine and rainfall. Slopes that are exposed to the sun are warm. They support plant growth. The slopes which are not exposed to the sun have fewer vegetation.Biotic factors
These are the living organisms which have an effect on the growth of vegetation.
These include human beings, animals, bacteria, burrowing animals and insects.
Human activities such as deforestation, mining and overgrazing destroy vegetation. Other activities such as agroforestry, reforestation, afforestation and creation of forest reserves result in the development of vegetation.
Some insects aid in plant pollination. Animals and birds aid in seed dispersal leading to growth and distribution of vegetation.
Burrowing animals and earthworms aerate the soil resulting in suitable conditions for plant growth.Task 9.1
1. Describe how each of the following factors influences the growth of vegetation.
(a) Climate factors
(b) Edaphic factors
(c) Topographic factors2. Explain how human activities have influenced the distribution of
vegetation. Use specific examples from Rwanda.Importance of vegetation

Work in groups of four.
1. Go outside your classroom
2. Look at the vegetation surrounding your school.
3. Find out the importance of the vegetation to the people who live near them and to the country.
4. Write your findings down.
5. Discuss them in a class presentation.Vegetation is a major component of the ecosystem. It is important because of the following reasons.
1. Food – Some vegetation are a source of food for human beings and animals.
Some insects also feed on vegetation.2. Habitat for wild animals – Forests and other vegetation provide a home for wild animals. Wild animals attract tourists. They earn the country foreign exchange that aids in economic development. Therefore, we should not destroy our vegetation.
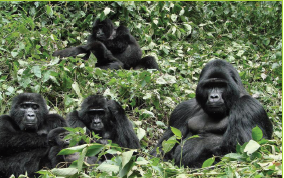
Fig. 9.11 Vegetation provides habitats for wild animals.
3. Sources of medicine – Some types of vegetation such as barks, roots and leaves of trees are used as medicine. They are used in curing different diseases in both animals and in humans too.
4. Prevent soil erosion – Vegetation holds soil together. This prevents erosion by water and wind. Vegetation also reduces the speed of water when it is raining. Roots of vegetation hold soil particles together. This helps to reduce soil erosion and conserve soil.
5. Purify the air – Vegetation purify the air that we breathe. They utilise carbon (IV) oxide in the atmosphere and release oxygen.
6. Improve soil fertility – Plant materials that fall from different vegetation decompose into humus. This improves the fertility of the soil. The decaying material increases the organic matter
content in the soil.7. Source of timber – Trees are a source of timber. This is used in making furniture and building. Trees are also a source of fuel. However, trees should not be cut carelessly. Whenever one tree is cut, two more trees should be planted.
8. Source of raw materials – Vegetation are also a source of raw materials for industries. For example, trees are used in the manufacture of paper, plywood and rubber.
9. Windbreaks – Vegetation such as trees act as windbreaks. They help in reducing the speed of wind. This reduces the effects of wind such as blowing away roof tops or soil erosion.
10. Conserve soil and water – The roots of vegetation help in conserving soil and water. They hold the soils together and conserve moisture in the soil.
Task 9.2
1. Explain the importance of vegetation to the economy of Rwanda.
2. Give five uses of trees.Relationship between vegetation and human activities

Work in groups of four.
1. Find out how the presence of the vegetation around your school has influenced the activities that take place in the area.
2. Use the Internet, textbooks and topographic maps to find out how vegetation influences human activities in different areas of the world.
3. Write down your findings.
4. Present them in class.1. Vegetation type and distribution have a great influence on human activities and occupation over the earth’s surface. For example, availability of grass has led to livestock keeping due to availability of pasture.
2. Overdependence on vegetation by human beings for their needs has had a negative impact on vegetation.
It has lead to a reduction in the area under natural vegetation. Such human activities include overstocking leading to overgrazing, pollution and deforestation.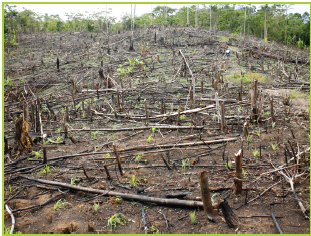
Fig. 9.12 Deforestation.
3. The human population is growing. There is need for land for settlement. Human beings are destroying vegetation to create more land for settlement. This has had an effect on the distribution of vegetation.
4. Human activities such as pollution lead to climate change. This leads to global warming and causes a decrease in vegetation.
Work in groups of four.
1. Find out how the human activities that take place have affected the vegetation in the area surrounding your school.
2. Use the Internet, textbooks and topographic maps to find out human activities have affected vegetation in different areas of the world.
3. Write down your findings.
4. Present them in class.Did you know?
• The forest at Nyungwe is one of Africa’s true rainforests with more than 200 types of trees and numerous flowering plants.
• Much of Rwanda’s natural rainforest has been cut down to make way for its growing population.
• The bamboo is a natural vegetation.
• Some plants like the Venus flytrap are carnivorous.
• There are over 200,000 plant species.
1. Define vegetation.
2. List and describe the different types of vegetation.
3. Discuss four factors that influence the distribution of vegetation.
4. Assess the importance of vegetation to Rwanda.
5. Describe how natural vegetation has influenced the following human activities.
(a) Tourism
(b) Livestock keeping
(c) Building and construction
(d) Medicine
6. Describe how the following human activities have influenced the distribution of vegetation.
(a) Overstocking
(b) Mining
(c) Pollution
(d) Urbanisation.UNIT 10:General organisation of hydrography

By the end of this unit, you must be able to analyse the general organisation of hydrography and its relationship with human activities.
Unit objectives
By the end of this unit, you must be able to:
(a) state different types of water bodies
(b) identify the major terminologies related to drainage
(c) identify major rivers of the world
(d) explain different parts of river profile and their characteristics
(e) identify different drainage patterns
(f) explain the relationship between drainage and human activities.Hydrography is the study of water bodies of the Earth. The water bodies include oceans,
seas, rivers and lakes.
Mukamwezi’s class teacher took the class to the Kiniha slum area in Karongi district.
The class went for a field study. Mukamwezi observed that the surroundings in the areawas very dirty. She saw dirty water flowing almost everywhere carrying all types of waste. It also had a bad smell that polluted the area.
(a) Describe the environment in the slum area.
(b) What description is given to the condition where dirty water flows everywhere without proper direction?Definition of drainage
Drainage refers to the natural or artificial removal of surface and sub-surface water from an area. This is done through a system of natural streams in the ground or through pipes.Water bodies

Do this in pairs.
Use the Internet, maps of Rwanda, photographs and geography textbooks.
1. Name the categories of the water bodies found in Rwanda.
2. Describe their characteristics that justify them to be under the categories that you have put them.3. State the importance of the water bodies to Rwanda.
4. Discuss your findings in class.A water body is any significant accumulation of water on the earth’s surface. The water
bodies are categorised into two.• Natural water bodies
• Artificial water bodiesExamples of natural water bodies include oceans, seas, lakes, swamps, rivers and ponds. Reservoirs, dams, canals and artificial lakes are examples of artificial water bodies.

In groups, use geographical resources such as textbooks, the Internet and documentaries.
1. Find out the main types of water bodies.
2. Describe their characteristics.
3. Identify the water bodies in your country.
4. Write down your findings and present in class.The main water bodies include the following.
(a) Oceans - An ocean is a large and extended body of salty water occupying a basin between continents. Examples of oceans of the world include the Indian Ocean, Atlantic Ocean, Pacific Ocean, Arctic Ocean and Southern Ocean.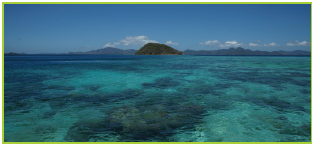
Fig 10.1 The Indian Ocean.
(b) Lakes - A lake is a body of water contained in an extensive depression on the earth’s
surface. The water in the lake may be salty or fresh. Examples of lakes in Rwanda include Lake Kivu, Lake Ruhondo, Lake Mugesera, Lake Burera, Lake Muhazi and Lake Ihema.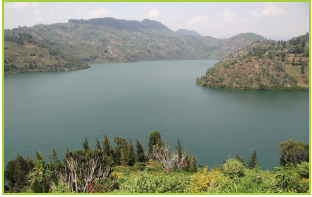
Fig 10.2 Lake Kivu in Rwanda.
(c) Ponds - A pond is a body of stagnant water that could either be natural or artificial. It is smaller than a lake and is surrounded by land.

Fig 10.3 A pond.
(d) Reservoirs - A reservoir is an artificial lake where water is stored. It is from reservoirs that dams are constructed across rivers. Examples of reservoirs in Rwanda include the Nyabarango and Rusumo dams.
Fig 10.4 Dam on Nyabarongo River.
(e) Swamp - This is a flat uncultivated land where water collects. The ground is usually wet and soft and saturated with water. Rugezi, Kamiranzovu, Mwogo, Nyabugogo, Rwasave, Ngenda,
Sake, Mugesera, Ntende, Rwagitima, Muganza, Bugarama, Koko, Mugenoro are some of the swamps in Rwanda.
Fig 10.5 Rugezi marshland.
(f) Seas - A sea is a large body of salty water found on the margin of oceans.
It is partially enclosed by land. It is smaller than an ocean. Examples of seas include Mediterranean Sea, Baltic Sea, Red Sea and Dead Sea.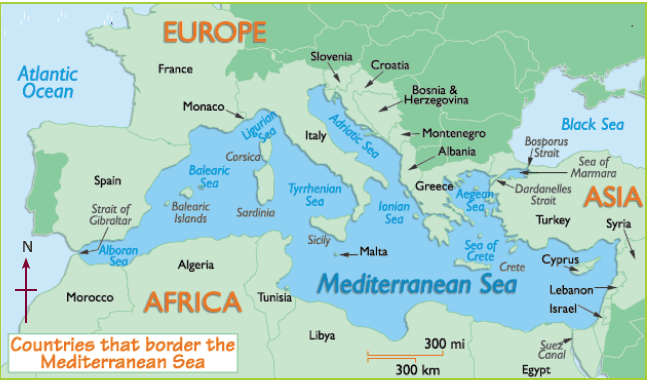
Fig 10.6 A map showing the location of the Mediterranean Sea.
(g) Rivers - A river is a stream of water which flows in a channel from a high ground to a low ground. It flows into an ocean,
sea, lake or swamp. Rivers in Rwanda include Mwogo, Rukarara, Mukungwa, Base, Nyabarongo and the Akanyaru and the Akagera Rivers.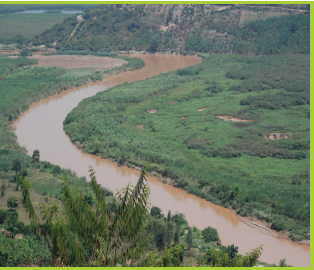
Fig 10.7 River Nyabarongo in Rwanda.
There are different types of rivers. They include:
(a) Perennial river - This is a river that contains water throughout the year. It can also be referred to as a permanent river. An example is River Nyabarongo.
(b) Intermittent river – This is a river whose surface water ceases to flow at some point in time. Such rivers periodically stop flowing. Such rivers drain large arid and semi-arid areas. An
example is River Kidepo in Uganda.
(c) Ephemeral river – This is a river that flows periodically and only exists for a short period. It flows immediately following heavy rains or snow melt.Task 10.1
1. Draw correct diagrams showing the following.
(a) A reservoir
(b) A river
(c) A pond.
2. Identify the main water bodies in Rwanda.
3. Differentiate between a perennial and an intermittent river.Major rivers of the world

1. In pairs, use an atlas to identify and locate the main rivers of the world.
2. Identify their sources and mouths.
3. Share your findings in a class presentation.Some of the major rivers of the world include the following.
Table 10.1 Major rivers of the world.

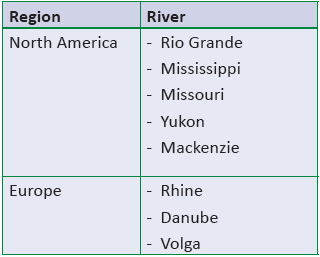

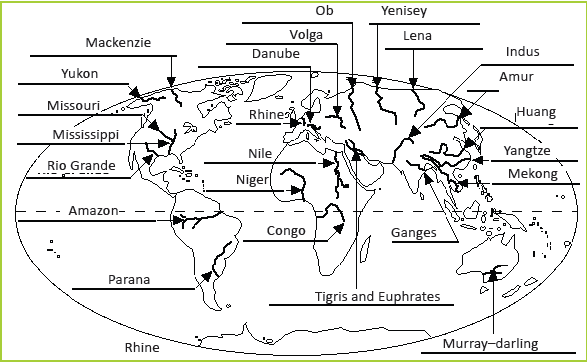
Fig 10.9 Rivers of the world.

Do this individually.
1. Draw a sketch map of the world. On it, mark and name the main rivers of the world.
2. For each of the main rivers in (a) above, name their sources.
3. Name the continents and countries that contain each of the rivers you have named.
4. Present your work for marking.
1. Use an atlas or the Internet to identify the major rivers of the world marked by the arrows shown.
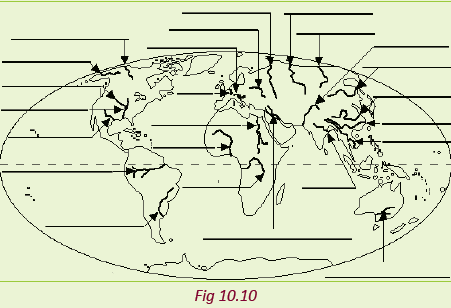
2. Present your findings in a class discussion.
River profile

Work in groups of three. Study the photographs shown below.
1. Identify the parts of the river profiles that are shown in the pictures.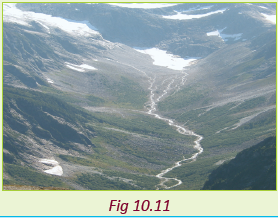
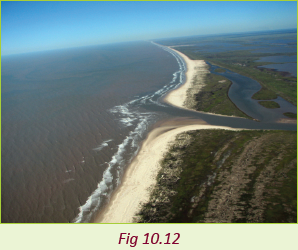

2. Discuss the characteristics of each of the stages identified.
3. Present your findings in class.A river profile is the shape of the river course. There are two river profiles.
• The cross river profile.
• The long river profile.Parts of a river profile
Cross river profile
This is the transverse profile of a river from one bank to another. The river cross profile
changes from the upper to the lower course.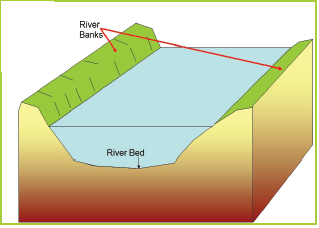
Fig 10.14 A cross profile of a river.
Long profile
This is the shape of a river along its course from the source to the mouth. The long profile is expressed graphically as a curve.
It has a steep gradient near the source but gradually flattens towards the river mouth.
The profile of a river is ideally expected to be smooth. However, this never occurs since the energy of the river changes as it flows through its course.The energy changes in the long profile may be caused by the following.
(a) Increase in the river discharge due to increased precipitation.
(b) Changes in the sea level. This may be either a rise or fall in the level of the sea.
(c) The land may rise or fall due to continental movements.The long profile of the river is divided into three stages.
• The youthful stage
• The middle stage
• Old stage
Fig 10.15 The long profile of a river
(a) The youthful stage (upper course)
This is the stage that is near to the river’s source. The river has a lot of energy due to the steep gradient. Erosion is the dominant function of the river.The characteristics of the youthful stage of a river:
(a) The river has a steep gradient.
(b) The water flows at a very high speed.
(c) There is a deep steep sided river valley.
(d) It has a narrow channel.
(e) Vertical erosion is dominant
(f) The river channel is V-shaped.(b) The middle stage
This stage is also known as the mature stage or the valley stage. It is the stage between the youthful and the old stages.
The gradient of the river channel is reduced.The river has more stream volume since more tributaries join it.Characteristics of the middle stage of a river:
(a) The river has wide U-shaped valley.
(b) The gradient of the river channel is gentle.(c) The water speed is moderate.
(d) There is high stream volume.
(e) The river erodes its valley laterally thus widening it.
(f) Both erosion and deposition take place at this stage.(c) The old stage (lower course)
This is the stage that is close to the river mouth. The gradient of the river channel is very gentle. The main function of the river is deposition though lateral erosion still occurs.Characteristics of the old stage of a river:
(a) The gradient of the river channel is very low.
(b) The speed of the river is very low.
(c) The stream volume is large.
(d) The river valley is wide and U-shaped.
(e) Deposition occurs on the river channel making it shallow.Task 10.2
1. What is a long profile of a river?
2. Name three stages of the long profile of a river.
3. Name the features found in each stage of the long profile.
4. State the characteristics of the river in each stage.Drainage patterns
A drainage pattern is the arrangement of a river and its tributaries on the earth’s surface. Drainage patterns tell a lot about the land. Drainage patterns are influenced by:
• the slope of the land• differences in the rock resistance
• rock structure.
There are different types of drainage patterns. They include:
• radial
• dendritic
• trellis
• centripetal
• parallel(a) Radial drainage pattern
This is a drainage pattern that forms on volcanic cones or domes.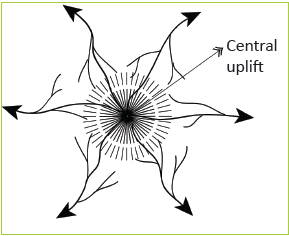
Fig 10.16 Radial drainage pattern.
The rivers flow outwards from a central high point. The pattern resembles the spokes of a bicycle wheel. The slope influences the direction of flow of the rivers.
(b) Dendritic drainage pattern
This drainage pattern looks like a tree trunk and its branches. The tributaries flow towards the main river from many directions. They join the main river at acute angles. This pattern develops in an area with gentle slopes with fairly uniform rock type.
The direction of flow is influenced by the slope. It is common on massive crystalline rocks such as granite. It also develops on horizontal gently dipping sedimentary rocks.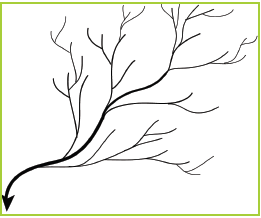
Fig 10. 17 Dendritic drainage pattern.
(c) Trellis drainage pattern
This is a pattern where the tributaries join the main river at right angles. The minor tributaries also join the main tributaries at right angles. It develops in areas where there are alternate layers of hard and soft rocks. These rocks lie at right angles to the main direction of slope. The main river is
powerful enough to cut through the hard rocks while the tributaries cut through the soft layers of rocks at right angles. The minor tributaries cut valleys into the less resistant rocks. The hard layers of rocks protrude as ridges.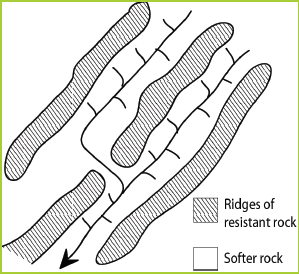
Fig 10.18 Trellis drainage patterns.
(d) Centripetal drainage pattern
This is a drainage pattern where rivers flow from all directions into a common basin.
The common basin could be a swamp or a lake. The direction of flow of the rivers is influenced by the slope.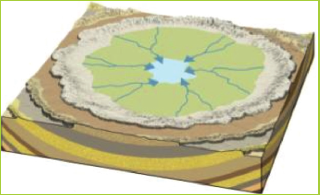
Fig 10.19 Centripetal drainage pattern.
(e) Parallel drainage pattern
This is a drainage pattern where the main river and its tributaries flow parallel to each other. It occurs over a large area. The slope determines the direction of flow of the river. It is common on steep slopes and escarpments. Tributaries join the main river at small acute angles.
Fig 10.20 Parallel drainage pattern
(f) Fault guided drainage pattern
This is a drainage pattern where rivers flow along fault lines. This occurs in areas that have experienced faulting. The direction of flow is influenced by the faults. The tributaries form very sharp bends along their course. This drainage pattern is also referred to as rectangular drainage pattern.
Fig 10.21 Fault guided or rectangular drainage pattern.
(g) Annular drainage pattern
This is a drainage pattern around a basin or crater. It forms when the main river and its tributaries are arranged in a series of curves around a basin. The tributaries join the main river at sharp angles. Lake Bosumtwi in Ghana forms this pattern.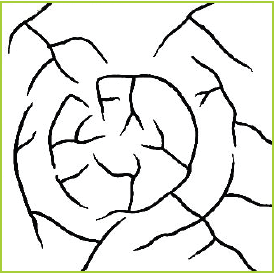
Fig 10.22 Annular drainage patterns.

Work in groups of three. Use an atlas.
1. Identify the different drainage patterns of the major rivers of the world.
2. List the patterns and match them to specific rivers.
3. Discuss your findings in class.
Work in groups of four.
1. Collect clay soil and water.
2. Mix the two well
3. Mould the following drainage system.
(a) Radial drainage pattern
(b) Dendritic drainage system
(c) Trellis drainage pattern
(d) Centripetal drainage pattern
(e) Present your work for assessment.Task 10.3
1. What is a drainage pattern?
2. State three factors that influence the formation of drainage patterns.
3. Describe the characteristics of the following drainage patterns.
(a) Dendritic
(b) Radial
(c) Centripetal
(d) TrellisRelationship between water bodies and human activities
The relationship between the water bodies and human activities can be looked at in two ways.
(a) The influence of water bodies on human activities.
(b) The influence of human activities on water bodies.Influence of water bodies on human activities

Do this in pairs.
1. Outline the ways in which human activities are influenced by water bodies. Give examples from Rwanda.
2. Discuss your findings in class.Water bodies have a great effect on human activities. These effects include the following:
(a) Settlements
Water bodies that contain fresh water attract human settlements. This is because they provide water for domestic use.
(b) Agriculture
Fresh water bodies encourage agriculture by providing water which is used for irrigation. Rivers deposit alluvium in the flood plains. Alluvium contains fertile soils which are used for growing crops. The water bodies also provide water for livestock to drink encouraging livestock keeping.
(c) Transport
Lakes, seas, oceans and navigable rivers provide a cheap means of transport for people and goods.
(d) Fishing
Water bodies such as oceans, lakes, rivers are good habitats for fish and other aquatic life. Fishing is carried out in such water bodies for subsistence and for sale.(e) Mining
Some water bodies contain minerals in their beds. These minerals are mined.
Mining takes place as an economic activity. Minerals which are mined in water bodies include salt, trona and gold.
(f) Tourism
Water bodies form beautiful sceneries e.g. waterfalls and sandy beaches which attract tourists. Tourism earns foreign exchange which is used for economic development.
(g) Recreation
Some water bodies offer recreational activities. Water sports such as surfing, yatching and sport fishing are some recreational activities that people engage in.
Water bodies such as rivers and lakes provide water which is used for industrial
purposes. Water bodies also provide raw materials which encourage the establishment of
industries. Fish leads to establishment of fish related industries.
(i) Ports
Some rivers have suitable sites for the construction of ports and harbours. Rias and estuaries at river mouths are used for construction of ports. Fiords form natural harbours.
(j) Hydroelectric power generation
Some rivers have been dammed and their water is used to generate hydroelectric power. The power is used for domestic and industrial purposes.(k) Building materials
Lakes and rivers contain sand, gravel and pebbles in their beds. These materials are extracted and used as building materials.
(l) Flooding
Water bodies such as rivers may flood causing the displacement of people, destruction of property. Floods also cause loss of lives.
(m) Water-borne diseases
Water bodies can be breeding grounds for disease-carrying organisms. Mosquitoes and snails transmit malaria and bilharzia respectively, which are water-borne diseases.The impact of human activities on water bodies

Work in pairs.
1. Outline the ways in which human activities affect water bodies. Give examples from Rwanda.
2. Discuss your findings in class.Human activities have an increasing impact on the water bodies. These activities include sedimentation, deforestation, pollution, landscape changes, urban growth and climate change.
(a) Sedimentation
Human activities such as farming, clearance of forests, mining and building of roads expose the soils to erosion. The soils are washed by surface runoff and are eventually deposited in the water bodies.The sediments affect water in various ways.
• They can harm aquatic life by carrying toxic chemicals into the water.
• They reduce the amount of sunlight penetrating the water.
• They add nutrients to the water encouraging the growth of plants (entrophication)
• Sediments reduce the capacity of reservoirs making them shallow.
This interferes with navigation and result in flooding of the areas adjacent to the water bodies.(b) Deforestation
The clearance of vegetation in the catchment areas exposes the soil to erosion leading to sedimentation in the water bodies.
(c) Pollution
Industrial wastes, sewage and surface runoff from the farm lands are disposed of into the
water bodies. They cause pollution making the water unfit for use. Gases emitted from factories and vehicles are released into the atmosphere. This leads to the formation of acid rain which damages vegetation and pollute the water.
(d) Excessive use of water
The excessive use of water from the surface and underground sources leads drying up of water bodies. Such water bodies include lakes, rivers and aquifers. Some of the rivers experiencing excessive use of include Niger and Nile.(e) Climate change
Some human activities lead to climate change. Climate change can result into wetter or drier climates in some regions of the world. In drier climates, a decline in the volume of the water bodies is witnessed.
(f) Landscape changes
The drainage of swamps to create dry land for agriculture interferes with the water balance. The water cycle is also destroyed leading to the depletion of wetlands. It also affects the flow of water into the lakes, eventually affecting their sizes.
(g) Urban growth
The expansion of urban centres results in increased contamination of underground water and surface water bodies. This occurs by direct discharge and surface runoff. Contamination can occur directly through seepage of soluble contaminants from septic tanks, landfills and other industrial
wastes.
Work in groups of three.
1. Why is it important to protect water bodies?
2. Suggest ways in which the citizens of Rwanda can protect the water bodies in Rwanda.
3. Giving examples in Rwanda, discuss how forests and mountains are responsible for the creation of rivers.
4. Discuss your findings in a class discussion.Did you know?
• Rivers normally contain freshwater.
• Most of the world’s major cities are located near the banks of rivers.
• The largest river drainage basin area in the world is that of the Amazon river.
• Rivers begin at their source in higher grounds such as mountains or hills.
• A dendritic drainage pattern is the most common form of drainage pattern.
1. Define drainage.
2. Give four types of water bodies.
3. List three terminologies related to drainage.
4. Identify the major rivers of the world and the continents in which they are located.
5. Discuss the different parts of a river profile and their characteristics.
6. Identify and describe seven drainage patterns.
7. (a) Explain how water bodies influence human activities. Give examples to support your answer.
(b) Discuss how human activities affect water bodies.UNIT 11:Hazards

By the end of this unit, you must be able to propose responses to the effects of natural and non-natural hazards in the environment.
Learning objectives
By the end of this unit, you must be able to:
(a) define hazards
(b) identify different types of hazards
(c) state the causes and effects of hazards
(d) explain human responses to natural and or human hazards in the short, medium and long term.Hazards

Do this individually.
1. Use your dictionary and the Internet to find out the meaning of the term hazard.
2. Write it down in your notebook.
3. Share your findings with your class members.Hazards are events or activities that cause a threat to life, health, property or the environment. Hazards can cause great harm to life on the earth and to the physical environment. They have a very significant impact on a country or area.
Types of hazards

Work in pairs.
1. List the different types of hazards that affect people and the environment in your area.
2. Discuss them in class.There are many hazards that affect human beings and their environment. These hazards
are divided into two major categories.
• Natural hazards.
• Man-made hazards.Natural hazards
These are naturally occurring events that have negative effects on the environment and on people. Human beings have no control over natural hazards. However, some measures can be put in place to reduce their effects. Examples of natural hazards include floods, earthquakes, drought, epidemics, landslides, volcanic eruptions and strong winds.Floods


Fig 11.1
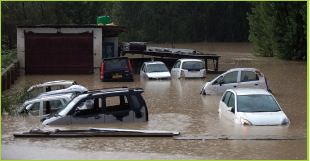
Fig 11.2
1. Name the type of hazard shown in the pictures.
2. Suggest possible causes of the hazard shown.
3. What are the effects of this hazard to human activities?
4. Suggest possible measures that can be put in place to overcome the hazard.
5. Give examples of countries in Africa where this hazard is common. Use the Internet and other geographical documents to get this information.
6. Present your findings in a class discussion.A flood is an overflow of large amounts of water onto dry land. The flood water covers the land surface. When floods occur, they wash away important things such as crops and other vegetation. People are also displaced from their settlement areas. Sometimes people drown in the floods.
Causes of floods
1. Soil deposition – Soils are usually deposited on river beds due to erosion.
This makes the river beds to become shallow. The increase in river water due to high rainfall makes water to spill over the banks thus causing floods.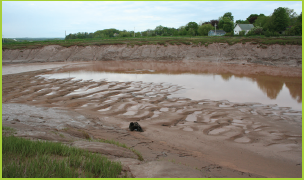
Fig. 11.3 Soil deposition on a river bed.
2. High rainfall – High rainfall in catchment areas releases large volumes of water into the rivers. This causes the rivers to burst the banks as the water flows to the adjacent lands.
3. Blocked drainage systems – Blocked drainage systems in the urban areas cause water to flow on the surface.
4. Earthquakes – They cause tsunamis in the oceans which flood coastal lowlands.
5. Low gradients of the river channels
– Low gradient river channels in the old stage lead to low stream velocity. This causes the load to be deposited in the river channel making it shallow. The water spills over the river banks
causing flooding.Effects of floods
1. Displacements of people since their homes are in water.
2. Flooding washes away crops leading to food shortage.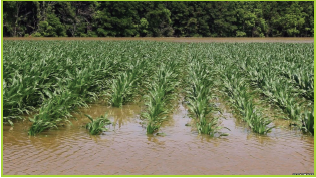
Fig. 11.4 Floods destroy crops.
3. Water logging in soils which hinders crop cultivation.
4. Loss of lives through drowning, and destruction of property.
5. Floods wash away bridges, roads and railway lines which interfere with transport and communication.
6. Create pools of stagnant water which provide a conducive habitat for breeding of disease-causing organisms such as mosquitoes which spread malaria.
Diseases such as cholera, typhoid, malaria and bilharzia are also common in flooded areas.Prevention and control measures
1. Planting vegetation – Vegetation prevents the land from erosion. They hold soil firmly together. Vegetation helps to reduce the flow of flood water hence reducing its effects.2. Educating people – People should be educated on the importance of not blocking drainage systems by poor waste disposal. This will prevent blocking of drainage systems when it rains.
3. Construction of dams – Dams should be constructed. They should have flood-control reservoirs to help in flood control.
Fig. 11.5 Reservoirs in a dams.
Earthquakes

Work in pairs. Study the pictures below and answer the questions that follow.

Fig 11.6
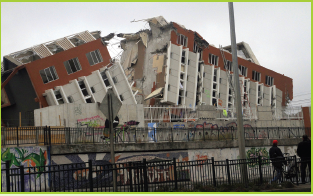
Fig 11.7
1. Describe what you can observe in the pictures.
2. Suggest areas where the hazard shown in the pictures is common.
3. State the effects of the hazard shown in a settlement area.
4. Suggest measures that can be put in place to overcome the effects of the above hazard.
5. Present your findings in a class discussion.An earthquakes is a sudden and violent shaking of the ground as a result of movements within the earth’s crust. It can also be due to volcanic action. Earthquakes cause a lot of destruction.
Causes of earthquakes
1. Movement of tectonic plates – Earthquakes occur when two plates move towards each other and one of them slides beneath the other. It also occurs when the plates move away from each other or when the plates slide against each other without destroying the earth’s crust.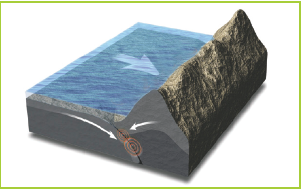
Fig. 11.8 (a) Plates moving towards each other.
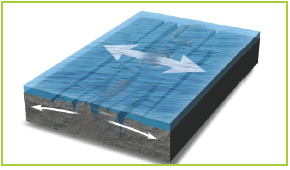
Fig. 11.8 (b) Plates moving away from each other.

Fig. 11.8 (c) Plates sliding against each other.
2. Violent volcanic eruptions – Magma that is pushed from the interior of the earth through the vent by great force causes vibrations in the earth’s crust.
3. Radioactivity – Radioactivity refers to the particles that are emitted from
the mantle due to instability. It causes the mantle to release a lot of energy which in turn causes vibrations in the earth’s crust.Effects of earthquakes
1. Destruction of property – A lot of property is destroyed when earthquakes occur. For example, there is destruction of buildings, roads, railway lines, bridges and dams.
2. Loss of lives – Earthquakes occur suddenly. When buildings collapse, people in them lose their lives. When roads crack, accidents occur leading to loss of lives.
3. Earthquakes cause occurrence of landslides.
4. They also cause flooding of coastal lowlands due to tsunamis.
5. Outbreak of fire – This is caused by the damaged electric cables.
6. They cause breaking or displacement of rocks of the earth’s crust.
7. Displacement of people – When earthquakes occur, people are forced to move from where they live. This is due to destruction of property including houses. Therefore, they have to move and settle in a different area.Prevention and control measures
Earthquakes cannot be prevented. However, they can be monitored using specialized equipment. People can then be alerted to a possible earthquake. People are then able to prepare themselves by evacuating vulnerable areas. This helps to reduce the effects of the earthquake.
Work in groups of three.
1. Carry out a book and Internet research to find out some of the things that can be done to indicate preparedness for an earthquake.
2. Discuss this in groups.
3. Present your findings in class.Drought

Your facilitator will download different video clips from the Internet showing areas facing
drought. Watch the clip and discuss the following in class.
1. The causes of drought.
2. The effects of drought.
3. Ways of preventing droughts from occurring.Drought is a prolonged period of low rainfall leading to shortage of water. Drought affects people, animals and vegetation. Examples of areas that experience drought in Africa include the Sahel, Ethiopia, Somalia, Kenya, Angola and Mozambique.
Causes of drought
1. Lack of rain – Drought occurs when an area does not receive adequate amounts of rainfall for a long period of time.
2. Global warming – The gases that are released in the atmosphere due to human activities cause a rise in temperature. This in turn causes climate change. The weather patterns change and areas receive little rainfall. This can lead to drought.3. Deforestation – Forests help in conserving water and reducing evaporation. Their roots hold water in the soil. Cutting down of trees exposes water sources such as rivers and streams causing them to experience more evaporation. The water bodies become smaller making an area dry.
This speeds up drought conditions.Effects of droughts
Drought has the following effects.
1. Frequent food shortages.
2. Loss of lives.
3. Shortage of water.
4. Drying up of rivers.
5. Shrinking of lakes.
6. Decrease in hydro-electric power production due to lack of water.
7. Loss of vegetation.Prevention and control measures
It is difficult to detect a drought. It also cannot be prevented. However, certain control measures can be put in place to reduce the effects of a drought.
1. Building dams – Dams should be built in different areas. They should be used to collect and conserve water during the rainy seasons. This water can then be used for different purposes when there is a drought.
2. Irrigation – When an area is hit by drought, irrigation farming can be practised. The water from dams can be used to irrigate the crops. This will ensure a constant supply of water to the crops. Drip irrigation should be used in an area facing drought to prevent wastage of water.
Fig. 11.9 Drip irrigation in a dry area.
3. Greenhouse farming – Greenhouse farming should be encouraged. Greenhouses protect crops against adverse climatic conditions. This ensures that food is available throughout the drought period.
4. Rain water harvesting – During the rainy season, people can harvest and store rainwater to be used during a drought.
5. Recycling water – Water that has been used can be purified and reused.Epidemic

In the month of April 2014 in Kamembe slum in Rusizi District, there was an outbreak of a disease. The disease caused the death of very many people.
Medical officers from the government visited the area to find out what disease it was. They noticed the following symptoms in people:
• diarrhoea
• fever
• stomach ache
• vomiting.Those who were diagnosed were told that they had cholera. They were also told that it was an epidemic.
(a) What do you think is the meaning of the term epidemic?
(b) What likely caused the epidemic?
(c) Suggest some of the solutions that can be put in place to prevent occurrence of the disease.
(d) Discuss your answers in a class presentation.An epidemic is an outbreak of a disease that spreads rapidly among many people in a community at a particular time. Examples of epidemic diseases include HIV and Aids,
Ebola, influenza, cholera, malaria and typhoid.Causes of epidemics
1. Climatic conditions – Climatic conditions such as flooding lead to the spread of epidemics. The flood water causes sewages to overflow. The water for domestic use then becomes contaminated causing outbreaks of diseases.
2. Lack of water – Poor water supply in an area can cause an epidemic. People have little or no access to safe water for their day to day use.
3. Inadequate sanitation facilities – People living in poverty usually live in areas with poor hygiene and that lack proper facilities for disposal of waste.
These unhygienic conditions cause epidemics.
4. Unsafe food – When people eat food that is contaminated, they can get diarrhoea and other such infectionsThey may also get diseases such as cholera and typhoid which are caused by consuming contaminated food and water.
Effects of epidemics
The following are the effects of epidemics in an area.
1. Loss of lives.
2. High cost of treatment.
3. Shortage of labour due to disposition or death of energetic people.
4. Reduced productivity of people due to illnesses. This leads to poor economic development in an area.
Prevention and control measures
1. Vaccination – People should be vaccinated against various diseases that may cause death rapidly. This will protect them against infection.
2. Proper hygiene – Most epidemics are brought about due to lack of proper hygiene. People should practice personal, environmental and food hygiene to prevent outbreaks of diseases such as cholera and typhoid.
3. Education – People should be educated on different types of epidemics and their effects to a community. They should also be educated on how to protect themselves against infection
and how to handle the epidemics if they get infected.
4. Eating a balanced diet – A diet that has all the nutrients needed by the body will make the immune system strong. This will make people resistant to certain diseases. Lack of nutrients
in the body makes the body’s immune system weak.Landslides

Do this in groups of four.
Your teacher will provide you with video clips on various areas that have been hit by landslides. Watch the video carefully. After watching do the following:
1. Find out the possible causes of landslides.
2. Give the effects of the landslides on a community.
3. Suggest possible prevention measures of above hazard.
4. Name the areas in Rwanda that are likely to experience the hazard.
5. Present your findings in a class discussion.Landslides refer the movement of masses of earth’s materials composed of rocks and soils down a slope. Landslides may be rapid or slow.

Fig. 11.10 Landslide
Causes of landslides
1. Prolonged heavy rainfall – Rainwater saturates and lubricates the soil and rock materials making the earth unstable.2. Vibrations of the earth – These vibrations are caused by earthquakes.
They cause trembling and shaking of the earth’s crust making soil and rocks to move down-slope.
3. Undercutting at the base of a slope – Undercutting is the process of wearing away of the part below a cliff or a slope. This makes the slope to be unstable thus triggers movement downslope.
4. Melting ice – It may cause movement of large masses of ice and rock particles downslope.
5. Volcanic eruptions – When volcanic eruptions occur, there is a rupture on the crust. This causes earth movements which make soil and rocks move downslope.
6. Mining and quarrying activities – During mining and quarrying activities, techniques such as blasting are used. These cause vibrations to occur under the soil that lead to landslides.
7. Wildfires – Fires destroy vegetation. The vegetation holds soil firmly together preventing landslides from occurring. When the vegetation is destroyed by fire, the soil becomes loose causing
landslides.Effects of landslides
1. Destruction of property such as buildings.
2. Loss of lives and injuries to people.
3. Destruction and interruption of transport and communication lines such as roads.
4. Landslides expose the slopes to soil erosion.
5. Displacement of people when they occur in settlement areas.Prevention and control measures
1. Improving drainage – Improving the surface and sub-surface drainage of an area near a slope will help reduce the occurrence of a landslide. This is because water is the main cause of most landslides.
2. Growing vegetation – Vegetation holds the soil together firmly. People should avoid destroying vegetation through cutting trees in sloppy areas. Trees and other vegetation should be planted to
hold any loose soil in place.
3. Removing and replacing soil – Soil that is prone to landslides can be removed. It should then be replaced with soils that are not prone to landslides such as silt and sandy soils.Volcanic eruptions

Work in groups of three. Describe the activity shown in the following pictures.

Fig 11.11

Fig 11.12
1. Give reasons why the activity taking place in the picture is considered a
hazard.
2. Give examples of areas where the activity in the pictures have been experienced in Rwanda and Africa.
3. State how the activity shown in the pictures influences human activities both positively and negatively.
4. Discuss your answers in a class presentation.Volcanic eruptions occur when there is rupture on the crust of the earth. The rupture causes hot lava, volcanic ash and gases to be discharged from volcanic vents.

Fig. 11.13 Volcanic eruption on Mount Nyiragongo
Causes of volcanic eruptions
Volcanic eruptions are caused by movement of tectonic plates. This movement causes magma to rise through cracks or weaknesses in the crust of the earth. Pressure then builds up inside the earth’s crust. When this pressure is released, the magma explodes and moves to the surface causing volcanic eruptions.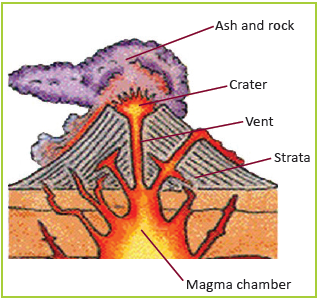
Fig. 11.14 How a volcanic eruption occurs.
Effects of volcanic eruptions
Massive volcanic eruptions result in the following.
1. Displacement of people.
2. Loss of lives.
3. Destruction of settlement areas and property.
4. Air pollution that occur s from the volcanic ashes and gases that are released.
5. Destruction of transport and communication lines.
6. Destruction of farmlands leading to food shortages.7. Destruction of power lines and other communication infrastructure.
8. Destruction of vegetation and wildlife.Prevention and control measures
Volcanic eruptions cannot be prevented. However, people can be educated on the different things they can do to protect themselves and their families when the eruptions occur.
Work in groups of three.
1. Study the pictures below and explain what is taking place. Explain the causes and effects of each.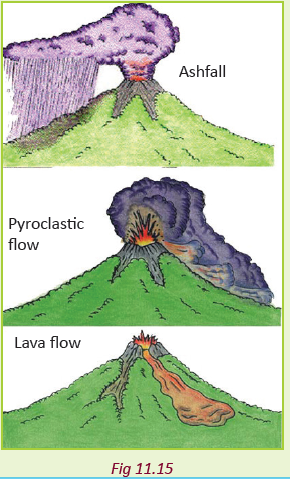
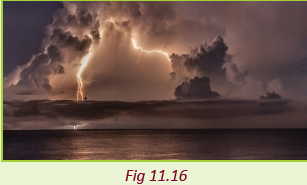

2. Find out from a resource person the types of natural disasters that have occurred in your local area in the past.
3. Discuss the natural disasters that you have been explained to the resource person.
4. Identify their causes and effects and write down short notes in your notebooks.
5. Find out how the people reacted and responded after the occurrence of the hazard.
6. Find out the disaster preparedness, response and prevention measures the people and the government have adopted in case of a reoccurrence of the disaster.
7. Present your findings in class.Human-caused hazards
These are disastrous events caused directly by identifiable, deliberate or negligent human actions. They are also known as non-natural disasters. These hazards include pollution, wars, famine, accidents, fires and terrorism.Pollution

Work in groups of three. Study the pictures below and answer the questions that follow

Fig 11.18
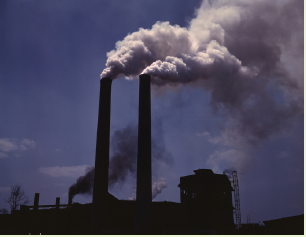
Fig 11.19

Fig 11.20
1. Define the term pollution.
2. Name the types of pollution shown in Figure 11.20.
3. Give the effects of pollution on the environment.
4. Identify the types of pollution in your local environment.
5. Suggest possible measures that can be put in place to overcome the problem of pollution.
6. Present your findings in class.Pollution is the introduction of contaminants into the environment that cause undesirable effects. It causes harm to people and other living things and also to the environment.
Sewage water, dust and smoke are examples of contaminants. Pollution can be classified into air, water, ground (or land) and noise pollution.Causes of air pollution
1. Emissions from industries – The smoke and fumes from industries cause air pollution. Large amounts of carbon monoxide are released into the atmosphere introducing impurities in the air.
2. Burning of fossil fuels – Fossil fuels are natural fuels such as coal, oil and gas.
Vehicles and other means of transport use these fossil fuels. When the fuels burn, they release fumes. The fumes cause air pollution. This is a major cause of air pollution in Rwanda. It is quite
difficult to manage.
Fig. 11.21 Fumes from a car.
3. Chemicals – Chemicals used in agricultural production also cause pollution. Herbicides and pesticides used in dusting crops are usually released in the air causing pollution.
4. Dust – When there is too much wind, dust is blown from the surface of the earth. This leads to air pollution.Causes of water pollution
1. Fertilisers – Fertilisers are applied in the soil during agricultural production.
When it rains, they are carried away by rain water and deposited into sources of water such as rivers and lakes.
2. Sewage water – There is no proper mechanism for sewage disposal in many areas. Sewage water is mostly released into water sources and this causes pollution. It also leads to the spread of water borne diseases.
3. Dumping of dirt into water sources – People dump waste products such as human waste, animal waste and domestic wastes into water sources. This causes pollution.4. Oil spills – Oils spills from ferries and ships lead to pollution of the water sources. This contributes to destruction of aquatic life.
Fig. 11.22 Oil spillage in a water body
Causes of land pollution
1. Excessive use of fertilisers – Excessive use of fertilisers in agricultural processes lead to contamination of soils.
2. Poor disposal of garbage – There are no appropriate areas for disposing garbage. This has lead to emergence of random dumping sites that cause land pollution.
Causes of noise pollution
1. Industries – Industries have a lot of machines that produce very loud noise.
These sounds are unpleasant and therefore cause pollution.
2. Means of transport – Various means of transport such as large motor vehicles, trains and aeroplanes produce very loud noise. The noise causes pollution.3. Entertainment activities – Entertainment activities are also a cause of noise pollution. Examples are weddings, parties and music from entertainment areas.
Effects of pollution
1. Climate change – Pollution leads to the release of gases into the atmosphere.
This causes the climate to change. Temperatures become high due to global warming.
2. Poor health conditions among people
– Air, water and land pollution have adverse effects on the health of people. Water pollution leads to the spread of water-borne diseases. Air pollution leads to respiratory infections.
3. Death of aquatic life – Oil spillage in water bodies deprives aquatic animals of oxygen. This causes them to die.
4. Reduction in agricultural production – Climate change causes unfavourable
conditions for agriculture. The crop yields reduce leading to food insecurity. Excessive use of fertilisers also causes soils to be acidic. They are therefore not suitable for crop production.
5. Formation of acid rain – Chemicals and smoke in the air cause the formation of acid rain. Acid rain destroys aquatic life. It also destroys the leaves of plants leading to loss of vegetation cover.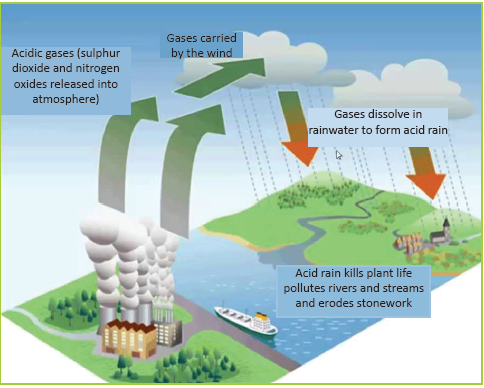
Fig. 11.23 Formation of acid rain
Prevention and control measures
1. Recycling – Waste materials should be recycled to reduce the amount of waste products dumped in water bodies and on land. It will also help reduce the number of dumping sites.
2. Combustion of gases – Gases and vapours should be burnt using flames.
This will ensure that they are released into the environment in the form of less harmful products. For example, carbon monoxide should be burnt and released as carbon (IV) oxide which is
less harmful.
3. Maintenance of vehicles – Motor vehicles and other means of transport should be properly maintained to reduce the amount of fumes released in the environment.
4. Sewage treatment – Sewage water should be treated and the water recycled. The solid wastes should be disposed of appropriately and not in the water sources.5. Reduce use of chemical fertilisers – The use of chemical fertilisers should be reduced. Farmers should opt for more environmental friendly methods such as using farmyard manure and green
manure.
6. Sucking of oil spills – Oil spills should be sucked from the surface of water
immediately they occur. This reduces water pollution and prevents the death of aquatic life.Wars

Work in groups of three.
Use geographical documents and the Internet to research on war as a human
hazard. Use your findings to answer the following questions.
1. What is war?
2. Outline the possible causes of war.3. Explain the effects of war on:
• human activities
• the economy.
4. Explain the possible measures that can be taken to stop the occurrence of war.
5. Present your findings in a class discussion.War is a conflict between large groups of people. It involves physical force inflicted by use of weapons. War takes many forms such as armed conflicts, hostilities and police action. The 1st and 2nd World Wars are examples of war. War has resulted in great destruction on the economy, human suffering and loss of lives.
Causes of war
1. Competition – Competition for some resources that are unfairly distributed or which are inadequate result in conflicts and war. Such resources include jobs, political positions, territory, housing, cultivable land, fresh water and pasture.
2. Poor governance – This makes people unhappy with the government. It makes people or groups of people to fight for independence from the central government.
3. A clash in people’s beliefs – Religions and political views give a group of people a sense of identity. When these beliefs are interfered with, it results into war.
4. Ethnic differences – Ethnicity gives people a sense of identity and belonging. A threat to this results into violence or conflicts.Effects of war
1. It leads to the death of people and human suffering.
2. It leads to displacement of people from their homelands creating refugees.
3. It leads to destruction of property.
4. The soldiers and victims suffer from mental and psychological illnesses.
5. It results in food shortages since farmers abandon their farming activities as they look for safety.
6. There is economic stagnation due to the destruction of the main infrastructure.
It is also very costly to finance wars. The resources that would have been used for economic development are diverted to war.Prevention and control measures
1. Promote peace education – People should be taught the importance of peace and harmony in the country. This will reduce hostility which may lead to war. They should also be taught the
effects of wars to human beings and o development of the country.
2. Increase security – Security personnel should be deployed to various borders of the country. This will help to protect the country against external attacks which may result to war.Famine

Do this in groups.
Your facilitator will provide you with video clips on various areas that have been hit by famine. Watch the video carefully. After watching, find out the following.
(a) What are the causes of famines?
(b) Give the effects of the famine to a country.
(c) Suggest possible prevention measures to the above hazard.
(d) Present your findings in a class discussion.Famine is a widespread scarcity of food. It is caused by many factors. Famine is accompanied by cases of starvation, malnutrition and outbreak of diseases. This is a huge problem that affects very many countries in Africa. There was a great famine in Rwanda in the year 1943 – 1944.

Fig. 11.24 An area facing famine.
Causes of famine
1. Conflicts – When a country or an area is engaged in war, the government uses funds to deal with the war. When a natural hazard such a drought affects an area, the government lacks funds to
deal with the situation.
2. Climate change – Global warming results in poor agricultural production. It leads to reduced amounts of rainfall received in an area. This can result in famine.3. Natural hazards – Natural hazards cause people to fight for the scarce resources.
They also cause food insecurity due to low agricultural production.
4. Poverty – People living in poverty do not have access to land needed for agricultural production. Food will thus not be available to ensure food security.
5. Poor infrastructure – Poor transport and communication facilities in a country cause poor food distribution. People living in areas with poor road networks cannot easily access food.Effects of famine
1. Malnutrition – Lack of all nutrients required by the body causes health problems. These health problems may lead to death.
2. Epidemics – During famine, people have access to very little food and water. They do not get enough nutrients needed to protect the body against attacks by diseases. Therefore, they
are prone to attack by diseases which may lead to an increase in number of deaths.
3. Starvation – Famine leads to lack of food in an area or country. This in turn leads to starvation. Extreme cases of starvation lead to death.
4. Migration – People usually migrate from areas that have been hit by famine in search of food. They later decide to settle in those areas. This leads to population increase in some areas.Prevention and control measures
1. Improve infrastructure – Transport and communication infrastructure should be improved. This will ensure that the roads are accessible and thus food can be distributed equally in all areas of the
country. This will help prevent famine.
2. Conflict resolution – Conflicts that occur should be resolved peacefully without engaging in war.
3. Disaster preparedness – People should be taught on how to handle different hazards when they occur. The government should also set up disaster response centres that will ensure that people experiencing famine are given food.
4. Improved farming methods – Improved farming methods such as building of greenhouses should be adopted.This will ensure constant food supply throughout the year. People living in dry areas should practise irrigation farming to ensure there is crop production hence food security. Organic farming should also be encouraged to reduce land pollution which leads to poor crop yields.Accidents

Work in pairs.
Use geographical documents and the Internet to research on accidents as a human hazard. Use your findings to answer the following questions.
1. What are the different examples of accidents that human beings face?
2. Outline the possible causes of accidents.3. Explain the effects of accidents on the economy.
4. Explain the possible measures that can be taken to reduce accidents.
5. Present your findings in class.An accident is an unplanned or unfortunate event that happens unexpectedly. It also happens unintentionally. Accidents result in injuries or damage. Accidents can occur when doing different activities such when travelling, doing domestic chores like cooking, playing, walking and working.
Some accidents also occur as a result of poisoning or electric shock.
Fig. 11.25 A fire accident.
Causes of accidents
1. Careless and drunken driving – Road accidents cause a lot of deaths in the country. They mostly occur due to careless driving. They also occur due to speeding. Some drivers drive under
the influence of alcohol thus cause accidents.
2. Poor weather conditions – Poor weather conditions also lead to travel accidents. When there is fog or mist, drivers and pilots are not able to see clearly.
3. Failure to observe road safety rules – Many of road users do not obey road safety rules. This increases the number of accidents that occur.4. Careless handling of machines and equipment – If machines are not handled well when working, they can cause to injury to those using them. This happens more in industries. Electric appliances should also be handled well and used for the purposes they are intended for to avoid accidents.
5. Poor housekeeping practices – The home is where many accidents that can be prevented occur. This is due to poor housekeeping practices and carelessness. For example, when water spills on the floor and it is not wiped, it can cause falls.
6. Gas leaks in homes – When one does not turn off the gas knob well, it causes the gas to leak. A fire can start when a match is lit.
7. Poor road network – Roads with a lot of potholes and those that are unpaved can lead to road accidents.
Effects of accidents
1. Death – Many accidents are fatal. They cause the loss of lives of very many people. Road accidents cause very many deaths in the country daily.
2. Loss of property – When accidents occur, property worth a lot of money is lost. Infrastructure is also destroyed.
3. Disability – Those who are injured from accidents may become disabled. This prevents them from doing their work as they were used to. They have to learn new ways of coping with the situation.4. Reduced development – Accidents lead to loss of lives. This causes a reduction in the population of an area. The rate of development thus reduces due to scarcity of human labour.
Prevention and control measures
1. Education on road safety – People should be educated on how they can use roads safely. They should also be taught the importance of observing road safety.
2. Being careful – People should be careful when performing different tasks or when handling machines to prevent accidents.
3. Construction and maintenance of roads – Road networks should be improved to ensure that the number of accidents are reduced.
4. Avoid speeding when driving – Drivers should be cautioned against speeding. Speed governors should be installed in vehicles to ensure that drivers drive within acceptable speed limits.
5. Proper housekeeping practices – The house should be kept clean and everything should be stored where it is supposed to be to reduce accidents.
Gas cookers should be turned off appropriately to prevent gas leaks which may lead to fire outbreaks.Responses to hazards

Work in groups of three.
Use geographical documents and the Internet to research on the different responses to hazards. Use your findings to answer the following questions.1. What is a response to a hazard?
2. What do you understand by:
• short-term response
• medium-term response
• long-term response?
3. Give reasons why it is necessary to respond after the occurrence of a hazards.
4. Identify some of the hazards that have occured in Rwanda.
5. For each hazard in (4) above, outline the short-term, medium-term and longterm responses that have been carried out to overcome those hazards.
6. Give some of the challenges that face responses to hazards in Rwanda.
7. Present your findings in class.A response to a hazard is a deliberate effort or measure that is put in place to ease the problem. There are three responses to hazards.
• short-term
• medium-term
• long-term(a) Short-term responses
These are responses that occur in the days and weeks immediately after a disaster has occurred. Short-term responses mainly involve search, rescue and helping those injured or affected. Short-term responses are rescue measures. They include the following.
• Search and rescue operations.
• Provision of machinery and equipment for use in the search and rescue operations such as helicopters, boats and bulldozers.
• Recovery of dead bodies and survivors.
• Provision of food, tents and water.
• Sending of medical teams to the affected areas.
• Provision of aid money to help victims and their families.
• Burying of the dead victims to stop the spread of diseases.(b) Medium-term responses
These are responses that occur in weeks and months after a disaster has taken place.
These responses are aimed at providing services and facilities to help the victims of a hazard to settle and continue with their normal lives. Medium-term responses are rehabilitation measures.
They include the following.
• Medical rehabilitation and counselling.
• Reconnection of water and electricity supplies.
• Rebuilding of homes.
• Rebuilding of transport lines such as roads, railway lines, airports and ports.
• Reconnection of communication lines such as the telephone masts and Internet.
• Clearance of damaged buildings.
• Re-building and reopening of schools, hospitals, colleges, universities, shopping malls, offices and banks.
• Cancellation of debts.
(c) Long-term responses
A long-term response is a response or activity that goes on for months or years after a disaster has occurred. The aim of the long-term response is to jump start the local economy. Long-term responses are reconstruction measures.They include the following.
• Building of new shelters such as schools, hospitals and houses.
• Cancellation of debts.
• Improvement on the disaster monitoring and warning systems such as those used for earthquakes.
• Improved education provision to people on hazard risks and their possible solutions.
• Provision of long-term aid or donations to a region or country.
• Creation of enterprise zones in order to encourage investment.
• Taking refugees back to their homes.
Work in groups of ten.
1. Act out a skit to show an area that has experienced a hazard. Use a hazard of your choice.
2. Respond to the hazard that has occurred and offer short-term solutions to the affected people.
3. Outline the medium term and long term solutions that should be offered in response to the hazard.
Project work.
Work in groups of six.
Your teacher will provide you with writing materials and tools.
1. Prepare posters and leaflets on causes and effects of natural and human caused hazards that might occur in and outside your school’s environment.
2. Each group should carry out an awareness campaign targeting the rest of the school to educate the other students on the causes and effects of the possible hazards. Extend the campaign and education to people outside the school.
3. Educated them on disaster preparedness and appropriate responses to each hazard.Did you know?
• When magma reaches the earth’s surface it is referred to as lava. When the lava cools down, it forms rocks.
• Most natural disasters are caused by weather.
• Floods are the most widespread natural disaster aside from wildfires.
• Earthquakes are the deadliest of all natural disasters.
• The greatest famine in histor y killed around 45 million people in China between 1958 and 1962.
1. Define a hazard.
2. Giving examples, discuss the different types of hazards.
3. The table below shows some of the hazards that have been experienced in Rwanda. Fill in the blank spaces.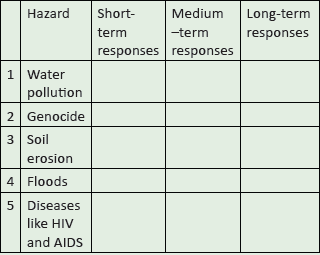
4. Explain the importance of responses to hazards in Rwanda.
5. Identify some of the challenges that Rwanda faces in the attempts to respond to hazards.UNIT 12:Population and settlement

By the end of this unit, you must be able to explain general population concepts and settlement patterns (rural and urban).
Unit objectives
By the end of this unit, you must be able to:
(a) define population and associated concepts
(b) identify types of settlement
(c) define concept of migration.
Work in groups of four.
1. Count the number of people in your classroom.
2. Include all the students, your facilitator and any other person present at the time of counting.
3. Give the number of males and females, separately.
4. Use the data collected to draw a chart or a picture of your classroom. Use symbols to show the statistics of your class.
5. Display your chart or picture on the class notice board.
6. Describe the composition of the people in your class.7. Why is it important for your facilitator and school management to know the number of students in a class?

Work in pairs. Your teacher will guide you to fill in the table below with the required
details.Table 12.1 The population of our school.
Category of people (persons) Number Females
(a) Learners
(b) Teachers
(c) Workers such as cleaners, cooks and
security personnel.
(d) Administrators
(e) Visitors such as the inspectors.Males
(a) Learners
(b) Teachers
(c) Workers such as cleaners, cooks and security personnel.
(d) Administrators
(e) Visitors such as the inspectors.(a) Analysis
(b) The number of females
(c) The number of males
(d) The total number of the populationGeneral description or
comment on the composition of the school’s populationstructure.(Compare the male and female numbers)
Population
Work in pairs.
1. Define the term population.
2. Explain the meaning of population census.
3. Why do you think it is important for countries to carry out population census?
4. Give the term given to the study of population.Population is a term used to refer to the number of people living in an area at a given time. Using the findings of Activity 12.1, you are able to know the population of your class. At the same time, Activity 12.2, assists you to know the population of your school. Suppose your class was a country, you would be able to know the number of people living in the country. The official counting exercise
is known as population census.
Population census is the act of counting people living in a given area over a specific time. Population census is usually done by countries at intervals of ten years. Rwanda also carries out its population census after every 10 years. The last population census in Rwanda was in 2012.It is therefore expected that there will be a population census in 2022.
The study of populations is referred to as demography. This field deals with studying the population distribution, population structure and composition, factors that influence population distribution and the effects of population levels on the available resources and socio-economic state of the
society.The population structure and composition

Do this in pairs.
1. Use the data findings in Activities 12.1 and 12.2 to do this activity.
2. Determine the age of the population of your school.
3. Fill in the table below.Table 12.2 The age group of the population of our school.
Category of people (persons) Age group Number of people Females 0 – 4
5 – 9
10 – 14
15 – 19
20 – 24
25 – 29
30 – 34
35 – 39
40 – 44
45 – 49Females 50 – 54
55 – 59
60 – 64
65+Males 0 – 4
5 – 9
10 – 14
15 – 19
20 – 24
25 – 29
30 – 34
35 – 39
40 – 44
45 – 49
50 – 54
55 – 59
60 – 64
65+Analysis
The number of females.
The number of males.
The total number of the population.General description or comment on the composition of the school’s population structure.
(Compare the male and female numbers in terms of age.)
1. State the number of females and males found in your school.
2. Why do you think it is very important to know the above numbers?
3. Identify the largest age group in your school and explain why it is so.
4. Using the answers obtained in 1, 2 and
3 above, explain what a population structure is.Population structure refers to the composition of a given population. It is broken down into categories such as age and gender. The population structure of a given country is represented diagrammatically by use of population pyramids. The pyramids are commonly known as the Age and Sex graphs.
The importance of a population structure
(a) It helps governments to project the future growth and economic prosperity of countries.
(b) It provides the data that is used by policy makers and economic planners. The data is used when planning and budgeting for the nation. For example it helps to determine the number of
schools, hospitals and distribution of clean water. Electricity supply, roads and recreational facilities in a given area can also be determined.
The information collected is then statistically represented. This representation gives a visual interpretation of the analysis of the population composition.
The nature of a population pyramid
-When the population structure has the greatest population lying between 0–14 years, it is a young population.
- Most developing countries have a population pyramid that is broad at the base. This means that there are more young people and few aged ones.
- On the other hand, the population structure of a developed country is narrow at the base and wider at the apex when compared to that of a developing country.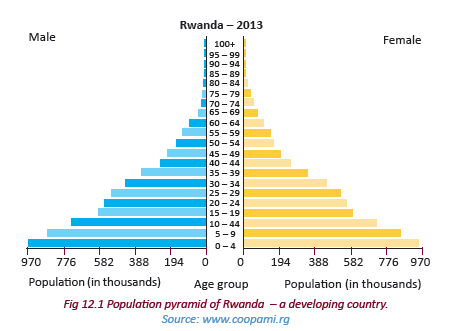
The middle part of this population structure is wide. This is reflected by bulging bars as illustrated below.
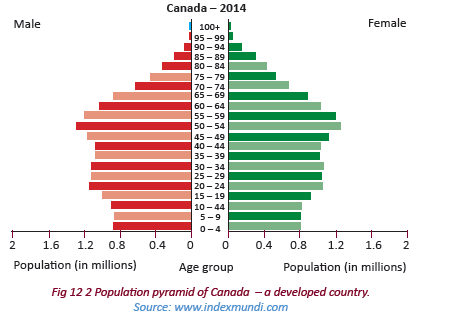
Population distribution and density

Do this in groups of three.
1. Use the five classes; Senior 1, Senior 2, Senior 3, Senior 4, and Senior 5 as representatives of the provinces of Rwanda.
2. Count the number of learners in each class.
3. Describe the way population is spread out in your school.Population distribution is the spread of people across the area where people live.
An analysis of population distribution shows areas with many people or few people and areas that are moderately populated.
This implies that population can hardly be evenly distributed. Some areas have dense, low and sparse populations. Population distribution is represented using population
maps. On such maps, dots are used to represent settlements. The maps are known as dot maps. There are other population maps that use shades of different colours. They are called choropleth maps.
Areas with many dots imply dense populations. Areas with scattered dots indicate sparse populations.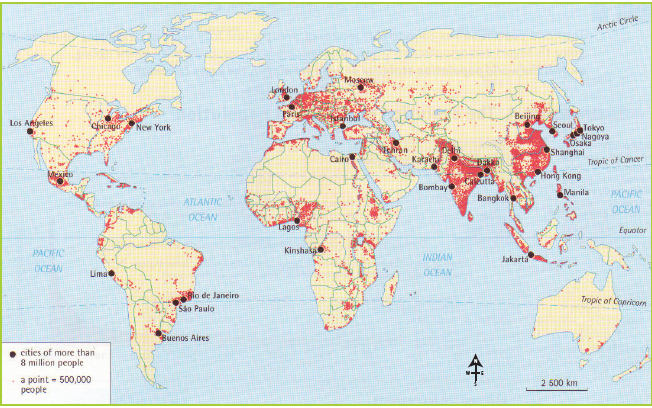
Fig 12.3 United States Hispanic population dot map.
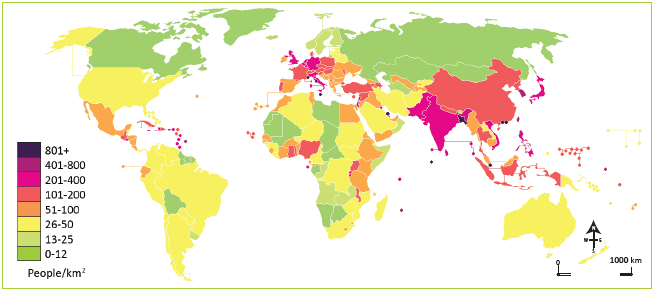
Fig 12.4 A choropleth map showing global population distribution.
Task 12.1
1. Define the term population distribution.
2. Describe a population structure.
3. Explain the composition of a population structure of a:
a) developing country
b) developed country.
4. Describe how population distribution is represented in geography.Population density
Population density refers to the number of people living per unit area. The unit area is usually in square kilometres. To determine the population density of an area, the total population of an area is divided by the total size of the area. The population density is expressed as persons per square kilometer.Suppose country Y has a total population of 29,500,500 people and a total land area of 156,578 km2. Its population density will be as follows:
Therefore, the population density of area Y
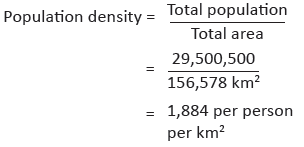
Therefore, the population density of area Y is 1,884 persons per square kilometer.

Use the data indicated in the Table 12.3 to determine the population density of each
country.Table 12.3 Population densities of different countries.
Country Total population Total area in km2 Population density X 11,565,810 26,671 ------------------------- Y 2,050,678 276,106 -------------------------- Z 50,000,658 25,000 -------------------------- E 38,689,654 102,000 --------------------------
1. Identify the country with the highest population density.
2. Identify the country with the lowest population density.
3. Explain the problems a country with a high population density is likely to face.
4. Examine the challenges a country with a low population density is likely to experience.
5. Present your findings in class.
Project work.
Work in groups of five.
1. Analyse the effects of a high population density on the environment where you live.
2. Suggest how the problems arising can be solved in order to use the environment sustainably.
3. Present your findings in class.enables the country to allocate resources appropriately. This is in proportion to the number of people.
Task 12.2
1. Define the term population density.
2. Explain how the population of a given country is obtained.
3. Why is it necessary to determine the population densities of various parts of Ma country?
4. Calculate the population density of country X, whose total population is 2,506,761 people and total area is 2,565 square kilometres.Population growth

Do this individually.
There is a large inflow of refugees from Burundi entering into Rwanda. The refugees are fleeing from insecurity and famine.
Unfortunately, this is happening when the infant mortality rate in Rwanda has declined
tremendously. The life expectancy level in Rwanda has also risen.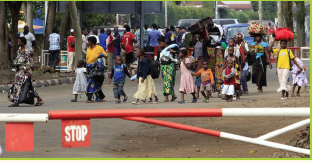
Fig 12.5
1. Explain the effects that this refugee problem will have on the population of Rwanda.
2. Identify the main factors that have forced refugees from Burundi to enter Rwanda.
3. Why did the refugees decide to take refuge in Rwanda?Population growth refers to the increase in the number of people living in a given area or country. The population of the world has been steadily increasing over time.
The population of Africa is also rapidly increasing. To determine whether there has been population growth, the following formula is used; (birth rate + immigration) – (death rate + emigration).(a) Birth rate

Do this individually.
1. Study the population of your home area.
2. Compare it with how it was last year.
3. Do you notice any difference?
4. Explain the difference noted.
5. Present your findings in class.Birth rate refers to the number of live babies born in a year for every 1000 people in the total population. It is calculated using the following formula.

Suppose in a certain year, new born babies were 200,000 in a total population of 10,000,000 people. The birth rate is as follows;

The birth rate is approximately 20 per every 1,000. This means that every year there are
20 newborn babies.
The birth rate of an area is closely affected by fertility.
(b) Fertility rate
Work individually.
1. Identify the following families in your neighbourhood:
(a) families with many children
(b) families with few children
(c) childless families.
2. Explain the varying sizes of families.Fertility rate refers to the number of children that would be born to a woman in her lifetime. It is calculated per every 1000 women in a population. Fertility rates vary in different areas. Other reasons that account for differences in fertility rates include economic constraints, cultural and
traditional beliefs, poor nutrition by the mothers and diseases.Task 12.3
1. Explain the difference between fertility rate and birth rate.
2. Explain the factors that influence the fertility rate in any given region.
3. What would happen to population sizes if the fertility rate:
(a) increases
(b) decreases?(c) Death rate

Do this in pairs.
In a certain year in a village in Gasabo district, there were many grandparents taking care
of their grandchildren. After 10 years, the grandchildren were found alone taking care of themselves. Their grandparents could not be seen anymore.
(a) What do you think happened to that village?
(b) Why were the grandchildren left alone?Death rate refers to the number of people dying per 1000 people in the total population. It is calculated using the following formula:
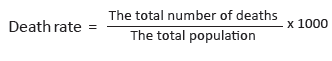
Let us see a scenario;
In 2014, country X registered 60,000 deaths in a total population of 12,000,000 people.
Calculate the death rate of country X.
This means that for every 1000 people of the general population, 5 persons died in that year.
(d) Growth rate
Growth rate refers to the natural change in the number of people living in a given area or country. This change is by an increase or decrease expressed as a percentage. Growth rate is also defined as the ratio of birth rate and death rate per 1000 people.
This is determined by the formula:
There are different types of growth rates.
Rapid growth rate - refers to a situation where birth rates are high and death rates are
low. This leads to a fast growing population.
Slow growth rate - refers to a nearly stagnant population growth where both the birth and death rate are low. It is experienced in countries such as Britain and Sweden.
Zero growth rate - is also known as constant growth rate. It is a stable population growth
rate where birth rates are equal to death rates and the rate of population increase is
therefore zero.
Negative growth rate- is a type of growth rate where birth rates are lower than death
rates. This results in a declining population.
(e) Natural increase
This is the difference between the number of births and number of deaths. It occurs when the birth rate exceeds the death rate.
This may be caused by high birth rates, low death rates and influx of people like
refugees into a country.
(f) Natural decrease
This is a condition that occurs when the death rate exceeds the birth rate. It results in a low population growth rate. A natural decrease could also be caused by epidemics such as HIV and AIDS, natural hazards such as floods, severe drought, pests and diseases and civil wars.
Do this in pairs.
Use the following data to calculate the birth and death rates of various countries.Table 12.4

1. Define the term death rate.
2. Differentiate between birth and death rates.
3. Comment on country X and Y and suggest factors that led to their differences in birth and death rates.
4. Calculate the growth rate for each of the countries.
5. Identify some factors that may influence the population growth rate.
Do this in groups of three.
Use the Internet, geography textbooks and other geographical documents.
1. Find out other concepts and terms related to population studies.
2. Describe the characteristics of the concepts.
3. Write down your findings.
4. Discuss them in a class presentation.Settlement

Do this in pairs. Discuss and answer the following questions.
1. Where did the early man live?
2. Where do people live?
3. Describe where you live.
4. Why is it necessary to have homes?
5. Identify the factors that influence the establishment of a home.
6. Draw a village where people live and display your picture in the class.A settlement refers to a place where people live and establish their homes. It refers to forms of human habitation from a single dwelling to the largest city.
People choose to build their homes in given areas due to factors that may be favourable.
They include the following.
(a) Where there is a reliable source of water.
(b) In places with fertile soils that can support plant growth.
(c) In locations with enough supply of food such as near the market or an agriculturally rich region.(d) In places with security such as near the king’s palace, state house or army barracks.
(e) In areas with favourable relief that is generally flat or gently sloping areas. This is for easy accessibility and infrastructural development.
(f) In places that are disease and pest free.
(g) Strategic positions or sites such as at a place where many roads meet.Types of settlements

Observe the settlements around your home area and school. Answer the following questions in a class discussion.
1. Describe the settlements.
2. Name the types of settlements you have observed.
3. Which type of settlement is associated with roads, rails and towns?
4. Which type of settlement is associated with rivers and farms?Rural settlements are villages occupied by people involved in primary production such as subsistence agriculture.
Urban settlements are areas occupied by people who are involved in trade, commerce and
industrial activities. They comprise of towns or urban centres and cities.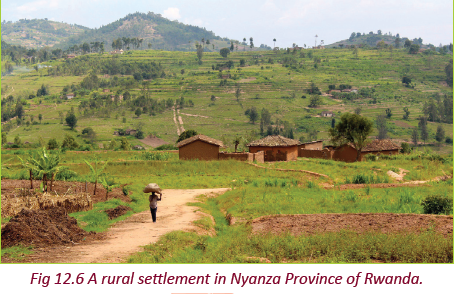
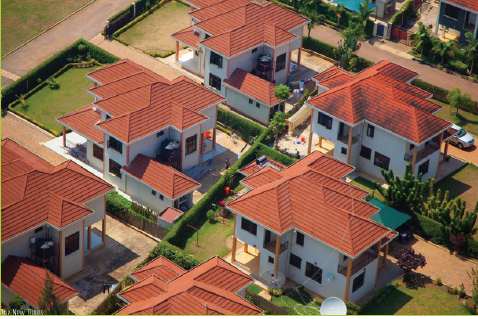
Fig 12.7 An Aerial view of housing units of urban settlements in Kibagabaga, Gasabo District.
Both rural and urban settlements take any of the following settlement patterns.
(a) Nucleated settlement pattern.
(b) Linear settlement pattern.
(c) Sparse settlement pattern.(a) Nucleated settlements
This is a settlement pattern where people cluster together to form compact
settlements. The clusters may be around a market, a source of water or a farm that has
been divided into strips.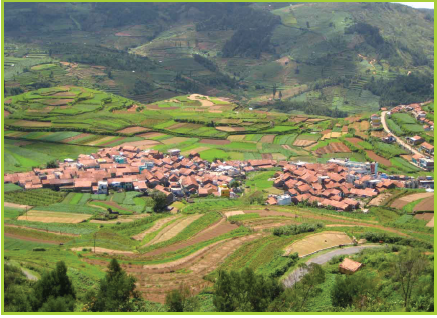
Fig 12.8 A nucleated settlement pattern in Poomparai village in India.
(b) Linear settlements
This is a common kind of settlement pattern. Homesteads and houses are arranged in lines.The houses are located on either side of certain features like roads, railways, rivers or along a coast. Most linear settlements develop because of the convenience of nearness
to a transport route.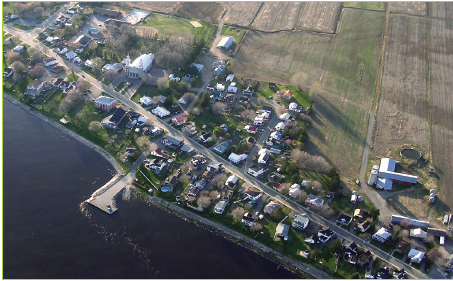
Fig 12. 9 A linear settlement pattern along Saint Lawrence River in Quebec Canada.
(c) Sparse or scattered settlements
This is a type of settlement consists of isolated dwellings which are scattered over a large area. This type of settlement is common in areas where rainfall is very low and unreliable in nature. Practices such as hunting, shifting cultivation and food gathering and nomadic pastoralism are a
main economic activity.
Fig 12.10 A dispersed settlement pattern in Darrenfelen and Cwm Dyar-fach in Britain.

Do this in pairs.
1. Observe the settlements in the area around your school.
2. Identify the different types of settlement patterns.
3. Give their characteristics and reasons why they exist.
4. Record your findings for a class discussion.Task 12.4
1. Define the term settlement.
2. Explain the meaning of the following.
(a) Rural settlement.
(b) Urban settlement.
3. Differentiate between:
(a) nucleated settlement and sparse settlement
(b) linear and isolated settlementMigration
Do this in pairs.
Study the photograph shown below and answer the questions that follow.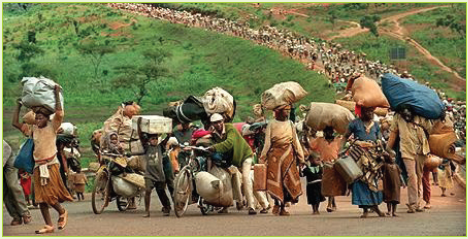
Fig 12.11 Refugees from Rwanda.
1. Explain what is happening in the photograph.
2. Identify the causes of such a mass movement of people like those in the photograph.
3. What are the challenges that such people face during and after such undesirable movement?
4. Suggest what can be done to stop such movements from happening in our country.Migration is a term used to refer to the movement of people from one place to another for specific purposes. The purposes could be to search for jobs, search for pasture, search for better living conditions or as a result of civil war.
Types of migration
There are different types of migration.
The types are classified based on the original location of a person and their final destination. They include the following.(a) Internal migration
This is the movement of people from one place to another within the same country.
It does not include crossing of borders of a country.(b) External migration
This refers to the movement of people from one country to another. It involves crossing the borders of a country. This means that they emigrate from one country to another.
When someone migrates from one country to another, the person is known as an emigrant. The same person in the receiving country is known as an immigrant. The processes of movement are known as emigration and immigration respectively.
Study the table below and fill in the missing information.
Table 12.5

Other types of migration
(a) Voluntary migration
This is where an individual moves from one place to another without being forced. A person moves out of his or her own free will. The movement could be between continents, countries or certain parts of the same country. This is sometimes referred to as “analysed migration”. The parties involved study the advantages and disadvantages of moving and decide to leave willingly.(b) Involuntary migration
This is forced migration where an individual shifts from a place to another due to unfavourable factors. A person moves against his or her will. For example, the government may decide to resettle a given population due to a need. The need could be such as infrastructural development. Other factors that can force people to move include war, genocide or civil unrest in a country.(c) Permanent migration or long-term migration
This is the movement of people from the source area to another place with no intention of returning back to their origin.(d) Temporary migration or short-term migration
This is the movement of people from the source area to another part with an intention of returning to their homes. It is also referred to as a “return migration” or short-term migration. This form of migration is practised by businessmen, tourists and students.
There are other types of migration that are found on villages and towns. They are presented in Table 12.6.Table 12.6 Types of migration.
(a) Rural – urban migration This is the movement of people from villages
to cities and towns.(b) Rural – rural migration This is the movement of people from one
village to another village.(c) Urban – urban migration This is the movement of people from one
city to another(d) Urban – rural migration This is the movement of people from cities
or towns to villages.
Use Geography textbooks, the Internet, maps and other documents.
1. Find out the types of migration that exist in Rwanda. Give examples.
2. Note them down and discuss your findings in a class presentation.Did you know?
• About 50% of the world population is under 25 years old.
• The average life expectancy is 80 years old for people in industrialized nations, and 53 years old for Sub-Saharan Africa.
• The continent with highest population is Asia that accounts for 60% of world’s population.
• Early human migrations are thought to have begun when Homo Erectus first migrated out of Africa to Eurasia.
• The largest migration corridor in the world is the Mexico – USA.
1. Define population.
2. Explain the meaning of the following terms:
(a) population structure
(b) population distribution and density.
3. Why is it important for governments to carry out census in their countries?
4. Differentiate between:
(a) birth, death and growth rates.
(b) natural increase and decrease.
5. (a) Define settlement.
(b) List and briefly describe three types of settlements.
6. (a) Define migration.
(b) Mention and briefly explain the two main types of migration.
(c) Give four reasons why people migrate.UNIT 13:Economic activities

By the end of this unit, you must be able to categorise the types of various economic activities and their importance on development.
Unit objectives
By the end of the unit, you must be able to:
(a) define an economic activity
(b) state the types of economic activities
(c) identify the importance of various economic activities.Economic activities

Work in groups of three under the guidance of your teacher.
1. Go outside the school and look around.
2. Identify and describe the activities that people do to earn some money.
3. Tell your teacher what the people who live near you at home do to earn some money.
4. Why do the people do the activities that you have mentioned above?
5. Record your findings in class.
6. Present your findings in a class discussion.An economic activity is an action that involves the production, distribution and
consumption of goods and services.Types of economic activities
There are three main categories of economic
activities.
• Primary
• Secondary
• Tertiary
(a) Primary economic activities
In pairs, study the following photographs and answer the questions that follow.
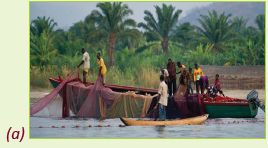
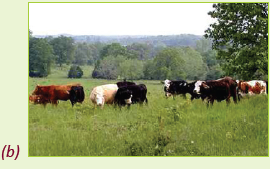
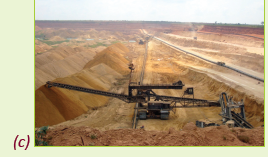
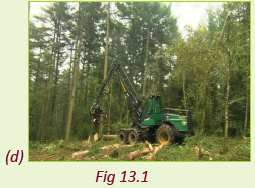
1. Identify the activities taking place in each of the photographs.
2. Give the products of each activity shown in the photographs.
3. Identify an area in Rwanda where each of the activities shown is carried out.Primary economic activities are those that involve the extraction of natural resources from the earth. These activities produce food and raw materials for other industries.
In most cases, people who are involved in primary economic activities live closer to the areas where the resources are found.
Examples of primary economic activities include crop cultivation, livestock farming,
mining, forestry, fishing and quarrying.• In crop cultivation, farmers dig the ground and plant seeds. The seeds later germinate into crops that mature. The crops are harvested to obtain food.
• In livestock farming, farmers keep a variety of livestock like cows, sheep, goats and pigs. These animals are kept for their meat, wool and skin.• In mining, the mineral resources are obtained from the ground through different means. They are then taken for further processing.
• Forestry involves tree harvesting where mature trees are cut down for timber.
• Fishing entails the catching of fish in water using nets and other fishing equipment.(b) Secondary economic activities

Study the photographs below and answer the questions that follow.
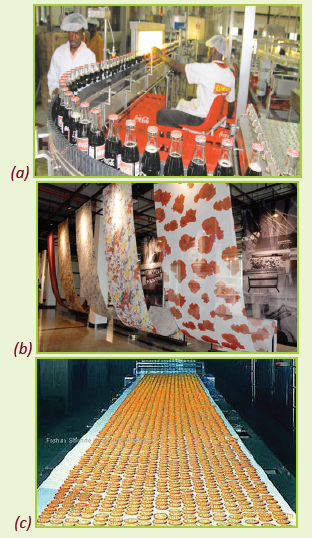

Secondary economic activities are those that utilise the products from the primary economic activities. Secondary economic activities change the raw materials into semi-processed or finished products. This is done by processing or manufacturing.
The raw materials are made more valuable through processing.Table 13.1 Secondary and primary economic activities.
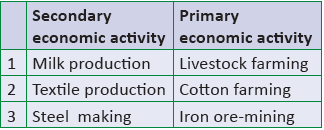
• In milk production, raw milk from the cows is processed into different milk products that include treated milk, skimmed milk and cheese.
• In textile production, raw cotton from farms is processed into cloth.
• In steel making, iron ore is refined into fine steel.(c) Tertiary economic activities

Study the photographs below and answer the questions that follow.


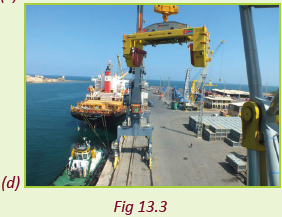
1. Identify the services provided in the photographs.
2. For each activity, identify one area in Rwanda where it is carried out.Tertiary economic activities are those that provide services to people. Examples of tertiary economic activities include transport and communication, tourism, banking, trade, insurance, administration and entertainment. Professionals who provide services include teachers, lawyers
and medical officers.
1. Classify the economic activities in the pictures below as either primary, secondary or tertiary.


Fig 13.4
2. Do you see some of these activities taking place near your home or school?
3. Discuss their importance to the community.Importance of economic activities

Work in groups of three.
1. Discuss the importance of the economic activities that take place near your school or home.
2. Do you think they are of importance to the country? Discuss their importance.
3. Write them down in your note book.
4. Discuss them in your groups and then present your findings in a class presentation.Economic activities play a very significant role in the sustainable development of a country.
(a) Economic activities provide food for the population, for example, fishing and farming.
(b) Economic activities provide employment to people, for example, those working in plantations or factories.
(c) The sale of products from primary and secondary activities is a source of income to people. This helps to raise the people’s standards of living. Products such as milk are sold to the consumers
and earn the farmers an income.
(d) Economic activities such as processing activities are a source of revenue to the government. This revenue is earned through taxation. The revenue is used for economic development of various
areas of the economy.
(e) Commodities from the economic activities are exported to earn foreign exchange. This revenue is in turn used for economic development of the country.
(f) The economic activities such as dairy or tea farming have led to development of transport and communication networks in the rural areas. For example, the construction of roads has led to
improved accessibility.
(g) The economic activities lead to production of commodities required by people for use. This has enabled people to have access to the basic needs and services. This leads to improved standards of living.
(i) Some economic activities such as tea processing and mining have led to the growth of towns.(j) Economic activities have led to equitable distribution of goods and services. People who do not produce a commodity are still able to get them easily. This is because they can buy the commodities that they do not have in exchange for money or for other goods and services. Services such as banking, insurance come close to the people who need them.
Improved standards of living and continuous investment into various economic activities leads to sustainable development.
1. Name some of the economic activities that take place in Rwanda.
2. List the products of the activities.
3. State the importance of the activities and products produced to the country and to the immediate community that engages in the activity.
4 Record your findings and present them in class for discussion.
1. Discuss how the government of Rwanda utilises the revenue from the economic activities.
2. Why is it important for the government to develop all areas of the country?
3. Discuss within your group and record your findings in your notebook.
4. Present your findings in a class discussion.Did you know?
• Most developing countries still engage in primary activities.• Agriculture remains the main primary activity undertaken by developing nations.
• Developing countries export raw materials to developed countries for processing then buy them back as finished products.
• All the three types of economic activities have a positive economic impact to a country.
• Tertiary activities offer support to both the primary and secondary economic activities.
1. (a) Give examples of primary economic activities in Rwanda.
(b) List some of the employment opportunities in the primary economic activities.
2. (a) What are secondary economic activities?
(b) Give examples of secondary economic activities that take place in your country.
3. (a) Define tertiary economic activities.
(b) Explain the importance of tertiary economic activities to primary and secondary activities.
(c) List some of the employment opportunities in the tertiary economic activities.
4. Outline the main economic activities in Rwanda.
5. Giving examples, explain the importance of the three economic activities to the economy of Rwanda.
• Aeration – is the process by which air is circulated through, mixed with or dissolved in a substance.
• Aerosol – a substance that is released from a container as a spray.
• Afforestation – establishment of a forest in an area where there was no forest.
• Agroforestry – agriculture that involves cultivation and conservation of trees.
• Alluvial soils – fertile soil deposited by water flowing over flood plains or in river beds.
• Altitude – the height of an object or point in relation to sea level or ground level.
• Aquatic – relating to water, living in or near water.
• Aquifer – an underground layer of water-bearing permeable rock.
• Aspect – the compass direction that a slope faces.
• Axis - an invisible line around which an object such as a planet rotates, or spins.
• Base – a substance that is slippery to touch, tastes bitter and changes the colour of indicators.
• Biodiversity – variety of life in the world.
• Calibrate – mark with a standard scale of readings.
• Canopy – the cover formed by the leafy upper branches of the trees in a forest.
• Capillarity – the process in which a liquid flows in narrow spaces like soil pores• Cartographer – a person who creates maps.
• Census – an official count or survey of a population.
• Ceramics – things made of clay and hardened by heat.
• Chlorofluorocarbon – a chemical containing atoms of carbon, chlorine, and fluorine. It is mostly used in the manufacture of aerosol sprays.
• Constriction – a place where something has become tighter or narrower; an obstruction.
• Consumption – using up of a resource.
• Continental movement – movement of the earth’s continents relative to each other
• Continents – part of the earth’s crust that rises above the oceans .
• Convectional currents – the transfer of heat by the mass movement of heated particles.
• Coordinates – each of a group of numbers used to indicate the position of a point, line or plane.
• Core – central and innermost part of the earth or other planet.
• Coriolis effect – the force that causes a moving object to change direction, towards the right in the Northern Hemisphere and the left in the Southern Hemisphere.
• Cosmic – relating to the universe.
• Crest – the top of a mountain or a hill.
• Crust – outer layer of the earth.• Crystals - a small piece of a substance that is formed when the substance turns into a solid.
• Data – facts and statistics collected together for reference or analysis.
• Decay – rotting of organic matter through the action of bacteria or fungi.
• Decomposition – the process of rotting.
• Deflect – to cause something to change direction.
• Degree of inclination – the angle at which a piece of land is raised in relation to a point of reference.
• Demography – the study of populations with emphasis on statistics such as births, deaths and income.
• Density – the mass per unit volume of a substance .
• Deploy – to spread out or arrange strategically.
• Deposition – the act or process of depositing.
• Digital – electronic technology that generates, stores and processes data.
• Dinosaur – an ancient reptile of enormous size.
• Disintegration – the process of breaking into pieces.
• Drainage – the process of removing excess water from a substance.
• Drizzle – light rain falling in very fine drops.
• Ecosystem – a biological community of interacting organisms and their physical environment.
• Elevation – the height of a geographical location above or below a point of reference.• Emigration – the act of leaving one’s native country with the intent to settle elsewhere.
• Equatorial trough – the low atmospheric pressure zone that lies between the subtropical high-pressure belts of the Northern and Southern Hemispheres.
• Erosion – Weathering in which surface soil and rock are washed away by the action of glaciers, water and wind.
• Exotic – originating in a distant or foreign country.
• Extrusive – relating to rock that has been forced out onto the earth’s surface as lava or other volcanic deposits.
• Farmyard manure – the traditional manure that is mostly readily available to the farmers. It is made using cow dung, cow urine, waste straw and other dairy wastes.
• Fauna – the animals of a particular region.
• Fieldwork – practical work conducted by a researcher in the natural environment.
• Flora – the plants of a particular region.
• Foreign exchange – currency from other countries.
• Forest reserve – forests that have been set side and protected by law in a certain country.
• Fossils – preserved remains of things of the old times.
• Gender – the state of being male or female with reference to social and cultural differences.
• Geography – the study of the physical features of the earth and its atmosphere.
It also studies human activities as they affect and are affected by the physical features. This includes the distribution of populations and resources, land use, and industries.• Glacial – relating to ice.
• Granule – a small grain or particle of something.
• Gravity – the force that attracts a body towards the centre of the earth. It can also attract a body towards any other physical body with mass.
• Green manure – a fertiliser consisting of growing plants that are plowed back into the soil.
• Haze – a slight obscuration of the lower atmosphere, caused by fine suspended particles.
• Heath – a short shrub with small leaves and pink or purple bell-shaped flowers.
• Horizon – a zone or layer
• Hydrological cycle – this is a continuous cycle where water evaporates, into the air and becomes part of the clouds. It then falls down to earth as precipitation and evaporates again. This repeats again and again in a never-ending cycle.
• Immigration – the action of coming to live permanently in a foreign country.
• Impervious – not allowing fluid to pass through.
• Infiltrate – to cause a liquid to enter something like soil through its pores.
• Inorganic – not consisting of living matter
• Insolation – a measure of solar radiation energy received on a given surface area in a given time.
• Interstellar gas – gases, and dust that occupy the space between the stars.It provides the raw material for the formation of new stars.• Intrusive – of or relating to igneous rock that while molten, is pushed into cracks or between other layers of rock.
• Ionosphere – a part of earth’s atmosphere that has a lot of ions from the solar radiation.
• Isotope – a different version of a chemical element.
• Jovian planets – outer planets away from the sun.
• Landform – a natural feature on the earth’s surface.
• Landscape – all the visible features of an area of land.
• Laterally – extending from side to side.
• Lava – hot molten or semi-fluid rock erupted from a volcano or fissure.
• Lava ejecta – material ejected out of a volcano such as pumice, ash and tuff.
• Lava flow – a mass of flowing or solidified lava.
• Lay of the land – the natural features of a geographic area
• Light years – The distance that light travels in a vacuum in one year.
• Loess – a loamy soil deposit formed by wind.
• Louvre – a structure on a roof or window, with side openings for ventilation.
• Lumbering – the process of cutting down trees and turning them into timber.
• Macro-nutrients – nutrients that provide energy and are required in large amounts.• Mafic rocks – a silicate mineral or rock rich in magnesium and iron that is dark in colour.
• Magma – hot fluid or semi- fluid material below or within the earth’s crust.
• Mantle – a layer in the interior of Earth or another planet.
• Maritime – relating to the sea.
• Matter – a physical substance that occupies space and has mass.
• Metamorphism – alteration of the composition or structure of a rock by heat or pressure.
• Meteorologist – scientists who study the atmosphere. They examine its effects on the environment, predict the weather, or investigate climate trends.
• Micro-climate – the climate of a small area that is different from the area around it.
• Micro-nutrients – nutrients required in small amounts.
• Micro-organism – a living organism that is too small to be seen with the naked eye e. g bacteria.
• Molten – in a semi-liquid state by means of heating.
• Moorland – an area of low-growing vegetation of grass and bushes on acidic soils.
• Murram – a form of clay material used for road surfaces.
• Muslin – lightweight cotton cloth.
• Natural resources – materials or substances that occur in nature and can be used for economic gain. They include forests, fertile land, water, minerals etc.
• Oblique – aerial photographs taken from a high point at a slope angle.• Oceanic bed – the bottom of the ocean.
• Offshore – situated at sea some distance from the shore.
• Onshore – situated or occurring on land.
• Organic – relating to or derived from living matter.
• Organic farming – a form of agriculture that depends on techniques like crop rotation, green manure, compost and biological pest control.
• Orographic – resulting from the effects of mountains.
• Oxides – a mixture of oxygen and another element.
• Ozone layer – a layer in Earth’s stratosphere that absorbs most of the ultraviolet radiation reaching Earth from the sun.
• Ped – a soil particle.
• Percolate – of a liquid; filter gradually through a porous surface or substance.
• Perennial – lasting or existing for a long time.
• Permeability – the state of a material that causes it to allow liquids or gases
to pass through it.
• Photosynthesis – a process used by plants to convert light energy from the sun, into chemical energy that can be later released to fuel the plant’s activities.
• Physical features – the environment: landforms, water bodies, climate, natural vegetation and soils of the earth.
• Planetoid – minor planet
• Plankton – the small and microscopic organisms drifting or floating in the sea or fresh water.• Plutonic – igneous rock formed by solidification below the earth’s surface.
• Population pyramid – a graphical illustration that shows the distribution of various age groups in a population.
• Porous – relating to a rock having spaces or holes through which liquid or air may pass.
• Precipitate – cause (a substance) to be deposited in solid form from a solution.
• Pressure belt – A pressure belt is a band of high and low pressure found every 30 degrees.
• Quarrying – extraction of stones from rocks on the ground.
• Rain shadow – a region with little rainfall because it is sheltered from rainbearing winds.
• Ratio – a relationship between two quantities showing the number of times one value is contained in another.
• Raw materials – a basic material that is used to produce goods, finished products and energy.
• Reforestation – restocking of existing forests that have been depleted or destroyed.
• Refugee – a person who has been forced to leave their country in order to escape war, persecution or natural disaster.
• Regolith – the layer of loose material covering the bedrock of the earth.
• Relief – the highest and lowest elevation points in an area. Mountains and ridges are the highest elevation points, while valleys are the lowest.
• Revenue – a country’s income from which public expenses are met.• Ribbon – a long narrow strip of something.
• Run-off – draining away of water from the land surface.
• Satellite – a body that orbits around Earth, any other planet or a star.
• Scarp – a very steep bank or slope.
• Sea level – an average level for the surface of the earth’s oceans from which heights are measured.
• Sea waves – a disturbance on the surface of the sea or lake. It is usually in the form of a moving ridge or swell.
• Sediments – solid fragments of inorganic or organic material that settle at the bottom of lakes or ocean beds. They are carried and deposited by wind, water, or ice.
• Sediments – the accumulation of sand and dirt that settles at the bottom of lakes or oceans.
• Semi-processed – a product that has not been fully processed to completion to create a product.
• Sensitise – make an object or substance sensitive to light.
• Slide – an image on a transparent base for projection on a screen.
• Soil aggregate – groups of soil particles that bind to each other strongly.
• Solidification – to make something into a hard compact mass or a solid.
• Soluble – of a substance able to dissolve in water.
• Sub-surface water – water beneath earth’s surface as part of the water cycle.
• Sublimation – a chemical process where a solid turns into a gas without going through a liquid stage.• Submarine canyons – is a steep-sided valley cut into the sea floor .
• Tectonic plate movement – theory which states that the Earth’s lithosphere is divided into plates that float over the mantle.
• Terrain – a tract of land considered with its physical features.
• Terrestrial planets – inner planets closer to the sun.
• Tillage – preparation of land for growing crops.
• Topographical map – a detailed, accurate graphic representation of features that appear on the earth’s surface.
• Transverse – extending across something.
• Tributaries – rivers or streams flowing into a larger river or lake.
• Tsunami – a very large ocean wave caused by an underwater earthquake or volcanic eruption.• Twilight – the soft light from the sky when the sun is below the horizon. It usually occurs at daybreak to sunrise or from sunset to nightfall.
• Ultra-violet – electromagnetic radiation.
• Undulating – to have a wavy shape that rises and falls such as in hills and valleys.
• Vacuum – empty space.
• Volcanic lava – the molten rock expelled by a volcano during an eruption.
• Vulcanicity – the process through which gases and molten rock are forced out onto the earth’s surface or into the earth’s crust.
• Waterlogged – saturated with or full of water.
• Watershed – a ridge of high land dividing two areas that are drained by different river system.
• Zone – an area distinguished from other parts by a distinct feature or characteristic.References
1. Allaby, A. and M. Allaby. (Editors). 1999. Dictionary of Earth Sciences. 2nd Edition. Oxford University press, London
2. Bunnet R.B (2004): Physical Geography in Diagrams for Africa, Longman
3. Christopherson, R. W. 2005. Geosystems: An Introduction to Physical Geography. 5th Edition. Prentice Hall, Upper Saddle River, New Jersey
4. Citation: Pidwirny, M. (2006). “Introduction to Geography”. Fundamentals of Physical Geography, 2nd Edition
5. Collin Buckle (2007): Landforms and Landscapes in Africa. An introduction to Geomorphology, Pearson Education Limited; Edinburgh
6. F. J. Monkhouse (2008): Principles of Physical Geography, Hodder Education; London
7. Goh Cheng Leong (1996): Certificate Physical and Human Geography, Oxford University Press; Hong Kong
8. Gregory, K.J. (2001). The Changing Nature of Physical Geography, Edward Arnold; London
9. Harvey, M. E. and B.P. Holly, B. P. (Editors). (1981). Themes in Geographic Thought, Croom Helm; London
10. Holt-Jensen, A. (2000). Geography - History and Concepts: A Student’s Guide, 3rd Edition; Sage Publications
11. Jane Crispin and Francis Jegede (2000). Population, Resources and Development, Collins Publishers; London
12. Johnston, R. J. (1997). Geography and Geographers: Anglo-American Geography since 1945, 5th Edition. Arnold Publishers; London
13. Lanegran, D.A. and R. Palm (Editors). (1978). An Invitation to Geography, 2nd Edition. McGraw-Hill Publishing; New York
14. Livingston, D.N. 1992. The Geographical Tradition: Episodes in the History of a Contested Enterprise, Basil Blackwell; Cambridge, Mass
15. Lukermann, F. (1964). Geography as a formal intellectual discipline and the way in which it contributes to human knowledge. The Canadian Geographer, 8(4): 167–172
16. Martin, G.J. and P.E. James. (1993). All Possible Worlds: A History of Geographical Ideas, 3rd Edition, John Wiley and Sons; New York
17. McKnight, T. L. and D. Hess. (2002). Physical Geography: A Landscape Appreciation. 7th Edition. Prentice Hall, Upper Saddle River; New Jersey
18. Michael Senior (1987). Tropical Lands: A Human Geography, Longman Group UK Limited; Essex
19. Monkhouse F. J. (2007): A Dictionary of Geography, 2nd Edition, Transaction Publishers; New Brunswick (U.S.A)
20. Morrill, R.L. (1983). The Nature, Unity and Value of Geography. Professional Geographer 35(1): 1-9.