UNIT 1: APPLICATIONS OF MATRICES AND DETERMINANTS
Key unit competence: Apply matrices and determinants concepts in solvinginputs & outputs model and related problems.
Introductory activity
Prices of the three commodities A,B and C are X,Y and Z per units
respectively. A person P purchases 4 units of B and sells two units of A and
5 units of C. Person Q purchases 2 units of C and sells 3 units of A and one
unit of B. Person R purchases one unit of A and sells 3 units of B and one
unit of C. in the process P, Q and R earn 15000Frw, 1000Frw and 4000Frw
respectively. Use matrix inversion to calculate the prices per unit of A, B andC.
1.1 Application of matrices
1.1.1 Economic applications
Learning activity 1.1.1
Three customers purchased biscuits of different types P, Q and R. The first
customer purchased 10 packets of type P, 7 packets of type Q and 3 packets
of type R. Second customer purchased 4 packets of type P, 8 packets of type
Q and 10 packets of type R. The third customer purchased 4 packets of
type P, 7 packets of type Q and 8 packets of type R. If type P costs 4000Frw,
type Q costs 5000Frw and type R costs 6000Frw each, then using matrixoperation, find the amount of money spent by these customers individually.
Economics is the study of shortage and how it impacts the use of resources,
the production of products and services, the growth of production and welfare
through time, as well as a wide range of other complicated issues that are of
the utmost importance to society in order to satisfy human needs and wants.
To understand money, jobs, prices, monopolies, and how the world works
on a daily basis, one must study economics. All across the world, matrices’
properties, determinants, and inverse matrices, together with their addition,
subtraction, and multiplication operations, are employed to address these real-
world issues. In economics, matrices are typically also used in the productionprocess.
Example 1
A firm produces three products A, B and C requiring the mix of three materials
P, Q and R. The requirement (per unit) of each product for each material is asfollows.
Using matrix notation, find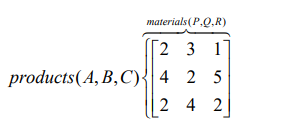
i. The total requirement of each material if the firm produces 100 units ofeach product
ii. The per unit cost of production of each product if the per unit cost ofmaterials P,Q and R is 5000Frw, 10000Frw and 5000Frw respectively
iii. The total cost of production if the firm produces 200 units of each product
Solution
i. The total requirement of each material if the firm produces 100 units
of each product can be calculated using the matrix multiplication givenbelow
With the help of matrix multiplication, the per unit cost of production of each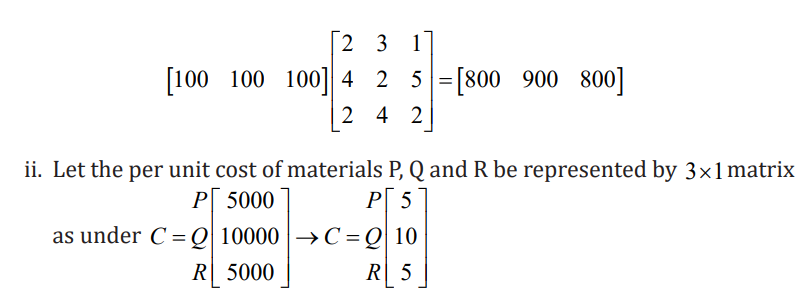
product would be calculated as
iii. The total cost of production if the firm produces 200 units of each product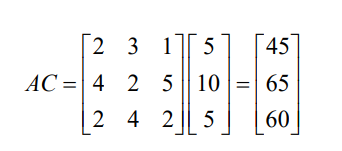
would be given as
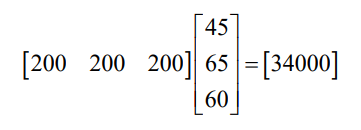
Hence, the total cost of production will be 34000Frw
Example 2
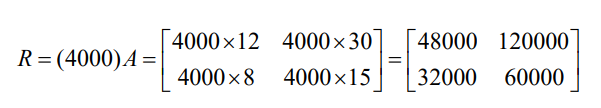
The number of units of a product sold by a retailer for the last 2 weeks areshown in matrix a below, where the columns represent weeks and the rows
item sells for 4000Frw, derive a matrix for total sales revenue for this retailer
for these two shop units over this two-week period.
Solution:
Total revenue is calculated by multiplying each element in matrix of sales
quantities A by the scalar value 4000, the price that each unit is sold at. Thustotal revenue can be represented in Frw by the matrix
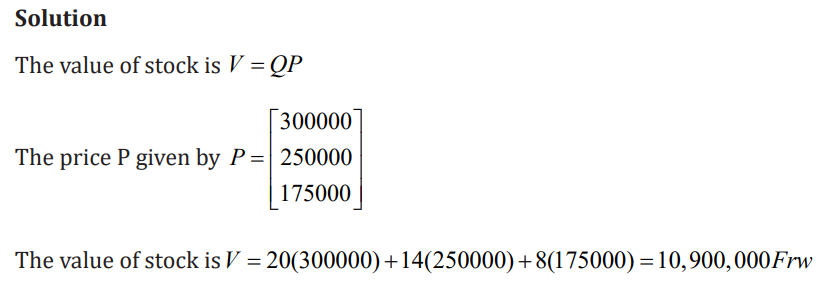
Example 3
If the price of TV is 300000Frw, the price of a stereo is 250000Frw, the price of
a tape deck is 175000Frw. Present price P in a 3 1× matrix then determine thevalue of stock for the outlet given by Q = [20 14 8]
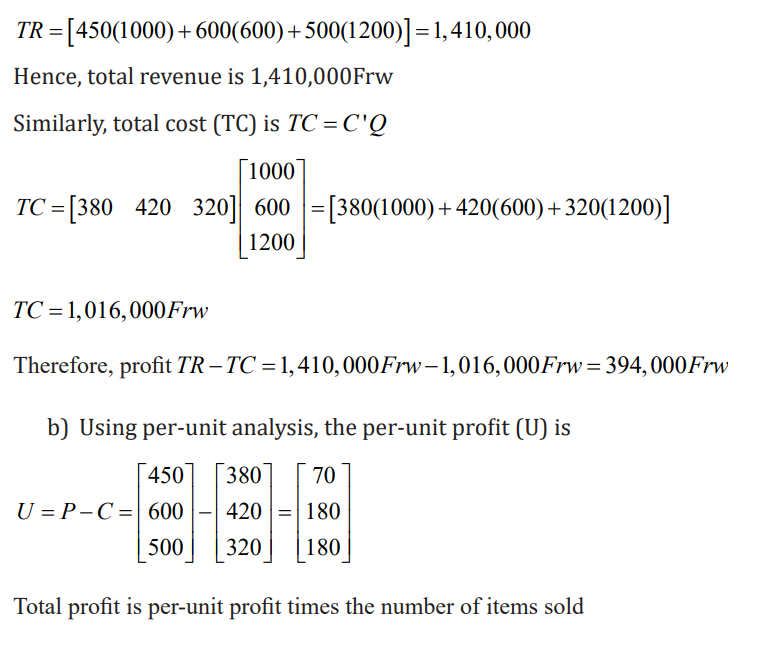
Example 4
A hamburger chain sells 1000 hamburgers, 600 cheeseburgers, and 1200 milk
shakers in a week. The price of a hamburger is 450Frw, a cheeseburger 600Frw
and a milk shake 500Frw. The cost to the chain of a hamburger is 380Frw, a
cheeseburger 420Frw, and a milk shake 320Frw. Find the firm’s profit for theweek, using
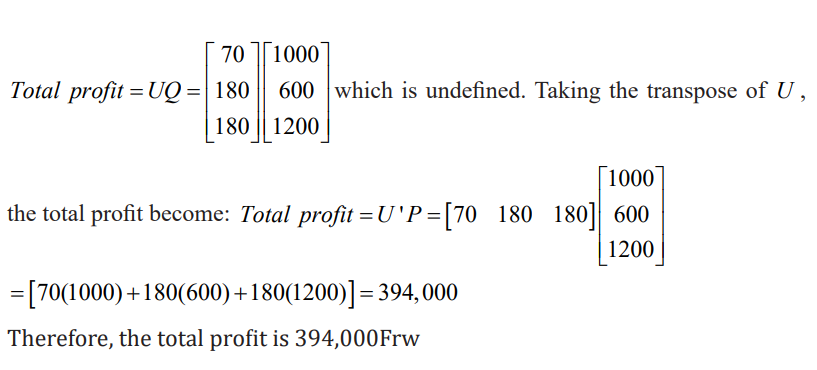
a) total conceptsb) per-unit analysis to prove that matrix multiplication is distributive
Solution
a) The quantity of goods sold (Q), the selling price of the goods (P), and thecost of goods (C) can all be presented in matrix form.
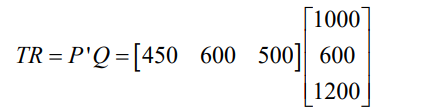
Which is not defined as given. Taking the transpose of P or Q will render the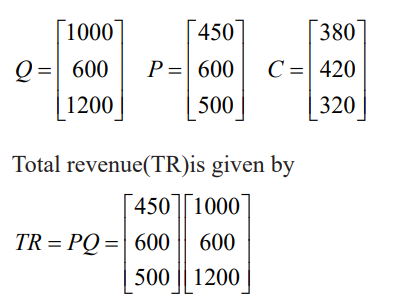
vectors conformable for multiplication. Note that the order of multiplication isimportant. Thus, taking the transpose of P and premultiplying, we get,
Application activity 1.1.1
A firm produces two goods in a pure competition, and has a following total
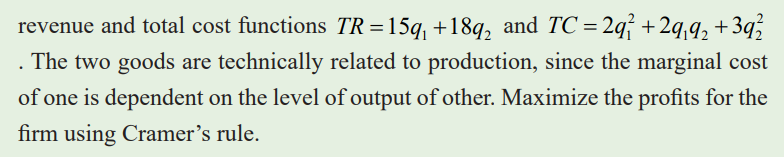
1.1.2. Financial applications
Learning activity 1.1.2
With clear example discuss the importance of matrices in finance andaccounting.
The process of raising cash or funds for any kind of expense is called financing. To
further handle this process, matrices are more useful in financial applications.
Matrix algebra is used in financial calculations due to the large amount of data
involved. These include managing financial risk, presenting investment orbusiness expense results or returns, and calculating value-at-risk.
To facilitate a better understanding of accounting procedures based on the
principle of double entry, various methods of solving a given problem exist. It
is very crucial to emphasize the use of matrix algebra in financial records for
accountants, bankers, and accounting students in order to prepare them foremerging trends in the business/financial world.
Application of Matrix Additive to Financial Records
In the application of matrix addition concept, one needs to examine thoroughly
the accounting records to obtain the relevant figures expressed in monetary
terms to form the required matrices. The principle of double entry in accounting
provided the need to record any business transaction twice (i.e. as debit and
credit). Accounting records in books are strictly governed by the principle
of double entry, making it easier to obtain matrices of financial transactions
from one period to the next. As a result, using appropriate matrix concepts, the
opening and closing balances can be determined from period to period with
little difficulty.
In addition, financial economics and financial econometrics rely on the use of
matrix algebra because of the need to manipulate large data inputs. Therefore,
matrix used in financial risk management, used to describe the outcomes orpayoff of an investment, and used to calculate value at risk.
Example
A finance company has offices located in province, district and cells. Assume
that there are 5 provinces, 30 districts and 200 sectors to be considered by thecompany. The workers at every level are given in the matrix form,
column stands for head clerks , and the 3rd column stands for cashiers. The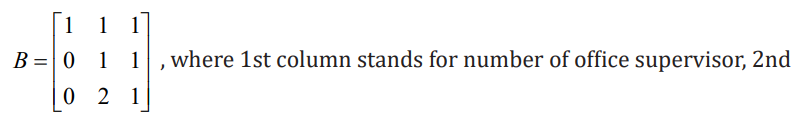
basic monthly salaries (in FRW) are as follows:
Office supervisor: 150,000
Head clerk: 120,000
Cashier: 117,500
Using matrix notation, find
i. The total number of posts of each kind in all the offices taken together
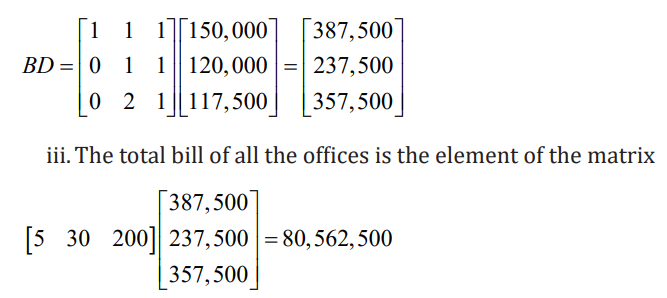
ii. The total basic monthly salary bill of each kind of office and,iii. The total basic monthly salary bill of all the offices taken together
ii. Total basic monthly salary bill of each kind of offices is the elements of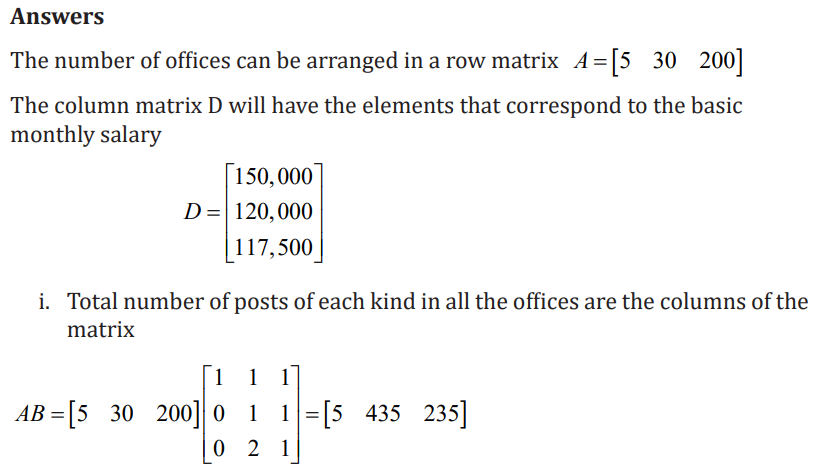
matrix
Application activity 1.1.2
Visit the finance office and look at how he/she completes the cash booksthen perform the following:
a) Create a matrix from debited and credit transactionsb) Find out transaction vector from these matrices
1.2. System of linear equations
1.2.1 Introduction to linear systems
Learning activity 1.2.1


By simplifying the second equation and found that x+ y = 3 is contradictory to
the first equation x +y = 4
A system of linear equations that has no solution is said to be inconsistent. If
there is at least one solution it is called consistent. Therefore, every system of
linear equations has either no solution, exactly one solution or infinitely manysolutions.
An arbitrary system of m equations and n variables ( m n × linear system) canbe written as

Application activity 1.2.1
Solve the following system of linear equations

1.2.2 Application of system of linear equations
Learning activity 1.2.2
A factory produces three types of the ideal food processor. Each type X
model processor requires 30 minutes of juice processing, 40 minutes of
bread processing, and 30 minutes of yoghurt processing, while each type Y
model processor requires 20 minutes of juice processing, 50 minutes of bread
processing, and 30 minutes of yoghurt processing. Each type Z model processor
requires 30 minutes of juice processing, 30 minutes of bread processing, and
20 minutes of yoghurt processing. How many of each type will be produced if
2500 minutes of juice processing, 3500 minutes of bread processing, and 2400minutes of yoghurt processing are used in one day?
When there is more than one unknown and enough information to set up
equations in those unknowns, systems of linear equations are used to solve such
applications. In general, we need enough information to set up n equations
in n unknowns if there are n unknowns. Solving such system means finding
values for the unknown variables which satisfy all the equations at the same
time . Even though other methods for solving systems of linear equations exist
, one method like the use matrices is the more important choice in economics,finance, and accounting for solving systems of linear equations.
Consider any given situation that represents a system of linear equations,consider the following keys points while solving the problem:
i. Identify unknown quantities in a problem represent them with variables
ii. Write system of equations which models the problem’s conditions
iii. Deduce matrices from the systemiv. Solve for unknown variables
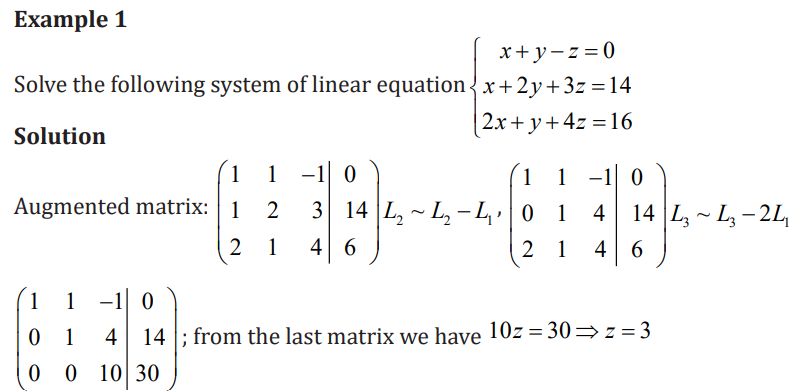
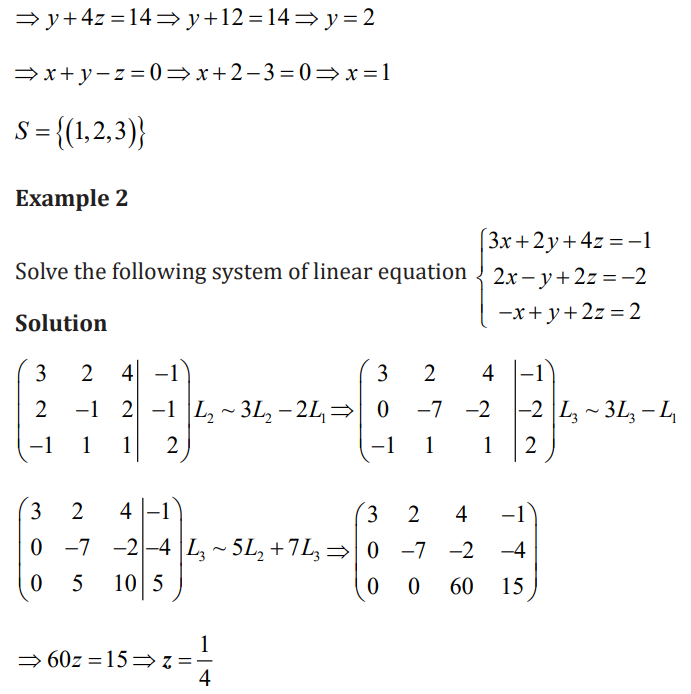
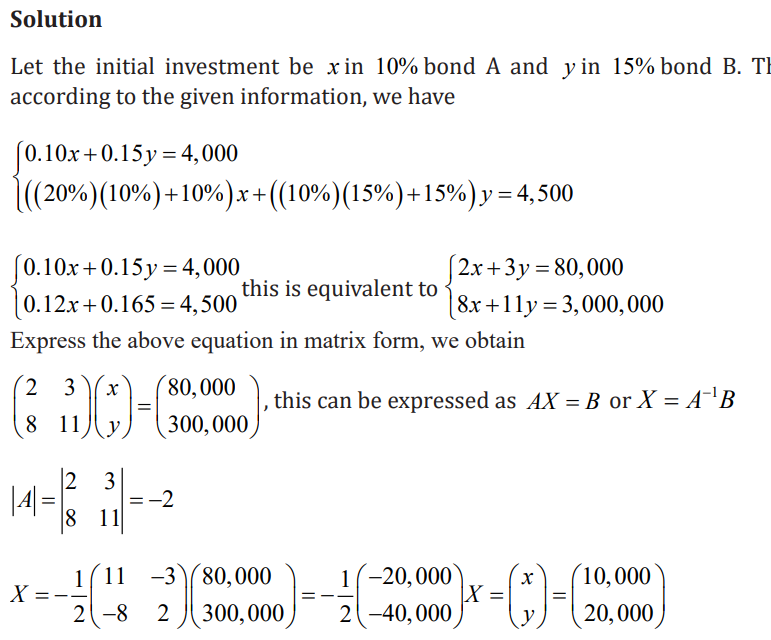
Example 1
Mr. John invested a part of his investment in 10% bond A and a part in 15% bond
B. His interest income during the first year is 4,000Frw. If he invests 20% more
in 10% bond A and 10% more in 15% bond B, his income during the second
year increases by 500Frw. Find his initial investment in bonds A and B usingmatrix method.
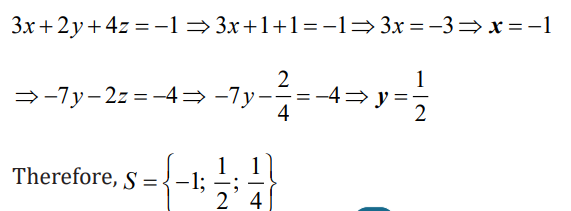
Hence, the production levels of the products are given by First product has 11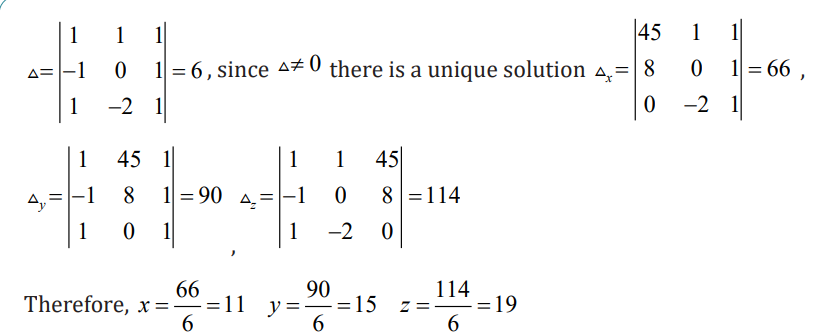
tons, second product has 15 tons and the third product has 19 tons
Application activity 1.2.2
A couple of two person has 60,000,000Frw to invest. They wish to earn an
average of 5,000,000 per year on the investment over a 5 year period. Based
on the yearly average return on mutual funds for 5 years ending december,
2022, they are considering the following funds: Personal savings at 5%,bank loans at 6%,
a) As their financial advisor, prepare a table showing the various ways
the couple can achieve their goalb) Comment on the various possibilities and the overall plan
1.3. Input-outputs models and Leontief theorem for matrix oforder 2.
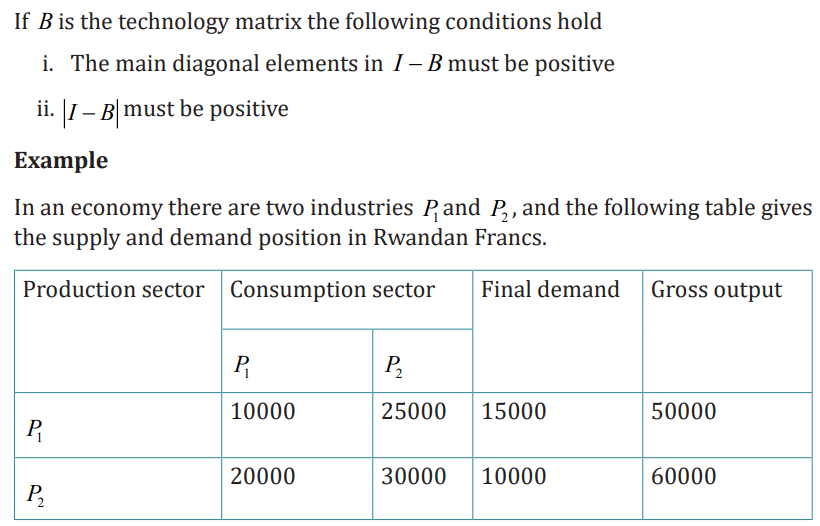
1.3.1 Input-outputs models ( n = 2 )
Learning activity 1.3.1
1. Generate input-output model formula and conditions hold fortechnology matrix
2. Two commodities A and B are produced such that 0.4 tons of A and
0.7 tons of B are required to produce a tons of A. similarly 0.1 tons of
A and 0.7 tons of B are needed to produce a tons of B.i. Write down a technology matrix
ii. If 6.8 tons of A and 10.2 tons of B are required, find the grossproduction of both them.
Input Output analysis is a type of economic analysis that focuses on the
interdependence of economic sectors. The method is most commonly used to
estimate the effects of positive and negative economic shocks and to analyze
the unforeseen consequences across an economy. Input-output tables are the
foundation of input-output analysis. Such tables contain a series of rows and
columns of data that quantify the supply chain for various economic sectors.
The industries are listed at the top of each row and column. The information in
each column corresponds to the level of inputs used in the production function
of that industry. The column for auto manufacturing, for example, displays
the resources required to construct automobiles (i.e., requirement of steel,
aluminum, plastic, electronic etc,). Input – Output models typically includes
separate tables showing the amount of required per unit of investment orproduction.
The use of Input-Output Models
Input-output models are used to calculate the total economic impact of a
change in industry output or demand for one or more commodities. These
models employ known information about inter-industry relationships to track
all changes in the output of supplier industries required to support an initial
increase in an industry’s output or an increase in commodity expenditures. Themodel is commonly shocked during this process.
Let us consider a simple economic model with two industries, A1 and A2, each
producing a single type of product. Assume that each industry consumes a
portion of its own output and the remainder from the other industry in order
to function. As a result, the industries are interdependent. Also, assume that
whatever is produced is consumed. That is, each industry’s total output must
be sufficient to meet its own demand, the demand of the other industry, and the
external demand (final demand).The main goal is to determine the output levels
of each of the two industries in order to meet a change in final demand, based
on knowledge of the two industries’ current outputs, under the assumptionthat the economy’s structure does not change.


Application activity 1.3.1
An economy produces only coal and steel. These to commodities serve as
intermediate inputs in each other’s production. 0.4 tons of steel and 0.7 tons
of coal are needed to produce a ton of steel. Similarly, 0.1 tons of steel and 0.6
tons of coal are required to produce a ton of coal. No capital inputs are needed.
Do you think that the system is viable? The 2 and 5 labor days are required to
produce a ton of coal and steel respectively. If economy needs 100 tons of coal
and 50 tons of steel, calculate the gross output of the two commodities and thetotal labor days required.
1.3.2 Leontief theorem for matrix of order two
Learning activity 1.3.2
1. Differentiate open Leontief Model from closed Leontief Model
2. The following are two firms that are producing units in tons foragriculture and manufacturing.
Assume that the external demand of agriculture is 80 and the one of manufacturing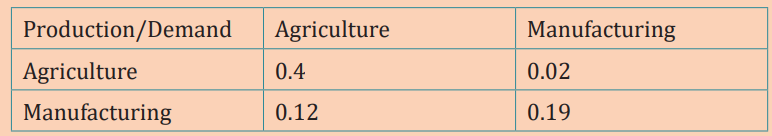
is 200. Determine the units to be produced by agriculture and manufacturingfirms in order to satisfy their own external demands.
The Leontief model is an economic model for an entire country or region. In
this model, n industries produce a numbern of different products such that
the input equals the output, or consumption equals production. It distinguishesbetween closed and open model.
The open Leontief Model is a simplified economic model of a society in which
consumption equals production, or input equals output. Internal Consumption
(or internal demand) is defined as the amount of production consumed within
industries, whereas External Demand is the amount used outside of industries.
In addition, some production consumed internally by industries, rest consumed
by external bodies. This model allows us to calculate how much production is
required in each industry to meet total demand. To determine the productionlevel, first create a consumption matrix C.
Therefore, an industry is profitable if the corresponding column in C has sum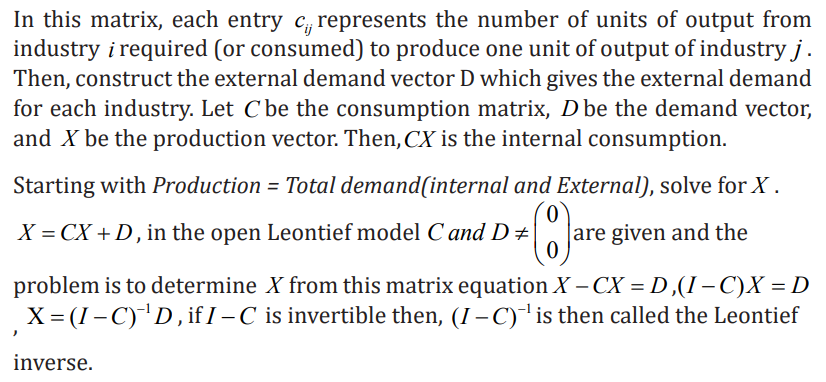
less than one.
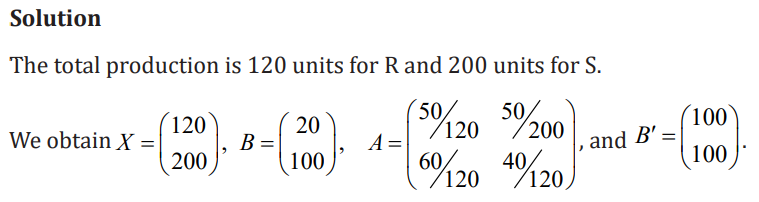
Example
An economy has the two industries R and S. The current consumption is givenby the table
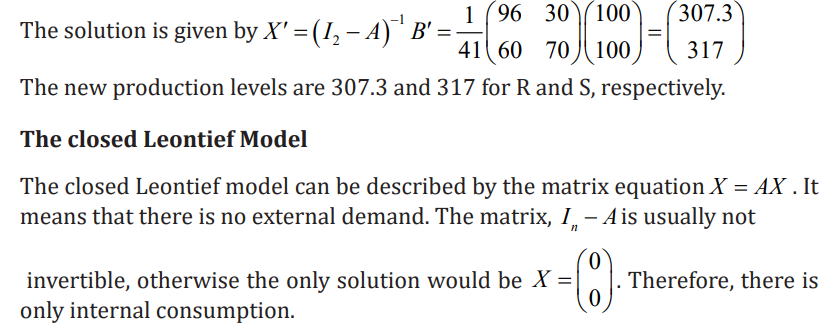
Assume the new external demand is 100 units of R and 100 units of S. Determine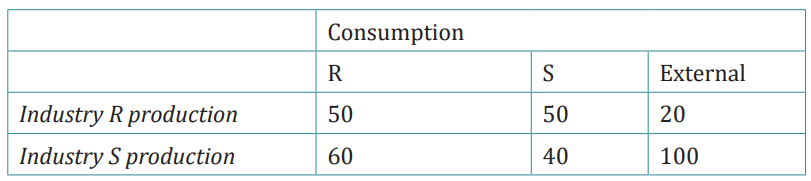
the new production levels.
Example
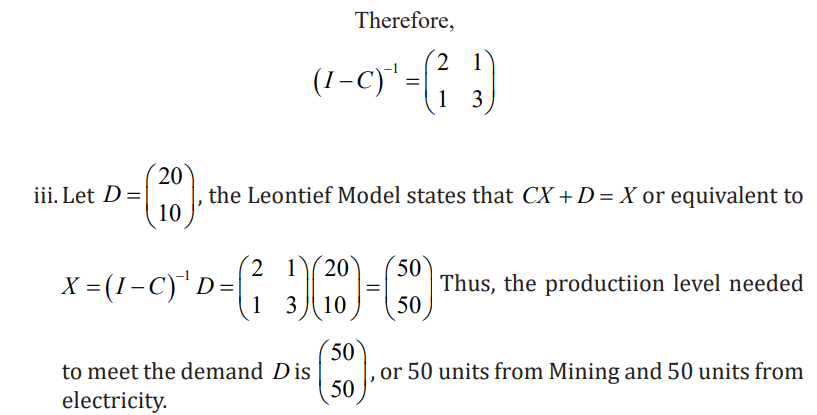
Suppose that an economy has two sectors, Mining and electricity. For each
unit of output, Mining requires 0.4 unites of its own production and 0.2 units
of electricity. Moreover, for each unit output, electricity requires 0.2 units ofMining and 0.6 units of its own production.
i. Determine the consumption matrix C for this economy
ii. Find the inverse
iii. Using the Leontief model, determine the production levels from each
sector that are necessary to satisfy a final demand of 20 units from miningand 10 units from electricity.

Application activity 1.3.2
An economy has two sectors namely electricity and services. For each unit
of output, electricity requires 0.5 units from its own sector and 0.4 units
from services. Services require 0.5 units from electricity and 0.2 from itsown sector to produce one unit of services.
i. Determine the consumption matrix C
ii. State the Leontief input-output equation relating C to the productionX and final demand D
iii. Use an inverse matrix to determine the production necessary to
satisfy a final demand of 1000 units of electricity and 2000 units ofservices.
1.4 End unit assessment

Determine the number of cars of each type which can be produced using 29, 13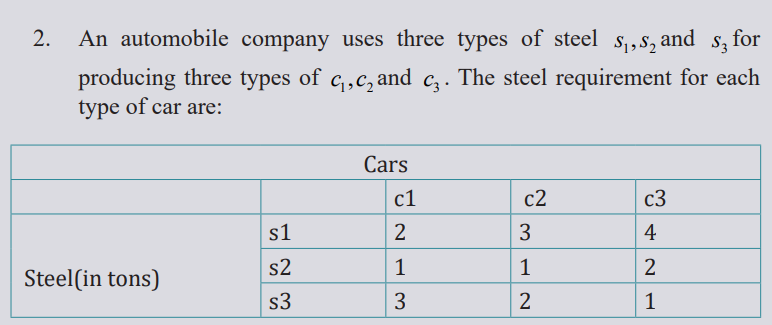
and 16 tons of steel of the three types respectively.
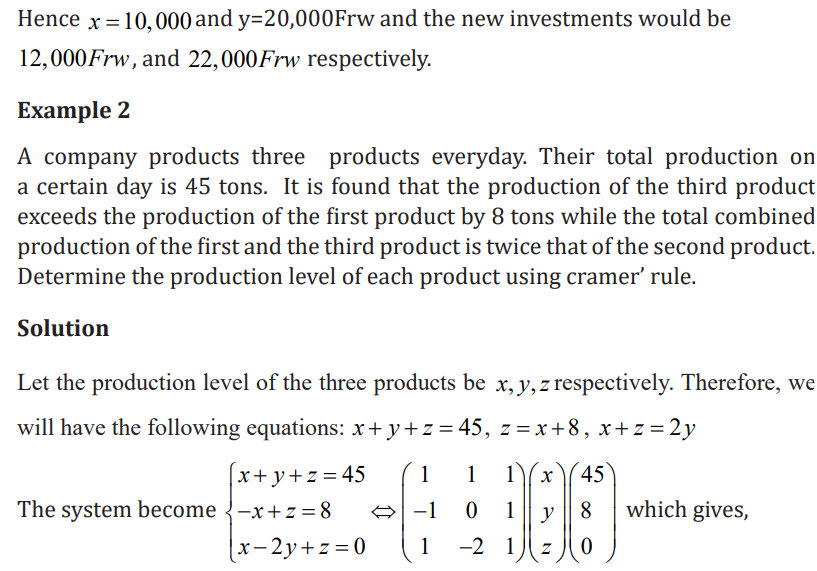
3. A company produces three products every day. Their total production
on a certain day is 45 tons. It is found that the production of the third
product exceeds the production of the first product by 8 tons while
the total combined production of the first and the third product is
twice that of the second product. Determine the production level ofeach product using Cramer’s rule.
4. An economy has two sectors, mining and electricity. For each unit
of output, mining requires 40% units of its own production and
20% units of electricity. Moreover, for each unit output, electricityrequires 20% units of mining and 0.6 units of its own production.
a) Determine the consumption matrix C for this economy
b) Find the inverse of I-C
c) Using the Leontief model, determine the production levels from
each sector that are necessary to satisfy a final demand of 20 unitsfrom mining and 10 units from electricity.